the Creative Commons Attribution 4.0 License.
the Creative Commons Attribution 4.0 License.
 | 12 Jul 2021
Analysis of the microphysical properties of snowfall using scanning polarimetric and vertically pointing multi-frequency Doppler radars
Pavlos Kollias
Sergey Y. Matrosov
Alessandro Battaglia
Alexander V. Ryzhkov
Radar dual-wavelength ratio (DWR) measurements from the Stony Brook Radar Observatory Ka-band scanning polarimetric radar (KASPR, 35 GHz), a W-band profiling radar (94 GHz), and a next-generation K-band (24 GHz) micro rain radar (MRRPro) were exploited for ice particle identification using triple-frequency approaches. The results indicated that two of the radar frequencies (K and Ka band) are not sufficiently separated; thus, the triple-frequency radar approaches had limited success. On the other hand, a joint analysis of DWR, mean Doppler velocity (MDV), and polarimetric radar variables indicated potential in identifying ice particle types and distinguishing among different ice growth processes and even in revealing additional microphysical details.
We investigated all DWR pairs in conjunction with MDV from the KASPR profiling measurements and differential reflectivity (ZDR) and specific differential phase (KDP) from the KASPR quasi-vertical profiles. The DWR-versus-MDV diagrams coupled with the polarimetric observables exhibited distinct separations of particle populations attributed to different rime degrees and particle growth processes. In fallstreaks, the 35–94 GHz DWR pair increased with the magnitude of MDV corresponding to the scattering calculations for aggregates with lower degrees of riming. The DWR values further increased at lower altitudes while ZDR slightly decreased, indicating further aggregation. Particle populations with higher rime degrees had a similar increase in DWR but a 1–1.5 m s−1 larger magnitude of MDV and rapid decreases in KDP and ZDR. The analysis also depicted the early stage of riming where ZDR increased with the MDV magnitude collocated with small increases in DWR. This approach will improve quantitative estimations of snow amount and microphysical quantities such as rime mass fraction. The study suggests that triple-frequency measurements are not always necessary for in-depth ice microphysical studies and that dual-frequency polarimetric and Doppler measurements can successfully be used to gain insights into ice hydrometeor microphysics.
- Article
(7328 KB) - Full-text XML
- BibTeX
- EndNote


Millimeter-wavelength (i.e., operating at 35 and 94 GHz) radars have been widely used for the study of liquid and ice precipitation clouds, utilizing the radars' high sensitivity to smaller particles due to Rayleigh scattering and excellent spatiotemporal resolution (Kollias et al., 2007). Cloud radars at 35 and 94 GHz have been routinely operated at surface-based observatories during the last 2 decades (e.g., the European Union CloudNet project and the US Atmospheric Radiation Measurement (ARM) facility; Illingworth et al., 2015; Stokes and Schwartz, 1994; Mather and Voyles, 2013; Kollias et al., 2014, 2016) and from a variety of ship-based (e.g., Lewis et al., 2012) and airborne (e.g., Battaglia et al., 2016; Tridon et al., 2019) platforms. Millimeter-wavelength radars are particularly suitable for the study of hydrometeor properties (e.g., particle mass, size) using the presence of non-Rayleigh scattering signals and their higher sensitivity to attenuation. For example, the dual-wavelength ratio (DWR), the ratio of the longer-wavelength reflectivity to the shorter-wavelength reflectivity, is affected by the differential backscatter and/or attenuation and depends on the particle size, type, orientation, rime fraction, and radar beam path. DWRs have been used in multi-wavelength radar measurements for microphysical retrievals such as estimations of liquid water content (e.g., Hogan et al., 2005; Huang et al., 2009; Tridon et al., 2013; Zhu et al., 2019), ice water content (IWC), snowfall rate (e.g., Matrosov, 1998), and identification of particle types (e.g., Kneifel et al., 2015; Leinonen and Moisseev, 2015; Moisseev et al., 2015; Sinclair et al., 2016; Matrosov et al., 2019).
Kneifel et al. (2015) illustrated the effectiveness of DWRs in identifying ice crystals, aggregates, and rimed particles, when considering well-separated triple radar frequencies (i.e., X, Ka, and W bands) so that each frequency experiences different scattering regimes. The DWR of X-band to Ka-band reflectivity (DWRXKa) versus the DWR of Ka-band to W-band reflectivity (DWRKaW) diagrams indicated different dependencies on particle type and size. Those curves were in good agreement with the observed particle types (Kneifel et al., 2016). The triple-frequency capabilities have been used for different frequency combinations such as S, X, and W bands and Ku, Ka, and W bands (e.g., Leinonen and Moisseev, 2015; Mason et al., 2019) or even shorter-wavelength radars (e.g., Ka, W, and G bands; Lamer et al., 2021). While the triple-frequency approach is a powerful technique for microphysics research, it requires accurate calibration of the radars, reliable attenuation correction, careful beam matching, and sufficiently high sensitivities at all frequencies. These conditions are satisfied only in a handful of surface observatories.
Another limitation of the triple-frequency measurements for ice particle identification is that the triple frequencies should be well separated from each other so that magnitudes of non-Rayleigh scattering are different for various DWR pairs and the curves representing a particle type in the DWR correspondence diagram can be distinguished. If the frequencies are too close, then the DWR trends corresponding to different hydrometeor types may not be sufficiently separated from each other. For instance, Ka-band (around 35 GHz) frequency and K-band (around 24 GHz) frequency, which have been employed by a widely used, low-power, low-cost, high-quality precipitation profiler, the micro rain radar (MRR; e.g., Peters et al., 2002), are rather close, producing similar trends when coupled with a third frequency as shown in Fig. 1. Figure 1a is a DWRKKa-versus-DWRKW diagram from the scattering calculations (detailed descriptions of the scattering calculations are available in the Appendix). Similarly, Fig. 1c is a DWRXKa-versus-DWRXW diagram. These diagrams show that the two-DWR space from the three frequency radars exhibits a dependency on ice particle types, specifically size and rime fraction. However, considering modeling uncertainties and measurement noise, it would be hard to discern the particle types in the K–Ka–W DWR space, while the X–Ka–W DWR space has larger dynamic ranges that are likely enough to discern the particle types, as presented in previous studies. This is, in part, due to the fact that the K-band frequency (∼24 GHz) is not sufficiently separated from the Ka-band frequency (∼35 GHz).
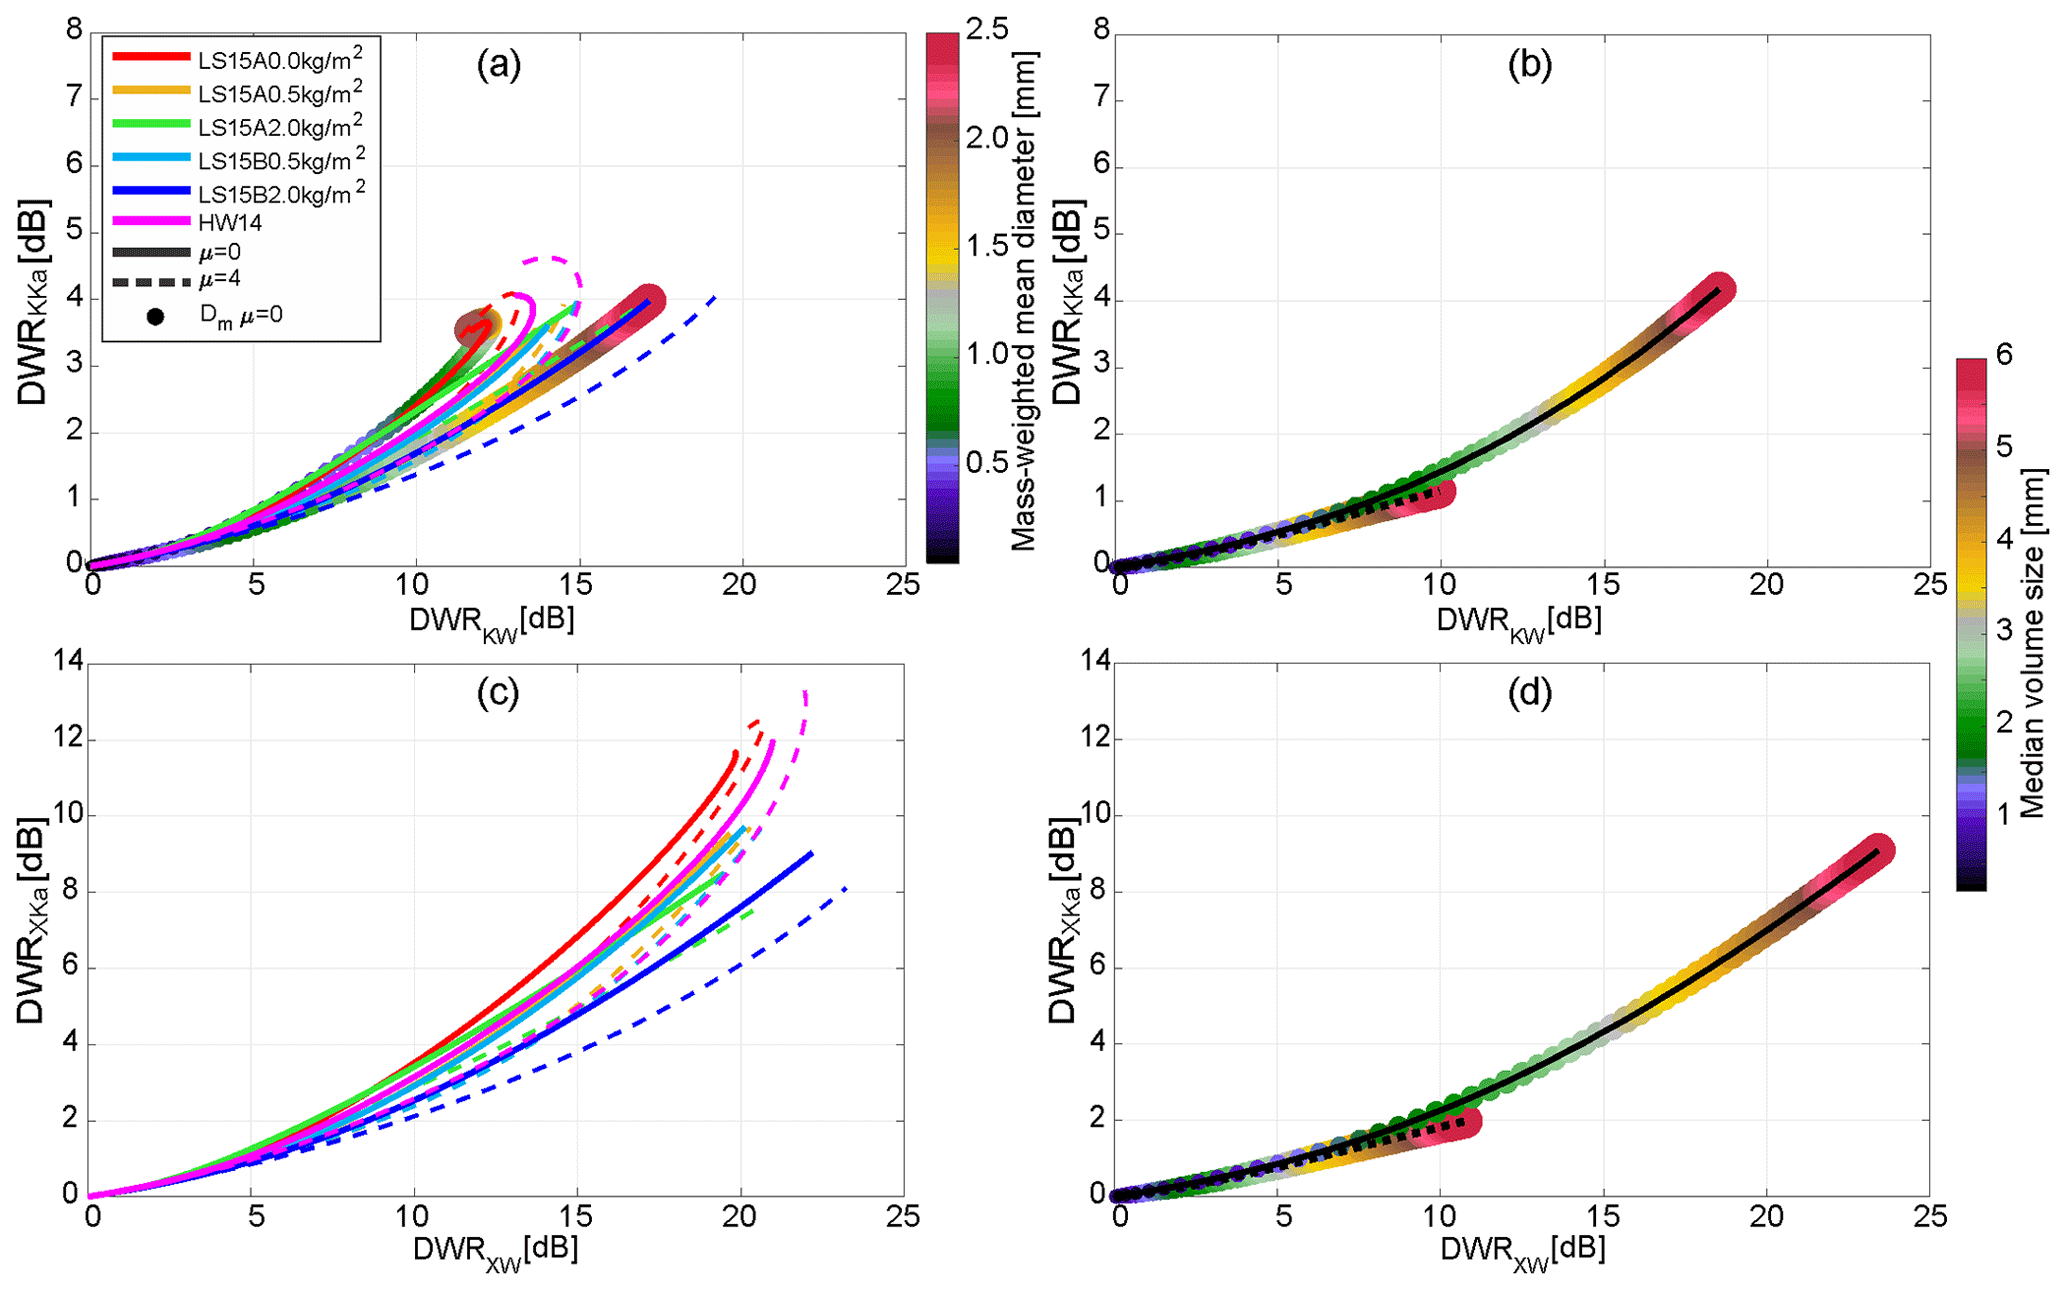
Figure 1DWR of K-band (24 GHz) reflectivity to Ka-band (35.5 GHz) reflectivity versus that of K-band reflectivity to W-band (94 GHz) reflectivity from (a) the self-similar Rayleigh–Gans approximation (SSRGA) scattering property database and (b) Matrosov et al. (2019), accounting for particle aspect ratio (AR). (c) and (d) are the same as (a) and (b), respectively, but for the DWR of X-band (10.7 GHz) reflectivity to Ka-band reflectivity versus that of X-band reflectivity to W-band reflectivity. Line colors in (a) and (c) represent particle models listed in Table A1. Solid and dashed lines in (a) and (c) represent the shape parameter (μ) of the PSD (particle size distribution) equal to 0 and 4, respectively. The color of circles in (a) represents the water-equivalent mass-weighted volume diameter (Dm) of each PSD used to calculate DWRs; here, Dm values for the particle models of unrimed aggregates with μ = 0 (solid red line) and aggregates with a high rime degree (solid blue line) of Leinonen and Szyrmer (2015) are presented. Solid and dashed lines in (b) and (d) represent AR = 0.8 and AR = 0.3, respectively. The DWRs in (b) and (d) were calculated for PSDs with μ = 0 and median volume particle size (color of circles) ranging from 0.2 to 6.0 mm.
It has been shown (e.g., Matrosov et al., 2019) that the DWR also depends on particle shapes (i.e., aspect ratios defined as the ratio of the minor to major particle dimensions). For particles preferentially oriented with their major dimensions in the horizontal plane, the DWR dependence on particle shapes is usually strongest for vertically pointing radar measurements and relatively weak for slant radar viewing (Matrosov, 2021). The impacts of particle shape on the two DWR pairs' diagram (Fig. 1), however, are much smaller than those on individual DWRs for a given frequency pair. To illustrate this point, Fig. 1b and d show DWRKKa–DWRKW and DWRXKa–DWRXW correspondences, respectively, for a “soft” spheroidal particle model with aspect ratios of 0.3 and 0.8. The much weaker particle shape influence on the DWRKKa–DWRKW field (compared to individual DWRs) is explained, in part, by the fact that both DWRKKa and DWRKW increase/decrease as particles become more/less spherical. A similar feature is found in the DWRXKa–DWRXW field. Particle populations with similar characteristic sizes (colored circles in Fig. 1b and d) but different aspect ratios (0.3 vs. 0.8), however, produce quite different values of DWR for both frequency pairs. It is worth also mentioning that a soft spheroid particle model produces DWRKKa–DWRKW correspondences that are similar to those with more sophisticated models (Fig. 1a vs. Fig. 1b).
In addition to power measurements, profiling cloud radar can also measure the mean Doppler velocity (MDV). Although the MDV is affected by the vertical air motion, the cloud Doppler radar community has developed robust methodologies to use MDV to improve discrimination between the particle types and ice growth processes (e.g., Orr and Kropfli, 1999; Luke et al., 2010; Protat and Williams, 2011; Kalesse et al., 2013; Schrom and Kumjian, 2016; Oue et al., 2018). Particle fall speed, which is sensitive to rime fraction, is a valuable variable to use to identify particle types (e.g., Locatelli and Hobbs, 1974; Kajikawa, 1989; Mason et al., 2018, 2019). However, using only MDV and reflectivity measurements would not be enough to distinguish between aggregation and the early stage of riming, because both are associated with very similar fall speeds (e.g., Oue et al., 2016). This study first introduces the use of DWR coupled with MDV to identify particle types that have different degrees of riming. Figure 2 shows DWRKaW as a function of MDV and differential MDV (dMDV = Ka-band MDV–W-band MDV). The MDV–DWR correspondence is also sensitive to particle size distribution (PSD) details and rime degree. Figure 2 indicates only a weak dependency on PSD, which can be advantageous for distinguishing particle types as PSD influences are minimized.
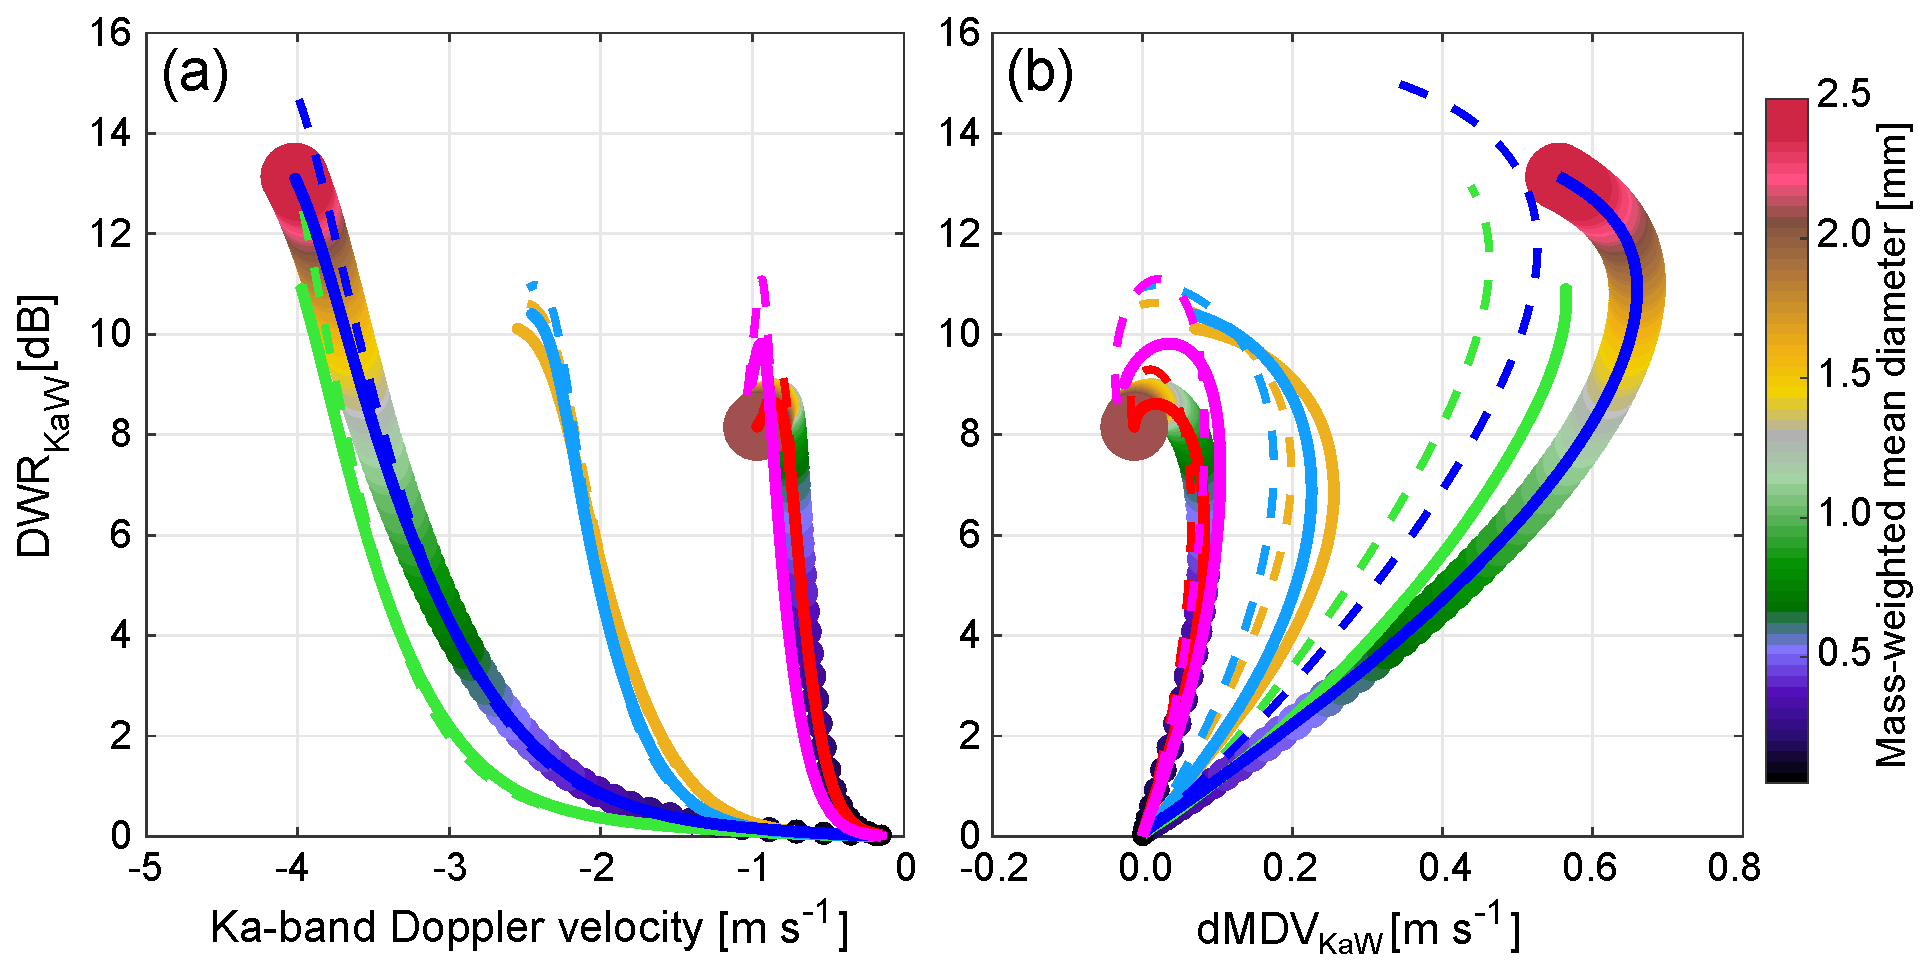
Figure 2(a) DWR of Ka-band (35.5 GHz) reflectivity to W-band (94 GHz) reflectivity versus Ka-band mean Doppler velocity from the SSRGA scattering database with particle fall velocity models of Heymsfield and Westbrook (2010). (b) DWR of Ka-band reflectivity to W-band reflectivity versus difference between Ka-band MDV and W-band MDV. Negative Doppler velocity in (a) represents a downward motion. Color scale and line legends are the same as in Fig. 1. These particle models can be classified into particles of a low (red and magenta), middle (yellow and cyan), and high (blue and green) rime degree.
Similarly to DWR and MDV, polarimetric radar observables are also sensitive to microphysical properties such as particle type, characteristic size, rime fraction, aspect ratio, canting angle, and complexity of shape (e.g., Myagkov et al., 2016). These properties provide a constraint on the particle shapes (i.e., aspect ratio) and help to mitigate the uncertainty in the DWR analysis mentioned above. The polarimetric variables are particularly suitable for identifying depositional, aggregation, and riming growths (e.g., Oue et al., 2016; Matrosov et al., 2020). The most common characteristics of the polarimetric observables representing the depositional growth are enhancements of differential reflectivity (ZDR) and the specific differential phase (KDP) in a dendritic/plate-like growth regime (e.g., around a temperature of −15 ∘C), where the ice crystals with small aspect ratios are formed by depositional growth. The ZDR values decrease with decreasing height in a region of aggregation, while KDP often has a maximum just below the ZDR peak. With further height decrease, the aspect ratios of the individual particles increase (e.g., Vivekanandan et al., 1994; Ryzhkov et al., 1998; Kennedy and Rutledge, 2011; Andrić et al., 2013; Bechini et al., 2013; Schrom et al., 2015; Kumjian et al., 2016; Griffin et al., 2018; Matrosov et al., 2020). Similar vertical changes in the polarimetric variables have often been found in the rime-dominated regions (e.g., Zawadzki et al., 2001; Oue et al., 2016; Giangrande et al., 2016; Kumjian and Lombardo, 2017), as heavy riming increases particle aspect ratios. Mean particle aspect ratios can be quantitatively estimated using proxies for radar circular depolarization ratios (e.g., Matrosov et al., 2017). Radar depolarization ratios can also be used to distinguish among ice hydrometeor types, effectively separating oblate (e.g., plates, dendrites) from prolate (e.g., columns, needles) habits (e.g., Matrosov, 1991; Reinking et al., 2002; Matrosov et al., 2012; Oue et al., 2015). Schrom and Kumjian (2016) suggested that a complementary use of mean vertical Doppler velocity could help to distinguish the riming process from aggregation-dominated regions. A joint analysis of polarimetric variables and Doppler spectra by Oue et al. (2018) illustrated a capability of particle type identification in Arctic mixed-phase clouds. However, distinguishing between aggregation and the early stage of riming is still challenging even though MDV and polarimetric variables are jointly used due to their similar signatures (e.g., Oue et al., 2016).
Winter storms in the northeast USA often effect heavy snowfall and destruction of life and property. The lack of understanding of ice microphysical processes in the storms and poor representation of the ice microphysics parameterizations in numerical cloud models have resulted in large uncertainty in forecasting snowfall. The ice microphysical processes including depositional, riming, and aggregation growths often coexist in the snowstorm cloudy volumes (e.g., Kumjian and Lombardo, 2017; Colle et al., 2014), making it difficult to identify these processes in the observations. To facilitate studies of cloud microphysics and dynamics in northeast USA, the Stony Brook Radar Observatory (SBRO) was established in March 2017 in Stony Brook University, Stony Brook, NY (Fig. 3). The flagship radar of the SBRO is a very sensitive, sophisticated, and well-calibrated Ka-band (35 GHz) scanning fully polarimetric radar (KASPR). The radar measurements are complemented by two profiling radar systems operating at the W band (94 GHz, ROGER) and K band (24 GHz, MRRPro) and ground-based in situ sensors. The SBRO radar systems have collected vertically pointing triple-frequency reflectivity and Doppler velocity data which were complemented by polarimetric variables from KASPR for a snowstorm observed on 20 February 2019. The triple-frequency measurements showed that the DWR from the dual-wavelength measurements in conjunction with MDV and polarimetric observations had a higher efficiency in distinguishing ice particle types and growth processes rather than the DWR-only diagrams from triple-frequency measurements. This study first illustrates the capability and advantage of the use of MDV and polarimetric radar observables in conjunction with DWR measurements to identify particle types and growth processes in winter storms.
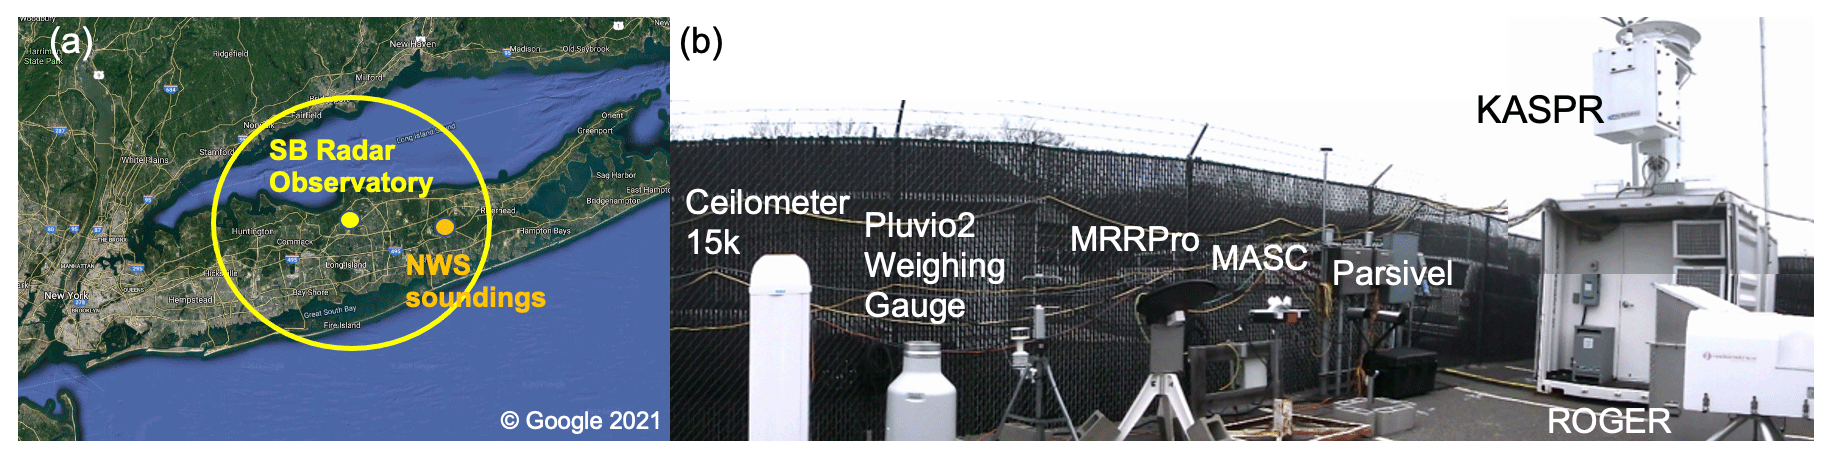
Figure 3(a) Location of the Stony Brook Radar Observatory. (b) Instruments deployed at SBRO. The big yellow circle in (a) represents the KASPR 30 km observation range.
SBRO has been in operation since March 2017 (40.897∘ N, 73.127∘ W; ∼22 km west of a National Weather Service (NWS) sounding site at Upton, NY; https://you.stonybrook.edu/radar/, last access: 24 June 2021). KASPR, ROGER, and MRRPro at SBRO collected triple-frequency data during a snow event on 20 February 2019. This is so far the only case where the high-quality, well-calibrated, triple-frequency measurements together with ground-based in situ measurements for snow particles for the evaluation are available. The SBRO site also has ground-based in situ observation instruments. The in situ instruments including a Parsivel optical disdrometer and multi-angle snowflake camera (MASC; Garrett et al., 2012) were used to evaluate the radar-based particle identifications. The SBRO operates ceilometers at the SBRO and Brookhaven National Laboratory sites. Ceilometer backscatter is sensitive to cloud liquid droplets embedded in ice precipitation clouds. A microwave radiometer was also installed at the SBRO site; however, it was not functional during the precipitation in this study due to significant snow accumulation on the sensor.
2.1 Ka-band (35 GHz) scanning polarimetric radar (KASPR)
KASPR, a state-of-the-art cloud scanning radar, is capable of collecting Doppler spectra and radar moments through alternate transmission of horizontally (H) and vertically (V) polarized waves and simultaneous reception of co-polar and cross-polar components of the backscattered wave with the beamwidth of 0.32∘. Therefore, a full set of polarimetric radar observables are available including the radar reflectivity (ZHH), differential reflectivity (ZDR), differential phase (φDP), co-polar correlation coefficient (ρhv), linear depolarization ratio (LDR), and cross-polar correlation coefficient (ρhx), along with the Doppler velocity and spectral width. The specific differential phase (KDP) is estimated using an iterative algorithm proposed by Hubbert and Bringi (1995). The data post-processing details are described in Oue et al. (2018). KASPR was calibrated using a corner reflector technique, providing reliable reflectivity data to calibrate the data of the other two radars. The detailed configurations are also available in Kumjian et al. (2020) and Kollias et al. (2020b).
During the radar measurements on 20 February 2019, KASPR executed a scanning strategy that consisted of surveillance (plan position indicator, PPI) scans at a 15∘ elevation angle, a zenith-pointing PPI, hemispheric range–height indicator (HSRHI) scans at four azimuth angles, and a 5 min vertically pointing (VPT) mode during which Doppler spectrum data were collected. This pattern was repeated and took approximately 15 min to complete. During a 15 min cycle, two 15∘ PPI scans were included, so we had the 15∘ PPI scans every ∼7 min which were used to produce quasi-vertical profile products. The PPI and HSRHI scans were performed in a full polarimetry mode with scan speeds of 6 and 2 s−1, respectively, to collect data with a 30 m range-gate spacing, 0.6∘ PPI azimuthal spacing, and 0.3∘ HSRHI elevation spacing. The VPT mode was executed with only horizontally polarized waves transmitted and both horizontally and vertically polarized waves received. During the VPT mode, the Doppler spectra were collected every second with a 15 m range-gate spacing and 0.04 m s−1 velocity bin spacing. The zenith PPI scans were used to estimate a systematic bias of ZDR. The ZDR values presented in this study were corrected for the systematic biases.
2.2 W-band (94 GHz) compact solid-state frequency-modulated continuous-wave (C-FMCW) profiling radar (ROGER)
The system was initially developed as an airborne radar and was integrated on the Center for Interdisciplinary Remotely-Piloted Aircraft Studies Twin Otter aircraft (Mead et al., 2003). In 2017, the system was refurbished by installing 61 cm parabolic dish antennas and upgrading all the C-FMCW electronics, including a new metal frame to hold the antennas, the server computer and the power supplies, to make it suitable for ground-based observations and easy shipping.
This radar system is capable of collecting Doppler spectra with spatiotemporal resolutions similar to those of KASPR (Table 1) and located next to KASPR, which allows good beam matching and reliable DWR measurements. The data during the cases were collected every 4 s at 30 m vertical spacing with a beamwidth of 0.3∘ (Table 1).
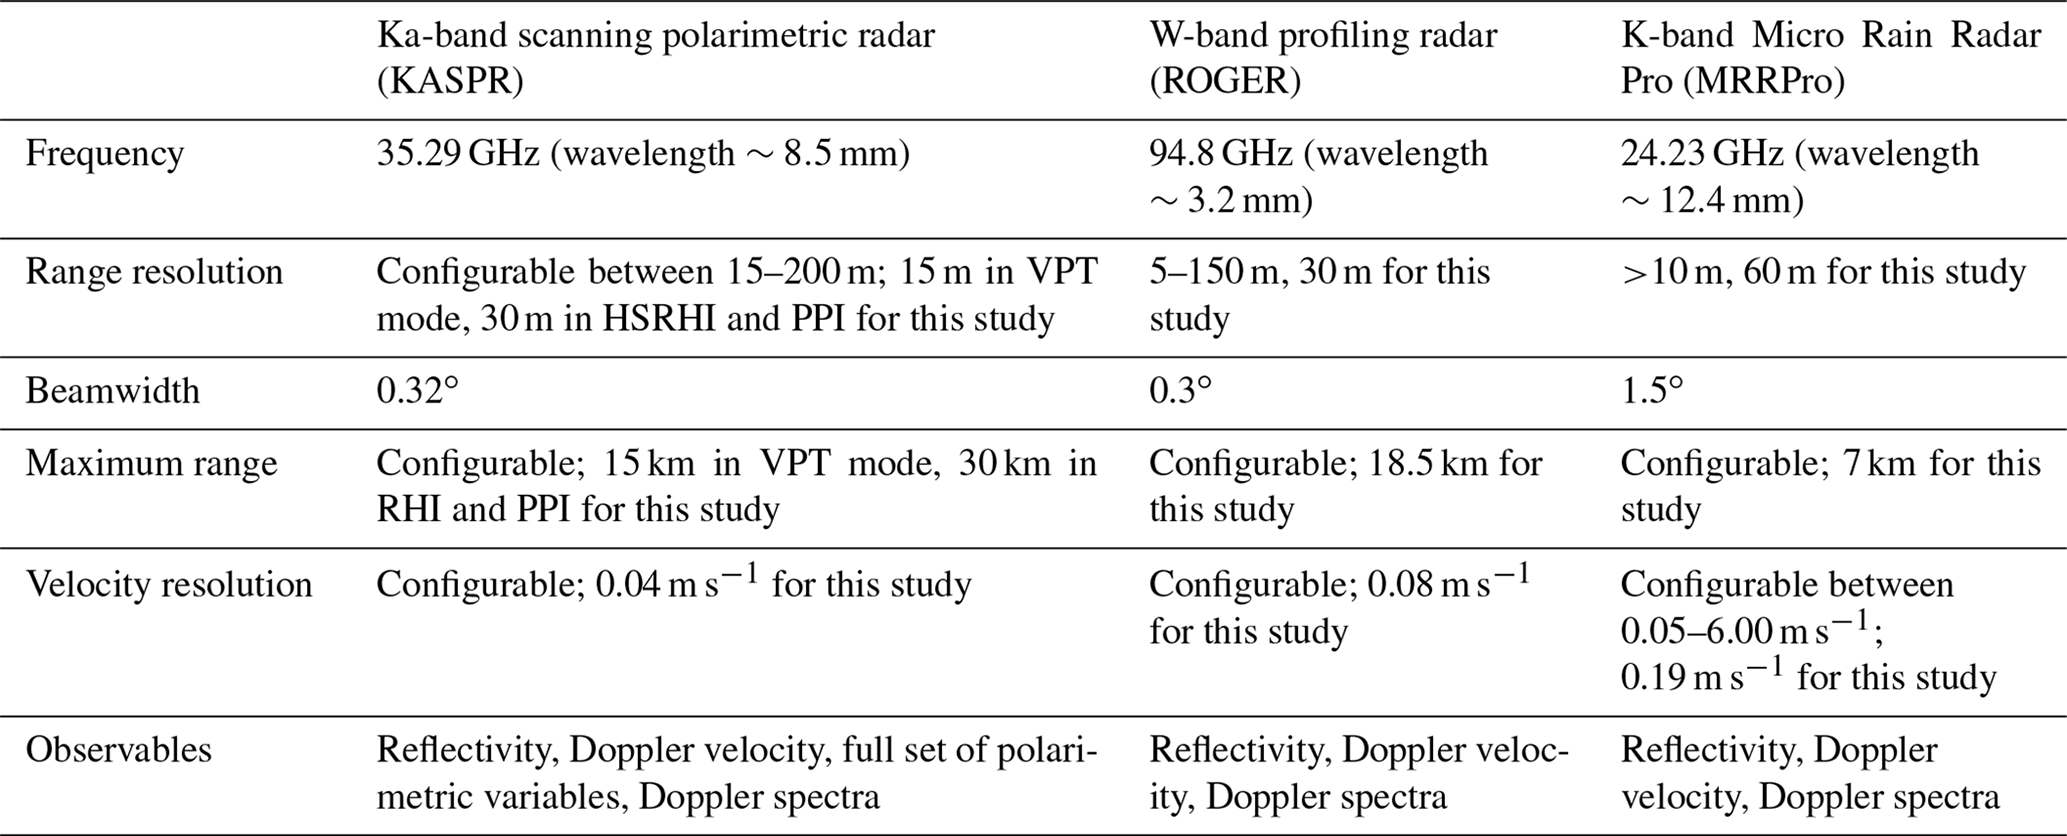
2.3 K-band (24 GHz) Micro Rain Radar Pro (MRRPro)
The MRRPro is the latest version of the MRR developed by Metek GmbH that has evolved to be a powerful standalone profiler for investigations of precipitation and cloud dynamics with very low installation and logistics effort. The MRRPro features a high-performance processing unit which significantly improves the options in the operating parameters (Table 1). During the observation in this study, the MRRPro collected Doppler spectra at a 60 m range-gate spacing every 4 s up to the maximum observation range of 7 km. The Nyquist velocity was 12.08 m s−1 during the observations producing the velocity bin spacing of 0.192 m s−1.
2.4 Ground-based in situ measurements
A Parsivel optical disdrometer measures terminal velocity and the horizontal size of individual precipitation particles passing through a sheet of light (30 mm wide, 1 mm high, and 180 mm long) with a 650 nm laser diode with a power of 3 mW (Löffler-Mang and Blahak, 2001). The total measuring surface has an area of 54 cm2. The measured size and velocity are classified into 1 of 32 size bins ranging from 0.062 to 24.5 mm and 32 velocity bins ranging from 0.04 to 20.5 m s−1 every minute.
The multi-angle snowflake camera (MASC) is located adjacent to the Parsivel. The MASC consists of three cameras that are separated by an angle of 36∘, each pointed toward the focal point about 10 cm away (Garrett et al., 2012; Garrett and Yuter, 2014). On top of each camera rests a 2700 lm light-emitting diode. The focal point lies within a ring that has two near-infrared emitter–detector pairs arranged in arrays that are separated vertically by 32 mm. The arrangement of the emitter–detector pairs allows for a trigger depth of field of 3100 mm2 but because of the camera field of view and depth of focus, only about 11 % of the images taken are in focus. Falling hydrometeors larger than 0.1 mm are recorded, and their fall speed is calculated as the time difference between triggering each emitter–detector pair.
3.1 Reflectivity calibration and DWR estimation
KASPR reflectivity measurements were well calibrated using a corner reflector technique (Lamer et al., 2021). Therefore, systematic offsets for the MRRPro and ROGER total reflectivities have been corrected by comparing them with the KASPR reflectivity at cloud bases from a different non-precipitating cloud case. The MRRPro and ROGER reflectivity and mean Doppler velocity data were interpolated into the KASPR VPT data resolution (15 m range and 1 s time spacings).
Gaseous attenuation needs to be considered and corrected when using short-wavelength radars (Lamer et al., 2021). The MRRPro's K-band (24 GHz) frequency is the lowest in the present study; however, the 24 GHz frequency is very close to a peak in the water vapor absorption spectrum (e.g., Liebe et al., 1993; Rosenkranz, 1998). Therefore, the water vapor attenuation for MRRPro could also be significant. We corrected the MRRPro, KASPR, and ROGER reflectivities for water vapor attenuation based on the Rosenkranz (1998) results, using sounding profiles launched twice daily (00:00 and 12:00 Z) at Upton, 21 km east of the observatory. The estimated column-integrated two-way attenuations at K, Ka, and W bands for our case study were up to 0.7, 0.2, and 1.2 dB, respectively.
Another source of the gaseous attenuation we should consider is oxygen (e.g., Liebe et al., 1993). Although the attenuation in oxygen may not be as large as that in water vapor, it may be non-negligible. We also estimated the attenuation by oxygen (i.e., dry air) for each of the three frequencies using the sounding profiles and corrected the MRRPro, KASPR, and ROGER reflectivities. The estimated column-integrated two-way attenuations for dry air at K, Ka, and W bands were generally 0.1, 0.2, and 0.3 dB, respectively.
Liquid water, which was expected to be present in precipitating clouds as supercooled droplets producing riming, can also be a cause of significant attenuation. Riming commonly occurs in snowstorms observed along the US northeast coast, indicating the presence of significant amounts of supercooled cloud water in the snowstorms (e.g., Colle et al., 2014). However, it was difficult to identify liquid cloud layers and liquid water content and estimate specific attenuation at each range bin in the ice clouds. Moreover, attenuation by ice particles might be significant if the large amount of ice were produced in the clouds and the radar beam passed through the ice layers. Tridon et al. (2020) proposed a relative path-integrated attenuation (PIA) technique to retrieve liquid water content using DWR profiles. A key idea of this technique is that the DWR from dual-frequency radars near cloud tops, where it is expected that small ice crystals are in the Rayleigh scattering regime for both radar wavelengths, is mainly due to the PIA associated with liquid cloud droplets and ice particles. The DWR attributed to the total attenuation should then be equal to the DWR plateau near the cloud top. We applied the technique of Tridon et al. (2020) to the DWR from KASPR and ROGER measurements to find the DWR plateau near the cloud top as follows:
-
The measured DWRKaW values are averaged over 450 m (30 gates) and 20 s (20 rays). The range window was adapted for this study.
-
The DWR variance within the moving windows defined above must be lower than 4 dB2. Because the DWR data were still noisy after the averaging, we used a larger window size (450 m) than in Tridon et al. (2020).
-
KASPR reflectivity and its variance (within the same moving windows) must be lower than 5 dBZ and 2.5 dB2, respectively.
-
The DWR plateau is found where the DWR gradient is lower than 1 dB km−1 near the cloud top at each profile.
-
The masked DWRKaW is averaged at the cloud-top layer, and the DWR value is considered the total PIA.
The ROGER reflectivity was corrected for the estimated PIA linearly in the cloud layer from the ice cloud base so that the total attenuation in the column was consistent with the estimated PIA. This assumption might produce an uncertainty; however, this kind of correction showed reasonable results compared to no correction for PIA, as demonstrated by previous studies (e.g., Dias Neto et al., 2019; Oue et al., 2018). The DWR plateau-based PIA estimation technique requires enough sensitivity to capture cloud tops where Rayleigh scattering is expected for both. The MRRPro is sufficiently sensitive to precipitation (Fig. 4c) but not to small particle populations with reflectivity <0 dBZ. The MRRPro reflectivity near its echo top could still include non-Rayleigh scatterings at Ka or W bands. Because of this, attenuations by hydrometeors in the KASPR and MRRPro reflectivity fields were not accounted for using the DWR plateau-based attenuation correction in this study. Moreover, the presence of supercooled liquid droplets might cause total signal extinction. A microwave radiometer deployed at the SBRO observed liquid water path (LWP) values, which were generally around 150 g m−2 before the precipitation onset. According to Tridon et al. (2020), this amount of liquid should produce a path-integrated attenuation of less than 1 dB in the KASPR and MRRPro reflectivity measurements.
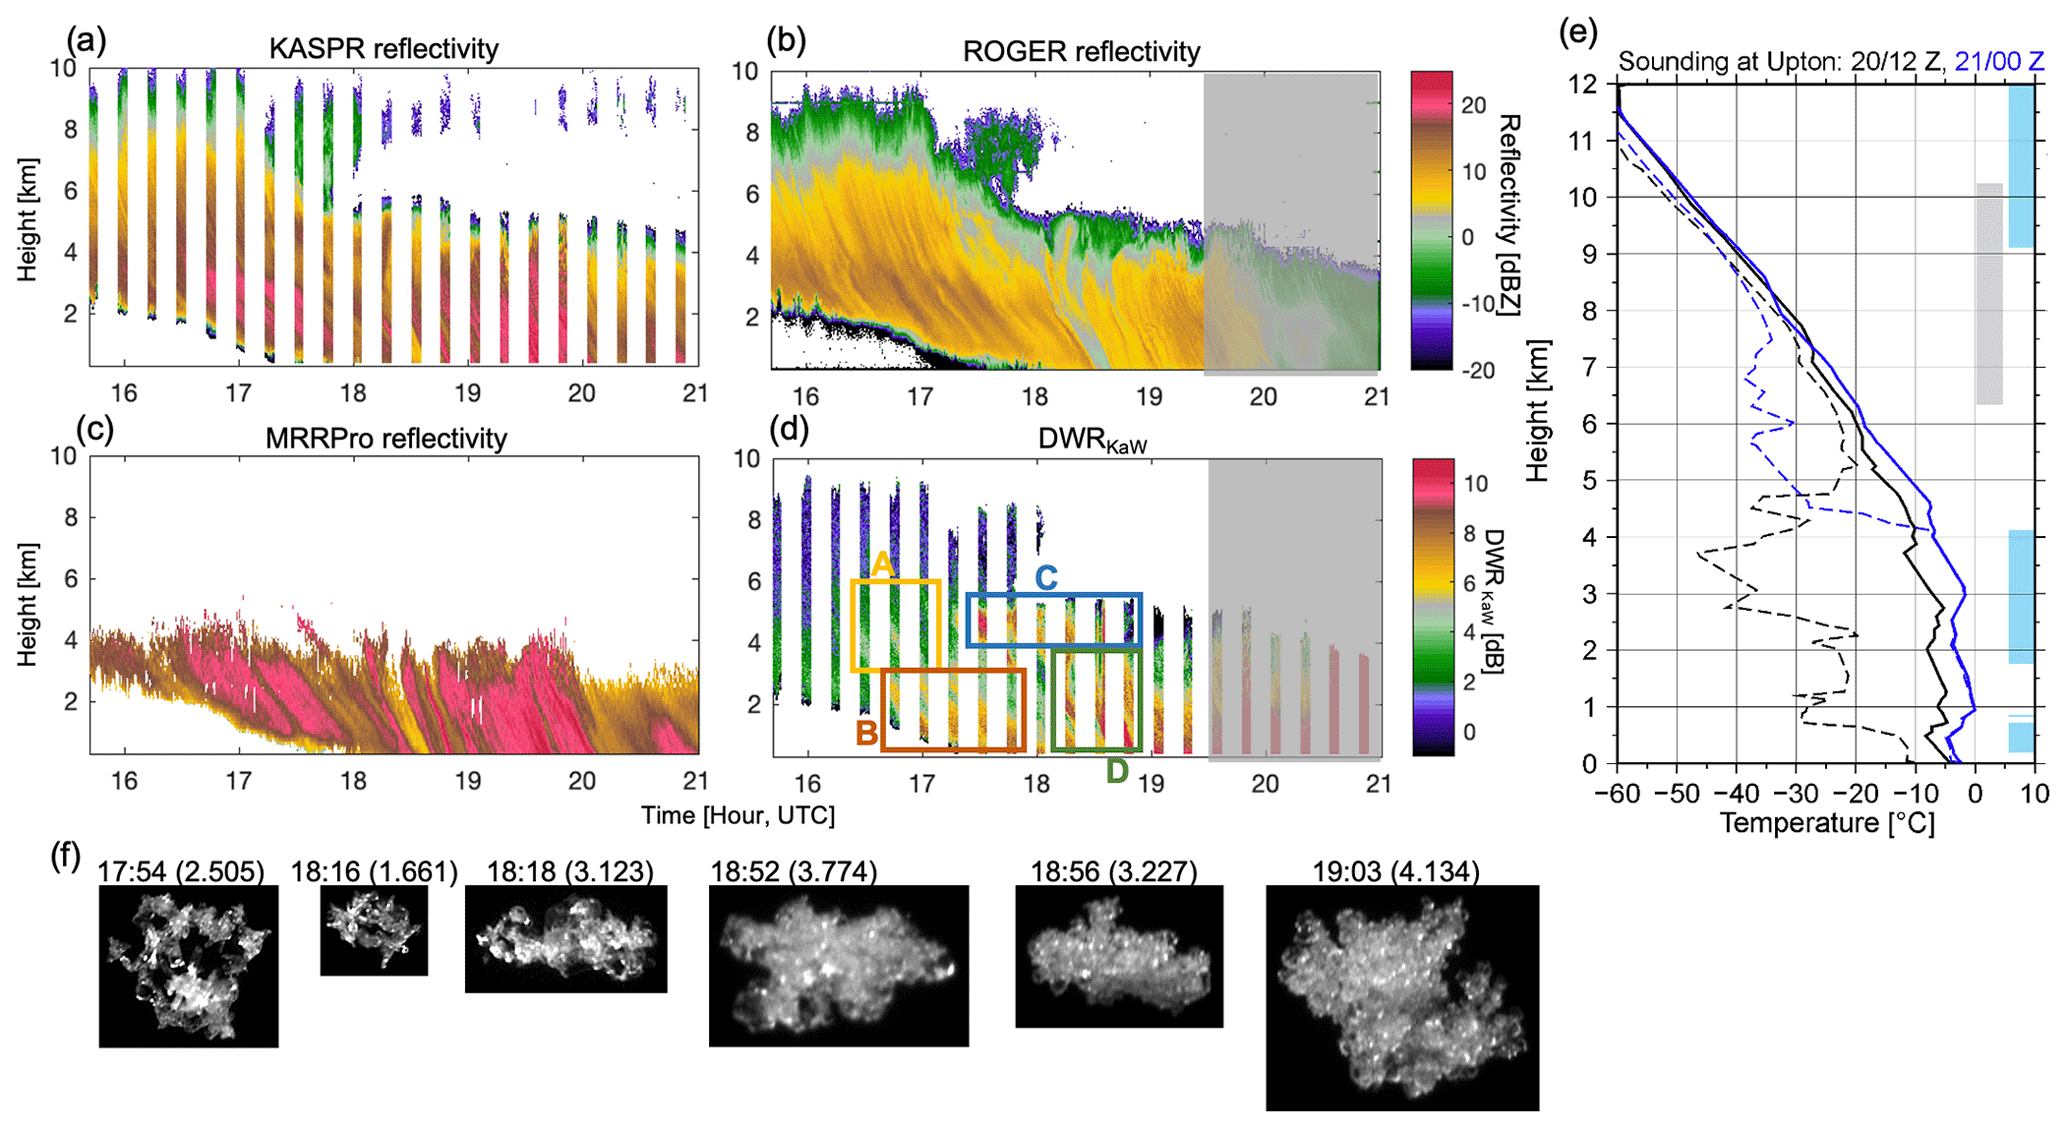
Figure 4Height–time cross sections of (a) KASPR VPT reflectivity, (b) ROGER reflectivity, (c) MRRPro reflectivity, and (d) DWR of KASPR reflectivity to ROGER reflectivity on 20 February 2019; (e) vertical profiles of temperature (solid line) and dew point temperature (dashed line) from the NWS Upton sounding measurements at 12:00 UTC on 20 February (black color) and 00:00 UTC on 21 February (blue color) 2019; and (f) examples of snowflake images captured by the MASC. Boxes in (d) represent analysis regions used for Figs. 7–10. Gray and blue shades in (e) represent regions of supersaturation with respect to ice for 12:00 UTC on 20 February and 00:00 UTC on 21 February, respectively. Each image in (f) displays observation time and maximum dimension in parentheses (unit is mm).
Another error source of the DWR analysis is radar beam mismatching. The three radars were located at the same observation site; the distances between those radars were less than 5 m; therefore, we expect that the beam mismatch due to location is small. On the other hand, a difference in beamwidths (Table 1) is another possible cause of beam mismatching. The KASPR and ROGER beamwidths are well matched, while MRRPro's beamwidth is 5 times larger than those of KASPR and ROGER. The beamwidth differences between MRRPro and KASPR and between MRRPro and ROGER might result in larger variabilities in DWRs.
3.2 Mean Doppler velocity
Similarly to the reflectivity measurements, the MRRPro and ROGER mean Doppler velocity data were interpolated into the KASPR VPT data resolution. The observed mean Doppler velocities from the three radars were corrected for air density changes based on the sounding profiles and adjusted to the surface.
3.3 KASPR polarimetric observables
The polarimetric radar observables such as ZDR and KDP are more prominent when they are collected at lower-elevation scans, whereas the DWR data were collected by vertically pointing measurements. To compare those two data sets from the different types of scans, we employed a quasi-vertical profile (QVP) technique proposed by Ryzhkov et al. (2016). The QVP technique azimuthally averages polarimetric radar variables for each conical PPI scan at non-zero elevations to produce these variables in a height-versus-time format. The QVPs have high vertical resolutions allowing for capture of important polarimetric radar signatures and their evolution (e.g., Griffin et al., 2018, 2020; Kumjian and Lombardo, 2017; Troemel et al., 2019). We use the PPI scans at an elevation angle of 15∘ every 7–8 min with a scan rate of 6∘ s−1. Since the slant range resolution of the 15∘ PPI data is 30 m, the corresponding QVP data have vertical spacing of approximately 10 m and a maximum height of 7.8 km. Note that the actual vertical resolution of QVP is determined by the vertical size of the radar resolution volume, which increases with distance from the radar (Ryzhkov et al., 2016). The use of conical PPI at a higher elevation angle (15∘) for QVP reconstruction ensures relatively high horizontal resolutions at lower altitudes (11 km at the height of 2 km) that facilitates direct comparison with the DWR profiles from the three radar vertically pointing measurements. The KASPR QVP data were interpolated into the KASPR VPT data resolution, similarly to in Oue et al. (2018). Because a single PPI scan was performed every 7 min while the KASPR 5 min VPT dwell collecting profile data every second was performed at a 15 min interval, a single KASPR QVP corresponds to about 150 DWR profiles.
During the 2018/19 and 2019/20 winter seasons, most precipitation was non-dry snow including rain, wet snow, refrozen particles, and sleet, with very few dry-snow events at the ground around Long Island, NY. Those non-dry snow particles caused significant attenuation of radar signals particularly at millimeter wavelengths and accumulation on the radomes. Although the majority of the observed precipitation cases during the winter seasons included the non-dry snow particles near the ground, for a few cases before snow started to accumulate, ice clouds (with, possibly, embedded supercooled cloud layers) were observed aloft. We selected a period from a snow precipitation case on 20 February 2019, when KASPR in VPT mode, ROGER, and MRRPro simultaneously observed snowfall without significant attenuations.
A high-pressure system at the surface persisted around Long Island from 09:00 to 21:00 UTC on 20 February 2019, while two troughs were also identified to the southeast of Long Island: one was elongated from a low-pressure system in Tennessee to Pennsylvania and the other was associated with another low-pressure system around the coast of Georgia and lay along the east coast toward Long Island. Either one of the two or both could be accompanied by a warm frontal-like stratiform precipitation providing snow in Long Island. Snow precipitation started at around 18:00 UTC at SBRO. Based on the MASC-observed particle images and Parsivel-observed particle diameter and fall velocity, dry snow aggregates dominated from the beginning till 23:30 UTC, and then the dominant precipitation included mixed-phase particles and changed into pure rain at around 04:00 UTC on 21 February.
Figures 4 and 5 show the time–height curtain images of the reflectivities from the three radars and KASPR and ROGER MDV together with KASPR polarimetric QVPs. The triple-frequency measurements started at 15:41 UTC. The cloud base descended until the lidar backscatter signal reached KASPR's lowest gate (0.4 km altitude) at 19:00 UTC. The cloud top attained a 10 km altitude, but the cloud top was decoupled from the ice precipitation from 17:45 UTC onwards.
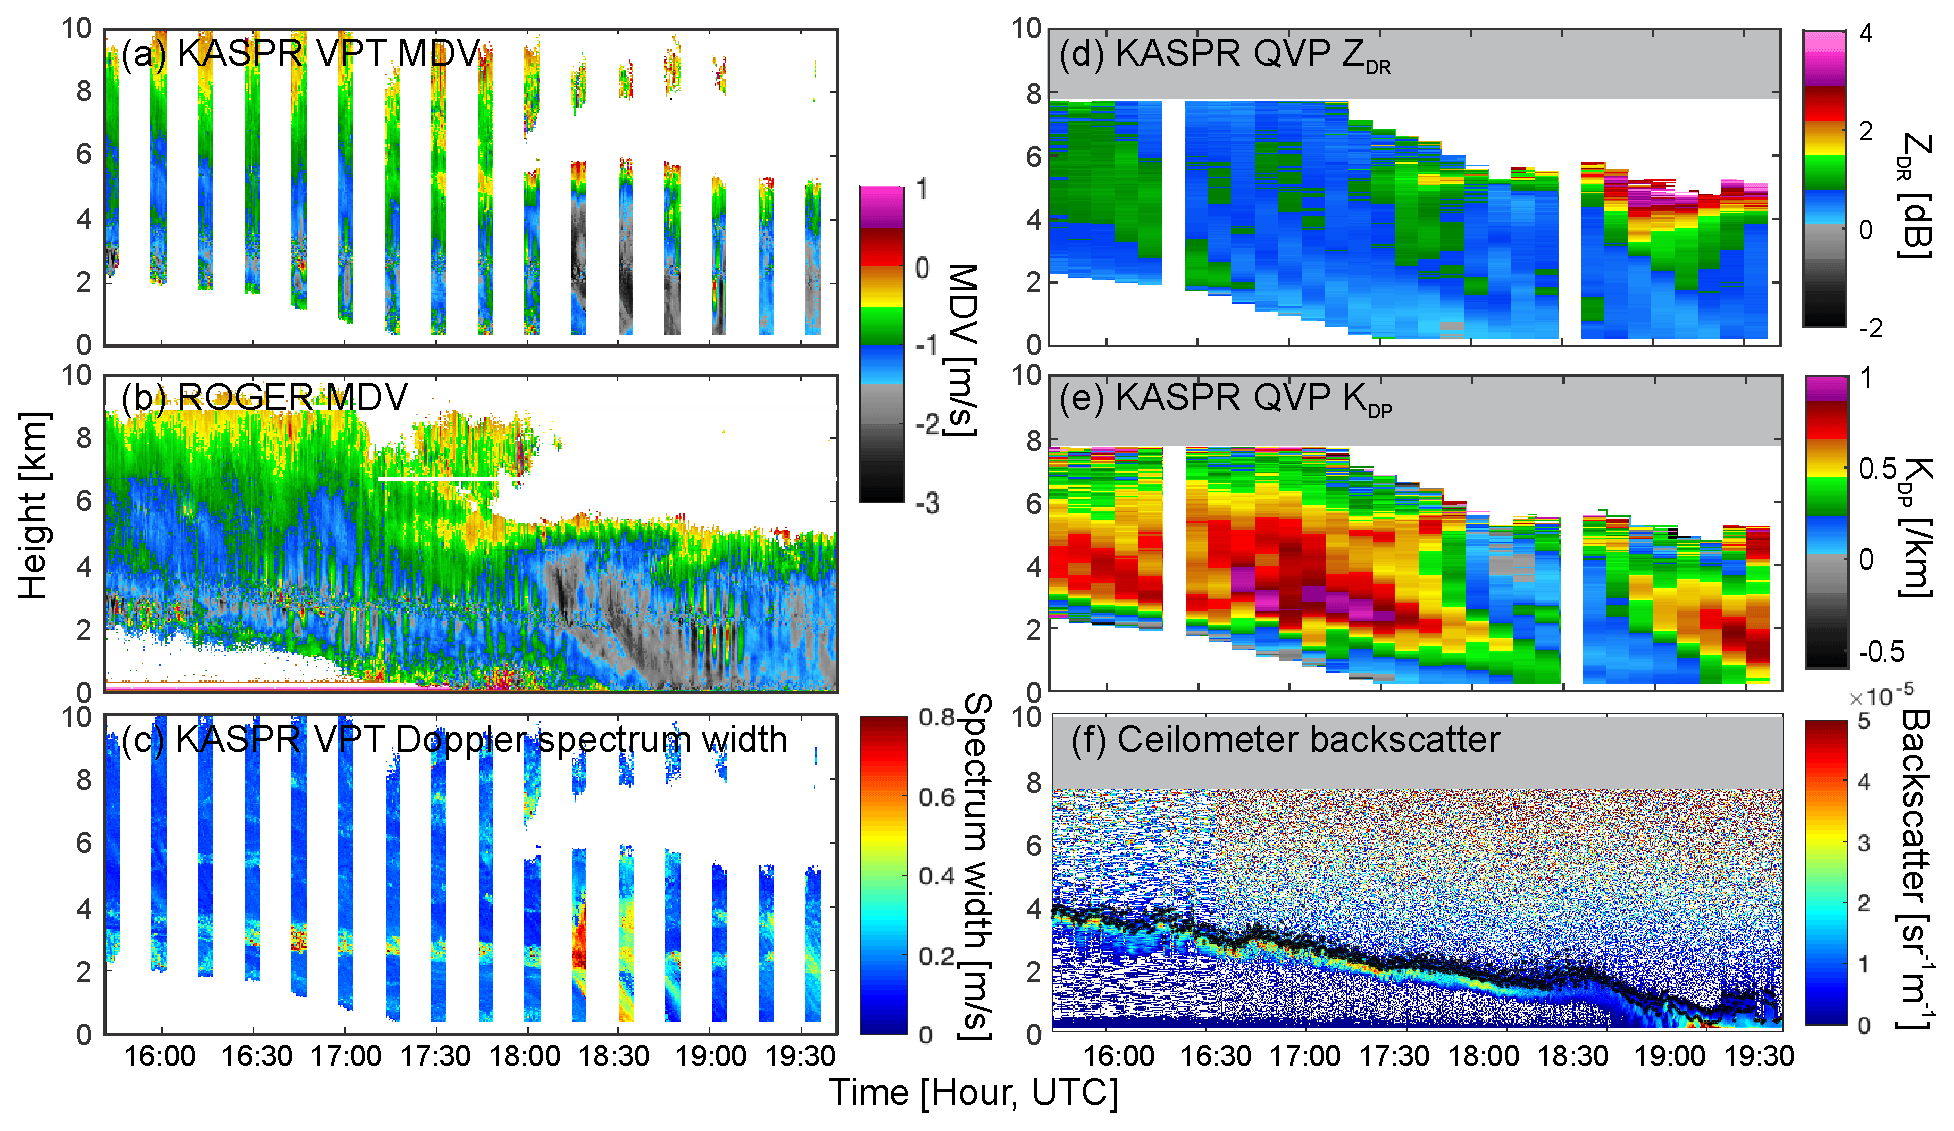
Figure 5Height–time cross sections of (a) MDV from the KASPR VPT measurements, (b) MDV from the ROGER measurements, (c) spectrum width from the KASPR VPT measurements, (d) QVP of KASPR ZDR, (e) QVP of KASPR KDP, and (f) ceilometer backscatter on 20 February 2019. Black dots in (f) represent cloud base heights.
The KASPR and ROGER reflectivity fields indicated generation of cell-like features by 17:10 UTC near the cloud top above an 8 km altitude (Fig. 4), as the MDV indicated convection features in the generating cells (Fig. 5). These generating cells produced fallstreaks underneath as reflectivity increased toward the ground and reached the ground by 18:20 UTC. KASPR RHI scans in Fig. 6 showed fallstreaks elongating from the generating cell layer following the wind direction above the 2 km altitude (W–E direction). The KASPR ZDR was enhanced between the fallstreaks while KDP increased in the lower part of the enhanced ZDR layer and just below the enhanced ZDR layer. The enhancement of ZDR was generated at a height of 5–6 km, where the temperature ranged from −20 to −15 ∘C, corresponding to a dendritic growth layer and close to supersaturation with respect to ice from the 12:00 UTC sounding (Fig. 4e). This is a typical signature of the aggregation and generation of dendritic crystals commonly observed by previous studies (e.g., Kennedy and Rutledge, 2011; Schneebeli et al., 2013; Kumjian et al., 2014; Williams et al., 2015; Oue et al., 2018). The DWRKaW increased toward the ground in the fallstreaks, as reflectivity increased. At times corresponding to the fallstreaks reaching the ground, the MASC observed large aggregates.
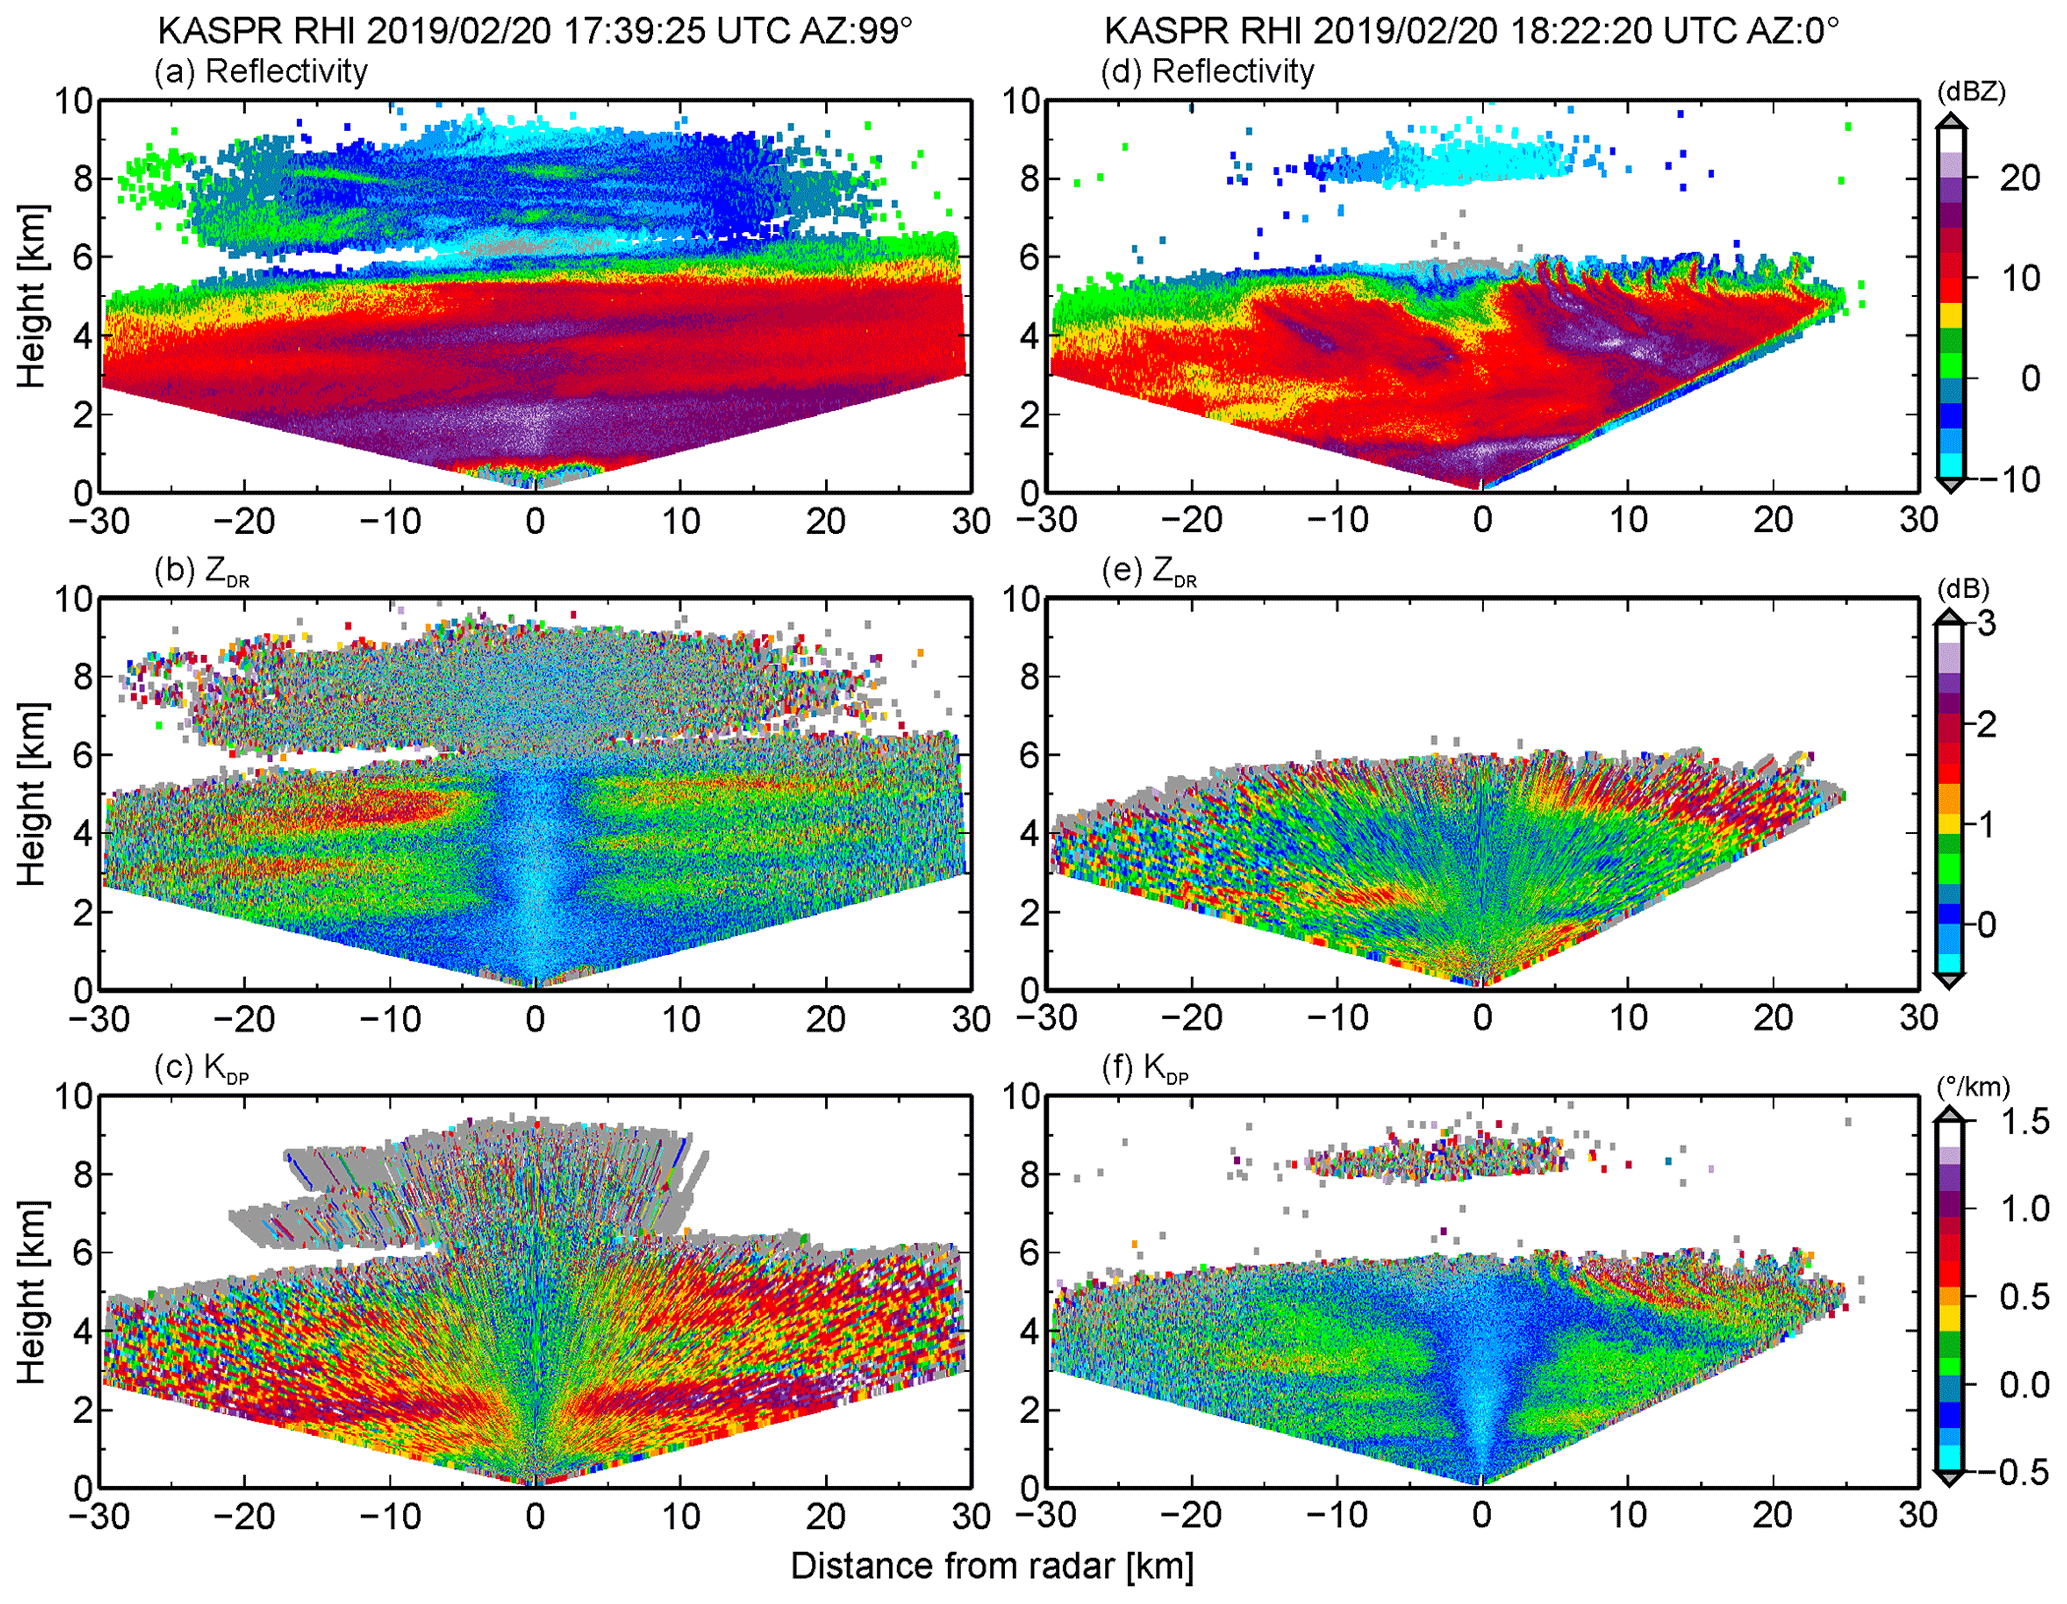
Figure 6KASPR (a, d) reflectivity, (b, e) ZDR, and (c, f) KDP from RHI measurements (a, b, c) at 17:39 UTC at an azimuth angle of 99∘ and (d, e, f) at 18:22 UTC at an azimuth angle of 0∘.
Starting from 17:50 UTC, precipitation observed at the surface originated at a 6 km altitude. The KASPR RHI measurements revealed that cloud aloft was decoupled from below and there were structured generating cells near the lower cloud top at 6 km (Fig. 6). Large ZDR values were observed between the generating cells and between fallstreaks, while KDP slightly increased just below the generating cell layer but decreased to near zero within the fallstreaks. There was a layer of large DWRKaW at 4–5.5 km altitude from 17:15 to 18:50 UTC, even though the Ka-band reflectivity was smaller than that in the former fallstreaks. The large DWRKaW extended toward the ground and reached the surface at 18:30 UTC (Fig. 4d), as the KASPR polarimetric signatures associated with the fallstreaks reached the surface (Fig. 5d and e). Corresponding to the time when the fallstreak features reached the surface, the MASC observed rimed particles (Fig. 4f). These DWR and polarimetric features likely indicate ice particle growth; however, it is hard to determine specific ice growth processes (i.e., distinguishing riming and aggregation processes) from the DWRKaW or the polarimetric observables only.
There are several signatures that suggest different types of ice particle growth during the two periods. A distinct difference between the two periods is found in the MDV from the vertically pointing measurements and the KASPR polarimetric observables; they suggest different ice particle fall speeds attributed to the particle types and microphysics. The downward motion within the fallstreaks during the first period gradually increased toward the ground to 1.5 m s−1, indicative of growth of individual ice particles. The fallstreaks corresponded to the enhanced KDP but decreased ZDR, suggesting that oblate small particles aggregated within the fallstreaks. In contrast, the latter period corresponded to decreased KDP, while ZDR values are enhanced near the 6 km altitude but decreased toward the surface. These KDP and ZDR evolutions suggest that small oblate ice crystals formed at an 6 km altitude and aggregated as they fell, forming more spherical shapes, as many previous polarimetric radar studies have observed. The MDV showed faster downward motion compared to the fallstreaks in the first period, suggesting heavy aggregation and/or riming.
Another interesting characteristic to be noted is that there was a distinct region of turbulence, which can clearly be seen as a layer with a large spectrum width and variability in MDV at around a 3 km altitude. This was consistent with large lidar backscatter values suggesting the presence of a liquid cloud base. The reflectivity and DWR of fallstreaks were intensified below the turbulence layer.
Although the individual radar parameters suggest a variety of ice particle types and microphysical processes, it is not straightforward to identify the ice particle types and distinguish the processes, in particular aggregation and riming, by a single measurement.
5.1 DWRs from the three frequencies
Based on the DWRKaW height–time plots, we selected four regions as shown in Fig. 4d, each of which had similar characteristics in terms of DWRs, MDV, and polarimetry to identify ice particle types and their growth processes. We first present traditional triple-frequency DWR–DWR diagrams (DWRKW versus DWRKKa in Fig. 7) for each selected region. The DWRs from Region A and Region B tend to be distributed toward the model low-rime-degree lines (smaller DWRKW at a given DWRKKa), while those from Region C and Region D were distributed toward the higher-rime-degree regions (larger DWRKW at a given DWRKKa). These are consistent with MASC ice particle observations. Although the distribution of the DWRs for each region seems to be significantly separated, most of the data overlap, making it hard to distinguish the growth processes and types. This is, in part, because K-band (24 GHz) and Ka-band (35 GHz) measurements are not sufficiently separated in the frequency domain.

Figure 7(a)–(d) DWRKKa-versus-DWRKW diagrams for regions A, B, C, and D, respectively. Color shades represent normalized frequency. Lines in each panel represent the SSRGA calculations using particle type and PSD models described in Appendix A. The color line legend is the same as in Fig. 1a, and black lines are same as black lines in Fig. 1b.
Besides the insufficient frequency separation, there are data points that deviate from the model lines in the DWRKW-versus-DWRKKa field in each region. There are several causes of such deviations (e.g., Lamer et al., 2021). The most likely cause is unaccounted for attenuations particularly at Ka and W bands due to supercooled cloud water or ice or both. The ceilometer backscatter measurements shown in Fig. 5f, in addition to the MWR LWP measurements, suggest that thin supercooled liquid cloud layers were indeed present at least around the large Doppler spectrum width layer. Unfortunately, the ceilometer backscatter information is insufficient to provide a complete mapping of such layers because of complete signal extinction caused either by the ice clouds or by underlying liquid layers themselves. Ice particles could also cause signal attenuation (Battaglia et al., 2020; Tridon et al., 2020) particularly for the shorter-wavelength radars. Although the DWR plateau-based PIA technique has corrected the ROGER reflectivity for those attenuations related to the KASPR reflectivity (Sect. 3.1), the attenuation in the KASPR reflectivity itself cannot be accounted for in this study. This factor also causes underestimation of the PIA-corrected ROGER reflectivity.
Secondly, the beam mismatch could be significant when the radar beams penetrate fine narrow fallstreaks, even though the radars were collocated within 5 m of each other. As mentioned previously, the KASPR and ROGER beamwidths are well matched (0.3∘), while the MRRPro's beamwidth is 5 times larger (1.5∘). The radar sampling volumes, which are larger at higher altitudes, cannot resolve the small-timescale and small-spatial-scale phenomena, and the difference in beamwidth is a source of uncertainty. Moreover, the ice particle models may not represent the whole gamut of ice particles possibly present in the clouds.
5.2 DWRs coupled with MDV and polarimetric variables
Observed MDV is mainly attributed to the vertical air motion and the particle fall speeds, which are sensitive to particle size, rime degree, size distribution, and type and can provide additional information to distinguish ice types and processes. Kneifel and Moisseev (2020) demonstrated that MDV is a function of rime fraction. We further illustrate that MDV coupled with DWR shows a good indicator of degree of riming. Figure 8 shows the observed DWRKaW as a function of KASPR MDV together with the model plot with different rime degrees (lines). Most of DWRKaW values from Region A are less than 7 dB and are located between the middle-rime-degree (yellow and cyan) and low-rime-degree (red and magenta) lines, suggesting light riming of small aggregates (Fig. 8a). These particles could grow keeping a similar degree of riming by aggregation, as the data points from Region B are shifted toward larger DWRKaW values between the middle-rime-degree and low-rime-degree lines (Fig. 8b). It is possible that the turbulence layer at around a 3 km altitude (Fig. 5b and c) contributed to light riming. The turbulence also contributed to the wide distribution of MDV.
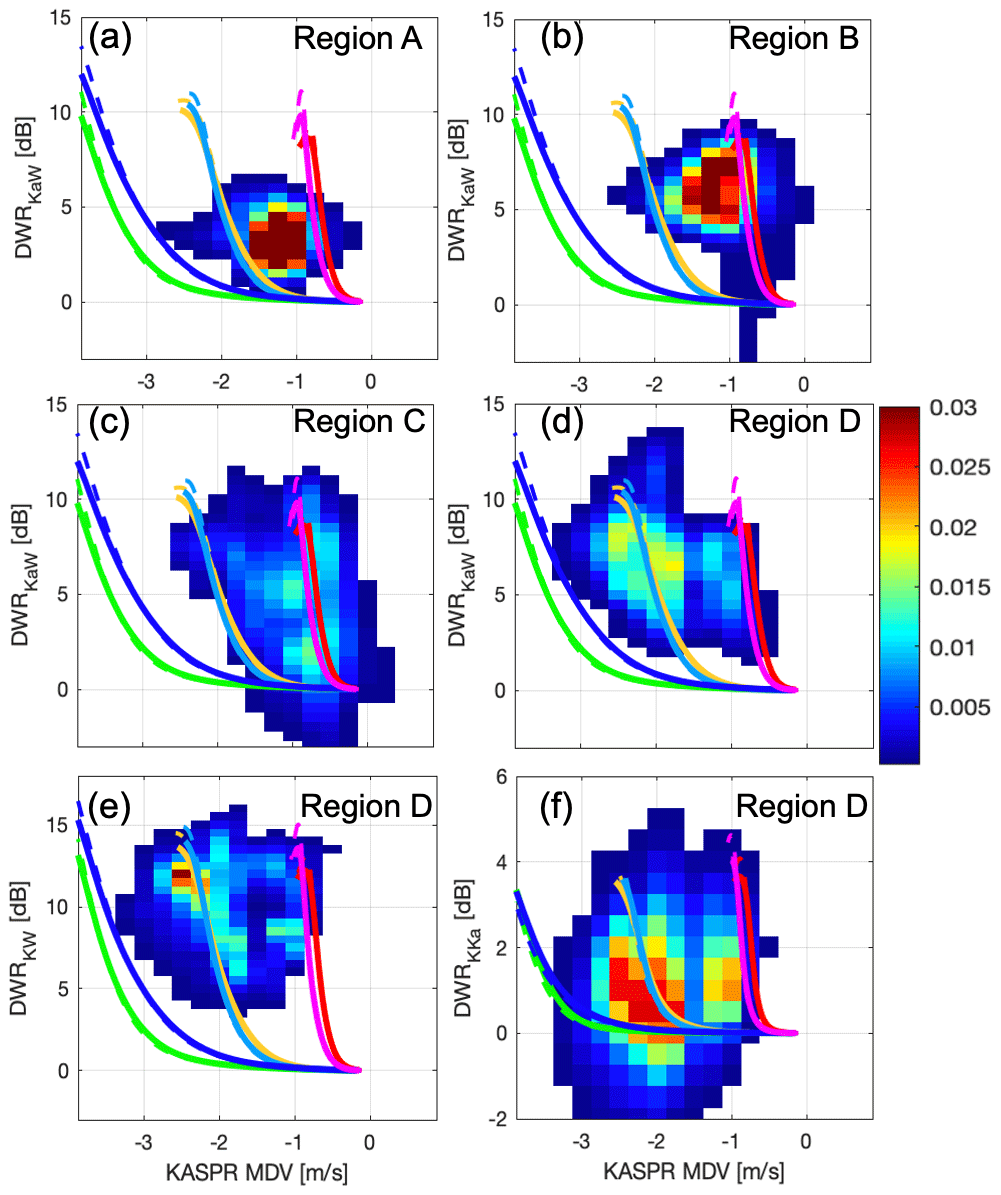
Figure 8(a)–(d) Diagrams of KASPR VPT MDV versus DWRKaW for regions A, B, C, and D, respectively. (e) Diagram of KASPR VPT MDV versus DWRKW for Region D and (f) of KASPR VPT MDV versus DWRKKa for Region D. Color shades represent normalized frequency. Lines in each panel represent the SSRGA calculations using different particle models and PSDs described in Appendix A. The legend for the lines is as in Fig. 1.
DWRKaW from Region C generally follows the low-rime-degree particle lines; DWRKaW increased from near zero to 10 dB while MDV changed from near zero to −0.8 m s−1. Some data points are shifted toward the middle-rime-degree particle lines (i.e., faster downward motion at a given DWRKaW). These data clusters suggest that the aggregation dominated, but some particles started riming. Region D, which is located below Region C, also has generally two data clusters. A smaller data cluster closely follows the low-rime-degree lines, as the DWRKaW increased 2 to 9 dB while the MDV changed from −0.6 to −1.3 m s−1. The other population, which has higher occurrence, is generally along the middle-rime-degree lines; the DWRKaW increased from 3 to 12 dB while the MDV changed from −1.8 to −2.5 m s−1 in the middle of the population. The left edge of the second data population is closer to the higher-riming-degree (blue and green) lines. Those downward MDVs belonging to the two populations are consistent with fall velocities of aggregates and heavily rimed particles, respectively, as reported by Locatelli and Hobbs (1974). These characteristics suggest that aggregates produced near the cloud top at 6 km rimed during the falling as particle fall speeds quickly increased. These distinct separations of the particle populations associated with the particle growth processes are not clearly found in the triple-frequency DWR field in Fig. 7, whereas these are shown not only in the fields of DWRKaW versus KASPR MDV but also in the DWRKW-versus-MDV (Fig. 8e) and DWRKKa-versus-MDV (Fig. 8f) diagrams.
Adding polarimetric information supports this interpretation and gives further insights into particle microphysics in terms of their shapes. Figure 9a–d and e–h are the same as Fig. 8a–d, but the color shades represent KASPR QVP ZDR (Fig. 9a–d) and KDP (Fig. 9e–h), respectively. For the data following the low-rime-degree lines for Region C and Region D, ZDR values decreased as DWR increased (Fig. 9c, d), while KDP values slightly decreased by approximately 0.2∘ km−1 (Fig. 9g, h). It can be interpreted that small ice particles producing near-zero DWRs were horizontally oriented oblate particles in the dendritic crystal growth zone (temperature of −15 to −10 ∘C), which produced large ZDR values and then aggregated into large crystals as DWR increased. On the other hand, the individual frequency pair DWR for vertically pointing measurements also strongly depends on particle aspect ratios (Matrosov et al., 2019). The impacts of particle aspect ratio on DWRKaW values could be as high as ∼3 and ∼5 dB for particle distributions with a median volume size of 1 and 2 mm, respectively (Matrosov, 2021). The increase in DWRKaW in the diagrams can include both the particle size and the particle shape effects.
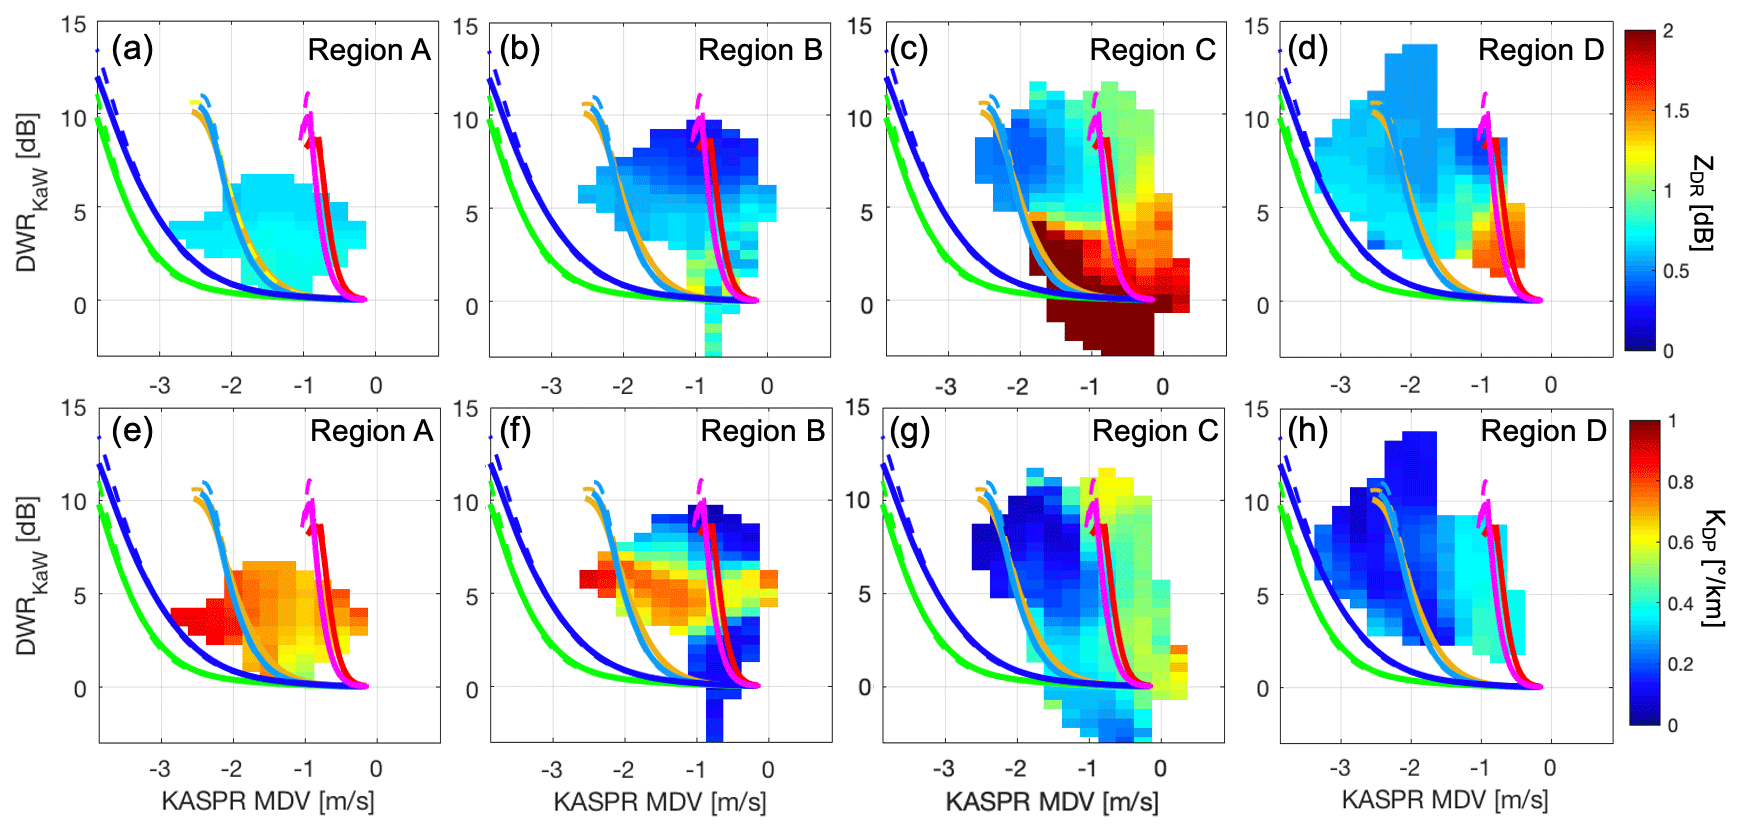
Figure 9Diagrams of KASPR VPT MDV versus DWRKaW for (a, e) Region A, (b, f) Region B, (c, g) Region C, and (d, h) Region D. Color shades in (a)–(d) and (e)–(h) represent KASPR QVP ZDR and KDP, respectively, averaged at each MDV–DWR bin. Lines in each panel represent the SSRGA calculations using particle type and PSD models described in Appendix A. The legend for the lines is the same as in Fig. 1.
The DWR–MDV diagrams suggest that as DWRKaW increased, the MDV corresponding to the low-rime-degree particle populations in both Region C and Region D reached m s−1, consistent with the fall speeds of low-rime-degree aggregates. This effect is more likely due to the increase in size rather than in aspect ratio. During the aggregation process, the size distribution of snowflakes evolves in such a way that the concentration of smaller, higher-density particles decreases whereas the number of larger, lower-density snowflakes increases. This is a primary reason for the reduction in both ZDR and KDP due to aggregation, although the increase in the average aspect ratio and possibly more chaotic orientation additionally contribute to such a reduction. The KDP values could also be accounted for by changes in the number concentration of the horizontally oriented oblate particles (with aspect ratio <1); its increase contributes to increasing KDP.
In the DWR–MDV data clusters following the high-rime-degree particle lines in Region C, ZDR and KDP quickly decreased as the DWRKaW and the magnitude of MDV increased; ZDR values decreased from 2 to 0.5 dB, and the KDP values decreased from 0.4∘ km−1 to near zero (Fig. 9c, g). Although the increase in the DWRKaW includes the effects of both size and aspect ratio as discussed above, the increase in the magnitude of MDV can represent the increase in size. The ZDR and KDP values are lower than those from the cluster following the low-rime-degree model's lines at a given DWRKaW. Lower KDP and ZDR values suggest particle growth by heavier riming, which tends to produce more spherical particles.
These ZDR and KDP characteristics shown in both low-rime-degree and high-rime-degree particle data groups in Region C are very similar to those in Region D, but the KDP and ZDR values in Region D are generally lower at a given DWRKaW, with a mean MDV of −3.5 m s−1 (Fig. 9d, h). The lower KDP and ZDR in Region D represent further particle growth which is accompanied by the decrease in their density, increase in their aspect ratios, and more random orientation.
It is interesting that for DWRKaW values of less than 5 dB in Region C, the observed ZDR values with faster fall speeds (corresponding to the high-rime-degree particle lines) are larger than those with slower fall speeds (corresponding to the low-rime-degree particle lines) at a given DWRKaW (Fig. 9c). This suggests that riming first worked to fill the gaps of branches of dendrite crystals, resulting in increasing the mass of individual crystals without significant change in their aspect ratio, and thus ZDR increased. This type of riming would not significantly contribute to the increase in KDP (Fig. 9g), likely due to low concentration of such particles. This characteristic is consistent with the early stage of riming reported by previous studies (e.g., Oue et al., 2016; Li et al., 2018).
Compared to Region C and Region D, the polarimetric observables in Region A and Region B (Fig. 9a, b, e, and f) do not show clear trends with changes in rime degree, and the dynamical oscillation shown in Fig. 5a–c results in an uncertainty in the particle identification for Region A, particularly when DWRKaW values are smaller than 5 dB and MDV varies between −3 and 0 m s−1. Adding polarimetric variables together with temperature information facilitates the interpretation of the microphysics. ZDR values in Region A are positive but smaller than 1 dB and smaller than those from the later fallstreaks (Region C and Region D, for a given DWR), suggesting an aggregation process which was accompanied by a decrease in particle density, an increase in their aspect ratios, and more random particle orientations compared to Region C and Region D. In contrast, KDP is larger than that from the later fallstreaks. The large KDP and smaller ZDR values in Region A suggest aggregation intensified by a higher number concentration of ice crystals. The increase in ice number concentration can be explained by two processes. One possible cause is that near the dendrite growth regime (around −15 ∘C), dendritic ice crystals were nucleated. The dendritic branches could work to facilitate interlocking (Pruppacher and Klett, 2010). This is a well-known characteristic in winter storms that has been reported by many previous studies using polarimetric radar measurements (e.g., Kennedy and Rutledge, 2011). Another process is seeding from above (e.g., Griffin et al., 2018; Oue et al., 2018), which is more likely to contribute to an increase in ice concentration for this case. The cloud top height during observations in Region A and Region B reached 10 km, approximately 4 km higher than in Region C and Region D (Figs. 5 and 6). This fact suggests that a higher concentration of ice particles aloft seeded in Region A. Moreover, a possible light riming in the turbulence region could increase the mass of individual particles, hence KDP, as the cluster extended to the middle rime degree included large KDP values.
The particles were further growing at lower altitudes as DWRKaW increased with decreasing ZDR in Region B. However, a sublimation process near the ground could also be plausible. The nearest soundings at Upton (12:00 Z, black lines in Fig. 4e) showed a dry air condition at the lower altitudes. This sounding time was ∼5–6 h before the radar observation, but the dry air condition could still have been present near the ground, thus favoring sublimation in the lower altitudes of Region B. Due to sublimation some branches and/or edges of aggregate particles could have disappeared, resulting in decreasing the mean volume diameter. The classical aggregation process could have stopped with KDP remaining relatively large because it usually decreases proportionally to the mean volume diameter. Decrease in IWC attributed to the sublimation might have been minor with any noticeable impact on KDP. These processes related to the sublimation are represented by a cluster with high KDP in Region B, where the DWRKaW values slightly increased while KDP values remained high compared to in Region A. The sublimation also contributed to decreasing particle fall speed, as shown by a minor decrease in the magnitude of MDV in the data group, but the MDV probably resulted from some balance between the fall speed increase due to aggregation and its decrease due to sublimation. The classical diabatic sublimation cools and moistens the ambient air. Therefore, the sublimation subsided as the cloud base descended with time (Fig. 5f) and snow particles in the fallstreaks eventually reached the ground.
5.3 DWR coupled with differential MDV
The MDV measurements also have frequency dependencies because of the complex interplay between non-Rayleigh effects and the PSDs. Figure 10 shows dependencies of the ice particle types on the diagrams of DWRKaW versus differential MDV (dMDV = KASPR MDV − ROGER MDV) for Region C and Region D, together with the scattering calculations using the particle models. Similarly to the DWR–MDV diagram in Fig. 9, Region C includes a cluster with a higher number of occurrences along the particle lines of low-to-middle rime degrees, and a lower-frequency cluster extends toward the high-rime-degree particle lines. Region D has more data points for the high-rime-degree particle population.

Figure 10Difference in KASPR VPT MDV versus DWRKaW and ROGER MDV versus DWRKaW diagrams for (a) Region C and (b) Region D. Color shades represent normalized frequency. Panel (c) is the same as (b), but the color shades represent KASPR QVP ZDR. Lines in panels (a) and (b) represent the SSRGA calculations using particle type and PSD models described in Appendix A. The legend for the lines is the same as in Fig. 1.
Region D also includes large dMDV values greater than 0.6 m s−1 for DWRKaW values between 3 and 10 dB (Fig. 10b). It is possible that the larger values of dMDV correspond to an increase in the particle sizes and not to changes in the degree of riming. The ZDR values corresponding to these large dMDV values (Fig. 10c) are approximately 0.7 dB, suggesting that the particles were non-spherical, possibly contributing to the decrease in DWRKaW compared to the spherical particles.
As the scattering calculations show, distinguishing among different degrees of riming requires accurate measurements of MDV with an error of a few hundredths of 1 m s−1 and exact range-time-bin gate matching for lower DWRKaW (<5 dB). Although the vertical air motion contributions in MDV from each radar are canceled out in dMDV, subgrid-scale turbulence, the wide range of particle fall speeds, and different sampling times for the observations (1 s for KASPR in VPT mode and 4 s for ROGER) can all be sources of uncertainties. This limitation may affect the scatterplot distributions, e.g., with some points clustering outside the envelope of the model's lines. This limitation also affects Region A (not shown).
5.4 Evaluation using ground-based in situ measurements
The particle properties retrieved from the ground-based measurements including fall speed, size, aspect ratio, and area ratio are the result of ice growth processes in the clouds aloft. The Parsivel and MASC observations allowed us to evaluate the radar-based particle characteristics described above. The Parsivel and MASC collocated with the radars collected precipitation particles after 18:13 and 18:16 UTC, respectively. The snow images from the MASC were quantified by measurements of aspect ratio and area ratio, and their time series were presented in Fig. 11. Figure 11a and b present frequencies (color shades) together with median values (black line) observed for a 20 min time range every 1 min.
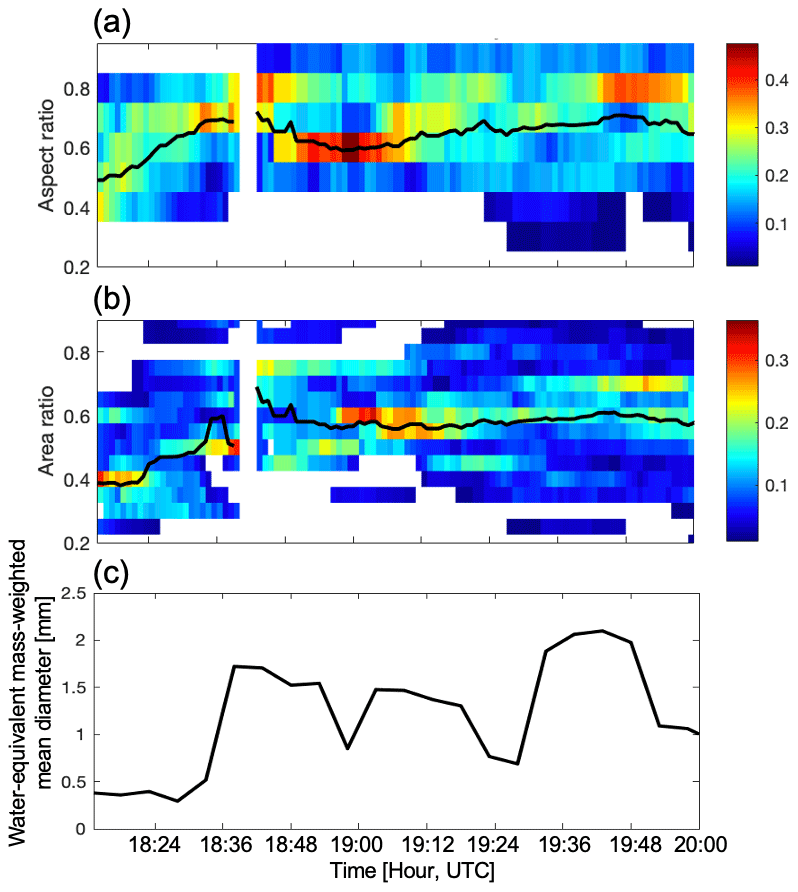
Figure 11Time series of (a) aspect ratio and (b) area ratio of snow particles measured by the MASC and (c) water-equivalent mass-weighted mean size of Parsivel-measured PSDs. Color shades and black lines in (a, b) represent normalized frequency and median values, respectively, for snow particles collected during a 15 min window every 1 min.
We also estimated the mass-weighted mean diameter for Parsivel-measured PSD. The ice particle mass was estimated using a methodology proposed by von Lerber et al. (2017). The methodology is based on a theory that individual particle mass can be expressed based on a hydrodynamic theory derived by Böhm (1989) using Reynold's number and the Best number (e.g., Mitchell, 1996; Mitchell and Heymsfield, 2005; Heymsfield and Westbrook, 2010). The equation of mass (Eq. 5 of von Lerber et al., 2017) indicates that the mass can be a function of fall velocity, area ratio, and size. In the present study, the area ratio is derived from the MASC images, and the fall velocity and size are estimated from the Parsivel measurements. The Parsivel-observed particle diameter and fall speed are fitted to a form of V=aDb, where a and b are constants using the 20 min integrated data. Previous studies have pointed out that Parsivel's velocity and even size measurements for snow include large uncertainties owing to the sampling limitation (Battaglia et al., 2010). Before estimating the relationships, we removed the following apparently unrealistic velocity values: (1) those exceeding 1.5 m s−1 associated with particles having a diameter of less than 1 mm in agreement with Locatelli and Hobbs (1974) and (2) data outside upper and lower boundaries of the V–D relationships. The upper boundary was determined based on Locatelli and Hobbs (1974) V–D relationships for rimed aggregates, and the lower boundary was determined based on Szyrmer and Zawadzki (2010) V–D relationships for unrimed aggregates. The Parsivel-measured size was adjusted to the maximum dimension using a technique proposed by von Lerber et al. (2017). Figure 11c presents the time series of the estimated water-equivalent mass-weighted mean diameter from the Parsivel-measured PSD.
These time series are consistent with the fallstreaks reaching the ground. Aspect ratio represents oblateness of particles relating to ZDR and partly contributing to KDP. Korolev and Isaac (2003) reported that mean aspect ratios of ice hydrometeors observed in situ from aircraft sampling are often around 0.6, while those of heavily rimed particles such as graupel increase toward 1. Depolarization-based radar retrievals of snowflake aspect ratios near the ground indicated mean intrinsic aspect ratios of about 0.4–0.5 (e.g., Matrosov et al., 2020). Area ratio in the current study is defined as the ratio of the area of the snowflake, which is found by counting all white pixels in a black-and-white image, to the area of the circumscribing circle defined by the maximum diameter from the MASC. The area ratio increases with riming (von Lerber et al., 2017).
The aspect ratio was relatively low before 18:30 UTC, when the median value was less than 0.6. At the same time, the area ratio was also relatively low, with the median area ratio smaller than 0.5. This period corresponds to a time when fallstreaks included in Region A and Region B reached near the ground, consistent with the radar MDV–DWR characteristics. The mass-weighted mean size was approximately 0.4 mm, consistent with the scattering model calculations shown in Fig. 2a. It should also be noted that aspect ratio estimates from in situ data (e.g., from Parsivel and/or MASC measurements or aircraft-based particle probes) are inferred from 2D particle projections, so these estimates usually overestimate actual (i.e., intrinsic) aspect ratios, which are defined as true minor-to-major particle dimension ratios (Jiang et al., 2017; Matrosov et al., 2017).
The median in situ aspect ratio exceeded 0.6 between 18:30 and 19:00 UTC while area ratio also increased. The water-equivalent mass-weighted mean diameter increased after 18:33 UTC, as it exceeded 1.3 mm between 18:38 and 19:48 UTC except at 18:58, 19:22, and 19:28 UTC. Those large-diameter periods correspond to times where fallstreaks included in Region D reached the ground. The ground-based characteristics suggest that the snowflakes were heavily rimed, larger aggregates, consistent with the observed characteristics of the radar MDV, DWR, and polarimetric observables.
DWRs from triple-frequency measurements are useful to identify ice particle types and processes as proposed in previous studies. For the technique to be effective, the radar frequencies need to be well separated. This requirement limits applications when using 24, 35, and 94 GHz frequency radars, like in this study. Despite this limitation, MDV and polarimetric variables can be used complementarily to identify ice particle types and distinguish among different ice growth processes and even reveal additional microphysical details.
We conducted triple-frequency measurements using the MRRPro (24 GHz), the Ka-band scanning polarimetric radar (KASPR, 35 GHz), and the W-band profiling radar (ROGER, 94 GHz) at the Stony Brook University Radar Observatory in the winter season of 2019/20. We successfully collected triple-frequency data from vertically pointing measurements for a snowstorm along the US northeast coast on 20 February 2019. Quasi-vertical profile (QVP) height-versus-time data were also obtained from KASPR PPI scans at an elevation angle of 15∘. We investigated all pairs of DWRs from the triple frequencies (i.e., DWRKKa, DWRKW, and DWRKaW) in conjunction with MDV from the KASPR vertically pointing measurements and ZDR and KDP from the KASPR QVPs. Overall, it was challenging to discern the precipitation particle types in the DWRKKa-versus-DWRKW diagram only, likely due to insufficient separation of the K-band frequency from the Ka band, whereas the DWR-versus-MDV diagrams for all DWR pairs exhibited distinct separations of particle populations attributed to different rime degrees and particle growth processes. Figure 12 presents a schematic showing the impact of different ice crystal types on DWR–MDV–polarimetric variables.
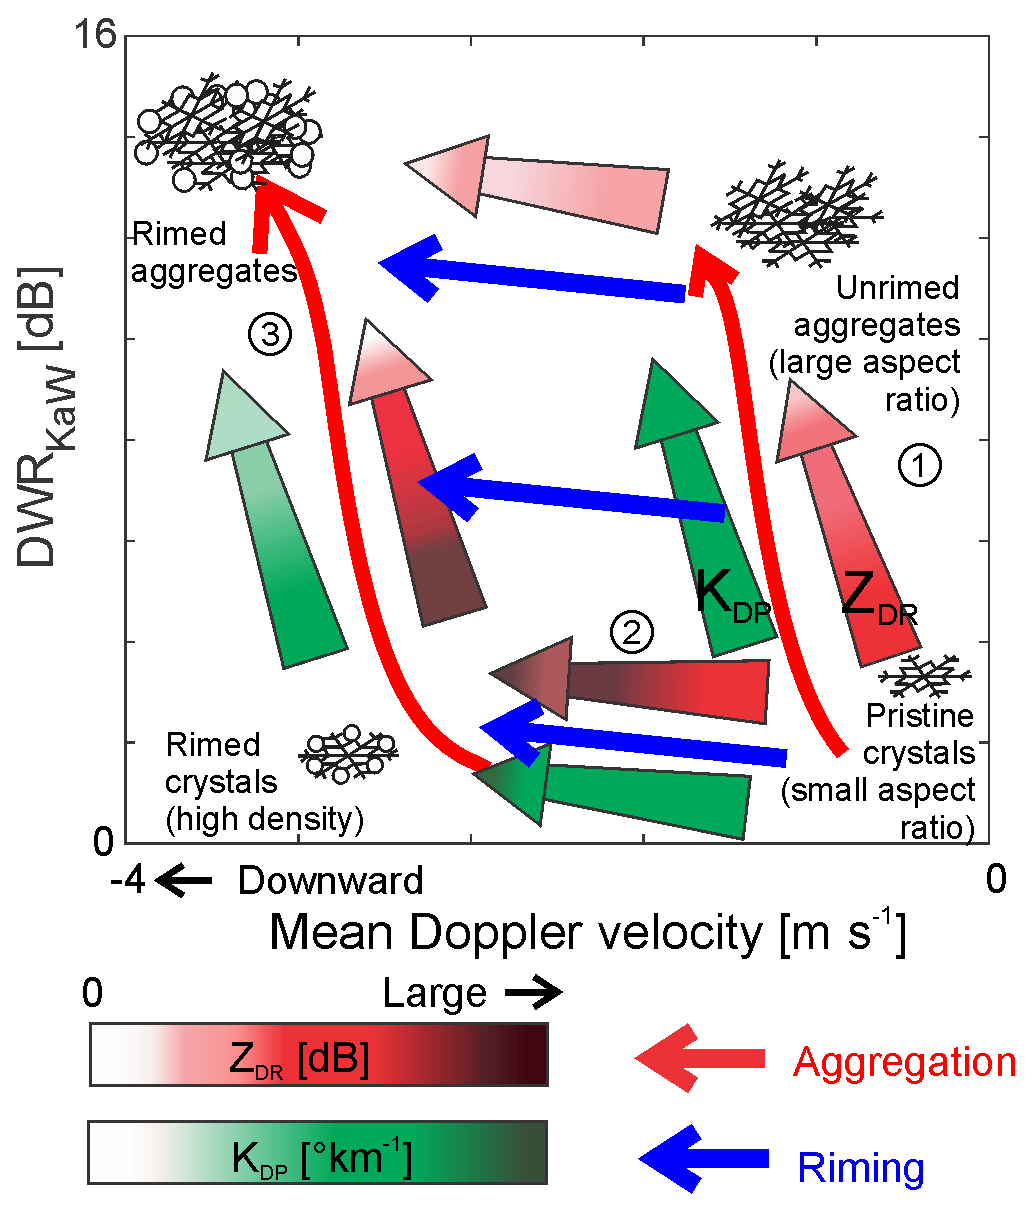
Figure 12A schematic DWR–MDV–polarimetric variable diagram based on the observation in this study.
Regions that included fallstreaks were dominated by the aggregation process, where the DWRKaW increased with the magnitude of MDV corresponding to the scattering calculations for aggregate particles of low to middle rime degrees (e.g., marked 1 in Fig. 12; regions A and B in Fig. 4). The DWRKaW values further increased at lower altitudes of the fallstreaks as reflectivity increased. ZDR and KDP values were 0.6 dB and 0.8∘ km−1, respectively. The small ZDR values in the lower region in conjunction with the MDV and Doppler spectrum width measurements suggested further ice growth produced by aggregation. Larger KDP in the fallstreaks were attributed to high-number-concentration ice particles generated aloft that facilitated aggregation. Alternatively enhanced KDP regions could have been generated in turbulent regions by light riming causing an increase in the mass of individual particles (e.g., marked 2 in Fig. 12; Region B in Fig. 4). Finally sublimation active near the ground at the beginning of precipitation might have resulted in dissipating the branches of the large aggregates and, consequently, decreasing the mean volume diameters. This caused little increase in DWR and kept KDP large.
Characteristics of riming were discerned in other regions where several different particle populations were expected. Associated with a population of lower-rime aggregates, DWRKaW increased from near zero to 10 dB while the magnitude of MDV increased from near zero to 0.8 m s−1. KDP and ZDR slightly decreased as DWRKaW increased, which was consistent with aggregate particles and accompanied by a decrease in the particles' density, increase in their aspect ratios, and more random particle orientation (e.g., marked 1 in Fig. 12; regions C and D in Fig. 4). Another particle population which was expected to have larger degrees of riming was distinguished from the particle populations with smaller degrees of riming using the DWRKaW-versus-MDV diagram (e.g., marked 3 in Fig. 12; regions C and D in Fig. 4); it had an increase in DWRKaW similar to that for aggregates with lower riming, but the magnitude of MDV was around 2–2.5 m s−1 (approximately 1–1.5 m s−1 larger than that for the former particle population). KDP and ZDR rapidly decreased to near zero when DWRKaW increased, suggesting rapid particle growth. Although DWRKaW also strongly depends on particle shape (in addition to dependence on particle size), the increase in the magnitude of MDV was likely attributed to the ice particle growth. In the lower altitudes, the occurrence of the higher-rime-degree particle populations increased as the magnitude of MDV reached 3.5 m s−1, while KDP and ZDR at a given DWRKaW were smaller than those observed in the upper region. These characteristics suggest further riming and increase in aspect ratios. The DWRKaW–MDV diagrams also depicted the early stage of riming where ZDR increased while the magnitude of MDV increased collocated with small increases in DWRKaW and KDP (e.g., marked 2 in Fig. 12; Region C in Fig. 4). The other DWRs (i.e., DWRKKa and DWRKW) as a function of MDV as well as coupling with the polarimetric variables also showed consistent characteristics, indicating that the joint analysis of the DWRs, MDV, and polarimetric variables is very useful to distinguish between riming and aggregation processes for these frequency pairs as well.
This study illustrated the capabilities of DWR measurements coupled with MDV and polarimetric measurements to discern riming and aggregation processes, which have been often observed by single-frequency radar measurements but not well separated. This study highlights that dual-frequency measurements coupled with MDV – typically available from all cloud radar systems – not only are more practical than the triple-frequency measurements (since they only involve two radars) but are more effective in separating the two processes as well. Such systems, when used in synergy with polarimetric observations, common in research and weather networks (e.g., Kollias et al., 2020a; NWS WSR-88D radars), can reveal complex microphysics and therefore improve quantitative estimations of snow amount (i.e., IWC, snow rate) and microphysical quantities such as rime mass fraction (e.g., Moisseev et al., 2017; Li et al., 2018). Shorter-wavelength radars and lidars as well as microwave radiometers can be complementarily used for better capturing the presence of supercooled liquid droplets and the riming process (e.g., Lamer et al., 2021; Tridon et al., 2020).
To evaluate the observed DWRs and mean Doppler velocity, we calculated the radar reflectivities and mean Doppler velocities at the three frequencies (i.e., 24.0, 35.5, and 94.0 GHz) using the radar backscattering cross-section database obtained from the self-similar Rayleigh–Gans approximation (SSRGA) method proposed by Hogan and Westbrook (2014). The SSRGA uses the Rayleigh–Gans approximation and its extension for an ensemble of particles, for which horizontal orientation with no canting was employed. The SSRGA employs a simple mathematical formulation which is very efficient in its numerical implementation and produces more realistic scattering properties compared to sphere/spheroid models, taking into account the internal structure of aggregates (e.g., Hogan and Westbrook, 2014; Hogan et al., 2017; Tyynelä et al., 2011; Leinonen et al., 2013; Tridon et al., 2019).
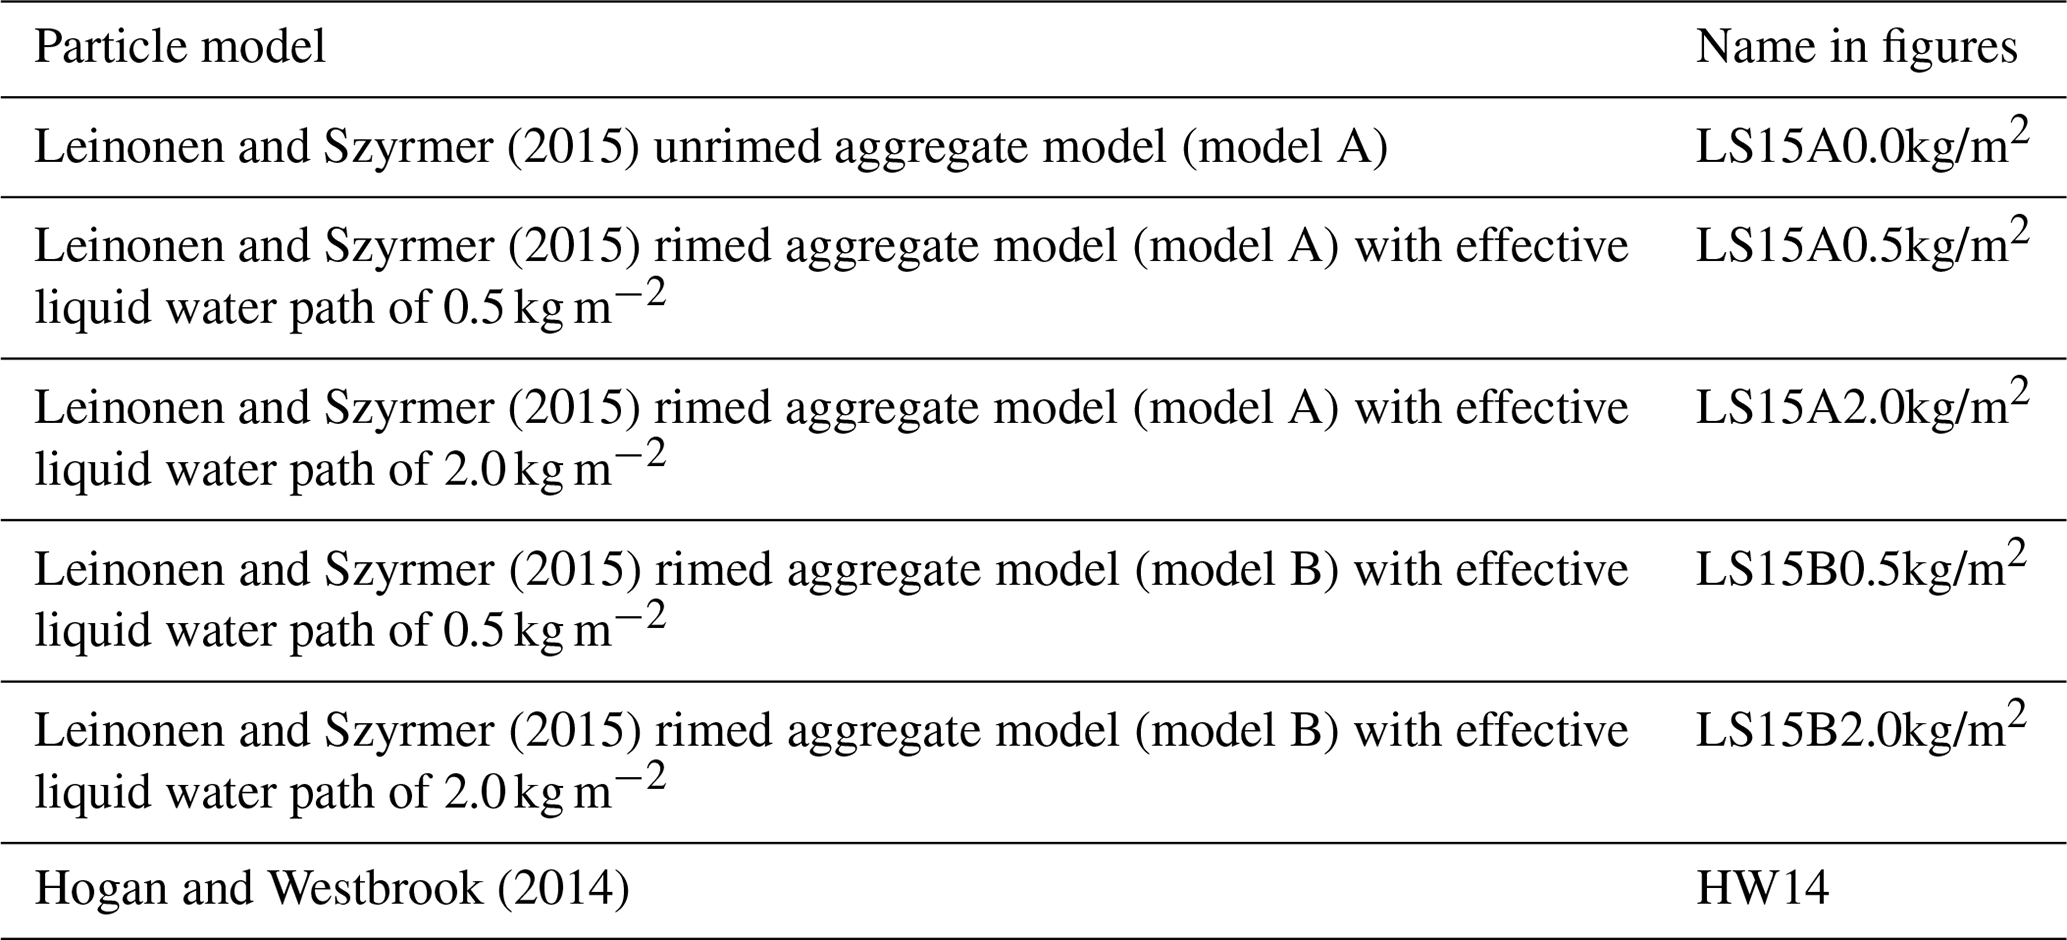
In this work, the SSRGA was adopted to calculate radar backscattering cross sections at a vertical incident angle for individual aggregate particles with different rime degrees (i.e., effective liquid water path) and sizes modeled by Leinonen and Szyrmer (2015) and Hogan and Westbrook (2014), similarly to in Tridon et al. (2019). Table A1 lists the particle models with different rime degrees used in the present study. To compute the radar reflectivity from the radar backscatter signals from the database, we used a gamma distribution as a particle size distribution (PSD), where the water-equivalent mass-weighted diameter (Dm) varied from 0.1 mm to 2.5 mm with a fixed shape parameter (μ) of 0 and 4.
Mean Doppler velocity at 1000 hPa was computed for each particle model and each PSD using the radar backscatter signals and a particle terminal velocity model by Heymsfield and Westbrook (2010). For all the MDV values presented in this study, negative values represent downward motions.
The SBRO radar data are available at the SBU Academic Commons (https://commons.library.stonybrook.edu/somasdata/11; Oue, 2021).
Data collection and analysis were performed by MO. Conceptualization of the method, interpretation, and writing were shared between MO, PK, SYM, AVR, and AB. Scattering calculation using the SSRGA was made by AB's group.
The authors declare that they have no conflict of interest.
Publisher's note: Copernicus Publications remains neutral with regard to jurisdictional claims in published maps and institutional affiliations.
Mariko Oue, Pavlos Kollias, Sergey Y. Matrosov, and Alexander V. Ryzhkov were supported by the National Science Foundation grant nos. AGS-1841215, 1841246, 1841260, and 1904809. Alessandro Battaglia was supported by Atmospheric System Research (grant no. DE-SC0017967). We thank Frederić Tridon of the University of Cologne for providing the lookup tables of SSRGA scattering properties and Samantha Nebylitsa of the University of Miami for processing the MASC and Parsivel data and retrieving particle properties. We also thank Matthew Miller and Sandra Yuter of North Carolina State University for supporting the MASC observations and providing MASC data.
This research has been supported by the National Science Foundation (grant nos. AGS-1841215, 1841246, 1841260, and 1904809) and the Atmospheric System Research (grant no. DE-SC0017967).
This paper was edited by Gianfranco Vulpiani and reviewed by two anonymous referees.
Andrić, J., Kumjian, M. R., Zrnić, D., Straka, J. M., and Melnikov, V.: Polarimetric signatures above the melting layer in winter storms: An observational and modeling study, J. Appl. Meteorol. Climatol., 52, 682–700, https://doi.org/10.1175/JAMC-D-12-028.1, 2013.
Battaglia, A., Rustemeier, E., Tokay, A., Blahak, U., and Simmer, C.: PARSIVEL Snow Observations: A Critical Assessment, J. Atmos. Ocean. Tech., 27, 333–344, https://doi.org/10.1175/2009JTECHA1332.1, 2010.
Battaglia, A., Mroz, K., T., Tridon, F., Tanelli, S., Tian, L., and Heymsfield, G. M.: Using a multiwavelength suite of microwave instruments to investigate the microphysical structure of deep convective cores, J. Geophys. Res.-Atmos., 121, 9356–9381, https://doi.org/10.1002/2016JD025269, 2016.
Battaglia, A., Kollias, P., Dhillon, R., Roy, R., Tanelli, S., Lebsock, M., Grecu, M., Lamer, K., Watters, D., Mroz, K., Heymsfield, G., Li, L., and Furukawa, K.: Space-borne cloud and precipitation radars: status, challenges and ways forward, Rev. Geophys., 58, e2019RG000686, https://doi.org/10.1029/2019RG000686, 2020.
Bechini, R., Baldini, L., and Chandrasekar, V.: Polarimetric radar observations in the ice region of precipitating clouds at C-band and X-band radar frequencies, Appl. Meteorol. Clim., 52, 1147–1169, https://doi.org/10.1175/JAMC-D-12-055.1, 2013.
Böhm, H.: A general equation for the terminal fall speed of solid hydrometeors, J. Atmos. Sci., 46, 2419–2427, https://doi.org/10.1175/1520-0469(1989)046<2419:AGEFTT>2.0.CO;2, 1989.
Colle, B. A., Stark, D., and Yuter, S. E.: Surface microphysical observations within East coast winter storms on Long Island, Mon. Weather Rev., 142, 3126–3146, 2014.
Dias Neto, J., Kneifel, S., Ori, D., Trömel, S., Handwerker, J., Bohn, B., Hermes, N., Mühlbauer, K., Lenefer, M., and Simmer, C.: The TRIple-frequency and Polarimetric radar Experiment for improving process observations of winter precipitation, Earth Syst. Sci. Data, 11, 845–863, https://doi.org/10.5194/essd-11-845-2019, 2019.
Garrett, T. J. and Yuter, S. E.: Observed influence of riming, temperature, and turbulence on the fallspeed of solid precipitation, Geophys. Res. Lett., 41, 6515–6522, https://doi.org/10.1002/2014GL061016, 2014.
Garrett, T. J., Fallgatter, C., Shkurko, K., and Howlett, D.: Fall speed measurement and high-resolution multi-angle photography of hydrometeors in free fall, Atmos. Meas. Tech., 5, 2625–2633, https://doi.org/10.5194/amt-5-2625-2012, 2012.
Giangrande, S., Toto, T., Bansemer, A., Kumjian, M., Mishra, S., and Ryzhkov, A.: Insights into riming and aggregation processes as revealed by aircraft, radar, and disdrometer observations for a 27 April 2011 widespread precipitation event, J. Geophys. Res.-Atmos, 121, 5846–5863, https://doi.org/10.1002/2015JD024537, 2016.
Griffin, E. M., Schuur, T. J., and Ryzhkov, A. V.: A Polarimetric Analysis of Ice Microphysical Processes in Snow, Using Quasi-Vertical Profiles, J. Appl. Meteorol. Clim., 57, 31–50, https://doi.org/10.1175/JAMC-D-17-0033.1, 2018.
Griffin, E. M., Schuur, T. J., and Ryzhkov, A. V.: A polarimetric radar analysis of ice microphysical properties in melting layers of winter storms using S-band quasi-vertical profiles, J. Appl. Meteorol. Clim., 59, 751–767, https://doi.org/10.1175/JAMC-D-19-0128.1, 2020.
Heymsfield, A. J. and Westbrook, C. D.: Advances in the estimation of ice particle fall speeds using laboratory and field measurements, J. Atmos. Sci., 67, 2469–2482, https://doi.org/10.1175/2010JAS3379.1, 2010.
Hogan, R. J. and Westbrook, C. D.: Equation for the microwave backscatter cross section of aggregate snowflakes using the self-similar Rayleigh–Gans approximation, J. Atmos. Sci., 71, 3292–3301, 2014.
Hogan, R. J., Gaussiat, N., and Illingworth, A. J.: Stratocumulus liquid water content from dual-wavelength radar, J. Atmos. Ocean. Tech., 22, 1207–1218, 2005.
Hogan, R. J., Honeyager, R., Tyynelä, J., and Kneifel, S.: Calculating the millimetre-wave scattering phase function of snowflakes using the self-similar Rayleigh–Gans approximation, Q. J. Roy. Meteor. Soc., 143, 834–844, 2017.
Huang, D., Johnson, K., Liu, Y., and Wiscombe, W.: High resolution retrieval of liquid water vertical distributions using collocated Ka-band and W-band cloud radars, Geophys. Res. Lett., 36, L24807, https://doi.org/10.1029/2009gl041364, 2009.
Hubbert, J. C. and Bringi, V. N.: An iterative filtering technique for the analysis of copolar differential phase and dual-Frequency Radar Measurements, J. Atmos. Ocean. Tech., 12, 643–648, https://doi.org/10.1175/1520-0426(1995)012<0643:AIFTFT>2.0.CO;2, 1995.
Illingworth, A. J., Barker, H. W., Beljaars, A., Ceccaldi, M., Chepfer, H., Clerbaux, N., Cole, J., Delanoë, J., Domenech, C., Donovan, D. P., Fukuda, S., Hirakata, M., Hogan, R. J., Huenerbein, A., Kollias, P., Kubota, T., Nakajima, T., Nakajima, T. Y., Nishizawa, T., Ohno,Y., Okamoto, H., Oki, R., Sato, K., Satoh, M., Shephard, M. W., Velázquez-Blázquez, A., Wandinger, U., Wehr, T., and van Zadelhoff, G.-J.: The EarthCARE satellite: The next step forward in global measurements of clouds, aerosols, precipitation, and radiation, B. Am. Meteorol. Soc., 96, 1311–1332, 2015.
Jiang, Z., Oue, M., Verlinde, J., Clothiaux, E., Aydin, K., Botta, G., and Lu, Y.: What can we conclude about the real aspect ratios of ice particle aggregates from two-dimensional images?, J. Appl. Meteorol. Clim., 56, 725–734, 2017.
Kajikawa, M.: Observation of the falling motion of early snowflakes. Part II: On the variation of falling velocity, J. Meteorol. Soc. Jpn., 67, 731–738, 1989.
Kalesse, H., Kollias, P., and Szyrmer, W.: On using the relationship between Doppler velocity and radar reflectivity to identify microphysical processes in midlatitudinal ice clouds, J. Geophys. Res.-Atmos., 118, 12168–12179, https://doi.org/10.1002/2013JD020386, 2013.
Kennedy, P. C. and Rutledge, S. A.: S-band dual-polarization radar observations of winter storms, J. Appl. Meteorol. Clim., 50, 844–858, https://doi.org/10.1175/2010JAMC2558.1, 2011.
Kneifel, S. and Moisseev, D.: Long-term statistics of riming in nonconvective clouds derived from ground-based Doppler cloud radar observations, J. Atmos. Sci., 77, 3495–3508, https://doi.org/10.1175/JAS-D-20-0007.1, 2020.
Kneifel, S., Lerber, A., Tiira, J., Moisseev, D., Kollias, P., and Leinonen, J.: Observed relations between snowfall microphysics and triple-frequency radar measurements, J. Geophys. Res.-Atmos., 120, 6034–6055, https://doi.org/10.1002/2015JD023156, 2015.
Kneifel, S., Kollias, P., Battaglia, A., Leinonen, J., Maahn, M., Kalesse, H., and Tridon, F.: First observations of triple-frequency radar Doppler spectra in snowfall: Interpretation and applications, Geophys. Res. Lett., 43, 2225–2233, https://doi.org/10.1002/2015GL067618, 2016.
Kollias, P., Clothiaux, E. E., Miller, M. A., Albrecht, B. A., Stephens, G. L., and Ackerman, T. P.: Millimeter-Wavelength Radars: New Frontier in Atmospheric Cloud and Precipitation Research, B. Am. Meteorol. Soc., 88, 1608–1624, 2007.
Kollias, P., Bharadwaj, N., Widener, K., Jo, I., and Johnson, K.: Scanning ARM cloud radars. Part I: Operational sampling strategies, J. Atmos. Ocean. Tech., 31, 569–582, https://doi.org/10.1175/JTECH-D-13-00044.1, 2014.
Kollias, P., Clothiaux, E. E., Ackerman, T. P., Albrecht, B. A., Widener, K. B., Moran, K. P., Luke, E. P., Johnson, K. L., Bharadwaj, N., Mead, J. B., Miller, M. A., Verlinde, J., Marchand, R. T., and Mace, G. G.: Development and Applications of ARM Millimeter-Wavelength Cloud Radars, Meteor. Mon., 57, 17.1–17.19, https://doi.org/10.1175/AMSMONOGRAPHS-D-15-0037.1, 2016.
Kollias, P., Bharadwaj, N., Clothiaux, E. E., Lamer, K., Oue, M., Hardin, J., Isom, B., Lindenmaier, I., Matthews, A., Luke, E. P., Giangrande, S. E., Johnson, K., Collis, S., Comstock, J., and Mather, J. H.: The ARM Radar Network: At the leading edge of cloud and precipitation observations, B. Am. Meteorol. Soc., 101, E588–E607, https://doi.org/10.1175/BAMS-D-18-0288.1, 2020a.
Kollias, P., Luke, E., Oue, M., and Lamer, K.: Agile adaptive radar sampling of fast evolving atmospheric phenomena guided by satellite imagery and surface cameras, Geophys. Res. Lett., 47, e2020GL088440, https://doi.org/10.1029/2020GL088440, 2020b.
Korolev, A. V. and Isaac, G.: Roundness and aspect ratio of particles in ice clouds, J. Atmos. Sci., 60, 1795–1808, https://doi.org/10.1175/1520-0469(2003)060<1795:RAAROP>2.0.CO;2, 2003.
Kumjian, M. R. and Lombardo, K. A.; Insights into the evolving microphysical and kinematic structure of Northeastern U.S. winter storms from dual-polarization Doppler radar, Mon. Weather Rev., 145, 1033–1061, https://doi.org/10.1175/MWR-D-15-0451.1, 2017.
Kumjian, M. R., Rutledge, S. A., Rasmussen, R. M., Kennedy, P. C., and Dixon, M.: High-resolution polarimetric radar observations of snow generating cells, J. Appl. Meteorol. Clim., 53, 1636–1658, https://doi.org/10.1175/JAMC-D-13-0312.1, 2014.
Kumjian, M. R., Mishra, S., Giangrande, S. E., Toto, T., Ryzhkov, A. V., and Bansemer, A.: Polarimetric radar and aircraft observations of saggy bright bands during MC3E, J. Geophys. Res., 121, 3584–3607, https://doi.org/10.1002/2015JD024446, 2016.
Kumjian, M. R., Tobin, D. M., Oue, M., and Kollias, P.: Microphysical Insights into Ice Pellet Formation Revealed by Fully Polarimetric Ka-band Doppler Radar, J. Appl. Meteorol. Clim., https://doi.org/10.1175/JAMC-D-20-0054.1, 2020.
Lamer, K., Oue, M., Battaglia, A., Roy, R. J., Cooper, K. B., Dhillon, R., and Kollias, P.: Multifrequency radar observations of clouds and precipitation including the G-band, Atmos. Meas. Tech., 14, 3615–3629, https://doi.org/10.5194/amt-14-3615-2021, 2021.
Leinonen, J. and Moisseev, D.: What do triple-frequency radar signatures reveal about aggregate snowflakes?, J. Geophys. Res.-Atmos., 120, 229–239, https://doi.org/10.1002/2014JD022072, 2015.
Leinonen, J. and Szyrmer, W.: Radar signatures of snowflake riming: a modeling study, Earth and Space Science, 2, 346–358, https://doi.org/10.1002/2015EA000102, 2015.
Leinonen, J., Moisseev, D., and Nousiainen, T.: Linking snowflake microstructure to multi-frequency radar observations, J. Geophys. Res.-Atmos., 118, 3259–3270, https://doi.org/10.1002/jgrd.50163, 2013.
Lewis, E. R., Wiscombe, W. J., Albrecht, B. A., Bland, G. L., Flagg, C. N., Klein, S. A., Kollias, P., Mace, G., Reynolds, R. M., Schwartz, S. E., Siebesma, A. P., Teixeira, J., Wood, R., and Zhang, M.: MAGIC: Marine ARM GPCI Investigation of Clouds, DOE/SC-ARM-12-020, U.S. Department of Energy, 12 pp., available at: https://www.arm.gov/publications/programdocs/doe-sc-arm-12-020.pdf, last access: 6 July 2021, 2012.
Li, H., Moisseev, D., and von Lerber, A.: How does riming affect dual-polarization observations and snowflake shape?, J. Geophys. Res., 123, 6070–6081, 2018.
Liebe, H. J., Hufford, G., and Cotton, M.: Propagation modeling of moist air and suspended water/ice particles at frequencies below 1000 GHz, presented at an AGARD Meeting on “Atmospheric Propagation Effects through Natural and Man-Made Obscurants for Visible to MM-Wave Radiation”, Mallorca, Spain, 17–20 May 1993 1993.
Locatelli, J. D. and Hobbs, P. V.: Fall speeds and masses of solid precipitation particles, Geophys. Res.-Atmos., 79, 2185–2197, 1974.
Löffler-Mang, M. and Blahak, U.: Estimation of the Equivalent Radar Reflectivity Factor from Measured Snow Size Spectra, J. Appl. Meteor., 40, 843–849, https://doi.org/10.1175/1520-0450(2001)040<0843:EOTERR>2.0.CO;2, 2001.
Luke, E., Kollias, P., and Shupe, M. D.: Detection of supercooled liquid in mixed-phase clouds using radar Doppler spectra, J. Geophys. Res.-Atmos., 115, D19201, https://doi.org/10.1029/2009JD012884, 2010.
Mason, S. L., Chiu, C. J., Hogan, R. J., Moisseev, D., and Kneifel, S.: Retrievals of riming and snow density from vertically pointing Doppler radars, J. Geophys. Res.-Atmos., 123, 13807–13834, https://doi.org/10.1029/2018JD028603, 2018.
Mason, S. L., Hogan, R. J., Westbrook, C. D., Kneifel, S., Moisseev, D., and von Terzi, L.: The importance of particle size distribution and internal structure for triple-frequency radar retrievals of the morphology of snow, Atmos. Meas. Tech., 12, 4993–5018, https://doi.org/10.5194/amt-12-4993-2019, 2019.
Mather, J. H. and Voyles, J. W.: The Arm Climate Research Facility: A review of structure and capabilities. B. Am. Meteorol. Soc., 94, 377–392, https://doi.org/10.1175/BAMS-D-11-00218.1, 2013.
Matrosov, S. Y.: Theoretical study of radar polarization parameters obtained from cirrus clouds, J. Atmos. Sci., 48, 1062–1070, https://doi.org/10.1175/1520-0469(1991)048<1062:TSORPP>2.0.CO;2, 1991.
Matrosov, S. Y.: A dual-wavelength radar method to measure snowfall rate, J. Appl. Meteorol., 37, 11, 1510–1521, https://doi.org/10.1175/1520-0450(1998)037<1510:ADWRMT>2.0.CO;2, 1998.
Matrosov, S. Y.: Polarimetric radar variables in snowfall at Ka- and W-band frequency bands: A comparative analysis, J. Atmos. Oceanic Technol., 38, 91–101, https://doi.org/10.1175/JTECH-D-20-0138.1, 2021.
Matrosov, S. Y., Mace, G. G., Marchand, R., Shupe, M. D., Hallar, A. G. and McCubbin, I. B.: Observations of ice crystal habits with a scanning polarimetric W-band radar at slant linear depolarization ratio mode, J. Atmos. Oceanic Technol., 29, 989–1008. https://doi.org/10.1175/JTECH-D-11-00131.1, 2012.
Matrosov, S. Y., Schmitt, C. G., Maahn, M., and de Boer, G.: Atmospheric ice particle shape estimates from polarimetric radar measurements and in situ observations, J. Atmos. Oceanic Technol., 34, 2569–2587, https://doi.org/10.1175/JTECH-D-17-0111.1, 2017.
Matrosov, S. Y., Maahn, M., and de Boer, G.: Observational and modeling study of ice hydrometeor radar dual-wavelength ratios, J. Appl. Meteorol. Clim., 58, 2005–2017, https://doi.org/10.1175/JAMC-D-19-0018.1, 2019.
Matrosov, S. Y., Ryzhkov, A. V., Maahn, M., and de Boer, G.: Hydrometeor shape variability in snowfall as retrieved from polarimetric radar measurements, J. Appl. Meteorol. Clim., 59, 1503–1517, https://doi.org/10.1175/JAMC-D-20-0052.1, 2020.
Mead, J. B., PopStefanija, I., Kollias, P., Albrecht, B., and Bluth, R.: Compact airborne solid-state 95 GHz FMCW radar system, 31st Int. Conf. on Radar Meteorology, Seattle, WA, 6–12 August 2003, available at: https://ams.confex.com/ams/pdfpapers/63494.pdf (last access: 6 July 2021), 2003.
Mitchell, D. L.: Use of mass- and area-dimensional power laws for determining precipitation particle terminal velocities, J. Atmos. Sci., 53, 1710–1723, https://doi.org/10.1175/1520-0469(1996)053<1710:UOMAAD>2.0.CO;2, 1996.
Mitchell, D. L. and Heymsfield, A. J.: Refinements in the treatment of ice particle terminal velocities, highlighting aggregates, J. Atmos. Sci., 62, 1637–1644, https://doi.org/10.1175/JAS3413.1, 2005.
Moisseev, D. N., Lautaportti, S., Tyynela, J., and Lim, S.: Dual-polarization radar signatures in snowstorms: Role of snowflake aggregation, J. Geophys. Res.-Atmos., 120, 12644–12655, https://doi.org/10.1002/2015JD023884, 2015.
Moisseev, D., von Lerber, A., and Tiira, J.: Quantifying the effect of riming on snowfall using ground-based observations, J. Geophys. Res.-Atmos., 122, 4019–4037, 2017
Myagkov, A., Seifert, P., Wandinger, U., Bühl, J., and Engelmann, R.: Relationship between temperature and apparent shape of pristine ice crystals derived from polarimetric cloud radar observations during the ACCEPT campaign, Atmos. Meas. Tech., 9, 3739–3754, https://doi.org/10.5194/amt-9-3739-2016, 2016.
Orr, B. W. and Kropfli, R.: A method for estimating particle fall velocities from vertically pointing Doppler radar, J. Atmos. Oceanic Technol., 16, 29–37, https://doi.org/10.1175/1520-0426(1999)016<0029:AMFEPF>2.0.CO;2, 1999.
Oue, M.: Stony Brook Radar Observatory radar data for February 20, 2019 (2021), SoMAS Research Data, 11, available at: https://commons.library.stonybrook.edu/somasdata/11 (last access: 6 July 2021), Stony Brook University [data set], 2021
Oue, M., Kumjian, M. R., Lu, Y., Verlinde, J., Aydin, K., and Clothiaux, E. E.: Linear depolarization ratios of columnar ice crystals in a deep precipitating system over the Arctic observed by zenith-pointing Ka-band Doppler radar, J. Appl. Meteorol. Clim., 54, 1060–1068, https://doi.org/10.1175/JAMC-D-15-0012.1, 2015.
Oue, M., Galletti, M., Verlinde, J., Ryzhkov, A., and Lu, Y.: Use of X-Band differential reflectivity measurements to study shallow Arctic mixed-phase clouds, J. Appl. Meteorol. Clim., 55, 403–424, https://doi.org/10.1175/JAMC-D-15-0168.1, 2016.
Oue, M., Kollias, P., Ryzhkov, A., and Luke, E.: Toward exploring the synergy between cloud radar polarimetry and Doppler spectral analysis in deep cold precipitating systems in the Arctic, J. Geophys. Res, 123, 2797–2815, https://doi.org/10.1002/2017JD027717, 2018.
Peters, G., Fischer, B., and Andersson, T.: Rain observations with a vertically looking Micro Rain Radar (MRR), Boreal Environ. Res., 7, 353–362, 2002.
Protat, A. and Williams, C. R.: The accuracy of radar estimates of ice terminal fall speed from vertically pointing Doppler radar measurements, J. Appl. Meteorol. Clim., 50, 2120–2138, https://doi.org/10.1175/JAMC-D-10-05031.1, 2011.
Pruppacher, H. R. and Klett, J. D.: Microphysics of clouds and precipitation, Springer, Dordrecht, 975 pp., https://doi.org/10.1007/978-0-306-48100-0, 2010.
Reinking, R. F., Matrosov, S. Y. Kropfli, R. A., and Bartram, B. W.: Evaluation of a 45-degree slant quasi-linear radar polarization state for distinguishing drizzle droplets, pristine ice crystals, and less regular ice particles, J. Atmos. Oceanic Technol., 19, 296–321, https://doi.org/10.1175/1520-0426-19.3.296, 2002.
Rosenkranz, P. W.: Water vapor microwave continuum absorption: A comparison of measurements and models, Radio Sci., 33, 919–928, https://doi.org/10.1029/98RS01182, 1998.
Ryzhkov, A. V., Zrnić, D. S., and Gordon, B. A.: Polarimetric method for ice water content determination, J. Appl. Meteorol., 37, 125–134, https://doi.org/10.1175/1520-0450(1998)037<0125:PMFIWC>2.0.CO;2, 1998.
Ryzhkov, A. V., Zhang, P., Reeves, H. D., Kumjian, M. R., Tschallener, T., Trömel, S., and Simmer, C.: Quasi-vertical profiles – A new way to look at polarimetric radar data, J. Atmos. Ocean. Tech., 33, 551–562, https://doi.org/10.1175/JTECH-D-15-0020.1, 2016.
Schneebeli, M., Dawes, N., Lehning, M., and Berne, A.: High-resolution vertical profiles of X-band polarimetric radar observables during snowfall in the Swiss Alps, J. Appl. Meteorol. Clim., 52, 378–394, https://doi.org/10.1175/JAMC-D-12-015.1, 2013.
Schrom, R. S. and Kumjian, M. R.: Connecting microphysical processes in Colorado Winter storms with vertical profiles of radar observations, J. Appl. Meteorol. Clim., 55, 1771–1787, https://doi.org/10.1175/JAMC-D-15-0338.1, 2016.
Schrom, R. S., Kumjian, M. R., and Lu, Y.: Polarimetric radar signatures of dendritic growth zones within Colorado winter storms, J. Appl. Meteorol. Clim., 54, 2365–2388, https://doi.org/10.1175/JAMC-D-15-0004.1, 2015.
Sinclair, V. A., Moisseev, D., and von Lerber, A.: How dual-polarization radar observations can be used to verify model representation of secondary ice, J. Geophys. Res.-Atmos., 121, 10954–10970, https://doi.org/10.1002/2016JD025381, 2016.
Stokes, G. M. and Schwartz, S. E.: The Atmospheric Radiation Measurement (ARM) Program: Programmatic Background and Design of the Cloud and Radiation Test, B. Am. Meteorol. Soc., 75, 1201–1222, https://doi.org/10.1175/1520-0477(1994)075<1201:TARMPP>2.0.CO;2, 1994.
Szyrmer, W. and Zawadzki, I.: Snow Studies. Part II: Average relationship between mass of snowflakes and their terminal fall velocity, J. Atmos. Sci., 67, 3319–3335, https://doi.org/10.1175/2010JAS3390.1, 2010.
Tridon, F., Battaglia, A., and Kollias, P.: Disentangling Mie and attenuation effects in rain using a Ka/W dual-wavelength Doppler spectral ratio technique, Geophys. Res. Lett., 40, 5548–5552, https://doi.org/10.1002/2013GL057454, 2013.
Tridon, F., Battaglia, A., Chase, R. J., Turk, F. J., Leinonen, J., Kneifel, S., Mroz, K., Finlon, J., Bansemer, A., and Tanelli, S.: The microphysics of stratiform precipitation during OLYMPEX: Compatibility between triple-frequency radar and airborne in situ observations, J. Geophys. Res.-Atmos., 124, 8764–8792, 2019.
Tridon, F., Battaglia, A., and Kneifel, S.: Estimating total attenuation using Rayleigh targets at cloud top: applications in multilayer and mixed-phase clouds observed by ground-based multifrequency radars, Atmos. Meas. Tech., 13, 5065–5085, https://doi.org/10.5194/amt-13-5065-2020, 2020.
Troemel, S., Ryzhkov, A., Hickman, B., Muhlbauer, K., and Simmer, C.: Polarimetric radar variables in the layers of melting and dendritic growth at X band – implications for a nowcasting strategy in stratiform rain, J. Appl. Meteorol. Clim., 58, 2497–2522, 2019.
Tyynelä, J., Leinonen, J., Moisseev, D., and Nousiainen, T.: Radar backscattering from snowflakes: Comparison of fractal, aggregate and soft-spheroid models, J. Atmos. Oceanic Technol., 28, 1365–1372, https://doi.org/10.1175/JTECH-D-11-00004.1, 2011.
Vivekanandan, J., Bringi, V., Hagen, M., and Meischner, P.: Polarimetric radar studies of atmospheric ice particles, IEEE T. Geosci. Remote, 32, 1–10, https://doi.org/10.1109/36.285183, 1994.
von Lerber, A., Moisseev, D., Bliven, L. F., Petersen, W., Harri, A.-M., and Chandrasekar, V.: Microphysical Properties of Snow and Their Link to Ze–S Relations during BAECC 2014, J. Appl. Meteorol. Climatol., 56, 1561–1582, https://doi.org/10.1175/JAMC-D-16-0379.1, 2017.
Williams, E., Smalley, D., Donovan, M., Hallowell, R., Hood, K., Bennett, B., Evaristo, R., Stepanek, A., Bals-Elsholz, T., Cobb, J., Ritzman, J., Korolev, A., and Wolde, M.: Measurements of differential reflectivity in snowstorms and warm season stratiform systems, J. Appl. Meteorol. Clim., 54, 573–595, https://doi.org/10.1175/JAMC-D-14-0020.1, 2015.
Zawadzki, I., Fabry, F., and Szyrmer, W.: Observations of supercooled water and secondary ice generation by a vertically pointing X-band Doppler radar, Atmos. Res., 59–60, 343–359, https://doi.org/10.1016/S0169-8095(01)00124-7, 2001.
Zhu, Z., Lamer, K., Kollias, P., and Clothiaux, E. E.: The vertical structure of liquid water content in shallow clouds as retrieved from dual-wavelength radar observations, J. Geophys. Res.-Atmos., 124, 14184–14197, 2019.
- Abstract
- Introduction
- Data
- Method
- Case description
- Results and discussions
- Summary
- Appendix A: Calculations of DWR and mean Doppler velocity for aggregated snowflakes using the self-similar Rayleigh–Gans approximation
- Data availability
- Author contributions
- Competing interests
- Disclaimer
- Acknowledgements
- Financial support
- Review statement
- References