the Creative Commons Attribution 4.0 License.
the Creative Commons Attribution 4.0 License.
 | 02 Sep 2021
Retrievals of dust-related particle mass and ice-nucleating particle concentration profiles with ground-based polarization lidar and sun photometer over a megacity in central China
Yunfei Zhang
Fuchao Liu
Zhenping Yin
Yifan Zhan
The POLIPHON (polarization lidar photometer networking) method is a powerful pathway to retrieve the height profiles of dust-related particle mass and ice-nucleating particle (INP) concentrations. The conversion factors fitted from the sun photometer observation data are the major part of the POLIPHON computations, which can convert the polarization-lidar-derived dust extinction coefficients into dust-related particle mass and INP concentrations. For the central Chinese megacity of Wuhan (30.5∘ N, 114.4∘ E), located at the downstream area several thousands of kilometers far away from the source regions of Asian dust, dust particles always mix with other aerosols from local emissions. Therefore, very few dust case data sets can be available when using the column-integrated Ångström exponent (for 440–870 nm) <0.3 and aerosol optical depth (at 532 nm) >0.1 recorded by a sun photometer as the filtering criteria. Instead, we present another dust case data set screening scheme that applies the simultaneous polarization lidar observation to verify the occurrence of dust. Based on the 33 dust-intrusion days identified during 2011–2013, the extinction-to-volume (cv,d) and extinction-to-large particle (with radius >250 nm) number concentration (c250,d) conversion factors are determined to be and 0.19±0.05 Mm cm−3, respectively. The c250,d for Wuhan is 27 % larger than that observed at Lanzhou SACOL (36.0∘ N, 104.1∘ E), a site closer to the Gobi Desert, and tends to be closer to those observed in North Africa and the Middle East, indicating dust aerosols from these two sources are also possibly involved in the dust events observed over Wuhan. As a comparison, the conversion factor c290,c of for continental aerosol is much smaller than c250,d, indicating that there is no significant influence of urban aerosols on the retrievals of dust-related conversion factor over Wuhan. The conversion factors are applied in a dust event in Wuhan to reveal the typical dust-related immersion-mode INP concentration over East Asian cities. The proposed dust case data set screening scheme may potentially be extended to the other polluted city sites that are more influenced by mixed dust.
- Article
(8051 KB) - Full-text XML
- BibTeX
- EndNote


Aerosol–cloud interactions, also named “aerosol indirect effects”, significantly impact the global climate (Rosenfeld et al., 2014). The interactions show an overall cooling effect on radiative forcing but still have a large uncertainty, meaning that they are still poorly understood and thus not well represented in the climate model (IPCC, 2013). Heterogeneous nucleation is one of the most important aerosol–cloud interactions for mixed-phase clouds, which are essential to cloud electrification and the production of precipitation (Rosenfeld et al., 2008; Mülmenstädt et al., 2015). At temperatures ranging from −38 to 0 ∘C, ice crystals within the mixed-phase cloud are primarily produced via heterogeneous freezing, with some types of insoluble aerosols acting as ice-nucleating particles (INPs) (Cantrell and Heymsfield, 2005).
Numerous types of aerosols can serve as INPs, as reviewed by Murray et al. (2012) and Kanji et al. (2017), e.g., mineral dust, biological material, volcanic ash. Dust is the dominant type, accounting for 77 % of active INPs ubiquitous all over the world and thus provides a great opportunity to study heterogeneous nucleation (Hoose et al., 2010). In principle, one INP can correspondingly form one ice crystal particle, except for the occurrence of ice multiplication mechanism (also named Hallett–Mossop process) at temperatures of −3 to −8 ∘C (Hallett and Mossop, 1974), which can rapidly enhance the number concentration of the ice population following initial primary ice nucleation events (Field et al., 2017). This agreement was substantially verified by a closure study on dust-related altocumulus and cirrus layers, which compared the lidar-derived ice-nucleating particle concentration (INPC) with the radar-derived ice crystal number concentration (ICNC) and found that the discrepancy between them was within an order of magnitude (Ansmann et al., 2019a). Moreover, good agreement between INPC derived by the measurements of CALIPSO spaceborne lidar and ICNC derived by the synergistic measurements of spaceborne radar and lidar (DARDAR) was also found by Marinou et al. (2019). Therefore, it is of significant importance to quantitatively estimate INPC profiles, which provide an approach to evaluate the ICNC parameterization that may be necessary for climate models.
The POLIPHON (polarization lidar photometer networking) method, first introduced by Ansmann et al. (2012), is able to retrieve the height profiles of dust-related INPC and dust mass concentration. In this approach, two remote sensing instruments, a polarization lidar and a sun photometer, are employed together with INP parameterization schemes (Mamouri and Ansmann, 2014, 2015, 2016; Mamali et al., 2018; Ansmann et al., 2019a, b, 2021; Hofer et al., 2020). Marinou et al. (2019) compared the INPC profiles retrieved by lidar observation with those measured by unmanned aerial vehicles (UAVs). A good coincidence within an order of magnitude was found when applying the parameterization scheme U17-D from Ullrich et al. (2017), meaning that the POLIPHON method is a promising approach to retrieve the INPC height profiles. Furthermore, the cost of such a remote sensing approach is much less than the airborne in situ observation, making it applicable for long-term INPC monitoring both locally and globally.
To retrieve the dust-related INPC profiles, the most significant aspect is the estimation of dust-related conversion factors that can convert the dust extinction coefficient to large particle (with radius >250 nm) number concentration and dust mass concentration. For the regions in or near deserts, pure or quasi-pure dust cases frequently occur with less influence from other aerosol emissions. Ansmann et al. (2019b) obtained the dust conversion factors for those Aerosol Robotic Network (AERONET) sites in or near the desert regions with the filtering criteria of an Ångström exponent (AE) for the 440–870 nm wavelength range AE <0.3 and a 532 nm (converted from 500 nm) aerosol optical depth (AOD) The pure dust case data sets following the criteria given above can be found in a large quantity, as shown by Ansmann et al. (2019b) (with adequate data points >2500 for each site). However, very few such data sets are available, as seen in sun photometer observation, for those cities located in the downstream regions of Asian dust if such filtering criteria are applied. For example, the local aerosol emissions are always abundant during the dust-intrusion days in a central Chinese megacity, e.g., Wuhan (30.5∘ N, 114.4∘ E) (see Fig. 1) (Kong and Yi, 2015; Ma et al., 2019; Yin et al., 2021b). Therefore, the sun-photometer-measured column-integrated aerosol properties are the result of a mixture of dust particles and other aerosols (i.e., mixed dust, usually with a lidar-measured particle depolarization ratio <0.3). Urban air pollution generally cannot affect the atmospheric INPC (Chen et al., 2018). Similarly, Kanji et al. (2020) and Schill et al. (2020) found that soot is also not an effective aerosol type when serving as an INP. However, the optical properties of these ineffective INP aerosols may have an impact on the retrievals of the dust-related conversion factors and then the INPC for mixed-dust situations in a megacity influenced by long-range-transported dust plumes (Córdoba-Jabonero et al., 2018; Mamouri and Ansmann, 2017; Wang et al., 2021). To retrieve the dust-related POLIPHON conversion factors for Wuhan, we present another dust case selection scheme by means of simultaneous ground-based polarization observations, which can verify the dust occurrence. Using this method, the height profiles of INPC and dust mass concentration can be successfully obtained at Wuhan.

Figure 1The land cover type during January 2019–February 2020 over the East Asia region (10–60∘ N, 60–130∘ E) obtained from the MODIS (combined Aqua and Terra) Collection 6 level-3 MCD12C1 product (with 0.05∘ resolution). The locations of three AERONET sites at Dushanbe (38.6∘ N, 68.8∘ E), Dalanzadgad (43.6∘ N, 104.4∘ E), and Lanzhou SACOL (36.0∘ N, 104.1∘ E), as well as the central Chinese city of Wuhan (30.5∘ N, 114.4∘ E), are marked with the hollow black triangles. The general locations of the Gobi Desert and Taklimakan Desert are also marked by the brown areas (Friedl et al., 2015).
The organization of this paper is as follows. We first briefly introduce the relevant instruments and data. The following section shows the primary steps of the POLIPHON method and the retrieval scheme of two dust-related conversion factors for Wuhan. In Sect. 4, we present a case study on the dust-related heterogeneous nucleation process at Wuhan using the method given in Sect. 3. In the last section, conclusions and discussions are presented.
2.1 Polarization lidar
A zenith-pointed ground-based polarization lidar, installed at an atmospheric observatory on the campus of Wuhan University, Wuhan, China (30.5∘ N, 114.4∘ E, ∼80 , the exact location can be seen in Fig. 1), was employed to observe the transported dust (He et al., 2015) and the ice formation within the mixed-phase cloud (He et al., 2021a, b; Yin et al., 2021a). The lidar system has been described in detail by Zhang et al. (2014) and Kong and Yi (2015) and enables us to obtain the height profiles of the aerosol extinction coefficient (if assuming a typical local lidar ratio), aerosol backscatter coefficient, and volume/particle linear depolarization ratio at 532 nm. It should be mentioned that double-cascaded cubic polarizing beam splitters were used for both the parallel and perpendicular polarized channels so that the crosstalk between them could be suppressed well.
The temporal and height resolutions of lidar raw data are 1 min and 3.75 m, respectively. The gain ratio between two orthogonally polarized channels is calibrated using the Δ90∘ method (Freudenthaler et al., 2009); the relative error for volume depolarization ratio δ (aerosol + molecular) is less than 5 %. The lidar-derived δ is sensitive to the nonsphericity of backscattering targets and therefore can be employed in distinguishing dust aerosols from other types of spherical aerosols (He and Yi, 2015; Sakai et al., 2010). The method from Fernald (1984) was used to retrieve the aerosol backscattering coefficient β and backscatter ratio R; the uncertainties are estimated to be ≤10 % for β and R. Following this, the particle linear depolarization ratio δp at height z can be calculated by using the equation below:
where δm (=0.004 for our lidar system) is the molecular depolarization ratio that is related to the specification of the narrowband filters in the receiving unit of the lidar system (Behrendt and Nakamura, 2002). The relative uncertainty for δp is generally on the order of 5 %–10 % (Mamouri et al., 2013).
2.2 Sun photometer and GRASP algorithm
A sun- and sky-scanning spectral photometer (CE-318) was installed at our observatory in April 2008 and operated until August 2013 (Zhang et al., 2021). It detects the direct solar irradiance at eight wavelengths (340, 380, 440, 500, 675, 870, 1020, and 1246 nm) for every 15 min; the AOD at each wavelength can then be calculated following the Beer–Lambert law. The uncertainties of AOD are ∼0.015 at 440–1020 nm and ∼0.035 at 340–380 nm under the optical air mass of 1.0 (Zhang et al., 2021), which corresponds to the summer solstice in the Northern Hemisphere. Considering that transported dust plumes generally intrude into Wuhan in spring and winter, these AOD uncertainties should be divided by a factor of 1.6 and 2.4, respectively. Therefore, the AOD uncertainties for our sun photometer should be similar to those (0.01–0.02) for AERONET field instruments (Holben et al., 1998). The sky radiance data are not available. The fine-mode fraction (FMF) of 500 nm AOD was obtained based on the method given by O'Neill et al. (2003). The uncertainty in FMF mainly depends on the assumptions of the coarse-mode Ångström exponent, the spectral derivative coarse-mode Ångström exponent, and the relationship between the fine-mode Ångström exponent and spectral derivative fine-mode Ångström exponent (O'Neill et al., 2001), which are related to the actual atmospheric condition.
The Generalized Retrieval of Aerosol and Surface Properties (GRASP) algorithm is widely used in retrieving aerosol microphysical properties (Dubovik et al., 2014) and was reported to be applied in dust event observation (Benavent-Oltra et al., 2017, 2019). Although our sun photometer lacks the sky radiance observation, the GRASP-AOD application allows us to determine particle size distributions using only spectral AOD data (Torres et al., 2017). In this study, the column-integrated particle size distribution was retrieved using the spectral AODs ranging from 380 to 1020 nm as the input in the GRASP algorithm. Considering Wuhan is a megacity with plenty of local aerosol emissions (Ma et al., 2019), we assumed the complex refractive index values to reflect the mixed desert dust characteristic in the particle size distribution inversion. The real part was set to be 1.55; the imaginary part was set to be wavelength dependent (i.e,. 0.003 at 380 nm, 0.0025 at 440 nm, 0.0022 at 500 nm, 0.0014 at 675 nm, 0.001 at 870 nm, and 0.001 at 1020 nm) (Dubovik et al., 2002). When calculating the particle size distributions for continental aerosols (AE >1.6), the complex refractive index was set to be 1.47+0.014i.
2.3 Radiosonde data
The radiosondes (GTS1-2, made by China) were launched twice per day at 08:00 local time (LT) (00:00 UTC) and 20:00 LT (12:00 UTC) from the Wuhan Weather Station, located approximately 24 km from our lidar site. The profiles of temperature and pressure provided by radiosondes were used in the INP concentration parameterization (DeMott et al., 2010, 2015) to convert the aerosol particle (with radius >250 nm) number concentrations (APC250) into the INP concentrations. The error for the measured temperature is less than 1 ∘C (Nash et al., 2011).
2.4 CALIOP
The Cloud–Aerosol Lidar and Infrared Pathfinder Satellite Observation (CALIPSO) satellite was launched in 2006 and carries the Cloud–Aerosol Lidar with Orthogonal Polarization (CALIOP) instrument to provide the vertical information of aerosols and clouds (Winker et al., 2007). The satellite orbit nearly passes Wuhan every day at about 02:00 and 14:00 LT with the nearest sub-point occurring every 16 d. Due to the change of its orbit height from 705 to 688 km made to resume formation flying with CloudSat, the closest horizontal distance between CALIPSO sub-point and our lidar site is <10 km before 13 September 2018 and <50 km currently. It can measure the elastic backscatter at both 532 and 1064 nm and is also capable of measuring the depolarization ratio at 532 nm near nadir during both daytime and nighttime. The depolarization ratio is used to identify the dust aerosol and the ice-containing cloud because of their nonspherical shape. The color ratio, defined as the ratio of backscattering at 1064 nm to backscattering at 532 nm, is provided as a measure of the particle size. In this study, the CALIOP Level-2 vertical feature mask (VFM) product was used not only to validate the presence of dust layers over Wuhan (Omar et al., 2009) but also to provide the three-dimensional structure information of the dust plume combining simultaneous ground-based measurements (i.e., vertical distribution and horizontal extension).
2.5 HYSPLIT model
The Hybrid Single Particle Lagrangian Integrated Trajectory (HYSPLIT) model, based on the National Centers for Environmental Prediction (NCEP) GDAS data product, can calculate the backward trajectory of the air mass (Draxler and Rolph, 2003). In this study, 3 d backward simulations were regarded to check the potential source of the dust aerosol layers observed by polarization lidar over Wuhan.
In this section, we introduce the retrieval schemes for dust-related particle mass and INP concentrations. The specific steps of the data processing were presented in previous studies (Mamouri and Ansmann, 2014, 2015, 2016). Here, we only present the main derivation steps (Sect. 3.1). More importantly, the retrieval scheme of dust-related conversion factors over Wuhan, a megacity that is thousands of kilometers away from desert regions, is shown in detail (Sect. 3.2). The methodological diagram is given in Fig. 2. The related data and algorithms applied for each step are shown. In particular, it should be emphasized that GRASP algorithm is only used in the step of deriving the particle size distribution from spectral AODs.
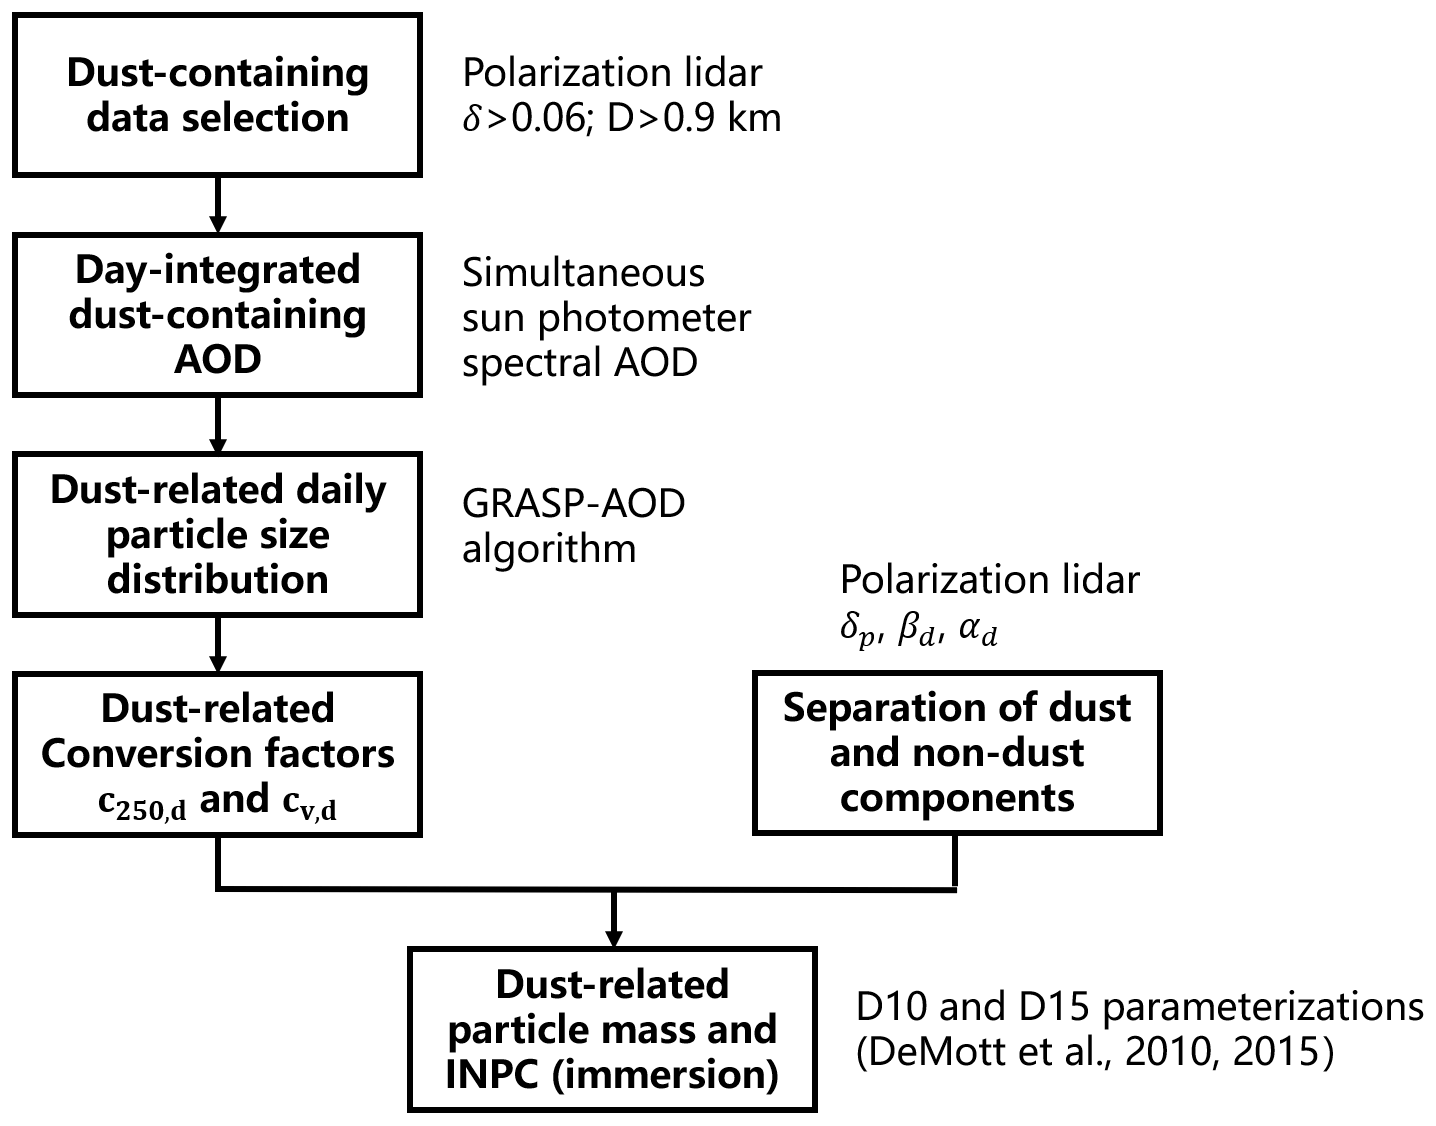
Figure 2Overview of the data analysis scheme in this work. The left column shows the specific steps for retrieving the dust-related conversion factors over Wuhan. The GRASP-AOD algorithm is used as an auxiliary for deriving the particle size distribution from sun-photometer-measured spectral AODs.
3.1 Retrieval scheme of dust mass concentration and dust-related INPC
First, the aerosol backscatter coefficient β can be determined from the Mie backscatter lidar data with the Fernald method (Fernald, 1984). Following this, we need to separate dust component (i.e., βd) from the total aerosol backscatter coefficient β using the so-called “one-step” approach (Mamouri and Ansmann, 2014). The dust backscatter coefficient βd can be converted into the dust extinction coefficient αd by multiplying it with a typical dust lidar ratio Sd. Finally, αd can be related to the dust mass concentration and dust-related INPC with the conversion factors obtained by sun photometer data and corresponding parameterizations.
The primary principle is introducing two threshold values of the particle depolarization ratio, non-dust particle depolarization ratio δnd=0.05, and dust particle depolarization ratio δd=0.31(Sakai et al., 2010) to separate the respective contribution of each component (dust particles, non-dust particles, and their mixture) to the total backscatter coefficient. The particles with δp<δnd are considered non-dust particles. The particles with δp>δd are considered pure dust particles (i.e. mineral dust). δp values that range between δnd and δd are a mix of non-dust and pure dust components. The dust backscatter coefficient βd can be expressed as follows (Tesche et al., 2009):
The subscripts d, nd, and p represent dust, non-dust, and particle (dust + non-dust), respectively. Therefore, the dust extinction coefficient αd can be calculated using
where the dust lidar ratio Sd is set to 45 sr (Hu et al., 2020). The uncertainty in αd mainly depends on the contribution of dust component within an aerosol layer. Very low dust contribution can cause a very large uncertainty in αd (Marinou et al., 2019). Since δpvalues are mostly observed to be 0.14–0.43 over Wuhan during the dust-related heterogeneous nucleation events (He et al., 2021a), we only consider the well-detected desert dust layer (δp≈0.3) and less pronounced aerosol layer (δp≈0.2) when estimating the uncertainty in αd. Mamouri and Ansmann (2014) estimated the uncertainty in βd to be 15 %–20 % for well-detected desert dust layers and 20 %–30 % for less pronounced aerosol layers. Considering the uncertainty of ∼10 % in updated dust lidar ratio (Peng et al., 2021), here the uncertainty in αd is estimated to be 18 %–32 %, which is more conservative than the values of 15 %–25 % given by Ansmann et al. (2019b).
Finally, the dust mass concentration Md can be computed by the equation below:
where ρd is the dust particle density (2.6 g cm−3 for Asian dust) (Wagner et al., 2009) and cv,d is the extinction-to-volume conversion factor. The value of cv,d can be obtained from sun-photometer-observed dust-intrusion days, as discussed by Sect. 3.2. The uncertainty in Md is estimated to be 29 %–64 %.
To calculate the INPC, the dust extinction coefficient αd need to be converted to the column-integrated number concentration of large particles with radius >250 nm APC250 (here denoted as n250,d) by the following expression:
where c250,d is the conversion factor obtained from sun photometer observation (see Sect. 3.2) during dust-intrusion days at our site. The overall uncertainty for n250,d is estimated to be 27 %–40 %. Based on an INPC parameterization scheme given by DeMott et al. (2010, 2015) that is appropriate for dust-related immersion freezing regime, one can finally retrieve the height profile of INPC:
Here, the INPC value under standard pressure (p0=1013 hPa) and temperature (T0=273.16 K) conditions can be expressed by the D10 parameterization scheme (DeMott et al., 2010):
with the constants a=0.0000594, b=3.33, c=0.0265, and d=0.0033. This parameterization scheme is applicable for temperatures ranging from −9 to −35 ∘C. The D15 parameterization scheme is another option explicitly for mineral dust (DeMott et al., 2015):
with the constants ad=0, bd=1.25, cd=0.46, , and fd=3.0. This parameterization scheme is applicable for temperatures ranging from −21 to −35 ∘C. The uncertainty for INPC using D15 is within an overall factor of 3 (Mamouri and Ansmann, 2015). In practice, the corresponding meteorological parameter (i.e., pressure and temperature) profiles are provided by the measurement from the most recently launched radiosonde.
Note that these two parameterizations (D10 and D15) are used for immersion freezing. Ullrich et al. (2017) developed another important parameterization for heterogeneous ice nucleation that quantifies the INPC as a function of ice nucleation active surface site density (related to temperature and ice saturation ratio). This parameterization included both desert dust and soot aerosol and was applicable for both immersion nucleation and deposition nucleation. Most dust layers over Wuhan appear at relatively low altitudes with warmer meteorological conditions; hence, immersion nucleation takes place more generally. Therefore, we only applied D10 and D15 parameterizations in this study.
3.2 POLIPHON conversion factors over Wuhan
As mentioned in Sect. 3.1, we need to obtain the dust-related conversion factors. Ansmann et al. (2019b) reported an extended set of dust conversion factors considering all relevant deserts around the globe using the AERONET database. To obtain climatological dust conversion factors for a given AERONET site, they filtered all AERONET data sets with the criteria of an Ångström exponent for the 440–870 wavelength range AE <0.3 and a 532 nm (converted from 500 nm) AOD The pure dust cases following the criteria given above can be found more easily (with adequate data sets >2500 for each site) in or near desert regions, as presented in Ansmann et al. (2019b). Dust frequently intrudes into Wuhan. However, very few sun photometer data sets can fulfill those constraints. This is caused by plenty of local aerosol emissions (especially within the boundary layer), which cause the column-integrated aerosol properties observed to generally reflect characteristics of mixed dust (dust particles mixed with other urban aerosols) (Shao et al., 2020; Liu et al., 2021; Yin et al., 2021b). It is also worth noting that the previous gravitational sedimentation and wet deposition of dust particles during transport may modify the dust optical and microphysical properties above Wuhan. Thus, the dust-related conversion factors differ from those of near-desert sites.
To select the dust-containing data sets from sun photometer observations, we employed, for the first time, the simultaneous ground-based polarization lidar observations as an auxiliary. Once a dust layer with δ>0.06 and layer thickness >0.9 km was observed by lidar (Huang et al., 2008), we considered the simultaneous observational data sets from sun photometer available for calculating the dust-related conversion factors. For a dust-intrusion day, all of these dust-containing data sets measured by the sun photometer were averaged to form a representative result (AOD and later particle size distribution calculated by GRASP algorithm) of this day. Here, we give an example of the dust case data set screening scheme for a typical dust-intrusion day. Figure 3 presents the time–height contour plots of the range-corrected signal and volume depolarization ratio measured by polarization lidar during 10:00–16:00 LT on 28 April 2011. The lidar system began to operate at ∼10:00 LT that day. Two distinct dust layers with δ>0.1 can be identified from the surface to around 2.0 km and above 2.5 km, respectively. Hence, it was a typical dust-intrusion day. In addition to this, four cloud-free periods (10:00–10:30, 12:20–12:50, 14:00–14:30, and 15:30–16:00 LT) were selected to show the vertical distributions of δ, as seen in Fig. 4c, d, e, and f, respectively. The δ values were larger than 0.06 throughout the whole lower troposphere (from the surface to around 5.5 km). Considering the thresholds of δ and thickness that we defined, all of these periods can be identified as “dust occurrence”.

Figure 3Time–height contour plots (1 min/30 m resolution) of (a) range-corrected signal and (b) volume depolarization ratio and 30 min integrated profiles of volume depolarization ratio during (c) 10:00–10:30 LT, (d) 12:20–12:50 LT, (e) 14:00–14:30 LT, and (f) 15:30–16:00 LT measured by a 532 nm polarization lidar on 28 April 2011. The vertical dashed blue lines indicate the volume depolarization ratio value of 0.06 that is considered as a threshold for the identification of dust occurrence.
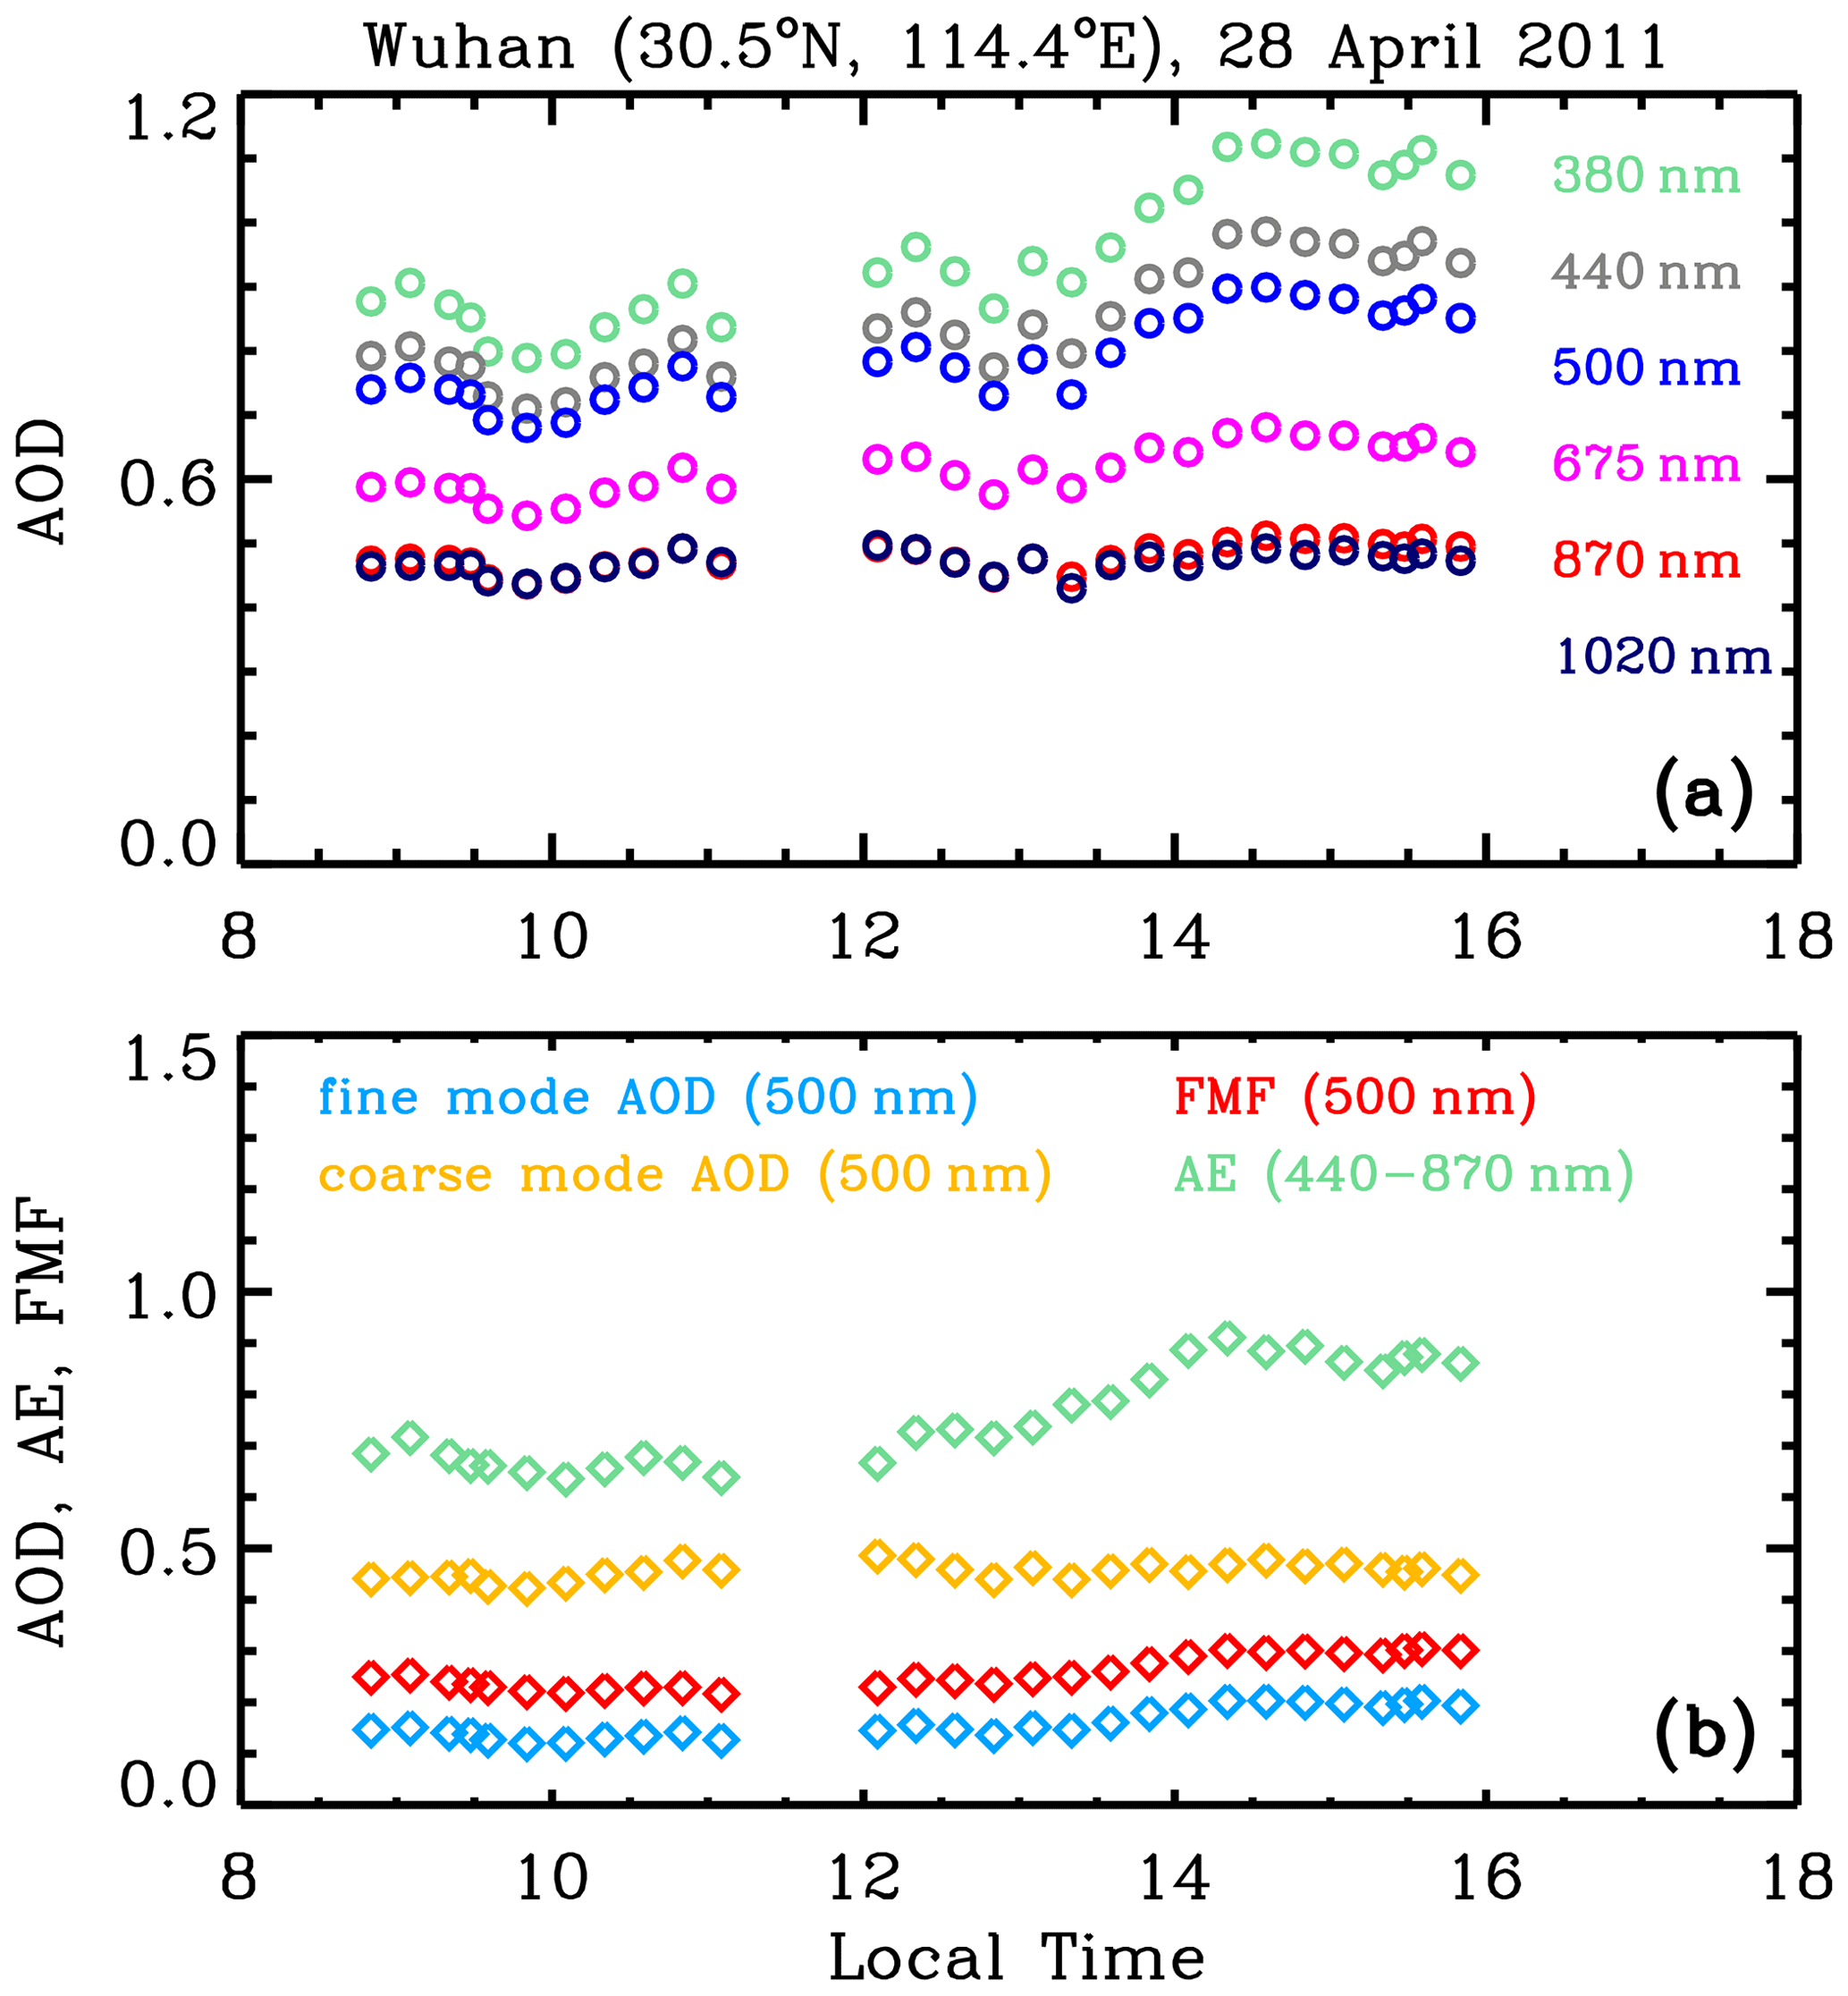
Figure 4Time series of (a) AOD at six wavelengths (380, 440, 500, 675, 870, 1020 nm) and (b) 500 nm fine-mode AOD (azure rhombi), coarse-mode AOD (yellow rhombi), fine-mode AOD fraction (FMF, red rhombi), and Ångström exponent for the 440–870 nm wavelength range (AE, aquamarine rhombi) observed with a sun photometer at Wuhan (30.5∘ N, 114.4∘ E) on 28 April 2011.
The sun photometer observation results for the same day, including six-wavelength AODs, AE, FMF, and fine-mode and coarse-mode 500 nm AODs, are shown in Fig. 4. FMFs ranged from 0.2 to 0.3 during the dust-intrusion period, indicating a significant contribution of large dust particles. Similar FMF values (0.2–0.4) were also reported at Ouarzazate (30.9∘ N, 6.9∘ W), Morocco, during the Saharan Mineral Dust Experiment 1 (SAMUM-1) (Ansmann et al., 2011; Mamouri and Ansmann, 2014). Nevertheless, AE values were 0.6–0.9, meaning that the mixed dust cases cannot fulfill the criteria for pure dust cases (AE < 0.3) as given by Ansmann et al. (2019b). As confirmed by the polarization lidar observation, the sun photometer data sets from the period 10:00–15:50 LT were related to the dust intrusion. Therefore, the corresponding data sets measured by sun photometer during this dust-intrusion period (12:05–15:50 LT) were averaged to form the representative results (AOD and later particle volume size distribution) for 28 April 2011. Figure 5 shows the column-integrated particle volume size distribution (Fig. 5a) and particle number size distribution (Fig. 5b) derived from the averaged spectral AODs during 10:00–15:50 LT on 28 April 2011 based on the GRASP-AOD algorithm. The particle radius ranges from 0.05 to 15 µm and is separated into 43 radius intervals of logarithmically equal width.
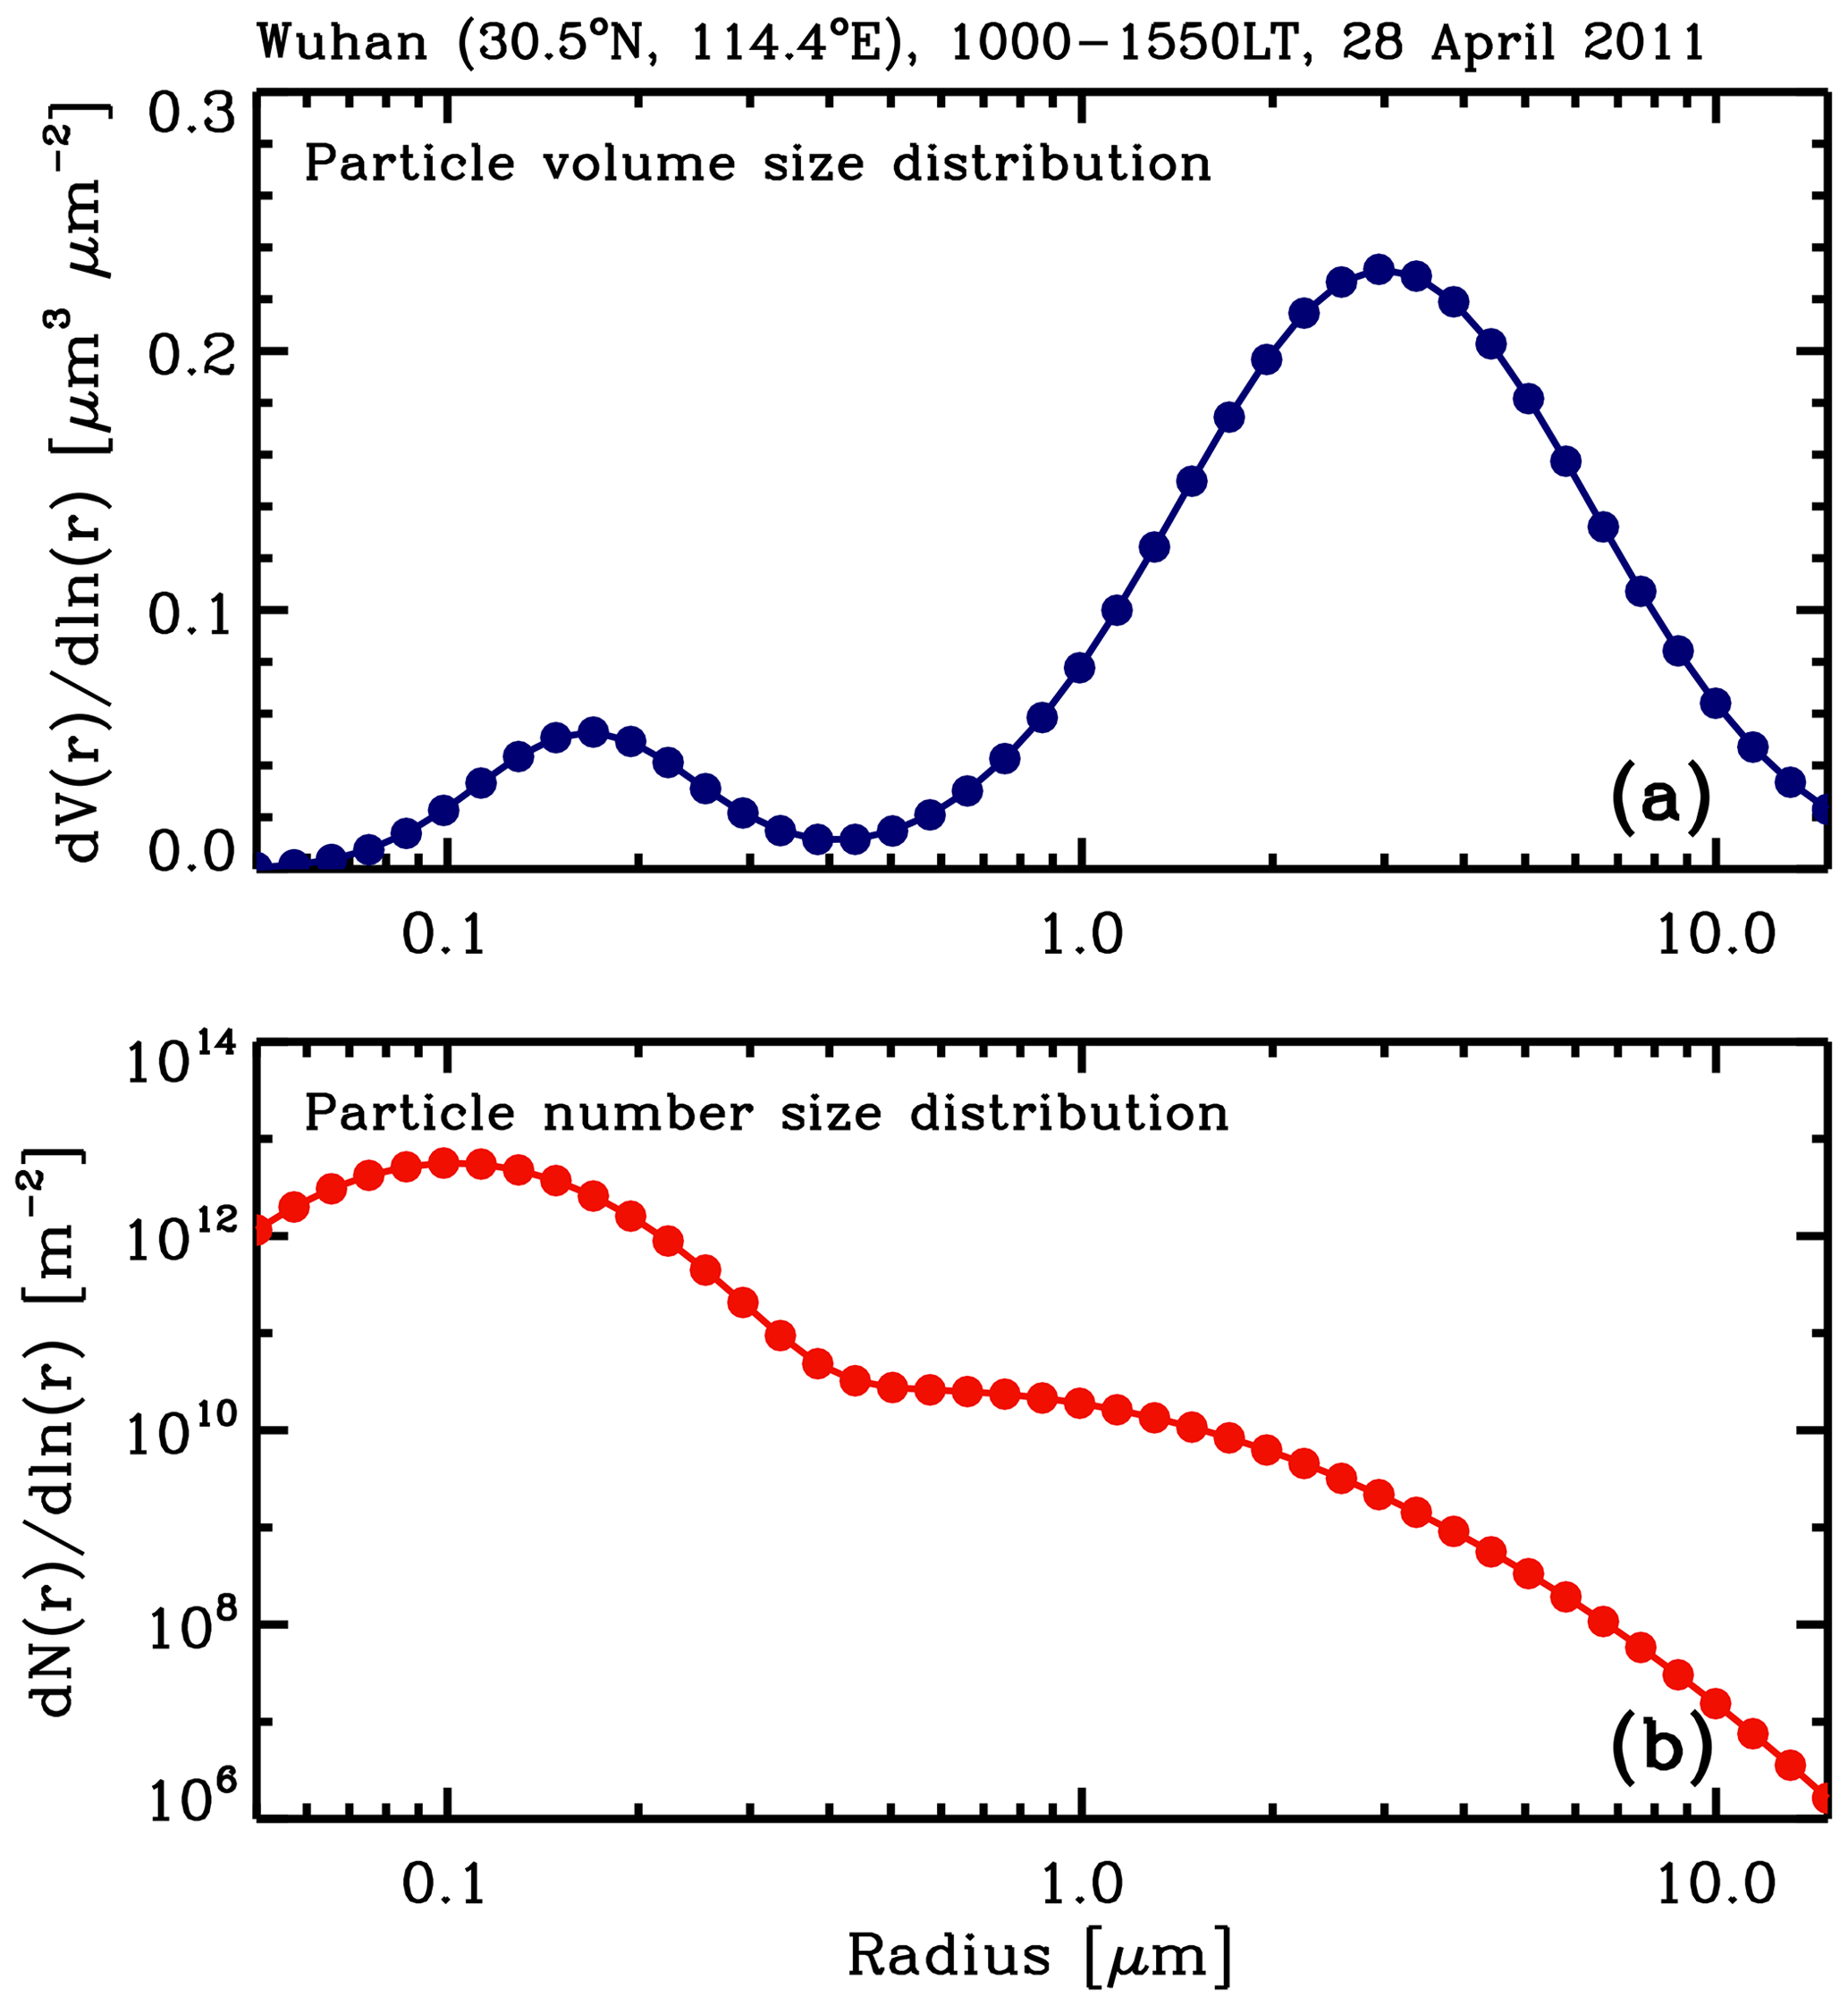
Figure 5Column-integrated (a) particle volume size distribution and (b) particle number size distribution derived from sun photometer observations at Wuhan (30.5∘ N, 114.4∘ E) during 10:00–15:50 LT on 28 April 2011 based on GRASP-AOD algorithm. Ground-based polarization lidar observation verified that dust episodes occurred during this period.
The column APC250 values are obtained by integrating the particle number (as given in Fig. 5b) with a radius larger than 250 nm. Considering dust is the dominant type in coarse-mode particles, we assume , where the subscript “d” denotes the dust component. Following this, the relationship between APC250,d and 500 nm AOD can be linked by a conversion factor c250,d with the following equation:
Assuming an aerosol layer thickness of D, we can convert the above equation to
where n250,d and αd are the layer-mean large particle (with radius >250 nm) number concentration and lidar-derived dust extinction coefficient, respectively. In total, we used 32 dust-intrusion days from joint lidar and sun photometer observations during 2011–2013. As seen in Fig. 6, a good correlation between n250,d and αd was found with a linear Pearson correlation coefficient of 0.976 for the period of 2011–2013. Each green point represents a pair of daily averaged values for the dust occurrence period of a dust-intrusion day (taking the day of 28 April 2011 shown above as an example). Note that these points represent the same data set (i.e., the same 33 dust-intrusion days) as those green points in Fig. 5. The c250,d value was 0.19±0.05 Mm cm−3 as computed by the equation below:
The standard deviation of 0.05 Mm cm−3 is similar to those obtained from other AERONET sites (0.02–0.05 Mm cm−3) by Ansmann et al. (2019b). The c250,d value of 0.19 Mm cm−3 is approximately 27 % larger than the value of 0.15 Mm cm−3 obtained at the Lanzhou SACOL (36.0∘ N, 104.1∘ E) AERONET site and Dalanzadgad, Mongolia (see Fig. 1), which are very close to the source region of Asian dust (Ansmann et al., 2019b). Mamouri and Ansmann (2015) mentioned that this dust-related conversion factor can almost be invariable from the dust source (Morocco and Cape Verde) to downwind regions (Barbados). Therefore, this discrepancy indicates that Wuhan may not be only influenced by Asian dust. Note that the conversion factor 0.19 Mm cm−3 is more like the values of 0.16–0.20 Mm cm−3 for North Africa (Saharan dust) and the Middle East, suggesting that dust aerosols from these two sources are also possibly involved in the dust events observed over Wuhan. This conjecture can be verified to some extent since the dust plumes over Wuhan can often be traced back to these two sources via HYSPLIT model simulation (He et al., 2021a). Kojima et al. (2006) confirmed that dust particles that have not undergone substantial aging or a cloud-processing event can be present thousands of kilometers from source regions. Furthermore, to analyze the potential impact of local emissions on c250,d, the conversion factor for continental aerosols c290,c was also calculated for the period 2008–2013, as seen from the purple points in Fig. 6 (Mamouri and Ansmann, 2016). The c290,c value of 0.11±0.02 Mm cm−3 for Wuhan is similar to those of around 0.10 Mm cm−3 for two city sites, Limassol, Cyprus (34.7∘ N, 33.0∘ E), and Leipzig, Germany (51.4∘ N, 12.4∘ E) (Mamouri and Ansmann, 2016), meaning that this value depicts a typical conversion factor for the urban aerosol situations. Similar to the results in Limassol and Leipzig (Fig. 7b in Mamouri and Ansmann, 2016), c250,d is almost twice as large as c290,c in Wuhan, indicating lesser large particles are included in local pollution. This comparison suggests that there is no significant influence of urban aerosols on the retrievals of the dust-related conversion factor c250,d in Wuhan, at least for the “most dusty” cases that we selected for c250,d calculation in this study.

Figure 6Relationship between extinction coefficient and large particle (with radius >250 nm) number concentration n250,d for mixed dust and n290,c for continental aerosols over Wuhan. Each green point denotes a pair of daily averaged values for the dust occurrence period of a dust-intrusion day (verified by ground-based polarization lidar). Each purple point denotes a pair of daily averaged values during the period when Ångström exponent The conversion factor is obtained during 2011–2013, and is obtained during 2008–2013 (see Eqs. 4 and 5 in Mamouri and Ansmann, 2016).
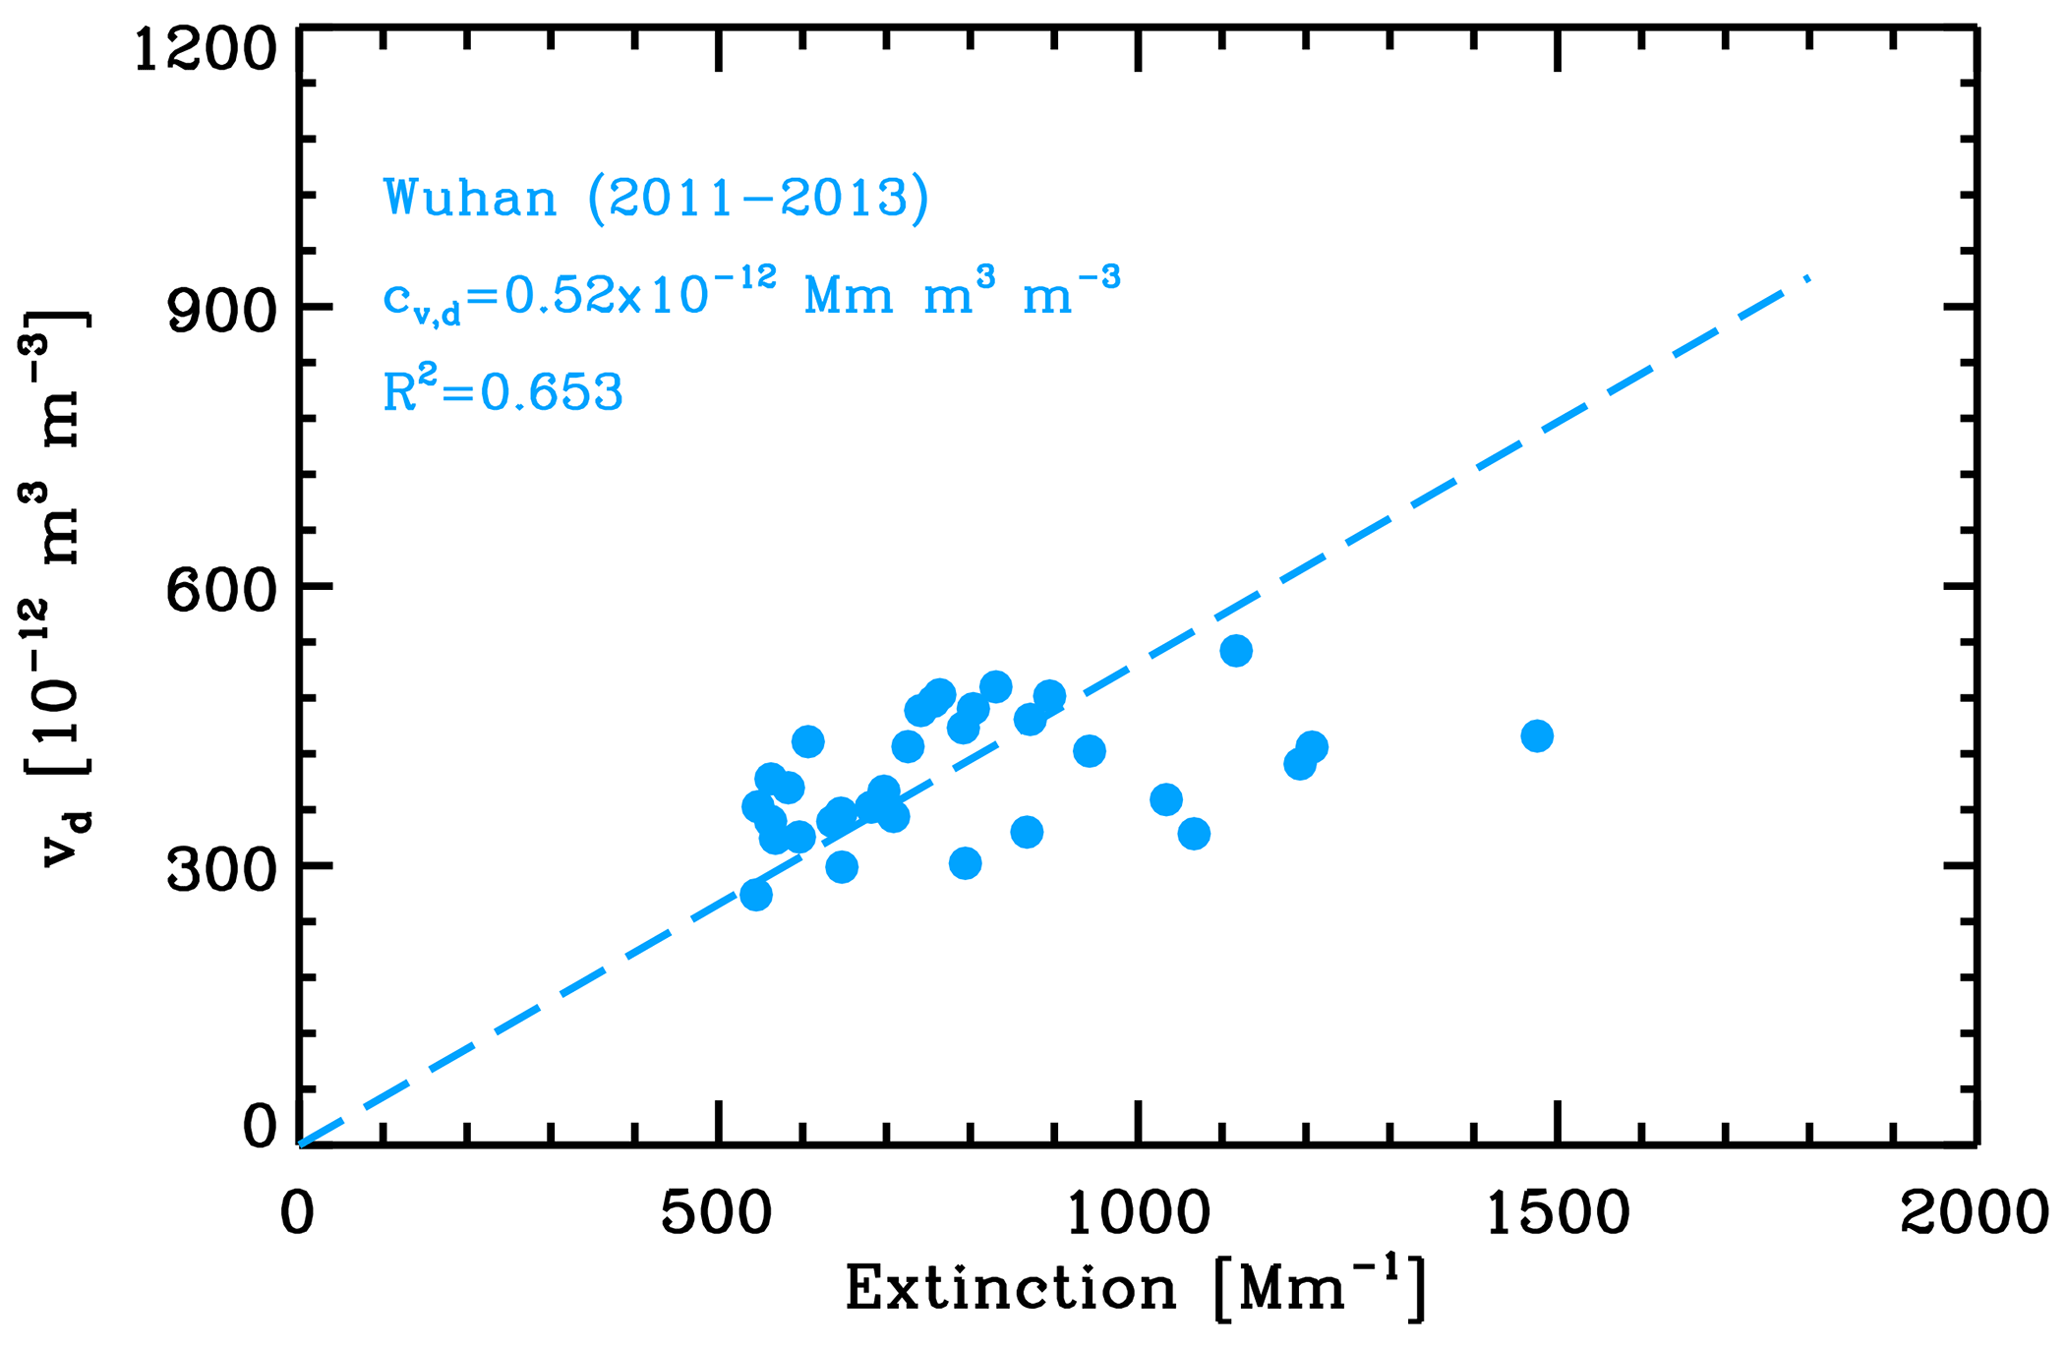
Figure 7Relationship between extinction coefficient and volume concentration vd for mixed dust. Correlations are given by sun photometer observations during dust-intrusion days that are verified by ground-based polarization lidar. Each point denotes a pair of daily averaged values for the dust occurrence period of a dust-intrusion day. The slope of the dashed blue line indicates the mean increase in vd with extinction coefficient, which is defined as the extinction-to-volume conversion factor . All of the points are obtained from the dust-intrusion days during 2011–2013.
The column particle volume concentration values Vd are obtained by integrating the entire particle size distribution spectrum. The relationship between Vd and 500 nm AOD can be linked by a so-called extinction-to-volume conversion factor cv,d with the following equation:
Assuming an aerosol layer thickness of D, we can convert the above equation to
where vd and αd are the layer-mean particle volume concentration and extinction coefficient, respectively. As seen in Fig. 7, a correlation between vd and αd was found with a linear Pearson correlation coefficient of 0.653 for the period of 2011–2013. Each point in Fig. 7 also represents a pair of daily averaged values for the dust occurrence period of a dust-intrusion day (taking 28 April 2011 as an example). The cv,d value was as computed by the equation below:
The conversion factor cv,d of is approximately 32 % smaller than the value of obtained at Lanzhou SACOL AERONET site (Ansmann et al., 2019b), suggesting that the proportion of dust particles in the atmospheric column is relatively smaller in Wuhan. In particular, those more dispersed points below the dashed line seem to be more affected by anthropogenic aerosols. Moreover, the standard deviation of for Wuhan is located in the varying interval of standard deviations (0.05– for the other AERONET sites in Ansmann et al. (2019b), meaning the cv,d value for Wuhan is justified.
Torres et al. (2017) analyzed the influence of AOD errors on the aerosol size distributions (in Sect. 3.4 therein). The tests with random simulated errors showed that the uncertainties in the GRASP bimodal log-normal size distribution parameters increase as the aerosol loads decreases. Considering the averaging AOD440 (AOD at 440 nm) value of 0.92 for the 33 d selected in our study, we use the uncertainties in bimodal log-normal size distribution parameters from the coarse-mode aerosol prevailing case cluster with AOD440=0.9 (i.e., “SOLV3” in Table 2 and 7 from Torres et al., 2017) to estimate the uncertainty involved in APC250 and total volume concentration. The same AOD errors were introduced for each wavelength as for the AERONET instruments. Taking the simulated uncertainties of GRASP bimodal log-normal size distribution parameters into account, the uncertainties in APC250 and total volume concentration caused by AOD errors are estimated to be <3.2 % and ∼0 %. The uncertainty in AOD500 is ∼2 %. Torres and Fuertes (2021) compared the aerosol size properties derived by GRASP-AOD application with those obtained by AERONET retrieval algorithm. When AOD440>0.4, the uncertainty in total volume concentration was estimated to be 23 %. Mamouri and Ansmann (2015) mentioned that the uncertainty in AERONET-algorithm-derived APC250 is 10 %–15 %. Propagating all the uncertainties above into the conversion factors obtained in this study, the derived uncertainties in c250,d and cv,d are conservatively estimated to be both <28 %.
We used the two dust-related conversion factors, c250,d and cv,d, retrieved at Wuhan to analyze a dust-related heterogeneous nucleation case on 31 December 2017. Figure 8 presents the time–height contour plots (1 min/30 m resolution) of the range-corrected signal (Fig. 8b) and volume depolarization ratio δ during 01:00–07:00 LT (Fig. 8d). The corresponding profiles of the relative humidity (RH), temperature (T), horizontal wind speed (V), and wind direction from the radiosonde launched at 08:00 LT are shown in Fig. 8a and c. Two distinct dust aerosol layers (below ∼2 km and at ∼4.5–6.5 km, respectively) were identified with peak δ values exceeding 0.1. Another slight dust layer with an enhanced δ of ∼0.04 occurred up to ∼8 km after ∼02:30 LT.
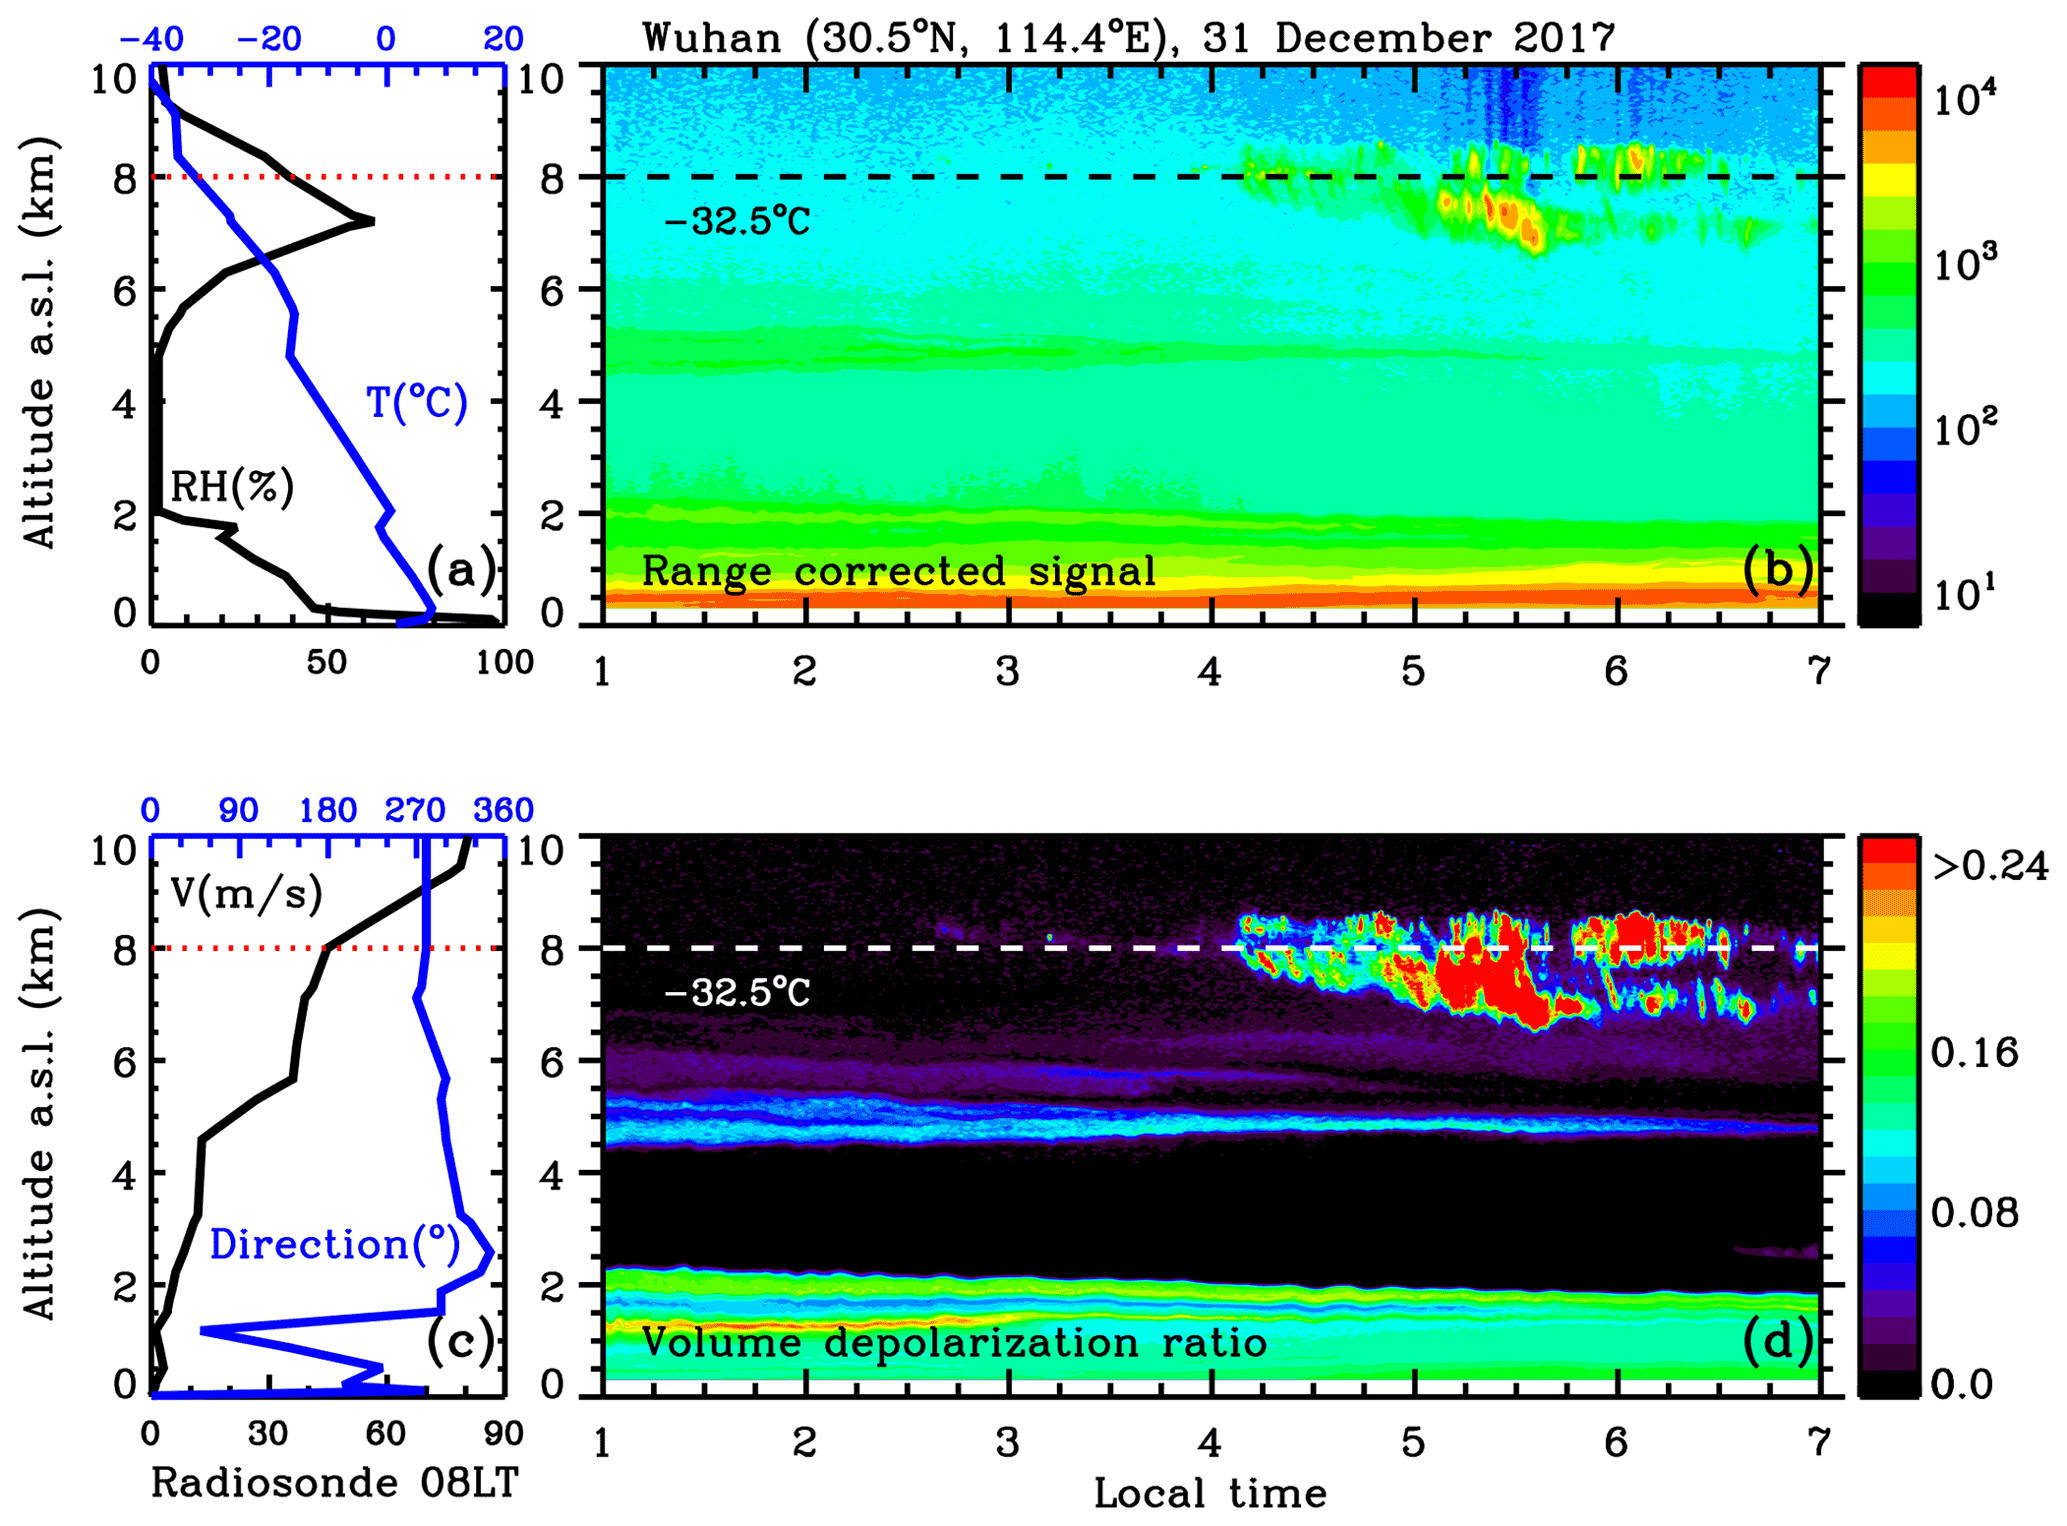
Figure 8Time–height contour plots (1 min/30 m resolution) of (b) range-corrected signal and (d) volume depolarization ratio measured by a 532 nm polarization lidar on 31 December 2017. Height profiles of (a) temperature and relative humidity and (c) wind speed and wind direction measured with the radiosonde launched at 08:00 LT. Horizontal lines indicate the −32.5 ∘C temperature height levels.
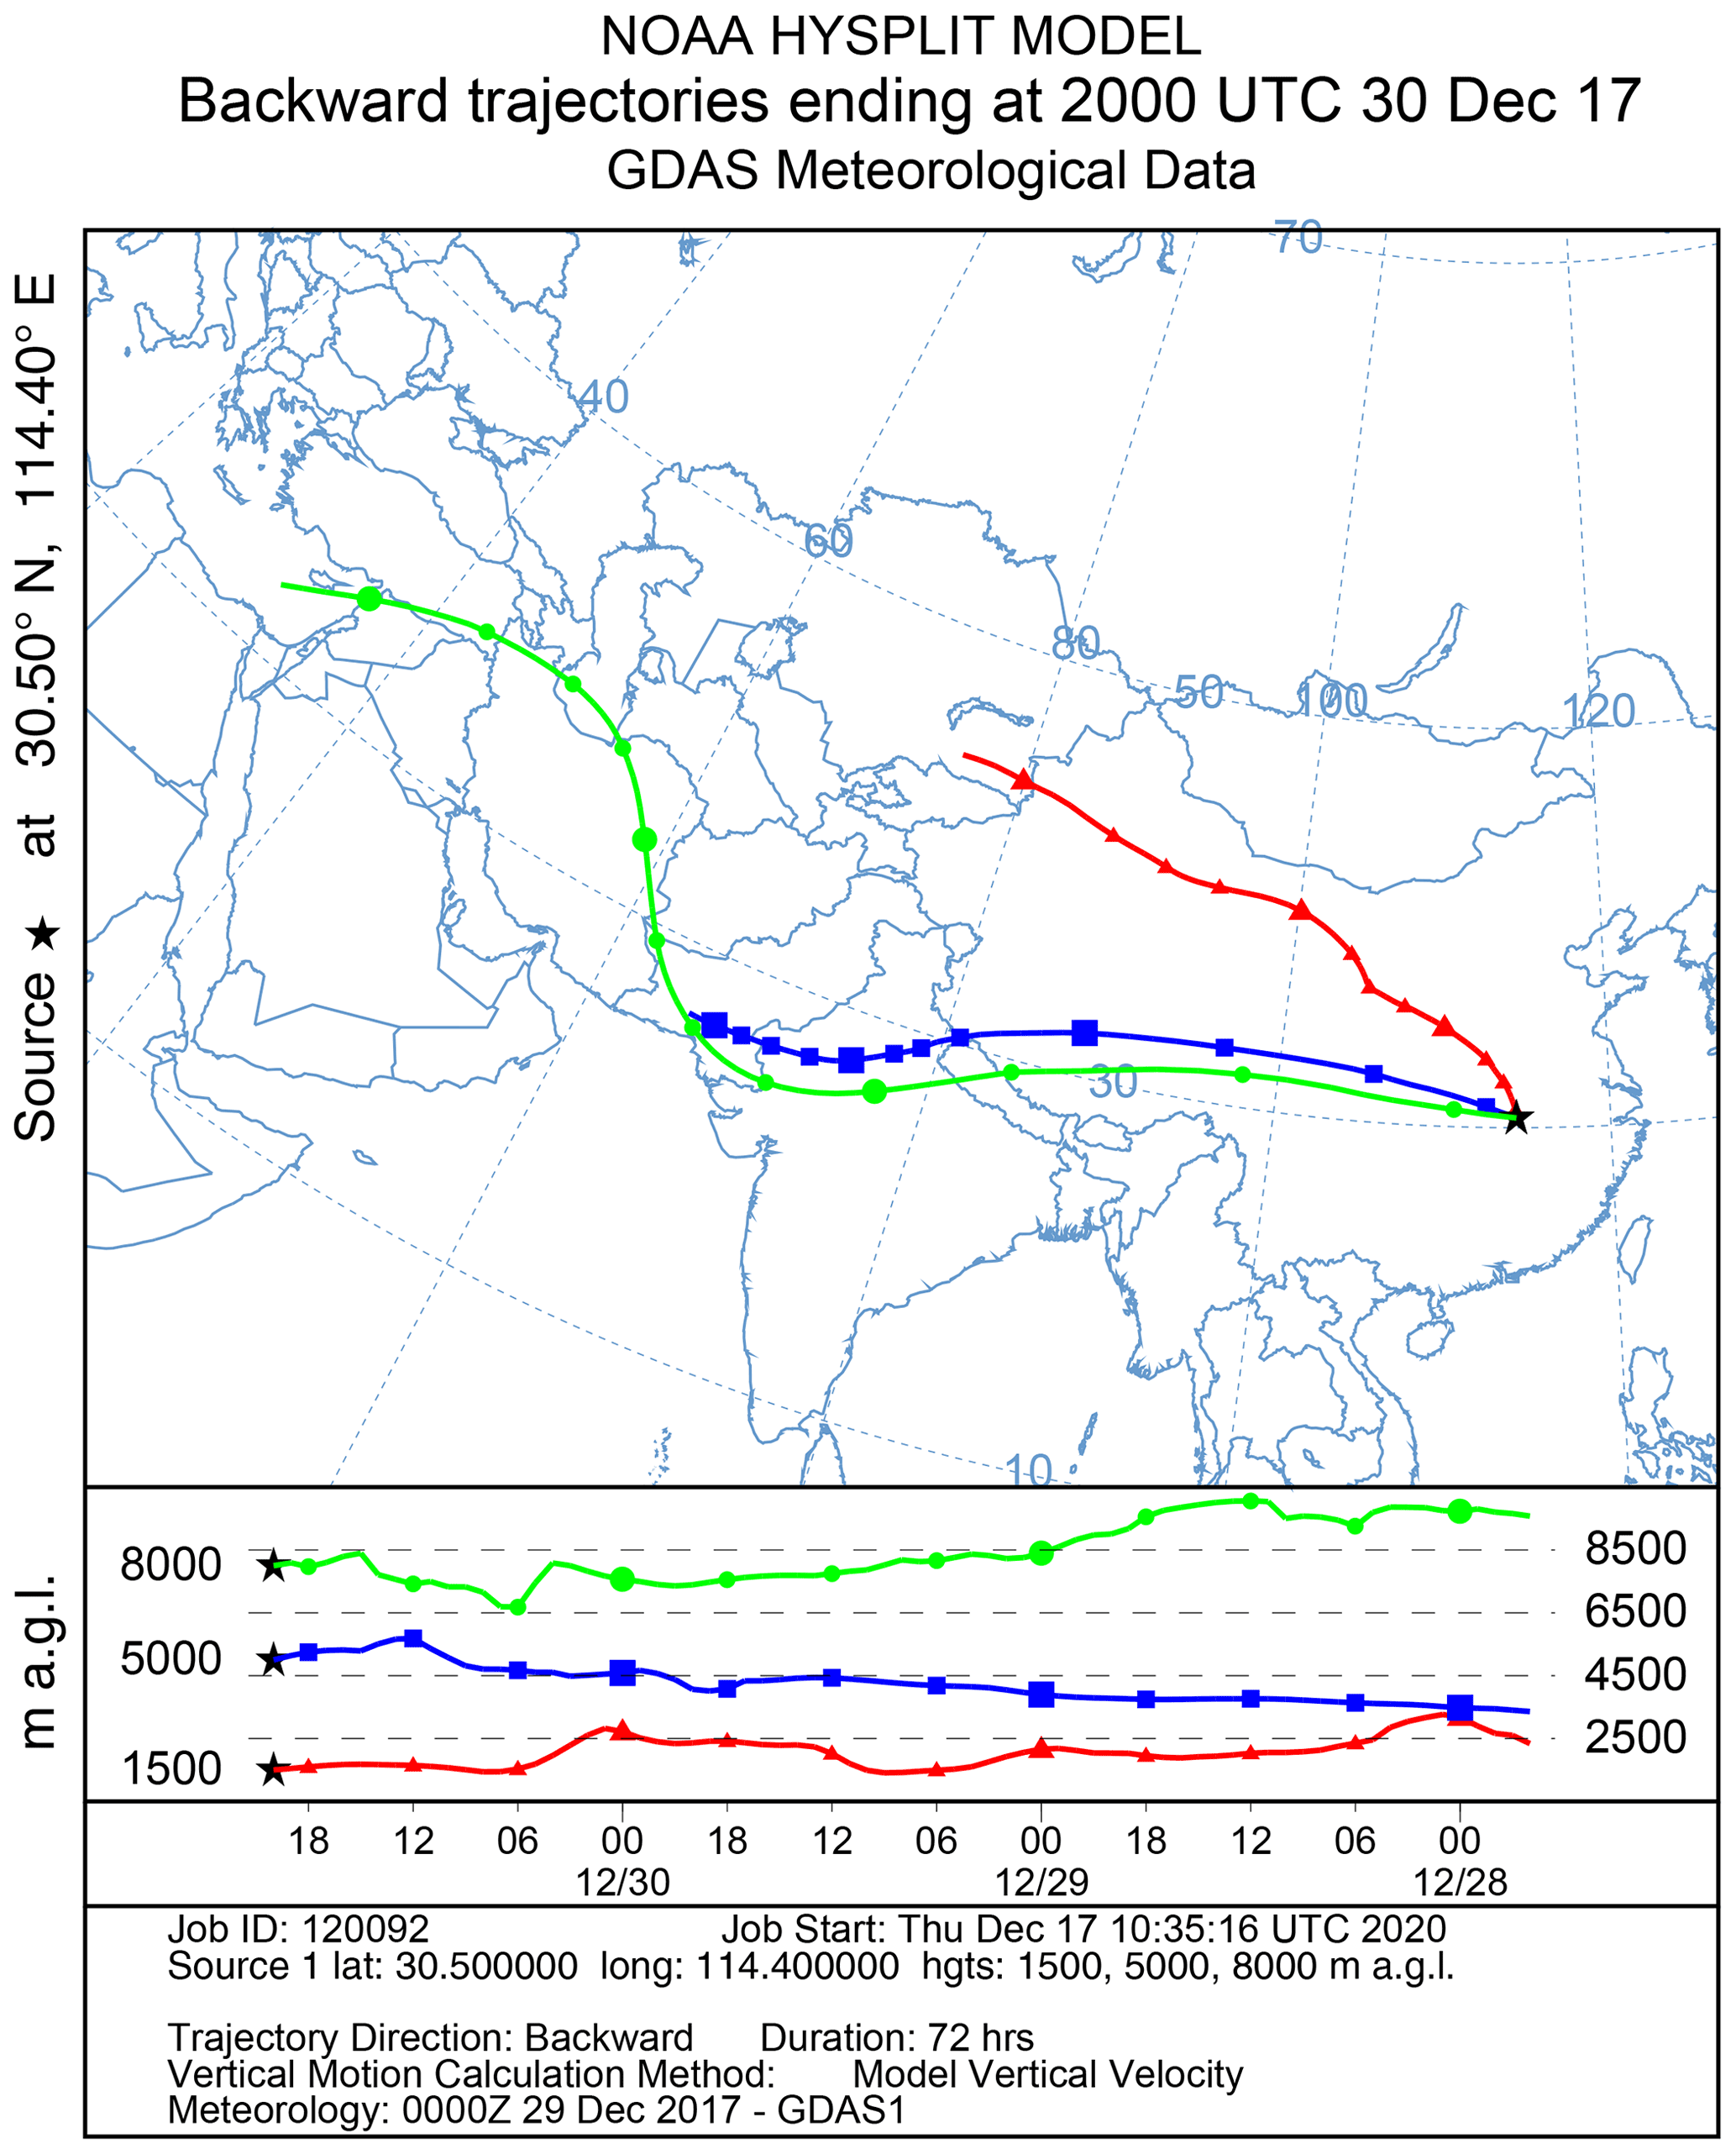
Figure 9The 3 d backward trajectories starting from Wuhan at 20:00 UTC on 30 December 2017 (at 1.5, 5.0, and 8.0 km) computed using the HYSPLIT model (Draxler and Rolph, 2003).
According to the backward trajectories in Fig. 9, the dust layer below 2 km probably originated from the Taklimakan Desert. The two aloft dust layers were probably linked to the desert regions over northwestern India and Pakistan. As seen from Fig. 10, the occurrence of dust over Wuhan was also verified by the vertical feature mask and aerosol subtype classification provided by the CALIOP Level-2 VFM data product. The satellite passed over Wuhan at ∼18:50 UTC on 30 December 2017 (02:50 LT on 31 December 2017). The vertical dashed line denoted the location of the nearest sub-point to Wuhan. The two aerosol layers around Wuhan, located at 0–2 and ∼4–5.5 km, were classified as a mix of dust (marked as “2”, in yellow) and polluted dust (marked as “5”, in brown), respectively.
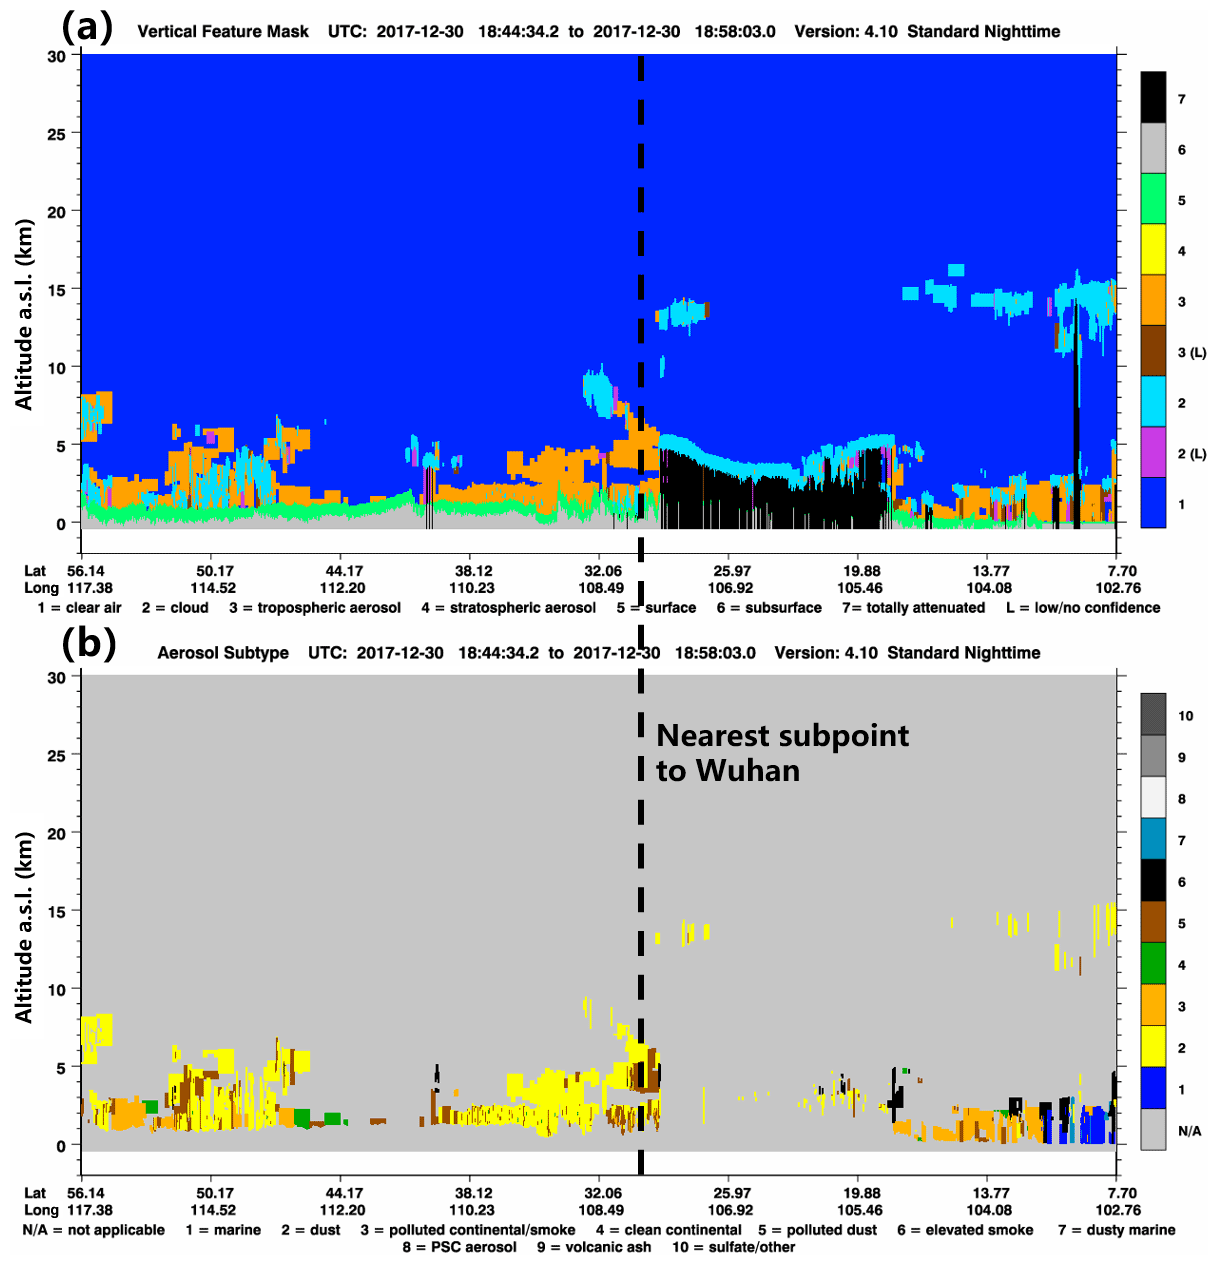
Figure 10CALIPSO altitude–orbit cross section measurements of the CALIOP Level-2 (a) vertical feature mask and (b) aerosol subtype product from 18:44:34 to 18:58:03 UTC on 30 December 2017. The corresponding orbit is 2017-12-30T18-31-05ZN. The vertical dashed line denotes the location of the nearest sub-point to Wuhan.
As seen in Fig. 8d, an ice-containing cloud appeared at ∼04:05 LT at the altitudes where the upmost slight dust layer was located. The temperature at around 8 km was −32.5 ∘C, as denoted by the horizontal dashed lines in Fig. 8. Therefore, the dust particles were likely to trigger the heterogeneous ice formation. Figure 11 shows the height profiles of optical properties including dust and total extinction coefficient, dust and total backscatter coefficient, volume depolarization ratio, and particle depolarization ratio during the period of 03:20–03:50 LT. The peak dust extinction coefficient for the upmost dust layer at an altitude of ∼8.1 km was 2.0 Mm−1. The peak particle depolarization ratio δp value for this slight dust layer was 0.16. The δp values of <0.3 were observed throughout the altitudes of 4–9 km, indicating the possible presence of mixed dust or fine-mode dust (Sakai et al., 2010).
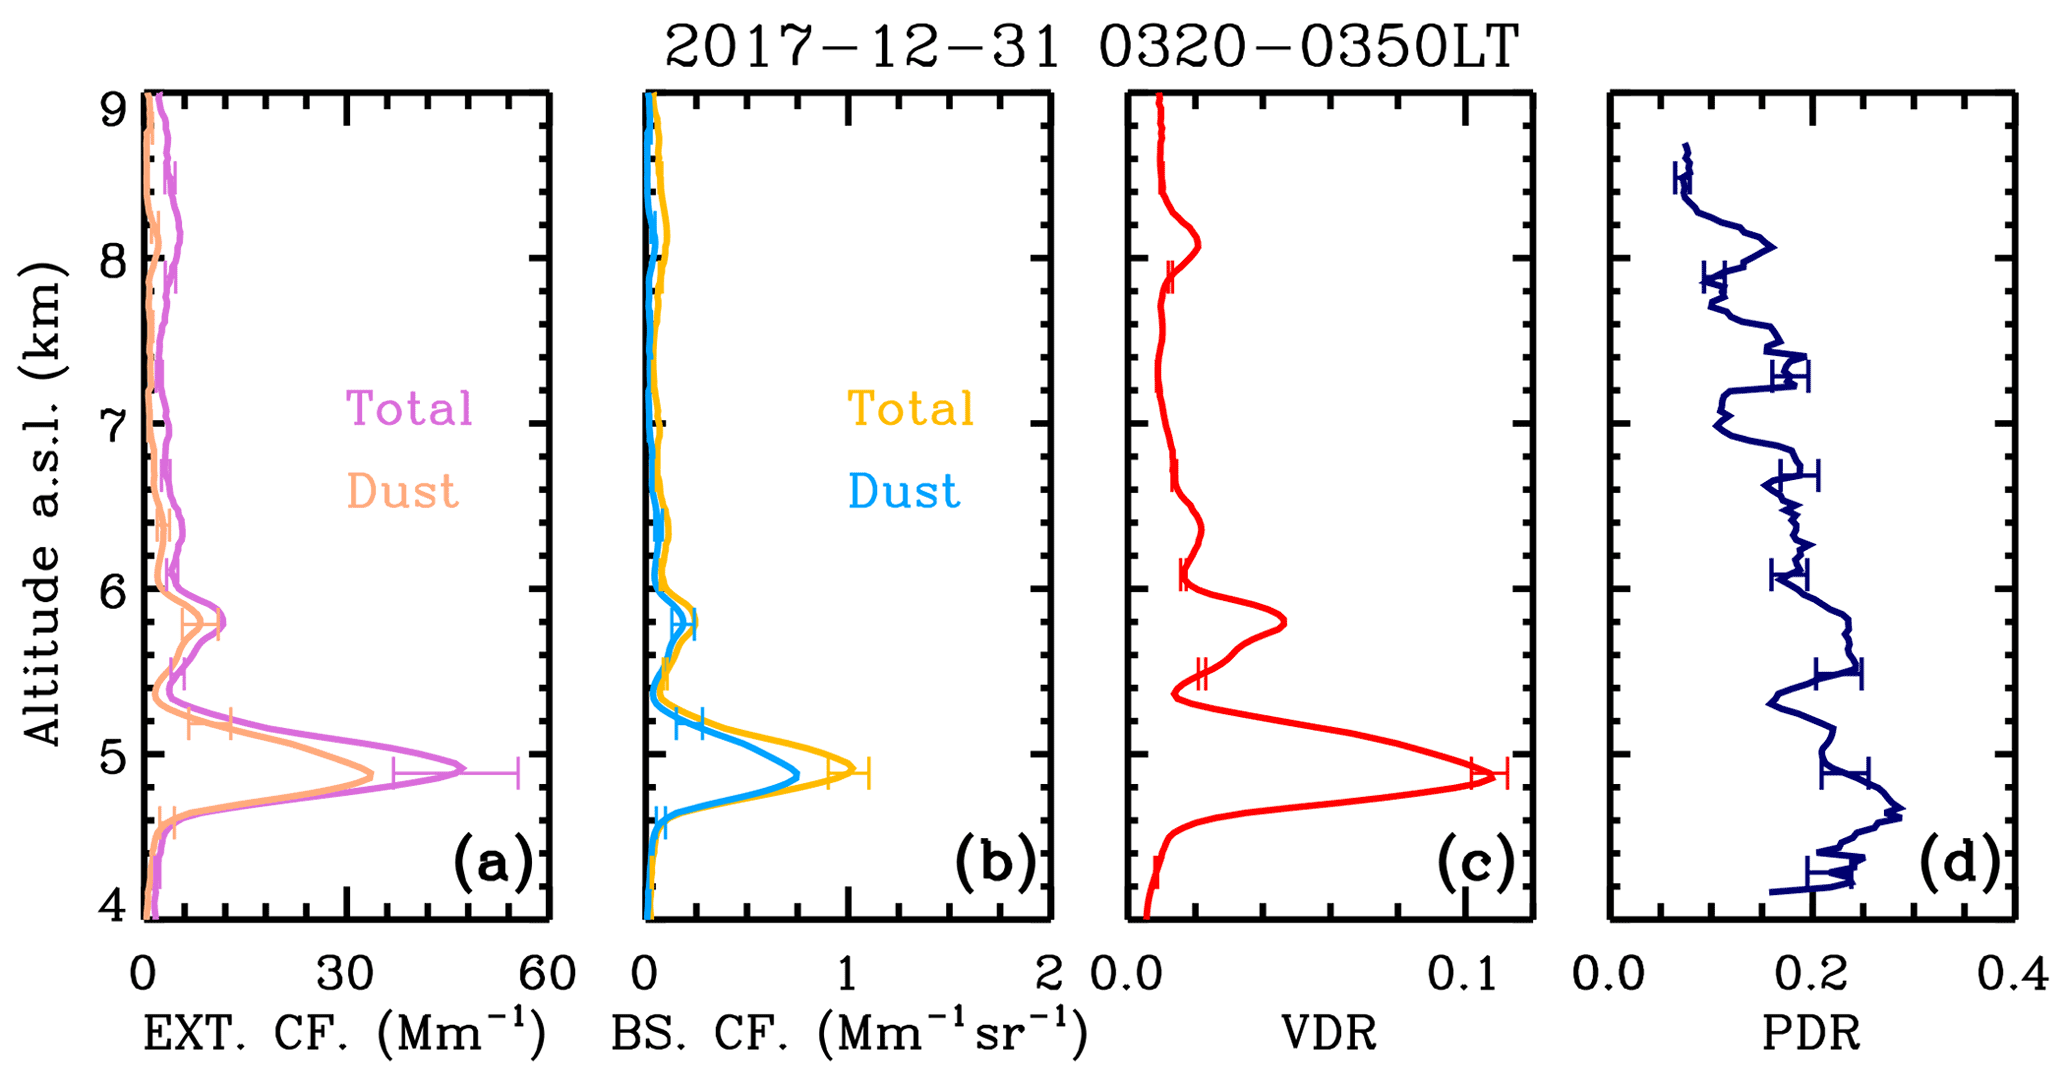
Figure 11Profiles of the (a) dust and total (dust + non-dust) extinction coefficient, (b) dust and total (dust + non-dust) backscatter coefficient, (c) volume depolarization ratio δ, and (d) particle depolarization ratio δp derived by the 532 nm polarization lidar during 03:20–03:50 LT on 31 December 2017. Horizontal error bars denote the relative errors of each parameter.
In Fig. 12a, the dust extinction coefficients were converted into the dust mass concentrations by multiplying by the extinction-to-volume conversion factor cv,d and dust density. The maximum dust mass concentrations were 2.6 µg m−3 for the dust layer around 8 km and 46.0 µg m−3 for the dust layer at altitudes of 4.4–5.3 km. Note that more dense dust plumes could even be observed frequently in Wuhan. The dust mass concentrations of 6.27–154.79 µg m−3 had been observed in Wuhan for the dust events from December 2012 to December 2013 (He et al., 2021a). In Fig. 12b, the dust extinction coefficients were converted into the large particle number concentrations APC250 by multiplying by the conversion factor c250,d. Applying the INPC parameterization scheme D10 (DeMott et al., 2010) and D15 (DeMott et al., 2015), the immersion mode ice-nucleating particle concentrations were finally retrieved as seen in Fig. 12c. The peak INPC value for the slight dust layer at an altitude of 8.1 km was 62.3 L−1 for D15 and 2.7 L−1 for D10. The two parameterization schemes are in good agreement at temperatures ranging from −30 to −20 ∘C. These dust-related INPs might be related to the later-formed ice particles within the cloud at the same altitudes. It should be mentioned that another INPC parameterization scheme U17-D should be utilized for deposition nucleation (not shown here) (Ullrich et al., 2017). Near the desert region, Jiang et al. (2016) found that INP concentrations can reach a level of several hundred per liter at −22 ∘C during a dust event in Xinjiang in northwestern China. For the downstream region of transported Asian dust, Chen et al. (2021) reported similar INP concentrations at −16 ∘C for 13 dust events in Beijing that ranged from 0.42 to 17.36 L−1. As more dense dust plumes were reported to appear frequently in Wuhan (He et al., 2021a), the INPC values, which are much larger than 62.3 L−1 (D15), as observed in this case are probably present at other times, especially in the winter when the zero isotherms can drop to a lower height. This INPC level can have an important effect on ice nucleation in the atmosphere.

Figure 12Profiles of the (a) dust mass concentration Md, (b) particle number concentration APC250, and (c) ice-nucleating particle concentration derived by the POLIPHON method (D10 and D15 parameterizations) during 03:20–03:50 LT on 31 December 2017. Horizontal dashed lines denote the temperature height levels of −15, −20, −25, −30, and −35 ∘C.
The quantitative evaluation of dust-related INPC profiles is of particular interest for understanding the specific contribution of heterogeneous nucleation to the aerosol–cloud-interaction-induced radiative forcing. Furthermore, the understanding of INPC is also indispensable for estimating the impact of dust-related INPs on extreme precipitation (Zhang et al., 2020). However, when using the POLIPHON method to estimate the dust-related INPC profiles, the obtainment of dust-related conversion factors is not easy but is of great importance for those cities over the downstream regions of long-range-transported dust plumes. They may suffer the dual impact of the emissions of local pollution and transported dust aerosols. Urban air pollution (e.g., anthropogenic PM2.5 and black carbon) are generally considered to not affect the atmospheric INPC (Chen et al., 2018), thus the extraction of dust-related INP concentration using the powerful POLIPHON method is possible. In addition, the dust sedimentation and particle microphysical properties modification may also take place during the transport and thus lead to modified conversion factors over downstream cities compared with those over near-desert areas.
In this study, the retrievals of INPC and dust mass concentration mass profiles were realized for the central Chinese megacity of Wuhan (30.5∘ N, 114.4∘ E), located in the downstream region of long-range-transported dust (see Fig. 1). Different from the previous screening schemes of dust occurrence data sets that simply employ the AOD at 532 nm >0.1 and Ångström exponent for the 440–870 nm wavelength range <0.3 (Ansmann et al., 2019b) as the indicators of dust occurrence, ground-based polarization lidar observation was used as a useful auxiliary to verify whether dust particles were involved in a data set measured by a sun photometer. As a consequence, the dust-related conversion factors that are explicit for Wuhan (usually mixed dust) were obtained for the first time. The extinction-to-volume conversion factor is , and the extinction-to-large particle (with radius >250 nm) number concentration conversion factor is . The c250,d for Wuhan is 27 % larger than that observed at Lanzhou SACOL (36.0∘ N, 104.1∘ E) AERONET site, which is much closer to the source region of Asian dust and is closer to those observed in North Africa and the Middle East, meaning dust aerosols from these two sources are also possibly involved in the dust events observed over Wuhan. As a comparison, the conversion factor c290,c of for continental aerosol is much less than c250,d, indicating that there is no significant influence of urban aerosols on the retrievals of the dust-related conversion factor in Wuhan. This dust case data set screening scheme may potentially be extended to other polluted city sites that are more influenced by mixed dust. In the future, we expect to validate the obtained conversion factors by comparing them with unmanned aerial vehicle (UAV) in situ measurements (Marinou et al., 2019).
A case study on the dust-related heterogeneous nucleation process was presented. Applying the conversion factors obtained herein together with the parameterization scheme D10 and D15, the height profile of immersion mode INPC and dust mass concentration before the presence of an ice-containing cloud was shown. The maximum dust mass concentration at an altitude of 8.1 km is only 2.6 µg m−3; the corresponding INPC here is derived at 62.3 L−1 (D15) and seemed to trigger the subsequent heterogeneous ice formation.
In the future, the conversion parameters obtained in this study will be used to study the seasonal and long-term variation of INPC vertical distributions over Wuhan (Tobo et al., 2020). We will also need to separate other different aerosol components and retrieve their corresponding POLIPHON conversion factors (Mamouri and Ansmann, 2017; Córdoba-Jabonero et al., 2018). Furthermore, the observations with millimeter-wave radar can give the ice crystal number concentration information within the cloud so that may realize the possible closure study of heterogeneous ice nucleation process (Ansmann et al., 2019a). Additionally, the retrieved dust mass concentration profiles can be used to verify the results from dust models such as NMME-DREAM (Konsta et al., 2021).
Sun photometer and ground-based polarization lidar data used to generate the results of this paper are available via the following link: https://doi.org/10.5281/zenodo.4683015 (He, 2021). CALIPSO data used in this work can be accessed through the following website: https://subset.larc.nasa.gov/ (CALIPSO, 2021). Wuhan radiosonde data can be obtained at the following website: http://weather.uwyo.edu/upperair/sounding.html (Wuhan Radiosonde, 2021). The MODIS land cover type data product is available at the following website: https://ladsweb.modaps.eosdis.nasa.gov (https://doi.org/10.5067/MODIS/MCD12C1.006, Friedel and Sulla-Menashe, 2015). The HYSPLIT model can be run through the following website: https://ready.arl.noaa.gov/HYSPLIT_traj.php (http://www.arl.noaa.gov/ready/hysplit4.html, Draxler and Rolph, 2003).
YH conceived the research, analyzed the data, acquired the research funding, and wrote the manuscript. YuZ analyzed the sun photometer data. FL reviewed and proofread the manuscript. ZY and YY participated in the scientific discussions and reviewed and proofread the manuscript. YiZ ran the GRASP-AOD algorithm. FY acquired the research funding and led the study.
The authors declare that they have no conflict of interest.
Publisher's note: Copernicus Publications remains neutral with regard to jurisdictional claims in published maps and institutional affiliations.
This article is part of the special issue “Dust aerosol measurements, modeling and multidisciplinary effects (AMT/ACP inter-journal SI)”. It is not associated with a conference.
The authors thank the University of Wyoming for providing the Wuhan radiosonde data, the Atmospheric Science Data Center (ASDC) at the NASA Langley Research Center for providing the CALIPSO data, the Level 1 and Atmosphere Archive and Distribution System (LAADS) Distributed Active Archive Center (DAAC) at the NASA Goddard Space Flight Center for providing the MODIS land cover type data product, and the NOAA Air Resources Laboratory (ARL) for the HYSPLIT model. The authors also would like to acknowledge the use of GRASP inversion algorithm software (http://www.grasp-open.com, last access: 31 August 2021) in this work. Finally, we thank our colleagues that participated in the operation of the lidar system at our site.
This research has been supported by the National Natural Science Foundation of China (grant nos. 42005101 and 41927804), the Fundamental Research Funds for the Central Universities (grant nos. 2042020kf0018 and 2042021kf1006), the Natural Science Foundation of Hubei Province (grant no. 2020CFB229), and the Meridian Space Weather Monitoring Project (China).
This paper was edited by Carlos Pérez García-Pando and reviewed by two anonymous referees.
Ansmann, A., Petzold, A., Kandler, K., Tegen, I., Wendisch, M., Müller, D., Weinzierl, B., Müller, T., and Heintzenberg, J.: Saharan mineral dust experiments SAMUM-1 and SAMUM-2: What have we learned? Tellus B, 63, 403–429, https://doi.org/10.1111/j.1600-0889.2011.00555.x, 2011.
Ansmann, A., Seifert, P., Tesche, M., and Wandinger, U.: Profiling of fine and coarse particle mass: case studies of Saharan dust and Eyjafjallajökull/Grimsvötn volcanic plumes, Atmos. Chem. Phys., 12, 9399–9415, https://doi.org/10.5194/acp-12-9399-2012, 2012.
Ansmann, A., Mamouri, R.-E., Bühl, J., Seifert, P., Engelmann, R., Hofer, J., Nisantzi, A., Atkinson, J. D., Kanji, Z. A., Sierau, B., Vrekoussis, M., and Sciare, J.: Ice-nucleating particle versus ice crystal number concentrationin altocumulus and cirrus layers embedded in Saharan dust:a closure study, Atmos. Chem. Phys., 19, 15087–15115, https://doi.org/10.5194/acp-19-15087-2019, 2019a.
Ansmann, A., Mamouri, R.-E., Hofer, J., Baars, H., Althausen, D., and Abdullaev, S. F.: Dust mass, cloud condensation nuclei, and ice-nucleating particle profiling with polarization lidar: updated POLIPHON conversion factors from global AERONET analysis, Atmos. Meas. Tech., 12, 4849–4865, https://doi.org/10.5194/amt-12-4849-2019, 2019b.
Ansmann, A., Ohneiser, K., Mamouri, R.-E., Knopf, D. A., Veselovskii, I., Baars, H., Engelmann, R., Foth, A., Jimenez, C., Seifert, P., and Barja, B.: Tropospheric and stratospheric wildfire smoke profiling with lidar: mass, surface area, CCN, and INP retrieval, Atmos. Chem. Phys., 21, 9779–9807, https://doi.org/10.5194/acp-21-9779-2021, 2021.
Behrendt, A. and Nakamura, T.: Calculation of the calibration constant of polarization lidar and its dependency on atmospheric temperature, Opt. Express, 10, 805–817, https://doi.org/10.1364/OE.10.000805, 2002.
Benavent-Oltra, J. A., Román, R., Granados-Muñoz, M. J., Pérez-Ramírez, D., Ortiz-Amezcua, P., Denjean, C., Lopatin, A., Lyamani, H., Torres, B., Guerrero-Rascado, J. L., Fuertes, D., Dubovik, O., Chaikovsky, A., Olmo, F. J., Mallet, M., and Alados-Arboledas, L.: Comparative assessment of GRASP algorithm for a dust event over Granada (Spain) during ChArMEx-ADRIMED 2013 campaign, Atmos. Meas. Tech., 10, 4439–4457, https://doi.org/10.5194/amt-10-4439-2017, 2017.
Benavent-Oltra, J. A., Román, R., Casquero-Vera, J. A., Pérez-Ramírez, D., Lyamani, H., Ortiz-Amezcua, P., Bedoya-Velásquez, A. E., de Arruda Moreira, G., Barreto, Á., Lopatin, A., Fuertes, D., Herrera, M., Torres, B., Dubovik, O., Guerrero-Rascado, J. L., Goloub, P., Olmo-Reyes, F. J., and Alados-Arboledas, L.: Different strategies to retrieve aerosol properties at night-time with the GRASP algorithm, Atmos. Chem. Phys., 19, 14149–14171, https://doi.org/10.5194/acp-19-14149-2019, 2019.
CALIPSO: Cloud–Aerosol Lidar and Infrared Pathfinder Satellite Observation Lidar Level 2 data, vertical feature mask and aerosol subtype, available at: https://subset.larc.nasa.gov/, last access: 31 August 2021.
Cantrell, W. and Heymsfield, A.: Production of ice in tropospheric clouds, B. Am. Meteorol. Soc., 86, 795–807, https://doi.org/10.1175/BAMS-86-6-795, 2005.
Chen, J., Wu, Z., Augustin-Bauditz, S., Grawe, S., Hartmann, M., Pei, X., Liu, Z., Ji, D., and Wex, H.: Ice-nucleating particle concentrations unaffected by urban air pollution in Beijing, China, Atmos. Chem. Phys., 18, 3523–3539, https://doi.org/10.5194/acp-18-3523-2018, 2018.
Chen, J., Wu, Z., Chen, J., Reicher, N., Fang, X., Rudich, Y., and Hu, M.: Size-resolved atmospheric ice-nucleating particles during East Asian dust events, Atmos. Chem. Phys., 21, 3491–3506, https://doi.org/10.5194/acp-21-3491-2021, 2021.
Córdoba-Jabonero, C., Sicard, M., Ansmann, A., del Águila, A., and Baars, H.: Separation of the optical and mass features of particle components in different aerosol mixtures by using POLIPHON retrievals in synergy with continuous polarized Micro-Pulse Lidar (P-MPL) measurements, Atmos. Meas. Tech., 11, 4775–4795, https://doi.org/10.5194/amt-11-4775-2018, 2018.
DeMott, P., Prenni, A., Liu, X., Kreidenweis, S., Petters, M., Twohy, C., Richardson, M., Eidhammer, T., and Rogers, D.: Predicting global atmospheric ice nuclei distributions and their impacts on climate, P. Natl. Acad. Sci. USA, 107, 11217–11222, https://doi.org/10.1073/pnas.0910818107, 2010.
DeMott, P. J., Prenni, A. J., McMeeking, G. R., Sullivan, R. C., Petters, M. D., Tobo, Y., Niemand, M., Möhler, O., Snider, J. R., Wang, Z., and Kreidenweis, S. M.: Integrating laboratory and field data to quantify the immersion freezing ice nucleation activity of mineral dust particles, Atmos. Chem. Phys., 15, 393–409, https://doi.org/10.5194/acp-15-393-2015, 2015.
Draxler, R. and Rolph, G.: HYSPLIT (Hybrid Single-Particle Lagrangian Integrated Trajectory) Model, Air Resources Laboratory, NOAA, Silver Spring, Md, USA, available at: http://www.arl.noaa.gov/ready/hysplit4.html, (last access: 7 July 2021), 2003.
Dubovik, O., Holben, B., Eck, T., Smirnov, A., Kaufman, Y., King, M., Tanré and Slutsker, I.: Variability of absorption and optical properties of key aerosol types observed in worldwide locations, J. Atmos. Sci., 59, 590–608. https://doi.org/10.1175/1520-0469(2002)059<0590:VOAAOP>2.0.CO;2, 2002.
Dubovik, O., Lapyonok, T., Litvinov, P., Herman, M., Fuertes, D., Ducos, F., Lopatin, A., Chaikovsky, A., Torres, B., Derimian, Y., Huang, X., Aspetsberger, M., and Federspiel, C.: GRASP: A versatile algorithm for characterizing the atmosphere, SPIE Newsroom, https://doi.org/10.1117/2.1201408.005558, 2014.
Fernald, F. G.: Analysis of atmospheric lidar observations: some comments, Appl. Optics, 23, 652–653, https://doi.org/10.1364/AO.23.000652, 1984.
Field, P. R., Lawson, R. P., Brown, P. R. A., Lloyd, G., Westbrook, C., Moisseev, D., Miltenberger, A., Nenes, A., Blyth, A., Choularton, T., Connolly, P., Buehl, J., Crosier, J., Cui, Z., Dearden, C., DeMott, P., Flossmann, A., Heymsfield, A., Huang, Y., Kalesse, H., Kanji, Z. A., Korolev, A., Kirchgaessner, A., Lasher-Trapp, S., Leisner, T., McFarquhar, G., Phillips, V., Stith, J., and Sullivan, S.: Secondary Ice Production: Current State of the Science and Recommendations for the Future, Meteor. Mon., 58, 7.1–7.20, https://doi.org/10.1175/AMSMONOGRAPHS-D-16-0014.1, 2017.
Freudenthaler, V., Esselborn, M., Wiegner, M., Heese, B., Tesche, M., Ansmann, A., Müller, D., Althausen, D., Wirth, M., Fix, A., Ehret, G., Knippertz, P., Toledano, C., Gasteiger, J., Garhammer, M., and Seefeldner, M.: Depolarization ratio profiling at several wavelengths in pure Saharan dust during SAMUM2006, Tellus B, 61, 165–179, https://doi.org/10.1111/j.1600-0889.2008.00396.x, 2009.
Friedel, M. and Sulla-Menashe, D.: Boston University and MODAPS SIPS – NASA.: MCD12C1 MODIS/Terra+Aqua Land Cover Type Yearly L3 Global 0.05 Deg CMG. NASA LP DAAC, https://doi.org/10.5067/MODIS/MCD12C1.006, 2015.
Hallett, J. and Mossop, S.: Production of secondary ice particles during the riming process, Nature, 249, 26–28, https://doi.org/10.1038/249026a0, 1974.
He, Y.: MUA PLidar and Sun Photometer Dataset for Dust-related Ice Nucleation Particle Concentration Profile (Version 1.0), Zenodo [data set], https://doi.org/10.5281/zenodo.4683015, 2021.
He, Y. and Yi, F.: Dust aerosols detected using a ground-based polarization lidar and CALIPSO over Wuhan (30.5 N, 114.4 E), China, Adv. Meteorol., 2015, 536762, https://doi.org/10.1155/2015/536762, 2015.
He, Y., Yi, F., Yi, Y., Liu, F., and Zhang, Y.: Heterogeneous nucleation of midlevel cloud layer influenced by transported Asian dust over Wuhan (30.5∘ N, 114.4∘ E), China, J. Geophys. Res.-Atmos., 126, e2020JD033394, https://doi.org/10.1029/2020JD033394, 2021a.
He, Y., Liu, F., Yin, Z., Zhang, Y., Zhan, Y., and Yi, F.: Horizontally Oriented ice crystals observed by the synergy of zenith- and slant-pointed polarization lidar over Wuhan (30.5∘ N, 114.4∘ E), China, J. Quant. Spectrosc. Ra., 268, 107626, https://doi.org/10.1016/j.jqsrt.2021.107626, 2021b.
Hofer, J., Ansmann, A., Althausen, D., Engelmann, R., Baars, H., Abdullaev, S. F., and Makhmudov, A. N.: Long-term profiling of aerosol light extinction, particle mass, cloud condensation nuclei, and ice-nucleating particle concentration over Dushanbe, Tajikistan, in Central Asia, Atmos. Chem. Phys., 20, 4695–4711, https://doi.org/10.5194/acp-20-4695-2020, 2020.
Holben, B., Eck, T., Slutsker, I., Tanré, D., Buis, J., Setzer, A., Vermote, E., Reagan, J., Kaufman, Y., Nakajima, T., Lavenu, F., Jankowiak, I., and Smirnov, A.: AERONET—A federated instrument network and data archive for aerosol characterization, Remote Sens. Environ. 66, 1–16, https://doi.org/10.1016/s0034-4257(98)00031-5, 1998.
Hoose, C., Kristjánsson, J., Chen, J.-P., and Hazra, A.: A classical-theory-based parameterization of heterogeneous ice nucleation by mineral dust, soot, and biological particles in a global climate model, J. Atmos. Sci., 67, 2483–2503, https://doi.org/10.1175/2010JAS3425.1, 2010.
Hu, Q., Wang, H., Goloub, P., Li, Z., Veselovskii, I., Podvin, T., Li, K., and Korenskiy, M.: The characterization of Taklamakan dust properties using a multiwavelength Raman polarization lidar in Kashi, China, Atmos. Chem. Phys., 20, 13817–13834, https://doi.org/10.5194/acp-20-13817-2020, 2020.
Huang, J., Minnis, P., Chen, B., Huang, Z., Liu, Z., Zhao, Q., Yi, Y., and Ayers, J.; Long-range transport and vertical structure of Asian dust from CALIPSO and surface measurements during PACDEX, J. Geophys. Res.-Atmos., 113, D23212, https://doi.org/10.1029/2008JD010620, 2008.
IPCC: Climate change: The physical science basis. In Contribution of Working Group I to the Fifth Assessment Report of the Intergovernmental Panel on Climate Change, edited by: Stocker, T. F., Qin, D., Plattner, G.-K., Tignor, M., Allen, S. K., Boschung, J., Nauels, A., Xia, Y., Bex, V., and Midgley, P. M., Cambridge University Press, Cambridge, UK, https://doi.org/10.1016/S0925-7721(01)00003-7, 2013.
Jiang, H., Yin, Y., Wang, X., Gao, R., Yuan, L., Chen, K., and Shan, Y.: The measurement and parameterization of ice nucleating particles in different backgrounds of China, Atmos. Res., 181, 72–80, https://doi.org/10.1016/j.atmosres.2016.06.013, 2016.
Kanji, Z. A., Ladino, L. A., Wex, H., Boose, Y., Burkert-Kohn, M., Cziczo, D. J., and Krämer, M.: Overview of ice nucleating particles, Meteor. Mon., 58, 1.1–1.33, https://doi.org/10.1175/AMSMONOGRAPHS-D-16-0006.1, 2017.
Kanji, Z. A., Welti, A., Corbin, J. C., and Mensah, A. A.: Black carbon particles do not matter for immersion mode ice nucleation, Geophys. Res. Lett., 46, e2019GL086764, https://doi.org/10.1029/2019GL086764, 2020.
Kojima, T., Buseck, P., Iwasaka, Y., Matsuki, A., and Trochkine, D.: Sulfate-coated dust particles in the free troposphere over Japan, Atmos. Res., 82, 698–708, https://doi.org/10.1016/j.atmosres.2006.02.024, 2006.
Kong, W. and Yi, F.: Convective border layer evolution from lidar backscatter and its relationship with surface aerosol concentration at a location of a central China megacity, J. Geophys. Res.-Atmos., 120, 7928–7940, https://doi.org/10.1002/2015JD023248, 2015.
Konsta, D., Tsekeri, A., Solomos, S., Siomos, N., Gialitaki, A., Tetoni, E., Lopatin, A., Goloub, P., Dubovik, O., Amiridis, V., and Nastos, P.: The potential of GRASP/GARRLiC retrievals for dust aerosol model evaluation: case study during the PreTECT Campaign, Remote Sens.-Basel, 13, 873, https://doi.org/10.3390/rs13050873, 2021.
Liu, F., Yi, F., Yin, Z., Zhang, Y., He, Y., and Yi, Y.: Measurement report: characteristics of clear-day convective boundary layer and associated entrainment zone as observed by a ground-based polarization lidar over Wuhan (30.5∘ N, 114.4∘ E), Atmos. Chem. Phys., 21, 2981–2998, https://doi.org/10.5194/acp-21-2981-2021, 2021.
Ma, Y., Zhang, M., Jin, S., Gong, W., Chen, N., Chen, Z., Jin, Y., and Shi, Y.: Long-term investigation of aerosol optical and radiative characteristics in a typical megacity of central China during winter haze periods, J. Geophys. Res.-Atmos., 124, 12093–12106, https://doi.org/10.1029/2019JD030840, 2019.
Mamali, D., Marinou, E., Sciare, J., Pikridas, M., Kokkalis, P., Kottas, M., Binietoglou, I., Tsekeri, A., Keleshis, C., Engelmann, R., Baars, H., Ansmann, A., Amiridis, V., Russchenberg, H., and Biskos, G.: Vertical profiles of aerosol mass concentration derived by unmanned airborne in situ and remote sensing instruments during dust events, Atmos. Meas. Tech., 11, 2897–2910, https://doi.org/10.5194/amt-11-2897-2018, 2018.
Mamouri, R. E. and Ansmann, A.: Fine and coarse dust separation with polarization lidar, Atmos. Meas. Tech., 7, 3717–3735, https://doi.org/10.5194/amt-7-3717-2014, 2014.
Mamouri, R. E. and Ansmann, A.: Estimated desert-dust ice nuclei profiles from polarization lidar: methodology and case studies, Atmos. Chem. Phys., 15, 3463–3477, https://doi.org/10.5194/acp-15-3463-2015, 2015.
Mamouri, R.-E. and Ansmann, A.: Potential of polarization lidar to provide profiles of CCN- and INP-relevant aerosol parameters, Atmos. Chem. Phys., 16, 5905–5931, https://doi.org/10.5194/acp-16-5905-2016, 2016.
Mamouri, R.-E. and Ansmann, A.: Potential of polarization/Raman lidar to separate fine dust, coarse dust, maritime, and anthropogenic aerosol profiles, Atmos. Meas. Tech., 10, 3403–3427, https://doi.org/10.5194/amt-10-3403-2017, 2017.
Mamouri, R. E., Ansmann, A., Nisantzi, A., Kokkalis, P., Schwarz, A., and Hadjimitsis, D.: Low Arabian extinction-to-backscatter ratio, Geophys. Res. Lett., 40, 4762–4766, https://doi.org/10.1002/grl.50898, 2013.
Marinou, E., Tesche, M., Nenes, A., Ansmann, A., Schrod, J., Mamali, D., Tsekeri, A., Pikridas, M., Baars, H., Engelmann, R., Voudouri, K.-A., Solomos, S., Sciare, J., Groß, S., Ewald, F., and Amiridis, V.: Retrieval of ice-nucleating particle concentrations from lidar observations and comparison with UAV in situ measurements, Atmos. Chem. Phys., 19, 11315–11342, https://doi.org/10.5194/acp-19-11315-2019, 2019.
Mülmenstädt, J., Sourdeval, O., Delanoë, J., and Quaas, J.: Frequency of occurrence of rain from liquid-, mixed-, and ice-phase clouds derived from A-Train satellite retrievals, Geophys. Res. Lett., 42, 6502–6509, https://doi.org/10.1002/2015GL064604, 2015.
Murray, B. J., O'Sullivan, D., Atkinson, J. D., and Webb, M. E.: Ice nucleation by particles immersed in supercooled cloud droplet, Chem. Soc. Rev., 41, 6519–6554, https://doi.org/10.1039/c2cs35200a, 2012.
Nash, J., Oakley, T., Vömel, H., and Li, W.: WMO Intercomparison of high quality radiosonde systems, Yangjiang, China, 12 July – 2 August 2010, World Meteorological Organization Instruments and Observing methods, Report IOM-107, WMO/TD No. 1580, available at: https://library.wmo.int/index.php?lvl=author_see&id=10744#.YS2YbY4zaiM (last access: 31 August 2021), 2011.
Omar, A. H., Winker, D. M., Kittaka, C., Vaughan, M. A., Liu, Z., Hu, Y., Rogers, R. R., Ferrare, R. A., Lee, K.-P., Kuehn, R. E., and Hostetler, C. A.: The CALIPSO Automated Aerosol Classification and Lidar Ratio Selection Algorithm, J. Atmos. Ocean Tech., 26, 1994–2014, https://doi.org/10.1175/2009JTECHA1231.1, 2009.
O'Neill, N., Dubovik, O., and Eck, T. F.: A modified Ångström coefficient for the characterization of sub-micron aerosols, Appl. Optics, 40, 2368–2375, https://doi.org/10.1364/AO.40.002368, 2001.
O'Neill, N., Eck, T., Smirnov, A., Holben, B., and Thulasiraman, S.: Spectral discrimination of coarse and fine mode optical depth, J. Geophys. Res., 108, 4559, https://doi.org/10.1029/2002jd002975, 2003.
Peng, L., Yi, F., Liu, F., Yin, Z. and He, Y.: Optical properties of aerosol and cloud particles measured by a single-line-extracted pure rotational Raman lidar, Opt. Express, 29, 21947–21964, https://doi.org/10.1364/OE.427864, 2021.
Rosenfeld, D., Lohmann, U., Raga, G. B., O'Dowd, C. D., Kulmala, M., Fuzzi, S., Reissell, A., and Andreae, M. O.: Flood or drought: How do aerosols affect precipitation? Science, 321, 1309–1313, https://doi.org/10.1126/science.1160606, 2008.
Rosenfeld, D., Andreae, M. O., Asmi, A., Chin, M., Leeuw, G., Donovan, D. P., Kahn, R., Kinne, S., Kivekäs, N., Kulmala, M., Lau, W., Schmidt, K. S., Suni, T., Wagner, T., Wild, M., and Quaas, J.: Global observations of aerosol-cloud-precipitation-climate interactions, Rev. Geophys., 52, 750–808, https://doi.org/10.1002/2013RG000441, 2014.
Sakai, T., Nagai, T., Zaizen, Y., and Mano, Y.: Backscattering linear depolarization ratio measurements of mineral, sea-salt, and ammonium sulfate particles simulated in a laboratory chamber. Appl. Optics, 49, 4441–4449, https://doi.org/10.1364/AO.49.004441, 2010.
Schill, G. P., DeMott, P. J., Emerson, E., W. Rauker, A. M. C., Kodros, J. K., Suski, K. J., Hill, T., C. J., Levin, E. J. T., Pierce, J. R., Farmer, D. K., and Kreidenweis, S. M.: The contribution of black carbon to global ice nucleating particle concentrations relevant to mixed-phase clouds, P. Natl. Acad. Sci. USA, 117, 22705–22711, https://doi.org/10.1073/pnas.2001674117, 2020.
Shao, J., Yi, F., and Yin, Z.: Aerosol layers in the free troposphere and their seasonal variations as observed in Wuhan, China, Atmos. Environ., 224, 117323, https://doi.org/10.1016/j.atmosenv.2020.117323, 2020.
Tesche, M., Ansmann, A., Müller, D., Althausen, D., Engelmann, R., Freudenthaler, V., and Groß, S.: Vertically resolved separation of dust and smoke over Cape Verde using multiwavelength Raman and polarization lidars during Saharan Mineral Dust Experiment 2008, J. Geophys. Res., 114, D13202, https://doi.org/10.1029/2009JD011862, 2009.
Tobo, Y., Uetake, J., Matsui, H., Moteki, N., Uji, Y., Iwamoto, Y., Miura, K., and Misumi, R.: Seasonal trends of atmospheric ice nucleating particles over Tokyo, J. Geophys. Res.-Atmos., 125, e2020JD033658, https://doi.org/10.1029/2020JD033658, 2020.
Torres, B. and Fuertes, D.: Characterization of aerosol size properties from measurements of spectral optical depth: a global validation of the GRASP-AOD code using long-term AERONET data, Atmos. Meas. Tech., 14, 4471–4506, https://doi.org/10.5194/amt-14-4471-2021, 2021.
Torres, B., Dubovik, O., Fuertes, D., Schuster, G., Cachorro, V. E., Lapyonok, T., Goloub, P., Blarel, L., Barreto, A., Mallet, M., Toledano, C., and Tanré, D.: Advanced characterisation of aerosol size properties from measurements of spectral optical depth using the GRASP algorithm, Atmos. Meas. Tech., 10, 3743–3781, https://doi.org/10.5194/amt-10-3743-2017, 2017.
Ullrich, R., Hoose, C., Möhler, O., Niemand, M., Wagner, R., Höhler, K., Hiranuma, N., Saathoff, H., and Leisner, T.: A new ice nucleation active site parameterization for desert dust and soot, J. Atmos. Sci., 74, 699–717, https://doi.org/10.1175/JAS-D-16-0074.1, 2017.
Wagner, F., Bortoli, D., Pereira, S., Costa, M. J., Silva, A. M., Weinzierl, B., Esselborn, M., Petzold, A., Rasp, K., Heinold B., and Tegen, I.: Properties of dust aerosol particles transported to Portugal from the Sahara desert, Tellus B, 61, 297–306, https://doi.org/10.1111/j.1600-0889.2008.00393.x, 2009.
Wang, T., Han, Y., Hua, W., Tang, J., Huang, J., Zhou, T., Huang, Z., Bi, J., and Xie, H.: Profiling dust mass concentration in Northwest China using a joint lidar and sun-photometer setting, Remote Sens.-Basel, 13, 1099, https://doi.org/10.3390/rs13061099, 2021.
Winker, D., Hunt, W., and McGill, M.: Initial performance assessment of CALIOP, Geophys. Res. Lett., 34, L19803, https://doi.org/10.1029/2007GL030135, 2007.
Wuhan Radiosonde: Wuhan Radiosonde Data, available at: http://weather.uwyo.edu/upperair/sounding.html, last access: 31 August 2021.
Yin, Z., Yi, F., He, Y., Liu, F., Yu, C., and Zhang, Y.: Asian dust impacts on heterogeneous ice formation at Wuhan based on polarization lidar measurements, Atmos. Environ., 246, 118166, https://doi.org/10.1016/j.atmosenv.2020.118166, 2021a.
Yin, Z., Yi, F., Liu, F., He, Y., Zhang, Y., Yu, C., and Zhang, Y.: Long-term variations of aerosol optical properties over Wuhan with polarization lidar, Atmos. Environ., 259, 118508, https://doi.org/10.1016/j.atmosenv.2021.118508, 2021b.
Zhang, Y., Yi, F., Kong, W., and Yi, Y.: Slope characterization in combining analog and photon count data from atmospheric lidar measurements, Appl. Optics, 53, 7312–7320, https://doi.org/10.1364/AO.53.007312, 2014.
Zhang, Y., Yu, F., Luo, G., Chen, J.-P., and Chou, C.: Impact of mineral dust on summertime precipitation over the Taiwan region, J. Geophys. Res.-Atmos., 125, e2020JD033120, https://doi.org/10.1029/2020JD033120, 2020.
Zhang, Y., Zhang, Y., Yu, C., and Yi, F.: Evolution of aerosols in the atmospheric boundary layer and elevated layers during a severe, persistent haze episode in a central China megacity, Atmosphere, 12, 152, https://doi.org/10.3390/atmos12020152, 2021.
- Abstract
- Introduction
- Instrumentation and meteorological data
- Methodology
- Case study of a dust-related heterogeneous nucleation process
- Discussions and conclusions
- Data availability
- Author contributions
- Competing interests
- Disclaimer
- Special issue statement
- Acknowledgements
- Financial support
- Review statement
- References