the Creative Commons Attribution 4.0 License.
the Creative Commons Attribution 4.0 License.
 | 28 Jan 2021
Assessment of the TROPOMI tropospheric NO2 product based on airborne APEX observations
Frederik Tack
Alexis Merlaud
Marian-Daniel Iordache
Gaia Pinardi
Ermioni Dimitropoulou
Henk Eskes
Bart Bomans
Pepijn Veefkind
Michel Van Roozendael
Sentinel-5 Precursor (S-5P), launched in October 2017, carrying the TROPOspheric Monitoring Instrument (TROPOMI) nadir-viewing spectrometer, is the first mission of the Copernicus Programme dedicated to the monitoring of air quality, climate, and ozone. In the presented study, the TROPOMI tropospheric nitrogen dioxide (NO2) level-2 (L2) product (OFFL v1.03.01; 3.5 km × 7 km at nadir observations) has been validated over strongly polluted urban regions by comparison with coincident high-resolution Airborne Prism EXperiment (APEX) remote sensing observations (∼ 75 m × 120 m). Satellite products can be optimally assessed based on (APEX) airborne remote sensing observations, as a large amount of satellite pixels can be fully mapped at high accuracy and in a relatively short time interval, reducing the impact of spatiotemporal mismatches. In the framework of the S-5P validation campaign over Belgium (S5PVAL-BE), the APEX imaging spectrometer has been deployed during four mapping flights (26–29 June 2019) over the two largest urban regions in Belgium, i.e. Brussels and Antwerp, in order to map the horizontal distribution of tropospheric NO2. For each flight, 10 to 20 TROPOMI pixels were fully covered by approximately 2700 to 4000 APEX measurements within each TROPOMI pixel. The TROPOMI and APEX NO2 vertical column density (VCD) retrieval schemes are similar in concept. Overall, for the ensemble of the four flights, the standard TROPOMI NO2 VCD product is well correlated (R = 0.92) but biased negatively by −1.2 ± 1.2 × 10¹⁵ molec cm−2 or −14 ± 12 %, on average, with respect to coincident APEX NO2 retrievals. When replacing the coarse 1∘ × 1∘ the massively parallel (MP) version of the Tracer Model version 5 (TM5) a priori NO2 profiles by NO2 profile shapes from the Copernicus Atmospheric Monitoring Service (CAMS) regional chemistry transport model (CTM) ensemble at 0.1∘ × 0.1∘, R is 0.94 and the slope increases from 0.82 to 0.93. The bias is reduced to −0.1 ± 1.0 × 10¹⁵ molec cm−2 or −1.0 ± 12 %. The absolute difference is on average 1.3 × 10¹⁵ molec cm−2 (16 %) and 0.7 × 10¹⁵ molec cm−2 (9 %), when comparing APEX NO2 VCDs with TM5-MP-based and CAMS-based NO2 VCDs, respectively. Both sets of retrievals are well within the mission accuracy requirement of a maximum bias of 25 %–50 % for the TROPOMI tropospheric NO2 product for all individual compared pixels. Additionally, the APEX data set allows the study of TROPOMI subpixel variability and impact of signal smoothing due to its finite satellite pixel size, typically coarser than fine-scale gradients in the urban NO2 field. For a case study in the Antwerp region, the current TROPOMI data underestimate localized enhancements and overestimate background values by approximately 1–2 × 10¹⁵ molec cm−2 (10 %–20 %).
- Article
(23711 KB) - Full-text XML
- BibTeX
- EndNote


Sentinel-5 Precursor (S-5P), launched in October 2017, is the first of a series of atmospheric composition missions, planned within the European Commission's Copernicus programme. It carries the TROPOspheric Monitoring Instrument (TROPOMI) nadir-viewing spectrometer as its single payload. TROPOMI provides measurements of the atmospheric composition with an unprecedented combination of accuracy, spatial coverage, and spatial resolution, introducing new opportunities such as studying the variability of pollutants at the scale of cities, in addition to the monitoring of the global distribution of gases.
The new sensor technology and retrieval approach require carefully assessing the quality and validity of the generated data products to see if they meet their requirements in terms of accuracy and precision, by comparison with independent reference observations. The TROPOMI operational validation consists in routine quality control and long-term monitoring of the TROPOMI level-1 (L1) and level-2 (L2) products. This is performed within the European Space Agency (ESA) Mission Performance Center (MPC) in a semi-automatic way and based on a limited number of fiducial reference measurements (FRMs) available from ground-based reference networks, complemented by balloon and satellite observations. Large uncertainties however remain, mainly due to the mismatch in spatial representativeness of point-size stations and global satellite products. Routine validation is therefore complemented with campaign-based activities to provide a more in-depth, complete insight into the S-5P instrument performance and the fitness for purpose of its data products. A series of campaign activities have been identified and prioritized in the S-5P Campaign Implementation Plan (S-5P CIP) (Tack et al., 2018), established to address key validation priorities.
On this basis, a S-5P validation campaign over Belgium (S5PVAL-BE), focusing on nitrogen dioxide (NO2) column airborne observations, was identified as having much potential and high priority for TROPOMI validation due to (1) the strong gradients in the NO2 field over key Belgian cities, (2) the expertise built during the precursor BUMBA (Belgian urban NO2 monitoring based on Airborne Prism Experiment (APEX) remote sensing) campaigns over Belgium (Tack et al., 2017), and (3) the availability of APEX hyperspectral imager and complementary ground-based infrastructure, such as mobile differential optical absorption spectroscopy (DOAS), multi-axis (MAX)-DOAS, and CIMEL stations. Aircraft remote sensing instruments, such as iDOAS (Heue et al., 2008), ACAM (Kowalewski and Janz, 2009), Geostationary Trace gas and Aerosol Sensor Optimization (GeoTASO) (Nowlan et al., 2016), AirMAP (Meier et al., 2017), Spectrolite (Vlemmix et al., 2017), SWING (Merlaud et al., 2018), GEOstationary Coastal and Air Pollution Events (GEO-CAPE) Airborne Simulator (GCAS) (Nowlan et al., 2018), and APEX (Tack et al., 2017) are considered to be very valuable for satellite validation (van Geffen et al., 2018). The suitability of APEX to serve as independent reference for S-5P validation was assessed as part of the AROMAPEX project (Tack et al., 2019), a preparatory campaign activity focusing on the intercomparison of airborne atmospheric imaging systems (including APEX) and their mutual consistency, and the development of satellite validation strategies.
Tropospheric NO2 is one of the principal trace gas products of TROPOMI. It is a key pollutant with a direct impact on human health and an important precursor of tropospheric ozone and particulate matter. NO2 is primarily emitted as nitrogen monoxide (NO) and then rapidly oxidized to NO2. In urbanized areas, the primary source is fuel combustion due to traffic, domestic heating, and industrial activities. NO2 is a short-lived species with a lifetime on the order of hours. Its distribution is characterized by a strong spatiotemporal variability when close to the emission sources. Due to its high spatial resolution (initially 3.5 km × 7 km at nadir observations and 3.5 km × 5.5 km since 6 August 2019), TROPOMI is expected to be much more adequate for monitoring short-scale urban NO2 plumes than its predecessors, like GOME (Global Ozone Monitoring Experiment; 40 km × 320 km spatial resolution at nadir; 1995–2011; Burrows et al., 1999), SCIAMACHY (Scanning Imaging Absorption Chartography; 30 km × 60 km; 2002–2012; Bovensmann et al., 1999), OMI (Ozone Monitoring Instrument; 13 km × 24 km; 2004–present; Levelt et al., 2006), and GOME-2 (40 km × 80 km, 2007–present; Munro et al., 2016).
Richter et al. (2014) discusses the challenges associated with the validation of tropospheric reactive gases. These challenges arise from the large spatiotemporal variability of short-lived reactive gases, the dependency of the products on different geophysical parameters (surface albedo, trace gases profiles, aerosols, etc.), different instrument sensitivities, and the presence of small signals close to the detection limit. In preparation for the S-5P atmospheric mission and the forthcoming Sentinel-5 and Sentinel-4 missions (Ingmann et al., 2012), ESA has supported several projects to test newly developed airborne instruments and to develop satellite validation strategies, such as the AROMAT (Airborne ROmanian Measurements of Aerosols and Trace gases; Meier et al., 2017; Merlaud et al., 2018, 2020) and AROMAPEX (Vlemmix et al., 2017; Tack et al., 2019) campaigns. The S-5P validation campaign over Belgium (S5PVAL-BE) builds on the experience and lessons learned from these campaigns. For similar objectives, the National Aeronautics and Space Administration (NASA) has conducted a range of field campaigns including airborne imagers, such as the DISCOVER-AQ campaigns (https://discover-aq.larc.nasa.gov, last access: 18 January 2021; Nowlan et al., 2016, 2018) and the KORUS-AQ campaign (https://www-air.larc.nasa.gov/missions/korus-aq, last access: 18 January 2021; Herman et al., 2018) in preparation of the geostationary TEMPO (Tropospheric Emissions: Monitoring Pollution; Zoogman et al., 2017) and the GEMS (Geostationary Environment Monitoring Spectrometer mission for Southeast Asia; Kim et al., 2020) missions, respectively.
In this study, tropospheric NO2 vertical column densities (VCDs), retrieved from high-resolution APEX observations (∼ 75 m × 120 m), acquired during four flights (26–29 June 2019) over the two largest cities in Belgium, i.e. Brussels and Antwerp, have been compared with correlative retrievals from coincident S-5P overpasses. A single APEX flight typically covers a set of 10 to 20 TROPOMI pixels. The study focuses on the assessment of the TROPOMI L2 tropospheric NO2 product (OFFL v1.03.01) in polluted regions and more specifically on the accuracy and precision of the retrieved VCDs, and impact of intermediate products such as the slant column densities (SCDs), a priori NO2 vertical profiles, and surface reflectances (see Sects. 4 and 5). APEX provides a unique data set, allowing the study of TROPOMI subpixel variability, as well as the impact of signal smoothing (see Sect. 6) due to the finite satellite pixel size of TROPOMI, which is typically much larger than the fine-scale gradients in heterogeneous city plumes. The APEX spatial resolution is considerably higher than the typical resolution of spaceborne sensors. For example, one nadir TROPOMI pixel of 3.5 km by 7 km comprises approximately 2700 APEX pixels.
This is one of the first studies assessing TROPOMI NO2 retrievals over strongly polluted regions based on the comparison with airborne remote sensing observations and it is one of the first airborne spectrometer data sets well coinciding in space and time with a large amount of fully sampled satellite pixels. A similar study was carried out by Judd et al. (2020) using observations from the Long Island Sound Tropospheric Ozone Study (LISTOS) campaign in the New York City/Long Island Sound region in the United States. Earlier studies reporting on the validation of spaceborne observations based on airborne spectrometer data, such as Heue et al. (2005), Constantin et al. (2016), Lamsal et al. (2017), Broccardo et al. (2018), and Merlaud et al. (2020), have shown high potential but are scarce, mainly due to the relatively large pixel footprint of TROPOMI's predecessors with respect to the area that can be covered with an airborne mapping spectrometer.
Air pollution levels over Belgium are among the highest in Europe (https://www.greenpeace.org.au/research/new- satellite-data-reveals-worlds-largest-air-pollution-emission-hotspots-greenpeace-media-briefing/, last access: August 2020), with Brussels and Antwerp being key emission sources for anthropogenic nitrogen oxides (NOx = NO + NO2). In Antwerp, main NOx sources are related to (petro)chemical industry in the harbour area, while traffic emissions are dominant in Brussels. Strong gradients can be seen in Fig. 1 showing TROPOMI tropospheric NO2 VCDs, ranging between 3 and 11 × 1015 molec cm−2, observed over Belgium during a S-5P overpass on 27 June 2019 (orbit 8826). Red markers indicate the five largest Belgian cities, as well as the city of Lille, France, which is a major NO2 source close to the Belgian border. Besides these NO2 hotspots, long-range pollutant transport occurs regularly over Belgium. When wind is blowing from the north–northeast, plumes can be observed, emitted from the strongly industrialized Rhine–Ruhr valley in Germany and the port of Rotterdam in the Netherlands, which was the case on 27 June 2019. Similarly, plumes can be observed, emitted from Lille and Dunkirk in France, when the wind is south–southwest.
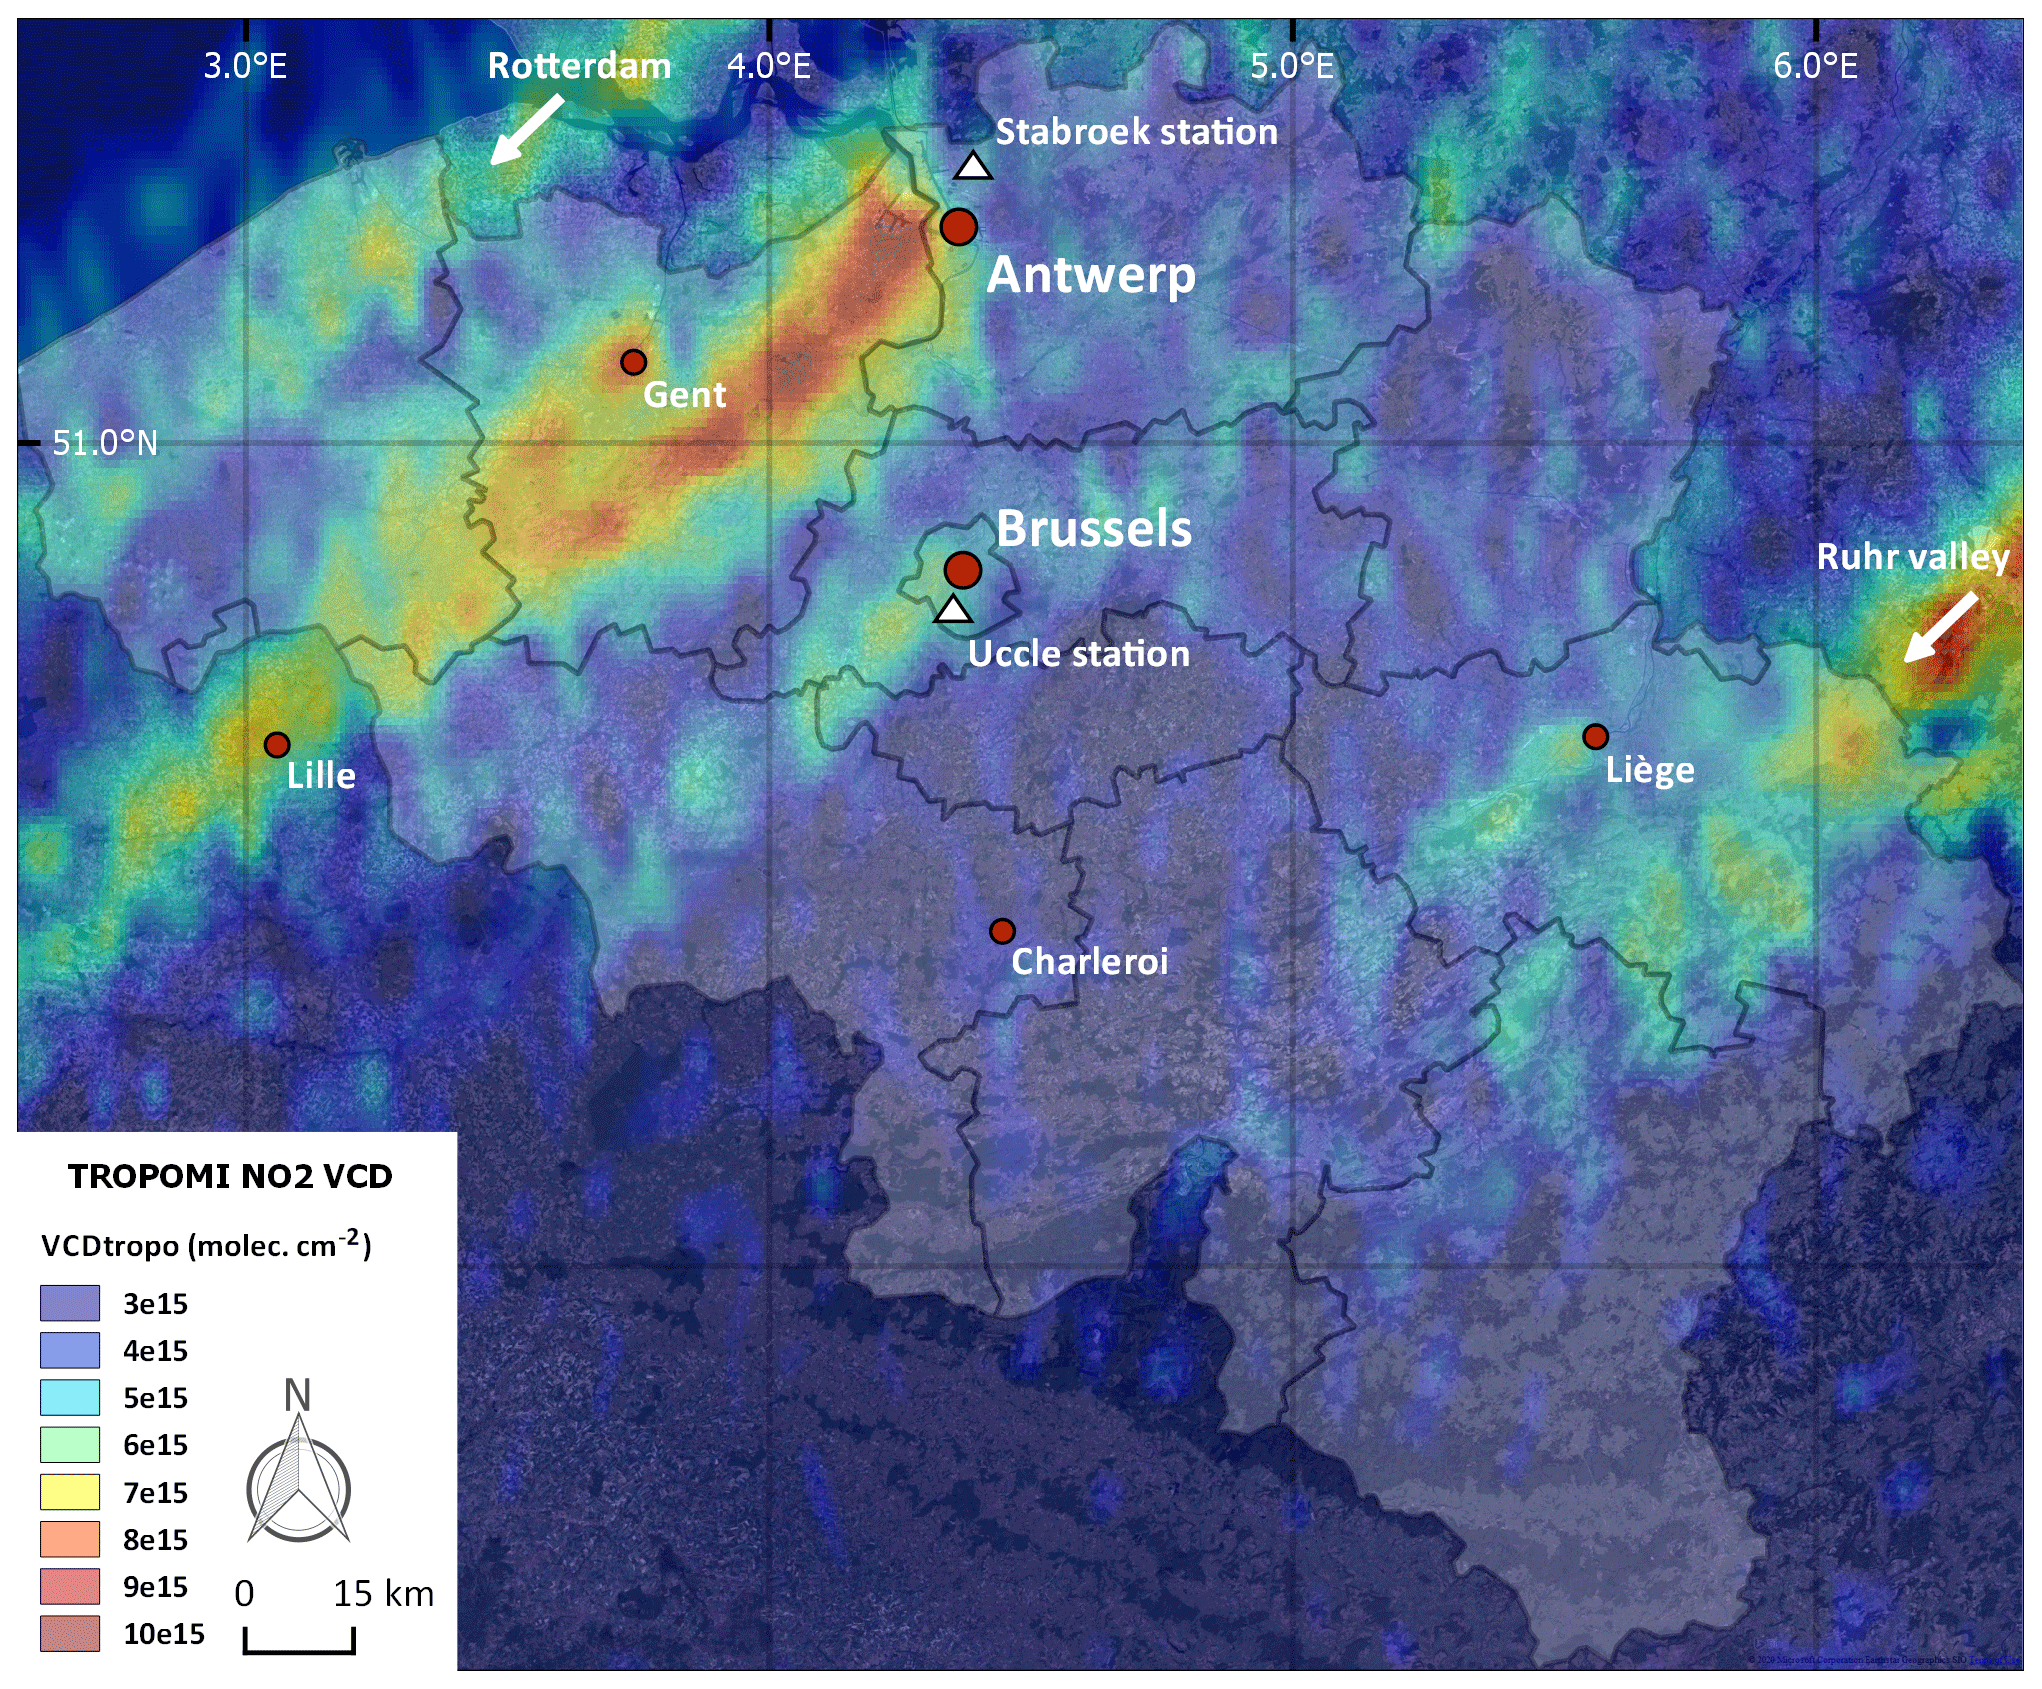
Figure 1Tropospheric NO2 hotspots observed over Belgium by TROPOMI, based on an early afternoon S-5P orbit (8826) on 27 June 2019 (OFFL v1.03.01 – thin plate spline interpolation at 0.01∘) (© Google Maps). Red markers indicate the five largest Belgian cities, as well as the city of Lille, France, which is a major NO2 source close to the Belgian border. The white triangles indicate the locations of the Uccle station (50.8∘ N, 4.4∘ E; 100 ) and Stabroek station (51.3∘ N, 4.4∘ E; 4 ). White arrows indicate the source locations for long-range transport plumes over Belgium. On 27 June 2019, there was a northeasterly wind (36∘).
The S5PVAL-BE campaign took place in Belgium from 26 to 29 June 2019. In total, four mapping flights, lasting between 1.5 and 2 h each, took place on four consecutive days. The APEX hyperspectral imager was operated by the Flemish Institute for Technological Research (VITO) from a Cessna 208B Grand Caravan EX, with registration number HB-TEN, owned by Swiss Flight Services (SFS) at a nominal altitude of 6.5 This is well above the planetary boundary layer (PBL), containing the bulk of the tropospheric NO2. The aircraft followed a regular mapping pattern consisting of adjacent straight flight lines, with slightly overlapping footprints, alternately flown from south to north and from north to south, with the first flight line in the west. A sufficiently large area was covered over and around the city in order to capture the emission plumes downwind of the key sources and also to cover a large amount of TROPOMI pixels in order to have a statistically relevant data set. For each flight, approximately 10 to 20 TROPOMI pixels were covered for at least half their extension by APEX observations.
The coincident APEX mapping flights were scheduled to take place within 1 h of the S-5P overpass, limiting the temporal variability between APEX and TROPOMI acquisitions to less than 1 h. This requirement ensures largely (see Sect. 5.2.2) that the same NO2 field was observed by both the satellite and aircraft instrument. Flights took place in mostly cloud-free conditions and on days with good visibility. For flights on 27 to 29 June, there was a cloud fraction of less than 1 % for the TROPOMI NO2 retrieval window at 440 nm. Only on 26 June (Flight no. 1), conditions were not fully optimal, with few scattered clouds and some light haze and aerosols (cloud fraction of 12 %). Two flights took place over the city and harbour of Antwerp on 27 and 29 June, and two flights over Brussels on 26 and 28 June. The flights covered variable meteorological and air quality conditions, as well as different overpass configurations, i.e. target area close to the TROPOMI nadir-viewing direction (27 and 28 June 2019, with only one early afternoon S-5P overpass) or closer to the edge of the swath (26 and 29 June 2019, with two early afternoon S-5P overpasses). All relevant flight characteristics are provided in Table 1, as well as the meteorological and environmental conditions during the flights. Note that the identifiers for the different flights (Flight nos. 1–4), as defined in Table 1, will be used in the continuation of this work to refer to the respective flights.
Table 1Mapping flight characteristics, and meteorological and environmental conditions for the four APEX flights, acquired over the cities of Antwerp and Brussels, in the framework of the S5PVAL-BE campaign.
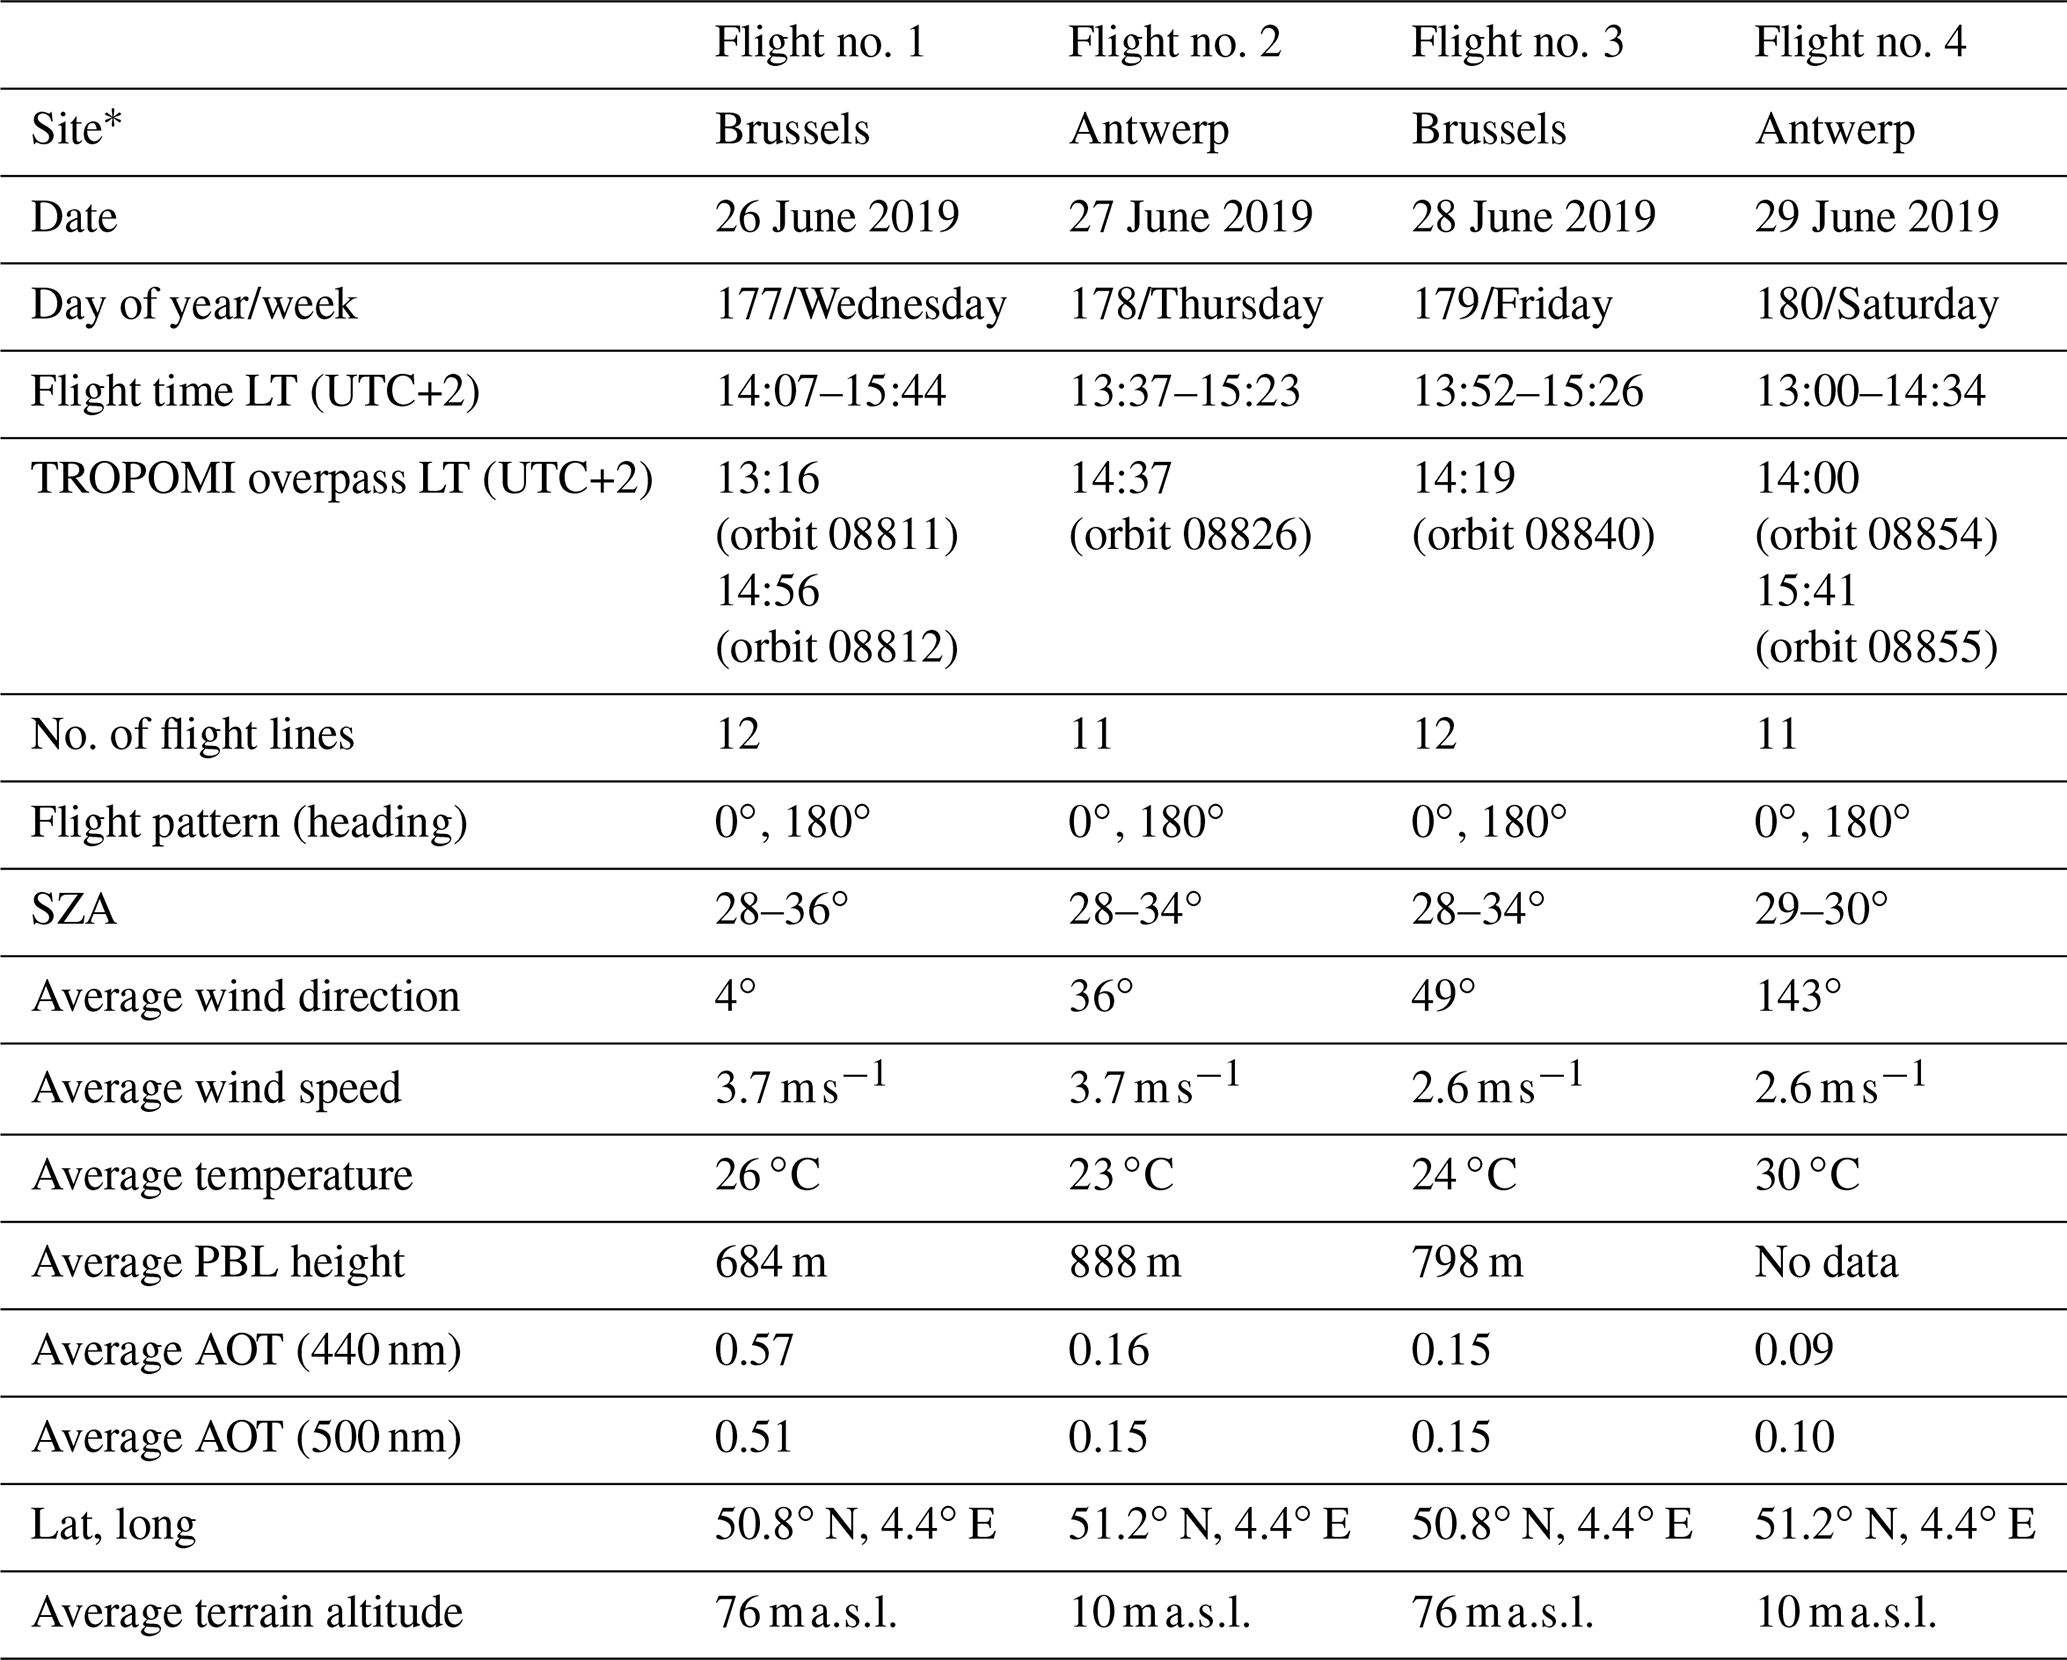
* Wind and temperature data are collected from weather stations of the Royal Meteorological Institute of Belgium (RMI), i.e. Uccle station (50.8∘ N, 4.4∘ E; 100 ) for Brussels and Stabroek station (51.3∘ N, 4.4∘ E; 4 ) for Antwerp, and measurements are averaged over the time of flight. PBL height was obtained from the backscatter profiles of a Vaisala CL51 automatic lidar and ceilometer (ALC) operated by RMI in Uccle. The aerosol optical thickness (AOT; level 1.5) was measured by the CIMEL AERONET station (Holben et al., 1998) in Uccle.
During all campaign days, there was a light breeze between 2.6 and 3.7 m s−1 at the surface, based on the average wind speed during the time of flight, and wind was usually blowing from the north–northeast, except for Flight no. 4 when there was a southeasterly wind. Wind and temperature data are collected from weather stations of the Royal Meteorological Institute of Belgium (RMI), i.e. Uccle station (50.8∘ N, 4.4∘ E; 100 ) for Brussels and Stabroek station (51.3∘ N, 4.4∘ E; 4 ) for Antwerp, and measurements are averaged over the time of flight. Surface temperatures were high, ranging between 23 and 30 ∘C. All observations were performed close to solar noon, and during the APEX acquisitions the solar zenith angle (SZA) ranged between 28 and 36∘ at maximum. The favourable high Sun position during summer maximized the light backscattered to the sensor and minimized the signal smoothing occurring in the case of shallow Sun elevation angles (Lawrence et al., 2015). On the other hand, the overall NO2 signal is generally slightly lower during summertime due to the shorter NO2 lifetime.
Due to the local noon overpass of TROPOMI, we assume a deep and well-developed boundary layer and a good vertical dispersion of the anthropogenic emissions in the PBL due to turbulent mixing from surface heating. During the overpasses, a PBL height between 700 and 900 m was retrieved from the backscatter profiles of a Vaisala CL51 automatic lidar and ceilometer (ALC) operated by RMI in Uccle. A low aerosol optical thickness (AOT; level 1.5) of less than 0.15, at 500 nm, was measured during Flight nos. 2–4 by a CIMEL Sun photometer at the Aerosol Robotic Network (AERONET) station (Holben et al., 1998) in Uccle. During Flight no. 1, an AOT of 0.51 at 500 nm was observed. On average, the retrieved AOT was 0.17 for June 2019. Note that the Uccle station is located south of Brussels, so for 26 to 28 June we assume that the site was downwind of the Brussels city centre and thus in a semi-polluted area. The CIMEL observations are largely consistent with measurements performed with a handheld model 540 Microtops II Sun photometer from Solar Lights (Porter et al., 2001). Measurements were performed from a car, looping around the city during the APEX overpasses. An average AOT (440 nm) of 0.65, 0.19, and 0.16 was observed by the Microtops on 26, 27, and 28 June, respectively.
3.1 S-5P and the TROPOMI payload
The TROPOMI instrument is a nadir-viewing pushbroom imaging spectrometer and was built by a joint venture between the Netherlands Space Office (NSO), Royal Netherlands Meteorological Institute (KNMI), Netherlands Institute for Space Research (SRON), Netherlands Organisation for Applied Scientific Research (TNO), Airbus Defence and Space Netherlands, and ESA. TROPOMI builds upon a rich heritage from similar instruments, such as SCIAMACHY (Bovensmann et al., 1999) on ESA's Envisat and OMI (Levelt et al., 2006) on NASA's Aura satellite. The main objective of the S-5P mission is to perform atmospheric measurements, relating to air quality, climate forcing, ozone, and UV radiation. S-5P bridges the gap in continuity of observations between its ESA predecessors (GOME and SCIAMACHY) and the forthcoming Sentinel-5 and Sentinel-4 missions, planned to be launched in 2023.
The TROPOMI instrument consists of four spectrometers covering the UV–VIS–NIR–SWIR wavelength ranges at a spectral resolution of 0.45–0.65 nm in the UV–VIS range. S-5P is in a near-polar, Sun-synchronous orbit of 824 km in altitude with an ascending node equatorial crossing at 13:30 MLST (mean local solar time). The entrance telescope allows for a wide field of view (FOV) of 108∘, corresponding to a swath width of approximately 2600 km, providing daily global coverage with a ground pixel size of approximately 3.5 km × 7 km at nadir (3.5 km × 5.5 km since 6 August 2019). For a full technical description, we refer to Veefkind et al. (2012), Loots et al. (2017), and Kleipool et al. (2018). The TROPOMI key specifications are provided and compared with the APEX specifications in Table 2.
Table 2TROPOMI and APEX specifications for the S5PVAL-BE campaign, defined for APEX for a nominal altitude of 6.5 Spectrometer characteristics are provided for the APEX visible–near-infrared (VNIR) detector and the TROPOMI UV–VIS channel only. The effective APEX spatial resolution is provided after applying spatial aggregation of the spectra for signal-to-noise enhancement.
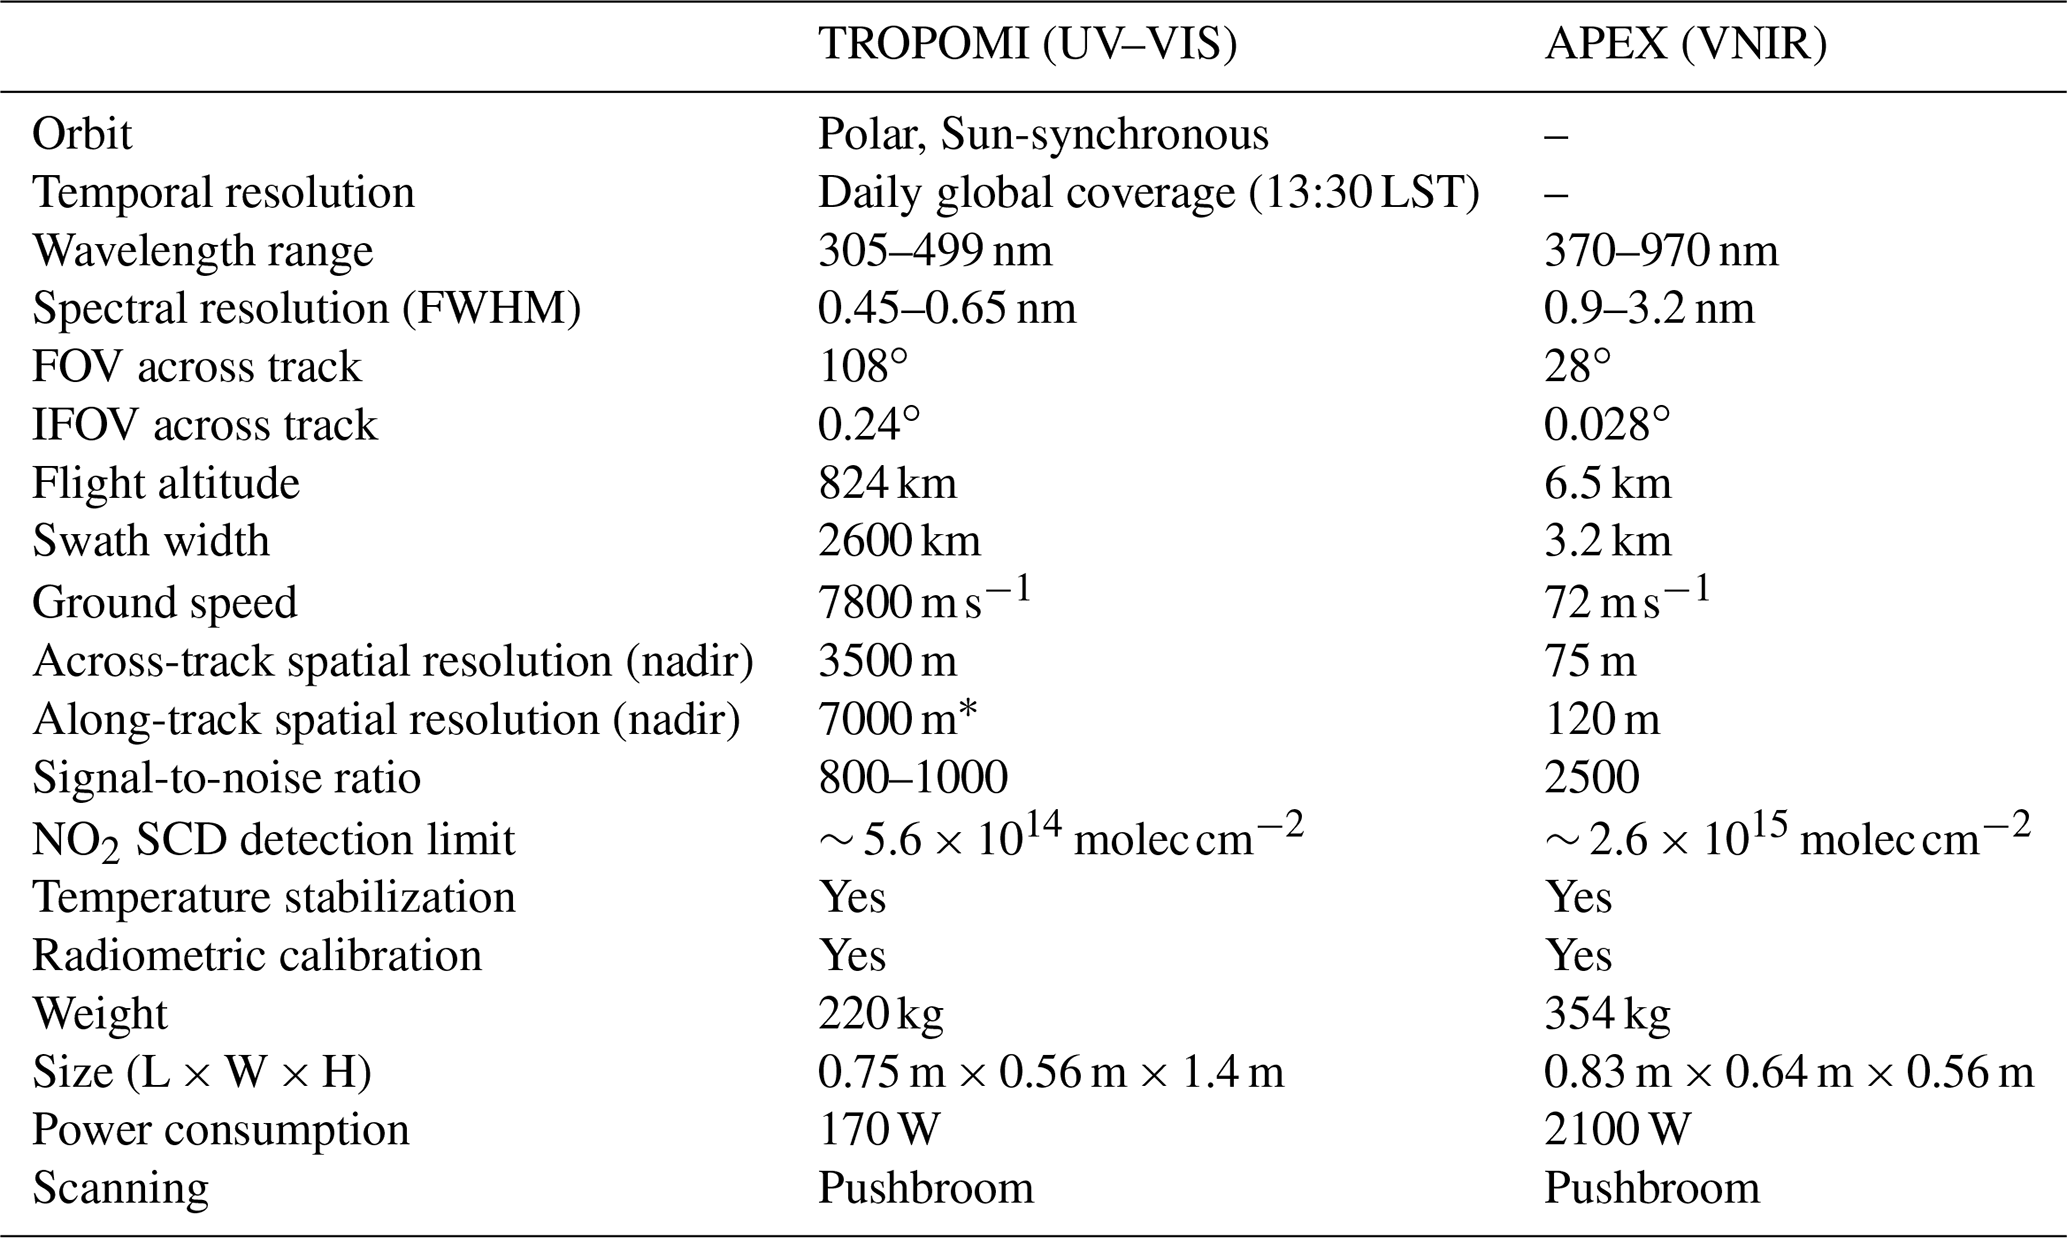
* 5500 m since 6 August 2019. This scenario has been successfully tested during the S-5P commissioning phase and it was recommended during the In-Orbit Commissioning Review (IOCR) to be implemented during the operational phase.
3.2 APEX airborne imager
The APEX instrument is a pushbroom imaging spectrometer, designed and developed on behalf of ESA by a Swiss–Belgian consortium (Itten et al., 2008; D'Odorico, 2012; Schaepman et al., 2015). Currently, APEX is jointly owned and operated by the remote sensing department of the Flemish Institute for Technological Research (VITO-TAP, Mol, Belgium) and the remote sensing laboratories from University of Zurich (RSL-UZH, Zurich, Switzerland). APEX records backscattered solar radiation in the visible, short-wave infrared regions of the electromagnetic spectrum, covering the 370 to 2540 nm wavelength range in two channels: a visible–near-infrared (VNIR) and a short-wave infrared channel (SWIR). In this study, only data from the VNIR channel (370–970 nm) were used. The radiance is spectrally dispersed by a prism. Hence, the full width at half maximum (FWHM) is a strongly non-linear function of the wavelength, broadening from 1.5 to 3 nm FWHM in the visible spectral range. The CCD (charge-coupled device) 14 bit depth area detector records data in 1000 pixels across track (spatial dimension) and 335 bands in the spectral dimension. Based on the across-track field of view (FOV) of 28∘, a swath width of 3.2 km is obtained at a nominal flight altitude of 6.5 The native spatial resolution of 3 m × 4 m, across and along track, respectively, is spatially aggregated to a resolution of approximately 75 m × 120 m in order to increase the signal to-noise ratio (SNR) while retaining sufficient spatial detail for atmospheric composition measurements (Tack et al., 2017). The APEX optical unit is enclosed by a thermo-regulated box, while the pressure in the spectrometer is kept at 200 hPa above ambient pressure.
In Table 2, the provided NO2 SCD detection limits are approximated by the average 1σ slant error on the DOAS fit, as instrument noise is the dominant source of errors in the spectral fitting. Using the same definition, NO2 SCD detection limits are estimated to be 5.6 × 10¹⁴ molec cm−2 for TROPOMI retrievals and 2.6 × 10¹⁵ molec cm−2 for APEX retrievals at its native resolution of 75 m × 120 m (see Sect. 5.2.1). However, in Sect. 5.2.2, spatiotemporal coinciding TROPOMI and APEX NO2 VCD grids are quantitatively compared by spatial averaging of all APEX NO2 VCDs within each TROPOMI pixel footprint. One nadir TROPOMI pixel corresponds to approximately 2700 APEX pixels, providing good statistics in the comparison. Spatial aggregation of APEX retrievals results in a decrease of its random uncertainty. Following Poisson statistics and assuming only photon noise, the noise is expected to decrease with the square root of the number of aggregated retrievals, resulting in a noise reduction by a factor of 52 or a noise level of 5.0 × 10¹³ molec cm−2 on the aggregated APEX pixels. This is approximately 1∕10 of the TROPOMI random error. The effective APEX noise level is, however, expected to be slightly larger as the noise reduction due to spatial binning does not completely follow shot noise statistics due to occurring dark current and read-out noise and systematic errors in the DOAS fit.
Several studies have demonstrated the capabilities of APEX for atmospheric trace gas retrieval applications, in particular high-resolution mapping of the NO2 variability over polluted regions (Popp et al., 2012; Kuhlmann et al., 2016; Tack et al., 2017, 2019).
4.1 TROPOMI NO2 processor
The TROPOMI NO2 processor is based on the DOMINO v2 (Dutch OMI NO2 data products of KNMI for OMI; Boersma et al., 2011) and QA4ECV (Quality Assurance for Essential Climate Variables; Boersma et al., 2018) processing systems, with a number of differences related to specific TROPOMI characteristics. The processor is based on a retrieval-data assimilation-modelling system using the 3-D global massively parallel (MP) version of the Tracer Model version 5 (TM5) (Huijnen et al., 2010) chemistry transport model (CTM) (Williams et al., 2017). It follows a three-step approach:
-
The retrieval of NO2 slant columns, being the NO2 concentration integrated along the effective light path, by application of the DOAS baseline method (Platt and Stutz, 2008) on the level-1b radiance and irradiance TROPOMI spectra. The DOAS retrieval follows a non-linear fitting approach similar to the one used for OMI (Boersma et al., 2011; van Geffen et al., 2015). Key retrieval parameters are provided in Table 3. Resulting SCDs are dependent on the optical light path through the atmosphere and thus on the viewing geometry, the assumed state of the atmosphere, and solar radiative transfer.
-
Separation of the total slant column into its tropospheric and stratospheric contributions, based on data assimilation of the SCDs in the TM5-MP CTM (Williams et al., 2017).
-
Conversion of the retrieved SCDs into VCDs by application of appropriate air mass factors (AMFs). AMFs express the relationship between SCDs and VCDs, accounting for the effects of the viewing and Sun geometry, NO2 vertical distribution, surface albedo, cloud fraction, cloud height, aerosol scattering, and terrain height. They are obtained by the integrated product of (1) altitude-dependent AMFs (or box AMFs) expressing the vertical sensitivity of the measurement and (2) daily NO2 vertical profiles from the TM5-MP model on a 1∘ × 1∘ grid and covering 34 vertical layers (between the surface and top of the atmosphere; TOA). Box AMFs are computed based on the Doubling-Adding KNMI (DAK version 3.2) radiative transfer model (RTM) (De Haan et al., 1987; Stammes et al., 2001). TROPOMI surface albedo is based on a climatology made from 5 years of OMI data, aggregated to a grid of 0.5∘ × 0.5∘ (Kleipool et al., 2008). For NO2 retrievals, the Lambert-equivalent reflectance (LER) at 440 nm is used. The LER is defined as the required reflectance of an isotropic surface needed to match the observed TOA reflectance in a pure Rayleigh scattering atmosphere under cloud-free conditions and no aerosols. Cloud parameters are retrieved based on the fast retrieval scheme for clouds from the oxygen A-band algorithm (FRESCO+; Wang et al., 2008).
Table 3Overview of the key parameters for the DOAS spectral fitting and NO2 slant column retrieval.
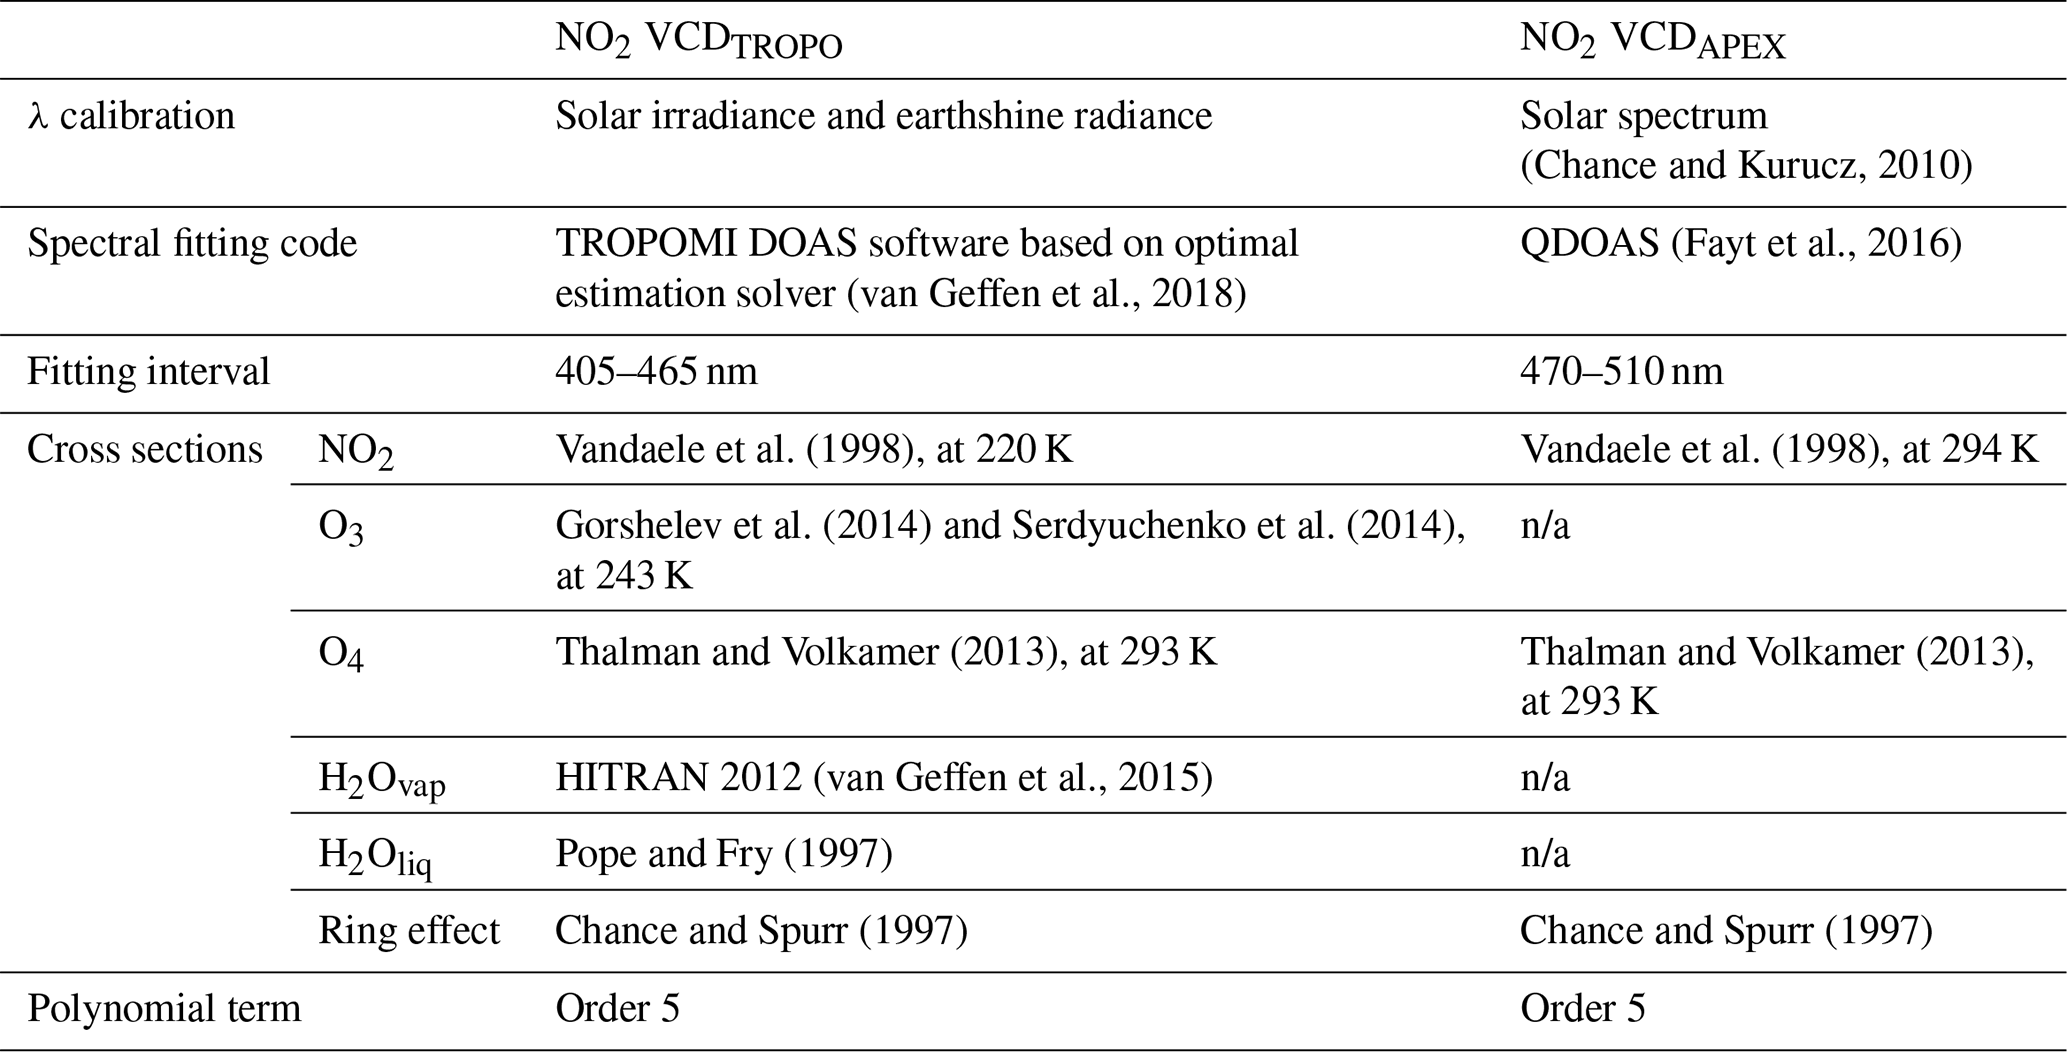
n/a: not applicable.
For a full description of the TROPOMI NO2 retrieval algorithm, we refer to the algorithm theoretical basis document (ATBD) of the total and tropospheric NO2 data products (van Geffen et al., 2018) and the recent study of van Geffen et al. (2020). Note that in the continuation of this work, NO2 VCDTROPO refers to the TROPOMI tropospheric NO2 VCD product based on the standard TM5-MP profiles.
4.2 APEX NO2 processor
The APEX NO2 VCD retrieval scheme is similar in concept to the TROPOMI one and the developed algorithm is well documented in Tack et al. (2017). A full discussion on the retrieval algorithm is beyond the scope of this paper. Therefore, we refer to Sect. 4.1, 4.2, 4.3, and 4.6 in Tack et al. (2017) for all details on the APEX DOAS analysis, reference spectrum, AMF computation, and NO2 VCD error budget, respectively. The DOAS spectral fit is based on the QDOAS software (Fayt et al., 2016) applied in the 470–510 nm spectral range, optimal for NO2 retrieval from APEX. Note that interference with unidentified instrumental artefacts or features prevents us from extending the fitting window to wavelengths lower than 470 nm, as discussed in Popp et al. (2012) and Tack et al. (2017). Key parameters for the NO2 SCD retrieval are provided in Table 3. For each flight, a reference spectrum was selected in a clean background area, upwind of the main sources, and the residual amount of NO2 in the reference was estimated from co-located mobile-DOAS measurements. NO2 box AMFs have been calculated with the LIDORT 2.6 RTM (Spurr, 2008). Sun and viewing geometry, defined by the SZA, viewing zenith angle (VZA), and relative azimuth angle (RAA) are computed by the APEX orthorectification module (Vreys et al., 2016) for each observation. Pressure and temperature atmospheric profiles are taken from the Air Force Geophysics Laboratory (AFGL) standard atmosphere for midlatitude summer (Anderson et al., 1986). Aerosol extinction profiles (AEPs) were constructed from the AOT and PBL height observations, measured by the CIMEL and ceilometer, respectively, during the respective flights (see Table 1). As APEX is radiometrically calibrated, a surface reflectance product can be retrieved from the at-sensor radiances by application of an atmospheric correction algorithm (Sterckx et al., 2016). Total AMFs are computed from the box AMFs based on integration along an a priori NO2 box profile, with constant mixing ratio in the PBL and taking the PBL height from the ceilometer observations (see Table 1). In the continuation of this work, NO2 VCDAPEX refers to the retrieved APEX tropospheric NO2 VCD product.
4.3 AMF dependence on key RTM parameters
4.3.1 NO2 profile and vertical sensitivity
A priori NO2 profile shapes used in the TROPOMI retrieval algorithms are specified using the TM5-MP CTM, which is an improved version of the TM4 CTM operated for the OMI DOMINO v2.0 product. TM5-MP has a finer spatial resolution (1∘ × 1∘), updated information on NOx emissions, and an improved description of relevant physical (photolysis rate constants) and chemical (reaction rate constants) processes (van Geffen et al., 2018). However, highly polluted areas typically exhibit strong NO2 vertical and horizontal gradients (see, e.g. Dieudonné et al., 2013; Ialongo et al., 2020; Zhao et al., 2020; Dimitropoulou et al., 2020; Pinardi et al., 2020). The sharp gradients between pollution plumes and background areas cannot be resolved properly at the horizontal scale of the model (∼ 100 km × 100 km). In Dimitropoulou et al. (2020), TROPOMI tropospheric NO2 VCDs were recalculated based on high-resolution MAX-DOAS profiles, while in Ialongo et al. (2020) a priori NO2 profiles were extracted from the Copernicus Atmospheric Monitoring Service (CAMS) regional CTM (Marécal et al., 2015; https://www.regional.atmosphere.copernicus.eu, last access: 18 January 2021). These transformations generally led to increased NO2 VCDs, resulting in a better agreement with reference ground-based measurements. In this study, a custom TROPOMI tropospheric NO2 product was also prescribed, based on NO2 profile shapes from the CAMS regional CTM ensemble. CAMS NO2 profiles, being a merge of CAMS regional (0.1∘ × 0.1∘; surface to 3 km altitude in seven layers; hourly data) and CAMS global (0.4∘ × 0.4∘; 3 km to TOA; 3-hourly data), analysed at the 0.1∘ grid of CAMS regional, were used to recompute the tropospheric AMFs and corresponding TROPOMI NO2 VCDs, referred to as VCDTROPO−CRE in the continuation of this work. In general, we find that the VCDs are increased by about 5 % to 40 % over the Brussels–Antwerp regions, depending on the day and location (see Fig. 2). In the absence of NO2 hotspots and plumes, the impact of changing the a priori profile is small. Both the standard and the custom TROPOMI NO2 products are compared with airborne APEX mapping data in Sect. 5.2.

Figure 2Ratio of TROPOMI tropospheric NO2 columns when using the CAMS regional a priori NO2 profiles with respect to TM5-MP a priori profiles over Belgium and neighbouring countries on 27 June 2019 (orbit 8826).
For the APEX retrievals, AEPs and a priori NO2 profiles were constructed from the AOT and PBL height observations, as discussed in Sect. 4.2. In order to yield retrievals independent from the satellite, box profiles were used instead of the TROPOMI TM5-MP profiles, as displayed in Fig. 3a. When TM5-MP or CAMS profiles would be applied as a priori for the APEX retrievals, the AMF would increase with, respectively, 9 % and 10 % on average, which is largely consistent with a similar sensitivity study reported in Tack et al. (2017). For the APEX retrievals, we assumed a well-mixed NO2 and aerosol box profile scenario and urban aerosols with a high single-scattering albedo (SSA) of 0.93. This causes a multiple scattering scenario and an enhancement of the optical path length in the NO2 layer and results in an increase in the AMF. When instead considering a no-aerosol scenario for the APEX retrievals, the AMF drops by 10 % on average. We assume that the opposing effects of using (1) a priori profile shape assumptions different from the TROPOMI retrievals and (2) different aerosol assumptions tend to cancel each other out in the APEX retrievals.
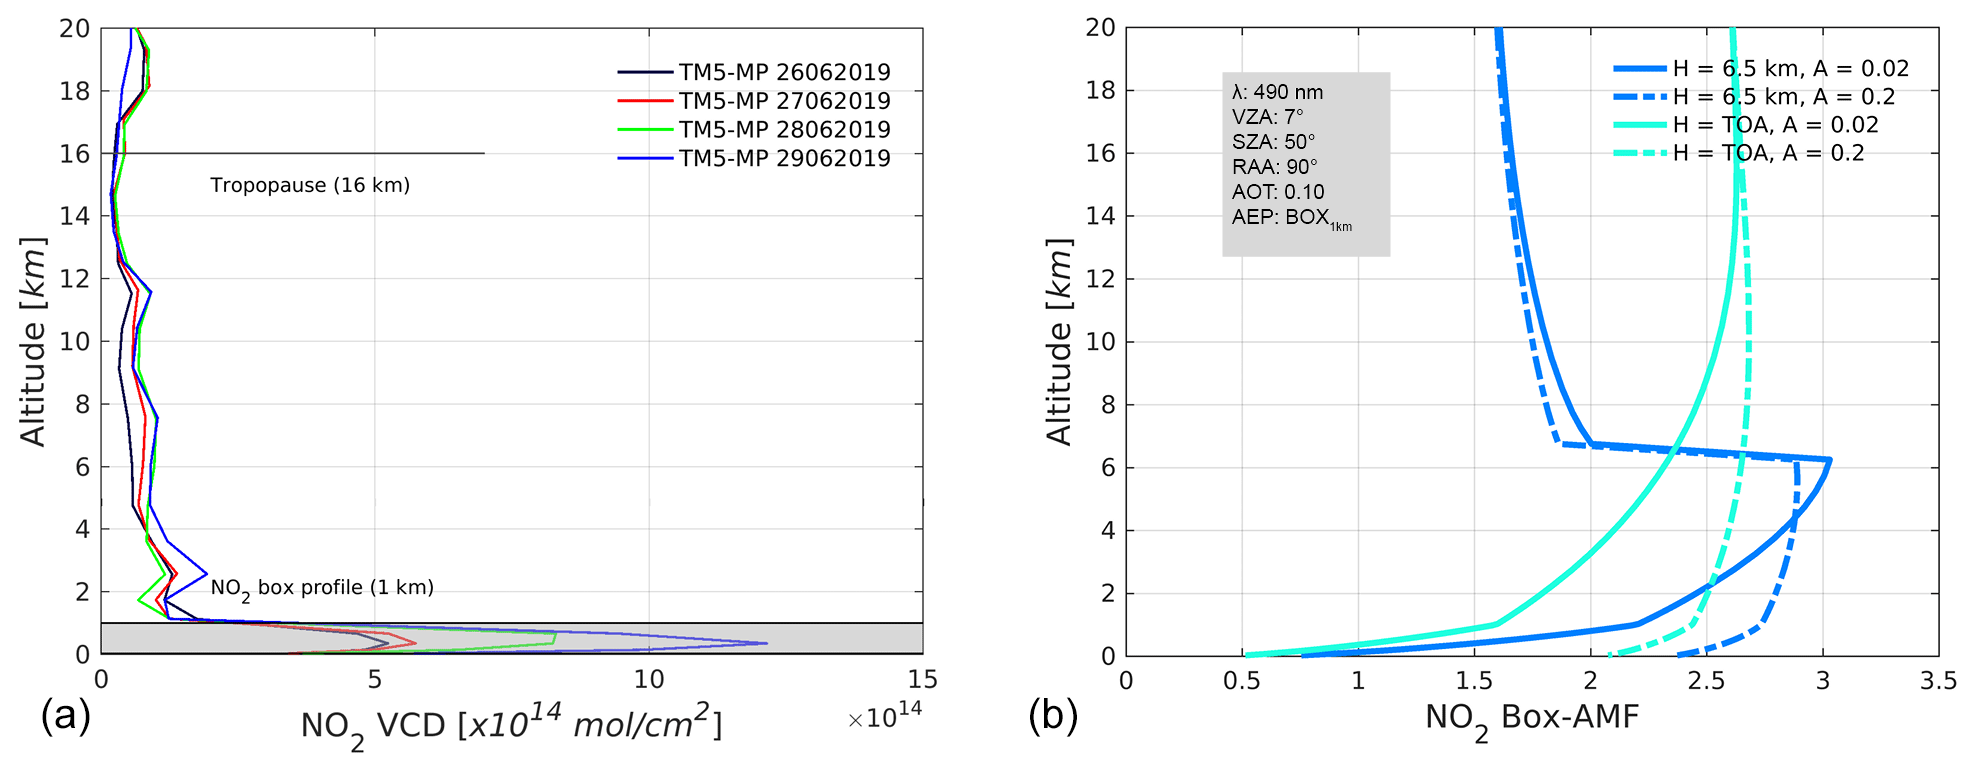
Figure 3(a) Representation of a well-mixed NO2 box profile of 1 km thickness and TM5-MP NO2 profiles interpolated over the campaign sites for Flight nos. 1–4, and (b) height-dependent box AMFs representing the vertical sensitivity to NO2, illustrated for APEX, operating at 6.5 , and TROPOMI, for both a low and high surface reflectance scenario.
Box AMFs were computed and plotted in Fig. 3b for APEX, operating at 6.5 , and TROPOMI, for both a low and high surface reflectance scenario and with fixed values for the other RTM parameters. The box AMFs describe the sensitivity of the observations as a function of altitude (Wagner et al., 2007). The shapes of both TROPOMI and APEX box AMFs are similar below the aircraft altitude (6.5 ), but APEX has a higher sensitivity. As can be seen, the nadir-looking airborne instrument has a peak in sensitivity in the layer directly under the sensor. Above the airborne platform, the sensitivity to NO2 converges rapidly with increasing altitude to a constant box AMF of 1.6, a value which corresponds to the geometrical AMF at the SZA of 50∘ assumed for this simulation. Due to scattering and absorption, the sensitivity decreases towards the ground surface where the bulk of the tropospheric NO2 is residing. The decrease in sensitivity is stronger for TROPOMI, due to the larger probability of scattering above the NO2 layer. For a low albedo case, i.e. 0.02, the box AMF of the layer closest to the ground surface (50 m thickness) is ∼ 50 % larger for APEX when compared to TROPOMI, while this is ∼ 15 % for a very high albedo case, i.e. 0.2. For the ensemble of the four data sets, the total tropospheric AMF is 1.1 ± 0.1 on average for TROPOMI retrievals and 1.7 ± 0.1 for APEX retrievals or approximately 50 % higher. This can be partly explained by a stronger decrease in sensitivity with increasing platform altitude due to the larger scattering probability above the absorbing layer.
4.3.2 Surface reflectance
The surface albedo used in the TROPOMI retrievals is currently based on a climatology made from 5 years of OMI data, aggregated to a grid of 0.5∘ × 0.5∘, as discussed in Sect. 4.1. In this section, we first compare the TROPOMI albedo at 440 nm with the surface reflectance product retrieved from the APEX at-sensor radiance at 490 nm (see Sect. 4.2). Similar to the assessment of coincident NO2 VCDs in Sect. 5.2.2, the spatiotemporal coinciding TROPOMI and APEX albedo grids are quantitatively compared by spatial averaging of all APEX albedo values within each TROPOMI pixel footprint for the ensemble of the APEX data sets. The latter is defined by the pixel corner coordinates provided in the L2 product, while the APEX albedo locations are defined by their respective pixel centre coordinates. TROPOMI pixels currently take the albedo values from the coarse OMI LER (∼ 50 km × 50 km), implying that groups of neighbouring TROPOMI pixels are assigned the same value. As a result, usually one APEX data set over a particular city covers only one to two different OMI LER albedo values. As APEX measures the albedo at high resolution (75 m × 120 m), we consider it as a good approximation of the effective albedo. By comparing the APEX albedo to the TROPOMI albedo, we can have an indication of the effective albedo variability over an urban area and how this is smoothed out in the TROPOMI/OMI LER due to its coarser resolution.
Analysing the ensemble of the four acquired APEX data sets provided in Table 1 at the native APEX spatial resolution of 75 m × 120 m, the APEX albedo is 0.040 on average and the variability within one TROPOMI pixel, expressed as the SD (standard deviation), is 0.022 on average or ∼ 55 % but can be up to 100 % for certain pixels. When resampled at the resolution of TROPOMI, the variability of the APEX-derived albedo is 0.012 on average or ∼ 30 %, with values ranging between 0.015 and 0.065 (see Fig. 4). The OMI-based TROPOMI albedo variability is low, i.e. 0.001, as only four different 0.5∘ OMI LER pixels are sampled over the APEX scenes. The strong effective albedo variability over urban areas, as illustrated by the APEX albedo, is not captured by the OMI LER. This is likely to introduce a noise in the NO2 VCD retrieval since this variability is not accounted for in the computed AMFs. In Sect. 5.2.2, it is shown that the comparison of APEX with coincident TROPOMI tropospheric NO2 SCDs exhibits a slightly smaller spread than when comparing APEX and TROPOMI VCDs.
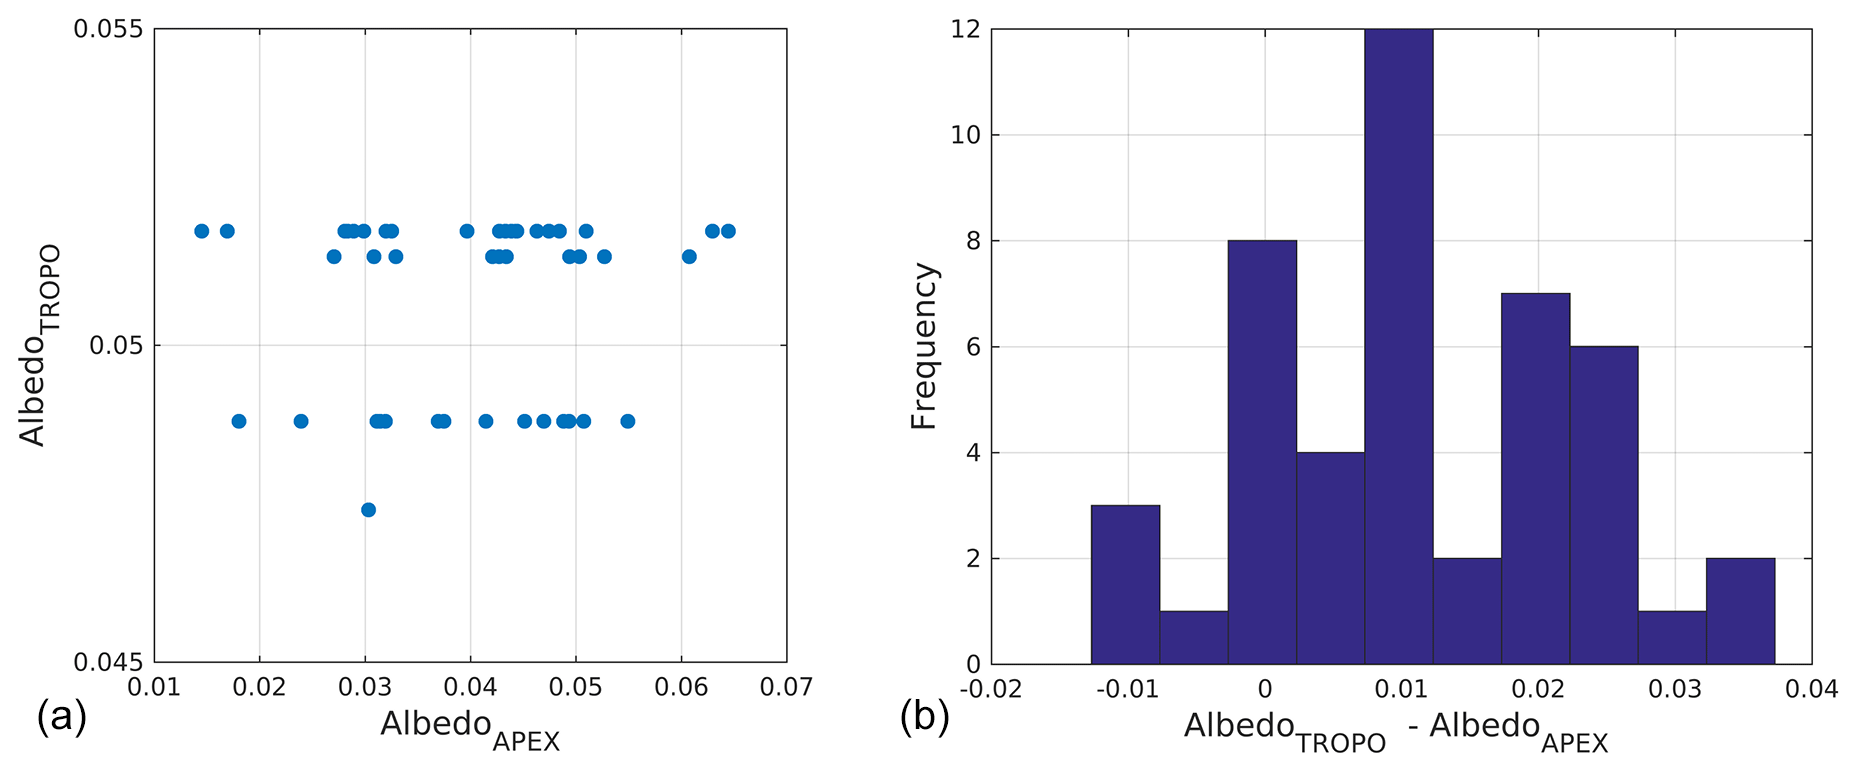
Figure 4(a) Scatter plot and (b) histogram for the comparison between TROPOMI albedo and APEX albedo, resampled at TROPOMI resolution, for the ensemble of the four APEX data sets.
The albedo for coincident TROPOMI pixels over the APEX scenes is 0.051, on average, or 0.011 (∼ 27 %) higher than APEX. This is somewhat surprising at first glance as one would expect that high albedo values, typically observed over urban areas (Heiden et al., 2007), would be smoothed out in the OMI LER low-resolution albedo product and that this would result in a lower overall albedo when compared to the high-resolution APEX product. However, Kleipool et al. (2008) discusses that a statistical analysis approach is used to yield a climatologically averaged reflectance in the OMI LER, instead of using an absolute minimum reflectance method or so-called minimum Lambertian equivalent reflectance (MLER). The statistical analysis approach results in a higher reflectance value than provided by the MLER. This is to take into account the presence of boundary layer haze and persistent cloud features. It seems that for clear-sky conditions, the OMI LER overestimates the surface reflectance and that for these conditions the MLER would be a better approximation. Over Belgium, OMI MLER (not provided in the TROPOMI L2 NO2 product) is approximately 0.005 lower than the OMI LER reflectance value, which would reduce the overestimation of TROPOMI reflectance to 0.006 when compared to APEX for the clear-sky flights. According to Boersma et al. (2004), for albedo values smaller than 0.200, an overestimation of the albedo by 0.005–0.010 can result in a 5 %–10 % increase of the tropospheric AMF and thus in a potential underestimation of the retrieved TROPOMI NO2 VCD.
The APEX and TROPOMI albedos have been both compared with Moderate Resolution Imaging Spectroradiometer (MODIS) albedo data and more specifically with the MODIS MCD43A3 black-sky albedo daily L3 500 m v006 product at 470 nm. Coincident APEX and MODIS albedo pixels are compared for the data set acquired over Antwerp on 27 June 2019, and the scatter plot is shown in Fig. 5a. The regression analysis shows a high correlation (R = 0.96) and a slope close to unity on a total of 2800 compared pixels, while the absolute difference is smaller than 0.005, on average. When comparing TROPOMI and MODIS albedo, both data sets are regridded to 0.5∘, which is the grid size of the OMI LER. Albedo pixels are compared for all of Belgium on 27 June 2019, and the scatter plot is shown in Fig. 5b. The dynamic range is much lower than for the comparison between APEX and MODIS albedo, and high albedo values (> 0.06), typically observed over urban areas, are smoothed out. The regression analysis shows a lower correlation (R=0.84), and the TROPOMI albedo is approximately 0.012 higher than MODIS. Similar statistics were found when comparing the data sets acquired on the other campaign days. The albedo is wavelength dependent and albedo products at different wavelengths have been compared: OMI LER at 440 nm, MODIS MCD43A3 at 470 nm, and APEX albedo at 490 nm. The wavelength dependency has been assessed by analysing the relative difference of the OMI LER albedo over Brussels and Antwerp between 440 and 470–490 nm for both the yearly and monthly OMI LER product (June). Overall, the OMI LER albedo increases slightly with wavelength but the increase is smaller than 4 % between 440 and 490 nm.
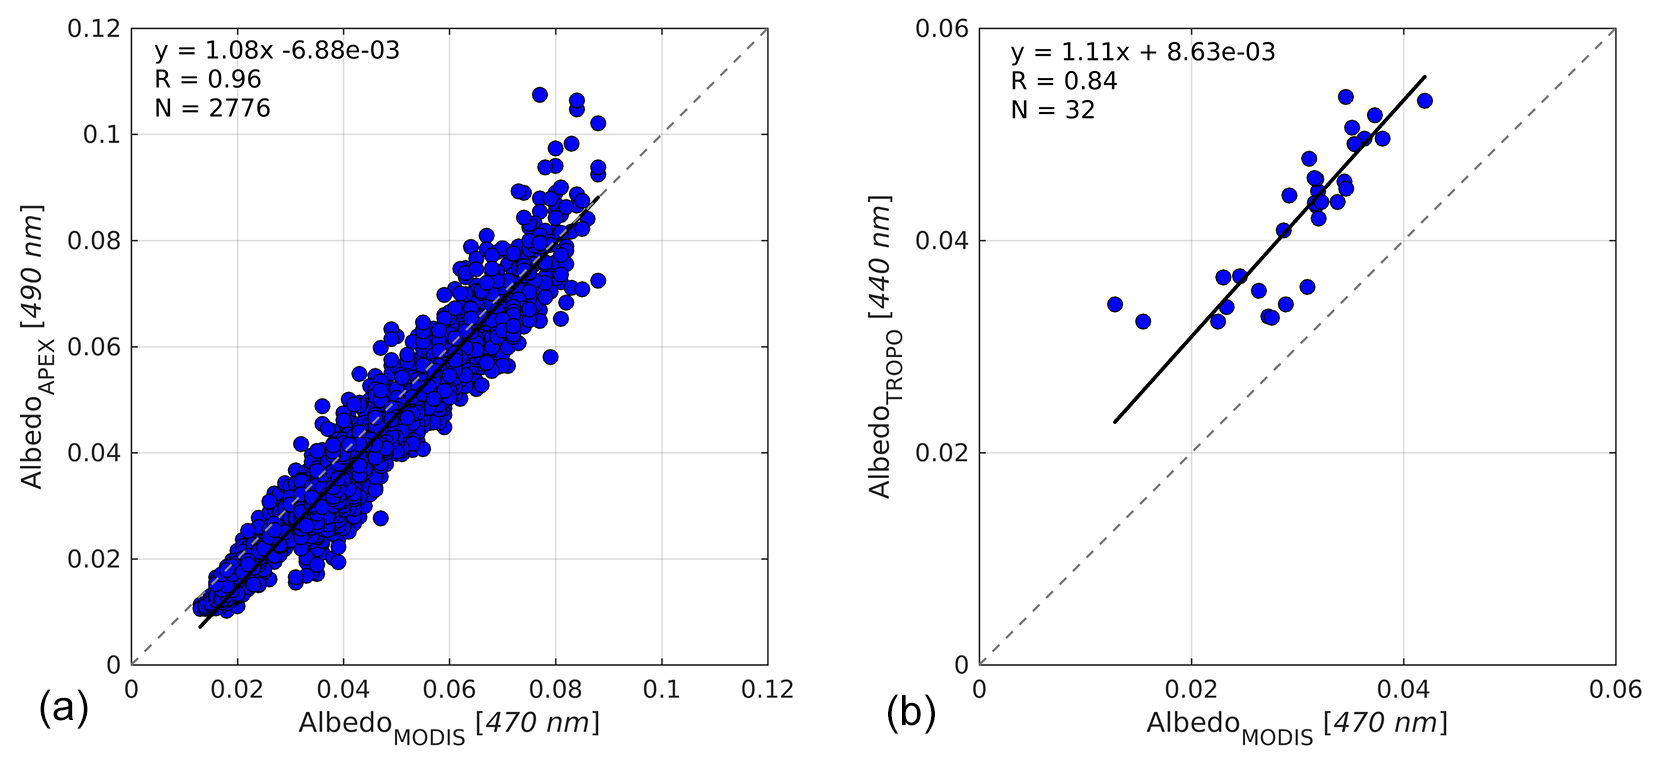
Figure 5Scatter plots and linear regression analyses of co-located (a) APEX and MODIS, and (b) TROPOMI and MODIS albedo pixels for 27 June 2019.
The observed overestimation of the OMI LER seems to be consistent with comparison studies reported in Kleipool et al. (2008). In the study, the OMI LER has been assessed for the entire globe by comparison with a similar LER map, based on data from the Total Ozone Mapping Spectrometer (TOMS) at 331, 340, 360, and 380 nm. The TOMS LER was approximately 0.015 lower than the OMI LER on average. GOME albedo at 335, 380, 440, and 494 nm was ∼ 0.005 lower on average. The OMI LER was approximately 0.020 higher than the black-sky albedo, derived from MODIS at 470 nm. According to Kleipool et al. (2008), this is partly related to viewing geometry effects of the bidirectional reflectance distribution function (BRDF) of the surface. The TROPOMI and MODIS reflectance products are also not provided at the same wavelength, and a statistical analysis approach is used to determine the reflectance value, instead of the OMI MLER. Even if a direct comparison of different albedo products is not trivial due to BRDF effects and albedo wavelength dependencies, among others, there is an indication that the OMI LER is overestimating the effective albedo in certain conditions, requiring a revision of the product and algorithm. Retrievals over strongly polluted areas also require an albedo product at higher resolution in order to resolve the typically strong albedo variability. A global gapless geometry-dependent LER (G3_LER) daily map product at 0.1∘, retrieved from the TROPOMI L1B radiances, is currently under development and discussed in Loyola et al. (2020). Also KNMI is working on a new TROPOMI LER product, extended compared to the OMI LER by including a viewing angle dependency, and will become available after the L1B product has been reprocessed to v2. As soon as a TROPOMI LER product becomes available, and its impact has been tested, this will be implemented to replace the OMI albedo climatology. New APEX validation flights over the Antwerp and Brussels region are foreseen for summer 2021 and will be valuable to assess (1) the retrieval impact of replacing the OMI LER by the TROPOMI LER and (2) the v2 reprocessing of the TROPOMI NO2 product.
Furthermore, for the NO2 retrieval, a surface albedo adjustment scheme has already been implemented and will become operational from v2.0 onwards (upgrade planned for the second half of 2020; Eskes et al., 2020). In this approach, the reflectivity measured in the NO2 fitting window will be compared with a computed reflectivity based on the LER climatology. In the event that the observed reflectivity is lower, the albedo value will be reduced to match the observation, and the AMF will be computed with the adjusted albedo. This approach should remedy part of the shortcomings of the current albedo climatology.
4.3.3 Cloud fraction
Due to the cloud-free conditions for Flight nos. 2 to 4, cloud parameters do not contribute to the uncertainties here. Nevertheless, the effective cloud fraction for the NO2 retrieval window at 440 nm, computed by FRESCO (Wang et al., 2008) and provided in the L2 product, was checked. For Flight nos. 2–4, a cloud cover of less than 1 % on average was computed over Belgium. During Flight no. 1, scattered clouds were present and a cloud fraction of on average 12 % was computed over Belgium.
A small cloud fraction of 12 % indicates that there is more scattering in the atmosphere than computed based on the LER value. In the TROPOMI NO2 retrieval, such small “cloud fractions” are used to implicitly compensate for aspects like too-small LER values (e.g. often the case over cities which have a higher reflectivity than the surroundings not resolved in the OMI map) or the presence of scattering aerosols, haze, or residual clouds. Ideally, the cloud pressure will indicate the altitude at which the scattering takes place. In practice, this is a challenge because cloud pressure uncertainties are large for small cloud fractions.
5.1 Analysis of the APEX NO2 VCD grid product
The retrieved APEX NO2 VCD maps are provided in Figs. 6 and 7 for the Antwerp (Flight nos. 2 and 4) and Brussels (Flight nos. 1 and 3) regions, respectively. Flight characteristics and meteorological and environmental parameters of the four APEX flights were already discussed in Sect. 2 and are summarized in Table 1. They assist the geophysical interpretation of the observed NO2 field. On the maps, white dots indicate the key point sources which are mostly chimney stacks from the prevailing petrochemical industry in the harbour of Antwerp. They are retrieved from the emission inventory 2017, provided by the Belgian Interregional Environmental Agency and a threshold was set at a minimum emission of 10 kg of NOx per hour in order to discriminate and visualize the main emitters. Key line sources such as the highways and city ring roads are indicated by white lines. TROPOMI tropospheric NO2 VCD retrievals are overlain as colour-coded polygons, defined by the pixel corner coordinates provided in the L2 product, and exhibit in general a good consistency with the APEX retrievals. However, elevated levels of NO2 from isolated hotspots or narrow and confined plumes, visible in the APEX retrievals, cannot be spatially resolved anymore by TROPOMI and are averaged out within the TROPOMI pixel. This is, for example, the case for the plume in the north of the APEX data set acquired over Antwerp on 27 June 2019. This smoothing effect will be studied in more detail in Sect. 6.
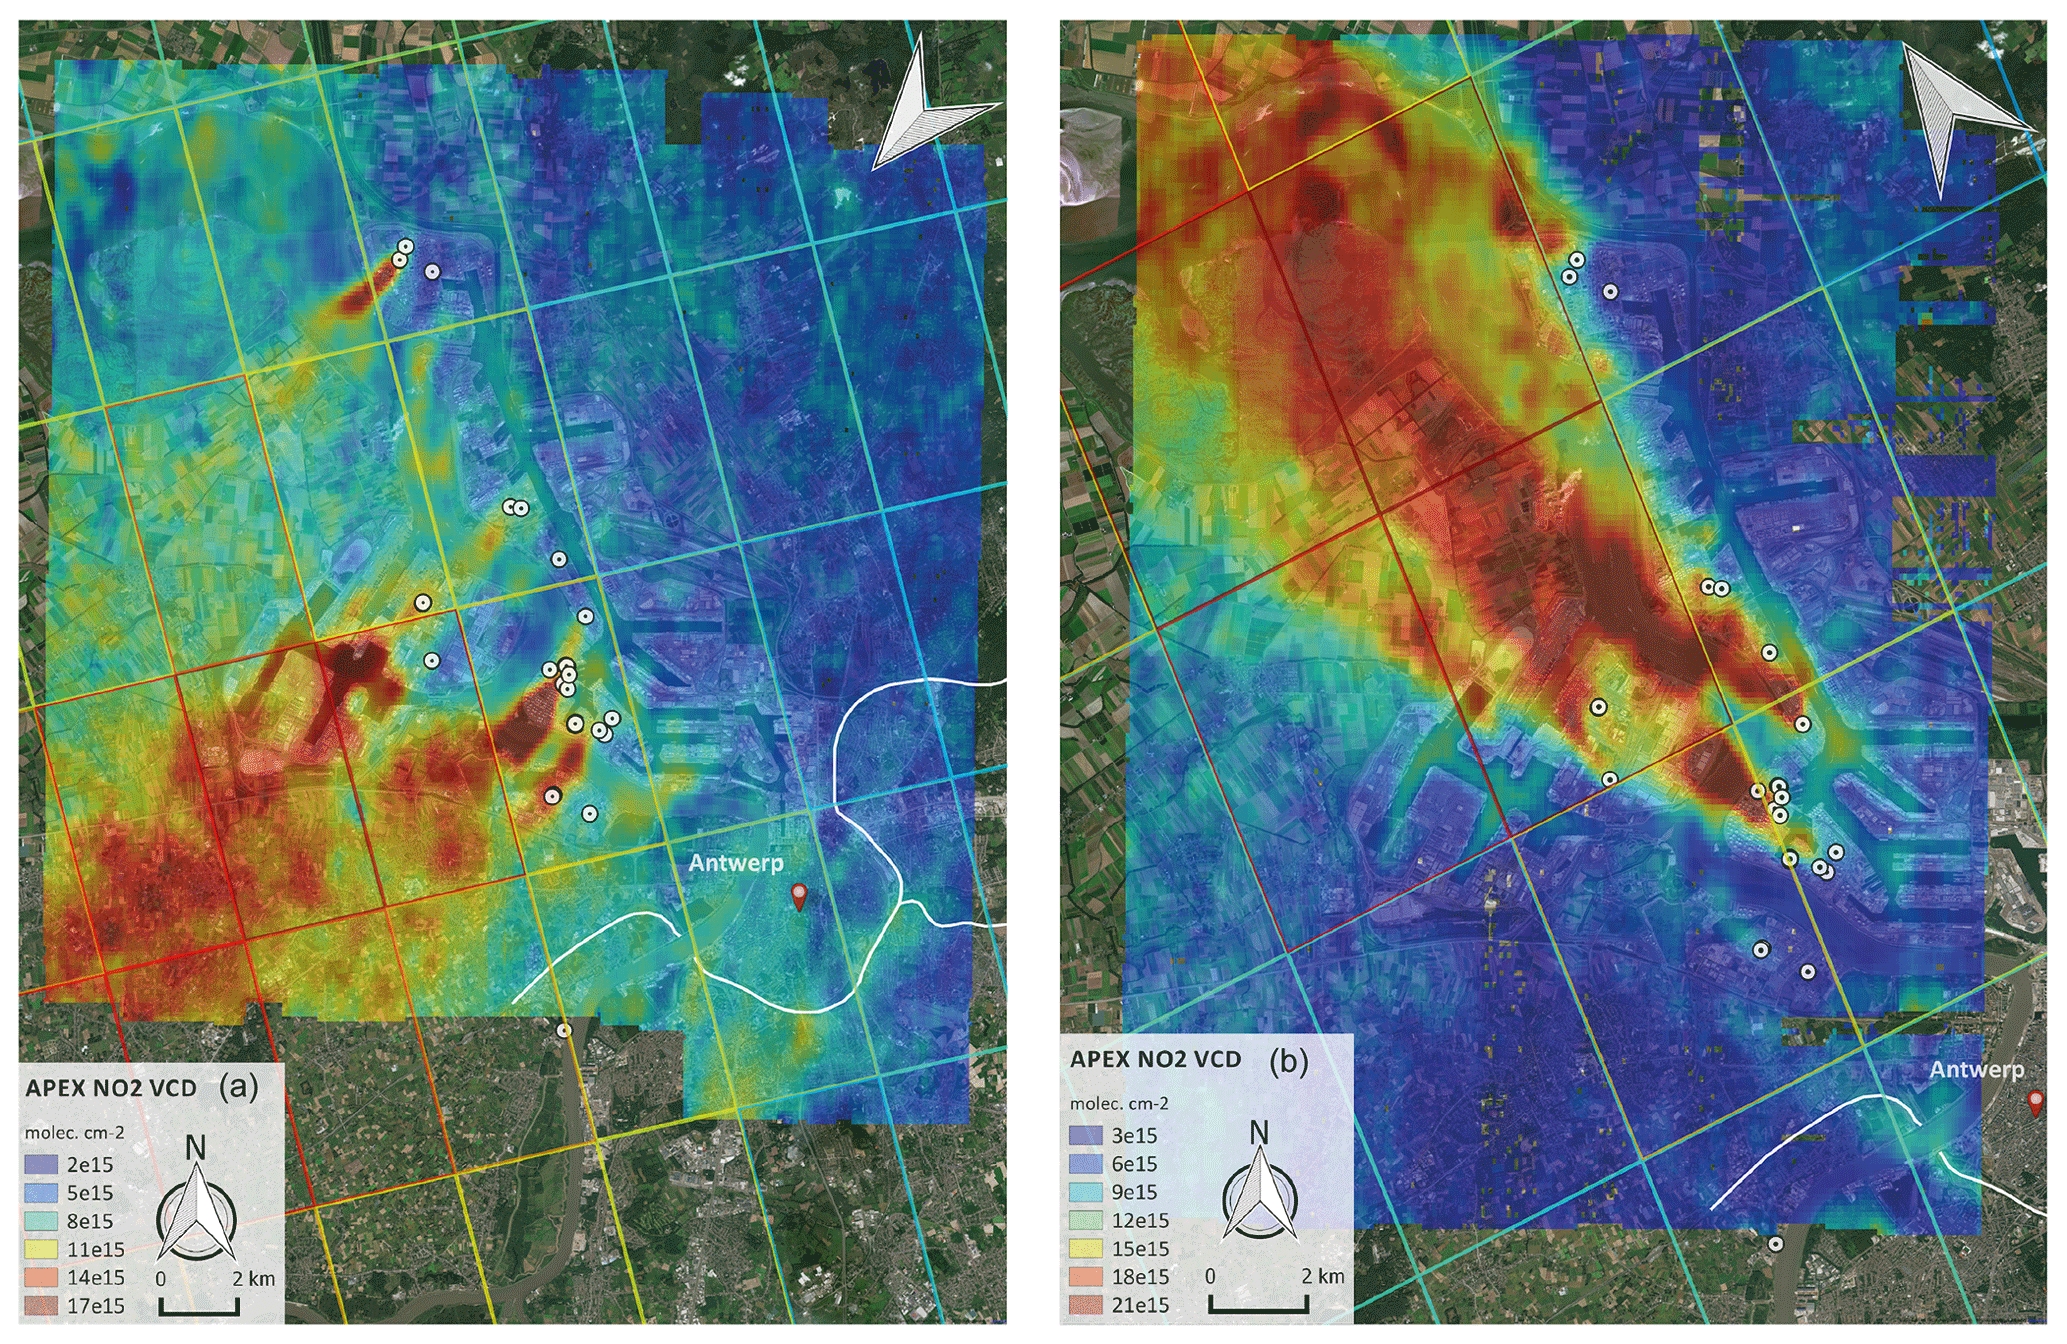
Figure 6Tropospheric NO2 VCD grids retrieved over Antwerp on (a) 27 June (Flight no. 2) and (b) 29 June (Flight no. 4) 2019. Note that different colour scales were applied in order to optimize the dynamic range of each data set. White dots indicate the point sources, emitting more than 10 kg of NOx per hour, according to the emission inventory (2017) of the Belgian Interregional Environment Agency. Line sources such as the key highways and city ring road are indicated by white lines. Coinciding TROPOMI tropospheric NO2 VCD retrievals are overlain as colour-coded polygons. White wind vectors indicate the surface wind, averaged over the APEX acquisition time, as provided in Table 1 (© Google Maps).
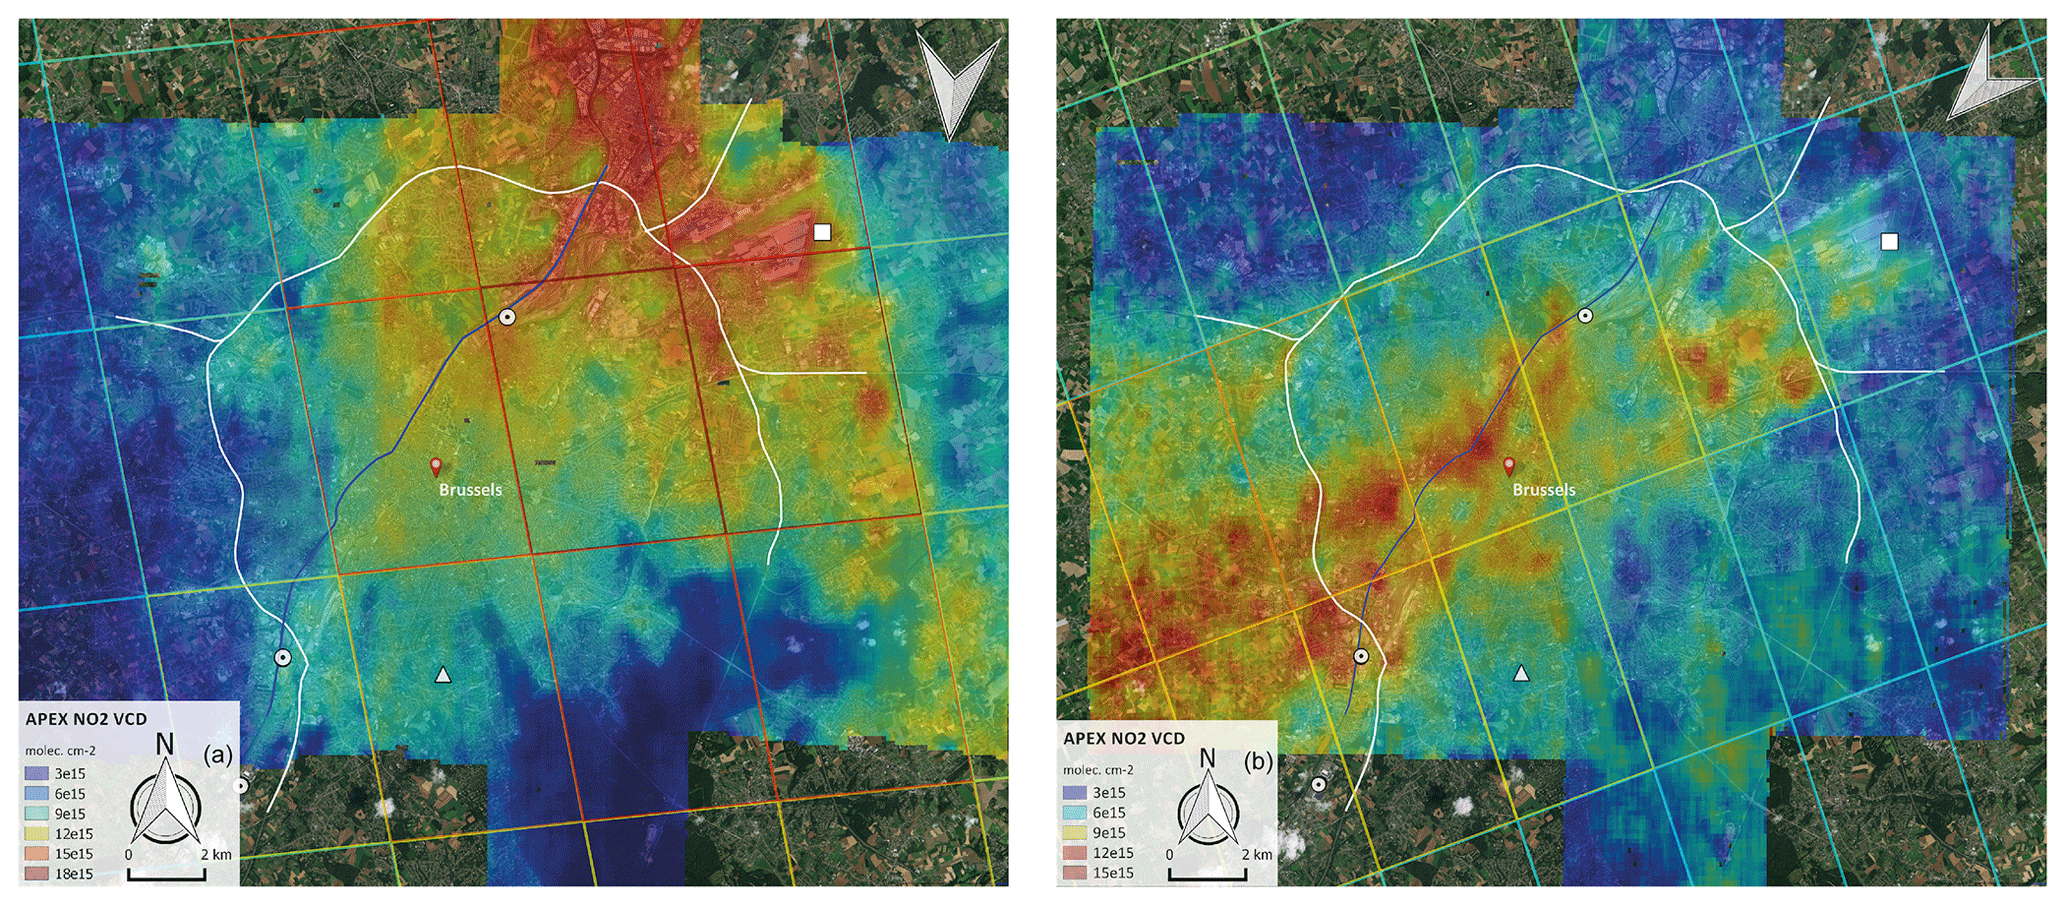
Figure 7Tropospheric NO2 VCD grids retrieved over Brussels on (a) 26 June (Flight no. 1) and (b) 28 June (Flight no. 3) 2019. Note that different colour scales were applied in order to optimize the dynamic range of each data set. White dots indicate the point sources, emitting more than 10 kg of NOx per hour, according to the emission inventory (2017) of the Belgian Interregional Environment Agency. The white triangle and white square indicate the location of the Uccle MAX-DOAS station and the international airport, respectively. Line sources such as the key highways and city ring road are indicated by white lines. Coinciding TROPOMI tropospheric NO2 VCD retrievals are overlain as colour-coded polygons. White wind vectors indicate the surface wind, averaged over the APEX acquisition time, as provided in Table 1 (© Google Maps).
The spatial resolution of the APEX retrievals allows us to reveal the urban fine-scale NO2 horizontal variability and to resolve individual emission sources. Strong patterns of enhanced NO2 can be discerned and linked to the key point and line sources. The maps reveal that the NO2 field is highly variable in urban areas in both space and time. The NO2 VCDs retrieved by APEX range between 1 and 40 × 1015 molec cm−2 in Antwerp with an average of 7.6 ± 3.8 × 10¹⁵ molec cm−2 for Flight no. 2 and 9.9 ± 6.1 × 10¹⁵ molec cm−2 for Flight no. 4. In Antwerp, the anthropogenic emissions are mainly related to industrial activities in the harbour. Some fine-scale plumes from individual stacks can be observed, while clusters of stacks contribute together to larger plumes. The observed plumes, narrow and confined close to their sources, are transported downwind for several tens of kilometres, as can also be observed in the TROPOMI retrievals (see Fig. 1). The primary emitted pollutant is NO, which is typically oxidized to NO2 after entering the atmosphere. Further downwind, the NO2 mixes and accumulates in the PBL and the plumes get more dispersed. Part of the emissions can also be related to traffic: increased values can be observed in the city centre of Antwerp as well as along and downwind from the ring road (R1) and junctions with the key highways E313 in the east and E19 in the west. Note that the main emission sources are largely the same as observed during previous APEX flights over Antwerp, as discussed in Tack et al. (2017).
Although 29 June is a Saturday, the NO2 VCDs observed over the Antwerp harbour are slightly higher than on 27 June, both in the APEX and TROPOMI data. The prevailing emissions in Antwerp from petrochemical industry are expected to be rather constant in contrast to traffic emissions, but meteorology, for example, a more stagnant wind speed (3.7 m s−1 on 27 June and 2.3 m s−1 on 29 June, on average), and other factors that can potentially increase the lifetime of NOx, might explain the slight NO2 VCD increase observed on 29 June. However, when averaging the NO2 levels for the whole of Belgium, TROPOMI observes a slightly lower tropospheric NO2 VCD on 29 June (3.3 ± 1.2 × 10¹⁵ molec cm−2) than on 27 June (3.8 ± 1.3 × 10¹⁵ molec cm−2).
Note that some instrumental problems were encountered during the flight on 29 June. The APEX instrument switched to an unstable state during the acquisition of the first three flight lines in the east over the city centre of Antwerp, hampering the application of the retrieval algorithm on the corrupted spectra. The problem also occurred in some parts of flight lines 4 to 6 explaining the gaps in the data set. The reasons for these instrument instabilities are currently unidentified.
The observed NO2 VCDs range between 1 and 24 × 1015 molec cm−2 in Brussels with an average of 9.8 ± 4.2 × 10¹⁵ molec cm−2 for Flight no. 1 and 6.9 ± 2.8 × 10¹⁵ molec cm−2 for Flight no. 3. Here, the observed anthropogenic emissions are predominantly related to traffic and relatively small-scale industrial activity along the Brussels Canal, indicated by the blue line. In this area, a considerable contribution is expected to come from a waste-to-energy plant. The station is indicated by the white dot in the north of the data set and is emitting approximately 15 kg of NOx per hour according to the emission inventory (2017). For Flight no. 1, a plume originating from the Antwerp harbour and transported over the eastern part of Brussels can be observed in both the TROPOMI and APEX data. A large city plume, moving downwind in southwestern direction, can be observed in the Flight no. 3 data, as well as hotspots near the Brussels city centre and increased NO2 levels along the R0 Brussels ring road and the junctions with the key highways (E40 and E19). The R0 is one of the busiest highways in Belgium with traffic volumes of more than 70 000 cars d−1. NO2 hotspots can also be observed in the area of the Brussels international airport in the northeast (indicated by a white square in Fig. 7), related to aircraft and airport traffic operations.
5.2 Assessment of the TROPOMI NO2 product
5.2.1 Error budget – precision assessment
The TROPOMI L2 tropospheric NO2 product (OFFL v1.03.01) has been assessed based on independent high-resolution airborne APEX data, acquired over the target areas within 1 h of the S-5P overpass time. The mission accuracy and precision requirements for the TROPOMI L2 products have been formulated by the L2 Quality Working Group (QWG) and agreed on with the S-5P Mission Advisory Group (MAG). The accuracy of the tropospheric NO2 VCD product is targeted to be around 25 %–50 %, with a precision of 0.7 × 10¹⁵ molec cm−2 (Fehr, 2016).
The TROPOMI NO2 processing chain provides a realistic error budget. The total TROPOMI tropospheric NO2 VCD error, σVCDTROPO, is driven by (1) error propagation of the slant column errors, (2) errors associated with the separation of the stratospheric and tropospheric contributions, and (3) tropospheric AMF errors (van Geffen et al., 2018). The overall error in the TROPOMI tropospheric NO2 columns can be quantified based on Boersma et al. (2004):
The overall error variance is provided for each retrieval in the L2 product and is fully described in van Geffen et al. (2018). Analysis of the TROPOMI L2 NO2 VCDs, coinciding with the APEX data sets, reveals a mean VCD and absolute error of 6.8 (VCDTROPO) and 7.9 (VCDTROPO−CRE) ± 2.1 × 10¹⁵ molec cm−2 or a relative error of approximately 31 % and 27 %, respectively. The maximum relative error observed was 42 %. In general, larger relative errors are seen mostly over semi-background areas, reflecting mainly uncertainties in the slant and stratospheric column retrieval. Over polluted regions, the absolute errors increase, while the relative errors drop. Here, the retrievals are largely dominated by systematic errors in the computation of the AMFs. These are related to uncertainties in the assumptions made for the RTM parameters with respect to the true atmospheric state and are dominated by the NO2 profile shape, surface albedo, and cloud parameters (cloud fraction and height). Uncertainties propagated due to the NO2 profile assumptions and surface albedo have been discussed in Sect. 4.3. The effect of clouds, however, was not considered in this study, as data acquisition took place in mostly clear-sky conditions.
The TROPOMI precision is targeted to be better than 7.0 × 10¹⁴ molec cm−2 (Fehr, 2016). We looked into the fitting error, σSCDTROPOi, as a proxy to assess compliance with the mission precision requirement, as instrument noise is the dominant source of errors in the spectral fitting of TROPOMI level-1b spectra. Averaged over the four campaign days over Belgium, the precision is estimated to be 5.6 ± 0.4 × 10¹⁴ molec cm−2 and thus well within the requirement. This is consistent with an assessment performed over the Pacific Ocean and discussed in van Geffen et al. (2018), reporting precision levels between 5.0 and 6.0 × 10¹⁴ molec cm−2. Note that the TROPOMI noise level is approximately 30 % lower than the initial OMI noise level (as measured in 2005). This is due to the higher radiometric SNR of TROPOMI, which is around 1400–1500 (∼ 900–1000 for OMI) for an individual level-1b spectrum in the 400–500 nm range (van Geffen et al., 2018).
A full error budget for APEX NO2 VCD retrievals has been discussed in Sect. 4.6 in Tack et al. (2017). Like for TROPOMI, the overall error on the retrieved APEX NO2 VCDs, σVCDAPEX, is dominated by uncertainties related to the DOAS fit and AMF computation. The error on the retrieved differential slant column density (DSCD) or the slant error, σDSCDAPEX, estimated from the fit residuals in the DOAS analysis, is 3.1 × 10¹⁵ molec cm−2, on average. The error on the AMF computation, σAMFAPEX, depends on uncertainties in the assumption of the RTM inputs with respect to the true atmospheric state and is dominated by systematic errors in the surface albedo, NO2 profile, and aerosol parameters. An estimate of approximately 15 % is obtained for σAMFAPEX, following the detailed error budget described in Sect. 4.6 in Tack et al. (2017). Due to the negligible spatiotemporal variability of the stratospheric NO2 field in the time between the acquisition of the reference spectrum and the measurements, i.e. less than 1 h, the stratospheric NO2 contribution to the signal is expected to cancel out in the case of APEX retrievals and is consequently not treated as a key error source. On the other hand, the error originating from the estimation of the NO2 residual amount in the reference spectrum, σSCDref, can be considerable as discussed in Tack et al. (2017). SCDref is derived from co-located mobile-DOAS measurements and the error can be up to 1.8 × 10¹⁵ molec cm−2. The overall error in the APEX tropospheric NO2 columns can be quantified based on the following error propagation method:
Analysis of all coincident APEX NO2 VCD reference measurements for the ensemble of the four flights reveals a mean VCD and absolute error of 8.0 ± 2.3 × 10¹⁵ molec cm−2 or a relative error of approximately 29 %. This is consistent with the retrieval errors found during previous APEX campaigns, e.g. BUMBA (Tack et al., 2017) and AROMAPEX (Tack et al., 2019), and is also in line with the typical error found for similar airborne hyperspectral imaging instruments (Tack et al., 2019). Spatiotemporal coinciding TROPOMI and APEX NO2 VCD grids are quantitatively compared in Sect. 5.2.2 by spatial averaging of all APEX NO2 VCDs within each TROPOMI pixel footprint, resulting in a decrease of the overall random uncertainty on APEX retrievals. As discussed in Sect. 3.2, the average APEX noise level is expected to decrease from ∼ 2.6 × 10¹⁵ to ∼ 5.0 × 10¹³ molec cm−2 after spatial aggregation. Propagating this into the mean APEX VCD error, σVCDAPEX is expected to be reduced from 2.3 to 1.6 × 10¹⁵ molec cm−2 or a reduction of the relative error from ∼ 29 % to ∼ 21 % on the retrieved APEX NO2 VCDs. The noise reduction has the biggest impact on retrievals over (urban) background areas, as the errors here are dominated by uncertainties in the slant column retrieval.
5.2.2 Comparison of coincident NO2 VCDs – accuracy assessment
Satellite products can be optimally assessed based on airborne observations as a large amount of satellite pixels can be fully mapped at high resolution in a relatively short time interval, reducing the impact of spatiotemporal mismatches. The spatiotemporal coinciding TROPOMI and APEX NO2 VCD grids are quantitatively compared by spatial averaging of all APEX NO2 VCDs within each TROPOMI pixel footprint. The latter is defined by the pixel corner coordinates provided in the L2 product, while the APEX VCD locations are defined by their respective pixel centre coordinates. Note that TROPOMI pixels are only considered in the further analysis when they are covered for more than 50 % by APEX pixels in order to reduce undersampling. Prior to the comparison, TROPOMI retrievals were checked based on their quality assurance (QA) value. Only pixels with a QA value equal to or larger than 0.75 were selected, removing cloudy pixels (cloud radiance fraction > 0.5) and erroneous retrievals (van Geffen et al., 2018). Note that all TROPOMI retrievals over the target scenes were compliant with the QA threshold.
In Appendix A, tropospheric NO2 VCD statistics for coincident TROPOMI and APEX pixels are provided for Flight nos. 1 to 4 in Tables A1 to A4, respectively. In total, 58 TROPOMI pixels were assessed. For each TROPOMI pixel acquired over the target area, the tropospheric NO2 VCD is provided for both the TM5-MP-based (NO2 VCDTROPO) and CAMS-based (NO2 VCDTROPO−CRE) product. On average, NO2 VCDTROPO is 6.8 × 10¹⁵ molec cm−2 and NO2 VCDTROPO−CRE is 7.9 × 10¹⁵ molec cm−2. For the APEX NO2 retrievals, the mean and median NO2 VCD are provided for each TROPOMI pixel, as well as the SD, relative SD or coefficient of variation (RSD), and minimum and maximum NO2 VCD. On average, over all flights, NO2 VCDAPEX is 8.0 × 10¹⁵ molec cm−2, which is in good agreement with the average CAMS-based TROPOMI NO2 VCDs. The SD and RSD are on average 2.3 × 10¹⁵ molec cm−2 or 29 %, respectively. They provide a measure for the subpixel variability or spatial heterogeneity of the NO2 field within a TROPOMI pixel, which is studied in more detail in Sect. 6. Highest concentrations are observed in the plume over the Antwerp harbour with maxima of up to 40 × 1015 molec cm−2.
Corresponding scatter plots and linear regression analyses of co-located TROPOMI and averaged APEX NO2 VCD retrievals are provided in Fig. 8 for the ensemble of all four data sets. In Fig. 8a, TROPOMI pixels are only included in the comparison when they are covered for more than 50 % by APEX pixels, in order to reduce undersampling. However, for reference, linear regression analysis is also applied to all TROPOMI pixels having coincident APEX pixels and is provided in Fig. 8b. The data points are colour coded based on the number of APEX pixels averaged within a particular TROPOMI pixel. Vertical error bars indicate the overall error in NO2 VCDTROPO (Eq. 1), while the horizontal whiskers represent the error in NO2 VCDAPEX retrievals (Eq. 2), averaged over all APEX pixels coinciding with a particular TROPOMI pixel. Regression lines are colour coded grey and black for the comparison of NO2 VCDAPEX with NO2 VCDTROPO, and NO2 VCDTROPO−CRE, respectively. Note that data points are shown for the comparison of NO2 VCDAPEX with VCDTROPO−CRE only. Corresponding correlation statistics are provided in Table 4 for each individual data set, as well as for the ensemble of the four data sets.
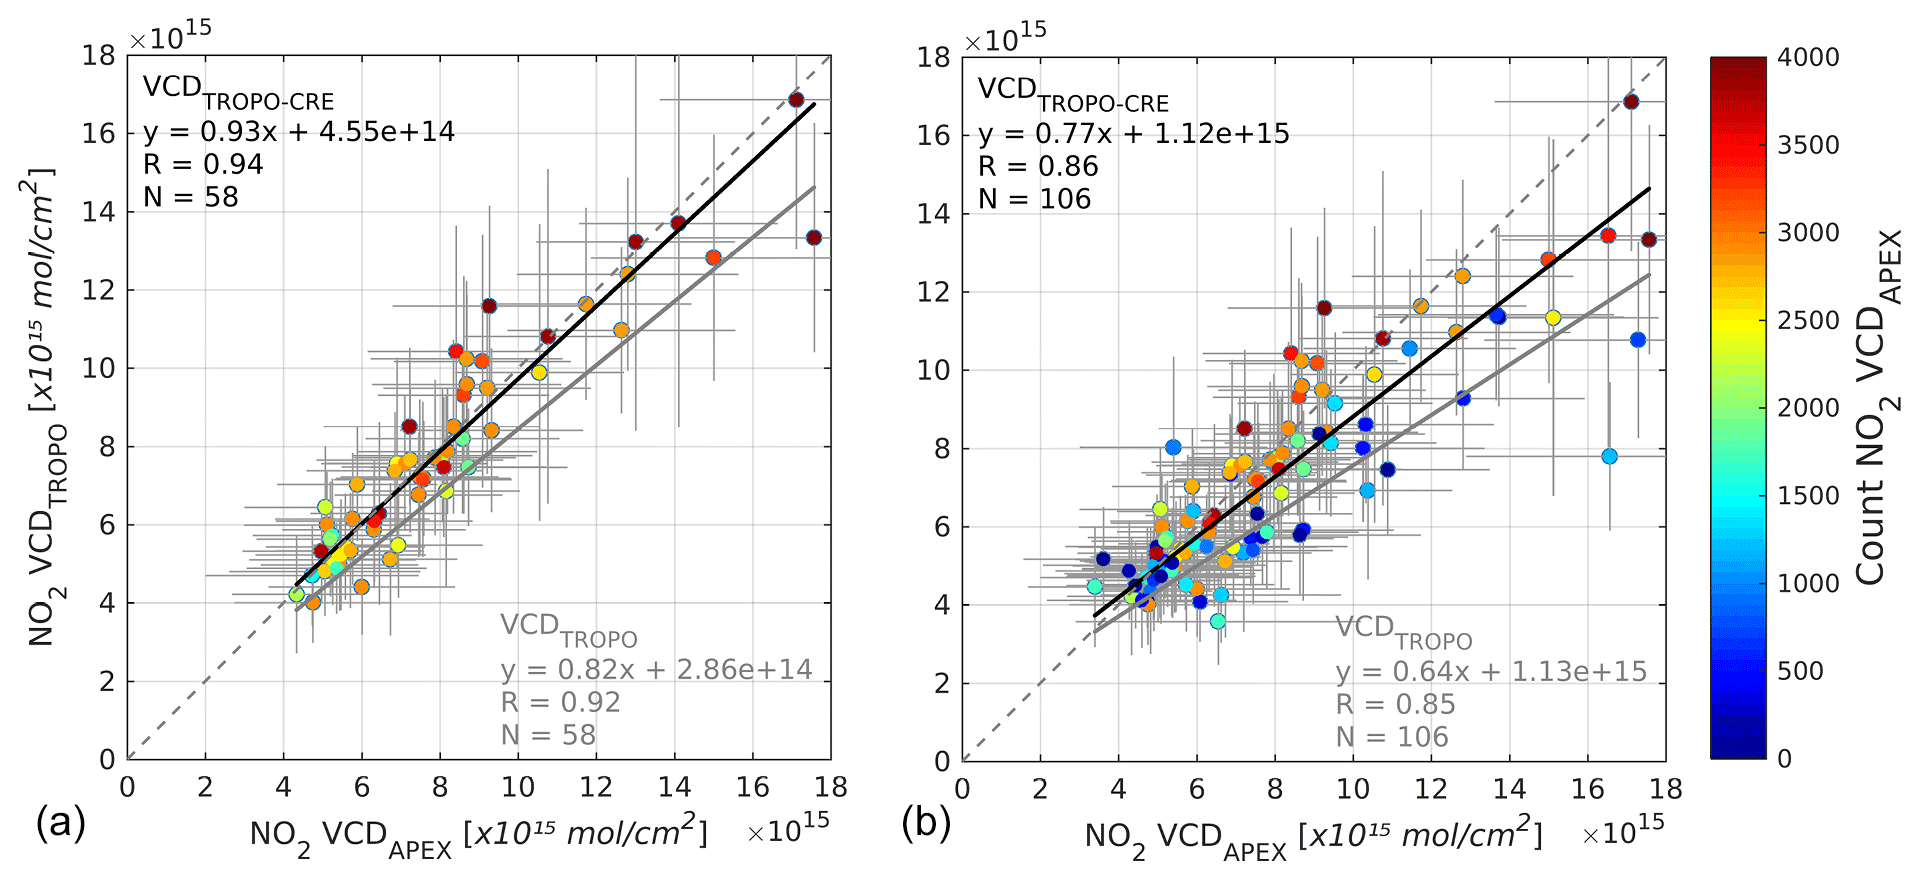
Figure 8Scatter plots and linear regression analyses of co-located TROPOMI and averaged APEX NO2 VCD retrievals for the data sets acquired on 26–29 June 2019. Regression lines and statistics are colour coded grey and black for the comparison of NO2 VCDAPEX with NO2 VCDTROPO and VCDTROPO−CRE, respectively. Note that data points are shown for the comparison of NO2 VCDAPEX with VCDTROPO−CRE only. Vertical error bars indicate the overall errors in NO2 VCDTROPO, while the horizontal whiskers represent the errors in NO2 VCDAPEX retrievals, averaged over all APEX pixels within the footprint of a co-located TROPOMI pixel. Data points are colour coded based on the number of APEX pixels averaged within a TROPOMI pixel. In panel (a), TROPOMI pixels are only included in the comparison when they are covered for more than 50 % by APEX pixels in order to avoid undersampling, while in panel (b), as a reference, all TROPOMI pixels having coincident APEX pixels are analysed.
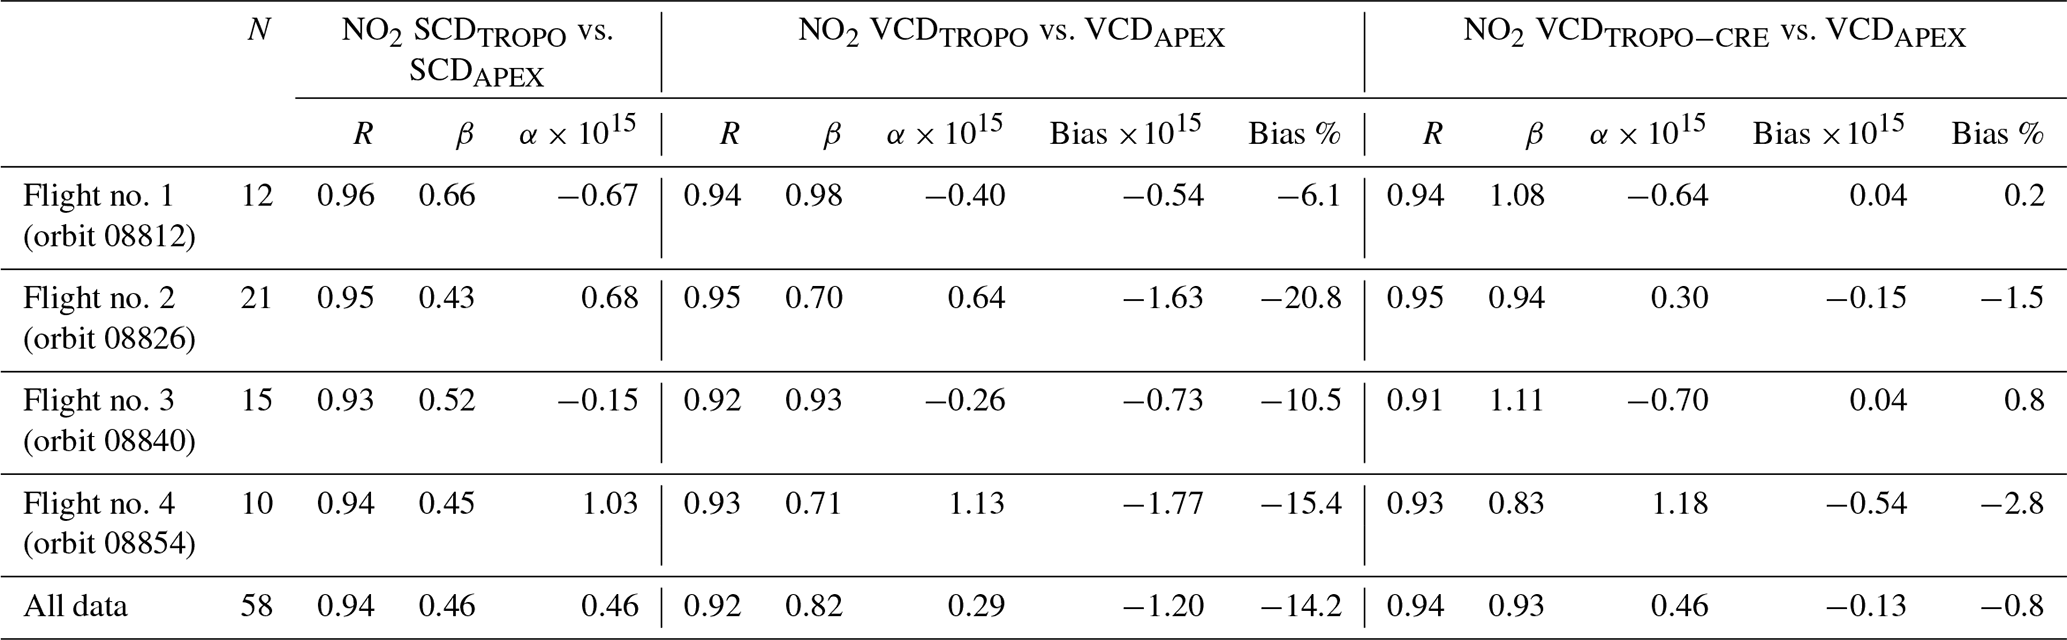
Table 4Correlation statistics between coincident APEX and TROPOMI NO2 SCD and VCD products (OFFL v1.03.01) for the different flights. The last row (“All data”) considers all four data sets together. TROPOMI pixels are only compared with the average of all APEX pixels within the footprint when they are covered for more than 50 % by APEX pixels. The NO2 VCD bias is defined by VCDTROPO(−CRE) − VCDAPEX and NO2 VCD relative bias is defined by (VCDTROPO(−CRE) − VCDAPEX) ∕ VCDAPEX ⋅ 100. Alpha (α) and beta (β) are the intercept and slope of the linear regression fit.
Overall, for the ensemble of the four flights, good agreement can be observed for both low and high retrievals. The standard TROPOMI NO2 VCD product is well correlated (R = 0.92) and has a slope and intercept of 0.82 and 0.3 × 10¹⁵ molec cm−2 with respect to APEX NO2 reference observations. The observed negative bias is expected to be due to a combination of the limited spatial resolution of a priori input for the AMF computation, i.e. NO2 profiles at 1∘ from the TM5-MP CTM and surface albedo at 0.5∘ from the OMI LER. When replacing the TM5-MP a priori NO2 profiles by CAMS-based profiles, the correlation coefficient increases to 0.94 and the slope increases by 11 % to 0.93. Correcting for the estimated systematic bias of 0.005 to 0.010 in the TROPOMI/OMI LER in the case of clear-sky days, as discussed in Sect. 4.3.2, would scale up the TROPOMI VCD retrievals by 5 % to 10 %. In Fig. 8b, a less favourable slope (0.77) and a reduced correlation (R = 0.86) can be observed due to the effect of undersampling when considering all covered TROPOMI pixels. When considering only TROPOMI pixels which are fully covered by APEX observations (only 31 instead of 58 pixels), the statistics are of the same order as when applying the condition that TROPOMI pixels should be covered at least half by APEX observations. This assures us that the data set based on the latter condition is representative while increasing the amount of TROPOMI pixels that can be assessed.
Note that Table 4 also shows correlation statistics for the comparison of the tropospheric NO2 slant column product, which has been compared in the same way as the VCDs. The slope is around 0.5 as the APEX airborne retrievals have a higher sensitivity to the NO2 layer than the TROPOMI retrievals, resulting in larger SCDs. This is properly accounted for by the AMFs when converting to the vertical columns. When looking at the scatter, the SCDs exhibit a slightly larger correlation coefficient and lower root mean square error (RMSE), i.e. 7.8 and 8.1 × 10¹⁴ molec cm−2, for the comparison of SCDs and VCDs, respectively. As discussed in Sect. 4.3.2, this could be related to noise introduced in the VCD retrieval by the difference between the effective albedo variability and the albedo from the coarse OMI LER climatology used in the computation of the AMFs.
The NO2 VCD bias, defined by VCDTROPO(−CRE) − VCDAPEX, and NO2 VCD relative bias, defined by (VCDTROPO(−CRE) − VCDAPEX) ∕ VCDAPEX ⋅ 100, have been calculated as well for the ensemble of the four data sets and are provided in Fig. 9 and Table 4. Data points and statistics are colour coded grey and black for the comparison of TM5-MP-based and CAMS-based TROPOMI NO2 VCDs with APEX NO2 VCDs, respectively. On average, the bias is −1.2 ± 1.2 × 10¹⁵ molec cm−2 or −14 ± 12 % for the difference between the standard TROPOMI NO2 VCD product and APEX. The bias is substantially reduced when replacing the coarse TM5-MP a priori NO2 profiles by CAMS-based profiles, which is −0.1 ± 1.0 × 10¹⁵ molec cm−2 or −1 ± 12 %. When the absolute value of the difference is taken, the bias is 1.3 × 10¹⁵ molec cm−2 or 16 %, and 0.7 × 10¹⁵ molec cm−2 or 9 % on average, when comparing VCDAPEX with VCDTROPO and VCDTROPO−CRE, respectively. In general, a stronger bias can be observed for high VCDs, related to the larger uncertainties on both the APEX and TROPOMI retrievals. Both sets of retrievals are well within the mission accuracy requirement of a maximum bias of 25 %–50 % for the TROPOMI tropospheric NO2 product for all individual compared pixels. These thresholds are indicated by the dashed red (25 %) and full (50 %) horizontal lines in Fig. 9b. Nevertheless, the standard tropospheric NO2 product is clearly biased low over polluted areas when compared to reference observations at higher resolution and this is consistent with the findings in other studies (Griffin et al., 2019; Ialongo et al., 2020; Zhao et al., 2020; Dimitropoulou et al., 2020; Judd et al., 2020; Verhoelst et al., 2021).
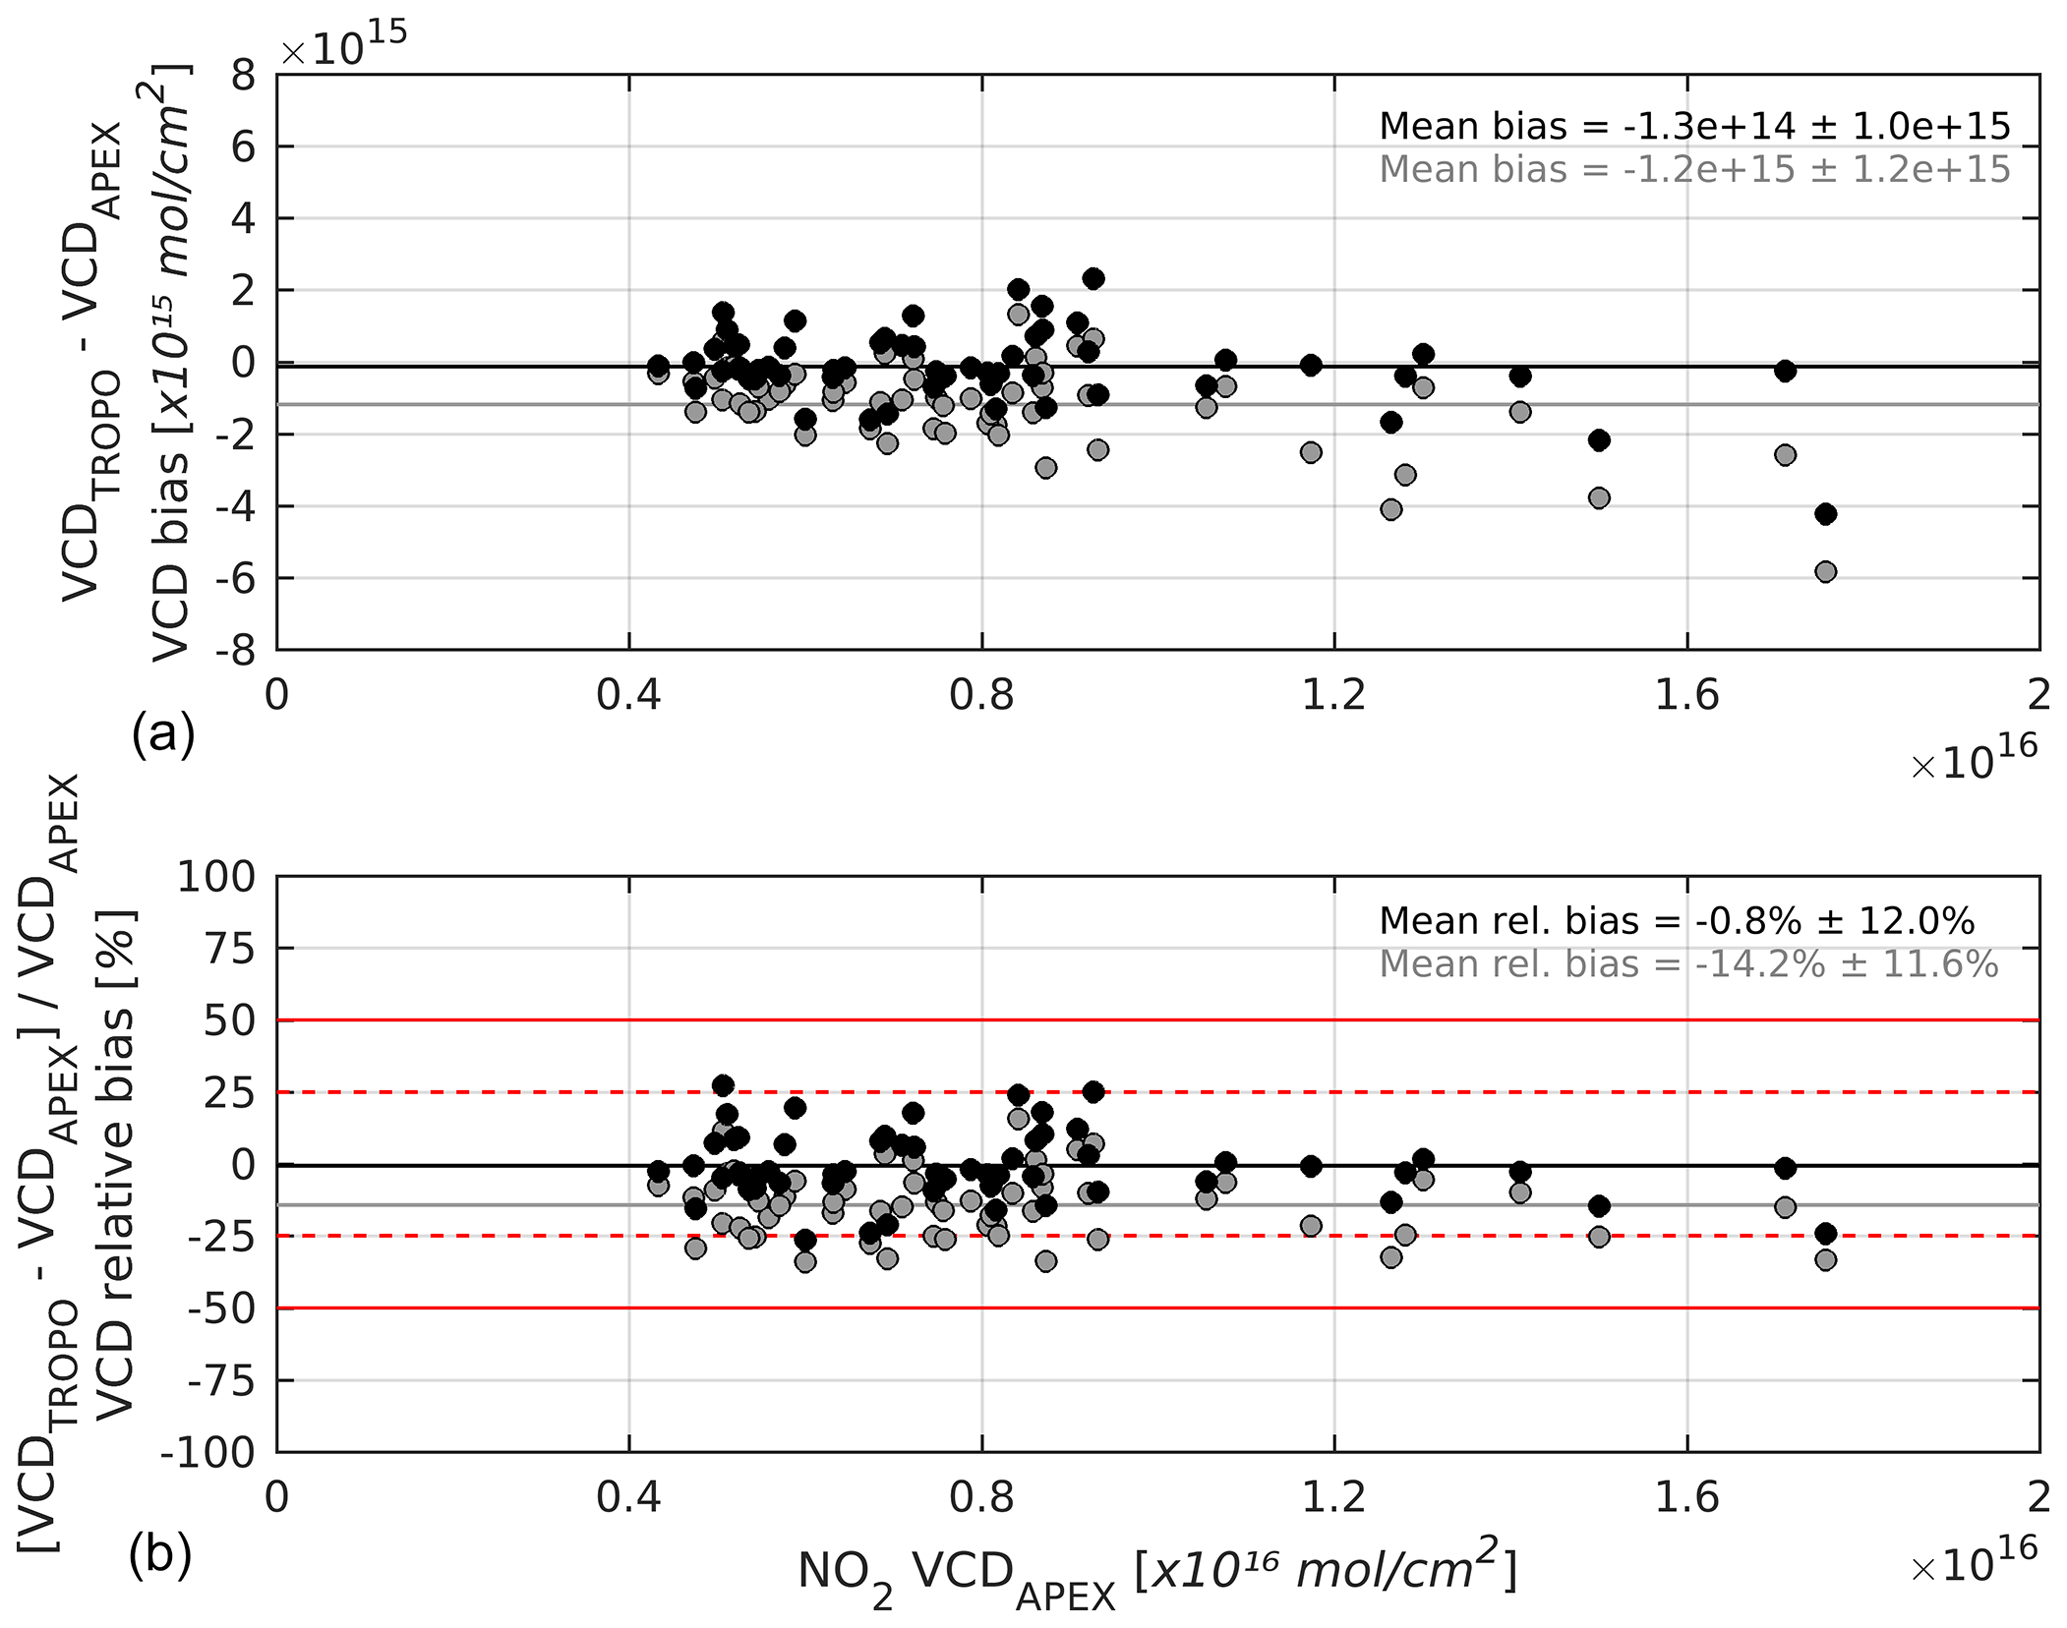
Figure 9(a) NO2 VCD bias (VCDTROPO(−CRE) − VCDAPEX) and (b) NO2 VCD relative bias ((VCDTROPO(−CRE) − VCDAPEX) ∕ VCDAPEX ⋅ 100) for the ensemble of the four data sets, acquired during the S5PVAL-BE campaign. Data points and statistics are colour coded grey and black for the comparison of TM5-MP-based and CAMS-based TROPOMI VCD retrievals with APEX, respectively, in analogy to Fig. 8. The grey and black horizontal lines represent the average (relative) bias. The dashed red and full horizontal lines represent the 25 % and 50 % bias between coincident TROPOMI and APEX NO2 VCDs, respectively.
In addition to the limitations of a priori assumptions in the AMF computation, studied in Sect. 4.3, the remaining disagreement between the data sets can be potentially attributed to the following:
-
There is disagreement due to different sensitivities to the NO2 layer due to instrumental and algorithmic differences.
-
There is disagreement due to differences in observation geometry and height. Note that APEX observations have reduced sensitivity to the NO2 above the aircraft altitude of 6.5 km (see Fig. 3b), while the TROPOMI NO2 VCD is defined up to the tropopause (approximately 16 km on the campaign days). The TM5-MP NO2 partial columns between 6.5 and 16 km range between 2.8 and 4.7 × 10¹⁴ molec cm−2. Retrieved APEX SCDs are the sum of the measured differential slant column and the residual amount of NO2 in a reference spectrum acquired over a clean area during the same flight. SCDref is derived from a tropospheric VCD, estimated in this work from mobile DOAS measurements. In principle, SCDref implicitly contains a contribution from the upper troposphere. However, also these measurements have a reduced sensitivity to the upper troposphere. In the event that there are temporal or spatial changes in the NO2 field in the upper troposphere between the reference area and observed area, this should be implicitly measured in the DSCD. As the amount of NO2 in the upper troposphere appears to be small compared to the total column over polluted sites, and as the APEX retrievals still have some sensitivity to it, we expect any impact on the comparisons to be minimal.
-
There is disagreement due to temporal differences in the observation of a dynamic NO2 field. Concerning the latter point, APEX data were acquired over the target areas within 1 h of the S-5P overpass time. Nevertheless, the potential impact of temporal NO2 variability due to the time offset between the acquisition of the APEX and TROPOMI data sets has been investigated. In Fig. 10a, the same scatter plot and linear regression analysis is shown as in Fig. 8a, however, with the data points colour coded based on the absolute time offset between the TROPOMI overpass and the mean acquisition time of APEX retrievals within the pixel. The data set does not exhibit a clear dependency on increasing time offset. In Fig. 10b, the observed NO2 VCD bias, defined by VCDTROPO−CRE − VCDAPEX, has been plotted against the absolute time offset. The data set seems to be uncorrelated with a correlation coefficient of 0.02. Relatively low and high biases occur at both small and large time offsets, which is pointing at a low impact of the temporal NO2 variability under the current conditions.
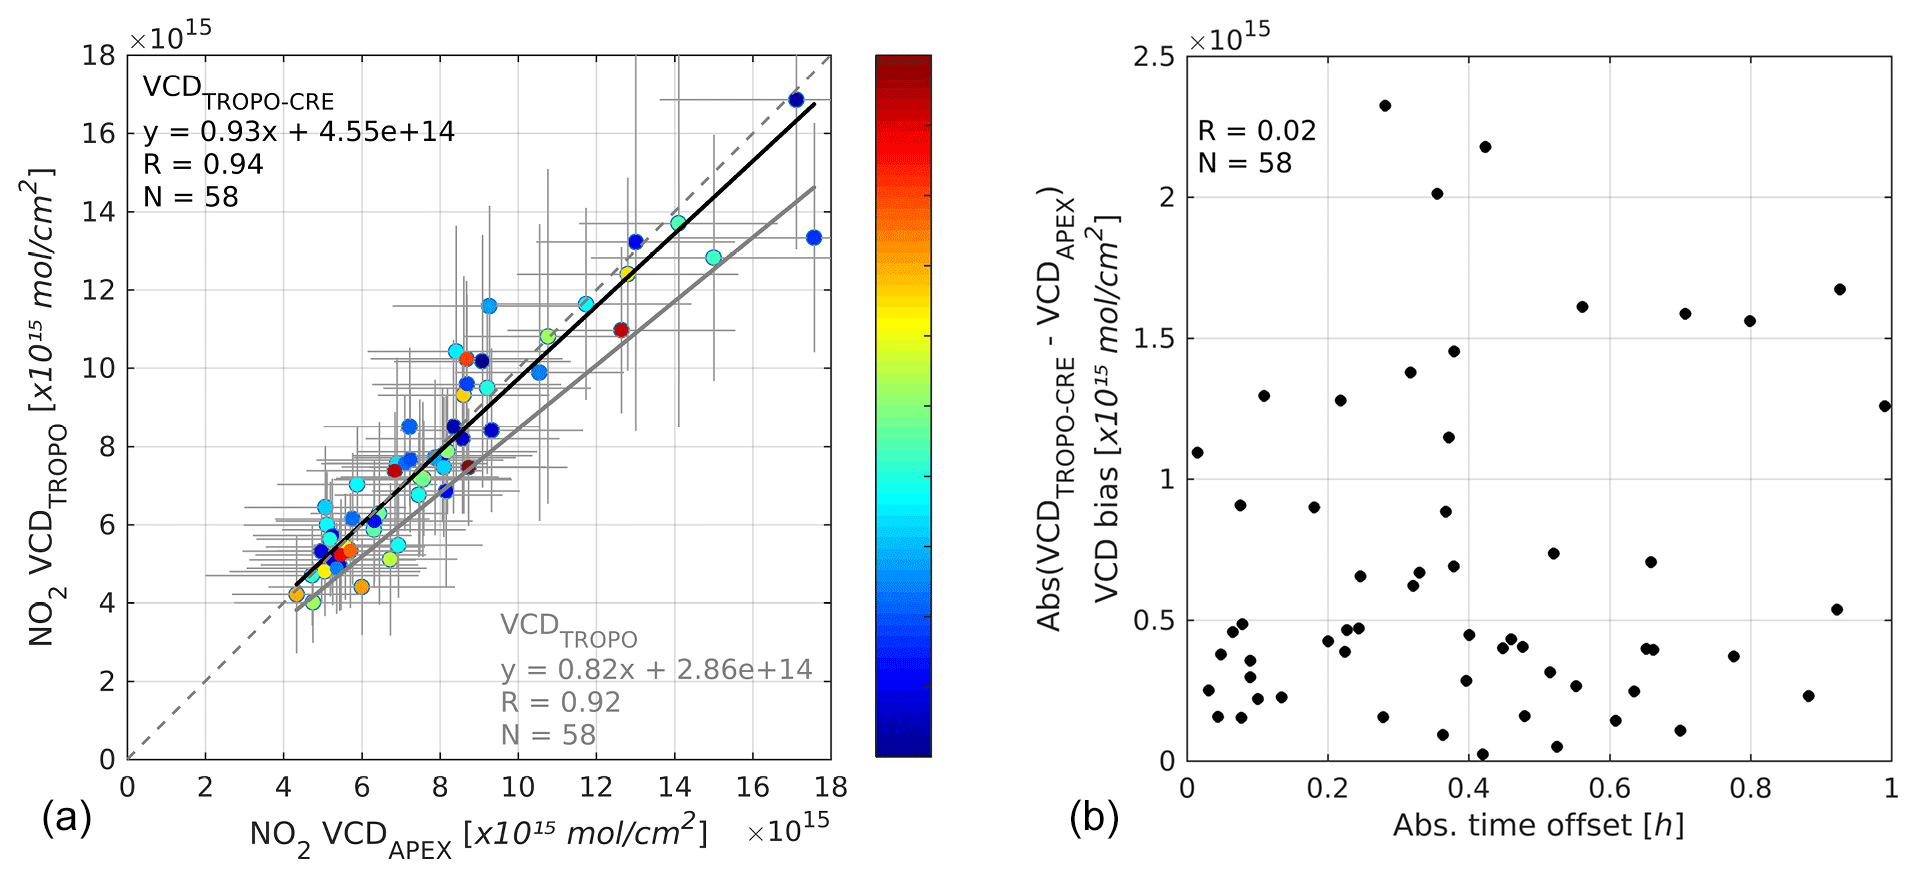
Figure 10(a) Same as Fig. 8a, but data points are colour coded based on the absolute time offset between TROPOMI overpass and mean acquisition time of APEX retrievals within the TROPOMI pixel, and in panel (b) the observed NO2 VCD bias, defined by VCDTROPO−CRE − VCDAPEX, has been plotted against the absolute time offset.
Both on 26 and 29 June 2019, there were two early afternoon S-5P overpasses over Belgium with a time difference between the two orbits of approximately 100 min. To assess the impact of the temporal NO2 variability, the changes in the NO2 field have been studied in the subsequent overpasses for the Belgian domain. Prior to the comparison, the data sets have been regridded to a common grid of size 0.1∘. On 26 June, the absolute value of the differences observed over the full Belgian domain was 3.8 ± 5.3 × 10¹⁴ molec cm−2 or 12 ± 10 %, on average. A maximum difference of 5.8 × 10¹⁵ molec cm−2 or 57 % was observed for a pixel over the harbour of Antwerp, most likely due to a combination of moving air masses in the key plumes and slight changes in the wind pattern. Additionally, the TROPOMI pixel footprints have different sizes and orientations which also has an effect when sampling the effective NO2 patterns and when regridding to the common grid size of 0.1∘. On 29 June, the absolute value of the differences observed was 3.6 ± 3.2 × 10¹⁴ molec cm−2 or 11 ± 8 %, on average, with a maximum of 2.0 × 10¹⁵ molec cm−2, again seen over the harbour of Antwerp.
When analysing the tropospheric NO2 VCD diurnal variation, retrieved from the Uccle MAX-DOAS station (50.8∘ N, 4.4∘ E; 100 ) for the four campaign days, we see a low variability during the merged APEX flight time (11:00–13:44 UTC) for Flight nos. 2 to 4 (see Fig. 11). The relative SD is lower than 10 %. However, during Flight no. 1, we observe a strong increase of the VCD from 1.5 to 2.9 × 10¹⁶ molec cm−2 and a RSD of 32 %. The instrument location is indicated by a white triangle in Fig. 7 and is pointed towards the Brussels city centre (35∘ N).
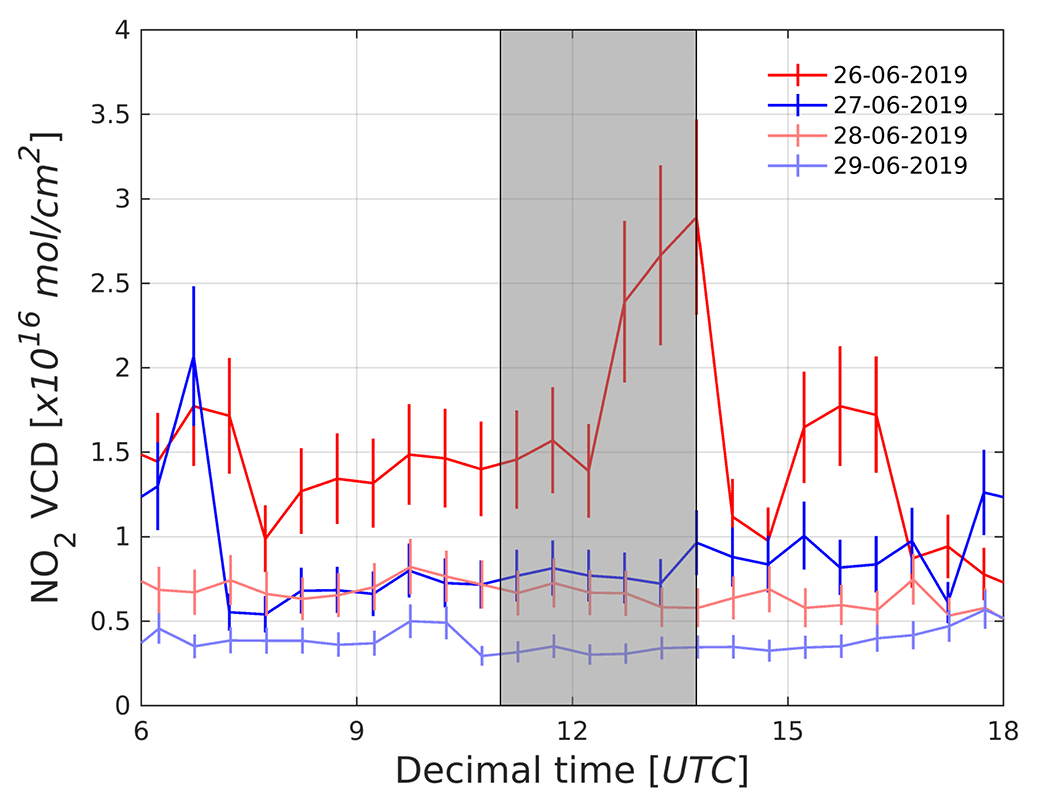
Figure 11Tropospheric NO2 VCD diurnal variation between 80∘ sunrise and sunset, retrieved from the Uccle MAX-DOAS station on 26–29 June 2019. The instrument is pointed towards the Brussels city centre (35∘ N). Vertical error bars indicate the NO2 VCD error for each retrieval. The grey zone indicates the merged APEX flight time (11:00–13:44 UTC) for 26 to 29 June.
For the flights over the Brussels region, we have also compared the TROPOMI and APEX NO2 VCD with the MAX-DOAS NO2 VCD at the time of overpass and results are provided in Table 5. The TROPOMI NO2 VCD is provided for the pixel in which the station resides for both the TM5-MP-based and CAMS-based products. The APEX NO2 VCD is provided for the average within the TROPOMI pixel footprint over the MAX-DOAS station and for the specific APEX pixel over the station. As the MAX-DOAS is performing elevation scans in a fixed azimuth direction (35∘ N), APEX observations are also averaged along this line of sight (LOS) in order to take into account the instrument directivity and in order to reduce potential mismatches due to differences in spatial representativity. In this case, however, temporal mismatches can occur as APEX pixels, acquired in different flight lines, are averaged. Based on the study of Dimitropoulou et al. (2020), the horizontal sensitivity of the MAX-DOAS is estimated to be on the order of 10 km for measurements in Brussels during summertime and in the visible wavelength range. Subsequently, APEX pixels are integrated along the LOS up to a distance of 10 km. MAX-DOAS observations are filtered based on the degrees of freedom which should be larger than 2. Secondly, the relative RMSE of the difference between measured and calculated differential slant column densities with respect to the zenith spectrum of each scan should be smaller than 15 % (Dimitropoulou et al., 2020). On 26 June, there was clearly a pollution event not seen over the station but further northeast along the MAX-DOAS LOS, as can be observed in the APEX NO2 VCD grid (see Figs. 7a and 11). When averaging the APEX pixels along the MAX-DOAS LOS up to a distance of 10 km, the difference in MAX-DOAS and APEX NO2 VCD is reduced from 4.8 to 0.1 × 10¹⁵ molec cm−2. On 28 June, the diurnal variation in the NO2 field was much smaller. We see a slight underestimation of 0.3 × 10¹⁵ molec cm−2 for the APEX observation above the station when compared to MAX-DOAS, while the latter is overestimated by 1.2 × 10¹⁵ molec cm−2 when averaging along the LOS.
Table 5Co-located TROPOMI, APEX, and MAX-DOAS observations for the flights over the Brussels region. The TROPOMI NO2 VCD is provided for the pixel in which the MAX-DOAS station resides, for both the TM5-MP-based and CAMS-based product. The APEX NO2 VCD is provided for the average within the TROPOMI pixel footprint over the MAX-DOAS station and for the specific APEX pixel over the station. As the MAX-DOAS is performing elevation scans in a fixed azimuth direction (35∘ N), APEX observations are also averaged along this line of sight in order to take into account the instrument directivity.
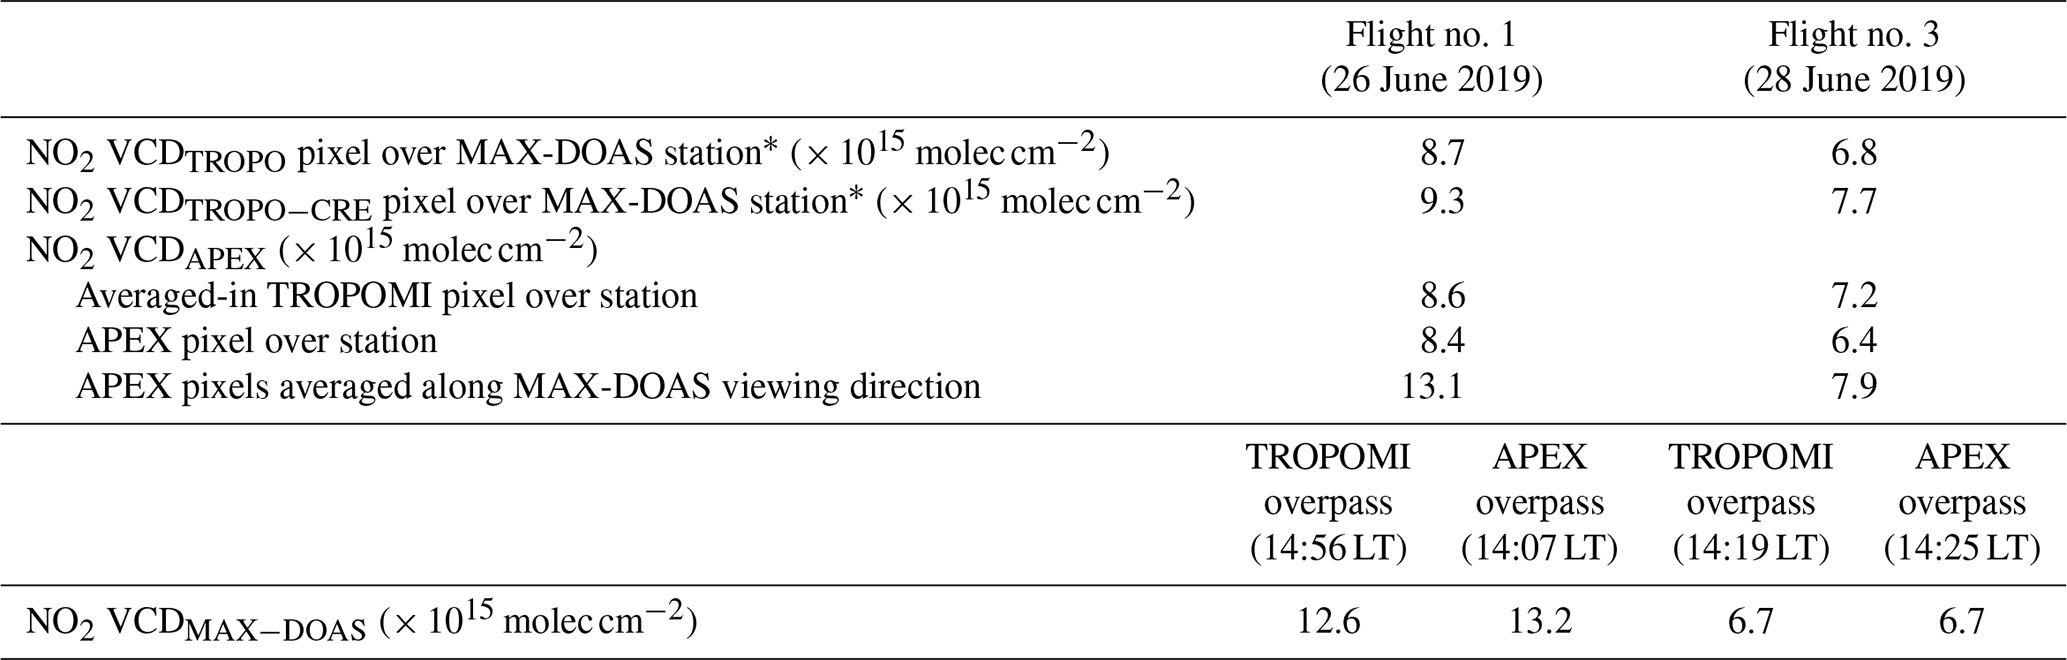
* TROPOMI pixel ID no. 2 in Table A1 for Flight no. 1 and pixel ID no. 3 in Table A3 for Flight no. 3.
Urbanized–industrialized areas are characterized by a strong spatial heterogeneity in the NO2 field and steep spatial gradients. Current spaceborne observations typically have a resolution which is much coarser than the fine spatial structures in urban NO2 plumes. The resulting smearing effect of the signal tends to bias the observed NO2 field: urban cores are systematically underestimated, while NO2 is overestimated over urban background areas. Note that in this work urban background is defined as an area in a polluted environment, which is not directly affected by pollution plumes. The same can be observed over large industrial plumes that can extend over several tens of kilometres downwind of its source. When spaceborne observations are compared with ground-based station observations, such as Pandora direct Sun (Judd et al., 2019) and MAX-DOAS (Dimitropoulou et al., 2020; Pinardi et al., 2020), the agreement is degraded with resolution as high concentrations in the pollution plumes are averaged out over a large area in the satellite data. Judd et al. (2019) downsample airborne GeoTASO VCDs (0.25 km × 0.25 km) to pseudo-TROPOMI (5 km × 5 km) and pseudo-OMI VCDs (18 km × 18 km). When compared to an ensemble of 10 Pandora stations, the initial NO2 VCD correlation drops from 0.91 to 0.88 and 0.61, respectively, while the slope is reduced from 1.03 to 0.77 and 0.57, respectively.
The high-resolution APEX retrievals monitor the effective variability in the NO2 field at much finer scale than based on current and near-future spaceborne observations. One nadir TROPOMI pixel of 3.5 km × 7 km consists of approximately 2700 APEX observations. In the case of fine-structured NO2 plumes, the airborne data are expected to measure a larger variability, and stronger horizontal gradients, while we expect more blurring of the signal in the coarser TROPOMI data. This is illustrated in Fig. 12, based on a 15 km long southwest–northeast cross section of the APEX and TROPOMI NO2 VCD grids, retrieved over Antwerp on 29 June 2019. APEX data show considerably more spatial detail and observe higher columns over NO2 hotspots when compared to TROPOMI. APEX measures peak NO2 values which are 6 × 10¹⁵ molec cm−2 or ∼ 50 % higher than seen by TROPOMI, while urban background pixels on their turn are overestimated up to 4 × 10¹⁵ molec cm−2 or ∼ 100 % in the TROPOMI retrievals.

Figure 12APEX and TROPOMI NO2 VCDs along a southwest–northeast 15 km cross section taken perpendicular to the major NO2 plume retrieved over Antwerp on 29 June 2019. Approximately five TROPOMI pixels and 150 APEX pixels are sampled.
The SD and RSD, computed in Sect. 5.2.2 for coincident TROPOMI and APEX pixels, can be used as measures for the subpixel variability or spatial heterogeneity of the NO2 field within TROPOMI pixels, and are provided in Appendix A. The RSD is obviously high for pixels that contain a steep gradient from urban background levels to NO2 plume levels, e.g. pixel 7 in Flight no. 2, which has a μ ± σ of 8.4 ± 4.3 × 10¹⁵ molec cm−2 or a variability of ∼ 51 %. The variability is usually low when a pixel is entirely in the plume: e.g. for pixel 5 in Flight no. 2, μ ± σ is 12.9 ± 2.2 × 10¹⁵ molec cm−2 or a variability of ∼ 17 %. TROPOMI pixels classified as urban background, such as pixel 16 in Flight no. 2, can also exhibit considerable variability, with a μ ± σ of 5.0 ± 2.0 × 10¹⁵ molec cm−2 or a variability of ∼ 41 %. This is due to high heterogeneity and the presence of small areas with moderate emissions, like a key road, industrial facility, or small residential area. Note that in some conditions the (R)SD can be used as an indicator for the instrument precision. However, we assume that the data sets acquired over the cities do not contain areas where the NO2 field is homogeneous enough to use it as a measure for the noise of the instrument.
6.1 Downsampling APEX to pseudo-TROPOMI NO2 VCDs
In this section, we investigate and quantify the impact of smearing of the effective signal due to the finite satellite pixel size. This is done based on the high-resolution APEX observations and under the assumption that the retrieved VCDs represent the true state of the NO2 field. We have adopted a downsampling method described in Kim et al. (2016) and Judd et al. (2019): first, we construct a pseudo-TROPOMI VCD grid (VCDpTROPO) by aggregating the APEX NO2 VCDs (VCDAPEX) according to a weighted average technique within grid cells of 5 km × 5 km, 4.4 km × 4.4 km, and 1 km × 1 km. The pixels are square in shape in order to avoid an orientation bias. Note that the original APEX VCD grid at 75 m × 120 m was regridded first to 100 m × 100 m for the same reason. The first two cases cover approximately the same area as a 7 km × 3.5 km (before 6 August 2019), and 5.5 km × 3.5 km (since 6 August 2019) TROPOMI nadir observation, respectively. The third case resembles a potential spatial resolution of future satellite or high-altitude pseudo-satellite (HAPS) missions and is still a factor of 10 larger than the APEX resolution. The respective NO2 VCD grids are shown in Fig. 13 for the data set acquired over Antwerp on 29 June. At the resolution of 1 km × 1 km, different plumes can still be resolved and they can be largely linked to the key emission sources, such as the stacks in the harbour and the Antwerp ring road. However, at the resolution of 4.4 km × 4.4 km and 5 km × 5 km, only one merged plume can be distinguished downwind, while it is not trivial to pinpoint its source(s). Note that the highest NO2 levels are not observed for the pixels containing the sources, as NO2 plumes are usually narrow and confined close to its source, resulting in a stronger smoothing effect for these pixels.
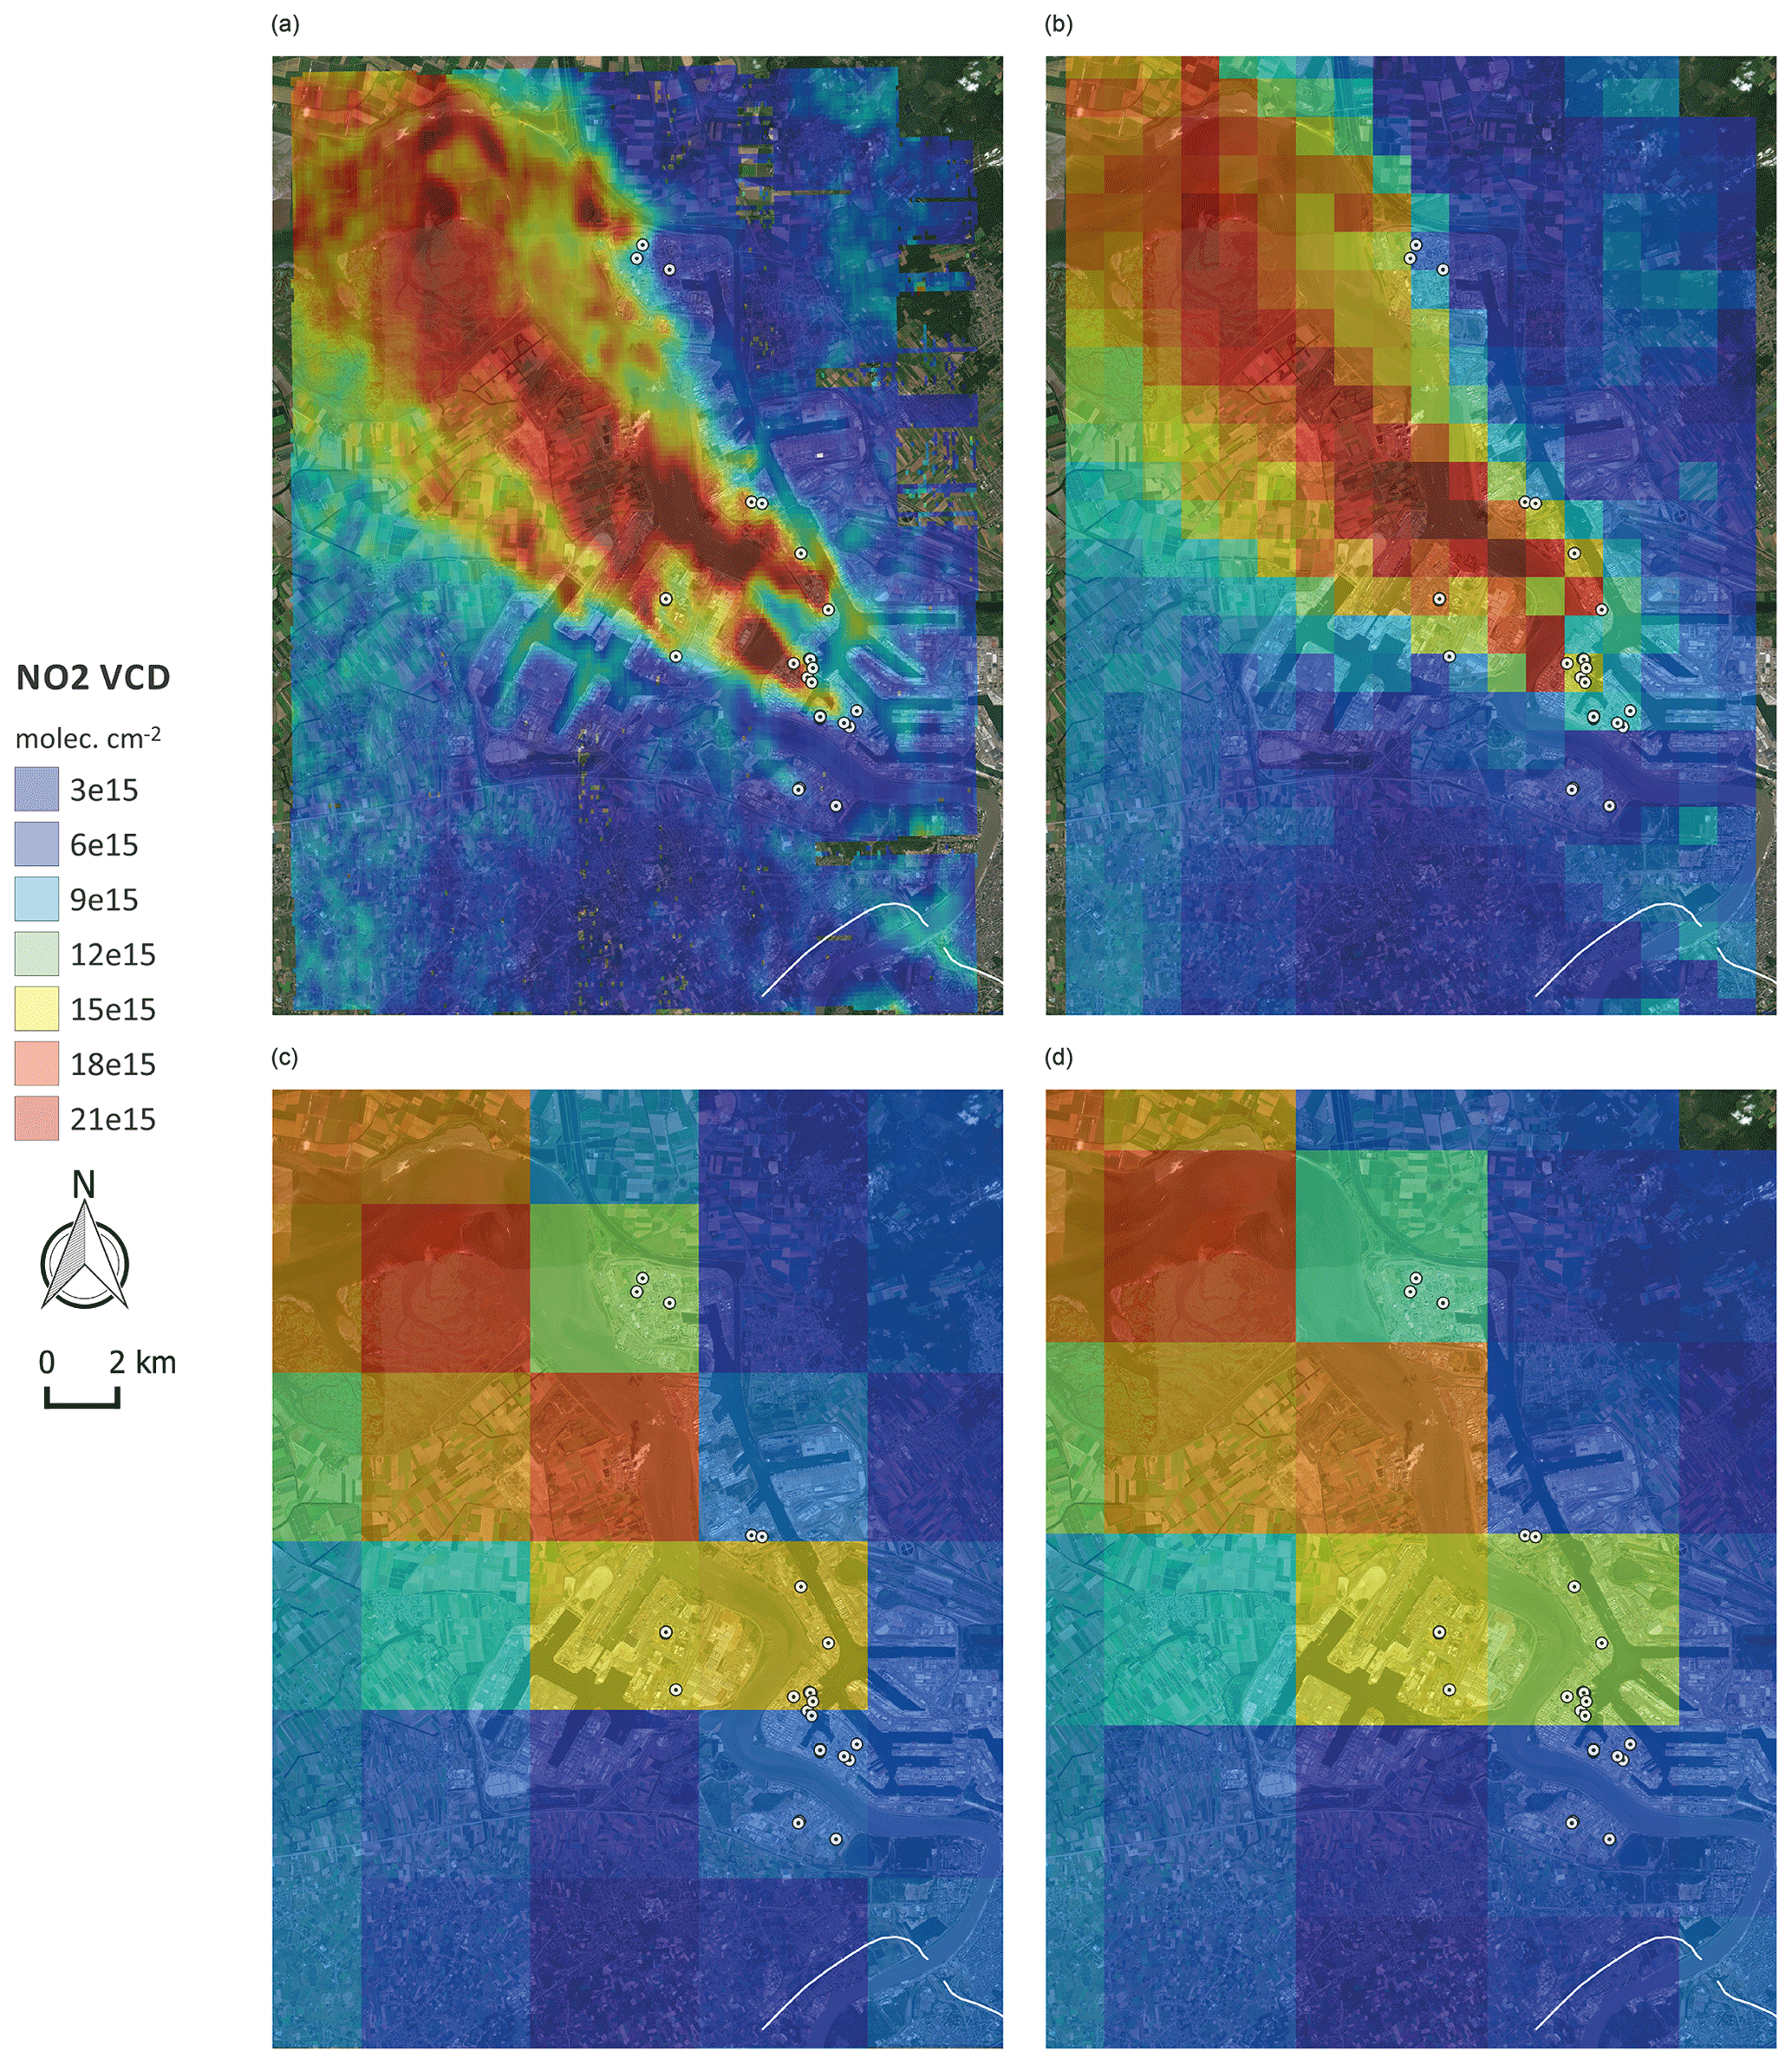
Figure 13(a) APEX NO2 VCD grid retrieved over Antwerp on 29 June, at 0.1 km × 0.1 km resolution, and the computed pseudo-satellite NO2 VCDs grids at (b) 1 km × 1 km, (c) 4.4 km × 4.4 km, and (d) 5 km × 5 km, respectively. White dots indicate the point sources, emitting more than 10 kg of NOx per hour, according to the emission inventory (2017) of the Belgian Interregional Environment Agency. Part of the city ring road is indicated by the white line (© Google Maps).
After regridding, the APEX NO2 VCDs are subtracted from the pseudo-satellite VCDs. The resulting absolute and relative VCD differences allow us to quantify the under- and overestimation bias in TROPOMI NO2 retrievals over strongly polluted regions, due to the smearing of the NO2 signal. The approach allows us to assess the impact solely related to the geometric effects resulting from the finite satellite pixel resolution. In the following, the approach is applied to two data sets acquired over Antwerp on 27 and 29 June 2019. The observed columns are larger for 29 June, while this day is also characterized by a larger variability.
In Fig. 14, the NO2 VCD (relative) biases between pseudo-TROPOMI NO2 VCDs at 4.4 km × 4.4 km and APEX NO2 VCDs at 0.1 km × 0.1 km are illustrated for the data set acquired over Antwerp on 29 June 2019. Negative differences or red-coloured pixels point at an underestimation of NO2 hotspots, while positive values or blue pixels point at overestimation of the urban background areas within the pseudo-TROPOMI VCDs. Whitish-coloured pixels represent no or very small bias. Obviously, the strongest under- and overestimation appears over and in the vicinity of the main plumes, and more specifically over transition regions, and it is expected that the smoothing will be stronger when spatial gradients become stronger. Further away from the patterns of enhanced NO2, e.g. in the northeast and the south, the variability becomes lower, resulting in a better agreement between the airborne high-resolution pixels and the relatively coarse pseudo-satellite pixels. However, the relative bias can still be substantial in the urban background areas due to the low NO2 VCDs in the APEX data at the native resolution. The same behaviour was observed in Richter et al. (2005) when comparing NO2 retrievals from GOME (40 km × 320 km) and SCIAMACHY (30 km × 60 km): while coincident observations agree very well over large areas of relatively homogeneous NO2 signals, they show considerable differences for areas with steep gradients in the NO2 field.
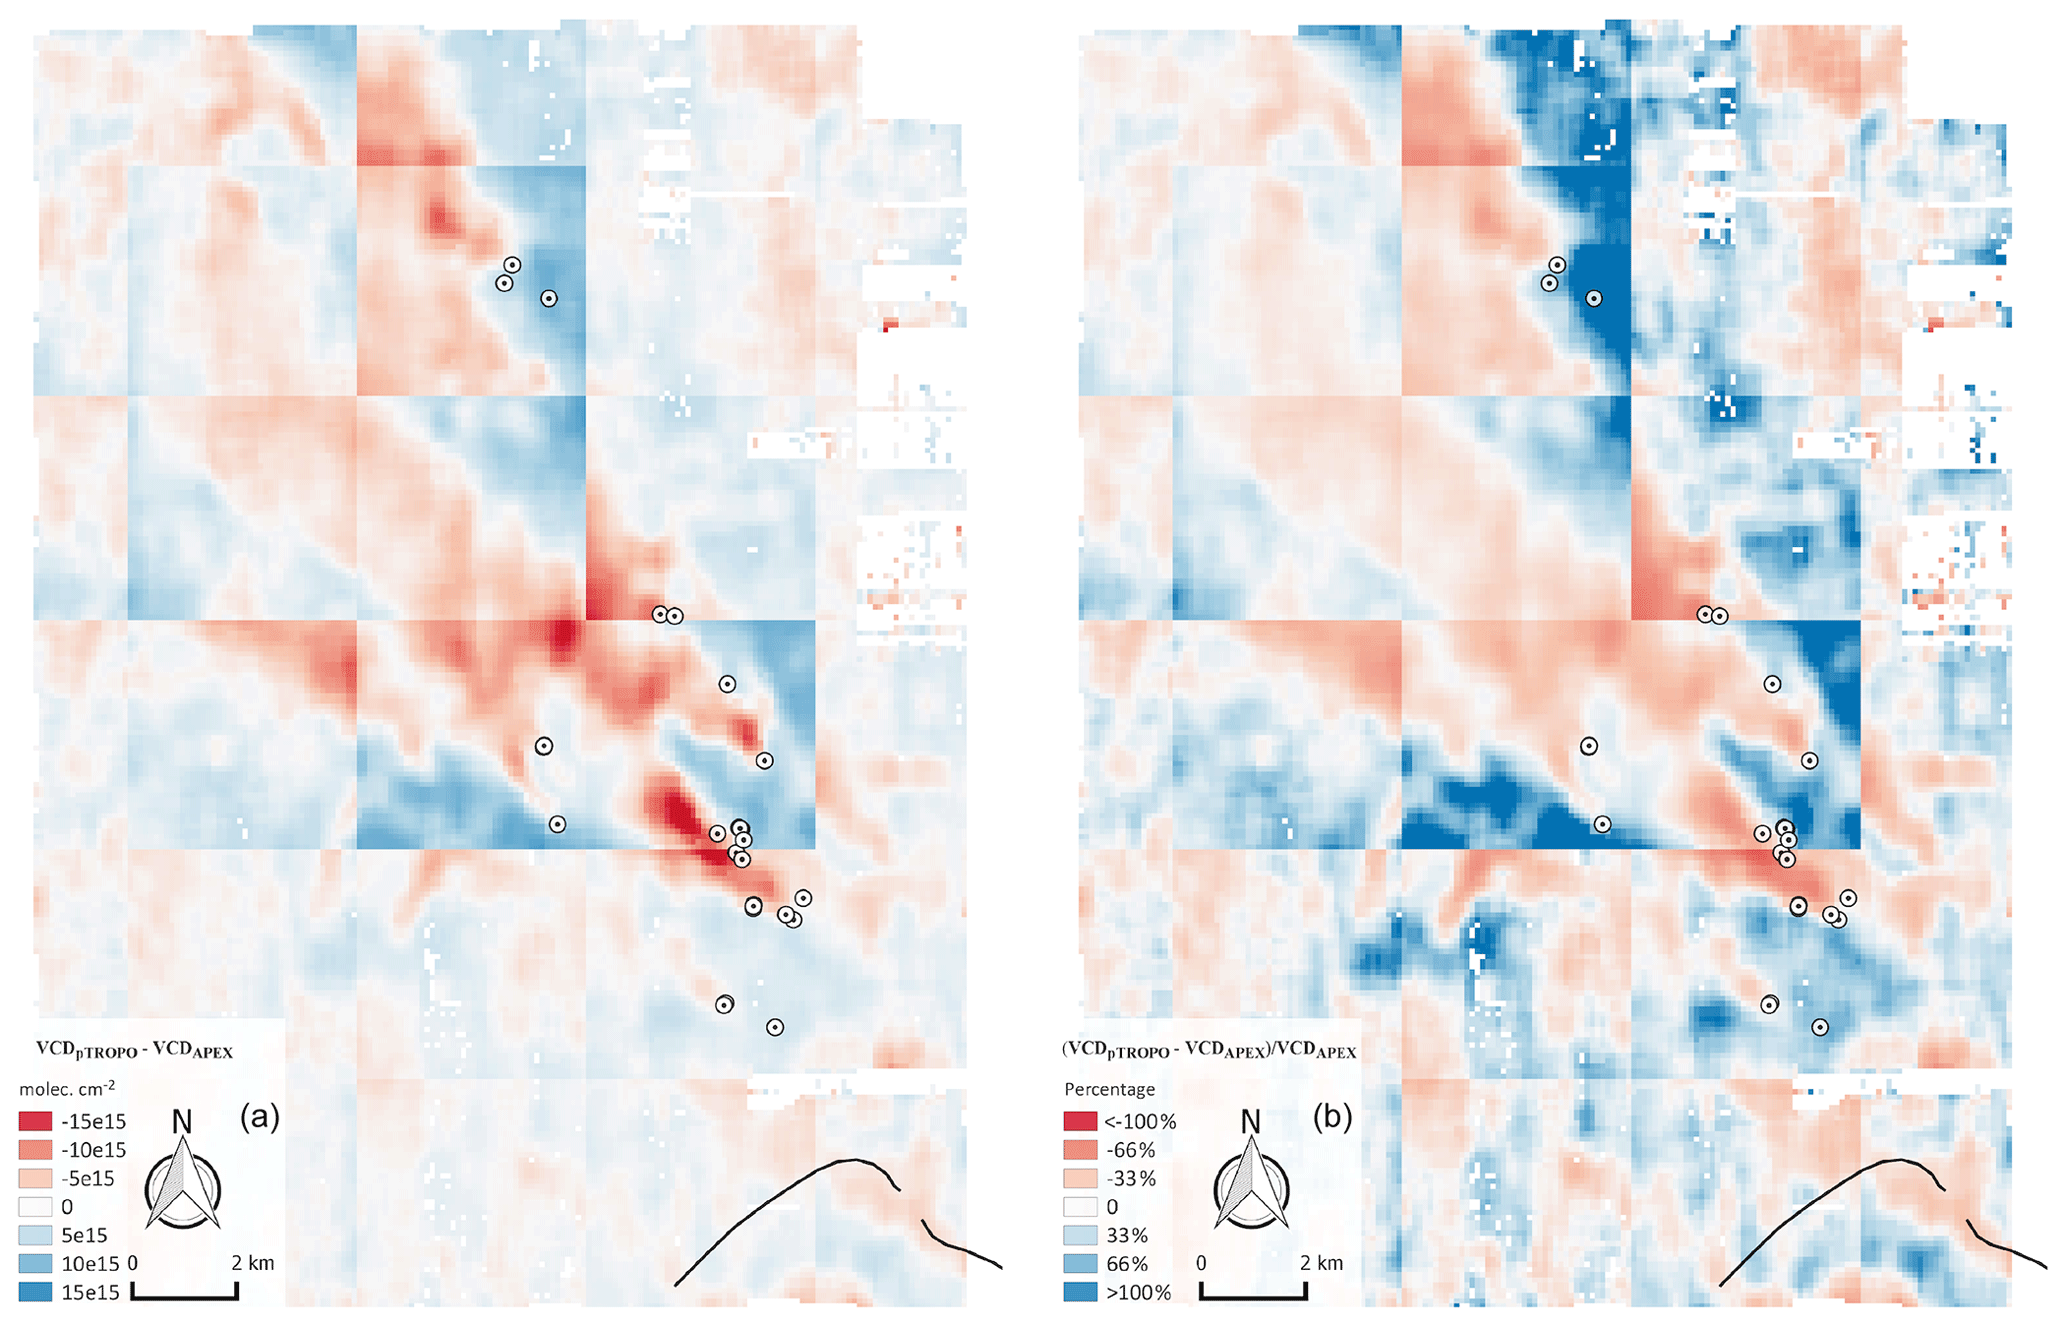
Figure 14(a) The NO2 VCD bias (VCDpTROPO − VCDAPEX) and (b) relative bias ((VCDpTROPO − VCDAPEX) ∕ VCDAPEX ⋅ 100) for the APEX data set acquired over Antwerp on 29 June 2019. VCDpTROPO is pseudo-TROPOMI NO2 VCDs, constructed by averaging the APEX NO2 VCDs within grid cells of 4.4 km × 4.4 km. White dots indicate the point sources, emitting more than 10 kg of NOx per hour, according to the emission inventory (2017) of the Belgian Interregional Environment Agency. Part of the city ring road is indicated by the black line.
Statistics, characterizing the NO2 field, are provided for the two different APEX data sets acquired over Antwerp in Table 6. The data set acquired on 27 June 2019 has a rather low mean VCD and variability of 7.6 ± 3.0 × 10¹⁵ molec cm−2 when compared to the data set acquired on 29 June 2019 (9.9 ± 5.4 × 10¹⁵ molec cm−2). Nevertheless, both areas represent an urban NO2 field characterized by relatively strong spatial gradients. Based on the study in Sect. 5.2.2, the subpixel variability can be up to 50 % when covering a typical gradient in the urban NO2 field.
Table 6NO2 VCD statistics for (1) two different APEX data sets acquired over Antwerp on 27 and 29 June 2019, (2) pseudo-TROPOMI grids (5 km × 5 km, 4.4 km × 4.4 km, and 1 km × 1 km) constructed by aggregating the native APEX NO2 VCDs from both former data sets, and (3) absolute and relative differences between the constructed pseudo-TROPOMI NO2 VCDs and original APEX VCDs.
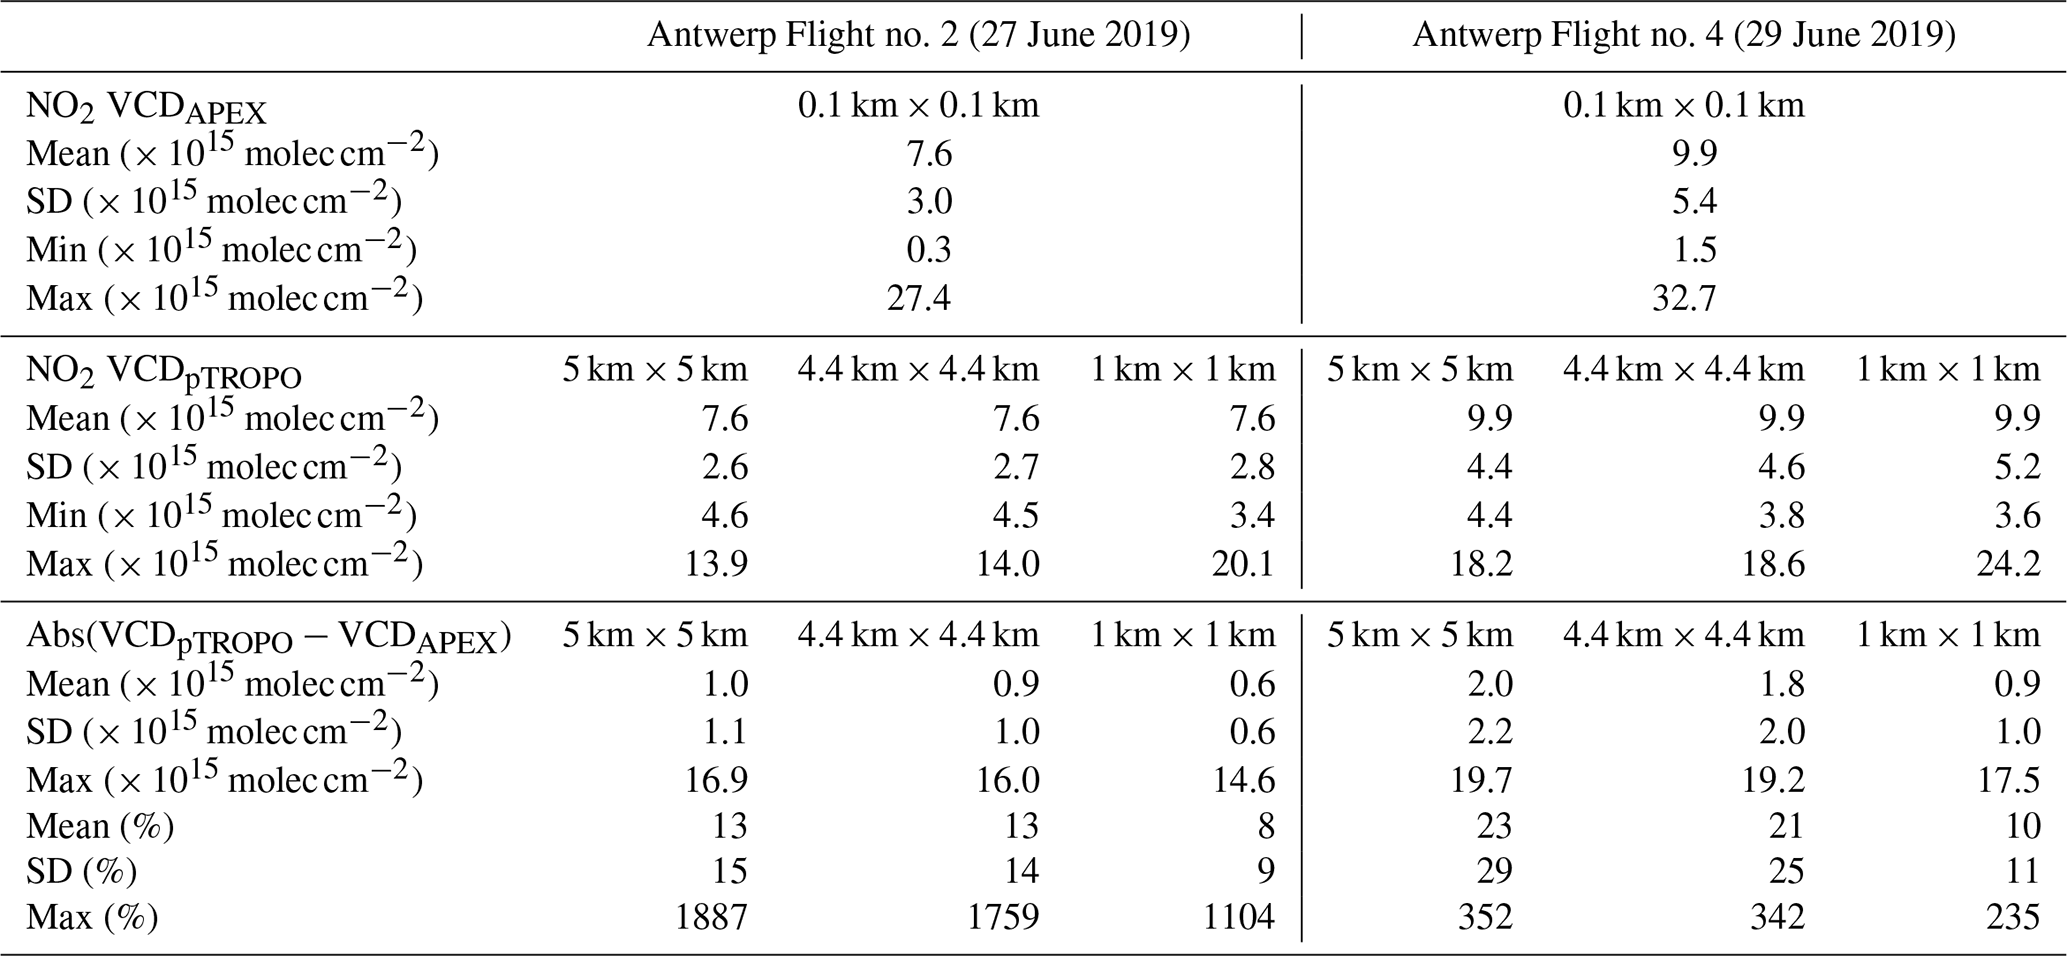
For both data sets, statistics are provided as well for the computed pseudo-satellite VCDs at 5 km × 5 km, 4.4 km × 4.4 km, and 1 km × 1 km. When increasing the pixel size, the overall variability drops, and the minima and maxima are less extreme due to the occurring smoothing.
In the last part of Table 6, statistics for the absolute value of the VCD differences are provided after subtracting the APEX NO2 VCDs at 0.1 km × 0.1 km from the pseudo-satellite VCDs. The amount of under- or overestimation is around 1 to 2 × 10¹⁵ molec cm−2, on average (5 km × 5 km grid), for the data set with relatively low (Flight no. 2) and high (Flight no. 4) urban NO2 variability, respectively. The bias can be as high as 20 × 1015 molec cm−2. The amount of under- or overestimation is still around 8 %–10 % on average for the pseudo-VCDs at 1 km × 1 km resolution. The difference seems, however, small between the two data sets acquired over Antwerp pointing out that (1) low or high variability is captured in more or less an equal way at the resolution of 1 km × 1 km, and (2) this is a near-optimal resolution to capture strong urban emissions and associated gradients from space, at least under the current conditions. The bias increases with pixel resolution up to ∼ 13 % (Flight no. 2) and ∼ 23 % (Flight no. 4) for the grid size at 5 km × 5 km. At this spatial resolution, the amount of variability in the data clearly has a stronger effect on the amount of smoothing of the effective signal. Maximum differences can be up to ∼ 1900 % and are due to the overestimation of retrievals with very low background values in the original APEX data (∼ 0.3 × 10¹⁵ molec cm−2). Based on a similar study applied to OMI data (13 km × 24 km) over the contiguous United States (Kim et al., 2016), it was found that under- or overestimation biases are on the order of 5–10 × 1015 molec cm−2 or 20 %–30 % for major cities like Washington D.C. and New York. Biases are more than 100 % for small-scale cities like Norfolk and Richmond. The stronger spatial smoothing observed in this study can be mainly explained by the coarser pixel resolution of OMI when compared to TROPOMI.
6.2 Simulations based on synthetic TROPOMI NO2 VCDs
In Fig. 15, an approach is illustrated based on synthetic satellite NO2 VCD data in order to study (1) the impact of spatial smoothing of the NO2 signal and (2) to which level spatial NO2 features can still be resolved from space. Here, satellite NO2 VCDs are simulated assuming that they contain an isolated NO2 hotspot of certain strength and size. The remaining part of the pixel is assigned a fixed value of 3 × 10¹⁵ molec cm−2, representative of urban background. The NO2 hotspots are defined by its relative size on the x axis, expressed as the fraction of a 5.5 km by 3.5 km TROPOMI nadir pixel, and average hotspot NO2 signal on the y axis, ranging between 1 and 5×10¹⁶ molec cm−2. In Fig. 15, the colour-coded matrix values define the satellite NO2 VCD based on a given NO2 hotspot of certain size (x axis) and strength (y axis) within the satellite pixel. A threshold is used to identify whether or not a NO2 signal within a TROPOMI pixel is still detectable and is defined as the sum of the urban background VCD of 3 × 10¹⁵ molec cm−2 and a NO2 VCD detection limit of 2.1 × 10¹⁵ molec cm−2, defined as 3 times the TROPOMI theoretical precision requirement. The separation between the white area and synthetic NO2 VCDs visualizes the threshold of 5.1 × 10¹⁵ molec cm−2.
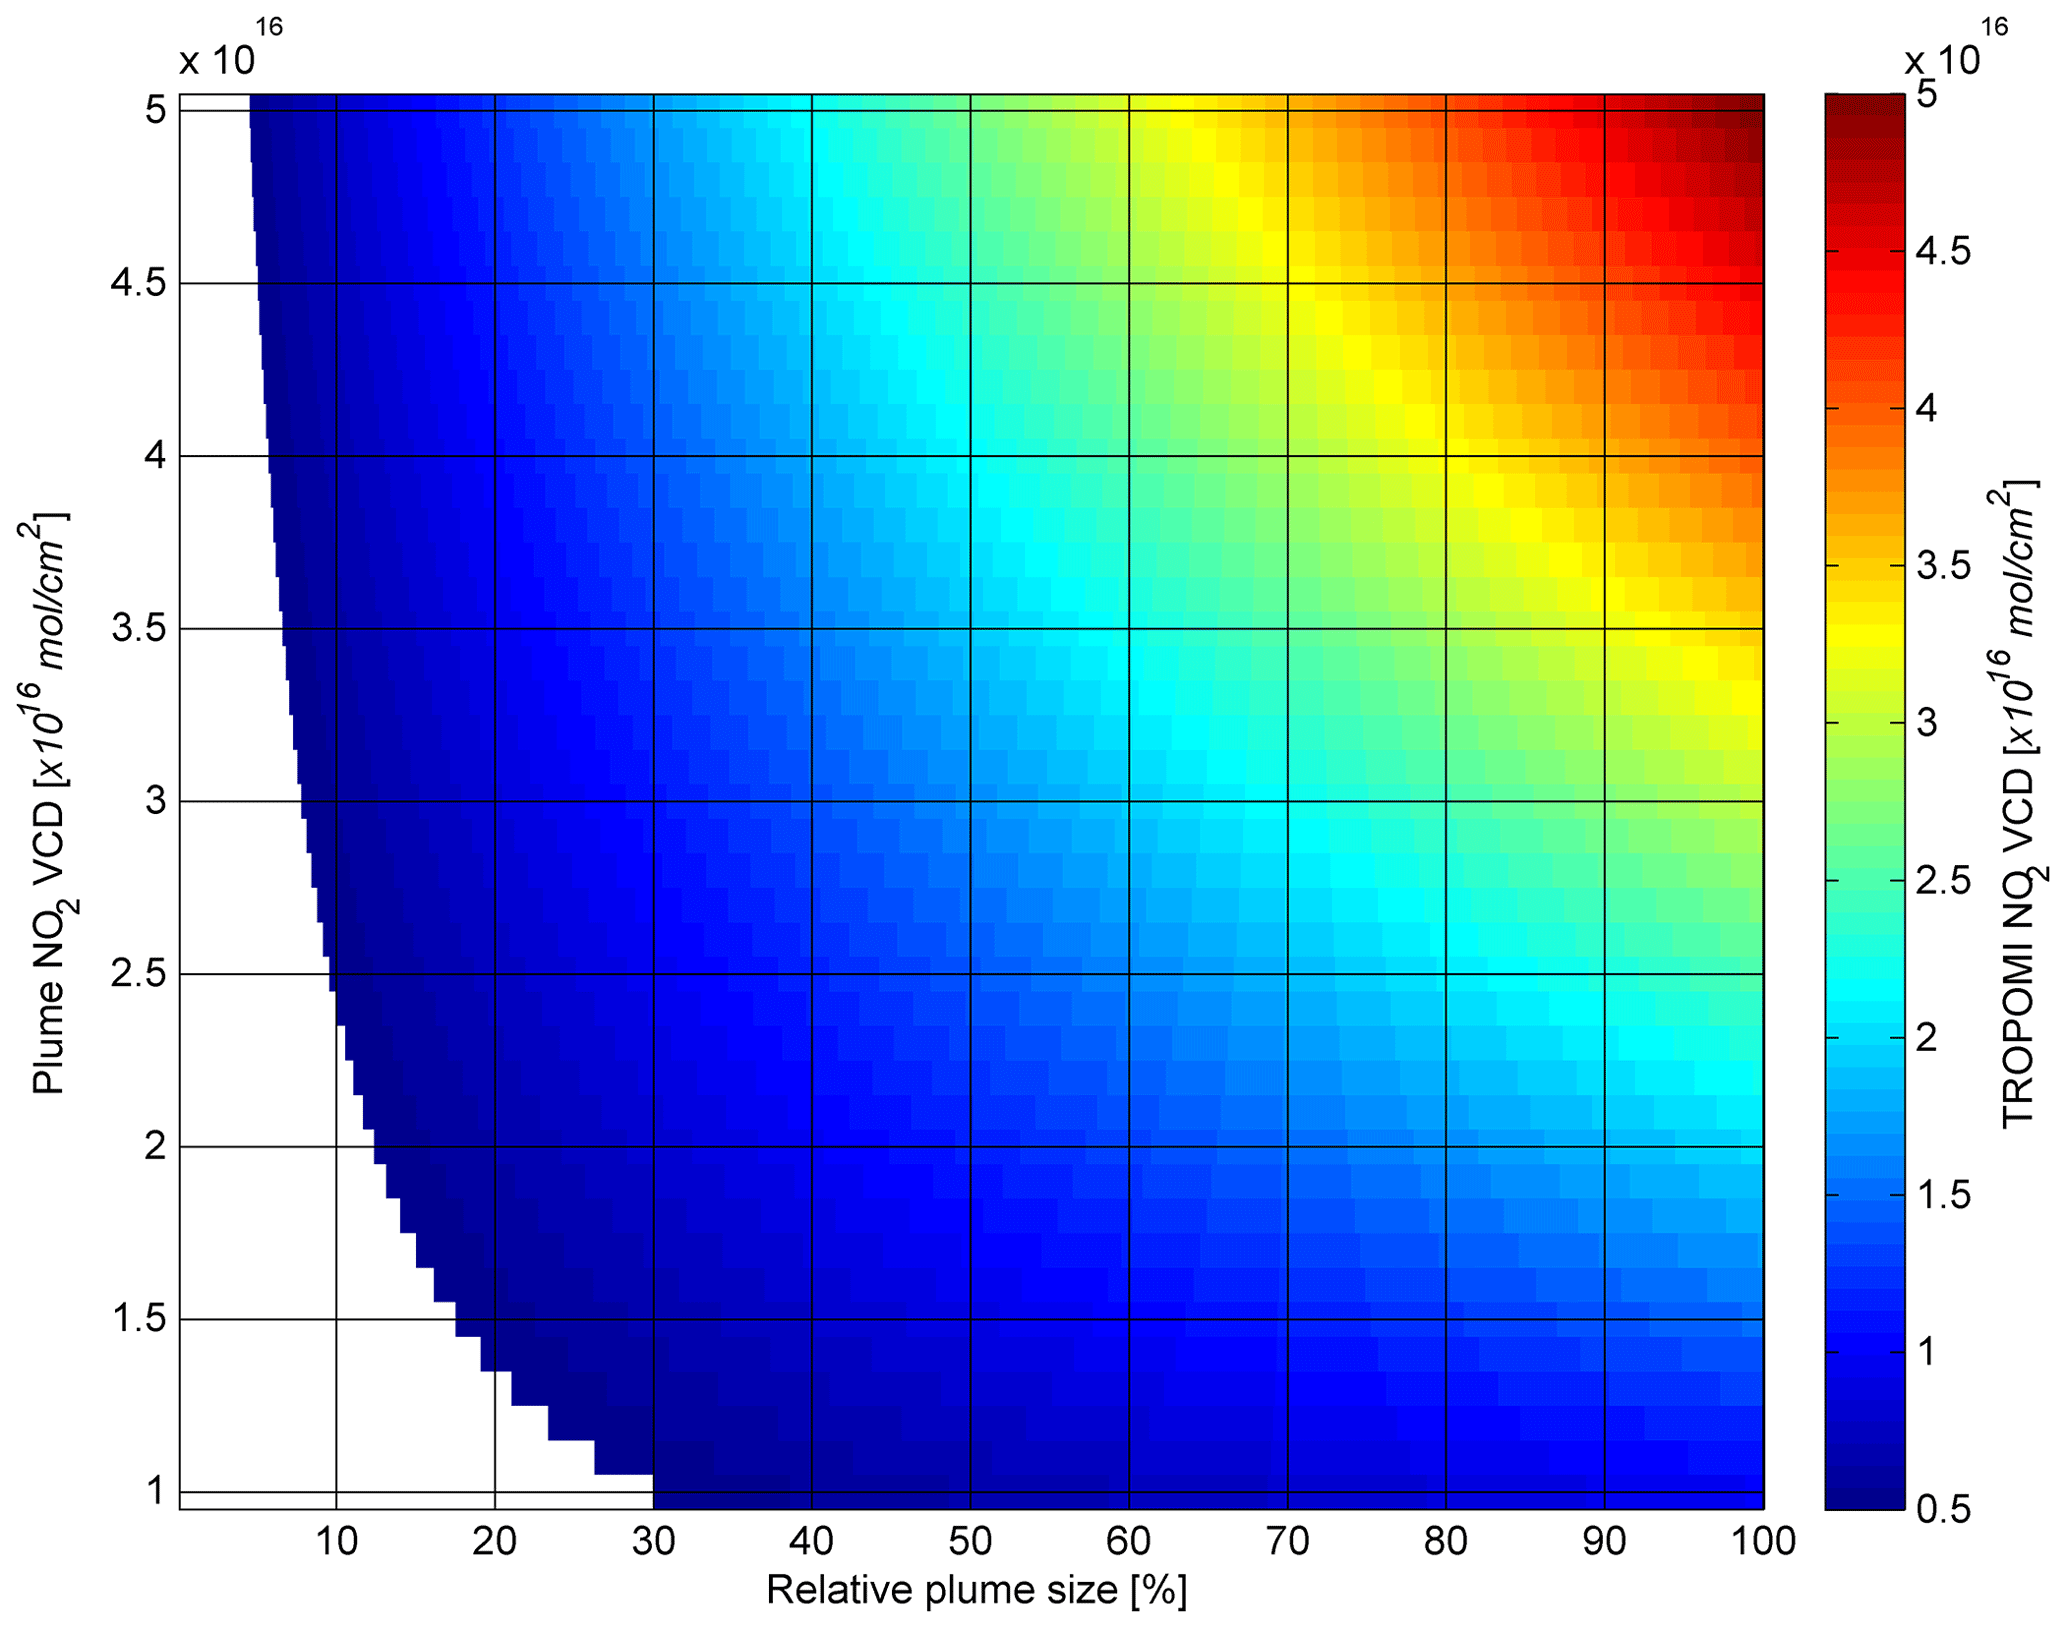
Figure 15Simulations of NO2 VCDs based on an isolated NO2 hotspot surrounded by urban background pixels (3 × 10¹⁵ molec cm−2). The NO2 hotspot is defined by its relative size on the x axis, expressed as the fraction of a 3.5 km by 5.5 km TROPOMI nadir pixel, and average NO2 signal strength on the y axis. The separation between the white area and synthetic NO2 VCDs corresponds to the hotspot detection threshold of 5.1 × 10¹⁵ molec cm−2.
In the case of a moderate source of 1 × 10¹⁶ molec cm−2, the plume needs to fill 30 % of the pixel, equivalent to 5.8 km2, in order to be detectable, while in the case of a strong source of 2.5 or 5 × 10¹⁶ molec cm−2, the hotspot needs to fill only 10 % (1.9 km2) or 5 % (1.0 km2) of the pixel, respectively. Note that in the case of a TROPOMI pixel size of 7 km by 3.5 km (product resolution at nadir until 6 August 2019), the size of the NO2 hotspot needs to be 7.4 km2, 2.3 km2 and 1.2 km2, respectively, in order to be detectable. In the event that a pixel is filled half by a NO2 hotspot with a strength of 1 × 10¹⁶ molec cm−2, its value will be 35 % lower than the hotspot value due to smoothing, while this will be approximately 45 % lower in the case of a hotspot value of 5 × 10¹⁶ molec cm−2.
Independent validation of the end-to-end mission performance is essential for the determination of S-5P data quality. It also provides critical information to identify and decide where and how to improve the overall data acquisition and processing chain. This is one of the first studies assessing TROPOMI tropospheric NO2 retrievals over strongly polluted urban areas, based on the comparison with airborne high-resolution remote sensing observations, and it is one of the first airborne spectrometer data sets coinciding in space and time with a large amount of fully sampled satellite pixels. Current satellite products can be optimally assessed with airborne data as a large number of satellite pixels can be fully mapped at high resolution in a relatively short time interval, reducing the impact of mismatches in spatial and temporal representativeness. NO2 VCDs retrieved from APEX, acquired on four consecutive clear-sky days (26–29 June 2019) over the cities of Brussels and Antwerp, have been compared with retrievals from coincident TROPOMI overpasses. On average, a TROPOMI pixel has been fully covered by approximately 2700 to 4000 APEX pixels, depending on the overpass, and time differences between APEX and TROPOMI acquisitions were limited to less than 1 h.
The case study over polluted regions in Belgium during summertime demonstrates that the TROPOMI tropospheric NO2 product meets the mission requirements in terms of precision and accuracy. Averaged over the four campaign days over Belgium, the precision of the TROPOMI NO2 VCD product is estimated to be 5.6 ± 0.4 × 10¹⁴ molec cm−2 and thus within the targeted requirement of 7.0 × 10¹⁴ molec cm−2. Overall, for the ensemble of the four flights, the standard TROPOMI NO2 VCD product is well correlated (R = 0.92) but biased negatively by −1.2 ± 1.2 × 10¹⁵ molec cm−2 or −14 ± 12 %, on average, with respect to coincident APEX NO2 retrievals. When replacing the coarse 1∘ × 1∘ TM5-MP a priori NO2 profiles with NO2 profile shapes from the CAMS regional CTM ensemble at 0.1∘ × 0.1∘, the slope increases by 11 % to 0.93 and the bias is reduced to −0.1 ± 1.0 × 10¹⁵ molec cm−2 or −1.0 ± 12 %. The absolute difference is on average 1.3 × 10¹⁵ molec cm−2 (16 %) and 0.7 × 10¹⁵ molec cm−2 (9 %), when comparing APEX with TM5-MP-based and CAMS-based NO2 VCDs, respectively. Both sets of retrievals are well within the TROPOMI mission accuracy requirement of a maximum bias of 25 %–50 % for all individually compared pixels.
Nevertheless, TROPOMI is generally biased low over polluted areas when compared to ground-based or airborne observations, and this is consistent with the findings in other studies, such as Griffin et al. (2019), Ialongo et al. (2020), Zhao et al. (2020), Dimitropoulou et al. (2020), Judd et al. (2020), and Verhoelst et al. (2021). The study of Judd et al. (2020) is based on 16 flight days with GeoTASO and GCAS over the New York City/Long Island Sound region. Overall, the standard TROPOMI NO2 VCD product is very well correlated (R = 0.96) but negatively biased by approximately −19 % with respect to coincident GeoTASO/GCAS NO2 retrievals. Replacing TM5-MP a priori NO2 profiles with NO2 profile shapes from the North American Model – Community Multiscale Air Quality model (NAM-CMAQ) at 12 km spatial resolution improves the overall bias to −7 %. The negative bias, observed in all studies, is expected to be due to a combination of (1) the limited spatial resolution of a priori input for the AMF computation, i.e. NO2 profiles at 1∘ from the TM5-MP CTM and surface albedo at 0.5∘ from the OMI LER, as well as (2) the estimated bias of 0.005–0.010 in the TROPOMI/OMI LER on clear-sky days. The NO2 product could be further improved for retrievals over polluted regions by making use of (1) a priori NO2 profiles from a high-resolution CTM, if available, such as the CAMS regional ensemble at 0.1∘ and (2) an improved albedo product. A G3_LER daily map product at 0.1∘, directly retrieved from the TROPOMI L1B radiances, is currently under development. Furthermore, a surface albedo adjustment scheme will become operational after reprocessing the L1B product to v2, planned for the second half of 2020.
The TROPOMI spatial resolution is limited to resolve fine-scale urban NO2 plumes and can cause a considerable smoothing effect in the case of the observation of strongly polluted scenes with steep gradients. This depends both on the instrument pixel size and the amount of heterogeneity in the NO2 field. The high-resolution APEX retrievals allow us to monitor the effective horizontal variability in the NO2 field at much finer scale. In Sect. 6, the impact of smearing of the effective signal due to the finite satellite pixel size was studied for the Antwerp region based on a downsampling approach of the APEX retrievals. Assuming a pixel size of 25 km to 20 km, equivalent to the initial 3.5 km × 7 km and new TROPOMI 3.5 km × 5.5 km spatial resolution (at nadir), the TROPOMI data underestimate localized enhancements and overestimate urban background values by approximately 1–2 × 10¹⁵ molec cm−2, on average, or 10 %–20 %, for the Antwerp case study. The average under- and overestimation is further reduced to 0.6–0.9 × 10¹⁵ molec cm−2, or smaller than 10 %, when increasing the pixel size to 1 km2. Therefore, detailed air quality studies at the city scale still require observations at higher spatial resolution, on the order of 1 km2 or better, in order to resolve all fine-scale structures within the typical heterogeneous NO2 field.
A validation strategy for TROPOMI tropospheric NO2 retrievals has been presented based on airborne mapping data, which can be valuable for future assessments of S-5P and upcoming satellite missions, such as S-5, S-4, GEMS, and TEMPO. The main focus was to quantify the TROPOMI retrieval uncertainties in polluted regions, and results from the comparison with APEX data, acquired over Belgium during summertime, have shown that the TROPOMI tropospheric NO2 product meets the mission requirements in terms of accuracy and precision. However, additional validation studies are required and are currently planned, focusing on more sites with different geophysical properties and varying pollution levels, including background areas, extreme albedo sites, other seasons, and cloudy scenes, among others, in order to assess as well the performance in suchlike conditions.
Table A1Tropospheric NO2 VCD statistics for coincident TROPOMI and APEX pixels for Flight no. 1, orbit 08812. APEX statistics are computed for all TROPOMI pixels covered by more than 50 % by APEX pixels.

a Relative SD (RSD) or coefficient of variation defined as the ratio of the SD to the mean. b The minimum and maximum are defined here as μ−2σ and μ+2σ, in order to reduce the impact of outliers.
Table A2Tropospheric NO2 VCD statistics for coincident TROPOMI and APEX pixels for Flight no. 2, orbit 08826.
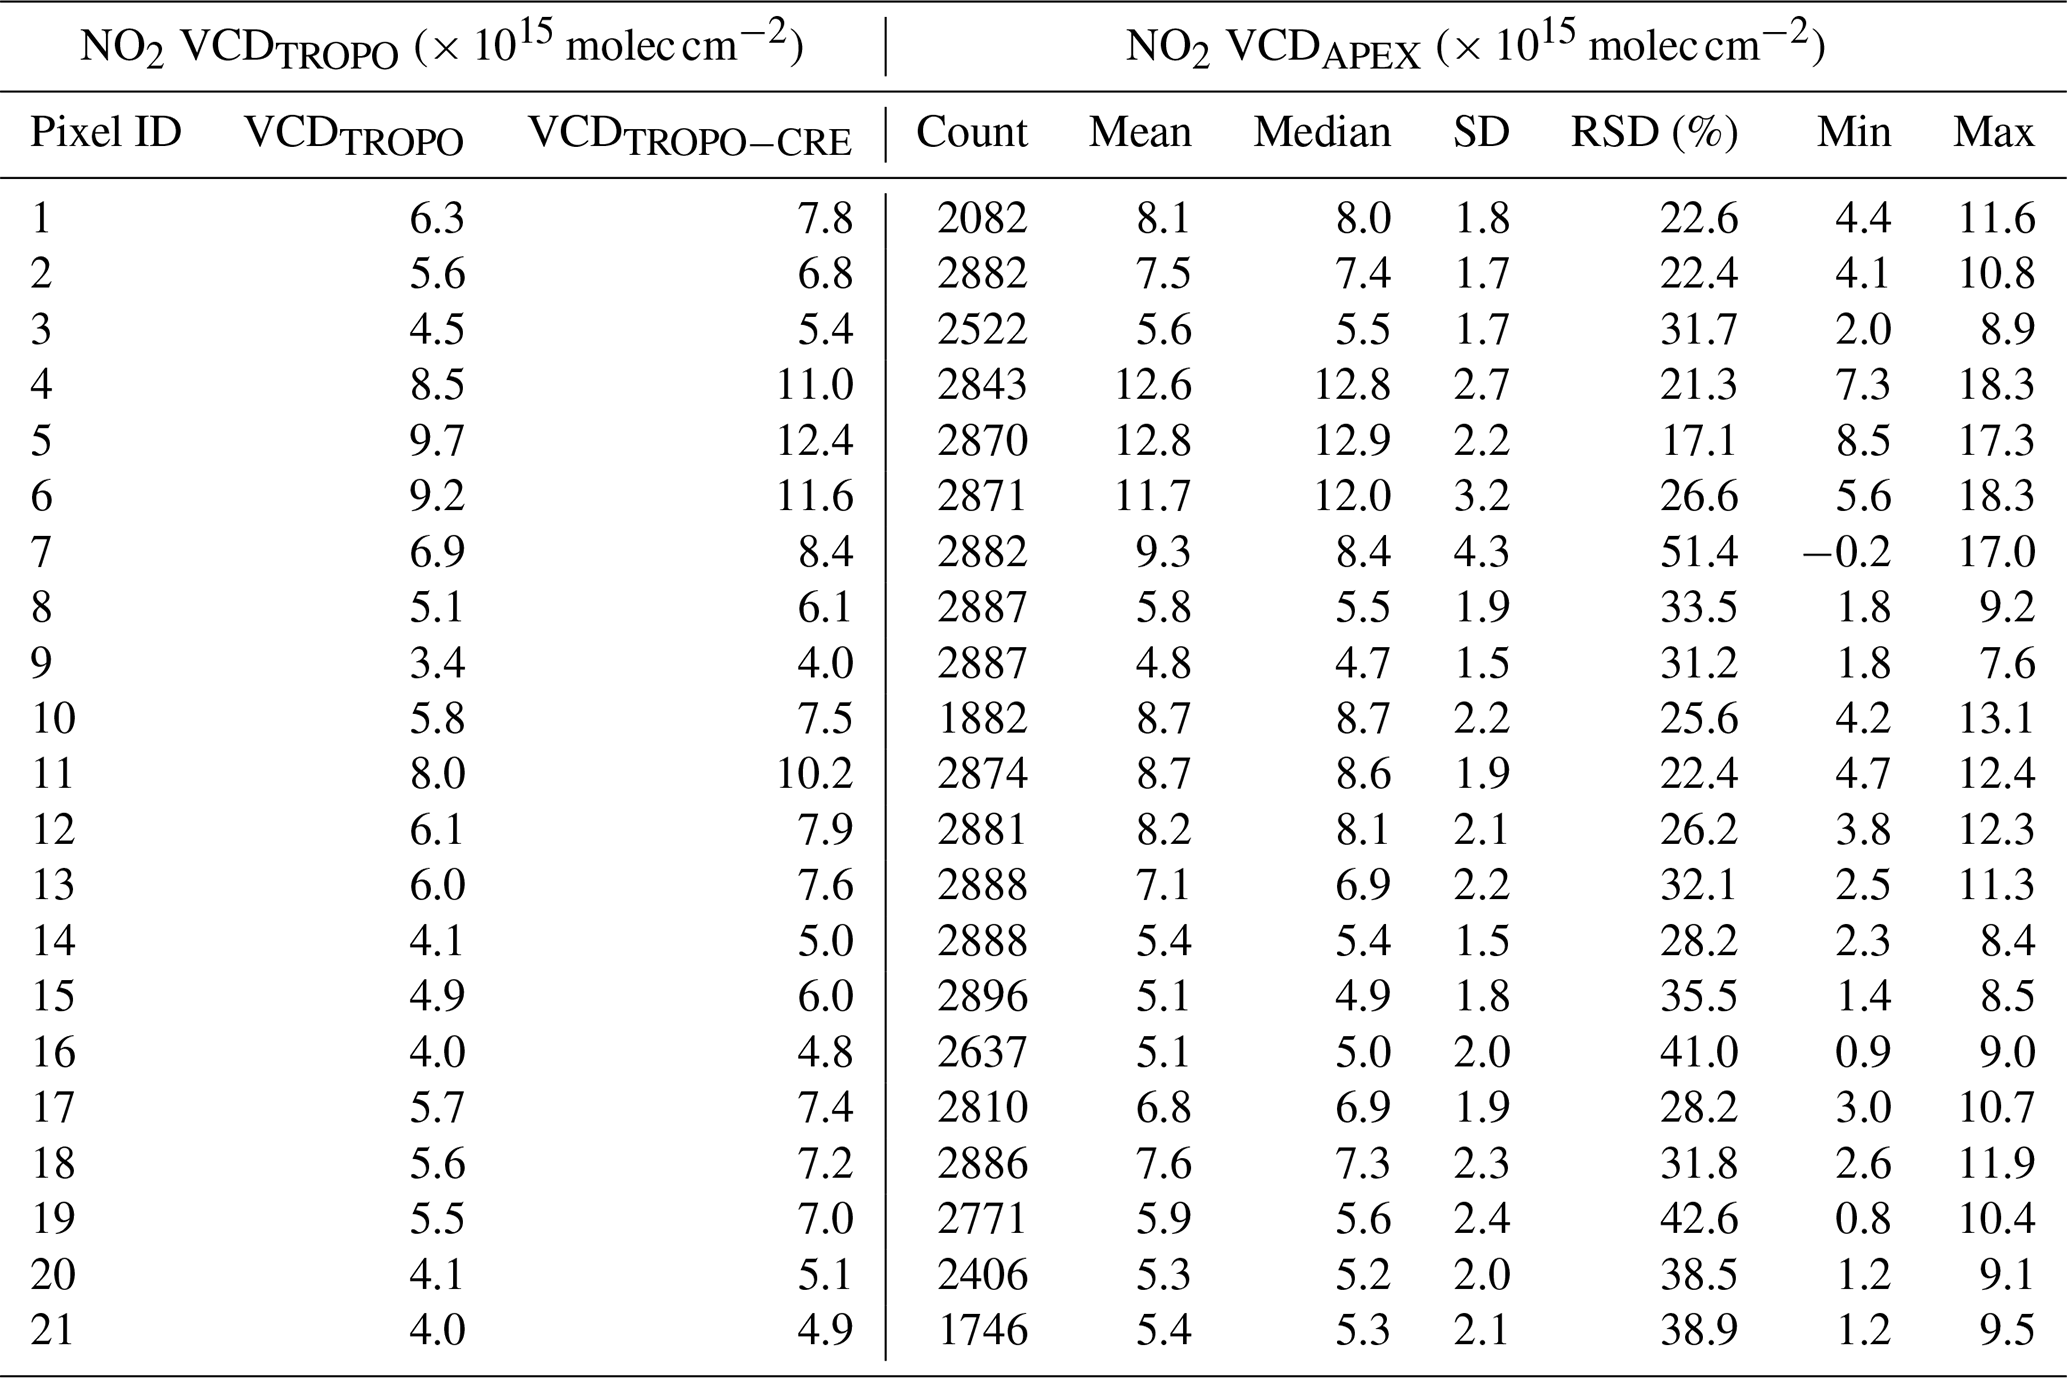
Table A3Tropospheric NO2 VCD statistics for coincident TROPOMI and APEX pixels for Flight no. 3, orbit 08840.
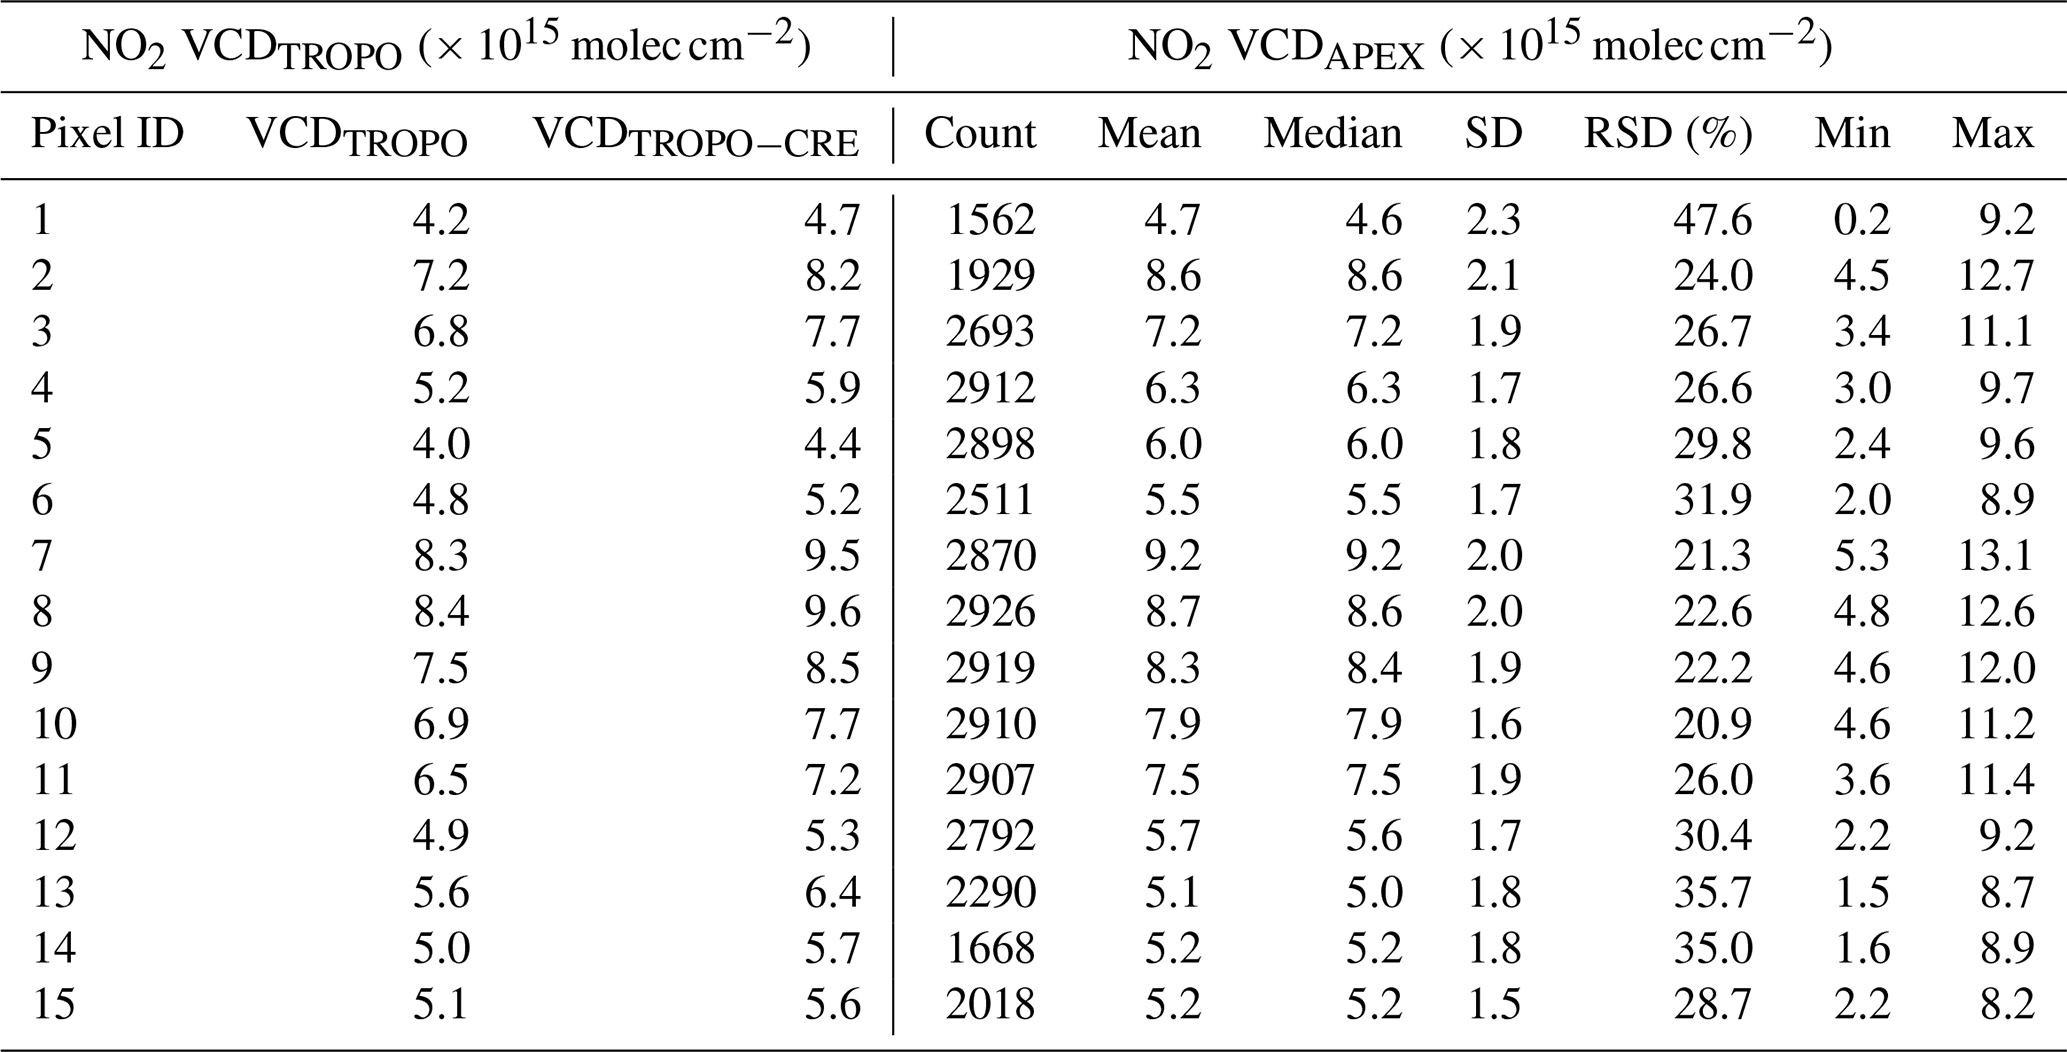
Table A4Tropospheric NO2 VCD statistics for coincident TROPOMI and APEX pixels for Flight no. 4, orbit 08854.
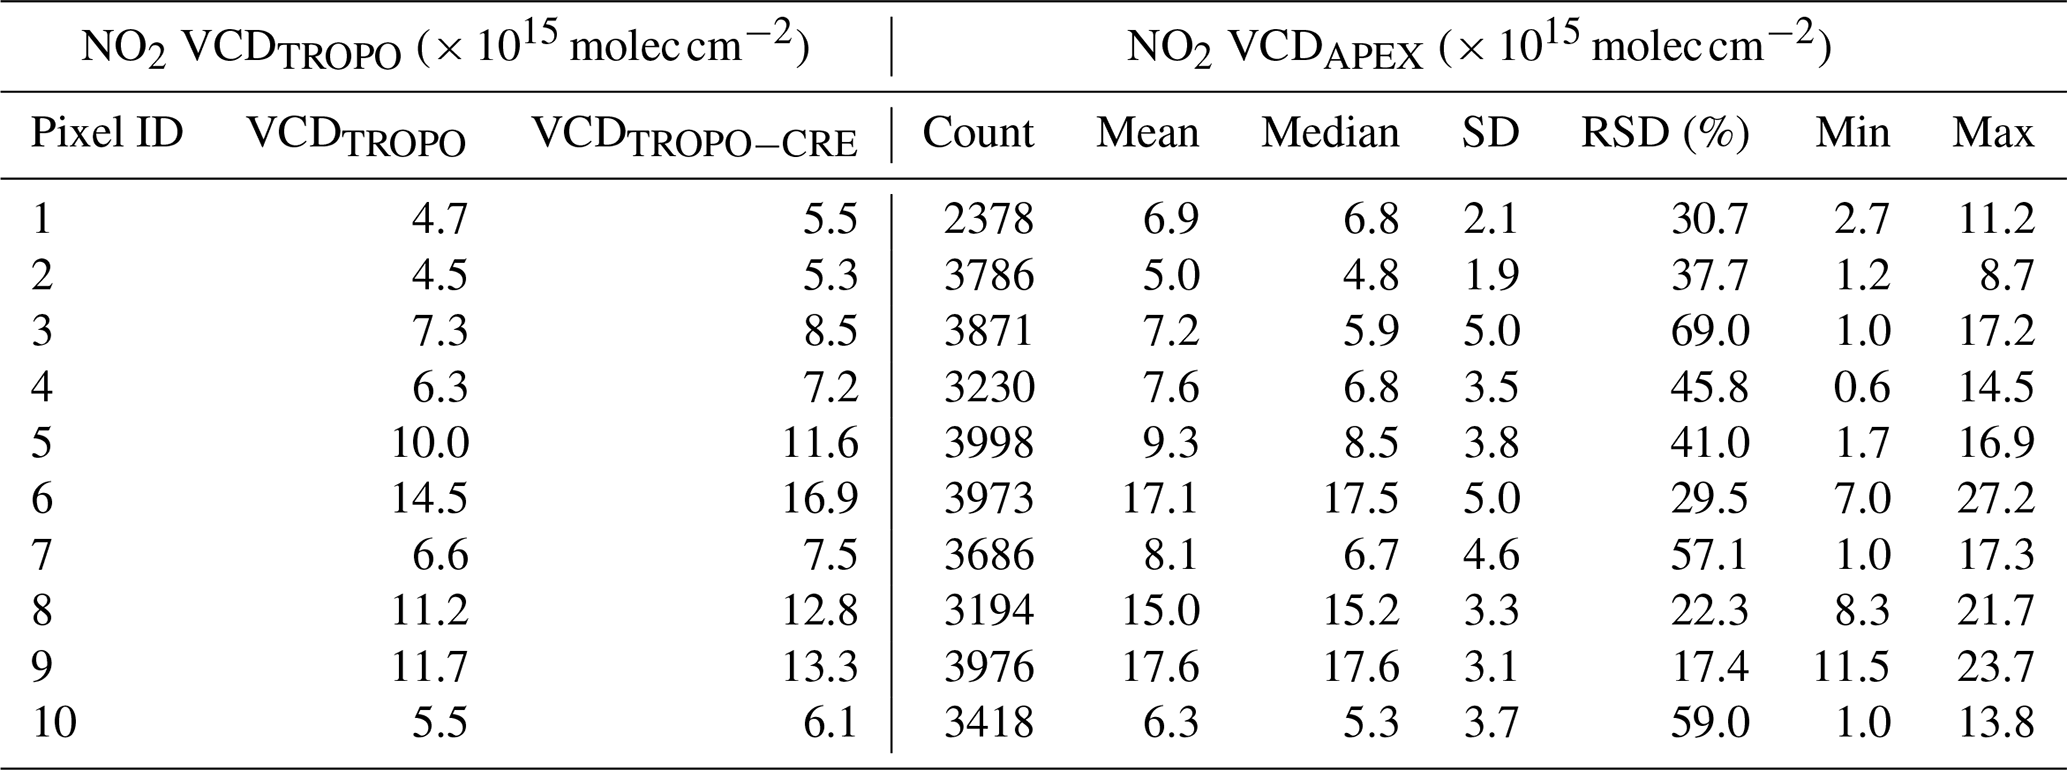
The code is available upon request to the corresponding author.
The data are available upon request to the corresponding author.
FT undertook the validation study and writing of the manuscript under supervision of MVR. FT, AM, BB, and MVR planned and organized the measurement campaign. MDI, GP, and ED contributed to the campaign. MDI and BB preprocessed the APEX spectra. HE processed the customized TROPOMI tropospheric NO2 product based on CAMS a priori profiles. FT performed the APEX VCD retrievals and comparison study. AM, MDI, GP, ED, HE, and MVR contributed to scientific discussions. All co-authors reviewed and discussed the results, and commented on the final manuscript.
The authors declare that they have no conflict of interest.
The Belgian Federal Science Policy Office is gratefully appreciated for funding the APEX aircraft activities in the framework of the STEREO programme. The European Space Agency is gratefully acknowledged for funding the S-5P Campaign Implementation Plan (Tack et al., 2018) and other TROPOMI retrieval and validation activities at BIRA. The authors wish to thank Frans Fierens and Charlotte Vanpoucke from the Belgian Interregional Environment Agency for providing emission inventory data. We also wish to thank Ben Somers from the KU Leuven University for providing the Microtops handheld Sun photometer and our colleagues François Hendrick and Martina Friedrich from BIRA for helping to conduct DOAS measurements during the S5PVAL-BE campaign.
This paper was edited by Lok Lamsal and reviewed by two anonymous referees.
Anderson, G., Clough, S., Kneizys, F., Chetwynd, J., and Shettle, E.: AFGL atmospheric constituent profiles (0–120 km), Hanscom AFB, MA: Optical Physics Division, Air Force Geophysics Laboratory, AFGL-TR, 86-0110, US Air Force Geophysics Laboratory, Optical Physics Division, 1, 1986.
Boersma, K. F., Eskes, H. J., and Brinksma, E. J.: Error analysis for tropospheric NO2 retrieval from space, J. Geophys. Res.-Atmos., 109, D04311, https://doi.org/10.1029/2003JD003962, 2004.
Boersma, K. F., Eskes, H. J., Dirksen, R. J., van der A, R. J., Veefkind, J. P., Stammes, P., Huijnen, V., Kleipool, Q. L., Sneep, M., Claas, J., Leitão, J., Richter, A., Zhou, Y., and Brunner, D.: An improved tropospheric NO2 column retrieval algorithm for the Ozone Monitoring Instrument, Atmos. Meas. Tech., 4, 1905–1928, https://doi.org/10.5194/amt-4-1905-2011, 2011.
Boersma, K. F., Eskes, H. J., Richter, A., De Smedt, I., Lorente, A., Beirle, S., van Geffen, J. H. G. M., Zara, M., Peters, E., Van Roozendael, M., Wagner, T., Maasakkers, J. D., van der A, R. J., Nightingale, J., De Rudder, A., Irie, H., Pinardi, G., Lambert, J.-C., and Compernolle, S. C.: Improving algorithms and uncertainty estimates for satellite NO2 retrievals: results from the quality assurance for the essential climate variables (QA4ECV) project, Atmos. Meas. Tech., 11, 6651–6678, https://doi.org/10.5194/amt-11-6651-2018, 2018.
Bovensmann, H., Burrows, J. P., Buchwitz, M., Frerick, J., Noël, S., Rozanov, V. V., Chance, K. V., and Goede, A. P. H.: SCIAMACHY: Mission Objectives and Measurement Modes, J. Amos Sci., 56, 127–150, https://doi.org/10.1175/1520- 0469(1999)056<0127:SMOAMM>2.0.CO;2, 1999.
Broccardo, S., Heue, K.-P., Walter, D., Meyer, C., Kokhanovsky, A., van der A, R., Piketh, S., Langerman, K., and Platt, U.: Intra-pixel variability in satellite tropospheric NO2 column densities derived from simultaneous space-borne and airborne observations over the South African Highveld, Atmos. Meas. Tech., 11, 2797–2819, https://doi.org/10.5194/amt-11-2797-2018, 2018.
Burrows, J., Weber, M., Buchwitz, M., Rozanov, V., Ladstätter-Weißenmayer, A., Richter, A., Debeek, R., Hoogen, R., Bramstedt, K., Eichmann, K.-U., and Eisinger, M.: The Global Ozone Monitoring Experiment (GOME): Mission concept and first scientific results, J. Atmos. Sci., 56, 151–175, 1999.
Chance, K. and Kurucz, R. L.: An improved high-resolution solar reference spectrum for Earth's atmosphere measurements in the ultraviolet, visible, and near infrared, available at: http://www.cfa.harvard.edu/atmosphere (last access: September 2013), 2010.
Chance, K. V. and Spurr, R. J. D.: Ring effect studies: Rayleigh scattering, including molecular parameters for rotational Raman scattering, and the Fraunhofer spectrum, Appl. Optics, 36, 5224–5230, 1997.
Constantin, D.-E., Merlaud, A., and the AROMAT team: Airborne Romanian Measurements of Aerosols and Trace gases (AROMAT-II), Final report, ESTEC, Noordwijk, the Netherlands, 2016.
De Haan, J. F., Bosma, P. B., and Hovenier, J. W.: The adding method for multiple scattering in a non-homogeneous Rayleigh atmosphere, Astron. Astrophys., 183, 371–391, 1987.
Dieudonné, E., Ravetta, F., Pelon, J., Goutail, F., and Pommereau, J.P.: Linking NO2 surface concentration and integrated content inthe urban developed atmospheric boundary layer, Geophys. Res. Lett., 40, 1247–1251, https://doi.org/10.1002/grl.50242, 2013.
Dimitropoulou, E., Hendrick, F., Pinardi, G., Friedrich, M. M., Merlaud, A., Tack, F., De Longueville, H., Fayt, C., Hermans, C., Laffineur, Q., Fierens, F., and Van Roozendael, M.: Validation of TROPOMI tropospheric NO2 columns using dual-scan multi-axis differential optical absorption spectroscopy (MAX-DOAS) measurements in Uccle, Brussels, Atmos. Meas. Tech., 13, 5165–5191, https://doi.org/10.5194/amt-13-5165-2020, 2020.
D'Odorico, P.: Monitoring the spectral performance of the APEX imaging spectrometer for inter-calibration of satellite missions, Remote Sensing Laboratories, Department of Geography, University of Zurich, 2012.
Eskes, H. J., van Geffen, J., Boersma, K.F., Sneep, M., ter Linden, M., Richter, A., Beirle, S., and Veefkind, P.: High spatial resolution nitrogen dioxide tropospheric column observations derived from Sentinel-5P TROPOMI observations, submitted to AMT, 2020.
Fayt, C., Danckaert, T., and Van Roozendael, M.: QDOAS software user manual 2.111, BIRA-IASB, Uccle, Belgium, available at: http://uv-vis.aeronomie.be/software/QDOAS/QDOAS_manual.pdf (last access: 10 May 2017), 2016.
Fehr, T.: Sentinel-5 Precursor Scientific Validation Implementation Plan, ESA-SMS, EOP-SM/2993/TF-tf Issue 1, available at: https://sentinel.esa.int/documents/247904/2474724/Sentinel-5P-Science-Validation-Implementation-Plan (last access: February 2020), 2016.
Gorshelev, V., Serdyuchenko, A., Weber, M., Chehade, W., and Burrows, J. P.: High spectral resolution ozone absorption cross-sections – Part 1: Measurements, data analysis and comparison with previous measurements around 293 K, Atmos. Meas. Tech., 7, 609–624, https://doi.org/10.5194/amt-7-609-2014, 2014.
Griffin, D., Zhao, X., McLinden, C. A., Boersma, F., Bourassa, A., Dammers, E., Degenstein, D., Eskes, H., Fehr, L., Fioletov, V., Hayden, K., Kharol, S. K., Li, S.-M., Makar, P., Martin, R. V., Mihele, C., Mittermeier, R. L., Krotkov, N., Sneep, M., Lamsal, L. N., ter Linden, M., van Geffen, J., Veefkind, P., and Wolde, M.: High-Resolution Mapping of Nitrogen Dioxide With TROPOMI: First Results and Validation Over the Canadian Oil Sands, Geophys. Res. Lett., 46, 1049–1060, https://doi.org/10.1029/2018GL081095, 2019.
Heiden, U., Segl, K., Roessner, S., and Kaufmann, H.: Determination of Robust Spectral Features for Identification of Urban Surface Materials in Hyperspectral Remote Sensing Data, Remote Sens. Environ., 111, 537–552, https://doi.org/10.1016/j.rse.2007.04.008, 2007.
Herman, J., Spinei, E., Fried, A., Kim, J., Kim, J., Kim, W., Cede, A., Abuhassan, N., and Segal-Rozenhaimer, M.: NO2 and HCHO measurements in Korea from 2012 to 2016 from Pandora spectrometer instruments compared with OMI retrievals and with aircraft measurements during the KORUS-AQ campaign, Atmos. Meas. Tech., 11, 4583–4603, https://doi.org/10.5194/amt-11-4583-2018, 2018.
Heue, K.-P., Richter, A., Bruns, M., Burrows, J. P., v. Friedeburg, C., Platt, U., Pundt, I., Wang, P., and Wagner, T.: Validation of SCIAMACHY tropospheric NO2-columns with AMAXDOAS measurements, Atmos. Chem. Phys., 5, 1039–1051, https://doi.org/10.5194/acp-5-1039-2005, 2005.
Heue, K.-P., Wagner, T., Broccardo, S. P., Walter, D., Piketh, S. J., Ross, K. E., Beirle, S., and Platt, U.: Direct observation of two dimensional trace gas distributions with an airborne Imaging DOAS instrument, Atmos. Chem. Phys., 8, 6707–6717, https://doi.org/10.5194/acp-8-6707-2008, 2008.
Holben, B. N., Eck, T. F., Slutsker, I., Tanre, D., Buis, J. P., Setzer, A., Vermote, E., Reagan, J. A., Kaufman, Y. J., Nakajima, T., Lavenu, F., Jankowiak, I., and Smirnov, A.: AERONET – federated instrument network and data archive for aerosol characterization, Remote Sens. Environ., 66, 1–16, 1998.
Huijnen, V., Williams, J., van Weele, M., van Noije, T., Krol, M., Dentener, F., Segers, A., Houweling, S., Peters, W., de Laat, J., Boersma, F., Bergamaschi, P., van Velthoven, P., Le Sager, P., Eskes, H., Alkemade, F., Scheele, R., Nédélec, P., and Pätz, H.-W.: The global chemistry transport model TM5: description and evaluation of the tropospheric chemistry version 3.0, Geosci. Model Dev., 3, 445–473, https://doi.org/10.5194/gmd-3-445-2010, 2010.
Ialongo, I., Virta, H., Eskes, H., Hovila, J., and Douros, J.: Comparison of TROPOMI/Sentinel-5 Precursor NO2 observations with ground-based measurements in Helsinki, Atmos. Meas. Tech., 13, 205–218, https://doi.org/10.5194/amt-13-205-2020, 2020.
Ingmann, P., Veihelmann, B., Langen, J., Lamarre, D., Stark, H., and Courrèges-Lacoste, G. B.: Requirements for the GMES Atmosphere Service and ESA's implementation concept: Sentinels-4/-5 and -5p, Remote Sens. Environ., 120, 58–69, https://doi.org/10.1016/j.rse.2012.01.023, 2012.
Itten, K. I., Dell'Endice, F., Hueni, A., Kneubühler, M., Schläpfer, D., Odermatt, D., Seidel, F., Huber, S., Schopfer, J., Kellenberger, T., Bühler, Y., D'Odorico, P., Nieke, J., Alberti, E., and Meuleman, K.: APEX – the Hyperspectral ESA Airborne Prism Experiment, Sensors, 8, 6235–6259, https://doi.org/10.3390/s8106235, 2008.
Judd, L. M., Al-Saadi, J. A., Janz, S. J., Kowalewski, M. G., Pierce, R. B., Szykman, J. J., Valin, L. C., Swap, R., Cede, A., Mueller, M., Tiefengraber, M., Abuhassan, N., and Williams, D.: Evaluating the impact of spatial resolution on tropospheric NO2 column comparisons within urban areas using high-resolution airborne data, Atmos. Meas. Tech., 12, 6091–6111, https://doi.org/10.5194/amt-12-6091-2019, 2019.
Judd, L. M., Al-Saadi, J. A., Szykman, J. J., Valin, L. C., Janz, S. J., Kowalewski, M. G., Eskes, H. J., Veefkind, J. P., Cede, A., Mueller, M., Gebetsberger, M., Swap, R., Pierce, R. B., Nowlan, C. R., Abad, G. G., Nehrir, A., and Williams, D.: Evaluating Sentinel-5P TROPOMI tropospheric NO2 column densities with airborne and Pandora spectrometers near New York City and Long Island Sound, Atmos. Meas. Tech., 13, 6113–6140, https://doi.org/10.5194/amt-13-6113-2020, 2020.
Kim, H. C., Lee, P., Judd, L., Pan, L., and Lefer, B.: OMI NO2 column densities over North American urban cities: the effect of satellite footprint resolution, Geosci. Model Dev., 9, 1111–1123, https://doi.org/10.5194/gmd-9-1111-2016, 2016.
Kim, J., Jeong, U., Ahn, M.-H., et al.: New Era of Air Quality Monitoring from Space: Geostationary Environment Monitoring Spectrometer (GEMS), B. Am. Meteorol. Soc., 101, E1–E22, https://doi.org/10.1175/BAMS-D-18-0013.1, 2020.
Kleipool, Q. L., Dobber, M. R., De Haan, J. F., and Levelt, P. F.: Earth surface reflectance climatology from 3 years of OMI data, J. Geophys. Res., 113, D18308, https://doi.org/10.1029/2008JD010290, 2008.
Kleipool, Q., Ludewig, A., Babić, L., Bartstra, R., Braak, R., Dierssen, W., Dewitte, P.-J., Kenter, P., Landzaat, R., Leloux, J., Loots, E., Meijering, P., van der Plas, E., Rozemeijer, N., Schepers, D., Schiavini, D., Smeets, J., Vacanti, G., Vonk, F., and Veefkind, P.: Pre-launch calibration results of the TROPOMI payload on-board the Sentinel-5 Precursor satellite, Atmos. Meas. Tech., 11, 6439–6479, https://doi.org/10.5194/amt-11-6439-2018, 2018.
Kowalewski, M. G. and Janz, S. J.: Remote sensing capabilities of the Airborne Compact Atmospheric Mapper, Proc. SPIE 7452, Earth Observing Systems XIV, San Diego, California, USA, 4–5 August 2009, 74520Q, https://doi.org/10.1117/12.827035, 2009.
Kuhlmann, G., Hueni, A., Damm, A., and Brunner, D.: An Algorithm for In-Flight Spectral Calibration of Imaging Spectrometers, Remote Sens.-Basel, 8, 1017, https://doi.org/10.3390/rs8121017, 2016.
Lamsal, L. N., Janz, S. J., Krotkov, N. A., Pickering, K. E., Spurr, R. J. D., Kowalewski, M. G., Loughner, C. P., Crawford, J. H., Swartz, W. H., and Herman, J. R.: High-resolution NO2 observations from the Airborne Compact Atmospheric Mapper: Retrieval and validation: High-Resolution NO2 Observations, J. Geophys. Res.-Atmos., 122, 1953–1970, https://doi.org/10.1002/2016JD025483, 2017.
Lawrence, J. P., Anand, J. S., Vande Hey, J. D., White, J., Leigh, R. R., Monks, P. S., and Leigh, R. J.: High-resolution measurements from the airborne Atmospheric Nitrogen Dioxide Imager (ANDI), Atmos. Meas. Tech., 8, 4735–4754, https://doi.org/10.5194/amt-8-4735-2015, 2015.
Levelt, P. F., van den Oord, G. H., Dobber, M. R., Malkki, A., Visser, H., de Vries, J., Stammes, P., Lundell, J. O., and Saari, H.: The ozone monitoring instrument, IEEE T. Geosci. Remote, 44, 1093–1101, https://doi.org/10.1109/TGRS.2006.872333, 2006.
Loots, E., Babic, L., Braak, R., Dierssen, W., Kissi-Ameyaw, J., Kleipool, Q., Leloux, J., Ludewig, A., Rozemeijer, N., Smeets, J., and Vacanti, G.: Algorithm theoretical basis document for the TROPOMI L01b data processor, S5P-KNMI-L01B-0009-SD Issue 8.0.0, Royal Netherlands Meteorological Institute (KNMI), available at: http://www.tropomi.eu/document/tropomi-l01b-atbd (last access: February 2020), 2017.
Loyola, D. G., Xu, J., Heue, K.-P., and Zimmer, W.: Applying FP_ILM to the retrieval of geometry-dependent effective Lambertian equivalent reflectivity (GE_LER) daily maps from UVN satellite measurements, Atmos. Meas. Tech., 13, 985–999, https://doi.org/10.5194/amt-13-985-2020, 2020.
Marécal, V., Peuch, V.-H., Andersson, C., Andersson, S., Arteta, J., Beekmann, M., Benedictow, A., Bergström, R., Bessagnet, B., Cansado, A., Chéroux, F., Colette, A., Coman, A., Curier, R. L., Denier van der Gon, H. A. C., Drouin, A., Elbern, H., Emili, E., Engelen, R. J., Eskes, H. J., Foret, G., Friese, E., Gauss, M., Giannaros, C., Guth, J., Joly, M., Jaumouillé, E., Josse, B., Kadygrov, N., Kaiser, J. W., Krajsek, K., Kuenen, J., Kumar, U., Liora, N., Lopez, E., Malherbe, L., Martinez, I., Melas, D., Meleux, F., Menut, L., Moinat, P., Morales, T., Parmentier, J., Piacentini, A., Plu, M., Poupkou, A., Queguiner, S., Robertson, L., Rouïl, L., Schaap, M., Segers, A., Sofiev, M., Tarasson, L., Thomas, M., Timmermans, R., Valdebenito, Á., van Velthoven, P., van Versendaal, R., Vira, J., and Ung, A.: A regional air quality forecasting system over Europe: the MACC-II daily ensemble production, Geosci. Model Dev., 8, 2777–2813, https://doi.org/10.5194/gmd-8-2777-2015, 2015.
Meier, A. C., Schönhardt, A., Bösch, T., Richter, A., Seyler, A., Ruhtz, T., Constantin, D.-E., Shaiganfar, R., Wagner, T., Merlaud, A., Van Roozendael, M., Belegante, L., Nicolae, D., Georgescu, L., and Burrows, J. P.: High-resolution airborne imaging DOAS measurements of NO2 above Bucharest during AROMAT, Atmos. Meas. Tech., 10, 1831–1857, https://doi.org/10.5194/amt-10-1831-2017, 2017.
Merlaud, A., Tack, F., Constantin, D., Georgescu, L., Maes, J., Fayt, C., Mingireanu, F., Schuettemeyer, D., Meier, A. C., Schönardt, A., Ruhtz, T., Bellegante, L., Nicolae, D., Den Hoed, M., Allaart, M., and Van Roozendael, M.: The Small Whiskbroom Imager for atmospheric compositioN monitorinG (SWING) and its operations from an unmanned aerial vehicle (UAV) during the AROMAT campaign, Atmos. Meas. Tech., 11, 551–567, https://doi.org/10.5194/amt-11-551-2018, 2018.
Merlaud, A., Belegante, L., Constantin, D.-E., Den Hoed, M., Meier, A. C., Allaart, M., Ardelean, M., Arseni, M., Bösch, T., Brenot, H., Calcan, A., Dekemper, E., Donner, S., Dörner, S., Balanica Dragomir, M. C., Georgescu, L., Nemuc, A., Nicolae, D., Pinardi, G., Richter, A., Rosu, A., Ruhtz, T., Schönhardt, A., Schuettemeyer, D., Shaiganfar, R., Stebel, K., Tack, F., Nicolae Vâjâiac, S., Vasilescu, J., Vanhamel, J., Wagner, T., and Van Roozendael, M.: Satellite validation strategy assessments based on the AROMAT campaigns, Atmos. Meas. Tech., 13, 5513–5535, https://doi.org/10.5194/amt-13-5513-2020, 2020.
Munro, R., Lang, R., Klaes, D., Poli, G., Retscher, C., Lindstrot, R., Huckle, R., Lacan, A., Grzegorski, M., Holdak, A., Kokhanovsky, A., Livschitz, J., and Eisinger, M.: The GOME-2 instrument on the Metop series of satellites: instrument design, calibration, and level 1 data processing – an overview, Atmos. Meas. Tech., 9, 1279–1301, https://doi.org/10.5194/amt-9-1279-2016, 2016.
Nowlan, C. R., Liu, X., Leitch, J. W., Chance, K., González Abad, G., Liu, C., Zoogman, P., Cole, J., Delker, T., Good, W., Murcray, F., Ruppert, L., Soo, D., Follette-Cook, M. B., Janz, S. J., Kowalewski, M. G., Loughner, C. P., Pickering, K. E., Herman, J. R., Beaver, M. R., Long, R. W., Szykman, J. J., Judd, L. M., Kelley, P., Luke, W. T., Ren, X., and Al-Saadi, J. A.: Nitrogen dioxide observations from the Geostationary Trace gas and Aerosol Sensor Optimization (GeoTASO) airborne instrument: Retrieval algorithm and measurements during DISCOVER-AQ Texas 2013, Atmos. Meas. Tech., 9, 2647–2668, https://doi.org/10.5194/amt-9-2647-2016, 2016.
Nowlan, C. R., Liu, X., Janz, S. J., Kowalewski, M. G., Chance, K., Follette-Cook, M. B., Fried, A., González Abad, G., Herman, J. R., Judd, L. M., Kwon, H.-A., Loughner, C. P., Pickering, K. E., Richter, D., Spinei, E., Walega, J., Weibring, P., and Weinheimer, A. J.: Nitrogen dioxide and formaldehyde measurements from the GEOstationary Coastal and Air Pollution Events (GEO-CAPE) Airborne Simulator over Houston, Texas, Atmos. Meas. Tech., 11, 5941–5964, https://doi.org/10.5194/amt-11-5941-2018, 2018.
Pinardi, G., Van Roozendael, M., Hendrick, F., Theys, N., Abuhassan, N., Bais, A., Boersma, F., Cede, A., Chong, J., Donner, S., Drosoglou, T., Dzhola, A., Eskes, H., Frieß, U., Granville, J., Herman, J. R., Holla, R., Hovila, J., Irie, H., Kanaya, Y., Karagkiozidis, D., Kouremeti, N., Lambert, J.-C., Ma, J., Peters, E., Piters, A., Postylyakov, O., Richter, A., Remmers, J., Takashima, H., Tiefengraber, M., Valks, P., Vlemmix, T., Wagner, T., and Wittrock, F.: Validation of tropospheric NO2 column measurements of GOME-2A and OMI using MAX-DOAS and direct sun network observations, Atmos. Meas. Tech., 13, 6141–6174, https://doi.org/10.5194/amt-13-6141-2020, 2020.
Platt, U. and Stutz, J.: Differential Optical Absorption Spectroscopy: Principles and Applications, Springer-Verlag, Berlin, Germany, 2008.
Pope, R. M. and Fry, E. S.: Absorption spectrum (380–700 nm) of pure water. II. Integrating cavity measurements, Appl. Optics, 36, 8710–8723, 1997.
Popp, C., Brunner, D., Damm, A., Van Roozendael, M., Fayt, C., and Buchmann, B.: High-resolution NO2 remote sensing from the Airborne Prism EXperiment (APEX) imaging spectrometer, Atmos. Meas. Tech., 5, 2211–2225, https://doi.org/10.5194/amt-5-2211-2012, 2012.
Porter, J. N., Miller, M., Pietras, C., and Motell, C.: Ship-based sun photometer measurements using microtops sun photometers, J. Atmos. Ocean. Tech., 18, 765–774, 2001.
Richter, A., Burrows, J. P., Nüß, H., Granier, C., and Niemeier, U.: Increase in tropospheric nitrogen dioxide over China observed from space, Nature, 437, 129–132, https://doi.org/10.1038/nature04092, 2005.
Richter, A., Weber, M., Burrows, J. P., Lambert, J.-C., and van Gijsel, A.: Validation strategy for satellite observations of tropospheric reactive gases, Ann. Geophys., 56, https://doi.org/10.4401/ag-6335, 2014.
Schaepman, M. E., Jehle, M., Hueni, A., D'Odorico, P., Damm, A., Weyermann, J., Schneider, F. D., Laurent, V., Popp, C., Seidel, F. C., Lenhard, K., Gege, P., Küchler, C., Brazile, J., Kohler, P., De Vos, L., Meuleman, K., Meynart, R., Schläpfer, D., Kneubühler, M., and Itten, K. I.: Advanced radiometry measurements and Earth science applications with the Airborne Prism Experiment (APEX), Remote Sens. Environ., 158, 207–219, 2015.
Serdyuchenko, A., Gorshelev, V., Weber, M., Chehade, W., and Burrows, J. P.: High spectral resolution ozone absorption cross-sections – Part 2: Temperature dependence, Atmos. Meas. Tech., 7, 625–636, https://doi.org/10.5194/amt-7-625-2014, 2014.
Spurr, R.: LIDORT and VLIDORT: Linearized pseudo-spherical scalar and vector discrete ordinate radiative transfer models for use in remote sensing retrieval problems, in: Light Scattering Reviews 3, edited by: Kokhanovsky, A., Springer, Berlin Heidelberg, 2008.
Stammes, P.: Spectral radiance modeling in the UV-visible range, in: IRS 2000: Current Problems in Atmospheric Radiation, edited by: Smith, W. and Timofeyev, Y., 385–388, A. Deepak, Hampton, Va, 2001.
Sterckx, S., Vreys, K., Biesemans, J., Iordache, M.-D., Bertels, L., and Meuleman, K.: Atmospheric correction of APEX hyperspectral data, Miscellanea Geographica, 20, 16–20, https://doi.org/10.1515/mgrsd-2015-0022, 2016.
Tack, F., Merlaud, A., Iordache, M.-D., Danckaert, T., Yu, H., Fayt, C., Meuleman, K., Deutsch, F., Fierens, F., and Van Roozendael, M.: High-resolution mapping of the NO2 spatial distribution over Belgian urban areas based on airborne APEX remote sensing, Atmos. Meas. Tech., 10, 1665–1688, https://doi.org/10.5194/amt-10-1665-2017, 2017.
Tack, F., Van Roozendael, M., Merlaud, A., Sha, M. K., De Mazière, M., Richter, A., Meier, A., Bovensmann, H., Apituley, A., and Hase, F.: Sentinel-5 Precursor Campaign Implementation Plan, Issue 1, Royal Belgian Institute for Space Aeronomy (BIRA), available at: ftp://ftp-ae.oma.be/pub/from_Frederick.Tack/ESA_S5P_Campaign_Implementation_Plan_v1.0_20180806.pdf (last access: February 2020), 2018.
Tack, F., Merlaud, A., Meier, A. C., Vlemmix, T., Ruhtz, T., Iordache, M.-D., Ge, X., van der Wal, L., Schuettemeyer, D., Ardelean, M., Calcan, A., Constantin, D., Schönhardt, A., Meuleman, K., Richter, A., and Van Roozendael, M.: Intercomparison of four airborne imaging DOAS systems for tropospheric NO2 mapping – the AROMAPEX campaign, Atmos. Meas. Tech., 12, 211–236, https://doi.org/10.5194/amt-12-211-2019, 2019.
Thalman, R. and Volkamer, R.: Temperature Dependent Absorption Cross-Sections of O2–O2 Collision Pairs between 340 and 630 nm and at Atmospherically Relevant Pressure, Phys. Chem. Chem. Phys., 15, 15371–15381, https://doi.org/10.1039/C3CP50968K, 2013.
Vandaele, A.-C., Hermans, C., Simon, P. C., Carleer, M., Colin, R., Fally, S., Mérienne, M.-F., Jenouvrier, A., and Coquart, B.: Measurements of the NO2 absorption cross-section from 42,000 cm−1 to 10,000 cm−1 (238–1000 nm) at 220 K and 294 K, J. Quant. Spectrosc. Ra., 59, 171–184, 1998.
van Geffen, J. H. G. M., Boersma, K. F., Van Roozendael, M., Hendrick, F., Mahieu, E., De Smedt, I., Sneep, M., and Veefkind, J. P.: Improved spectral fitting of nitrogen dioxide from OMI in the 405–465 nm window, Atmos. Meas. Tech., 8, 1685–1699, https://doi.org/10.5194/amt-8-1685-2015, 2015.
van Geffen, J., Eskes, H., Boersma, K., Maasakkers, J., and Veefkind, J.: TROPOMI ATBD of the total and tropospheric NO2 data products, S5P-KNMI-L2-0005-RP Issue 1.3.0, Royal Netherlands Meteorological Institute (KNMI), available at: https://sentinel.esa.int/documents/247904/2476257/Sentinel-5P-TROPOMI-ATBD-NO2-data-products (last access: February 2020), 2018.
van Geffen, J., Boersma, K. F., Eskes, H., Sneep, M., ter Linden, M., Zara, M., and Veefkind, J. P.: S5P TROPOMI NO2 slant column retrieval: method, stability, uncertainties and comparisons with OMI, Atmos. Meas. Tech., 13, 1315–1335, https://doi.org/10.5194/amt-13-1315-2020, 2020.
Veefkind, J., Aben, I., McMullan, K., Förster, H., de Vries, J., Otter, G., Claas, J., Eskes, H., de Haan, J., Kleipool, Q., van Weele, M., Hasekamp, O., Hoogeveen, R., Landgraf, J., Snel, R., Tol, P., Ingmann, P., Voors, R., Kruizinga, B., Vink, R., Visser, H., and Levelt, P.: TROPOMI on the ESA Sentinel-5 Precursor: A GMES mission for global observations of the atmospheric composition for climate, air quality and ozone layer applications, Remote Sens. Environ., 120, 70–83, https://doi.org/10.1016/j.rse.2011.09.027, 2012.
Verhoelst, T., Compernolle, S., Pinardi, G., Lambert, J.-C., Eskes, H. J., Eichmann, K.-U., Fjæraa, A. M., Granville, J., Niemeijer, S., Cede, A., Tiefengraber, M., Hendrick, F., Pazmiño, A., Bais, A., Bazureau, A., Boersma, K. F., Bognar, K., Dehn, A., Donner, S., Elokhov, A., Gebetsberger, M., Goutail, F., Grutter de la Mora, M., Gruzdev, A., Gratsea, M., Hansen, G. H., Irie, H., Jepsen, N., Kanaya, Y., Karagkiozidis, D., Kivi, R., Kreher, K., Levelt, P. F., Liu, C., Müller, M., Navarro Comas, M., Piters, A. J. M., Pommereau, J.-P., Portafaix, T., Prados-Roman, C., Puentedura, O., Querel, R., Remmers, J., Richter, A., Rimmer, J., Rivera Cárdenas, C., Saavedra de Miguel, L., Sinyakov, V. P., Stremme, W., Strong, K., Van Roozendael, M., Veefkind, J. P., Wagner, T., Wittrock, F., Yela González, M., and Zehner, C.: Ground-based validation of the Copernicus Sentinel-5P TROPOMI NO2 measurements with the NDACC ZSL-DOAS, MAX-DOAS and Pandonia global networks, Atmos. Meas. Tech., 14, 481–510, https://doi.org/10.5194/amt-14-481-2021, 2021.
Vlemmix, T., Ge, X., de Goeij, B. T. G., van der Wal, L. F., Otter, G. C. J., Stammes, P., Wang, P., Merlaud, A., Schüttemeyer, D., Meier, A. C., Veefkind, J. P., and Levelt, P. F.: Retrieval of tropospheric NO2 columns over Berlin from high-resolution airborne observations with the spectrolite breadboard instrument, Atmos. Meas. Tech. Discuss. [preprint], https://doi.org/10.5194/amt-2017-257, in review, 2017.
Vreys, K., Iordache, M.-D., Biesemans, J., and Meuleman, K.: Geometric correction of APEX hyperspectral data, Miscellanea Geographica, 20, 11–15, https://doi.org/10.1515/mgrsd-2016-0006, 2016.
Wagner, T., Burrows, J. P., Deutschmann, T., Dix, B., von Friedeburg, C., Frieß, U., Hendrick, F., Heue, K.-P., Irie, H., Iwabuchi, H., Kanaya, Y., Keller, J., McLinden, C. A., Oetjen, H., Palazzi, E., Petritoli, A., Platt, U., Postylyakov, O., Pukite, J., Richter, A., van Roozendael, M., Rozanov, A., Rozanov, V., Sinreich, R., Sanghavi, S., and Wittrock, F.: Comparison of box-air-mass-factors and radiances for Multiple-Axis Differential Optical Absorption Spectroscopy (MAX-DOAS) geometries calculated from different UV/visible radiative transfer models, Atmos. Chem. Phys., 7, 1809–1833, https://doi.org/10.5194/acp-7-1809-2007, 2007.
Wang, P., Stammes, P., van der A, R., Pinardi, G., and van Roozendael, M.: FRESCO+: an improved O2 A-band cloud retrieval algorithm for tropospheric trace gas retrievals, Atmos. Chem. Phys., 8, 6565–6576, https://doi.org/10.5194/acp-8-6565-2008, 2008.
Williams, J. E., Boersma, K. F., Le Sager, P., and Verstraeten, W. W.: The high-resolution version of TM5-MP for optimized satellite retrievals: description and validation, Geosci. Model Dev., 10, 721–750, https://doi.org/10.5194/gmd-10-721-2017, 2017.
Zhao, X., Griffin, D., Fioletov, V., McLinden, C., Cede, A., Tiefengraber, M., Müller, M., Bognar, K., Strong, K., Boersma, F., Eskes, H., Davies, J., Ogyu, A., and Lee, S. C.: Assessment of the quality of TROPOMI high-spatial-resolution NO2 data products in the Greater Toronto Area, Atmos. Meas. Tech., 13, 2131–2159, https://doi.org/10.5194/amt-13-2131-2020, 2020.
Zoogman, P., Liu, X., Suleiman, R., Pennington, W., Flittner, D., Al-Saadi, J., Hilton, B., Nicks, D., Newchurch, M., Carr, J., Janz, S., Andraschko, M., Arola, A., Baker, B., Canova, B., Miller,C. C., Cohen, R., Davis, J., Dussault, M., Edwards, D., Fishman, J., Ghulam, A., Abad, G. G., Grutter, M., Herman, J., Houck, J., Jacob, D., Joiner, J., Kerridge, B., Kim, J., Krotkov, N., Lamsal, L., Li, C., Lindfors, A., Martin, R., McElroy, C., McLinden, C., Natraj, V., Neil, D., Nowlan, C., O'Sullivan, E., Palmer, P., Pierce, R., Pippin, M., Saiz-Lopez, A., Spurr, R., Szykman, J., Torres, O., Veefkind, J., Veihelmann, B., Wang, H., Wang, J., and Chance, K.: Tropospheric emissions: Monitoring of pollution (TEMPO), J. Quant. Spectrosc. Ra., 186, 17–39, https://doi.org/10.1016/j.jqsrt.2016.05.008, 2017.
- Abstract
- Introduction
- S5PVAL-BE campaign
- Observation systems
- NO2 VCD retrieval algorithm
- Results
- Subpixel NO2 variability and spatial smearing
- Conclusions
- Appendix A: Tropospheric NO2 VCD statistics for coincident TROPOMI and APEX pixels
- Code availability
- Data availability
- Author contributions
- Competing interests
- Acknowledgements
- Review statement
- References