the Creative Commons Attribution 4.0 License.
the Creative Commons Attribution 4.0 License.
 | 04 Nov 2021
Constraining the response factors of an extractive electrospray ionization mass spectrometer for near-molecular aerosol speciation
Chuan Ping Lee
Jordan E. Krechmer
Francesca Majluf
Yandong Tong
Manjula R. Canagaratna
Julia Schmale
André S. H. Prévôt
Urs Baltensperger
Josef Dommen
Jay G. Slowik
Online characterization of aerosol composition at the near-molecular level is key to understanding chemical reaction mechanisms, kinetics, and sources under various atmospheric conditions. The recently developed extractive electrospray ionization time-of-flight mass spectrometer (EESI-TOF) is capable of detecting a wide range of organic oxidation products in the particle phase in real time with minimal fragmentation. Quantification can sometimes be hindered by a lack of available commercial standards for aerosol constituents, however. Good correlations between the EESI-TOF and other aerosol speciation techniques have been reported, though no attempts have yet been made to parameterize the EESI-TOF response factor for different chemical species. Here, we report the first parameterization of the EESI-TOF response factor for secondary organic aerosol (SOA) at the near-molecular level based on its elemental composition. SOA was formed by ozonolysis of monoterpene or OH oxidation of aromatics inside an oxidation flow reactor (OFR) using ammonium nitrate as seed particles. A Vocus proton-transfer reaction mass spectrometer (Vocus-PTR) and a high-resolution aerosol mass spectrometer (AMS) were used to determine the gas-phase molecular composition and the particle-phase bulk chemical composition, respectively. The EESI response factors towards bulk SOA coating and the inorganic seed particle core were constrained by intercomparison with the AMS. The highest bulk EESI response factor was observed for SOA produced from 1,3,5-trimethylbenzene, followed by those produced from d-limonene and o-cresol, consistent with previous findings. The near-molecular EESI response factors were derived from intercomparisons with Vocus-PTR measurements and were found to vary from 103 to 106 ion counts s−1 ppb−1, mostly within ±1 order of magnitude of their geometric mean of 104.6 ion counts s−1 ppb−1. For aromatic SOA components, the EESI response factors correlated with molecular weight and oxygen content and inversely correlated with volatility. The near-molecular response factors mostly agreed within a factor of 20 for isomers observed across the aromatics and biogenic systems. Parameterization of the near-molecular response factors based on the measured elemental formulae could reproduce the empirically determined response factor for a single volatile organic compound (VOC) system to within a factor of 5 for the configuration of our mass spectrometers. The results demonstrate that standard-free quantification using the EESI-TOF is possible.
- Article
(2470 KB) - Full-text XML
-
Supplement
(1787 KB) - BibTeX
- EndNote


Suspended particulate matter, or aerosol, is ubiquitous in the troposphere with far-reaching implications for public health, air quality, and climate (Jimenez et al., 2009; Dockery et al., 1993). The aerosol composition can have large spatiotemporal variations, evolving over the course of a week or changing drastically within a matter of seconds, depending on the emission source, meteorology, and atmospheric chemistry. Large discrepancies have been reported between ambient observations and modelling results (Volkamer et al., 2006; Tsigaridis et al., 2014). Real-time aerosol speciation is therefore required to temporally resolve and understand aerosol dynamics. To this end, an aerosol mass spectrometer (AMS) using flash vaporization and electron impact (EI) ionization serves as a reliable quantification method to determine the bulk composition of PM1 or PM2.5 (i.e. particles with an aerodynamic diameter < 1 or < 2.5 µm, respectively) over long periods of time both online (DeCarlo et al., 2006; Jimenez et al., 2009; Ng et al., 2011) and offline (Daellenbach et al., 2016). However, the extensive thermal and EI-induced fragmentations render the technique ill-suited to inferring the molecular identity of individual components, with very few exceptions (Alfarra et al., 2007; Budisulistiorini et al., 2013). More recent techniques such as the Filter Inlet for Gases and AEROsols (FIGAERO; Lopez-Hilfiker et al., 2014) and the Chemical Analysis of Aerosol Online (CHARON) inlet (Müller et al., 2017; Eichler et al., 2015) utilize chemical ionization mass spectrometry (CIMS) instead. Although CIMS is a much “softer” ionization technique than EI, ionization-induced fragmentation still occurs to some extent depending on the analyte, e.g. during proton-transfer reaction (PTR) used by the CHARON (Leglise et al., 2019; Murschell et al., 2017; Duncianu et al., 2017). Furthermore, the need for thermal volatilization to convert the particles to vapours before ionization may introduce artefacts from the decomposition of thermally labile compounds (Leglise et al., 2019; Stark et al., 2017; Zhao et al., 2019).
In contrast, the extractive electrospray ionization (EESI) mass spectrometry (MS) can be used for online aerosol analysis without sample preparation (Gallimore and Kalberer, 2013; Chen et al., 2006; Lopez-Hilfiker et al., 2019; Doezema et al., 2012), reducing associated artefacts. Electrospray ionization (ESI) is known to be a soft ionization technique, capable of preserving even non-covalent interactions, e.g. protein–protein interactions (Siuzdak et al., 1996), though some fragmentation reactions have been reported to occur within the ESI droplet (Rovelli et al., 2020). In EESI, charged droplets generated by an electrospray (ES) collide with the analyte aerosol. A denuder is used to strip gas-phase species and reduce measurement interference. Soluble particulate analytes are extracted by the charged droplets and ionized via Coulomb explosions as the charged droplets rapidly evaporate (Kebarle and Peschke, 2000). The addition of sodium iodide (NaI) to the ES solution as a dopant suppresses unwanted ionization pathways (e.g. H+ transfer), resulting in predominately the formation of Na+ adduct, . With this ionization scheme, the recently developed EESI time-of-flight mass spectrometer (EESI-TOF) is able to achieve detection limits on the order of 1–10 ng m−3 for compounds like raffinose and dipentaerythritol on the timescale of 5 s (Lopez-Hilfiker et al., 2019). The low detection limit and fast time resolution of the EESI-TOF have enabled real-time near-molecular speciation of organic aerosol (i.e. identification of the chemical formulae of molecular ions) for various laboratory and field applications, both indoors and outdoors (Brown et al., 2021; Lopez-Hilfiker et al., 2019; Pagonis et al., 2021; Pospisilova et al., 2020; Qi et al., 2019; Stefenelli et al., 2019). Further adaptation of the EESI with the Orbitrap mass analyser potentially allows for structural elucidation using online tandem mass spectrometry, in addition to unambiguous assignment of the chemical formulae (Lee et al., 2020).
Tests with authentic standards show that the EESI-TOF can quantify target inorganic and organic analytes present in complex sample matrices (Fang et al., 2016; Giannoukos et al., 2020; Lopez-Hilfiker et al., 2019; Wu et al., 2013). However, the relative ionization efficiencies (RIEs) of EESI or ESI (where the analyte is directly infused into the ES solution) towards different compounds could vary by orders of magnitude depending on the instrument setting, sample matrices, electrospray solutions, and other experimental conditions (Kruve et al., 2013; Liigand et al., 2018; Kruve et al., 2014; Oss et al., 2010; Mayhew et al., 2020; Lopez-Hilfiker et al., 2019). For instance, the EESI response factors for two carboxylic acids, citric acid (C6H8O7) and azelaic acid (C9H16O4), differ by 1–2 orders of magnitude when detected as Na+ adducts () using a 50 50 methanol water ES solvent spiked with 100 ppm NaI (Lopez-Hilfiker et al., 2019). Similarly, the RIE of varies by 4 orders of magnitude for a selection of 19 standard compounds detected with ESI using a mixture of acetornitrile (80 % ) and 0.1 M sodium acetate solution in water (20 % ) as the ES solution (Kruve et al., 2013).
In this study, we estimate the EESI-TOF response factors to various particle-phase species found in biogenic and anthropogenic SOA. In lieu of authentic standards for SOA, which comprises complex mixtures of hundreds of unique compounds, we compare the EESI-TOF measurements with established quantitative and semi-quantitative techniques to constrain the bulk and near-molecular response factors. Our results show that the EESI-TOF response factor to SOA components varies from 103 to 106 cps ppb−1 (cps is ion counts per second) with structural dependencies, as evidenced in the differences for isomers observed across multiple systems. In general, response factors were observed to increase with the analyte molecule size and oxygen content. Based on properties derived from the measured elemental formula, regression models could predict the response factor of individual ions to within a factor of 5 of the measured values when the identity of the precursor volatile organic compound is known.
2.1 Oxidation flow reactor
Oxidation reactions took place inside a Pyrex oxidation flow reactor (OFR) with an inner diameter of 7.4 cm and a length of 104 cm, which has been described previously (Molteni et al., 2018). Instruments sampled from the outlet of the OFR. The total flow rate inside the OFR was maintained at 12 L min−1, resulting in a plug flow velocity of 0.0465 m s−1. Excess flow was vented to avoid overpressure in the OFR. Approximately 1–2 mL of d-limonene (Sigma-Aldrich, 97 %), o-cresol (“cresol”, Sigma-Aldrich, ≥99 %), or 1,3,5-trimethylbenzene (“TMB”, Sigma-Aldrich, 98 %) was placed inside a glass vial connected orthogonally to a dry clean air carrier flow to supply volatile organic compound (VOC) precursors. Dry clean air and VOC precursors were injected near the entrance region of the OFR (x=0 cm), whereas ozone (O3) was injected further downstream (x=72 cm) coaxially into the centre of the OFR, as illustrated in Fig. S1 in the Supplement, resulting in an effective oxidation time of 8.4 s. O3 was generated using a mercury lamp with dry clean air. For experiments with aromatic precursors, tetramethylethylene (TME, Sigma-Aldrich, ≥99 %) was injected together with the VOC precursors to generate OH radicals via TME ozonolysis. In the absence of TME (and thereby OH), ozonolysis of aromatics is negligible (Atkinson and Arey, 2003). VOC and O3 injection rates were adjusted to minimize nucleation inside the OFR. When it was necessary to promote condensation of organic vapours, ammonium nitrate (NH4NO3) seed particles were generated from 0.0025 to 0.3 M aqueous solutions using a nebulizer, dried by a rubin silica gel diffusion dryer, and injected near the entrance of the OFR. A multichannel activated charcoal denuder was used to remove possible gas-phase contaminants generated during ammonium nitrate nebulization. The particle count mean diameter of the polydisperse seed aerosol ranged from 60 to 100 nm during seed injections.
2.2 Gas-phase quantification
O3 concentration was measured using an O3 monitor (Thermo 49C). VOC precursors and oxidation products were measured using a Vocus proton-transfer reaction long-time-of-flight mass spectrometer (Vocus-PTR), which has a mass resolving power () of approximately 8000 at a mass-to-charge ratio () of 200 (Vocus-PTR, Tofwerk, AG). The design and operations of the Vocus-PTR and other proton-transfer reaction mass spectrometer (PTR-MS) are described in detail elsewhere (Krechmer et al., 2018; Yuan et al., 2017). Ionization of an analyte, M, occurs via proton transfer with the H3O+ reagent ion inside the PTR drift tube if M has a higher proton affinity than H3O+:
Depending on the drift tube setting and the proton affinity of M, Reaction (R1) is reversible. If H3O+ depletion is negligible, as is the case in this study, the abundance of ion scales linearly with the concentration of M with a slope equal to the product of the species-dependent reaction rate constant kMH, drift time Δt, and the H3O+ reagent ion abundance. The proton-transfer reaction is exothermic, and the ionization-induced fragmentation occurs to varying degrees (∼ 0 % to ∼ 100 %) as the result of dehydration, H2 elimination, alkyl group loss, or HNO3 loss (Claflin et al., 2021; Duncianu et al., 2017; Leglise et al., 2019; Pagonis et al., 2019; Yuan et al., 2017), which can be represented by the term . The observed intensity of any ion is also a function of the ion abundance, , and ion transmission efficiency, . All together, the sensitivity for an analyte normalized to a H3O+ signal of 106 cps is expressed as follows (Sekimoto et al., 2017; Cappellin et al., 2012; Yuan et al., 2017):
where N is the number density of gas inside the drift tube. The overall ion transmission efficiency is a function of as determined by the ion optics and TOF extraction duty cycle. For the Vocus-PTR, the mass transmission efficiency was fitted to a lognormal function, as shown in Fig. S2a, levelling out at approximately 0.175 relative to the maximum transmission at ∼ 95. The reaction rate coefficient is dependent on the polarizability, α, and the permanent dipole moment of the analyte, μD. For similarly functionalized compounds, α linearly correlates with the molecular weight (MW), whereas μD is independent of MW (Sekimoto et al., 2017). Given the molecular weight and the elemental composition, consisting of only carbon (C), hydrogen (H), and oxygen (O) for the oxidation products of interest in the present study, the kMH values estimated using parameterization should agree within 50 % of the measured values, provided that the ion transmission efficiency and fragmentation behaviour for the analyte is known (Sekimoto et al., 2017). The calculated kMH values correlate linearly with the measured sensitivities for the calibrants used, as shown in Fig. S2b. Since the kMH parameterization was derived using non-oxygenated or lightly oxygenated species (i.e. number of oxygen nO≤2), the estimated kMH values would become more uncertain as we apply the parameterization for more oxygenated species. In addition, FMH is known to vary with functionalization and, in general, increase with the size of the molecule (Yuan et al., 2017), which may result in differing sensitivities for isomers and more underestimated sensitivities for larger molecules. A detailed characterization of kMH and FMH is beyond the scope of the current study. Instead, we assume a 50 % uncertainty for the estimated Vocus-PTR sensitivity as reported by Sekimoto et al. (2017) and propagate this uncertainty in subsequent analyses.
In this study, the Vocus-PTR core-sampled at 0.1 L min−1 from 4 L min−1 of air drawn from the OFR via a in. (outer diameter, o.d.) Teflon line ∼ 0.2 m in length. The Vocus-PTR differs from a traditional PTR-MS in its reagent ion source design, as well as in the use of a quadrupole-based focusing ion–molecule reactor (fIMR) instead of a standard drift tube (Krechmer et al., 2018). Comparison of the Vocus-PTR with traditional quadrupole and TOF PTR-MSs shows that it has much better sensitivity (1–3 orders of magnitude), with the estimated and measured sensitivities mostly agreeing within a factor of 2 (Holzinger et al., 2019). The Vocus fIMR reactor was heated and maintained at 60 ∘C, with an axial gradient of 330 V, and a pressure of 2.5 mbar. The reduced electric field () value is estimated to be 59 Td. Vocus-PTR data were analysed using Tofware 3.2 (Tofwerk, AG) in Igor Pro 8.
2.3 Particle-phase quantification
A high-resolution time-of-flight aerosol mass spectrometer (AMS, Aerodyne Research Inc.) was used to measure the bulk chemical composition of non-refractory (NR) aerosol (Canagaratna et al., 2007; DeCarlo et al., 2006). Samples were drawn at 1.27 cm3 s−1 through a 100 µm critical orifice and then focused by a PM2.5 aerodynamic lens (Peck et al., 2016; Williams et al., 2013; Xu et al., 2017). The AMS operated in mass spectrum (MS) mode with a 1 min time resolution, where the chopper alternated between the closed (i.e. particle beam blocked) and the open (i.e. particle beam unobstructed) positions to produce the difference spectra for aerosol quantification. The ionization efficiencies of ammonium (NH), nitrate (NO), and sulfate (SO) ions were calibrated using 300 nm size-selected NH4NO3 and (NH4)2SO4 aerosol at the beginning and end of the campaign by following the standard protocols (Canagaratna et al., 2007; DeCarlo et al., 2006). The relative ionization efficiencies for NH and SO, RIE and RIE, were measured to be 4.01 and 1.24, respectively. Default relative ionization efficiency is assumed for organics at 1.4 without applying any correction based on the average oxidation state of carbon (OSC). AMS data were analysed in Igor Pro 6.37 (WaveMetrics, Inc.) using the Squirrel (version 1.60G) and Pika (1.20G) analysis packages. When sampling high concentrations of inorganic salts (e.g. NH4NO3), CO ions could be produced from organic residues at the vaporizer surface, leading to overestimation of the organic aerosol (OA) mass (Pieber et al., 2016). Characterization and correction of the vaporizer artefacts are shown in Fig. S3. The particle size distribution was monitored using a scanning mobility particle sizer (SMPS 3938, TSI). The total particle mass concentration is calculated from the total particle volume concentration measured by the SMPS assuming that OA-coated seed particles, which are comprised predominately (>90 %) of NH4NO3, have the same density as pure NH4NO3 aerosol at 1.69 g cm−3 (Sarangi et al., 2016). To account for the AMS collection efficiency, the OA concentration is calculated by multiplying the OA mass fraction as measured by the AMS (after accounting for the vaporizer effect) with the total particle mass concentration as calculated from SMPS measurements.
2.4 Extractive electrospray ionization
An extractive electrospray ionization mass spectrometer, EESI-TOF (Tofwerk AG), was used for online, near-molecular organic aerosol speciation (Lopez-Hilfiker et al., 2019). The mass resolving power () was approximately 4200 at 200. The electrospray (ES) was generated from a 1 : 1 water : acetonitrile solution containing 100 ppm of NaI dopant delivered through a fused-silica capillary with a 150–250 mbar backing pressure at an electrical potential of 2.7–2.9 kV relative to the MS atmospheric pressure interface. The ion capillary at the MS interface was heated to 270 ∘C to facilitate ES droplet evaporation for analyte ionization. Whereas adduct formation with metal cations obfuscates analyses by traditional (+)ESI techniques that rely on the pathway, the intentional use of NaI for EESI ensures that Na+ adduct formation () is the dominant ionization pathway for organic aerosol components. This makes the EESI technique more robust against salt impurities (e.g. from aerosol samples, glassware, or solution) and ionization-induced fragmentations as compared to the pathway (Kruve et al., 2013). In addition to ions, acetonitrile–Na+ adducts (i.e. ) were observed in the mass spectra, along with negligible quantities of water–Na+ adducts (i.e. ) and ions. Analytes with labile hydrogen atoms, such as carboxylic acids or amines, could produce ions, where n corresponds to the number of labile hydrogen atoms exchanged with Na. We expect the abundance of relative to to be minor based on testing with standards (i.e. < 10% for cis-pinonic acid). The NH4NO3 seed particles were detected as [NaNO3+Na]+ by the EESI-TOF.
Samples were drawn at 1 L min−1 through a multichannel extruded carbon denuder with a >99.6 % gas-phase removal efficiency (e.g. for pinonic acid) (Tennison, 1998) placed immediately upstream of the ionization region. A manifold was placed upstream of the carbon denuder to direct the sample flow through either a high-efficiency particulate air filter (HEPA, Pall Corporation) to determine the background or a straight 10 mm o.d. stainless-steel tube to measure the aerosol composition. The manifold performed automated switching between the filtered and direct sampling periods, which lasted 1 and 5 min, respectively. For an analyte, x, the interconversion of the mass concentration, Massx, and the measured analyte ion intensity after background subtraction, Ix, depends on several factors as described in Lopez-Hilfiker et al. (2019):
where F is the inlet flow rate at 1 L min−1; MWx is the molecular weight of the neutral species x; EEx is the liquid-phase extraction efficiency inside the ES droplet; CEx is the collection efficiency of ES droplets by the ion capillary; IEx is the ionization efficiency during the ES evaporation process; and TE is the mass transmission efficiency, which depends on the ion optics settings. For simplicity, the four efficiency factors are jointly expressed by the response factor (RFx) instead:
To determine the EESI-TOF RFx on the near-molecular level, we estimated the concentration of condensed organic compounds during each seed injection, Pcond, based on the observed decrease in the gas-phase mixing ratios (in parts per billion, ppb) as measured by the Vocus-PTR. For consistency and ease of comparison with the Vocus-PTR, we define a response factor, RF, in terms of cps ppb−1:
The RF value corresponds to the slope of Ix as a linear function of Pcond,x. Similar results for RF were obtained using ordinary least squares (OLS) and orthogonal distance regression (ODR), as shown in Fig. S7. In order to propagate various uncertainties, including that of Vocus-PTR calibration factors, we report the RF values obtained using ODR in subsequent analyses. The RFx in cps molec.−1 (Eq. 3) can be converted to RF in cps ppb−1 (Eq. 4) using the instrument flow rate (∼ 1 L min−1 in this study) and the definition of the mixing ratio (1 ppb ≈ 2.46 × 10¹⁰ molec. cm−3 at 1 atm and 298 K). The RF towards dry, polydisperse levoglucosan (i.e. 1,6-anhydro-β-D-glucose, Sigma-Aldrich, >99 %) particles nebulized from aqueous solutions was approximately 7730±2130 cps ppb−1, or roughly 1170±320 cps of [C6H10O5 + Na]+ observed per µg m−3 of levoglucosan particles sampled.
2.5 Gas–particle partitioning
In the absence of vapour wall loss, the expected condensed concentration of an analyte x during seed particle injection, Pcond,x, is equal to the decrease in its gas-phase concentration, ΔGasx, increasing with the condensation sink (CS), which can be calculated from the observed particle size distribution:
where D is the gas diffusivity in m2 s−1, βi is the Fuchs–Sutugin correction factor for gas-phase diffusion over particles in the transition regime for particles in the ith size bin, dp,i is the particle diameter of bin i, and Ni is the particle number in bin i. In estimating βi, the mass accommodation coefficient was assumed to be unity (Kulmala and Wagner, 2001). The Knudsen number (Kn) is estimated based on the pressure normal mean free path, λP (Tang et al., 2015). The gas diffusivity estimated using Fuller's method (Fuller et al., 1966; Tang et al., 2015) ranges from to m2 s−1 for C3H6 and C20H32O16, respectively. A list of Kn, β, and D values estimated assuming a particle diameter of 100 nm is shown in Table S1 for selected CH and CHO compounds. A mean D value of m2 s−1 is assumed for the CS calculation.
In practice, the vapour wall loss is non-negligible, and the Pcond,x is expected to be higher than the observed ΔGasx. The effect of the vapour wall loss rate on the gas–particle partitioning behaviour during each seed injection is modelled using KinSim v4.05 (Peng and Jimenez, 2019) in Igor Pro 8. For simplicity, generic oxidation products of varying assumed saturation vapour concentrations (i.e. 10−2 µg m µg m−3) were used for the model in lieu of explicit representations of the oxidation chemistries for all three VOC systems, which are beyond the scope of the current study (see Sect. S5 in the Supplement for further details). For gas and/or particle species observed by the Vocus-PTR and/or EESI-TOF, the saturation vapour concentration at room temperature, C∗ (298 K), is estimated using the molecular corridor approach (Li et al., 2016), based on the framework developed originally for the two-dimensional volatility basis set (Donahue et al., 2011):
where is the reference carbon number; nC and nO are the number of carbon and oxygen atoms, respectively; bC and bO are the corresponding parameterization values for a specific compound class (e.g. CHO); bCO is the coefficient for the carbon–oxygen non-ideality, , hereafter referred to as NICO. Note that terms involving nitrogen- and sulfur-containing compounds are not shown as the current work focuses on oxidized organic compounds (i.e. CHO) only. For CHO compounds, the , bC, bO, and bCO values are 22.66, 0.4481, 1.656, and −0.779, respectively (Li et al., 2016). For highly oxygenated molecules (HOM), alternative , bC, bO, and bCO values, e.g. 25, 0.475, 0.2, and 0.9, respectively, have been proposed to better account for the abundance of −OOH functional groups, which decreases the saturation vapour pressure less than for combined −OH and =O functional groups (Mohr et al., 2019; Tröstl et al., 2016; Pankow and Asher, 2008). To accommodate the large range of oxidation products observed (e.g. CxHyOn where n ranges from 1 to 9) in the particle phase which span from HOM to singly oxygenated molecules, the formulation derived by Li et al. (2016) is applied to all molecular formulae.
2.6 Estimation and regression analysis of RF
Regression analyses on the logarithm of RIE of Na+ adducts observed by (+)ESI suggest that ion–dipole interactions and chelation enhance Na+ adduct formation efficiency (Guo et al., 1989; Kruve et al., 2013). The logarithm of RIE is also observed to increase as the logarithm of the vacuum-solvent partitioning coefficient becomes more negative (Kruve et al., 2013). Insights into the determining factors for the EESI-TOF RF of Na+ adduct ions may be gained through similar analysis. Because the Vocus-PTR and EESI-TOF could only determine the molecular formula of the analytes, regression of RF was performed using the elemental composition (i.e. nC, nH, nO) and their derivative properties as features, such as the carbon–oxygen non-ideality, NICO (the ) term in Eq. 6), double-bond equivalent (DBE, Eq. S16), and aromaticity (Xc, Eq. S17). Feature values were standardized (i.e. subtracted by the mean value and divided by the standard deviation) prior to fitting so that their relative importance could be compared based on their fitting coefficients. In total, 15 potential features were included in the initial analysis using six different regressors from the scikit-learn 0.23.1 packages in Spyder 4.1.4 and Python 3.8.3. Note that the model performance does not improve monotonically with the number of features used. The optimal set of features for each model was identified using default model hyperparameters to achieve a balance between goodness of fit (i.e. higher coefficient of determination, R2, Eq. S21) and model complexity (i.e. lower number of features). Results obtained using linear ridge regression (LRR) and gradient boosting regression (GBR) are discussed in the main text. LRR instead of ordinary least squares (OLS) regression was chosen to handle multicollinearity and overfitting issues during regression with the use of L2 regularization, i.e. by adding a term proportional to the sum of the square of feature weights () to the cost function. A nonparametric, decision-tree-type regressor such as GBR was chosen because it is expected to be better than linear regressors at handling possible interactions in the feature space, where an exhaustive search of all possible non-linear combinations of features is not feasible using linear regressors. Studies with ESI on the RIE of ions have reported significant improvement in prediction ability by random forest regression models (e.g. within ±1 order of magnitude of the expected values) compared to multiple linear regression models (e.g. within ±2 orders of magnitude of the expected values) for calibration standards (Liigand et al., 2020; Mayhew et al., 2020). See Sect. S7 in the Supplement for further details on the feature selection, model cross-validation, and model selection.
3.1 Near-molecular response factors
As shown for OH oxidation of TMB, the EESI-TOF signals responded promptly to each seed injection, as indicated by the rising OA concentration and CS in Fig. 1a and c, respectively. During each seed injection, the EESI-TOF observed growth in signal from a wide range of oxidation products (e.g. CxHyO1–9), with C9H14O3–9 shown in Fig. 1a. In Fig. 1c, decreases in gas-phase concentration during seed injections are observed by the Vocus-PTR at the same time as the increase in the EESI-TOF signals, though the change is hardly discernable under low CS conditions (< 0.1 s−1) due to competition for condensable species by the OFR wall. The SOA composition as measured by the EESI-TOF, averaged over all uptakes, is shown for cresol, TMB, and limonene oxidation products in Fig. S5a, b, and c, respectively. Significant contributions by C10 and C12 ions to the average EESI-TOF mass spectra were observed for SOA produced from OH oxidation of cresol and TMB, respectively, indicative of gas-phase dimer formation involving the RO2 radical of TME (used as an OH source) via RO2+R′O2 cross reactions (Berndt et al., 2018). In contrast, the signal of O3–limonene products was dominated by C8–10 ions, with negligible contribution from ions corresponding to dimers. Ions corresponding to small, volatile species (e.g. lightly oxidized C2 to C5 compounds) which are not expected in the particle phase were also observed, as shown in Fig. S5a–c, which may be an indication of some extent of ion fragmentation with the EESI-TOF. A comparison of the major oxidation products, e.g. those having the same carbon number as the precursor VOC, between the EESI-TOF particle-phase and Vocus-PTR gas-phase measurements are shown in Fig. 1b and d for the TMB runs, as well as in Fig. S6a–f for all VOC systems studied. While EESI-TOF particle-phase measurements suggest that C9H14Ox compounds are collectively much more abundant than either C9H12Ox or C9H16Ox compounds, Vocus-PTR gas-phase measurements suggest that C9H12Ox was more than 10 times more abundant than C9H14Ox, as shown in Fig. 1b and d. Similar discrepancies were observed for OH–cresol and O3–limonene oxidation products regarding the relative intensity of C7HOx and C10H14,16Ox, respectively. These disagreements cannot be explained by gas-to-particle partitioning: for example, the EESI-TOF signal intensity ratios of C9H14O4 to C9H12O4 and C9H14O5 to C9H12O5 are 1.6 and 10.5, respectively, while the Vocus-PTR gas-phase concentration ratios of C9H14O4 to C9H12O4 and C9H14O5 to C9H12O5 are 0.1 and 1.4, respectively, as shown in Fig. 1b and d. Given the same carbon and oxygen contents, the partitioning behaviours of C9H12Ox and C9H14Ox should be similar to each other. Different factors may contribute to the discrepancies between Fig. 1b and d, such as differences in the relative response factor of the EESI-TOF and/or Vocus-PTR to these compounds (e.g. C9H12Ox vs. C9H14Ox). For instance, a comparison of gas-phase measurements by nitrate ion atmospheric pressure chemical ionization, iodide ion chemical ionization, and the Vocus-PTR shows that they differ in the reported relative abundances of OH–TMB oxidation products (Wang et al., 2020). In addition, artefacts such as ion fragmentation are known to occur for PTR-based techniques (Yuan et al., 2017), which could be substantial (>70 %) for limonene oxidation products (Claflin et al., 2021; Pagonis et al., 2019); the formation of adducts in the EESI-TOF, which has been reported previously to occur to a minor extent (Lopez-Hilfiker et al., 2019), also contributes to the discrepancies between the EESI-TOF and Vocus-PTR. These uncertainties complicate our data interpretation but do not change the overall trend in the sensitivity estimation, as shown below in Fig. 3. A detailed characterization of the extent of ionization-related artefacts is beyond the scope of this study. For simplicity, it is assumed that fragmentation in the Vocus-PTR or adduct formation in the EESI-TOF was negligible for the remainder of the study unless specified otherwise.

Figure 1(a) Time series of particle-phase OH–TMB oxidation products, C9H14Ox observed as Na+ adduct ions by the EESI-TOF and the total organic aerosol concentration as observed by the AMS during three separate seed injection events. (b) Relative abundances of C9H12−20O1–9 in the particle phase based on the ion intensities observed by the EESI-TOF averaged over all seed injection events. (c) Time series of select gas-phase C9H14Ox products observed as protonated ions by the Vocus-PTR and the estimated condensation sink. (d) Relative abundances of C9H12–20O1–9 in the gas phase based on the mixing ratios estimated by the Vocus-PTR averaged over all steady-state periods prior to the seed injection events. The decrease in EESI-TOF intensity in (a) at 25 min corresponds to an automated background filter measurement. The gap in the Vocus-PTR time series in (c) at around 16 min corresponds to an automated background zero air measurement.
In the absence of any organic vapour wall loss, the amount of condensed organic material, Pcond, in response to seed injection is equal to the decrease in the gas-phase concentration, ΔGas. In the presence of vapour wall loss, the expected Pcond would be greater than the observed ΔGas. In addition, for sufficiently volatile species, the relative change in the gas-phase concentration is small. This makes quantification of Pcond and ΔGas based on the difference between the remaining gas-phase concentration Gremain, from the steady-state concentration GSS, increasingly untenable. The sensitivity of Pcond, Gremain, and ΔGas to changes in the wall loss rate kw, organic aerosol (OA) concentration, condensation sink CS, and saturation vapour concentration C∗ are modelled using KinSim and shown in Fig. 2a–c, assuming a base case condition of 0.04 s−1 for kw, 20 µg m−3 for OA, and 1 s−1 for the CS. As shown in Fig. 2a–b for species with C∗ below 10−2 µg m−3 (e.g. low volatility and extremely low volatility organic compounds), the amount of vapour condensed is determined primarily by the CS and kw, where the back reaction (i.e. evaporation from the particle phase) is negligible. Conversely, for species with C∗ above 104 µg m−3 (e.g. intermediate-volatility and volatile organic compounds), negligible condensation (i.e. Pcond and ΔGas are < 1% of GSS) can be expected. Figure 2c suggests that Pcond and Gremain are expected to be linearly anti-correlated, regardless of C∗, where the slope becomes steeper as kw increases. By extension, at a given CS and OA concentration, Pcond could be calculated from the change in gas-phase concentration, ΔGas (i.e. GSS−Gremain) by applying a uniform, kw-dependent scaling factor.
The expected behaviour of Pcond under observed CS and OA conditions for compounds of varying C∗ is modelled and shown in Fig. 2d, which suggests that it may be possible to constrain the C∗ of some semi-volatile compounds based on Pcond (normalized to its maximum observed value) as a function of the CS using only EESI-TOF data if the GSS is constant between seed injections. To identify the applicable C∗ range, we calculated the ratio of Pcond to GSS for compounds of different C∗ at different CS conditions as shown in Fig. 2e. The inter-correlations of the normalized Pcond for compounds of different C∗, similar to those shown in Fig. 2d, are shown in Fig. 2f for the TMB system, where the maximum CS fitted was 0.83 s−1. For compounds with log (C∗) lower than 1.18 or higher than 2.09, the normalized Pcond trends are indistinguishable from those with lower or higher C∗, respectively, as shown in Fig. 2d and f. While possible, constraining the C∗ of OA components based solely on the particle uptake is limited to a narrow C∗ range under our experimental conditions. Increasing the CS and/or OA concentration could extend the constrainable C∗ range, albeit at the risk of primary ion suppression under high loading conditions. See Sect. 5 and Fig. S4 in the Supplement for further discussions.
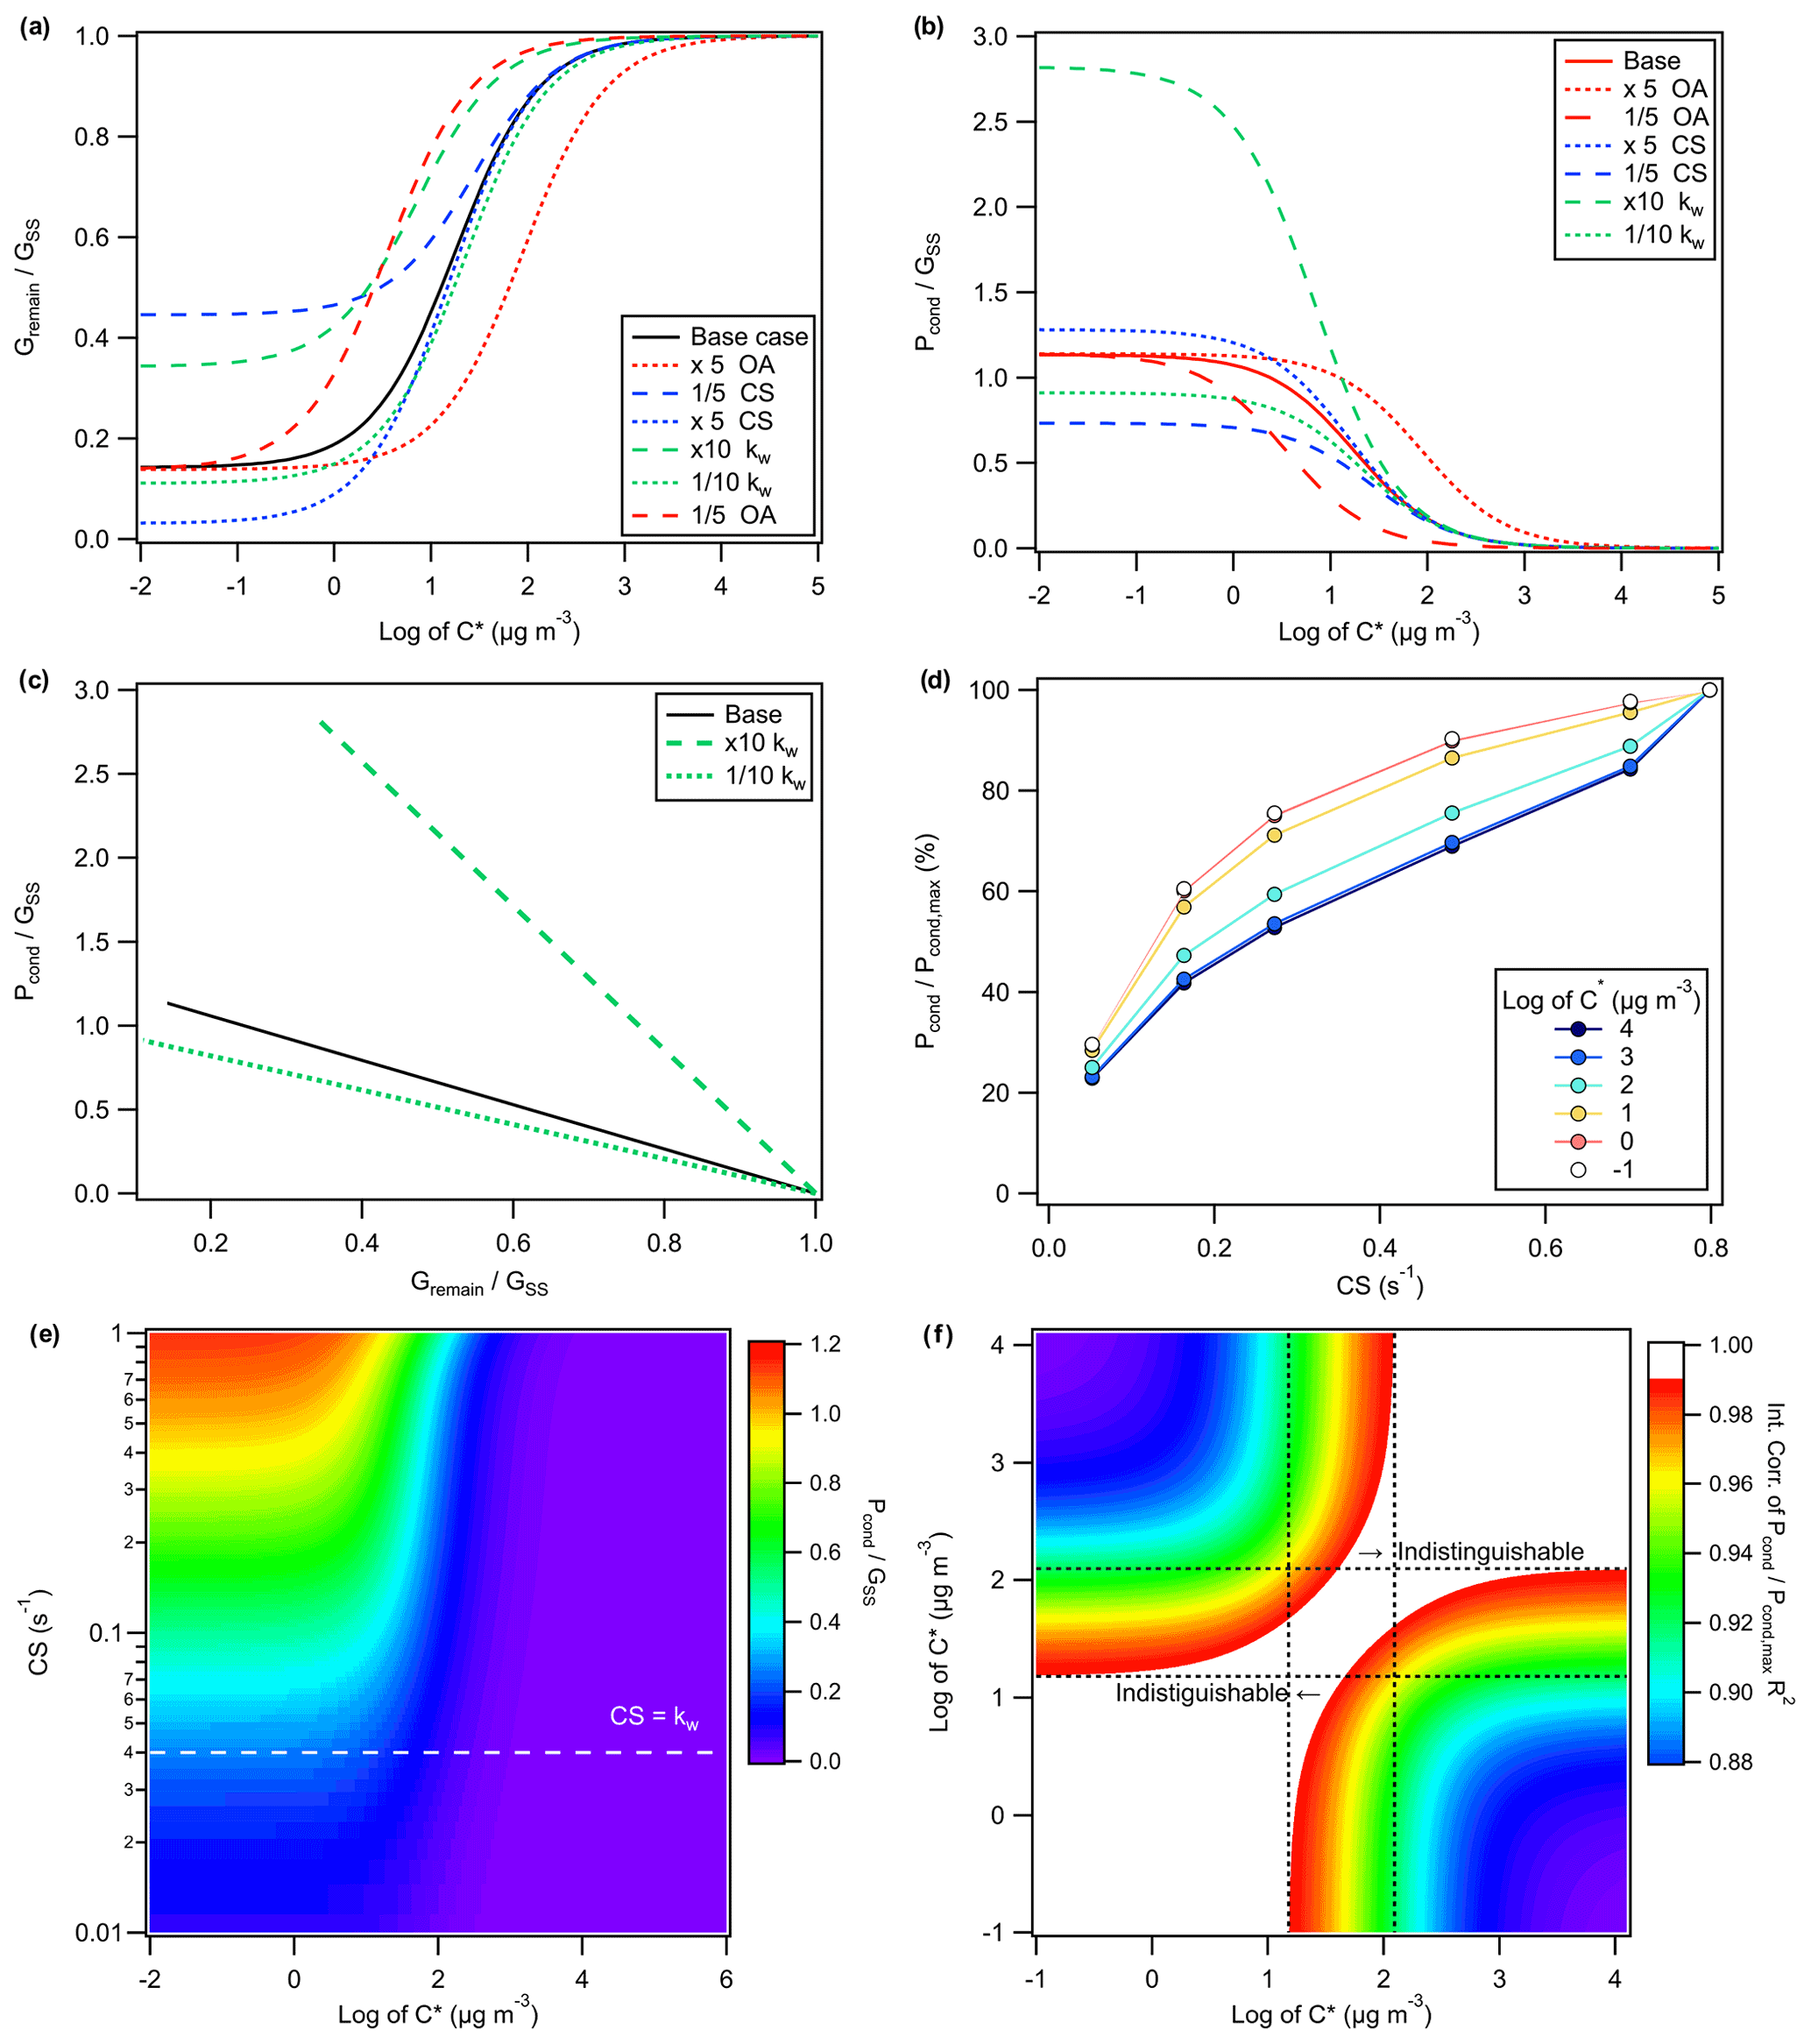
Figure 2Modelled trend of the remaining gas-phase concentration, Gremain, and the condensed vapour concentration, Pcond, relative to the steady-state gas-phase concentration prior to seed injection, GSS, at various organic aerosol (OA) concentrations; condensation sinks (CSs); or assumptions of the wall loss rates, kw, for oxidation products of varying saturation vapour concentrations, C∗. Panel (a) shows the ratio of Gremain to GSS as a function of log (C∗) for the base case scenario of 20 µg m−3 for OA, 1 s−1 for the CS, and 0.04 s−1 for kw, as well as alternative scenarios. Compounds with and < −2 were modelled but not shown, as their trends are similar to that of compounds with and −2, respectively. Similarly, (b) shows the ratio of Pcond to GSS as a function of log (C∗) under various combinations of OA, the CS, and kw. Panel (c) shows the correlation of and , which is similar regardless of the C∗ value, for different kw values. Panel (d) shows the trend of Pcond, normalized to its maximum, for products of varying C∗ as a function of the CS for kw=0.04 s−1. Compounds with and < −1 were modelled but not shown, as their trends are similar to those of compounds with and −1, respectively. The observed CS and OA from the TMB experiment are used to simulate the uptake trend shown in (d), as opposed to the hypothetical conditions used for simulations shown in (a)–(c). Panel (e) shows the modelled ratio of Pcond to GSS for compounds of varying C∗ under different CS and OA, which correlated roughly linearly with the CS, conditions. (f) The expected inter-correlation of the normalized Pcond trends for compounds of varying log (C∗) as a function of the CS for the TMB system, e.g. R2 of pairwise linear regressions for traces shown in (d) or vertical slices in (e). Regions with R2 above 0.99 are considered unreliable for constraining C∗ based solely on normalized Pcond. The ratios of Gremain and Pcond to GSS, which are independent of the production rate, are used as dimensionless quantities instead of their absolute values for ease of representation.
The near-molecular EESI-TOF sensitivities, RF in cps ppb−1, are calculated as the slope of the linear regression of intensity (in cps) observed by the EESI-TOF as a function of ΔGas (in ppb) determined by the Vocus-PTR for the corresponding species, i.e. . Based on the KinSim model results, we restricted the sensitivity analysis to compounds with expected ΔGas≥1 % of GSS under the highest observed OA and CS conditions, which correspond to compounds with log (C∗) < ∼ 3.6. Assuming that the C∗ estimated using the molecular corridor method (Li et al., 2016) has uncertainty of at least 1 order of magnitude (i.e. ±1 in the calculated log (C∗)), we relax the maximum log (C∗) threshold to 4.6. No correction for vapour wall loss was applied, which should only affect the absolute and not the relative RF for a given kw (Fig. 2c). As shown in Fig. 3a, the estimated RF ranges from 103 to 106 cps ppb−1, with the majority falling within 1 order of magnitude of their geometric mean at ∼ 104.6 cps ppb−1. For OH–cresol and OH–TMB oxidation products, the RF exhibits positive correlation with molecular weight and oxygen content, as shown in Fig. S8, which is consistent with previous findings on the positive correlation of the Na+ adduct ionization efficiency with molecular volume and ion–dipole interactions during ESI (Oss et al., 2010; Mayhew et al., 2020; Kruve et al., 2013). Similar correlations were not observed for O3–limonene oxidation products, which is likely due to differences in their molecular structures. It has been shown for isomers that their respective adducts can assume different conformations with different binding energies (Yang et al., 2017; Bol et al., 2017). Figure 3c compares the estimated EESI-TOF sensitivity of analytes from TMB oxidation with the ones from cresol or limonene oxidation. The sensitivity of isomers, comprised exclusively of C8–10 compounds, mostly agree within a factor of 20. The isomers derived from creosol have lower sensitivities than those derived from TMB, likely due to the cresol oxidation producing more (∼ 75 %) ring-retaining products (Schwantes et al., 2017), making them less polar than the ring-opening isomers, which may limit the extraction efficiency or the stability of the Na+ adduct of cresol oxidation products. A similar argument could be made for the increased isomer sensitivity of limonene oxidation products, e.g. C9H12O4, which would likely be a ring-retaining product for TMB (C9H12) but more likely a ring-opening product for limonene (C10H16). Alternatively, the RF of C9H12Ox may be underestimated for the TMB oxidation products due to H2O loss from C9H14Ox in the Vocus-PTR, which overestimates the ΔGas and Pcond of C9H12Ox. Under the assumption that all ions undergo H2O loss inside the Vocus-PTR, closer agreements (within a factor of 5) in RF were observed for most isomers between the TMB and limonene systems, as shown in Fig. 3d.

Figure 3(a) The compound-dependent EESI-TOF response factor, RF, of OH–TMB, OH–cresol, or O3–limonene oxidation products calculated as the linear regression slope of the observed rise in the particle-phase EESI-TOF ion intensity and the corresponding decrease in the gas-phase Vocus-PTR mixing ratio. From each reaction system, only oxidation products with R2≥0.5 for the linear regression of EESI-TOF signal increase and Vocus-PTR mixing ratio decreases are shown. Red, green, and blue shading indicates the log (C∗) range for low-volatility, semi-volatile, and intermediate-volatility organic compounds, respectively. Ion fragmentation in the Vocus-PTR is assumed to be negligible. (b) Same as (a), except that it is assumed that all ions undergo −H2O loss in the Vocus-PTR. (c) Comparison of the RF for analytes with an identical molecular formula observed in different systems. The 1-to-1 line is shown in solid black. Ion fragmentation in the Vocus-PTR is assumed to be negligible. (d) Same as (c), except that it is assumed that all ions undergo −H2O in the Vocus-PTR. The lighter- and darker-shaded regions represent deviations of a factor of 20 and 5, respectively, from the 1-to-1 line. The error bars shown correspond to the uncertainties in the fitted slopes.
3.2 Regression analysis
As discussed above, the near-molecular EESI-TOF sensitivity can be highly variable. While it is possible to estimate the binding energy (and by proxy the RF) of with an assumed adduct conformation via quantum chemical calculation, it would require a priori knowledge of the analyte molecular structure, which is not readily obtainable. Given the elemental composition which is obtainable with high-resolution mass spectrometry, i.e. nC, nH, and nO, we show in Fig. 4a that it is possible to predict the EESI-TOF RF within a factor of 5 using either linear regression or nonparametric regression models for OH–TMB oxidation products. Feature selection results shown in Fig. S9 and Table S2 suggest that, despite their differences, all regression models evaluate NICO or nO as one of the most important features in predicting the EESI-TOF RF for OH–TMB oxidation products. The positive correlation between RF with NICO or nO is intuitive, as compounds with higher NICO values also tend to be larger (i.e. higher nC and molecular volume) and/or more functionalized (i.e. higher nO), possibly enhancing the chelation of analyte M with Na+ and the binding energy of the . In addition, for similarly functionalized compounds, higher NICO and nO roughly translate to a lower C∗ and therefore likely a higher Henry's law constant (Hodzic et al., 2014), i.e. higher solubility and liquid–liquid extraction efficiency. The better performance obtained by nonparametric models compared to linear models and the importance of interaction terms such as NICO indicate that RF is not a linear function of the elemental composition. It is also important to recall that fragmentation reactions such as dehydration of carboxylic acids occur in PTRs; for similarly functionalized compounds, the degree of fragmentation increases with the size of the molecule (Yuan et al., 2017). When not corrected for, the fragmentation reactions would cause the Vocus-PTR and other PTR-MSs to underestimate the concentration of larger, more oxidized compounds. This would lead to overestimation of EESI RF for larger compounds and vice versa, partially accounting for the observed trend in the EESI RF with NICO or nO. Furthermore, the positive dependence of RF on NICO or nO may also reflect the impact of EESI-TOF mass transmission efficiency, where the ion optics were configured to favour the transmission of medium-to-high masses, e.g. ions with higher carbon and/or oxygen contents.
Although the observed RF values are specific to our instrumental and ES conditions, similar NICO and nO sensitivity dependencies may hold for other EESI(-TOF) systems, at least for TMB oxidation products. Regression models may perform very well for the training set (see Fig. S11) and may even allow for qualitative prediction for a similar dataset, as shown in Fig. S12a for the prediction of RF of cresol oxidation products by the model trained on TMB oxidation products. However, the regression models may not extrapolate well to a more diverse (Fig. S10b) or distinct system, as shown in Fig. S12b for the prediction of RF of limonene oxidation products using the regression model trained on TMB oxidation products. As discussed in Sect. S7, the inclusion of RF estimated for OH–cresol and O3–limonene oxidation products without any knowledge of the VOC precursor identity significantly degrades the prediction accuracies of all regressors, where the regression models performed slightly better () than when simply assuming a uniform RF equal to that of the geometric mean, ∼ 104.6 cps ppb−1, as shown in Fig. S10b. In this case, all regression models identified aromaticity (Xc) and/or the hydrogen-to-carbon ratio (H : C) as an important feature, which can be thought of as an attempt by the models to learn the identity of the VOC precursor or the structure of the oxidation products that derive from the said precursor. If the VOC precursor can be constrained, whether explicitly or perhaps using properties such as Xc as surrogates, it is possible to obtain reasonable predictions (e.g. within a factor of 5 of the measured value) for RF, as shown in Figs. 4b and S10c, which again suggests that features related to oxygen contents (e.g. nO, NICO, or the oxygen-to-carbon ratio O : C) are some of the important predictors for RF, along with the VOC precursor identity (Table S5). Given identical elemental formulae, all linear regression models predict higher EESI RF for limonene oxidation products, followed by that of TMB and cresol (Fig. S12d and Table S5). Additional structural information obtained using, for example, ion mobility spectrometry or tandem mass spectrometry would likely further improve RF prediction in lieu of prior knowledge of the VOC precursor when used in parallel or in tandem with the EESI-TOF.

Figure 4Comparison of the predicted and measured log of RF values using linear ridge regression (LRR) and gradient boosting regression (GBR) for (a) the TMB system only or for (b) all three VOC systems combined, where the VOC precursor identity was one-hot encoded and included as one of the features. The 1-to-1 line is shown in solid black. The lighter- and darker-shaded regions represent deviations of a factor of 20 and 5 from the 1-to-1 line, respectively. Model accuracies (see Eq. S21) are approximately 0.83 for GBR and 0.40 for LRR in (a) and 0.52 for GBR and 0.50 for LRR in (b). See Sect. 7 and Fig. S9 in the Supplement for details on feature selection and model validation.
3.3 Bulk sensitivity
The sum of the background-corrected ion intensities, weighted by the molecular weight of individual analytes, correlates linearly with the bulk organic aerosol concentration measured with the AMS, as shown in Fig. 5a. The bulk relative response factor RRFx normalized to that of OH–TMB oxidation products is approximately 0.23 and 0.54 for SOA produced from OH–cresol and O3–limonene reactions, respectively. The bulk RRFx observed in this study using 1 : 1 acetonitrile : water as ES solvent is consistent with the previous study using 1 : 1 methanol : water as ES solvent, where the EESI-TOF bulk RRFx towards OH oxidation products of TMB was shown to be approximately 1.8 and 5 times higher than that of OH oxidation products of toluene and α-pinene, respectively (Lopez-Hilfiker et al., 2019). Note that o-cresol is one of the main first-generation oxidation products of toluene, whereas limonene is a structural isomer of α-pinene. The total OA mass concentrations calculated using the predicted near-molecular response factor, RF, from EESI-TOF ion intensities overestimate the bulk OA concentration by approximately a factor of 2 but otherwise agree with the OA concentration measured by the AMS, as shown in Fig. S13.
In addition to , a substantial quantity of nitrogen(N)-containing ions was observed. Because no nitrogen oxides (NOx) or reduced nitrogen species were injected into the OFR, these N-containing ions are assumed to correspond to if they contain at least two carbon and three hydrogen atoms. It is possible that NH4NO3 decomposition may serve as a NOx source during seed injection, but this effect is likely negligible given the highly oxidizing environment in the OFR (i.e. >10 ppm O3). The average ratio of to ranges from 0.18 for OH–TMB SOA to 0.32 for O3–limonene SOA, as shown in Fig. 5b, and may have contributed to the discrepancies in RRFx, calculated for adducts. The -to- ratio also appears to be species-dependent, which likely reflects the differing adduct stability, which is beyond the scope of this study. Caution should be taken in ion assignment, especially when nitrogenated organic aerosol components are expected. One solution is to use pure water or a mixture of water with labelled C2H315N (at the cost of increased spectral complexity) as the ES solution. Alternatively, one could increase the collision-induced dissociation energy to dissociate the adduct ions, which seem to have lower binding energies than adducts (Lee et al., 2020).
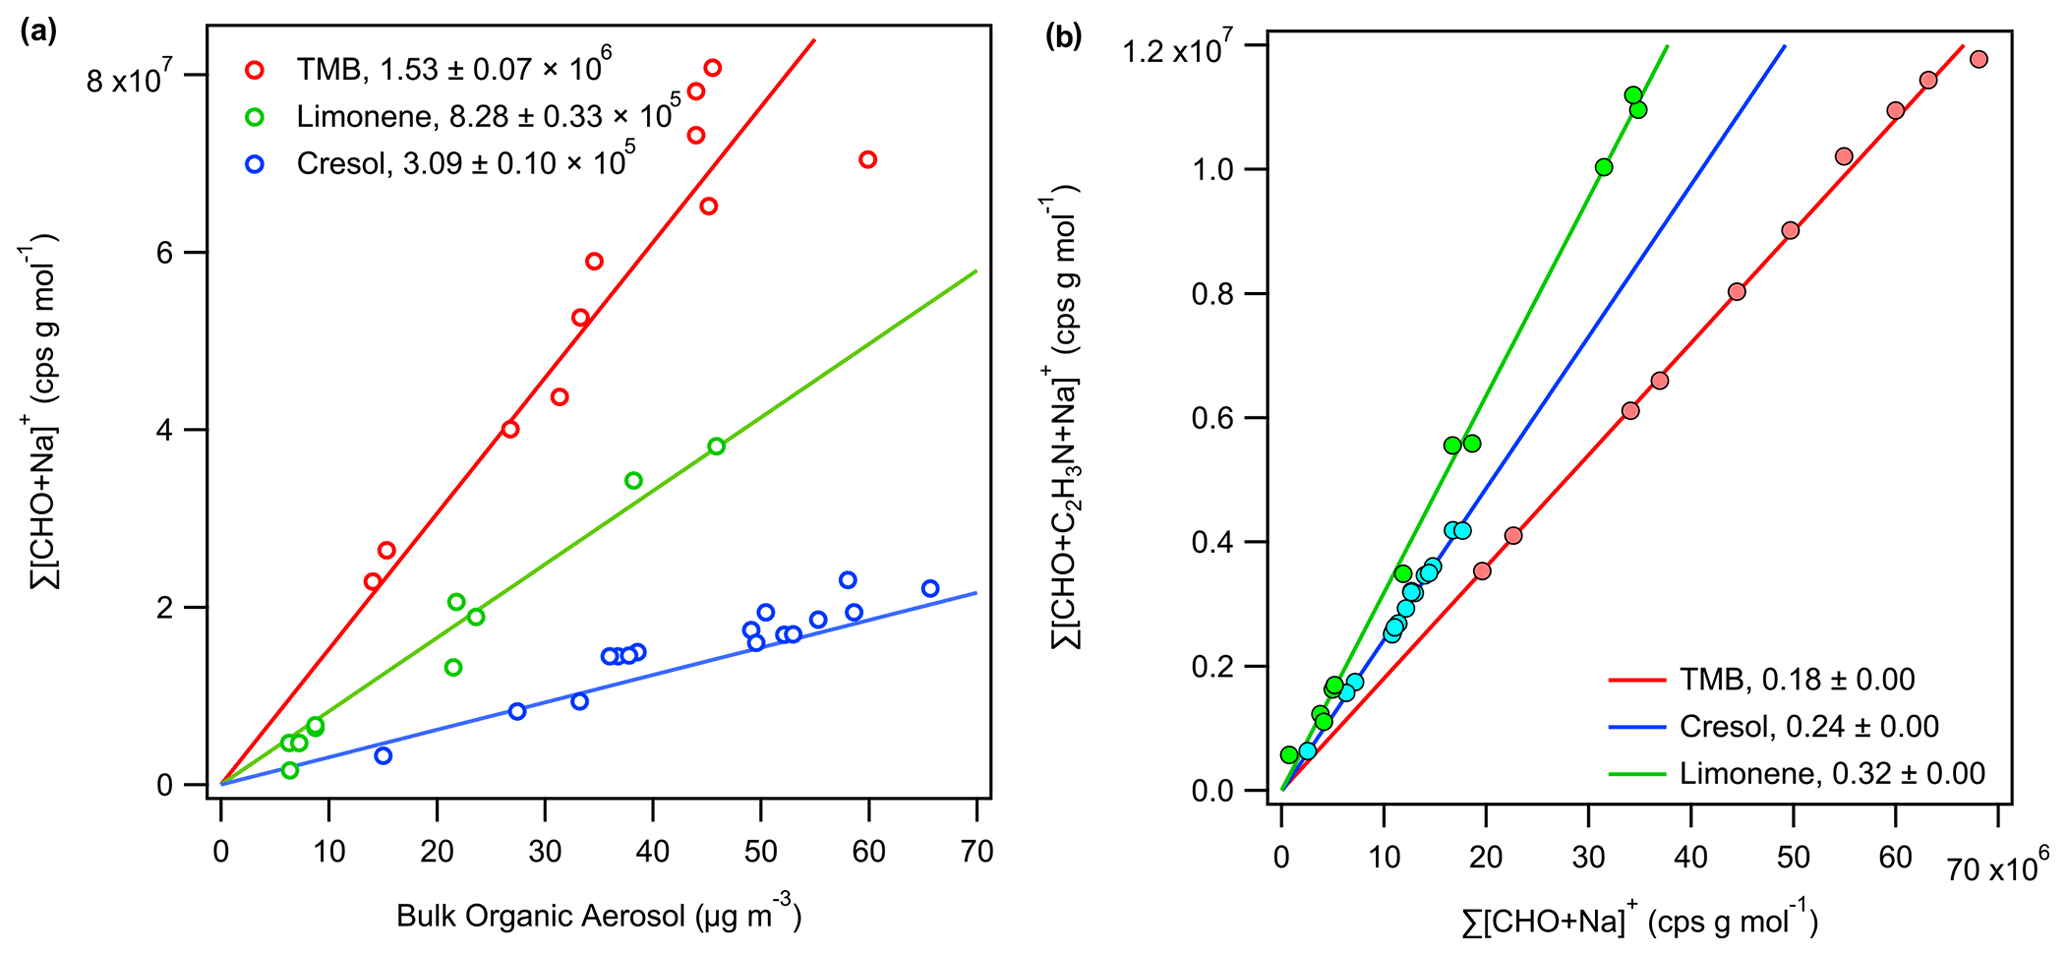
Figure 5Correlation of (a) the total EESI-TOF ion intensities with the bulk organic aerosol concentration as determined by the AMS and (b) the sum of background-subtracted, MW-weighted EESI-TOF and signals observed during the seed injection periods, excluding any analytes observed in only one of the two forms, i.e. or . Linear ordinary least squares regression with a forced 0 intercept is applied to determine the bulk EESI-TOF response factor in (a) and the average ratio of to in (b). For each species M, its EESI-TOF ion intensity measurement is weighted by its molecular weight in order to compare ion flux measurements by the EESI-TOF with mass measurements by the AMS.
In this study, we conducted organic aerosol uptake experiments in an oxidation flow reactor to constrain the EESI-TOF response factor to biogenic and anthropogenic secondary organic aerosol. Intercomparison with the AMS shows that the total EESI-TOF signal responds quantitatively to the bulk organic aerosol concentration even with high concentrations of inorganic aerosol present (up to 4.7 mg m−3 of NH4NO3 seed particles, Fig. S3), based on the linear relationship between the summed EESI-TOF signals of the Na+ adduct ions and AMS measurements of the bulk OA concentrations (Fig. 5a). The relative bulk response factor (i.e. ratio of the summed EESI signal, weighted by molecular weight, to AMS OA measurement) is shown to be highest for the oxidation products of 1,3,5-trimethylbenzene (1.00), followed by d-limonene (0.54) and o-cresol (0.23), consistent with previous results (Lopez-Hilfiker et al., 2019). Quantification of gas-phase oxidation products by a Vocus-PTR at a steady state and during organic aerosol uptake allowed us to constrain the EESI-TOF sensitivity for a range of SOA components. The measured near-molecular response factor, RF, ranges from 103 to 106 cps ppb−1, though mostly falls within ±1 order of magnitude of ∼ 104.6 cps ppb−1. Isomer sensitivities were shown to vary mostly within a factor of 20, with those showing more aromatic characteristics having lower sensitivities. Based on the measured elemental composition and properties derived from it, regression models are shown to be able to predict the measured sensitivity within a factor of 5 for OH–TMB oxidation products. The regression models trained with the TMB dataset can also produce qualitative predictions of RF for oxidation products derived from a structurally similar VOC precursor (i.e. o-cresol), though not for those derived from a distinct VOC precursor (i.e. d-limonene). Regression analyses suggest that oxygen contents (nO) and carbon–oxygen non-ideality (NICO, i.e. ) are key predictors for the EESI-TOF response factor to OH–TMB oxidation products, which points to the enhanced ability of an organic compound to chelate with Na+ as it increases in size (e.g. number of carbon atoms) and/or functionalization (e.g. number of oxygen atoms) as the reason for the sensitivity increase. Increases in NICO can also manifest as decreases in volatility, which may enhance solubility and liquid–liquid extraction efficiency during EESI. For a mixed VOC system, knowledge of the SOA precursor identities can help to constrain the EESI-TOF response factors. The total OA concentrations estimated using the EESI-TOF measurements and the predicted RF values show reasonable agreement with the observations by the AMS and SMPS, roughly within a factor of 2. If the SOA precursor is unknown, the RF prediction by regression models is marginally better than assuming a uniform EESI-TOF sensitivity. For bulk concentration estimation and time-series analysis, uniform sensitivity is a reasonable assumption, as seen in good agreements between EESI-TOF and AMS measurements for ambient organic aerosol samples (Qi et al., 2019; Stefenelli et al., 2019), where the bulk response factor remains consistent (in time) despite variabilities in individual RF values. For estimating the relative contribution by individual species, the parameterization of RF developed in this study may be applicable for SOA sources dominated by aromatics chemistry.
To our knowledge, this is the first study to constrain the EESI-TOF response factor to organic aerosol components without the use of chemical standards, many of which cannot be purchased commercially or synthesized. We show that it is possible to semi-quantitatively resolve the organic aerosol composition at the near-molecular level with a high time resolution. One limitation of the study is that the analytes with overlapping coverage in the EESI-TOF and Vocus-PTR do not include any extremely low volatility compounds or organic nitrates. Future studies should consider extending the oxidation timescale, minimizing wall loss, and utilizing techniques more suited for the quantification of moderately to highly oxygenated compounds at low concentrations, such as iodide or nitrate chemical ionization mass spectrometry. Future studies should also deconvolve the effects of liquid–liquid extraction efficiency, ionization efficiency, and ion transmission efficiency on the overall EESI sensitivity observed. Isolating each contributing factor is challenging. For instance, the ion transmission efficiency of the mass analyser may be characterized by splitting the analyte ion flow between the MS inlet and a Faraday cup electrometer to monitor the incoming flux (Heinritzi et al., 2016), although changes made to the ionization region geometry or flow may alter ES characteristics. One could also potentially probe the extraction efficiency by comparing EESI and infusion ESI results, although the two closely related techniques may differ in their ionization efficiencies and matrix effects. Finally, online structural elucidation would also be instrumental in the identification and quantification of organic aerosol components.
| AMS | Aerosol mass spectrometer |
| C* | Saturation vapour concentration |
| CEx | Collection efficiency of electrospray droplet by the ion capillary of ion x |
| CS | Condensation sink |
| D | Gas diffusivity |
| DBE | Double-bond equivalent |
| EEx | Liquid-phase extraction efficiency of analyte x |
| EESI | Extractive electrospray ionization |
| ES | Electrospray |
| ESI | Electrospray ionization |
| Extent of ionization-induced fragmentation of protonated ion, | |
| Gremain | Concentration of organic vapour x remaining in the gas phase during seed injection |
| GSS | Concentration of organic vapour x in the gas phase prior to seed injection at steady state |
| ΔGasx | Amount of organic vapour x removed from the gas phase during seed injection |
| GBR | Gradient boosting regression |
| IEx | Ionization efficiency of analyte x |
| Ix | Ion intensity of ion x |
| kMH | Reaction rate constant for PTRs |
| kw | Vapour wall loss coefficient |
| LRR | Linear ridge regression |
| MWx | Molecular weight of x |
| nC | Number of carbon atoms |
| nH | Number of hydrogen atoms |
| NICO | Carbon–oxygen non-ideality |
| nO | Number of oxygen atoms |
| OA | Organic aerosol |
| ODR | Orthogonal distance regression |
| OFR | Oxidation flow reactor |
| Pcond,x | Amount of organic compound x condensed onto seed particles during seed injection |
| PM# | Particulate matter with diameter < # µm |
| PTR | Proton-transfer reaction |
| RFx | EESI response factor of x in cps molec.−1 |
| RF | EESI response factor of x in cps ppb−1 |
| RIE | Relative ionization efficiency |
| RRFx | Relative EESI bulk response factor towards SOA produced from VOC precursor x |
| SMPS | Scanning mobility particle sizer |
| SOA | Secondary organic aerosol |
| TMB | 1,3,5-Trimethylbenzene |
| TME | Tetramethylethylene |
| Ion transmission efficiency of protonated ion, | |
| TOF | Time-of-flight |
| VOC | Volatile organic compound |
| Xc | Aromaticity |
| α | Polarizability |
| μD | Permanent dipole moment |
The data presented in the text and figures can be obtained at the Zenodo online repository (https://doi.org/10.5281/zenodo.5543327; Wang et al., 2021). Underlying data are available upon reasonable request.
The supplement related to this article is available online at: https://doi.org/10.5194/amt-14-6955-2021-supplement.
DSW, CPL, JD, JGS, and DMB designed the experiment. DSW, CPL, JEK, MRC, FM, YT, and DMB performed the experiments and collected the data. DSW, JEK, CPL, YT, and DMB analysed the data. DSW, CPL, JEK, UB, IEH, JGS, and DMB prepared the manuscript. All authors contributed to the data interpretation and manuscript revision.
Jordan E. Krechmer, Manjula R. Canagaratna, and Francesca Majluf are employed by Aerodyne Research Inc., which commercializes the Vocus-PTR, the EESI-TOF, and the AMS. The other authors declare no conflict of interest.
Publisher’s note: Copernicus Publications remains neutral with regard to jurisdictional claims in published maps and institutional affiliations.
This article is part of the special issue “Simulation chambers as tools in atmospheric research (AMT/ACP/GMD inter-journal SI)”. It is not associated with a conference.
We thank Houssni Lamkaddam and Mao Xiao for their helpful discussions.
This project has received funding from the European Union's Horizon 2020 Research and Innovation programme under Marie Skłodowska-Curie grant agreement no. 701647 and through the EUROCHAMP-2020 Infrastructure Activity under grant agreement no. 730997, as well as from the Swiss National Science Foundation (20020_172602, BSSGI0_155846).
This paper was edited by Hang Su and reviewed by two anonymous referees.
Alfarra, M. R., Prevot, A. S. H., Szidat, S., Sandradewi, J., Weimer, S., Lanz, V. A., Schreiber, D., Mohr, M., and Baltensperger, U.: Identification of the mass spectral signature of organic aerosols from wood burning emissions, Environ. Sci. Technol., 41, 5770–5777, https://doi.org/10.1021/es062289b, 2007.
Atkinson, R. and Arey, J.: Atmospheric Degradation of Volatile Organic Compounds, Chem. Rev., 103, 4605–4638, https://doi.org/10.1021/cr0206420, 2003.
Berndt, T., Mentler, B., Scholz, W., Fischer, L., Herrmann, H., Kulmala, M., and Hansel, A.: Accretion Product Formation from Ozonolysis and OH Radical Reaction of α-Pinene: Mechanistic Insight and the Influence of Isoprene and Ethylene, Environ. Sci. Technol., 52, 110069–11077, https://doi.org/10.1021/acs.est.8b02210, 2018.
Bol, M., Sakellaris, C. N., Jacob, C. R., and Mischnick, P.: Differences in the complexation of sodium with methyl esterified carboxymethyl/methoxyacetyl-O-glucans in electrospray ionization-mass spectrometry, Int. J. Mass Spectrom., 419, 20–28, https://doi.org/10.1016/j.ijms.2017.05.007, 2017.
Brown, W. L., Day, D. A., Stark, H., Pagonis, D., Krechmer, J. E., Liu, X., Price, D. J., Katz, E. F., DeCarlo, P. F., Masoud, C. G., Wang, D. S., Hildebrandt Ruiz, L., Arata, C., Lunderberg, D. M., Goldstein, A. H., Farmer, D. K., Vance, M. E., and Jimenez, J. L.: Real-time organic aerosol chemical speciation in the indoor environment using extractive electrospray ionization mass spectrometry, Indoor Air, 31, 141–155, https://doi.org/10.1111/ina.12721, 2021.
Budisulistiorini, S. H., Canagaratna, M. R., Croteau, P. L., Marth, W. J., Baumann, K., Edgerton, E. S., Shaw, S. L., Knipping, E. M., Worsnop, D. R., Jayne, J. T., Gold, A., and Surratt, J. D.: Real-time continuous characterization of secondary organic aerosol derived from isoprene epoxydiols in downtown Atlanta, Georgia, using the Aerodyne aerosol chemical speciation monitor, Environ. Sci. Technol., 47, 5686–5694, https://doi.org/10.1021/es400023n, 2013.
Canagaratna, M. R., Jayne, J. T., Jimenez, J. L., Allan, J. D., Alfarra, M. R., Zhang, Q., Onasch, T. B., Drewnick, F., Coe, H., Middlebrook, A., Delia, A., Williams, L. R., Trimborn, A. M., Northway, M. J., DeCarlo, P. F., Kolb, C. E., Davidovits, P., and Worsnop, D. R.: Chemical and microphysical characterization of ambient aerosols with the Aerodyne aerosol mass spectrometer, Mass Spectrom. Rev., 26, 185–222, https://doi.org/10.1002/mas.20115, 2007.
Cappellin, L., Karl, T., Probst, M., Ismailova, O., Winkler, P. M., Soukoulis, C., Aprea, E., Märk, T. D., Gasperi, F., and Biasioli, F.: On quantitative determination of volatile organic compound concentrations using proton transfer reaction time-of-flight mass spectrometry, Environ. Sci. Technol., 46, 2283–2290, https://doi.org/10.1021/es203985t, 2012.
Chen, H., Venter, A., and Cooks, R. G.: Extractive electrospray ionization for direct analysis of undiluted urine, milk and other complex mixtures without sample preparation, Chem. Commun., 19, 2042–2044, https://doi.org/10.1039/b602614a, 2006.
Claflin, M. S., Pagonis, D., Finewax, Z., Handschy, A. V., Day, D. A., Brown, W. L., Jayne, J. T., Worsnop, D. R., Jimenez, J. L., Ziemann, P. J., de Gouw, J., and Lerner, B. M.: An in situ gas chromatograph with automatic detector switching between PTR- and EI-TOF-MS: isomer-resolved measurements of indoor air, Atmos. Meas. Tech., 14, 133–152, https://doi.org/10.5194/amt-14-133-2021, 2021.
Daellenbach, K. R., Bozzetti, C., Křepelová, A., Canonaco, F., Wolf, R., Zotter, P., Fermo, P., Crippa, M., Slowik, J. G., Sosedova, Y., Zhang, Y., Huang, R.-J., Poulain, L., Szidat, S., Baltensperger, U., El Haddad, I., and Prévôt, A. S. H.: Characterization and source apportionment of organic aerosol using offline aerosol mass spectrometry, Atmos. Meas. Tech., 9, 23–39, https://doi.org/10.5194/amt-9-23-2016, 2016.
DeCarlo, P. F., Kimmel, J. R., Trimborn, A., Northway, M. J., Jayne, J. T., Aiken, A. C., Gonin, M., Fuhrer, K., Horvath, T., Docherty, K. S., Worsnop, D. R., and Jimenez, J. L.: Field-Deployable, High-Resolution, Time-of-Flight Aerosol Mass Spectrometer, Anal. Chem., 78, 8281–8289, https://doi.org/10.1021/ac061249n, 2006.
Dockery, D. W., Pope, C. A., Xu, X., Spengler, J. D., Ware, J. H., Fay, M. E., Ferris, B. G., and Speizer, F. E.: An Association between Air Pollution and Mortality in Six U.S. Cities, N. Engl. J. Med., 329, 1753–1759, https://doi.org/10.1056/NEJM199312093292401, 1993.
Doezema, L. A., Longin, T., Cody, W., Perraud, V., Dawson, M. L., Ezell, M. J., Greaves, J., Johnson, K. R., and Finlayson-Pitts, B. J.: Analysis of secondary organic aerosols in air using extractive electrospray ionization mass spectrometry (EESI-MS), RSC Adv., 2, 2930–2938, https://doi.org/10.1039/c2ra00961g, 2012.
Donahue, N. M., Epstein, S. A., Pandis, S. N., and Robinson, A. L.: A two-dimensional volatility basis set: 1. organic-aerosol mixing thermodynamics, Atmos. Chem. Phys., 11, 3303–3318, https://doi.org/10.5194/acp-11-3303-2011, 2011.
Duncianu, M., David, M., Kartigueyane, S., Cirtog, M., Doussin, J.-F., and Picquet-Varrault, B.: Measurement of alkyl and multifunctional organic nitrates by proton-transfer-reaction mass spectrometry, Atmos. Meas. Tech., 10, 1445–1463, https://doi.org/10.5194/amt-10-1445-2017, 2017.
Eichler, P., Müller, M., D'Anna, B., and Wisthaler, A.: A novel inlet system for online chemical analysis of semi-volatile submicron particulate matter, Atmos. Meas. Tech., 8, 1353–1360, https://doi.org/10.5194/amt-8-1353-2015, 2015.
Fang, X., Yang, S., Chingin, K., Zhu, L., Zhang, X., Zhou, Z., and Zhao, Z.: Quantitative detection of trace malachite green in aquiculturewater samples by extractive electrospray ionization mass spectrometry, Int. J. Environ. Res. Publ. Health, 13, 814, https://doi.org/10.3390/ijerph13080814, 2016.
Fuller, E. N., Schettler, P. D., and Giddings, J. C.: A new method for prediction of binary gas-phase diffusion coefficients, Ind. Eng. Chem., 58, 18–27, https://doi.org/10.1021/ie50677a007, 1966.
Gallimore, P. J. and Kalberer, M.: Characterizing an extractive electrospray ionization (EESI) source for the online mass spectrometry analysis of organic aerosols, Environ. Sci. Technol., 47, 7324–7331, https://doi.org/10.1021/es305199h, 2013.
Giannoukos, S., Lee, C. P., Tarik, M., Ludwig, C., Biollaz, S., Lamkaddam, H., Baltensperger, U., Prevot, A. S. H., and Slowik, J.: Real-Time Detection of Aerosol Metals Using Online Extractive Electrospray Ionization Mass Spectrometry, Anal. Chem., 92, 1316–1325, https://doi.org/10.1021/acs.analchem.9b04480, 2020.
Guo, B. C., Conklin, B. J., and Castleman, A. W.: Thermochemical properties of ion complexes Na + (M)n in the gas phase, J. Am. Chem. Soc., 111, 6506–6510, https://doi.org/10.1021/ja00199a005, 1989.
Heinritzi, M., Simon, M., Steiner, G., Wagner, A. C., Kürten, A., Hansel, A., and Curtius, J.: Characterization of the mass-dependent transmission efficiency of a CIMS, Atmos. Meas. Tech., 9, 1449–1460, https://doi.org/10.5194/amt-9-1449-2016, 2016.
Hodzic, A., Aumont, B., Knote, C., Lee-Taylor, J., Madronich, S., and Tyndall, G.: Volatility dependence of Henry's law constants of condensable organics: Application to estimate depositional loss of secondary organic aerosols, Geophys. Res. Lett., 41, 4795–4804, https://doi.org/10.1002/2014GL060649, 2014.
Holzinger, R., Acton, W. J. F., Bloss, W. J., Breitenlechner, M., Crilley, L. R., Dusanter, S., Gonin, M., Gros, V., Keutsch, F. N., Kiendler-Scharr, A., Kramer, L. J., Krechmer, J. E., Languille, B., Locoge, N., Lopez-Hilfiker, F., Materić, D., Moreno, S., Nemitz, E., Quéléver, L. L. J., Sarda Esteve, R., Sauvage, S., Schallhart, S., Sommariva, R., Tillmann, R., Wedel, S., Worton, D. R., Xu, K., and Zaytsev, A.: Validity and limitations of simple reaction kinetics to calculate concentrations of organic compounds from ion counts in PTR-MS, Atmos. Meas. Tech., 12, 6193–6208, https://doi.org/10.5194/amt-12-6193-2019, 2019.
Jimenez, J. L., Canagaratna, M. R., Donahue, N. M., Prevot, A. S. H., Zhang, Q., Kroll, J. H., DeCarlo, P. F., Allan, J. D., Coe, H., Ng, N. L., Aiken, A. C., Docherty, K. S., Ulbrich, I. M., Grieshop, A. P., Robinson, A. L., Duplissy, J., Smith, J. D., Wilson, K. R., Lanz, V. A., Hueglin, C., Sun, Y. L., Tian, J., Laaksonen, A., Raatikainen, T., Rautiainen, J., Vaattovaara, P., Ehn, M., Kulmala, M., Tomlinson, J. M., Collins, D. R., Cubison, M. J., Dunlea, J., Huffman, J. A., Onasch, T. B., Alfarra, M. R., Williams, P. I., Bower, K., Kondo, Y., Schneider, J., Drewnick, F., Borrmann, S., Weimer, S., Demerjian, K., Salcedo, D., Cottrell, L., Griffin, R., Takami, A., Miyoshi, T., Hatakeyama, S., Shimono, A., Sun, J. Y., Zhang, Y. M., Dzepina, K., Kimmel, J. R., Sueper, D., Jayne, J. T., Herndon, S. C., Trimborn, A. M., Williams, L. R., Wood, E. C., Middlebrook, A. M., Kolb, C. E., Baltensperger, U., and Worsnop, D. R.: Evolution of Organic Aerosols in the Atmosphere, Science, 326, 1525–1529, https://doi.org/10.1126/science.1180353, 2009.
Kebarle, P. and Peschke, M.: On the mechanisms by which the charged droplets produced by electrospray lead to gas phase ions, Anal. Chim. Acta, 406, 11–35, https://doi.org/10.1016/S0003-2670(99)00598-X, 2000.
Krechmer, J., Lopez-Hilfiker, F., Koss, A., Hutterli, M., Stoermer, C., Deming, B., Kimmel, J., Warneke, C., Holzinger, R., Jayne, J., Worsnop, D., Fuhrer, K., Gonin, M., and de Gouw, J.: Evaluation of a New Reagent-Ion Source and Focusing Ion–Molecule Reactor for Use in Proton-Transfer-Reaction Mass Spectrometry, Anal. Chem., 90, 12011–12018, https://doi.org/10.1021/acs.analchem.8b02641, 2018.
Kruve, A., Kaupmees, K., Liigand, J., Oss, M., and Leito, I.: Sodium adduct formation efficiency in ESI source, J. Mass Spectrom., 48, 695–702, https://doi.org/10.1002/jms.3218, 2013.
Kruve, A., Kaupmees, K., Liigand, J., and Leito, I.: Negative electrospray ionization via deprotonation: Predicting the ionization efficiency, Anal. Chem., 86, 4822–4830, https://doi.org/10.1021/ac404066v, 2014.
Kulmala, M. and Wagner, P. E.: Mass accommodation and uptake coefficients – A quantitative comparison, J. Aerosol Sci., 32, 833–841, https://doi.org/10.1016/S0021-8502(00)00116-6, 2001.
Lee, C. P., Riva, M., Wang, D., Tomaz, S., Li, D., Perrier, S., Slowik, J. G., Bourgain, F., Schmale, J., Prevot, A. S. H., Baltensperger, U., George, C., and El Haddad, I.: Online Aerosol Chemical Characterization by Extractive Electrospray Ionization–Ultrahigh-Resolution Mass Spectrometry (EESI-Orbitrap), Environ. Sci. Technol., 54, 3871–3880, https://doi.org/10.1021/acs.est.9b07090, 2020.
Leglise, J., Müller, M., Piel, F., Otto, T., and Wisthaler, A.: Bulk Organic Aerosol Analysis by Proton-Transfer-Reaction Mass Spectrometry: An Improved Methodology for the Determination of Total Organic Mass, O:C and H : C Elemental Ratios, and the Average Molecular Formula, Anal. Chem., 91, 12619–12624, https://doi.org/10.1021/acs.analchem.9b02949, 2019.
Li, Y., Pöschl, U., and Shiraiwa, M.: Molecular corridors and parameterizations of volatility in the chemical evolution of organic aerosols, Atmos. Chem. Phys., 16, 3327–3344, https://doi.org/10.5194/acp-16-3327-2016, 2016.
Liigand, J., Wang, T., Kellogg, J., Smedsgaard, J., Cech, N., and Kruve, A.: Quantification for non-targeted LC/MS screening without standard substances, Sci. Rep.-UK, 10, 1–10, https://doi.org/10.1038/s41598-020-62573-z, 2020.
Liigand, P., Liigand, J., Cuyckens, F., Vreeken, R. J., and Kruve, A.: Ionisation efficiencies can be predicted in complicated biological matrices: A proof of concept, Anal. Chim. Acta, 1032, 68–74, https://doi.org/10.1016/j.aca.2018.05.072, 2018.
Lopez-Hilfiker, F. D., Mohr, C., Ehn, M., Rubach, F., Kleist, E., Wildt, J., Mentel, Th. F., Lutz, A., Hallquist, M., Worsnop, D., and Thornton, J. A.: A novel method for online analysis of gas and particle composition: description and evaluation of a Filter Inlet for Gases and AEROsols (FIGAERO), Atmos. Meas. Tech., 7, 983–1001, https://doi.org/10.5194/amt-7-983-2014, 2014.
Lopez-Hilfiker, F. D., Pospisilova, V., Huang, W., Kalberer, M., Mohr, C., Stefenelli, G., Thornton, J. A., Baltensperger, U., Prevot, A. S. H., and Slowik, J. G.: An extractive electrospray ionization time-of-flight mass spectrometer (EESI-TOF) for online measurement of atmospheric aerosol particles, Atmos. Meas. Tech., 12, 4867–4886, https://doi.org/10.5194/amt-12-4867-2019, 2019.
Mayhew, A. W., Topping, D. O., and Hamilton, J. F.: New Approach Combining Molecular Fingerprints and Machine Learning to Estimate Relative Ionization Efficiency in Electrospray Ionization, ACS Omega, 5, 9510–9516, https://doi.org/10.1021/acsomega.0c00732, 2020.
Mohr, C., Thornton, J. A., Heitto, A., Lopez-Hilfiker, F. D., Lutz, A., Riipinen, I., Hong, J., Donahue, N. M., Hallquist, M., Petäjä, T., Kulmala, M., and Yli-Juuti, T.: Molecular identification of organic vapors driving atmospheric nanoparticle growth, Nat. Commun., 10, 4442, https://doi.org/10.1038/s41467-019-12473-2, 2019.
Molteni, U., Bianchi, F., Klein, F., El Haddad, I., Frege, C., Rossi, M. J., Dommen, J., and Baltensperger, U.: Formation of highly oxygenated organic molecules from aromatic compounds, Atmos. Chem. Phys., 18, 1909–1921, https://doi.org/10.5194/acp-18-1909-2018, 2018.
Müller, M., Eichler, P., D'Anna, B., Tan, W., and Wisthaler, A.: Direct Sampling and Analysis of Atmospheric Particulate Organic Matter by Proton-Transfer-Reaction Mass Spectrometry, Anal. Chem., 89, 10889–10897, https://doi.org/10.1021/acs.analchem.7b02582, 2017.
Murschell, T., Fulgham, S. R., and Farmer, D. K.: Gas-phase pesticide measurement using iodide ionization time-of-flight mass spectrometry, Atmos. Meas. Tech., 10, 2117–2127, https://doi.org/10.5194/amt-10-2117-2017, 2017.
Ng, N. L., Canagaratna, M. R., Jimenez, J. L., Chhabra, P. S., Seinfeld, J. H., and Worsnop, D. R.: Changes in organic aerosol composition with aging inferred from aerosol mass spectra, Atmos. Chem. Phys., 11, 6465–6474, https://doi.org/10.5194/acp-11-6465-2011, 2011.
Oss, M., Kruve, A., Herodes, K., and Leito, I.: Electrospray Ionization Efficiency Scale of Organic Compounds, Anal. Chem., 82, 2865–2872, https://doi.org/10.1021/ac902856t, 2010.
Pagonis, D., Price, D. J., Algrim, L. B., Day, D. A., Handschy, A. V., Stark, H., Miller, S. L., de Gouw, J., Jimenez, J. L., and Ziemann, P. J.: Time-Resolved Measurements of Indoor Chemical Emissions, Deposition, and Reactions in a University Art Museum, Environ. Sci. Technol., 53, 4794–4802, https://doi.org/10.1021/acs.est.9b00276, 2019.
Pagonis, D., Campuzano-Jost, P., Guo, H., Day, D. A., Schueneman, M. K., Brown, W. L., Nault, B. A., Stark, H., Siemens, K., Laskin, A., Piel, F., Tomsche, L., Wisthaler, A., Coggon, M. M., Gkatzelis, G. I., Halliday, H. S., Krechmer, J. E., Moore, R. H., Thomson, D. S., Warneke, C., Wiggins, E. B., and Jimenez, J. L.: Airborne extractive electrospray mass spectrometry measurements of the chemical composition of organic aerosol, Atmos. Meas. Tech., 14, 1545–1559, https://doi.org/10.5194/amt-14-1545-2021, 2021.
Pankow, J. F. and Asher, W. E.: SIMPOL.1: a simple group contribution method for predicting vapor pressures and enthalpies of vaporization of multifunctional organic compounds, Atmos. Chem. Phys., 8, 2773–2796, https://doi.org/10.5194/acp-8-2773-2008, 2008.
Peck, J., Gonzalez, L. A., Williams, L. R., Xu, W., Croteau, P. L., Timko, M. T., Jayne, J. T., Worsnop, D. R., Miake-Lye, R. C., and Smith, K. A.: Development of an aerosol mass spectrometer lens system for PM2.5, Aerosol Sci. Tech., 50, 781–789, https://doi.org/10.1080/02786826.2016.1190444, 2016.
Peng, Z. and Jimenez, J. L.: KinSim: A Research-Grade, User-Friendly, Visual Kinetics Simulator for Chemical-Kinetics and Environmental-Chemistry Teaching, J. Chem. Educ., 96, 806–811, https://doi.org/10.1021/acs.jchemed.9b00033, 2019.
Pieber, S. M., El Haddad, I., Slowik, J. G., Canagaratna, M. R., Jayne, J. T., Platt, S. M., Bozzetti, C., Daellenbach, K. R., Fröhlich, R., Vlachou, A., Klein, F., Dommen, J., Miljevic, B., Jiménez, J. L., Worsnop, D. R., Baltensperger, U., and Prévôt, A. S. H.: Inorganic Salt Interference on CO in Aerodyne AMS and ACSM Organic Aerosol Composition Studies, Environ. Sci. Technol., 50, 10494–10503, https://doi.org/10.1021/acs.est.6b01035, 2016.
Pospisilova, V., Lopez-Hilfiker, F. D., Bell, D. M., El Haddad, I., Mohr, C., Huang, W., Heikkinen, L., Xiao, M., Dommen, J., Prevot, A. S. H., Baltensperger, U., and Slowik, J. G.: On the fate of oxygenated organic molecules in atmospheric aerosol particles, Sci. Adv., 6, eaax8922, https://doi.org/10.1126/sciadv.aax8922, 2020.
Qi, L., Chen, M., Stefenelli, G., Pospisilova, V., Tong, Y., Bertrand, A., Hueglin, C., Ge, X., Baltensperger, U., Prévôt, A. S. H., and Slowik, J. G.: Organic aerosol source apportionment in Zurich using an extractive electrospray ionization time-of-flight mass spectrometer (EESI-TOF-MS) – Part 2: Biomass burning influences in winter, Atmos. Chem. Phys., 19, 8037–8062, https://doi.org/10.5194/acp-19-8037-2019, 2019.
Rovelli, G., Jacobs, M. I., Willis, M. D., Rapf, R. J., Prophet, A. M., and Wilson, K. R.: A critical analysis of electrospray techniques for the determination of accelerated rates and mechanisms of chemical reactions in droplets, Chem. Sci., 11, 13026–13043, https://doi.org/10.1039/d0sc04611f, 2020.
Sarangi, B., Aggarwal, S. G., Sinha, D., and Gupta, P. K.: Aerosol effective density measurement using scanning mobility particle sizer and quartz crystal microbalance with the estimation of involved uncertainty, Atmos. Meas. Tech., 9, 859–875, https://doi.org/10.5194/amt-9-859-2016, 2016.
Schwantes, R. H., Schilling, K. A., McVay, R. C., Lignell, H., Coggon, M. M., Zhang, X., Wennberg, P. O., and Seinfeld, J. H.: Formation of highly oxygenated low-volatility products from cresol oxidation, Atmos. Chem. Phys., 17, 3453–3474, https://doi.org/10.5194/acp-17-3453-2017, 2017.
Sekimoto, K., Li, S. M., Yuan, B., Koss, A., Coggon, M., Warneke, C., and de Gouw, J.: Calculation of the sensitivity of proton-transfer-reaction mass spectrometry (PTR-MS) for organic trace gases using molecular properties, Int. J. Mass Spectrom., 421, 71–94, https://doi.org/10.1016/j.ijms.2017.04.006, 2017.
Siuzdak, G., Bothner, B., Yeager, M., Brugidou, C., Fauquet, C. M., Hoey, K., and Chang, C. M.: Mass spectrometry and viral analysis, Chem. Biol., 3, 45–48, https://doi.org/10.1016/S1074-5521(96)90083-6, 1996.
Stark, H., Yatavelli, R. L. N., Thompson, S. L., Kang, H., Krechmer, J. E., Kimmel, J. R., Palm, B. B., Hu, W., Hayes, P. L., Day, D. A., Campuzano-Jost, P., Canagaratna, M. R., Jayne, J. T., Worsnop, D. R., and Jimenez, J. L.: Impact of Thermal Decomposition on Thermal Desorption Instruments: Advantage of Thermogram Analysis for Quantifying Volatility Distributions of Organic Species, Environ. Sci. Technol., 51, 8491–8500, https://doi.org/10.1021/acs.est.7b00160, 2017.
Stefenelli, G., Pospisilova, V., Lopez-Hilfiker, F. D., Daellenbach, K. R., Hüglin, C., Tong, Y., Baltensperger, U., Prévôt, A. S. H., and Slowik, J. G.: Organic aerosol source apportionment in Zurich using an extractive electrospray ionization time-of-flight mass spectrometer (EESI-TOF-MS) – Part 1: Biogenic influences and day–night chemistry in summer, Atmos. Chem. Phys., 19, 14825–14848, https://doi.org/10.5194/acp-19-14825-2019, 2019.
Tang, M. J., Shiraiwa, M., Pöschl, U., Cox, R. A., and Kalberer, M.: Compilation and evaluation of gas phase diffusion coefficients of reactive trace gases in the atmosphere: Volume 2. Diffusivities of organic compounds, pressure-normalised mean free paths, and average Knudsen numbers for gas uptake calculations, Atmos. Chem. Phys., 15, 5585–5598, https://doi.org/10.5194/acp-15-5585-2015, 2015.
Tennison, S. R.: Phenolic-resin-derived activated carbons, Appl. Catal. A Gen., 173, 289–311, https://doi.org/10.1016/S0926-860X(98)00186-0, 1998.
Tröstl, J., Chuang, W. K., Gordon, H., Heinritzi, M., Yan, C., Molteni, U., Ahlm, L., Frege, C., Bianchi, F., Wagner, R., Simon, M., Lehtipalo, K., Williamson, C., Craven, J. S., Duplissy, J., Adamov, A., Almeida, J., Bernhammer, A. K., Breitenlechner, M., Brilke, S., Dias, A., Ehrhart, S., Flagan, R. C., Franchin, A., Fuchs, C., Guida, R., Gysel, M., Hansel, A., Hoyle, C. R., Jokinen, T., Junninen, H., Kangasluoma, J., Keskinen, H., Kim, J., Krapf, M., Kürten, A., Laaksonen, A., Lawler, M., Leiminger, M., Mathot, S., Möhler, O., Nieminen, T., Onnela, A., Petäjä, T., Piel, F. M., Miettinen, P., Rissanen, M. P., Rondo, L., Sarnela, N., Schobesberger, S., Sengupta, K., Sipilä, M., Smith, J. N., Steiner, G., Tomè, A., Virtanen, A., Wagner, A. C., Weingartner, E., Wimmer, D., Winkler, P. M., Ye, P., Carslaw, K. S., Curtius, J., Dommen, J., Kirkby, J., Kulmala, M., Riipinen, I., Worsnop, D. R., Donahue, N. M., and Baltensperger, U.: The role of low-volatility organic compounds in initial particle growth in the atmosphere, Nature, 533, 527–531, https://doi.org/10.1038/nature18271, 2016.
Tsigaridis, K., Daskalakis, N., Kanakidou, M., Adams, P. J., Artaxo, P., Bahadur, R., Balkanski, Y., Bauer, S. E., Bellouin, N., Benedetti, A., Bergman, T., Berntsen, T. K., Beukes, J. P., Bian, H., Carslaw, K. S., Chin, M., Curci, G., Diehl, T., Easter, R. C., Ghan, S. J., Gong, S. L., Hodzic, A., Hoyle, C. R., Iversen, T., Jathar, S., Jimenez, J. L., Kaiser, J. W., Kirkevåg, A., Koch, D., Kokkola, H., Lee, Y. H., Lin, G., Liu, X., Luo, G., Ma, X., Mann, G. W., Mihalopoulos, N., Morcrette, J.-J., Müller, J.-F., Myhre, G., Myriokefalitakis, S., Ng, N. L., O'Donnell, D., Penner, J. E., Pozzoli, L., Pringle, K. J., Russell, L. M., Schulz, M., Sciare, J., Seland, Ø., Shindell, D. T., Sillman, S., Skeie, R. B., Spracklen, D., Stavrakou, T., Steenrod, S. D., Takemura, T., Tiitta, P., Tilmes, S., Tost, H., van Noije, T., van Zyl, P. G., von Salzen, K., Yu, F., Wang, Z., Wang, Z., Zaveri, R. A., Zhang, H., Zhang, K., Zhang, Q., and Zhang, X.: The AeroCom evaluation and intercomparison of organic aerosol in global models, Atmos. Chem. Phys., 14, 10845–10895, https://doi.org/10.5194/acp-14-10845-2014, 2014.
Volkamer, R., Jimenez, J. L., San Martini, F., Dzepina, K., Zhang, Q., Salcedo, D., Molina, L. T., Worsnop, D. R., and Molina, M. J.: Secondary organic aerosol formation from anthropogenic air pollution: Rapid and higher than expected, Geophys. Res. Lett., 33, 7–10, https://doi.org/10.1029/2006GL026899, 2006.
Wang, Y., Mehra, A., Krechmer, J. E., Yang, G., Hu, X., Lu, Y., Lambe, A., Canagaratna, M., Chen, J., Worsnop, D., Coe, H., and Wang, L.: Oxygenated products formed from OH-initiated reactions of trimethylbenzene: autoxidation and accretion, Atmos. Chem. Phys., 20, 9563–9579, https://doi.org/10.5194/acp-20-9563-2020, 2020.
Wang, D. S., Lee, C. P., Krechmer, J. E., Majluf, F., Tong, Y., Canagaratna, M. R., Schmale, J., Prévôt, A. S. H., Baltensperger, U., Dommen, J., El Haddad, I., Slowik, J. G., and Bell, D. M.: Dataset for “Constraining the response factors of an extractive electrospray ionization mass spectrometer for near-molecular aerosol speciation”, Zenodo [data set], https://doi.org/10.5281/zenodo.5543327, 2021.
Williams, L. R., Gonzalez, L. A., Peck, J., Trimborn, D., McInnis, J., Farrar, M. R., Moore, K. D., Jayne, J. T., Robinson, W. A., Lewis, D. K., Onasch, T. B., Canagaratna, M. R., Trimborn, A., Timko, M. T., Magoon, G., Deng, R., Tang, D., de la Rosa Blanco, E., Prévôt, A. S. H., Smith, K. A., and Worsnop, D. R.: Characterization of an aerodynamic lens for transmitting particles greater than 1 micrometer in diameter into the Aerodyne aerosol mass spectrometer, Atmos. Meas. Tech., 6, 3271–3280, https://doi.org/10.5194/amt-6-3271-2013, 2013.
Wu, Z., Zhou, Y., Xu, N., Tao, L., and Chen, H.: Extractive electrospray ionization mass spectrometry for sensitive detection of gaseous radioactive iodine-129, J. Anal. At. Spectrom., 28, 697–701, https://doi.org/10.1039/c3ja00011g, 2013.
Xu, W., Croteau, P., Williams, L., Canagaratna, M., Onasch, T., Cross, E., Zhang, X., Robinson, W., Worsnop, D., and Jayne, J.: Laboratory characterization of an aerosol chemical speciation monitor with PM2.5 measurement capability, Aerosol Sci. Tech., 51, 69–83, https://doi.org/10.1080/02786826.2016.1241859, 2017.
Yang, W., Li, Y., Kang, C., Zhao, H., Xiang, L., Li, C., and Wang, Q.: Sodiation-based in-source collision for profiling of pyranocoumarins in Radix Peucedani (Qianhu): utility of sodium adducts' stability with in-source collision, J. Mass Spectrom., 52, 152–164, https://doi.org/10.1002/jms.3913, 2017.
Yuan, B., Koss, A. R., Warneke, C., Coggon, M., Sekimoto, K., and De Gouw, J. A.: Proton-Transfer-Reaction Mass Spectrometry: Applications in Atmospheric Sciences, Chem. Rev., 117, 13187–13229, https://doi.org/10.1021/acs.chemrev.7b00325, 2017.
Zhao, Z., Yang, X., Lee, J., Tolentino, R., Mayorga, R., and Zhang, W.: Diverse Reactions in Highly Functionalized Organic Aerosols during Thermal Desorption, ACS Earth Space Chem., 4, 283–296, https://doi.org/10.1021/acsearthspacechem.9b00312, 2019.
- Abstract
- Introduction
- Experimental setup
- Results and discussion
- Conclusion
- Appendix A: Glossary of selected terms and abbreviations used in the study
- Data availability
- Author contributions
- Competing interests
- Disclaimer
- Special issue statement
- Acknowledgements
- Financial support
- Review statement
- References
- Supplement