the Creative Commons Attribution 4.0 License.
the Creative Commons Attribution 4.0 License.
 | 29 Jan 2021
Improving cloud type classification of ground-based images using region covariance descriptors
Yuzhu Tang
Pinglv Yang
Zeming Zhou
Delu Pan
Jianyu Chen
Xiaofeng Zhao
The distribution and frequency of occurrence of different cloud types affect the energy balance of the Earth. Automatic cloud type classification of images continuously observed by the ground-based imagers could help climate researchers find the relationship between cloud type variations and climate change. However, by far it is still a huge challenge to design a powerful discriminative classifier for cloud categorization. To tackle this difficulty, in this paper, we present an improved method with region covariance descriptors (RCovDs) and the Riemannian bag-of-feature (BoF) method. RCovDs model the correlations among different dimensional features, which allows for a more discriminative representation. BoF is extended from Euclidean space to Riemannian manifold by k-means clustering, in which Stein divergence is adopted as a similarity metric. The histogram feature is extracted by encoding RCovDs of the cloud image blocks with a BoF-based codebook. The multiclass support vector machine (SVM) is utilized for the recognition of cloud types. The experiments on the ground-based cloud image datasets show that a very high prediction accuracy (more than 98 % on two datasets) can be obtained with a small number of training samples, which validate the proposed method and exhibit the competitive performance against state-of-the-art methods.
- Article
(2866 KB) - Full-text XML
- BibTeX
- EndNote


Clouds affect the Earth's climate by modulating Earth's basic radiation balance (Hartmann et al., 1992; Ramanathan et al., 1989). Cloud type variations are shown to be as important as cloud cover in modifying the radiation field of the Earth–atmosphere system. For example, stratocumulus, altostratus and cirrostratus clouds produce the largest annual mean changes of the global top-of-atmosphere and surface shortwave radiative fluxes (Chen et al., 2000). Cloud type is also one of the most reliable predictors of weather, e.g., cirrocumulus clouds are a sign of good weather. Therefore, accurate cloud type classification is in great need. Currently, the classification task is mainly undertaken by manual observation, which is a labor-intensive and time-consuming method. Benefiting from the development of ground-based cloud image devices, we are able to continuously acquire cloud images and automatically classify the cloud types.
Clouds are by their very nature highly variable (Joubert, 1978), which makes the automatic classification a tough task. It is found that structure and texture are suitable to describe the visual appearance of clouds. The structural features include intensity gradient (Luo et al., 2018), mean grey value (Calbó and Sabburg, 2008; Liu et al., 2011), the census transform histogram (Xiao et al., 2016; Zhuo et al., 2014), edge sharpness (Liu et al., 2011), and features based on Fourier transform (Calbó and Sabburg, 2008). The textural features contain the scale invariant feature transform (SIFT) (Xiao et al., 2016), the grey level co-occurrence matrix (GLCM) (Cheng and Yu, 2015; Heinle et al., 2010; Huertas, 2017; Kazantzidis et al., 2012; Luo et al., 2018), the local binary patterns (LBPs) (Cheng and Yu, 2015) and its extensions (Liu et al., 2015; Y. Wang et al., 2018). Commonly, no single feature is best suited for cloud type recognition; thus, most existing algorithms tend to integrate multiple features to describe the cloud characteristics. However, those algorithms rarely consider the correlations between different dimensional features, which could lower the classification accuracy.
Within recent years, convolutional neural networks (CNNs) have been exploited for multitudes of image recognition models and have achieved remarkable performance (Krizhevsky et al., 2012). Being different from hand-crafted features, CNNs extract hierarchical features including the low-level details and high-level semantic information. Recently, plenty of studies (Shi et al., 2017; Ye et al., 2017) have obtained encouraging results by extracting the cloud signature from pre-trained CNNs, such as AlexNet (Krizhevsky et al., 2012) and VGGNet (Simonyan and Zisserman, 2015). In addition, attempts have been made to simply exploit end-to-end CNN models for cloud categorization (Li et al., 2020; Liu et al., 2019; Liu and Li, 2018; Liu et al., 2018; Zhang et al., 2018). However, the insufficiency of labeled samples might make the network hard to converge in the training stage.
The main challenges of the ground-based cloud image classification task can be ascribed to the following reasons. (1) One single feature cannot effectively describe different types of clouds; we need to extract textural, structural and statistical features simultaneously. (2) The scale of cloud varies greatly; therefore, the extracted features should be robust in the presence of illumination changes and nonrigid motion. (3) Different cloud types may have similar local characteristics; thus, the global features need to be considered. To address those issues, we utilize region covariance descriptors (RCovDs) to encode the features of the cloud image blocks, and with the aid of the bag-of-feature (BoF) method, we aggregate those local descriptors to obtain the global cloud image feature for cloud type classification.
The performance of RCovDs (Tuzel et al., 2006) is proved to be superior on object detection (Carreira et al., 2015; Guo et al., 2010; Li et al., 2013; Pang et al., 2008) and classification tasks (Fang et al., 2018; Li et al., 2013; Wang et al., 2012). As the second-order statistics of the image features, RCovDs can provide rich and compact context representations. The noises are largely filtered out by removing the mean values of the features. RCovDs are also scale and rotation invariant, irrespective of the pixel positions and numbers of sample points. Despite of their attractive properties, directly adopting RCovDs for cloud type classification is still of difficulty on account of their non-Euclidean geometry property. RCovDs are symmetric positive definite (SPD) matrices and naturally reside in a Riemannian manifold, therefore, the machine-learning algorithms on Euclidean space should be adapted for the automatic cloud image recognition.
In Euclidean space, BoF describes an image as a vector from a set of local descriptors (Jégou et al., 2012), and it aggregates the local features to obtain a global representation. Inspired by the work in (Faraki et al., 2015a), we encode RCovDs of the local image blocks into a histogram by using Riemannian counterpart of the conventional BoF, taking the geodesic distance of the underlying manifold as the metric.
In this paper, we extend our previous work (Luo et al., 2018), and propose an improved cloud type classification method based on RCovDs. The diagram is shown in Fig. 1. In the first step, we extract multiple pixel-level features such as intensity, color and gradients from the cloud image blocks to form RCovDs. In the second step, RCovDs are encoded by the Riemannian BoF to output the histogram representation. In the last step, the histogram is taken as the feed of the multiclass support vector machine (SVM) for cloud type prediction.
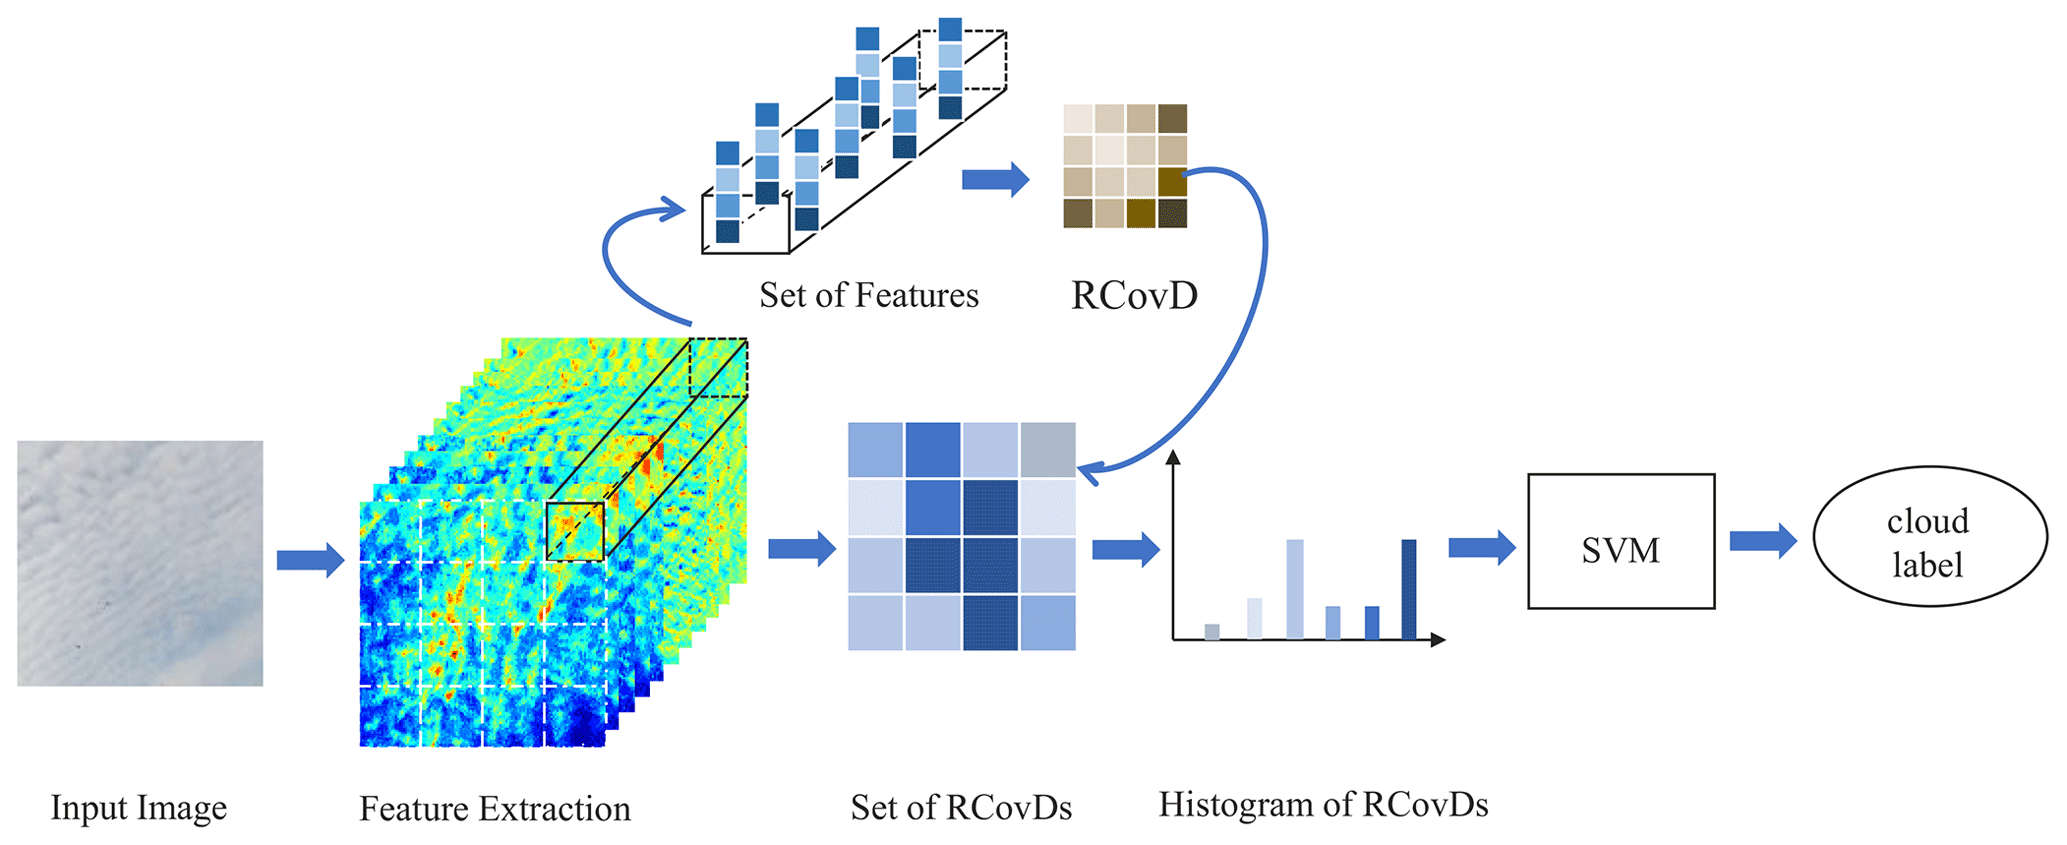
Figure 1Pipeline of the proposed cloud classification method. Multiple pixel-level features are firstly extracted from the cloud image blocks to form RCovDs; then the histogram representation of RCovDs is obtained by Riemannian BoF; finally, the cloud type is predicted by multiclass SVM.
The main contributions of this paper are the following:
-
The RCovD is firstly introduced to characterize the cloud image local patterns and the Riemannian BoF is applied to encode RCovDs into image-level histogram.
-
The impacts of Riemannian BoF codebook size and the image block size on cloud type classification accuracy are investigated.
-
For the small training dataset, the proposed algorithm offers better performance as compared to the state-of-the-art approaches.
The remainder of this paper is organized as follows. Section 2 introduces the ground-based cloud image datasets and details the proposed cloud type classification method. Experimental results and comparisons with other methods are presented in Sect. 3. Section 4 concludes our contributions and discusses the future work.
2.1 Dataset
2.1.1 SWIMCAT dataset
The Singapore Whole sky IMaging CATegories Database (SWIMCAT) was captured by a wide-angle high-resolution sky imaging system (WAHRISIS) (Dev et al., 2014), a calibrated ground-based whole-sky imager. During this observation, from January 2013 to May 2014, different weather conditions spanning several seasons are covered and far-reaching cloud categories are collected. The SWIMCAT dataset involves 784 sky and cloud images, including five distinct classes: clear sky, patterned clouds, thick dark clouds, thick white clouds and veil clouds. Figure 2 shows sample images from each category, the images have a dimension of 125×125 pixels (Dev et al., 2015).
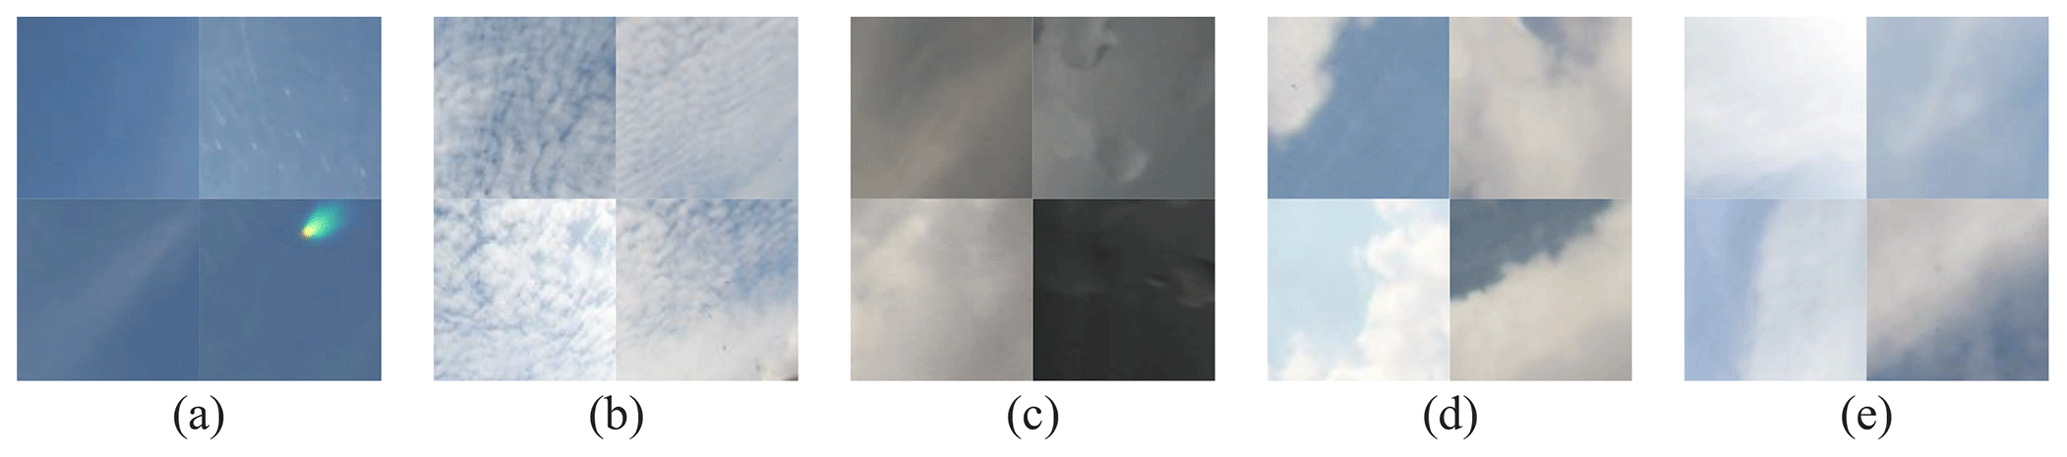
Figure 2Sample images from the SWIMCAT dataset. The dataset includes five cloud types, namely, (a) clear sky, (b) patterned clouds, (c) thick dark clouds, (d) thick white clouds and (e) veil clouds.
2.1.2 zenithal dataset
This dataset was acquired by the whole-sky infrared cloud-measuring system (WSIRCMS), which is located in Nanjing, China. The zenithal dataset contains 500 sky and cloud images, comprising five different categories: cirriform clouds, clear skies, cumuliform clouds, stratiform clouds and waveform clouds (Liu et al., 2011, 2013). Figure 3 illustrates some sample images of different cloud types, and the image size is 320 × 240 pixels.
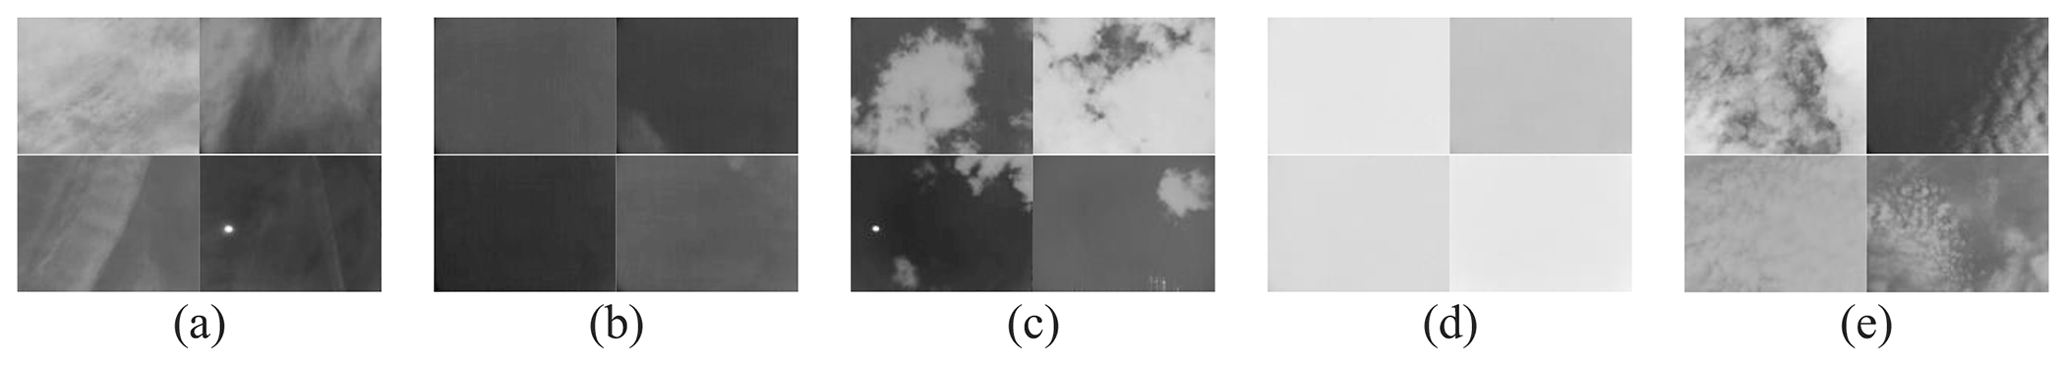
Figure 3Sample images from the zenithal dataset: (a) cirriform clouds, (b) clear sky, (c) cumuliform clouds, (d) stratiform clouds and (e) waveform clouds.
2.2 Feature extraction
The features for cloud type recognition should be representative and discriminative. In this paper, for the zenithal dataset, seven features are extracted, including the image intensity I(x,y), the norms of first- and second-order derivatives of I(x,y) in both x and y direction, and the norm of gradient. The zenithal cloud image is mapped to a seven-dimensional feature space:
As for the SWIMCAT dataset, we empirically choose the grayscale of the B component, norms of first-order derivatives of each color component and the norm of gradient. Each pixel of the SWIMCAT image is transformed to a 13-dimensional feature map.
We divide the cloud image into image blocks and then compute the SPD matrices with the feature maps defined in Eqs. (1) and (2). With the Riemannian BoF, those local feature descriptors in the form of SPD matrices are converted into a histogram feature vector, which is used for cloud type classification.
2.3 Region covariance descriptors
Let f be the feature map extracted from the cloud image I. For a given rectangular region R with size w×w, it contains pixels of d-dimensional feature vectors . The RCovD is defined by a d×d symmetric covariance matrix CR:
where is the mean of the feature vectors.
The RCovD correlates different components of the feature vectors, the diagonal entry CR(i,i) represents the variance of ith components of n feature vectors, and the element CR(i,j) denotes the covariance of the ith and jth components. Specifically, RCovD subtracts the mean of the feature vectors, so it can filter out the noise to a certain extent. Note that there might be a slight chance that CR is not strictly positive definite; in this particular case, CR could be converted into a symmetric positive definite (SPD) matrix by adding a regularization term λE, where λ is a coefficient with a small value which is set to , and E is the identity matrix (Huang et al., 2018; Wang et al., 2012; W. Wang et al., 2018).
RCovDs belong to SPD manifold; when it is endowed with a Riemannian metric, it forms a Riemannian manifold. Based on the metric, the geodesic distance can be induced to measure the similarity of the image features. The geodesic distance is the length of the shortest curve between two SPD matrices on SPD Riemannian manifold. The most common distance is the affine invariant Riemannian metric (AIRM) (Pennec et al., 2006):
where ∥⋅∥F is the Frobenius matrix norm and log (⋅) denotes the matrix logarithm. The matrix logarithm can be calculated by singular-value decomposition (SVD); let be the eigenvalue decomposition of a symmetric matrix, then the logarithm of A is given by
However, AIRM is computationally demanding. Driven by such computational concerns, in this paper we adopt the Stein divergence (Sra, 2012) as a Riemannian distance metric, which is defined as
where |⋅| denotes the determinant (det) operator.
2.4 Riemannian bag-of-feature method
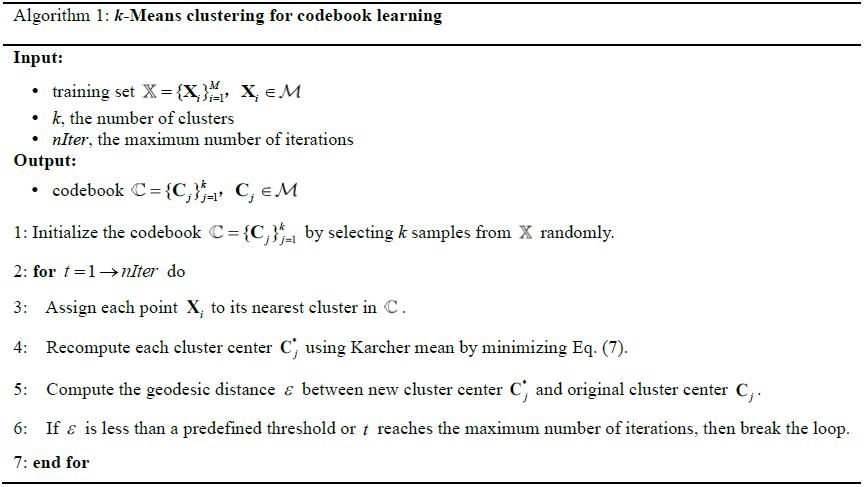
BoF requires a codebook with k codewords, which are usually obtained by clustering local descriptors. To extend the conventional BoF from Euclidean space into SPD Riemannian manifold ℳ, two steps should be considered. (1) Construct a codebook from a set of training RCovDs . (2) Obtain a k-dimensional histogram from a set of RCovDs with the codebook ℂ.
An alternative way to learn a codebook is to apply the conventional k-means clustering on vectorized RCovDs in the tangent space (Faraki et al., 2015b); however, it neglects the non-Euclidean geometric structure of SPD matrices. Taking the Riemannian geometry of SPD matrices into consideration, a possible way is to compute the cluster centers with Karcher mean (Pennec, 2006). The Karcher mean finds a point that minimizes the following object function:
where δS is Stein divergence to measure the geodesic distance of Xi and the clustering center Cj. Given the training set 𝕏, the codebook ℂ is initialized by randomly selecting k RCovDs from 𝕏 and iteratively updating the cluster centers using Eq. (7) until the average distance between each point Xi and its nearest cluster is minimized. The procedure is summarized in Algorithm 1. We choose the number of codewords empirically by considering the trade-off between classification accuracy and computation consumption, which will be detailed in Sect. 3.
After obtaining the codebook ℂ, the image-level feature can be expressed with the histogram H of RCovDs. In the most straightforward case, H can be yielded by hard-coding each RCovD Ei to the closest codeword in ℂ with Stein divergence. The jth ( dimension of H denotes the number of RCovDs assigned to the jth codeword. To demonstrate the significance of the histogram feature generated by Riemannian BoF, we randomly select half of the images in the SWIMCAT dataset and partition each 125×125 image into 25 nonoverlapping image blocks of size 25×25 to extract the second-order tensor features in the form of RCovD. Then, we learn a codebook of 10 codewords with Algorithm 1. In the same way, we select 20 images of each cloud type from the remaining images in the SWIMCAT dataset to construct a set of RCovDs for test and assign each RCovD to the nearest codeword to obtain the RCovD histogram of each cloud type. As shown in Fig. 4, RCovDs from different cloud types have obviously separable codeword distributions. RCovD distributions of clear sky, pattern and thick dark clouds are relatively concentrated, while the distributions of thick white and veil clouds are slightly scattered. In particular, the RCovDs of veil clouds and clear sky are assigned to almost the same codewords, which makes the categorization of these two types challenging. Overall, our proposed Riemannian BoF provides vectorized discriminative representation for the cloud classification task.
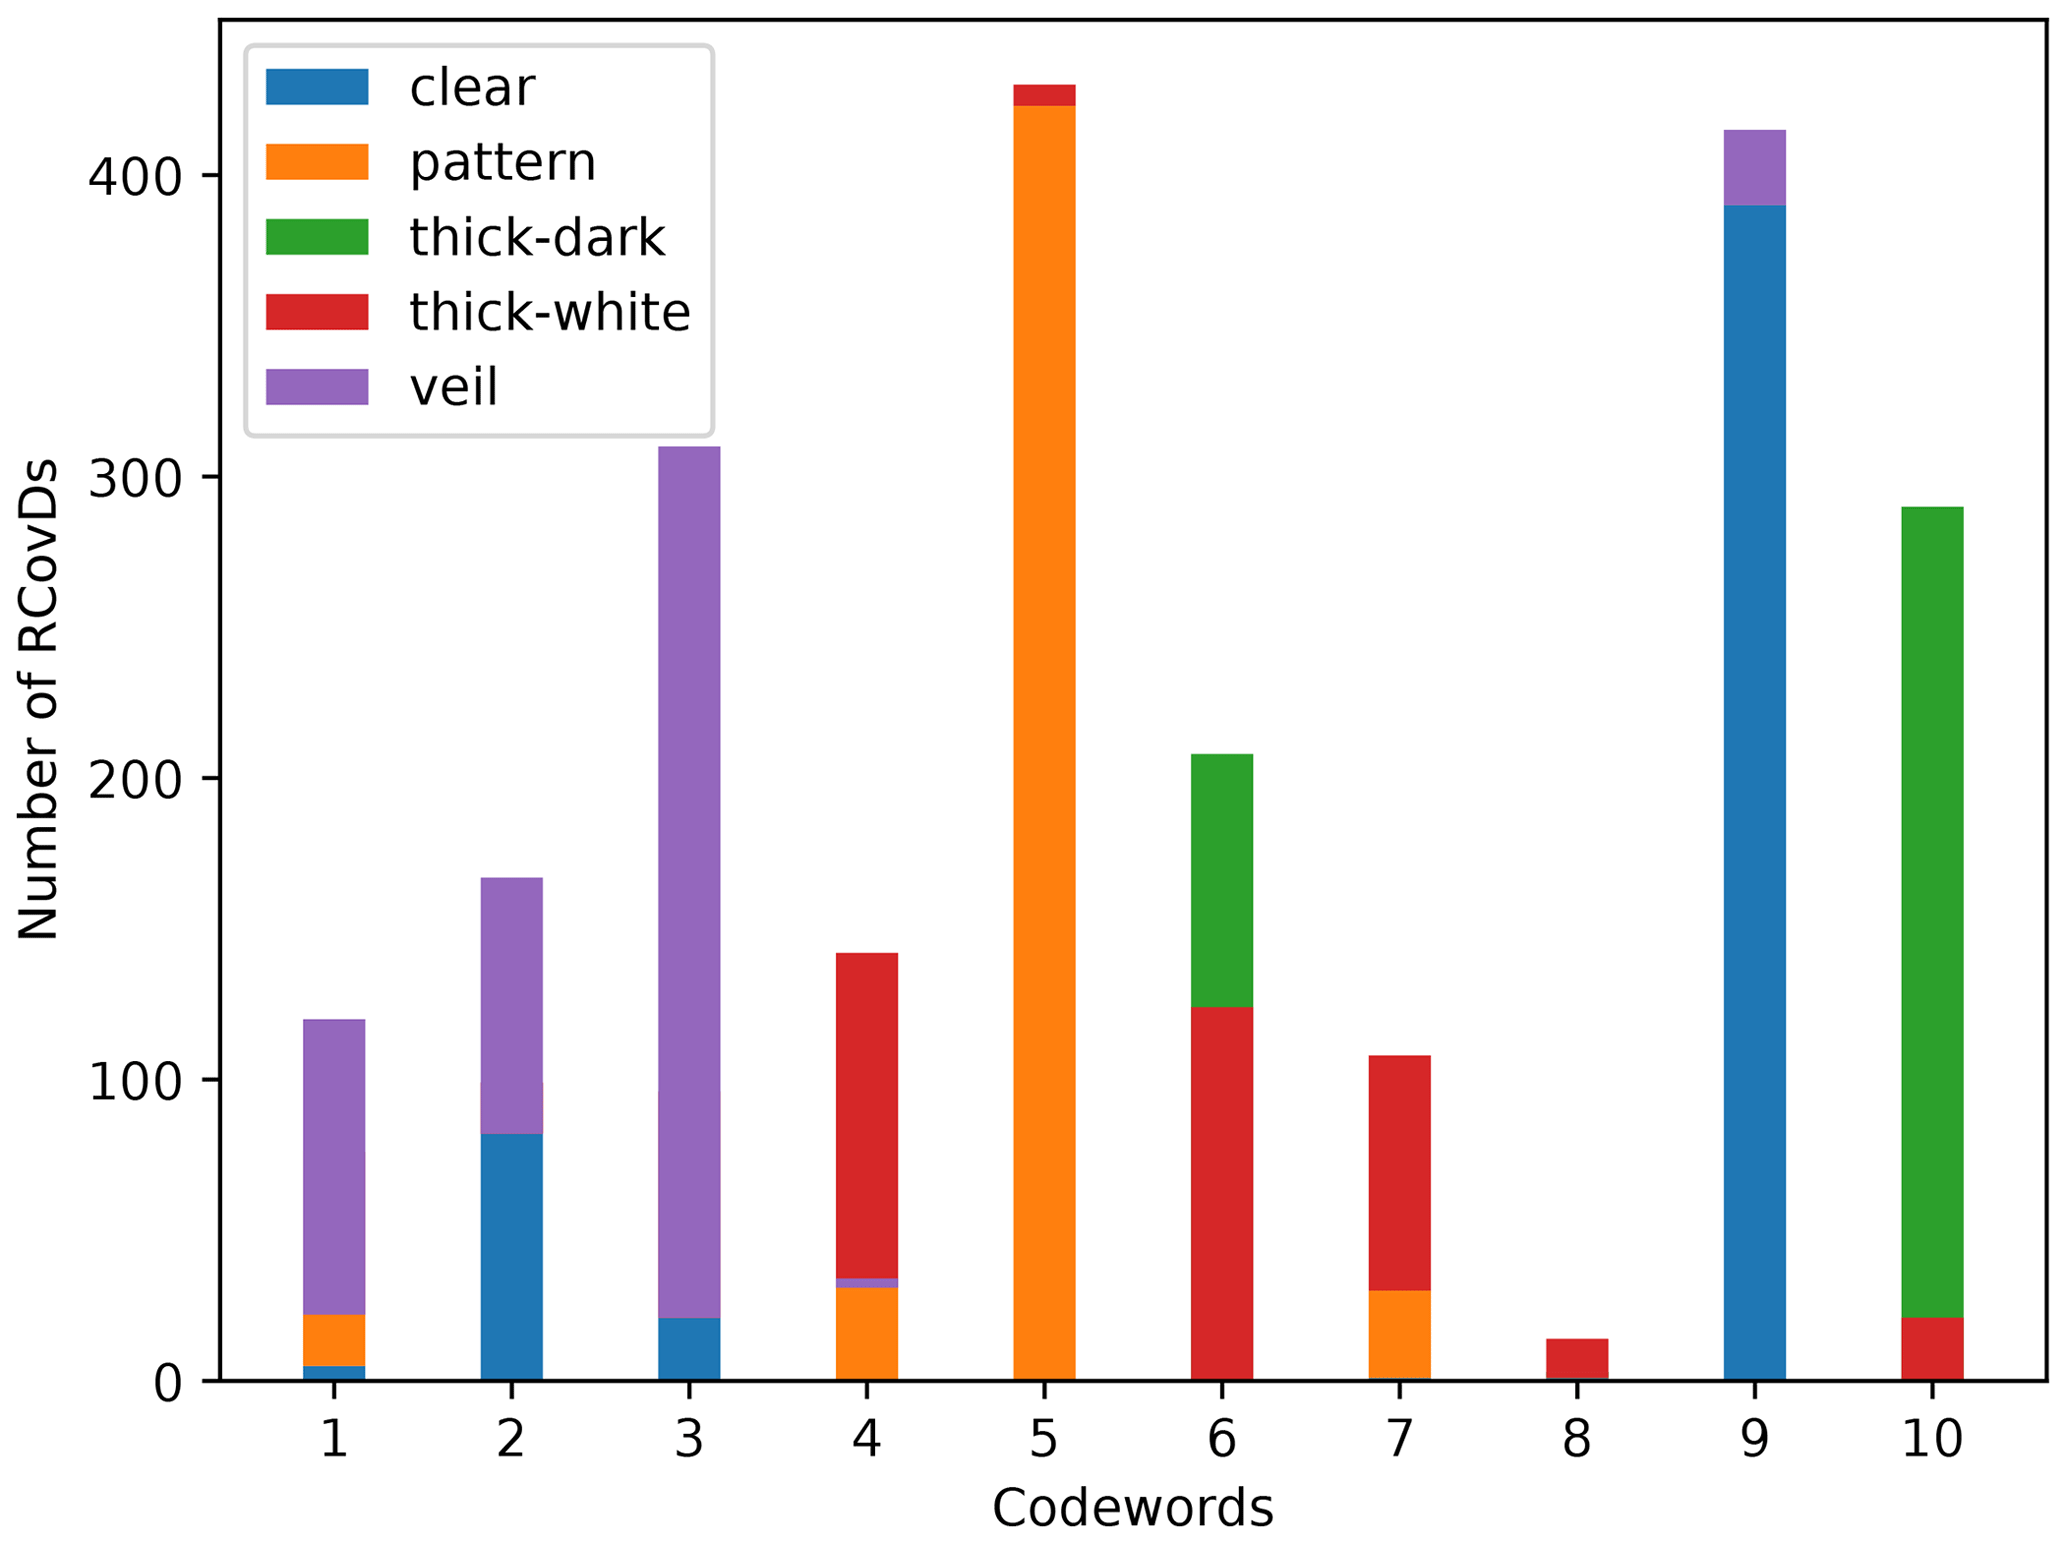
Figure 4Histogram of RCovDs from different cloud types on SWIMCAT dataset. RCovDs from different cloud types have distinctive codeword distributions. RCovD distributions of clear sky, pattern and thick dark clouds are relatively concentrated, while the distributions of thick white and veil clouds are slightly scattered. RCovDs of veils clouds and clear sky are assigned to almost the same codewords, which makes the categorization of these two types challenging.
2.5 Classification
SVM has significant performance in the classification task, since it establishes an input–output relationship directly from the training dataset; it excludes the need for any a priori assumptions or specific preprocessing phases. Another merit is that, once the training procedure is finished, the classification is directly obtained in real time with a strong reduction in computation (Taravat et al., 2015).
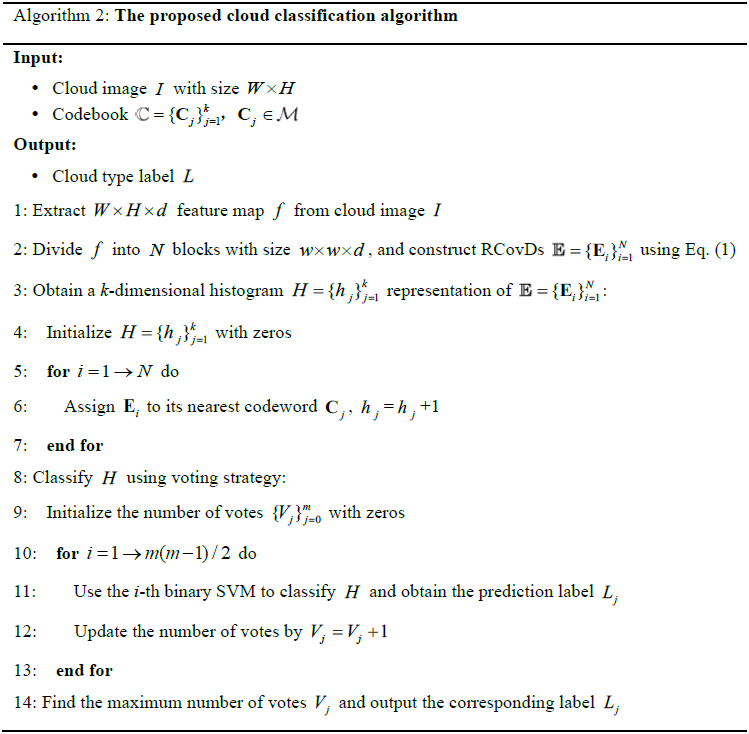
For m-class classification tasks, there are several ways to build SVM classifiers. In this paper, the “one-against-one” method is adopted, in which binary classifiers are constructed, and each classifier distinguishes one cloud type from another. We use the voting strategy to designate the cloud image to the category with the maximum number of votes (Chang and Lin, 2007; Hsu and Lin, 2002; Knerr et al., 1990; Kreßel, 1999). The proposed algorithm is summarized in Algorithm 2, in which SVM is implemented by the LIBSVM toolbox (Chang and Lin, 2007).
To demonstrate the performance of our proposed cloud type classification method, we conduct several experiments on the SWIMCAT and zenithal datasets. We firstly analyze the effects of the two parameters (i.e., the codebook size k and the image block size w×w) involved in the proposed algorithm on cloud type classification accuracy. Then, we design an empirical validation with various training and test partitions. Finally, we quantitatively evaluate and compare the best results of different methods, i.e., weighted local binary patterns (WLBP) (Liu et al., 2015), block-based cloud classification (BC) (Cheng and Yu, 2015), and Luo's methods (Luo et al., 2018).
3.1 Parameter configuration analysis
In order to assess the impacts of the codebook size, i.e., the centroids number k, and the image block size w×w on cloud classification accuracy, we conduct a sensitivity analysis on the SWIMCAT and zenithal datasets. In our experiments, k ranges from 5 to 40 with interval 5, and w ranges from 8 to 120 with the step size of 4. For a given w, the feature map is divided into blocks starting from the upper left corner of the feature map, and the incomplete blocks at the edges are dropped. We randomly choose 9 out of every 10 images (9/10) of the dataset for training, and the rest are for testing. The classification accuracy of each parameter configuration, as shown in Fig. 5, indicates that, to a certain extent, the larger the number of codebook size, the better the performance for both datasets. However, we observe that the improvement is not statistically significant after k exceeds 20, while the computing burden increases obviously. In fact, the complexity of the Riemannian BoF is mainly determined by the cluster center number. We note that as the block size w increases, the classification accuracy increases first and then degrades beyond the highest point, this trend is especially evident for the zenithal dataset. The reason is that larger blocks can capture more abundant texture information, while the local details might be ignored. Therefore, in the following experiments, considering trade-offs between classification accuracy and efficiency, we set k=30 and w=24 for the SWIMCAT dataset, and k and w are set to 35 and 52 for the zenithal dataset, respectively.
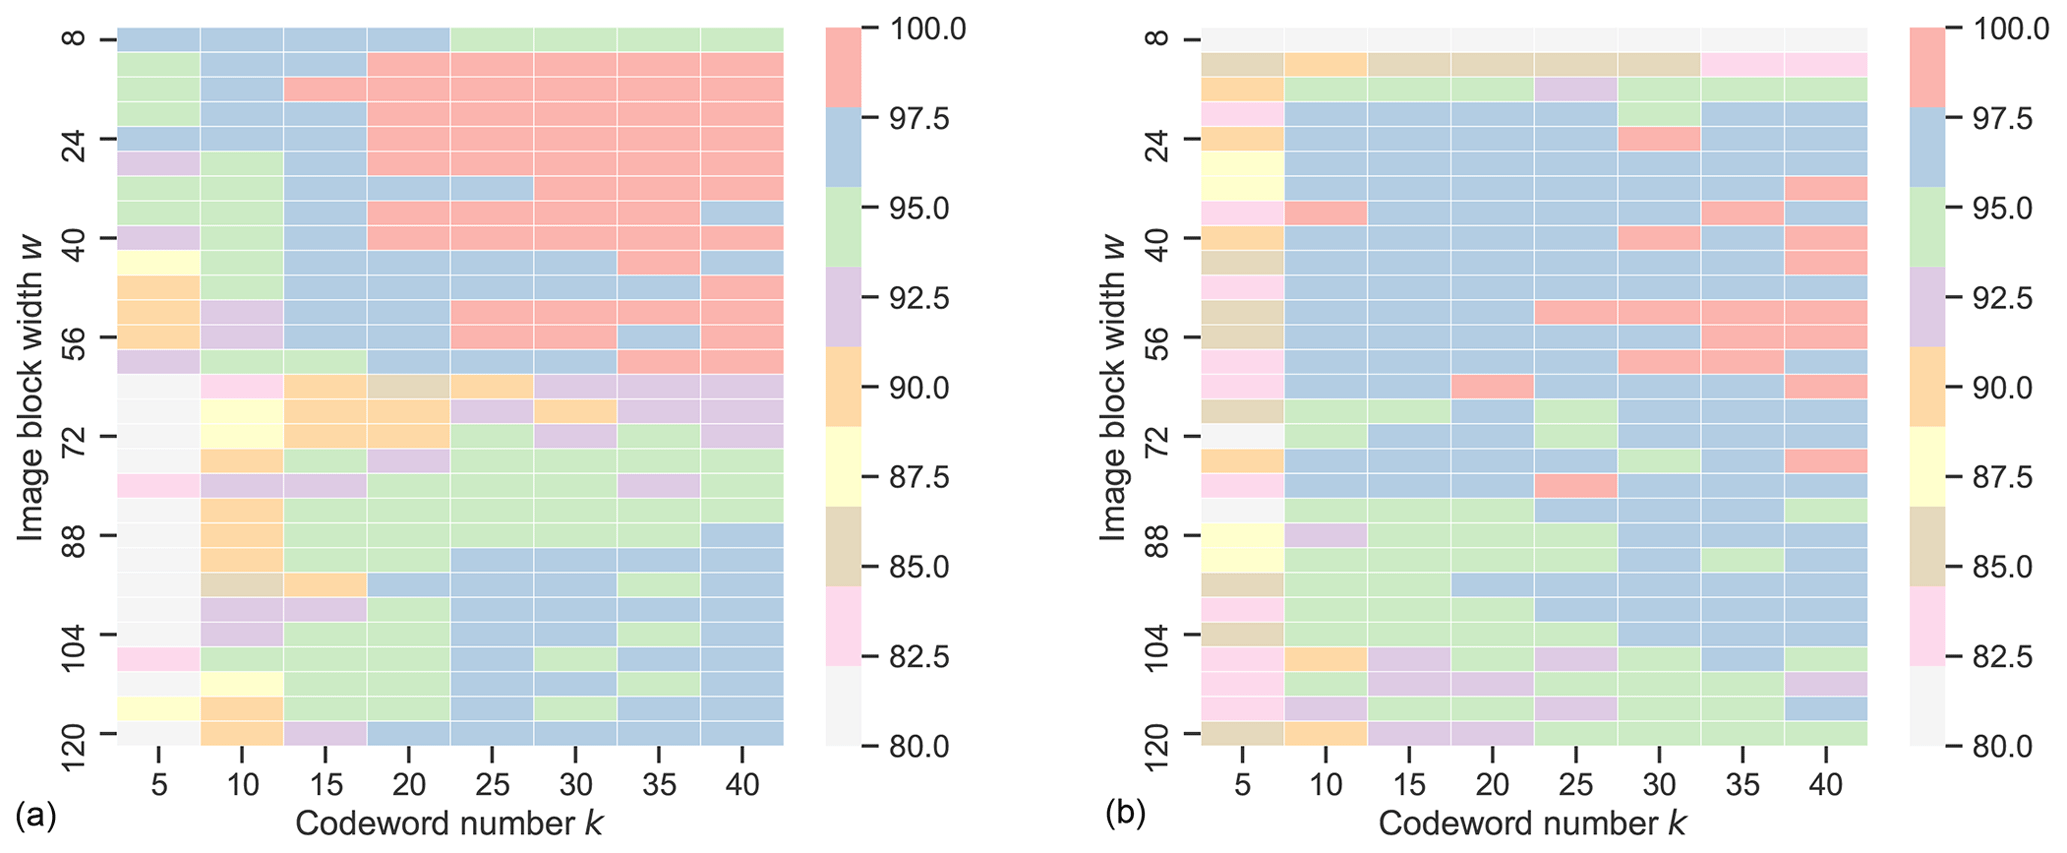
Figure 5Sensitivity analysis of parameters k and w in the proposed method on the SWIMCAT dataset (a) and the zenithal dataset (b).
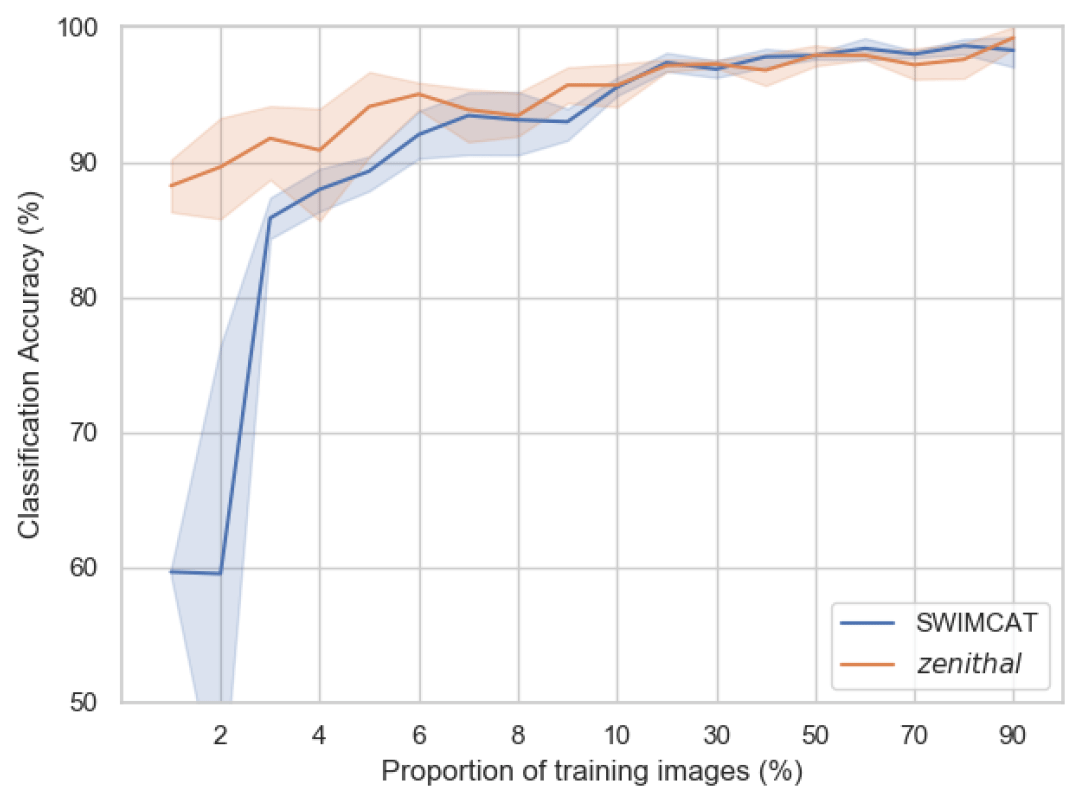
Figure 6Performance analysis of training images with different proportions on the SWIMCAT dataset and zenithal dataset.
3.2 Evaluation of dataset with small sample size
In machine-learning tasks, suitable annotated data samples are in short supply and quite costly for classifier training and testing. Since manual labeling requires much work, it is of great significance to reduce the dependence of the classification model on the labeled dataset. To estimate the performance of the proposed method comprehensively, we extract different proportions of training images randomly from each dataset and take the rest of the images as the test set. In order to guarantee the stability of the classification results, each experiment was repeated five times to take the average as the final classification result. Figure 6 shows that in the situation of small sample size, for the SWIMCAT dataset, the proposed method achieves an accuracy of more than 90 % on the test set with only 3 % of images (i.e., 24 out of 784) of the dataset as the training set. The accuracy can be improved by 5 % at least when the training set accounts for 9 % of the images (i.e., 72 out of 784). As for the zenithal dataset, our method obtains more than 90 % classification accuracy on the test set when we randomly select 6 % of the images (i.e., 30 out of 500) of the dataset as training set, and achieves more than 95 % accuracy when the proportion of training images increases to 10 %. Generally, our proposed method significantly fulfills a high classification accuracy in small training sample situations. This is remarkable, considering that our proposed method is combining just RCovDs and Riemannian BoF. In conclusion, the proposed method requires only a few manually labeled samples to achieve a high cloud type recognition accuracy.
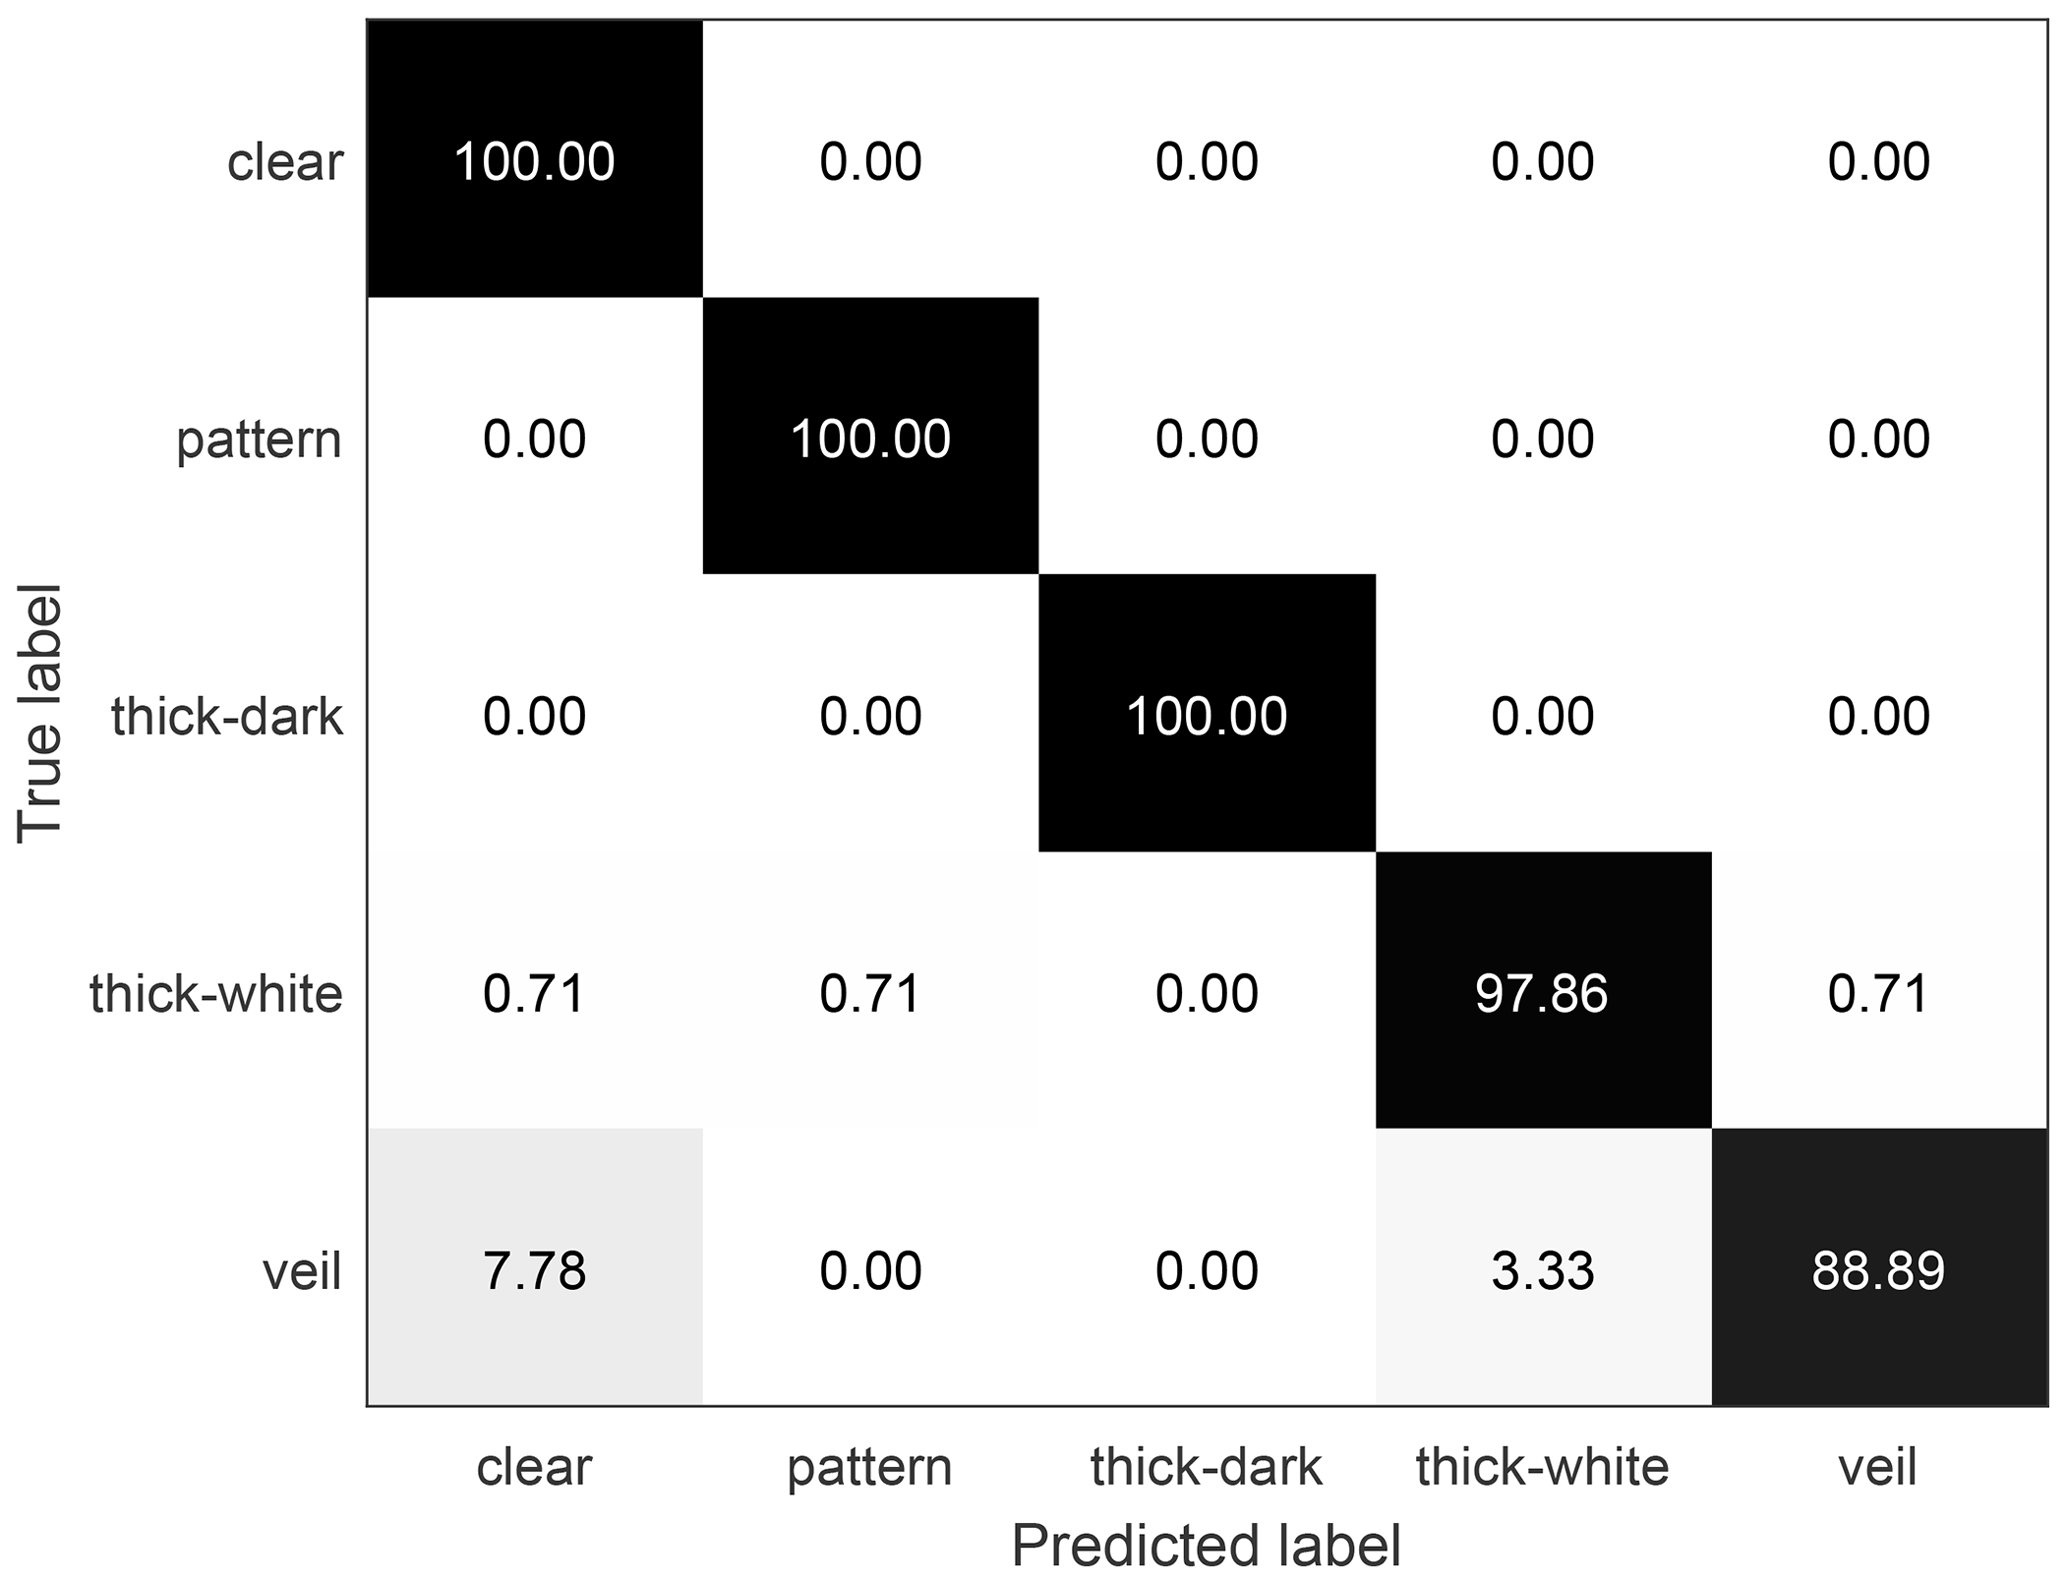
Figure 7The confusion matrix of the SWIMCAT dataset classification results using our proposed method. Nine-tenths (9/10) of the dataset is used for training and the rest is used for testing; the overall classification accuracy is 98.4 %.
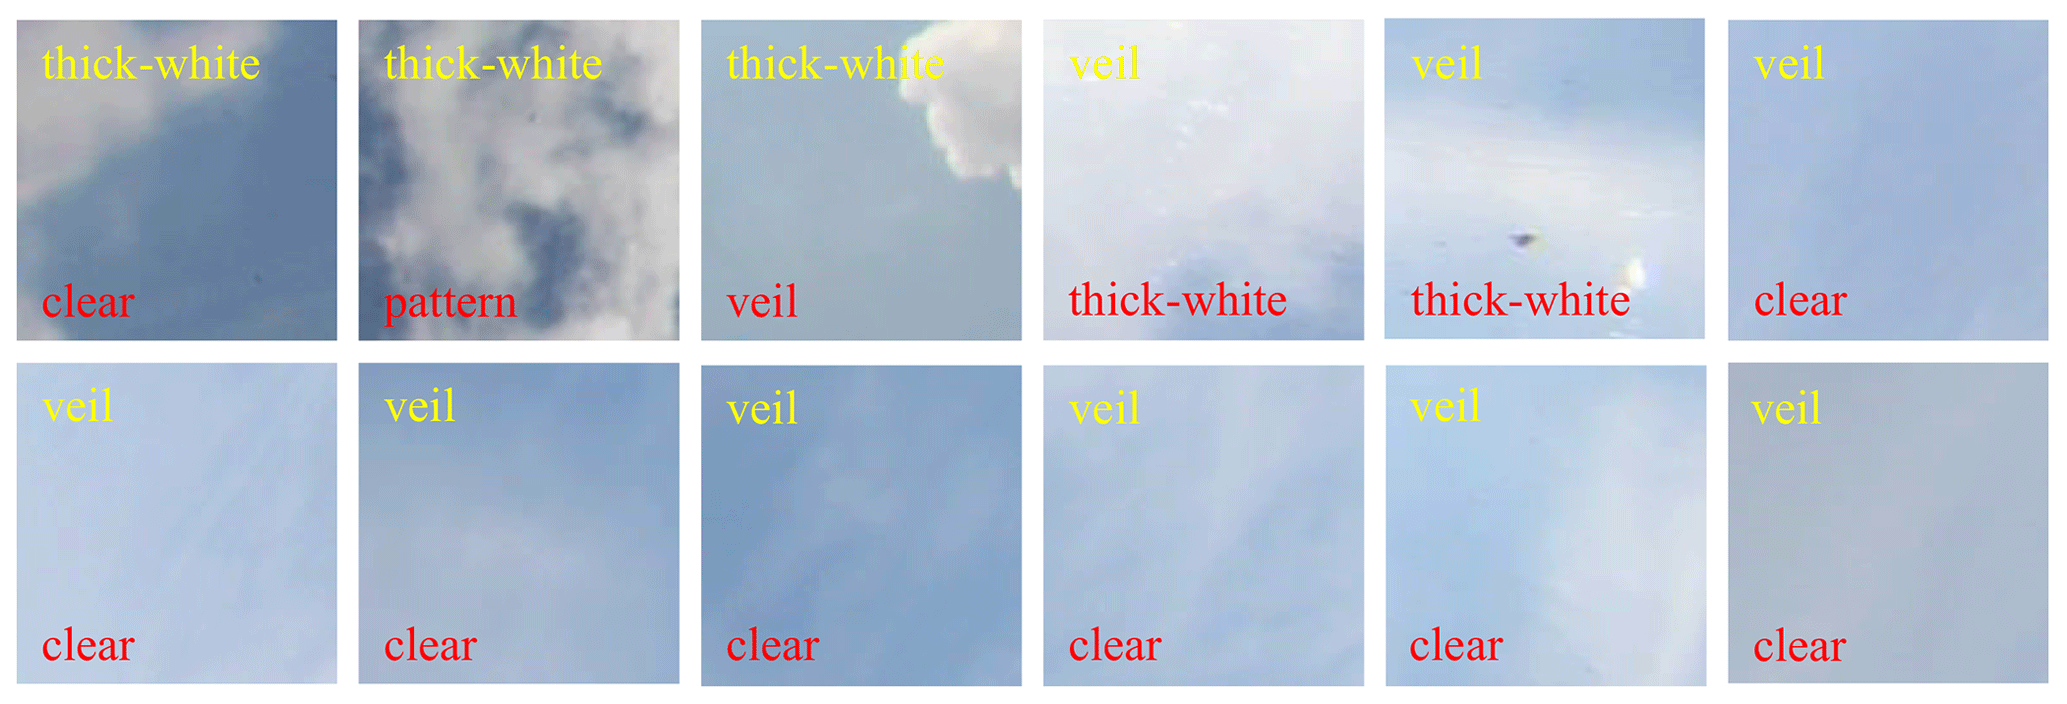
Figure 8Misclassified images of the SWIMCAT dataset. The yellow labels are the ground truth, and red labels are predicted cloud types. The veil clouds are prone to be misclassified as clear sky, since the veil clouds are thin and have high light transmittance; some veil clouds are misclassified as thick white cloud, when the camera lens is contaminated and the clouds are too thick. Besides, a small amount of thick white cloud is misclassified as clear sky, pattern clouds or veil clouds.
3.3 Comparison with state-of-the-art methods
Iterated cross validation is chosen as an effective scheme to verify the performance of the classifier. This strategy estimates the performance by randomly choosing a part of the samples for independent training and testing the model without these samples and repeating the procedure dozens of times (Beleites et al., 2013). In each experiment, we randomly select the same proportion (i.e., 1/10, 5/10, 9/10) of images for each category as the training set, and the remaining images are used as the test set. Each classification experiment is repeated 50 times to obtain the average accuracy as the final experimental result.
We compare the performance of our method with the best results published with the SWIMCAT dataset in Table 1. Notice that our algorithm utilizing RCovDs has a 2.58 % accuracy rate with the SWIMCAT dataset compared to other methods when the training sample accounts for 1/10 of the total data. And when the training sample accounts for 5/10 and 9/10, the proposed method is slightly higher than Luo's method and much higher than the other two methods. Figure 7 shows the confusion matrix of classification results with our proposed method on the SWIMCAT dataset, with 9/10 of the dataset as training set. The discrimination rates of clear sky, pattern clouds and thick dark clouds are perfect at 100 %, which demonstrates that these three types tend to be easily distinguished among all cloud types since they have the most significant features. Figure 8 shows two misclassified examples of the SWIMCAT dataset, where yellow labels are the ground truth and the red labels are the cloud types predicted by our method. Notice that the veil clouds are prone to be misclassified as clear sky, since the veil clouds are thin and have high light transmittance. Moreover, some veil clouds are misclassified as thick white cloud, when the camera lens is contaminated and the clouds are too thick. Besides, a small amount of thick white clouds is misclassified as clear sky, pattern clouds or veil clouds.

Figure 9The confusion matrix of the zenithal dataset classification results using the proposed method. Nine-tenths (9/10) of the dataset is used for training, and the rest are used for testing; the overall accuracy is 98.6 %.

Figure 10Misclassified images of the zenithal dataset. The yellow labels are the ground truth, and red labels are predicted cloud types. Waveform clouds and cirriform clouds are categorized as clear sky because the size of sky area is much larger than that of clouds, and these two cloud types are easily confused as they share similar local patterns.
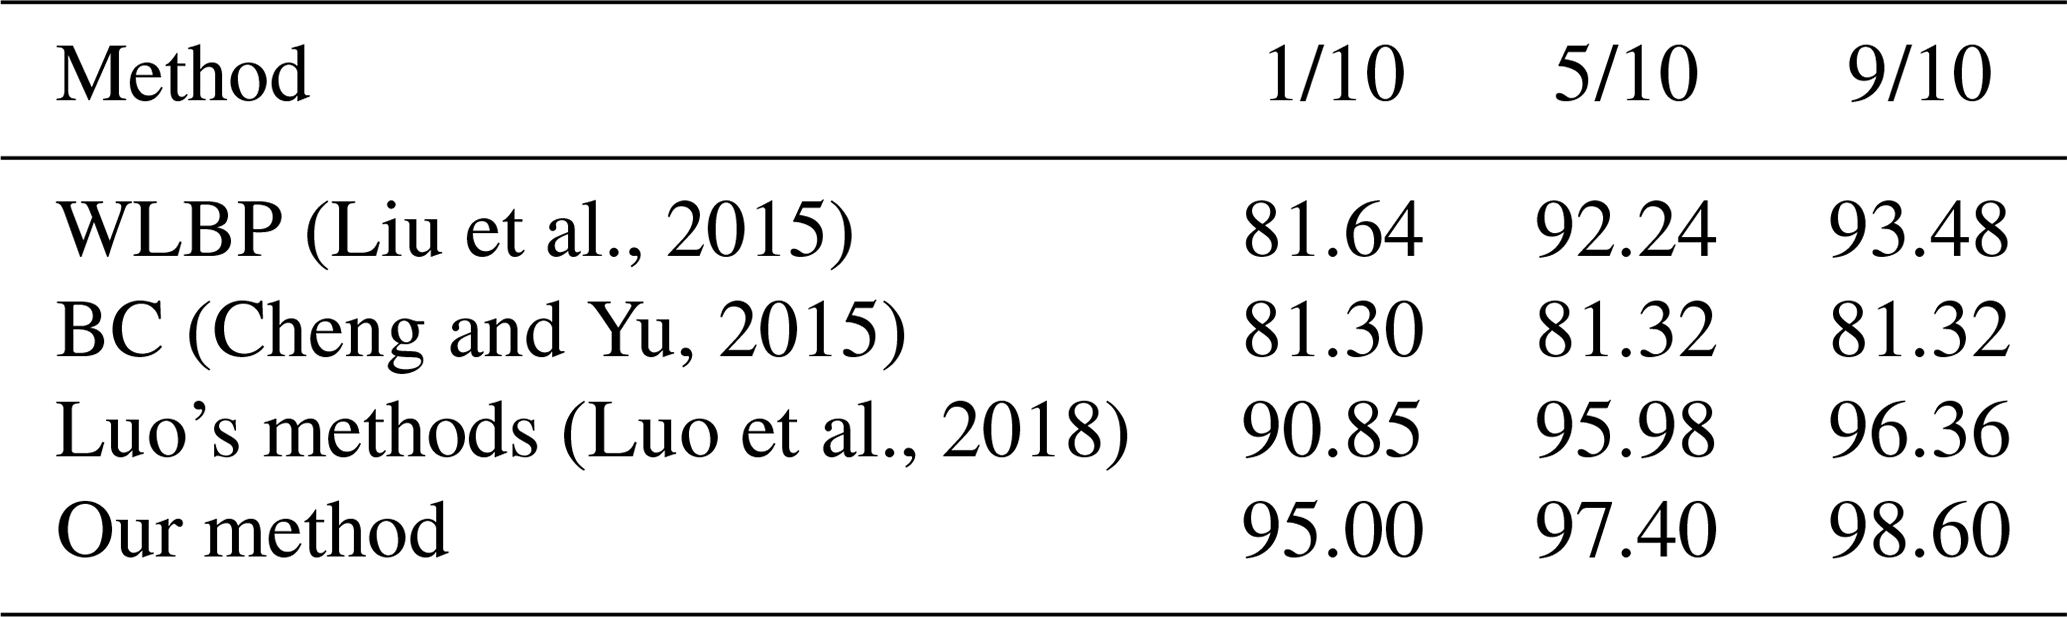
As for the zenithal dataset, Table 2 illustrates that the proposed method gains the highest overall accuracy compared with the other approaches. Figure 9 displays the confusion matrix of classification results with our method on the zenithal dataset, when 90 % of the dataset is used as the training set. The discrimination rates of clear sky, cumuliform clouds and stratiform clouds are up to 100 %. Only a small part of waveform clouds is misclassified as clear sky or cirriform clouds. In addition, some of the cirriform clouds are misclassified as clear sky or waveform clouds. Figure 10 illustrates the misclassified images of the zenithal dataset; waveform clouds and cirriform clouds are easy to be categorized as clear sky if the size of sky area is much larger than that of clouds. The reason why the waveform clouds and cirriform clouds are confused with each other is that they sometimes have extremely similar textures.
Table 1Classification accuracy (%) of the SWIMCAT dataset obtained by different methods.
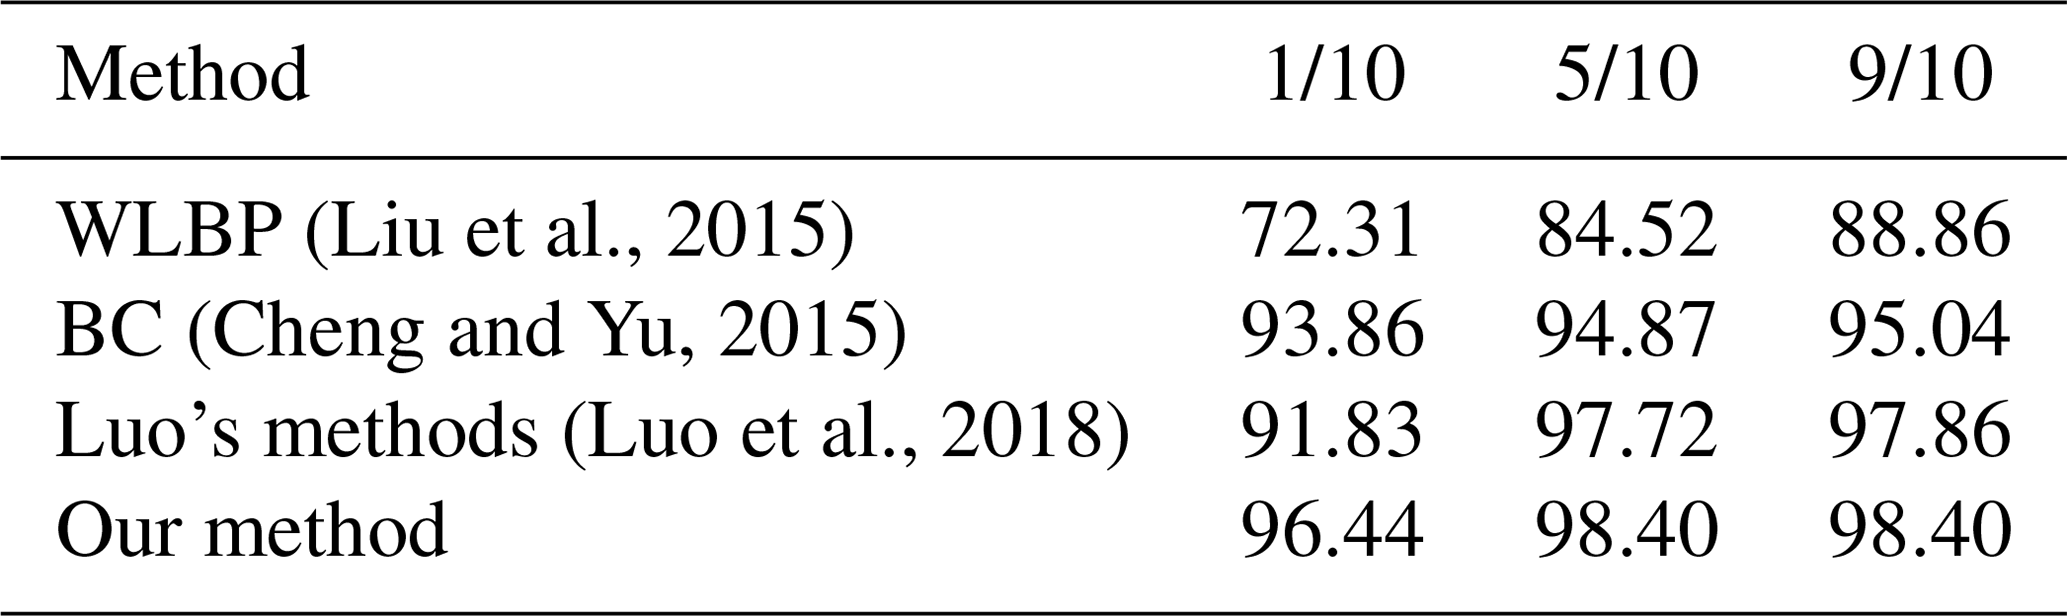
Table 2Classification accuracy (%) of the zenithal dataset obtained by different methods.
To tackle the challenge of automatic cloud type classification for ground-based cloud images in this paper, we present a new classification method with RCovDs as the local feature representation. RCovDs provide a simple way to fuse multiple pixel-level features, which improves the discriminative ability for cloud images. The image-level information is obtained by applying Riemannian BoF to encode RCovDs into a histogram. Finally, we apply the one-against-one multiclass SVM as the classifier.
It is noted that even tough we choose relatively simple image features to calculate RCovDs, the performance of the proposed method is still impressive. We conducted a parameter analysis experiment and figured out how block size w and codeword number k affect the accuracy of the proposed method. Classification experiments with different training set sizes demonstrate that our method is still efficient in the case of a small training set, which can greatly reduce the labor for labeling. In the third experiment, we compared our method to the other three cloud classification algorithms with different configurations of training and test sets. As the experimental results validate, the proposed method is competitive to state-of-the-art methods on both SWIMCAT and zenithal datasets.
In future work, features like LBP or GLCM could be gathered and mapped into Riemannian manifold, and the multiscale block strategy can be taken into consideration for a higher cloud type categorization accuracy. Other aspects, such as the complex sky conditions with various cloud types, should be deeply investigated to fulfill the application needs.
The code of the proposed method can be made available via email to tangyuzhu9293@163.com.
The SWIMCAT dataset used in this paper is available for download from https://doi.org/10.1109/ICIP.2015.7350833 (Dev et al., 2015), and the zenithal dataset can be made available via email to tangyuzhu9293@163.com.
YT performed the experiments and wrote the paper. PY analyzed the data and designed the experiments. ZZ conceived the method and reviewed the paper. JC, DP and XZ reviewed the paper and gave constructive suggestions.
The authors declare that they have no conflict of interest.
This research has been supported by the National Key Research and Development Program of China (grant no. 2016YFC1400903), the Key Special Project for Introduced Talents Team of Southern Marine Science and Engineering Guangdong Laboratory (Guangzhou) (grant no. GML2019ZD0602), and the National Natural Science Foundation of China (grant nos. 61473310, 41174164, 41376184, 40976109 and 41775027).
This paper was edited by Alexander Kokhanovsky and reviewed by three anonymous referees.
Beleites, C., Neugebauer, U., Bocklitz, T., Krafft, C., and Popp, J.: Sample size planning for classification models, Anal. Chim. Acta, 760C, 25–33, https://doi.org/10.1016/j.aca.2012.11.007, 2013.
Calbó, J. and Sabburg, J.: Feature Extraction from Whole-Sky Ground-Based Images for Cloud-Type Recognition, J. Atmos. Ocean. Technol., 25, 3–14, https://doi.org/10.1175/2007JTECHA959.1, 2008.
Carreira, J., Caseiro, R., Batista, J., and Sminchisescu, C.: Free-Form Region Description with Second-Order Pooling, IEEE T. Pattern Anal., 37, 1177–1189, https://doi.org/10.1109/TPAMI.2014.2361137, 2015.
Chang, C.-C. and Lin, C.-J.: LIBSVM: A library for support vector machines, ACM T. Intell. Syst. Technol., 2, 1–39, https://doi.org/10.1145/1961189.1961199, 2007.
Chen, T., Rossow, W. B., and Zhang, Y.: Radiative Effects of Cloud-Type Variations, J. Clim., 13, 264–286, https://doi.org/10.1175/1520-0442(2000)013<0264:reoctv>2.0.co;2, 2000.
Cheng, H.-Y. and Yu, C.-C.: Block-based cloud classification with statistical features and distribution of local texture features, Atmos. Meas. Tech., 8, 1173–1182, https://doi.org/10.5194/amt-8-1173-2015, 2015.
Dev, S., Savoy, F. M., Lee, Y. H., and Winkler, S.: WAHRSIS: A low-cost high-resolution whole sky imager with near-infrared capabilities, in: Proceedings of SPIE – The International Society for Optical Engineering 9071:90711L on SPIE Defense + Security, Baltimore, Maryland, USA, 5–9 May 2014, 90711L, https://doi.org/10.1117/12.2052982, 2014.
Dev, S., Lee, Y. H., and Winkler, S.: Categorization of cloud image patches using an improved texton-based approach, in: Proceedings of 2015 IEEE International Conference on Image Processing (ICIP), Québec City, Canada, 27–30 September, 422–426, https://doi.org/10.1109/ICIP.2015.7350833, 2015 (data available at: http://vintage.winklerbros.net/swimcat.html, last access: 23 January 2021).
Fang, L., He, N., Li, S., Plaza, A. J., and Plaza, J.: A New Spatial–Spectral Feature Extraction Method for Hyperspectral Images Using Local Covariance Matrix Representation, IEEE T. Geosci. Remote, 56, 3534–3546, https://doi.org/10.1109/TGRS.2018.2801387, 2018.
Faraki, M., Harandi, M. T., and Porikli, F.: More about VLAD: A leap from Euclidean to Riemannian manifolds, in: Proceedings of 2015 IEEE Conference on Computer Vision and Pattern Recognition, Boston, USA, 7–12 June 2015, 4951–4960, 2015a.
Faraki, M., Palhang, M., and Sanderson, C.: Log-Euclidean Bag of Words for Human Action Recognition, IET Comput. Vision, 9, 331–339, https://doi.org/10.1049/iet-cvi.2014.0018, 2015b.
Guo, K., Ishwar, P., and Konrad, J.: Action Recognition Using Sparse Representation on Covariance Manifolds of Optical Flow, in: Proceedings of the 7th IEEE International Conference on Advanced Video and Signal Based Surveillance, Boston, USA, 29 August–1 September 2010, 188–195, 2010.
Hartmann, D. L., Ockert-Bell, M. E., and Michelsen, M. L.: The Effect of Cloud Type on Earth's Energy Balance: Global Analysis, J. Clim., 5, 1281–1304, https://doi.org/10.1175/1520-0442(1992)005<1281:Teocto>2.0.Co;2, 1992.
Heinle, A., Macke, A., and Srivastav, A.: Automatic cloud classification of whole sky images, Atmos. Meas. Tech., 3, 557–567, https://doi.org/10.5194/amt-3-557-2010, 2010.
Hsu, C.-W. and Lin, C.-J.: A Comparison of Methods for Multiclass Support Vector Machines, IEEE T. Neur. Net. Lear., 13, 415–425, https://doi.org/10.1109/72.991427, 2002.
Huang, Z., Wang, R., Shan, S., Gool, L. V., and Chen, X.: Cross Euclidean-to-Riemannian Metric Learning with Application to Face Recognition from Video, IEEE T. Pattern Anal., 40, 2827–2840, https://doi.org/10.1109/TPAMI.2017.2776154, 2018.
Huertas, J. R.-B., Pozo, D., Aler, R., and Galván, I. M.: Genetic programming to extract features from the whole-sky camera for cloud type classification, in: Proceedings of the International Conference on Renewable Energies and Power Quality, Malaga, Spain, 4–6 April 2017, 132–136, 2017.
Jégou, H., Perronnin, F., Douze, M., Sánchez, J., Pérez, P., and Schmid, C.: Aggregating local image descriptors into compact codes, IEEE T. Pattern Anal., 34, 1704–1716, https://doi.org/10.1109/TPAMI.2011.235, 2012.
Joubert, A.: The astronomical image – Toward an objective analysis, Lastronomie, 93, 3–30, 1978.
Kazantzidis, A., Tzoumanikas, P., Bais, A., Fotopoulos, S., and Economou, G.: Cloud Detection and Classification with the Use of Whole-Sky Ground-Based Images, Atmos. Res., 113, 8-0-88, https://doi.org/10.1016/j.atmosres.2012.05.005, 2012.
Knerr, S., Personnaz, L., and Dreyfus, G.: Single-layer learning revisited: a stepwise procedure for building and training a neural network, in: Neurocomputing – Algorithms, Architectures and Applications, Springer, Berlin, Heidelberg, Germany, 41–50, 1990.
Kreßel, U. H.-G.: Pairwise classification and support vector machines, in: Advances in kernel methods: support vector learning, MIT Press, Cambridge, 255–268, 1999.
Krizhevsky, A., Sutskever, I., and Hinton, G. E.: ImageNet Classification with Deep Convolutional Neural Networks, in: Proceedings of the 25th International Conference on Neural Information Processing Systems - Volume 1, Lake Tahoe, Nevada, USA, 3–8 December 2012, 1097–1105, 2012.
Li, M., Liu, S., and Zhang, Z.: Deep tensor fusion network for multimodal ground-based cloud classification in weather station networks, Ad Hoc Networks, 96, 101991, https://doi.org/10.1016/j.adhoc.2019.101991, 2020.
Li, P., Wang, Q., Zuo, W., and Zhang, L.: Log-Euclidean Kernels for Sparse Representation and Dictionary Learning, in: Proceedings of 2013 IEEE International Conference on Computer Vision, Sydney, NSW, Australia, 1–8 December 2013, 1601–1608, 2013.
Liu, L., Sun, X., Chen, F., Zhao, S., and Gao, T.: Cloud Classification Based on Structure Features of Infrared Images, J. Atmos. Ocean. Technol., 28, 410–417, https://doi.org/10.1175/2010jtecha1385.1, 2011.
Liu, L., Sun, X., Gao, T., and Zhao, S.: Comparison of Cloud Properties from Ground-Based Infrared Cloud Measurement and Visual Observations, J. Atmos. Ocean. Technol., 30, 1171–1179, https://doi.org/10.1175/jtech-d-12-00157.1, 2013.
Liu, S., Duan, L., Zhang, Z., and Cao, X.: Hierarchical Multimodal Fusion for Ground-Based Cloud Classification in Weather Station Networks, IEEE Access, 7, 85688–85695, https://doi.org/10.1109/ACCESS.2019.2926092, 2019.
Liu, S. and Li, M.: Deep multimodal fusion for ground-based cloud classification in weather station networks, EURASIP J. Wirel. Comm., 2018, 48, https://doi.org/10.1186/s13638-018-1062-0, 2018.
Liu, S., Zhang, Z., and Mei, X.: Ground-based cloud classification using weighted local binary patterns, J. Appl. Remote Sens., 9, 095062, https://doi.org/10.1117/1.JRS.9.095062, 2015.
Liu, S., Li, M., Zhang, Z., Xiao, B., and Cao, X.: Multimodal Ground-Based Cloud Classification Using Joint Fusion Convolutional Neural Network, Remote Sens., 10, 822, https://doi.org/10.3390/rs10060822, 2018.
Luo, Q., Meng, Y., Liu, L., Zhao, X., and Zhou, Z.: Cloud classification of ground-based infrared images combining manifold and texture features, Atmos. Meas. Tech., 11, 5351–5361, https://doi.org/10.5194/amt-11-5351-2018, 2018.
Pang, Y., Yuan, Y., and Li, X.: Gabor-Based Region Covariance Matrices for Face Recognition, IEEE T. Circ. Syst. Vid., 18, 989–993, https://doi.org/10.1109/TCSVT.2008.924108, 2008.
Pennec, X.: Intrinsic Statistics on Riemannian Manifolds: Basic Tools for Geometric Measurements, J. Math. Imaging Vis., 25, 127–154, https://doi.org/10.1007/s10851-006-6228-4, 2006.
Pennec, X., Fillard, P., and Ayache, N.: A Riemannian Framework for Tensor Computing, Int. J. Comput. Vision, 66, 41–66, https://doi.org/10.1007/s11263-005-3222-z, 2006.
Ramanathan, V., Cess, R., Harrison, E. F., Minnis, P., Barkstrom, R. B., Ahmad, E., and Hartmann, D.: Cloud-radiative forcing and climate: Results from the Earth's radiation budget, Science, 243, 57–63, https://doi.org/10.1126/science.243.4887.57, 1989.
Shi, C., Wang, C., Wang, Y., and Xiao, B.: Deep Convolutional Activations-Based Features for Ground-Based Cloud Classification, IEEE Geosci. Remote S., 14, 816–820, https://doi.org/10.1109/LGRS.2017.2681658, 2017.
Simonyan, K. and Zisserman, A.: Very Deep Convolutional Networks for Large-Scale Image Recognition, in: Proceedings of the 3rd International Conference on Learning Representations, San Diego, CA, USA, 7–9 May 2015, 1–14, 2015.
Sra, S.: A new metric on the manifold of kernel matrices with application to matrix geometric means, in: Proceedings of the 25th International Conference on Neural Information Processing Systems – Volume 1, Lake Tahoe, Nevada, USA, 3–8 December 2012, 144–152, 2012.
Taravat, A., Frate, F. D., Cornaro, C., and Vergari, S.: Neural Networks and Support Vector Machine Algorithms for Automatic Cloud Classification of Whole-Sky Ground-Based Images, IEEE Geosci. Remote S., 12, 666–670, https://doi.org/10.1109/LGRS.2014.2356616, 2015.
Tuzel, O., Porikli, F., and Meer, P.: Region Covariance: A Fast Descriptor for Detection and Classification, in: Proceedings of the 9th European Conference on Computer Vision, Berlin, Heidelberg, 7–13 May 2006, 589–600, 2006.
Wang, R., Guo, H., Davis, L. S., and Dai, Q.: Covariance discriminative learning: A natural and efficient approach to image set classification, in: Proceedings of 2012 IEEE Conference on Computer Vision and Pattern Recognition, Providence, RI, USA, 16–21 June 2012, 2496–2503, 2012.
Wang, W., Wang, R., Huang, Z., Shan, S., and Chen, X.: Discriminant Analysis on Riemannian Manifold of Gaussian Distributions for Face Recognition with Image Sets, IEEE T. Image Process., 27, 151–163, https://doi.org/10.1109/TIP.2017.2746993, 2018.
Wang, Y., Shi, C., Wang, C., and Xiao, B.: Ground-based cloud classification by learning stable local binary patterns, Atmos. Res., 207, 74–89, https://doi.org/10.1016/j.atmosres.2018.02.023, 2018.
Xiao, Y., Cao, Z., Zhuo, W., Ye, L., and Zhu, L.: mCLOUD: A Multi-view Visual Feature Extraction Mechanism for Ground-based Cloud Image Categorization, J. Atmos. Ocean. Technol., 33, 789, https://doi.org/10.1175/JTECH-D-15-0015.1, 2016.
Ye, L., Cao, Z., and Xiao, Y.: DeepCloud: Ground-Based Cloud Image Categorization Using Deep Convolutional Features, IEEE T. Geosci. Remote S., 55, 5729–5740, https://doi.org/10.1109/TGRS.2017.2712809, 2017.
Zhang, Z., Li, D., and Liu, S.: Salient Dual Activations Aggregation for Ground-Based Cloud Classification in Weather Station Networks, IEEE Access, 6, 59173–59181, https://doi.org/10.1109/ACCESS.2018.2874994, 2018.
Zhuo, W., Cao, Z.-G., and Xiao, Y.: Cloud Classification of Ground-Based Images Using Texture–Structure Features, J. Atmos. Ocean. Technol., 31, 79–92, https://doi.org/10.1175/JTECH-D-13-00048.1, 2014.