the Creative Commons Attribution 4.0 License.
the Creative Commons Attribution 4.0 License.
 | 25 Feb 2022
Laboratory evaluation of the scattering matrix of ragweed, ash, birch and pine pollen towards pollen classification
Danaël Cholleton
Émilie Bialic
Antoine Dumas
Pascal Kaluzny
Patrick Rairoux
Pollen is nowadays recognized as one of the main atmospheric particles affecting public human health as well as the Earth's climate. In this context, an important issue concerns our ability to detect and differentiate among the existing pollen taxa. In this paper, the potential differences that may exist in light scattering by four of the most common pollen taxa, namely ragweed, birch, pine and ash, are analysed in the framework of the scattering matrix formalism at two wavelengths simultaneously (532 and 1064 nm). Interestingly, our laboratory experimental error bars are precise enough to show that these four pollen taxa, when embedded in ambient air, exhibit different spectral and polarimetric light-scattering characteristics, in the form of 10 scattering matrix elements (5 per wavelength), which allow each to be identified separately. To end with, a simpler light-scattering criterion is proposed for classification among the four considered pollen taxa by performing a principal component (PC) analysis, which still accounts for more than 99 % of the observed variance. We thus believe this work may open new insights for future atmospheric pollen detection.
- Article
(3414 KB) - Full-text XML
- BibTeX
- EndNote


Pollen is a biological aerosol impacting public health (Schaffner et al., 2020) and the Earth's climate (Li et al., 2013). The economical cost of pollen allergy on public health is impressive and was estimated to reach up to EUR 151 billion in Europe in 2014 (Lake et al., 2017). Moreover, this cost is expected to increase as the prevalence of allergies in the global population is increasing worldwide. Apart from this socio-economical cost, pollen may locally influence the Earth's radiative forcing, by increasing the IR downwelling flux (Spänkuch et al., 2000) and by acting as cloud-condensation nuclei (Pope, 2010). Indeed, Ambrosia pollen concentrations are expected to increase by 400 % in the following decades (Hamaoui-Laguel et al., 2015) for Ambrosia is an invasive plant. To our knowledge, no similar projection exists for other taxa. Based on observed evolutions over the 1994–2010 period, however, Zhang et al. (2015) reported a 42 % increase in the birch pollen concentration in the US. Due to climate change, which increases the global temperature and CO2 atmospheric concentrations, the length of the pollen season should be extended (Bielory et al., 2012). Moreover, the geographical repartition of pollen plants is also expected to be extended (Ziska et al., 2011). These health and climatic impacts mainly depend on the involved pollen species, which are numerous and induce various allergic reactions. To better quantify the impact of pollen on human health and climate, and as underscored by Crouzy et al. (2016), reliable measurements and forecasts are required as well as a reliable method for pollen identification and classification. At present, the most widely used methodology is that developed by Hirst (1952) 70 years ago, consisting of sampling then precipitating atmospheric pollen grains on an adhesive substrate prior to the microscopic observation of the deposited pollen grains. Though rather accurate, this historical methodology suffers from an overly long time duration, with characteristic times ranging from a few hours to a week, much higher than the characteristic time for the impact of pollen on human health. Another limitation of the historical methodology is that the pollen grains are counted one by one and identified by a scientist, which is time-consuming and may be operator dependent (Comtois et al., 1999). In this context, deep learning recently improved the identification of pollen grains through microscopy (Schaefer et al., 2021) by automating the procedure to differentiate among existing pollen taxa. As well as this, new methodologies based on interferometry, light-scattering or laser-induced fluorescence have been developed. In the latter, the fluorescence spectrum and its life-time have been used from the UV to the NIR spectral range to identify pollen (Pan et al., 2011; Kiselev et al., 2013). Likewise, image recognition on the scattering pattern of pollen grains have been investigated, as described by Šaulienė et al. (2019), and holographic images are also used (Giri et al., 2019; Sauvageat et al., 2020; Kemppinen et al., 2020) as an identification methodology. Finally, light scattering by pollen has been studied in the laboratory in aqueous solutions by Bickel and Stafford (1980) or when pollen are deposited on a substrate or a holder by Surbek et al. (2011), Iwai (2013), Raman et al. (2013) and Nouri et al. (2018). Concerning airborne pollen, Matsuda and Kawashima (2018) and Holler et al. (2016) studied forward and side scattering while polarization-dependent features of light scattering were first studied by our group by evaluating the scattering matrix of ragweed pollen in laboratory ambient air at near-backscattering angles (Cholleton et al., 2020). More recently, Gómez Martín et al. (2021) evaluated the scattering matrix of cypress pollen far from the backscattering angle. Also, the depolarization ratio of several pollen taxa has been studied in the field by Cao et al. (2010), Bohlmann et al. (2018) and Sicard et al. (2021) using lidar measurements. Nevertheless, light scattering by pollen embedded in ambient air still remains a complex topic, mostly due to the complexity in size and shape of the pollen taxa. In particular, it is not a priori granted that pollen differing in size and shape exhibit different light-scattering characteristics. Indeed, as underscored in Cholleton et al. (2020), no analytical light-scattering numerical simulation exists for such complex objects so that a remaining issue is to predict how these grains scatter light. Therefore, a controlled-laboratory experiment is needed to address light scattering by pollen with a precision allowing each pollen to be identified.
In this paper, to complement the above airborne pollen studies, the scattering matrix of several airborne pollen taxa is for the first time presented. We focus on ragweed, ash and birch pollen, which are allergenic and currently monitored in several countries in North America and in Europe. Pine pollen is also studied, as strong pine pollen events have been reported in the literature: Spänkuch et al. (2000) reported that a high pine pollen concentration increased the downwelling infrared flux by up to 8 times the monthly means. Our main selection criteria for choosing our pollen samples was therefore the geographical location (Europe, North America) and the allergenic character or/and the climatic impact of the pollen taxon. Still, other pollen taxa could be likewise studied by applying our new measurement technique, provided that the same accuracy is experimentally achieved. Extension of this work to all pollen taxa in a given geographical region is, however, beyond the scope of our contribution. The laboratory experiment is carried out at two wavelengths simultaneously (λVIS=532 nm and λIR=1064 nm) and provides five scattering matrix elements per pollen taxa and per wavelength. Interestingly, our experimental error bars are precise enough to reveal the existing differences in light scattering by these four pollen taxa, thus allowing each to be identified separately. Per pollen taxon, 10 scattering matrix elements are provided (5 per wavelength). Hence, compared with our previous contribution (Cholleton et al., 2020), three more pollen taxa are here studied (ash, birch and pine), which allows discussion of airborne pollen classification using polarization-resolved light scattering. As an output, a principal component analysis is applied to provide a simpler light-scattering criterion for classification among these four pollen taxa. The classification can then be visualized on a simple 2D-plane representation. The novelty of the paper is hence two-fold. Firstly, precise light-scattering characteristics of ragweed, ash, birch and pine are revealed in the form of 10 scattering matrix elements (5 per pollen sample per wavelength). Secondly, an analysis is proposed towards a pollen classification. The paper first presents the studied pollen samples and then details our laboratory methodology to precisely evaluate the scattering matrix of these pollen taxa. From that, the evaluation of their scattering matrix is presented, and a principal component analysis is proposed as an outlook to help classification of these pollen.
Figure 1 shows scanning electron microscopic images of the four studied pollen species, namely ragweed, ash, birch and pine. These microscopic images allow the size and the shape of these pollen to be characterized: each pollen taxon exhibits a very characteristic shape comprising grains presenting a quasi-monodisperse size distribution. The four considered species clearly differ in size and shape, from nearly spherical with a 20 µm volume equivalent diameter for ragweed to highly irregular shapes with a diameter larger than 60 µm for pine. Small-scale features exist on each pollen surface, such as granularity or apertures, which show the great complexity of these microscopic objects. These specific sizes and shapes are used for pollen recognition as extensively detailed in palynological databases (PalDat, 2021), as recalled in the introduction.
2.1 Ragweed
Ragweed or Ambrosia artemisiifolia pollen is amongst the most allergenic pollen in Europe and North America (Smith et al., 2013) with 15.8 million persons affected in Europe (Schaffner et al., 2020). Ragweed pollen induces particular allergic reactions twice as often as other pollen (Dahl et al., 1999) with an annual economic cost of EUR 7 billion in Europe (Schaffner et al., 2020). The ragweed season usually lasts from August to October, and this duration will get longer with expected increasing mean temperatures. Hence, ragweed pollen has been extensively studied in the literature (Smith et al., 2013; Hamaoui-Laguel et al., 2015; Zink et al., 2017), and extensive efforts have been made for the observations and forecasts of its concentration (Prank et al., 2013). Ragweed pollen grains exhibit a characteristic shape, that bears some resemblance with coronavirus virions (Petrov, 2020), are nearly but not quite spherical, with a mean volume-equivalent diameter of 21 µm. Its membrane exhibits three apertures (2 µm long), regular spikes (echinus) of about 1 µm length and a perforate structure, i.e. covered with holes of about 100 nm diameter.
2.2 Ash
We here consider ash (Fraxinus americana) pollen, which is a relevant source of allergenic reactions in North America. In Europe, ash pollen has been underestimated for a long time as its bloom season overlaps with that of birch (Imhof et al., 2014). Hence, Fraxinus excelsior, highly present in Europe, may also be considered as an outlook of this work, provided that the same experimental accuracy is achieved. Moreover, it presents a high cross-reactivity from allergens from other plant species such as birch pollen, as underscored by Niederberger et al. (2002). Its blooming season lasts from March to May. Ash pollen grains have an irregular shape, with a reticulate exine, i.e. ornamental elements arranged as a network of ridges with gaps of the micron scale, and 3–4 colpi, i.e. thin elongated apertures regularly distributed along its equatorial region. Its volume equivalent diameter is about 31 µm.
2.3 Birch
Alongside with ragweed, birch (Betula pendula) pollen is one of the most impactful in central and northern Europe (Biedermann et al., 2019). It also exhibits a cross-reactivity with other allergens. Depending on its location, the birch pollen season starts from March and lasts until late June. Birch pollen grains are irregularly shaped, with sunken interpectoral areas when dried. Their mean volume equivalent diameter is about 28 to 29 µm. They present 3 protruding pores, i.e. three 2 µm holes on its polar view. Birch pollen was one of the first to be integrated into global pollen forecasts (Siljamo et al., 2013), using dispersion models.
2.4 Pine
In contrast to the previous taxa, pine (Pinus strobus) pollen rarely causes allergies. Moreover, this pollen has been studied by optical diffraction tomography (Kim et al., 2018) to highlight its structure and morphological features and evaluate its refractive index. At last Sicard et al. (2021) recently studied its vertical distribution in the atmosphere using lidar-derived profiles. As shown Fig. 1d, pine pollen is the largest of the studied samples with a mean diameter of 69 µm. Its shape largely differs from that of other pollen, as two sacci, i.e. two large air-filled bladders, are attached to the centre part (Schwendemann et al., 2007). The refractive index of pine at 532 nm has been estimated to be between 1.5 and 1.54 (Kim et al., 2018), while its imaginary part remains undocumented.
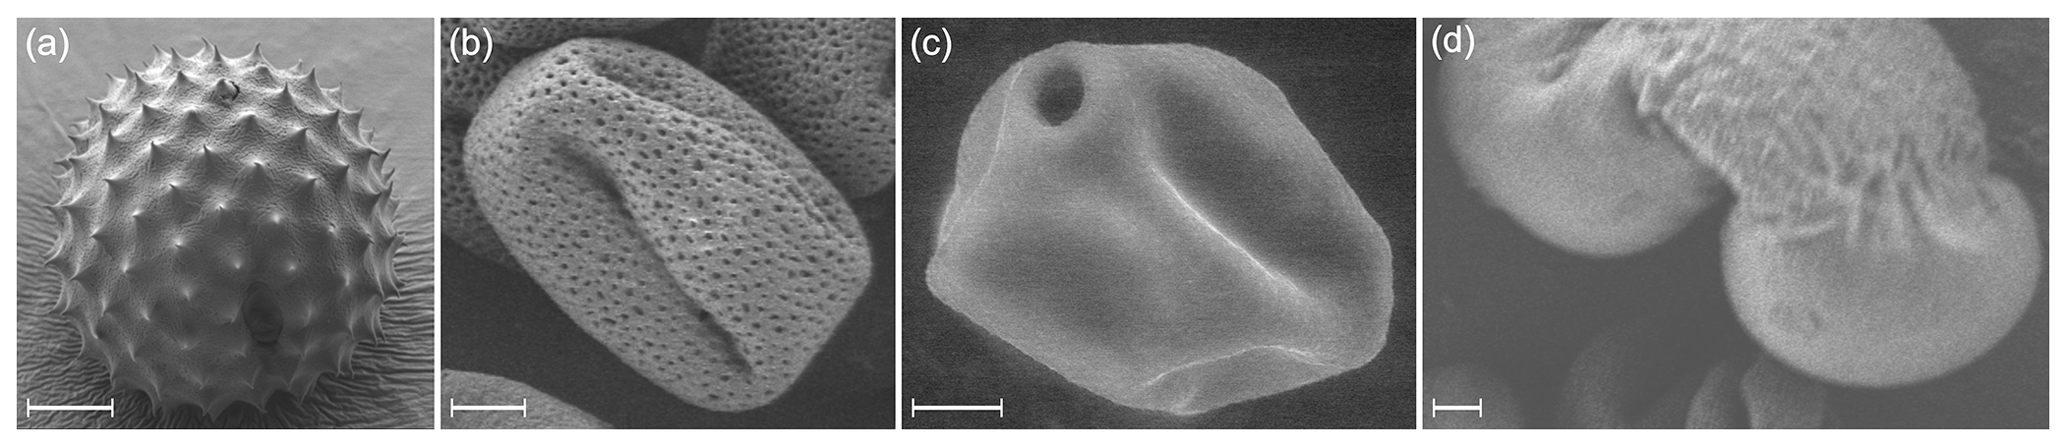
Figure 1Scanning electron microscopy (SEM) images of the studied pollen taken at the Institute of Light and Matter: (a) ragweed (Ambrosia artemisiifolia), (b) ash (Fraxinus americana), (c) birch (Betula pendula), (d) pine (Pinus strobus). The scale bar is 5 µm on all pictures. Pollen grains were suspended in ambient air and deposited on an adhesive substrate for SEM observations.
2.5 Pollen suspension
The studied pollen samples were supplied by Stallergenes Greer. Dry pollen powder has been suspended in the light-scattering volume using a solid aerosol generator supplied with dried compressed air (RH <10 %). The size distribution and concentration of the generated airborne ragweed pollen grains was measured using an Aerodynamic Particle Sizer (APS). As a consistency check, the retrieved ragweed pollen size distribution was found to be in agreement with the size specified by the supplier and also with above SEM observations issued from the state-of-the-art literature (PalDat, 2021). These commercial pollen grains may differ from atmospheric pollen grains. However, our Fig. 1 microscopic images did not exhibit differences in size or shape compared with fresher pollens. Otherwise, the most recent literature does not report any changes in the pollen light-scattering properties over a 10 d period (Miki and Kawashima, 2021).
3.1 Light scattering by pollen
We consider elastic light scattering by an ensemble of pollen grains suspended in ambient air with a polarized electromagnetic incident radiation of wavelength λ. Because the pollen samples are non-spherical (see Fig. 1), the polarization state of the scattered radiation may differ from that of the incident radiation. To describe the polarization states of the incident and scattered waves, the Stokes vector formalism (Mishchenko et al., 2002) is applied. The polarization state of the incident and scattered radiation is then described by a Stokes vector where I, Q, U and V respectively relate to the total intensity, the linear degree of polarization in the scattering plane at 45∘ from it and the degree of circular polarization. In the far-field single-scattering approximation and assuming random orientation, we learn from light-scattering textbooks (Mishchenko et al., 2002) that the incident and scattered Stokes vectors S0 and S are related by the so-called scattering matrix:
where the scattering matrix elements have been normalized with respect to the scattering phase function so that at most equals unity. and characterize how a linear polarization state is preserved during light scattering by the considered pollen, while shows whether circular polarization is preserved during light scattering by the pollen grains. Off-diagonal element quantifies the amount of non-polarized light after scattering by pollen, while the other off-diagonal element traduces the ability of pollen to convert a linearly polarized radiation to a circular polarization state through light scattering. The scattering matrix elements describe how the polarization state of the incident radiation is modified during light scattering by the studied pollen grains. These matrix elements hence depend on the shape of the pollen grains which we here investigate.
3.2 Laboratory experimental set-up for pollen light scattering
The specific size and shape of each pollen taxon is addressed by considering the Fig. 2 laboratory experiment, which has proven efficiency for ragweed pollen detection (Cholleton et al., 2020). We here recall its main characteristics for the sake of clarity before discussing its applicability to the detection of other pollen taxa in the next paragraph. This laboratory polarimeter operates at the near-backscattering angle and at two wavelengths λVIS=532 nm and λIR=1064 nm simultaneously. A reflecting polarizing beam-splitter cube (PBC) is used so that it is the s component of the scattered radiation that is measured by the photodetector. This experimental set-up has been validated on spherical particles (Cholleton et al., 2020) for which the scattering matrix can be analytically computed by applying the Mie theory, by measuring the corresponding size distribution with particle optical sizers.

Figure 2Scheme of the laboratory experimental set-up of the (λVIS, λIR) polarimeter from Cholleton et al. (2020). The 177.5∘ scattering angle has been exaggerated to ease the reading. k0(λ) and k(λ) respectively stand for the incident and scattered wave vectors at wavelength λ. Pollen grains are embedded in laboratory ambient air as described in Sect. 2.5. ψ is the angle between the fast axis of the quarter-wave plate (QWP) and the scattering plane.
Following Fig. 2, the detected pollen scattered intensity can be obtained by considering the successive Mueller matrices encountered by the incident radiation. After a few calculations (Cholleton et al., 2020), we get at wavelength λ:
where subscript i stands for incident polarization state while is a proportionality constant that accounts for the incident laser power and the electro-optics efficiency. The pollen scattering matrix elements are retrieved from Eq. (2) by adjusting the detected scattered intensity as a function of the angle ψ to retrieve the , , and coefficients, which only depend on the scattering matrix elements. To improve accuracy, the polarization state of the scattered radiation is analysed for several incident polarization states, obtained by rotating an analyser (QWP), whose position is labelled by the angle ψ. To retrieve all the pollen matrix elements, the polarization state of the scattered radiation is analysed for three successive incident polarization states, namely (p), (45+) and (RC). To give an example, a (RC)-polarized incident radiation allows , and to be retrieved, as established in Cholleton et al. (2020). Adding a (45+)-polarized incident radiation allows to be evaluated in addition. Finally, is retrieved from a (p)-polarized incident radiation. In summary, the following set of equations, established in Cholleton et al. (2020), is applied to retrieve the pollen scattering matrix elements from adjusted coefficients , , and :
3.3 Applicability of this set-up to the detection of other pollen taxa
To study the sensitivity of our methodology to other pollen taxa, three different taxa are considered, characterized by the following set of scattering matrix elements:
-
A spherical pollen called Taxon 1 has normalized scattering matrix elements . Taxon 1 is to our knowledge an hypothetical pollen since pollen are non-spherical (Hesse, 2009). It is here, however, considered for several pollen exhibits an overall spherical shape. Also, the spherical shape is the ideal shape to be detected and can hence be considered as a reference case for polarimetric studies.
-
A non-spherical pollen called Taxon 2 has scattering matrix elements . As can be seen in Sect. 4, dedicated to our laboratory results, these scattering matrix elements are that of ragweed pollen at wavelength λIR.
-
another non-spherical pollen called Taxon 3 exhibits close but different scattering matrix elements compared with Taxon 2, namely[]. As can be seen in Sect. 4, dedicated to our laboratory results, these scattering matrix elements are that of pine pollen at wavelength λIR.
To illustrate these ideas, we plotted in Fig. 3 the variation of as a function of the ψ angle of the analyser at a given wavelength λ, for Taxon 1, 2 and 3 at the three successive incident polarization states (p), (45+) and (RC). Interestingly, each pollen taxon is associated with a specific light-scattering curve, showing the sensitivity of our methodology. From Taxon 1 to 3, the (p)-polarization curve exhibits varying minima to be related to variations in the -scattering element. The same conclusions can be drawn with the curve minima, which are determined by the scattering matrix element. If the curve is π-periodic whatever the considered taxon, its extrema, which depend on , and , are also taxon-dependent. As a result, the proposed methodology can potentially be used to differentiate pollen exhibiting different scattering matrix elements. For that, however, the scattering matrix elements should be retrieved with precision, as discussed below.

Figure 3Numerical simulation of the detected scattered light intensity as a function of the ψ angle of the analyser for the three considered case studies of pollen taxa: Taxon 1 (dotted lines), Taxon 2 (solid lines) and Taxon 3 (dashed lines) at the three successive incident polarization states and (RC) from left to right. Each curve is normalized to unity (i.e. ) so that any change in the scattered light intensity is due to polarimetric considerations.
3.4 Scattering matrix elements retrieval accuracy
Taxon 2 can then be distinguished from Taxon 3 using polarimetric light scattering if their corresponding Fig. 3 curves can be distinguished within our experimental error bars. To give an example of our ability to distinguish two pollen taxa, to a 1 % variation in the scattering matrix element corresponds a 1 % variation in the detected scattered light intensity. Because Taxon 2 and 3 exhibit values differing by almost 50 %, the required precision can be reached. Moreover, in our experiment, the evaluation of the , , and coefficients, and hence of the scattering matrix elements (see Eq. 2), relies on a large number of measurement data points (180 points per fitted curve). Special care has indeed been taken to specify our experimental error bars on the retrieved scattering matrix elements by considering both statistical and systematic errors. Polarization cross-talks in the analyser have been minimized by aligning a second polarizing beam-splitter cube in the detector. Wavelength cross-talks are also fully negligible, which is key for revealing the spectral dependence of the scattering matrix elements, because laser-line selective interference filters are used in the light detector. Also, the incident polarization state may slightly differ from the (p), (45+) and (RC) polarization states. To quantify this uncertainty, we considered the following incident Stokes vector , where 2χ and 2ω represent deviations from the (p) incident polarization state (a similar discussion is drawn for (45+) and (RC) polarization states). At first order in 2χ and 2ω, the uncertainties of the scattering matrix elements are , 2, while the matrix element remains unperturbed. As elements at most equal unity, the uncertainties can be majored by their upper limit 2χ or 2ω, depending on the considered scattering matrix element. From a practical point of view, 2χ is evaluated by recording the scattered light intensity by complementary incident polarization states (45+) and (45−). Our calculations indeed show that . As well as this, 2ω is evaluated by recording the scattering curve corresponding to incident polarization states (RC) and (LC) since . Finally, we used the outputs of a paper by Mishchenko et al. (2007) to check that the single-scattering approximation was rather safe in our experiment, where k1〈d〉≫30 (k1 is the wave vector in the surrounding medium and 〈d〉 is the average inter-pollen distance), while particle volume concentration remained lower than 1 %, hence being considering a tenuous medium. Statistical errors due to potential fluctuations in the grain number concentration in the scattering volume are also accounted for by normalizing the detected intensity by that of a photodetector placed at a 170∘ scattering angle, which depends on the pollen grain number concentration. Indeed, the scattered light intensity at a 170∘ scattering angle is proportional to the pollen grain concentration as this detector is polarization insensitive. As a result, statistical errors due to potential fluctuations in the pollen grain number concentration are removed by considering the ratio of the two intensities at these two scattering angles. As a conclusion, from the measurements of the scattered intensity at wavelength λVIS and λIR, the method detailed above allows the precise retrieval of the scattering matrix with error bars that are sufficiently low to distinguish pollen taxa through polarimetric light scattering, as detailed in the Sect. 4 below, dedicated to our laboratory results.
4.1 Detected scattered light intensity by ragweed, ash, birch and pine
Figure 4 displays the detected scattered light intensity of our four pollen samples (ragweed, ash, birch, pine) at wavelengths λVIS (in green) and λIR (in red) and at the three incident polarization states (p), (45+) and (RC) for a complete rotation of the analyser labelled by the angle ψ. The uncertainty of the incident polarization state has been evaluated by applying the methodology presented in Sect. 3.4, thus comparing (45+) and (RC) polarization states to their complementary states (45−) and (LC): at both wavelengths, both 2χ and 2ω equals at most 0.01. To minimize statistical errors, each data point results from an average of four measurements, each composed of a sequence of 100 laser shots. In Fig. 4, the error bar affecting each data point is then the standard deviation of these four sequences. Moreover, the reproducibility of the observed minima during a full rotation of the analyser indicates that the shape of each considered pollen sample remained constant during the acquisition. Let us first discuss the scattered light intensity by ragweed pollen. The (p)-polarization curve exhibits non-zero minima, showing that ragweed pollen grains are non-spherical, in agreement with the SEM observation. In the (45+)-polarization curve, the two successive local minima are not equal at wavelength λIR (see, for example, the first and second minima of ragweed pollen at wavelength λIR), which proves that is not null, as opposed to wavelength λVIS where, within our error bars, no significant differences occur in the successive local minima for ragweed for example. Moreover, the light-scattering curves differ for the three other pollen taxa (ash, birch, pine). For instance, pine pollen, whose successive local minima are identical in the (45+)-polarization curve, exhibits a near-zero value at both wavelengths as detailed below in Sect. 4.2. Likewise, the (RC) polarization curve of the ash pollen is nearly constant, which relates to a value of the matrix element close to zero.
4.2 Retrieved scattering matrix elements for ragweed, ash, birch and pine
The Fig. 4 experimental data points are adjusted with Eq. (2) to retrieve the coefficients to (see Fig. 4 fitted curves). The agreement between our measurement data points and the Eq. (2) adjustment is notable. Therefore, we can apply the scattering matrix formalism to evaluate at each wavelength by applying Eq. (3), as presented in Fig. 5 with detailed numerical values given in Table 1 (wavelength λVIS) and in Table 2 (wavelength λIR). We first focus on the comparison of retrieved between the four pollen samples before discussing the spectroscopic variations of these matrix elements. Because our four pollen samples are non-spherical, all the retrieved values differ from unity. More interestingly, within our experimental error bars, each pollen exhibits a different matrix element. Likewise, within our error bars, other diagonal matrix elements and , which are also not null and differ from one another, specifically describe light scattering by each pollen taxon. The element is clearly higher for ragweed and birch, compared with ash and pine. Hence, among our set of four pollen taxa, a set of elements can be unequivocally linked to a single pollen taxon. Off-diagonal elements and are nearly equal to zero within our error bars. Regarding wavelength λIR, the same conclusions can be drawn with , and ; i.e. this set of matrix elements unequivocally relates to a single pollen taxon. Interestingly, while remains near zero, is not null for ragweed, ash and birch pollen. As underlined by Bickel and Stafford (1980), this matrix element may be relevant for the study of pollen particles. The diagonal elements are generally larger at wavelength λIR, which indirectly means they are easier to evaluate with a higher precision. The considered pollen taxa exhibit a rather pronounced spectral variation, except for birch, for which the matrix elements remain constant within error bars. The spectral dependence, however, remains complex to interpret, as the scattering matrix elements of pollen depend on the complex refractive index of pollen grains and the literature on pollen refractive indices is rather sparse, with, to our knowledge, no evaluation of their imaginary part and no spectral measurement at wavelengths λVIS and λIR. The fact that the pine pollen is not symmetrical along its axis and has a distinct size, texture and shape is indeed responsible for the observed differences in the retrieved scattering matrix elements for pine compared with other taxa. Our spectral and polarimetric light-scattering methodology is indeed sensitive to the size and to the shape of each pollen taxon, and the achieved precision in the scattering matrix retrieval allows for these specific size and shape features to be accounted for, which allows each pollen taxon to be identified separately.
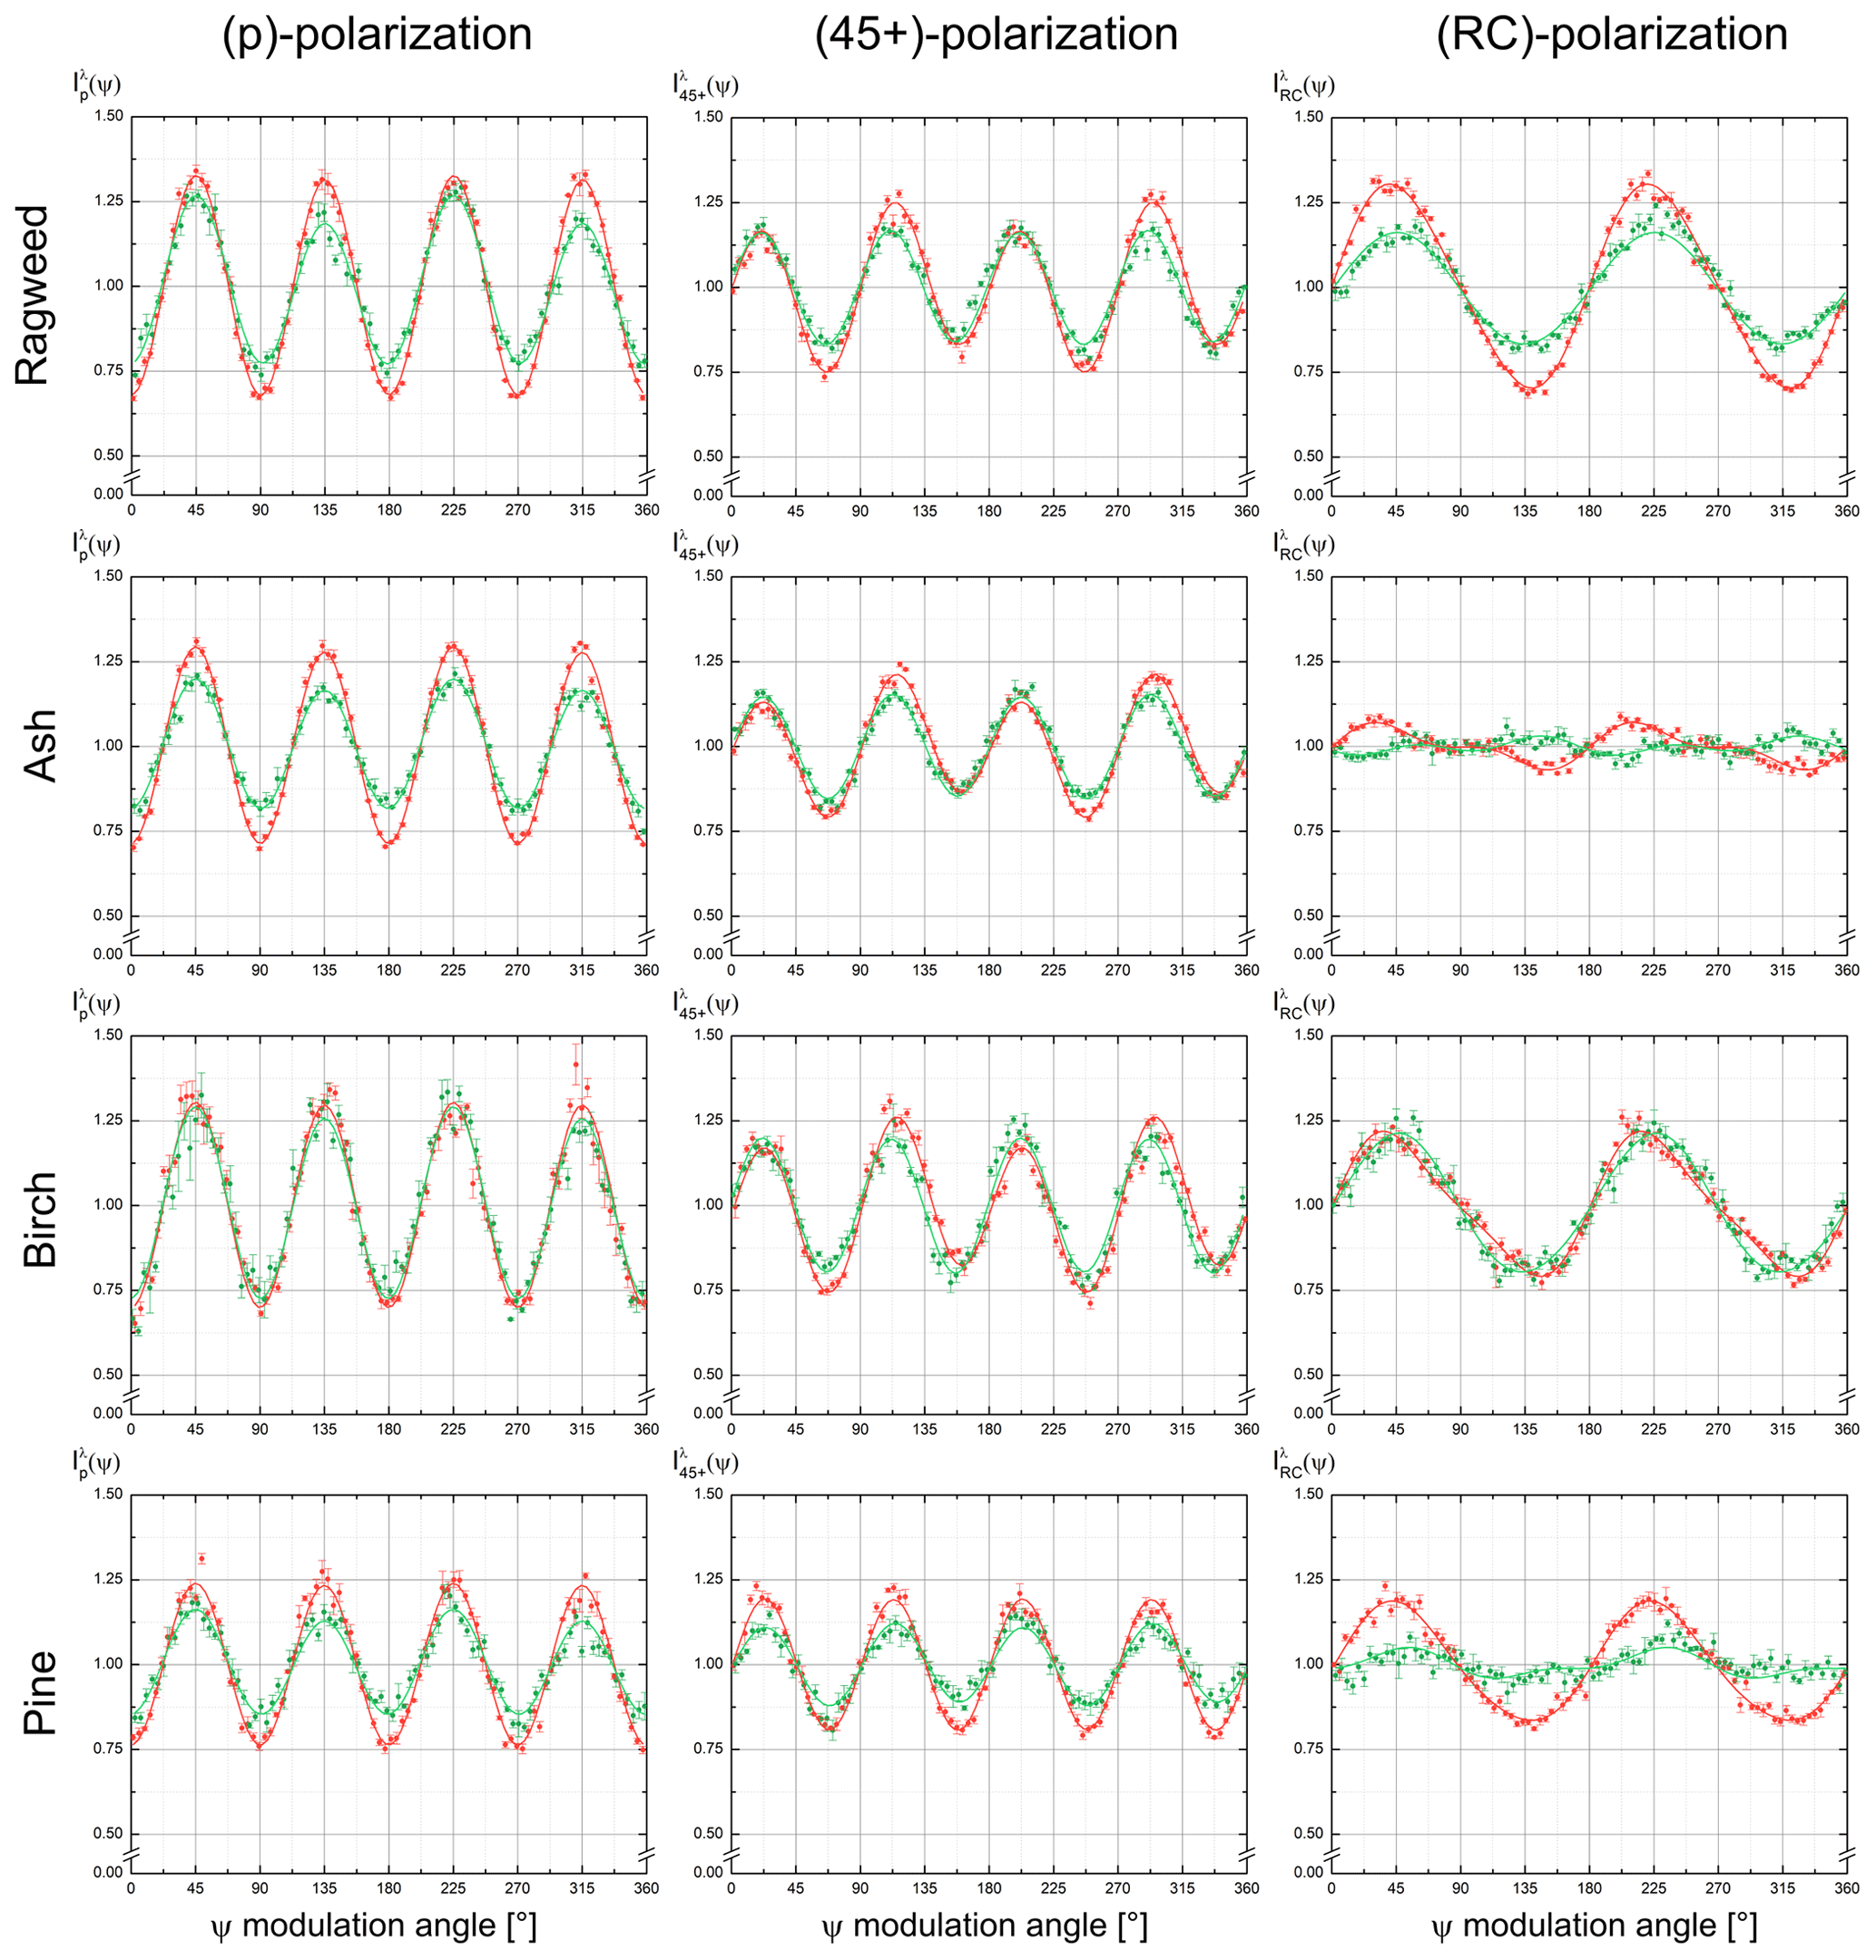
Figure 4Detected scattered light intensity by ragweed, ash, birch and pine pollen as a function of the of the ψ angle of the analyser for the three successive incident polarization states (p), (45+) and (RC) at wavelength λVIS (in green) and wavelength λIR (in red). The detected light intensity is normalized so that , as detailed in Sect. 3.3. A break has been inserted to ease the reading. Each measurement data point is obtained by repeating 400 lasers shots, and the uncertainty is calculated by following the methodology described in Sect. 3.4.
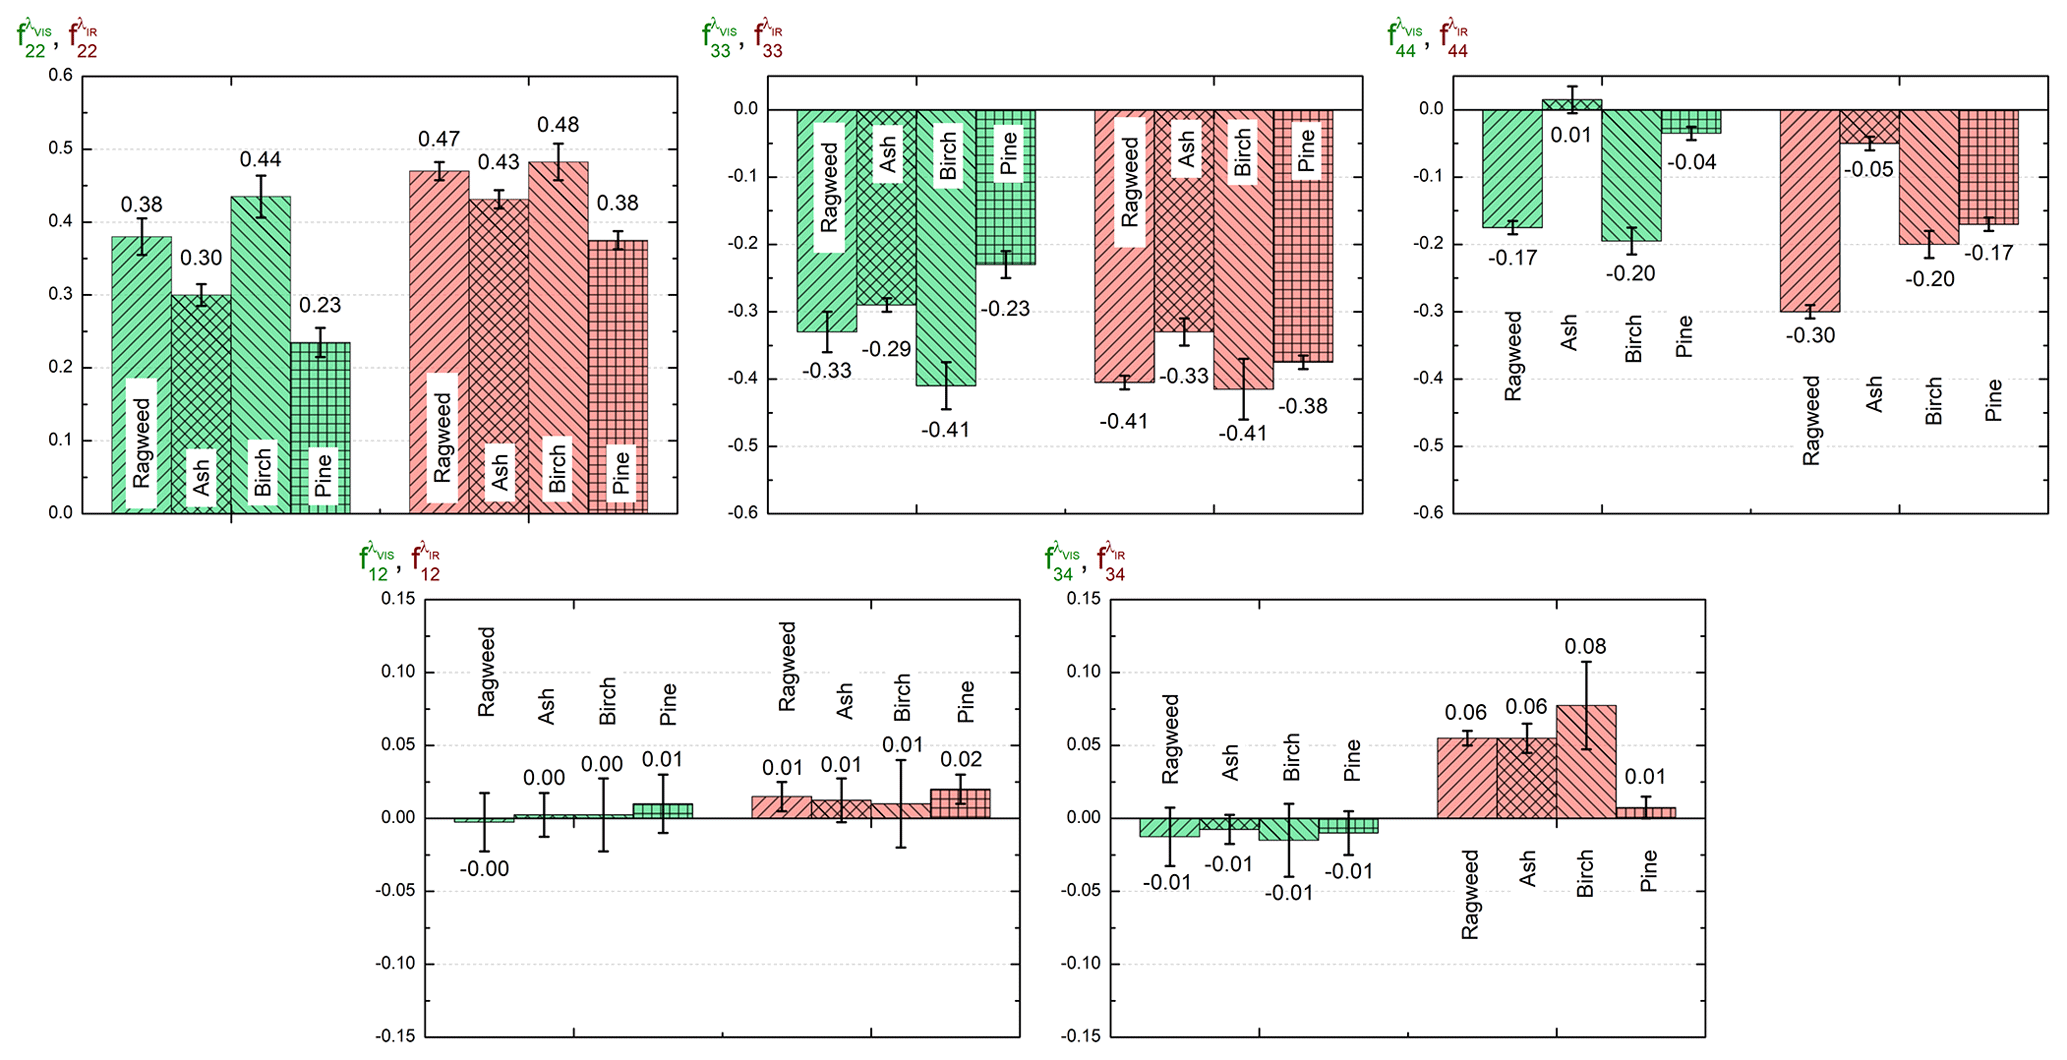
Figure 5Retrieved scattering matrix elements of ragweed, ash, birch and pine at a 177.5∘ scattering angle at wavelengths λVIS and λIR, with corresponding uncertainties evaluated by applying the methodology presented in Sect. 3. For each pollen taxon, the evaluation of the scattering matrix has been repeated with different samples: each evaluated scattering matrix lies within presented error bars.
Table 1Retrieved scattering matrix elements of ragweed, ash, birch and pine at a 177.5∘ scattering angle at wavelength λVIS.
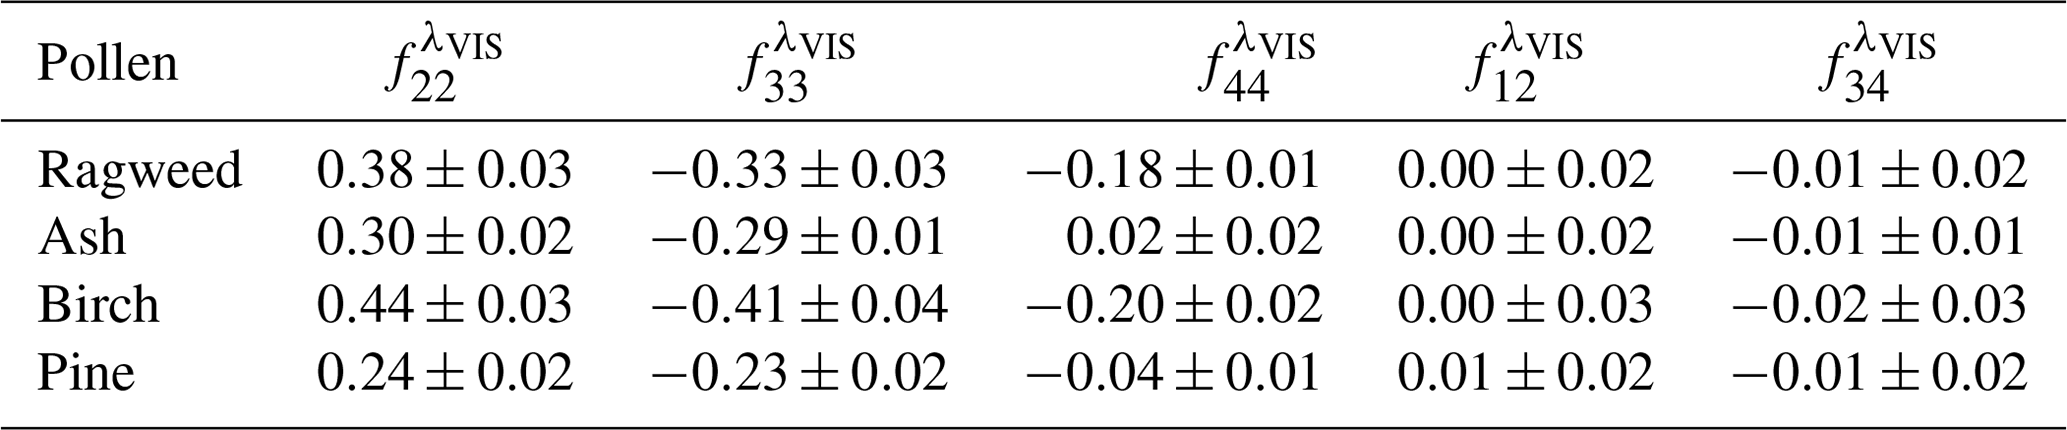
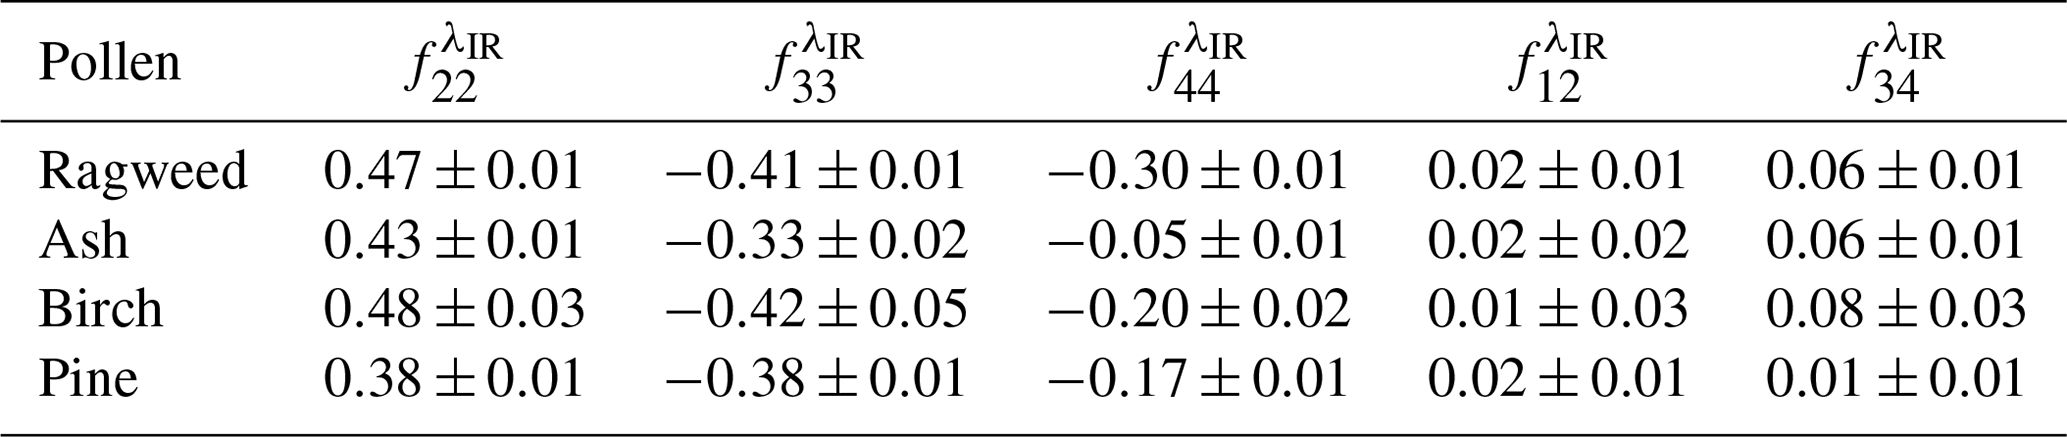
Table 2Retrieved scattering matrix elements of ragweed, ash, birch and pine at a 177.5∘ scattering angle at wavelength λIR.
4.3 Towards pollen identification using principal component analysis
As explained above, each of the four considered pollen exhibits its own set of 10 scattering elements (5 per wavelength), which allow them to be identified among the considered set of four pollen taxa. Pine can, however, be unequivocally identified using only, as it is the only taxon for which is null. Also, may allow pine to be distinguished from other taxa, however not ragweed from birch. Likewise, within our experimental uncertainties, and do not allow differentiation among the four considered pollen taxa. Consequently, for pollen identification through polarized light scattering, the complete set of scattering matrix elements must be generally taken into account, giving rise to the 40 elements given in Tables 1 and 2. However, it remains challenging and at least non-intuitive to identify a pollen taxon based on this set of 40 intricate scattering matrix elements. In the literature, decision trees have been applied for classification, but overlaps exist due to experimental uncertainties, which limit the application of this classification methodology. Rather, we here propose to reduce the dimensionality of our system to a 2D-representation plane while taking into account experimental uncertainties. Therefore, the goal of this paragraph is to provide a simpler light-scattering criterion for classifying among the four considered pollen taxa, based on a 2D-representation plane. To reduce the dimension of our four-pollen-taxa dataset, a principal component analysis (PCA) has been performed. A linear discriminant analysis (LDA) may appear to be more suited for labelled classes. However, as published by Martinez and Kak (2001), PCA might outperform LDA when the number of samples per class is small, and in our methodology, each class (pollen taxon) is represented by a single point as being representative of the distinct size and shape of each pollen taxon. Applying a LDA would require having more than one single point per class. PCA is a statistical method for dimension reduction and feature extraction (Jolliffe, 2005). There, each pollen is described by its two principal components, hereafter called PC1 and PC2, which form an orthogonal basis of two uncorrelated components. Each measured scattering pattern can then be defined in terms of a combination of the PCs. Interestingly, besides the advantage of a dimensionality reduction, the PCA maximizes the variance in the (PC1, PC2) representation of the dataset. For that, we considered the explained variance, which measures the proportion to which a mathematical model accounts for the dispersion of a given dataset. In our case, a threshold of 99 % explained variance is reached by taking into account only two principal components. As a result, Fig. 6 presents the projection of each pollen taxon in the new (PC1, PC2)-orthogonal basis. The newly obtained coordinates PC1 and PC2 of each pollen account for our 10 retrieved scattering matrix elements (5 per wavelength per pollen sample), and the corresponding error bars in Fig. 6 have been evaluated by propagating the uncertainties of each . The explained variance of PC1 is 78.8 %, while that of PC2 reaches 20.3 % so that the dimension reduction still accounts for 99.1 % of our experimental variance. Based on Fig. 6, a classification criterion among our four-pollen-taxa dataset is to assign to each pollen taxon the area delimited by its error bar. To each measured scattering pattern (i.e. each set of 10 evaluated matrix elements) there is a corresponding single point in the (PC1, PC2) basis, which allows the pollen to be identified if the evaluated point lies in one of the Fig. 6 coloured areas, which provides a simple criterion for classifying among the four considered pollen taxa, based on a 2D-representation plane. When considering each wavelength (λVIS, λIR) separately, the PCA still allows a simple light-scattering criterion to be identified to differentiate each taxon, with a precision depending on the achieved accuracy in the retrieved scattering matrix elements at the considered wavelength. This methodology can interestingly be extended to other pollen taxa provided that precise laboratory measurements of its matrix elements are first accurately carried out, as performed in Sect. 3 for ragweed, ash, birch and pine. Nevertheless, as is, our methodology allows non-equivocal regions in the PCA basis to be identified, due to the sensitivity and accuracy of our laboratory work. Hence, our evaluation of pollen scattering matrix at two wavelengths, when associated with a principal component analysis, is a step towards identifying non-equivocal polarized light-scattering characteristics of pollen, that works for the following set of taxa: ragweed, ash, birch and pine.
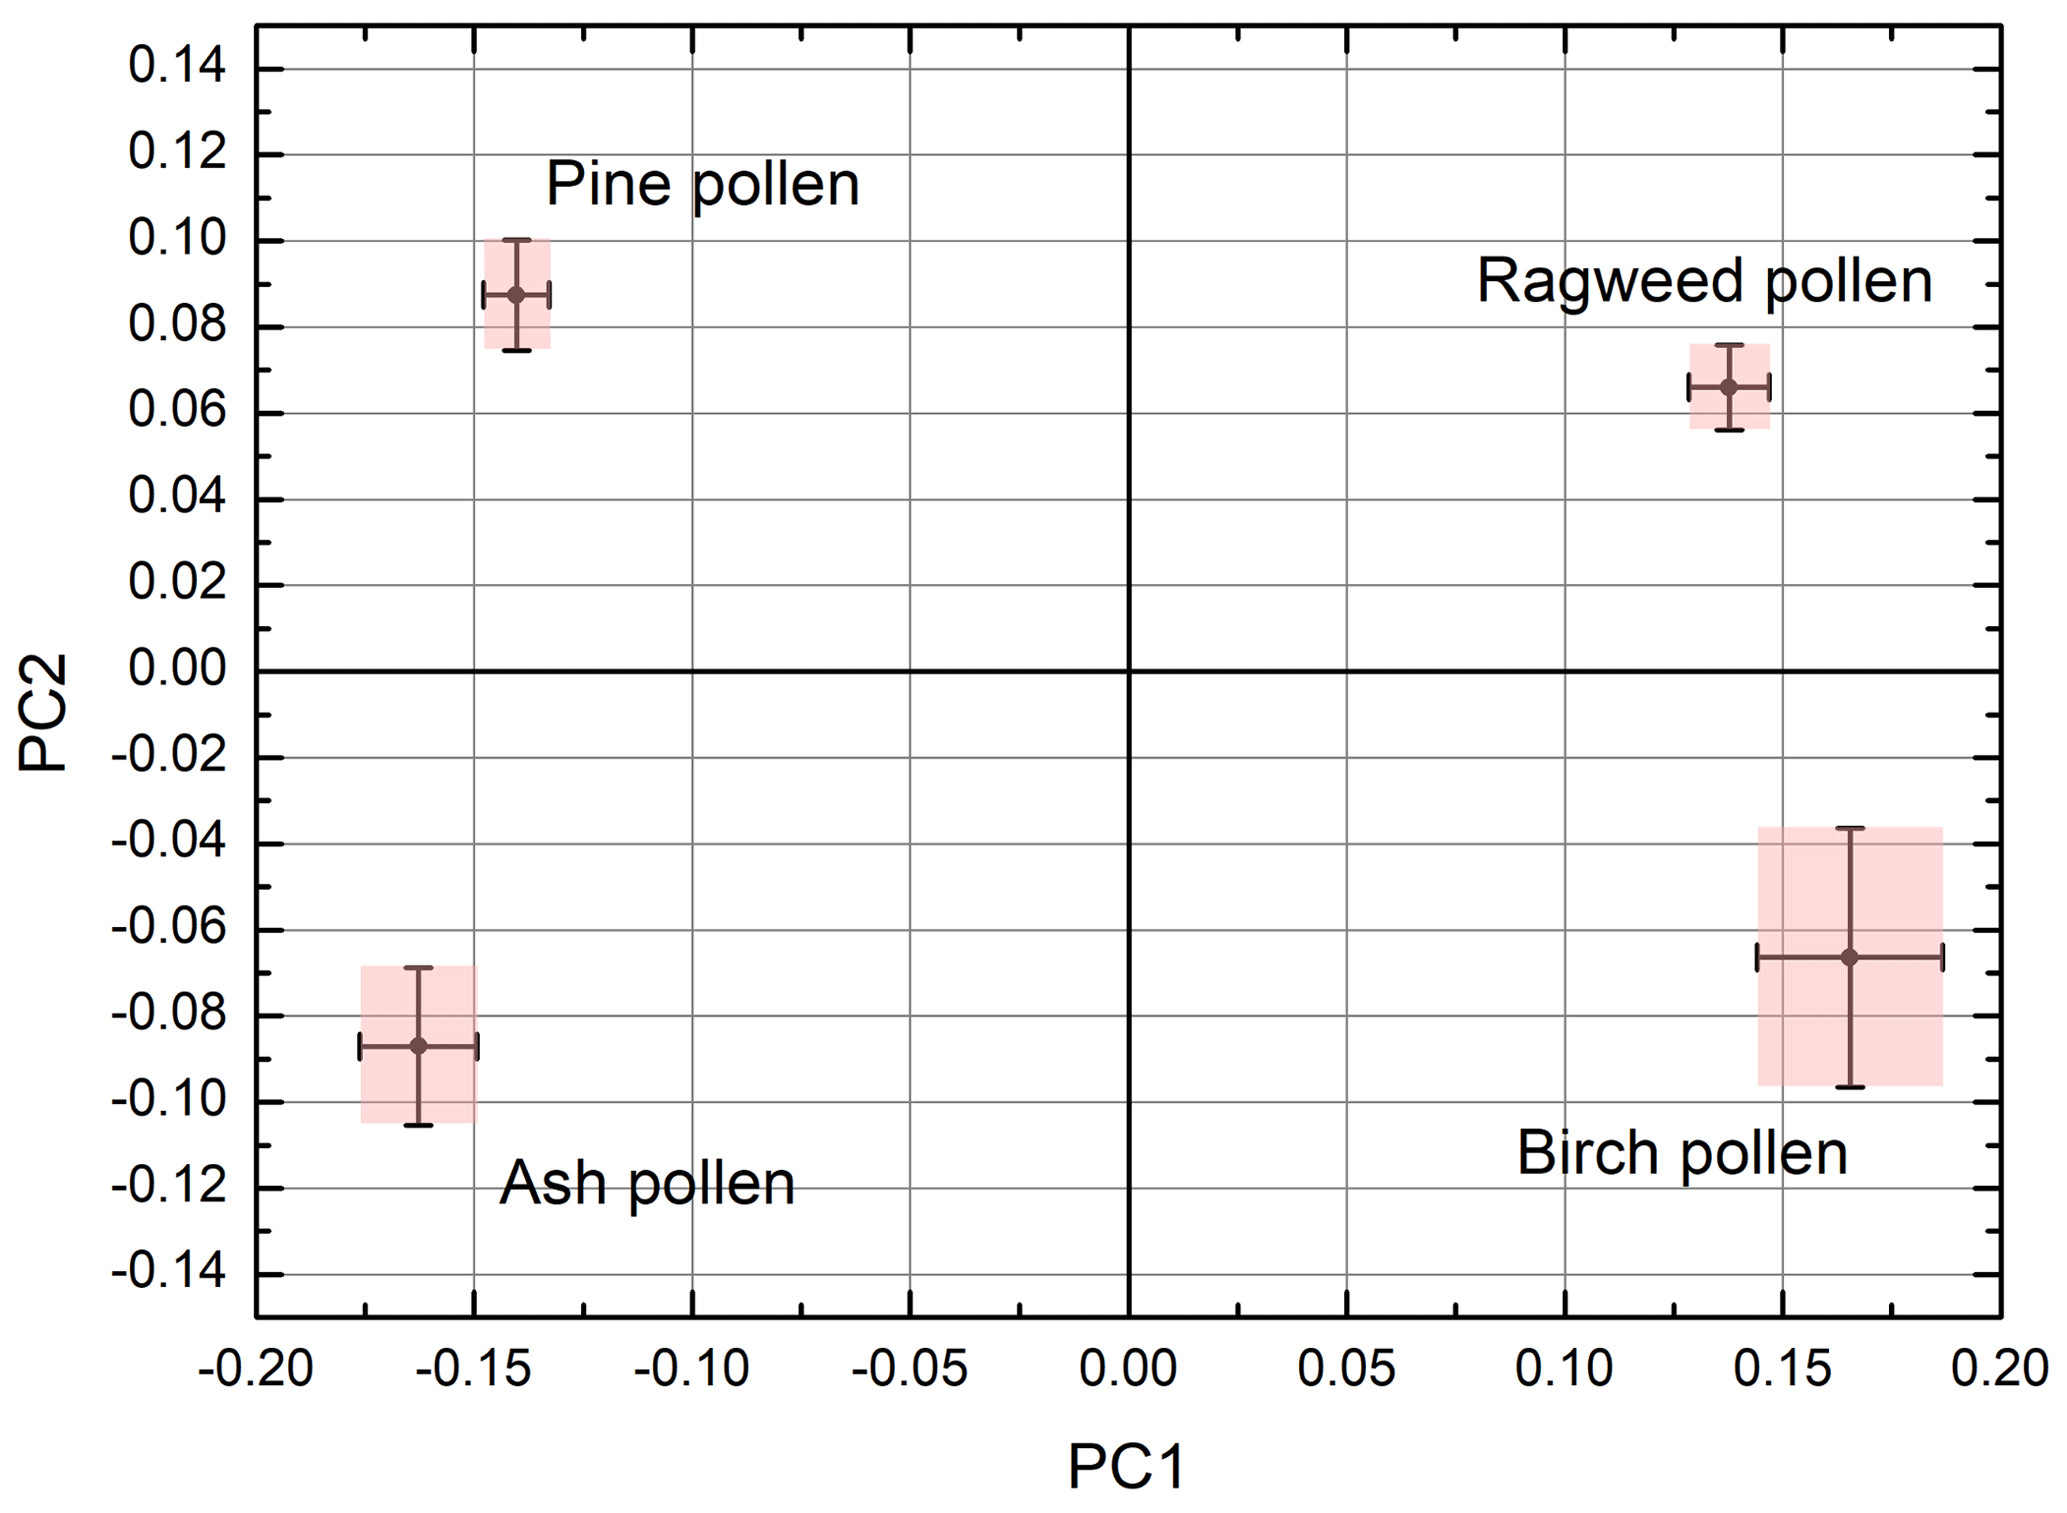
Figure 6Projection of the 10 fij scattering matrix elements (5 per wavelength) for each pollen taxon on the new (PC1, PC2)-orthogonal basis using principal component analysis. Error bars have been evaluated by propagating the uncertainties on each scattering matrix element. Coloured regions correspond to the range of (PC1, PC2) where the pollen taxon can be unequivocally identified among our set of four pollen taxa.
In a context where pollen is highly impacting atmospheric bioaerosols with a high socio-economical cost, new methodologies are required for monitoring and differentiating pollen. In this paper, the ability of polarized light scattering to differentiate a set of four pollen taxa (ragweed, ash, birch and pine) is experimentally studied in the laboratory at two wavelengths. Each pollen taxon having a very specific size and shape, light scattering by these complex-shaped particles is challenging and cannot be easily numerically simulated. In this context, a controlled laboratory experiment, relying on the robust scattering matrix formalism, has been carried out, with special emphasis on the required precision to identify different spectral and polarimetric characteristics of the four considered pollen taxa. This laboratory experiment provides precise retrievals of the scattering matrix elements of each pollen taxon in the form of 10 matrix elements (5 per wavelength). Hence, a set of 10 retrieved matrix elements has been drawn per pollen taxa. Interestingly, within our experimental uncertainties, the four considered pollen taxa, when embedded in ambient air, exhibit clearly different light-scattering characteristics, which allowed differentiation between each pollen taxon from the set of 40 matrix elements (5 per wavelength per pollen sample). Finally, to reduce the dimensionality of our system to a 2D-representation plane while taking into account our experimental uncertainties, a principal component analysis is here proposed. Though the dimensionality is reduced, this projection of each pollen taxon in the new (PC1, PC2)-orthogonal basis interestingly accounts for more than 99 % of our experimental variance, which allows a simple criterion to be provided for classifying among the four considered pollen taxa, based on a 2D-representation plane. There are multiple outlooks to this work. To remain focused on laboratory work, which is currently in short supply, the evaluation of the scattering matrix for a larger set of pollen taxon should be considered. If the four chosen pollen taxa are among the most impactful pollen, this work could be extended to other pollen by following our methodology. Any pollen taxon can in principle be studied and identified by applying our new methodology: our experimental error bars are indeed very low, as does the probability for two different pollen taxa to exhibit the same 10 scattering matrix elements (5 per wavelength). Intense laboratory work is, however, required for extending this work to other species, which is far beyond the scope of this contribution, aimed at introducing this new measurement technique. We may expect our methodology to be applicable to other sets of pollen taxa, provided that the same accuracy is experimentally achieved. The laboratory experiment should then be carried out. As well as this, extension of this work to other wavelengths, to pollen mixtures or to other scattering angles is also an interesting outlook of this work.
Code and data are available upon request by contacting the authors.
AM and PR designed the idea, DC and AM developed the instrument, and DC performed the measurement and data analysis. DC and AM wrote the paper. DC, AM, EB and PR contributed to the final paper. AM, AD, EB, PK and PR supervised the project.
The contact author has declared that neither they nor their co-authors have any competing interests.
Publisher's note: Copernicus Publications remains neutral with regard to jurisdictional claims in published maps and institutional affiliations.
CNRS is acknowledged for financial support and the Lyon Centre Technologique des Microstructures for their help in electronic microscopy.
This paper was edited by Francis Pope and reviewed by Athanasios Damialis and one anonymous referee.
Bickel, W. S. and Stafford, M. E.: Biological Particles as Irregularly Shaped Scatterers, in: Light Scattering by Irregularly Shaped Particles, edited by: Schuerman, D. W., Springer, Boston, MA, 299–305, https://doi.org/10.1007/978-1-4684-3704-1_35, 1980.
Biedermann, T., Winther, L., Till, S. J., Panzner, P., Knulst, A., and Valovirta, E.: Birch pollen allergy in Europe, Allergy, 74, 1237–1248, https://doi.org/10.1111/all.13758, 2019.
Bielory, L., Lyons, K., and Goldberg, R.: Climate Change and Allergic Disease, Curr. Allergy Asthm R., 12, 485–494, https://doi.org/10.1007/s11882-012-0314-z, 2012.
Bohlmann, S., Filioglou, M., Giannakaki, E., Shang, X., Saarto, A., and Komppula, M.: Characterization of atmospheric pollen with active remote sensing in Finland, in: Geophysical Research Abstracts, Geophysical Research Abstracts Vol. 20, EGU2018-12752, 2018.
Cao, X., Roy, G. A., and Bernier, R.: Lidar polarization discrimination of bioaerosols, Opt. Eng., 49, 116201, https://doi.org/10.1117/1.3505877, 2010.
Cholleton, D., Bialic, E., Dumas, A., Kaluzny, P., Rairoux, P., and Miffre, A.: Laboratory evaluation of the (VIS, IR) scattering matrix of complex-shaped ragweed pollen particles, J. Quant. Spectrosc. Ra., 254, 107223, https://doi.org/10.1016/j.jqsrt.2020.107223, 2020.
Comtois, P., Alcazar, P., and Neron, D.: Pollen counts statistics and its relevance to precision, Aerobiologia, 15, 19–28, https://doi.org/10.1023/a:1007501017470, 1999.
Crouzy, B., Stella, M., Konzelmann, T., Calpini, B., and Clot, B.: All-optical automatic pollen identification: Towards an operational system, Atmos. Environ., 140, 202–212, https://doi.org/10.1016/j.atmosenv.2016.05.062, 2016.
Dahl, Å., Strandhede, S.-O., and Wihl, J.-Å.: Ragweed – An allergy risk in Sweden?, Aerobiologia, 15, 293–297, https://doi.org/10.1023/A:1007678107552, 1999.
Giri, R., Morello, C., Heinson, Y. W., Kemppinen, O., Videen, G., Videen, G., Videen, G., and Berg, M. J.: Generation of aerosol-particle light-scattering patterns from digital holograms, Opt. Lett., 44, 819–822, https://doi.org/10.1364/OL.44.000819, 2019.
Gómez Martín, J. C., Guirado, D., Frattin, E., Bermudez-Edo, M., Cariñanos Gonzalez, P., Olmo Reyes, F. J., Nousiainen, T., Gutiérrez, P. J., Moreno, F., and Muñoz, O.: On the application of scattering matrix measurements to detection and identification of major types of airborne aerosol particles: Volcanic ash, desert dust and pollen, J. Quant. Spectrosc. Ra., 271, 107761, https://doi.org/10.1016/j.jqsrt.2021.107761, 2021.
Hamaoui-Laguel, L., Vautard, R., Liu, L., Solmon, F., Viovy, N., Khvorostyanov, D., Essl, F., Chuine, I., Colette, A., Semenov, M. A., Schaffhauser, A., Storkey, J., Thibaudon, M., and Epstein, M. M.: Effects of climate change and seed dispersal on airborne ragweed pollen loads in Europe, Nat. Clim. Change, 5, 766–771, https://doi.org/10.1038/nclimate2652, 2015.
Hesse, M. (Ed.): Pollen terminology: an illustrated handbook, Springer, Wien; New York, 261 pp., https://doi.org/10.1007/978-3-211-79894-2, 2009.
Hirst, J. M.: An automatic volumetric spore trap, Ann. Appl. Biol., 39, 257–265, https://doi.org/10.1111/j.1744-7348.1952.tb00904.x, 1952.
Holler, S., Fuerstenau, S. D., and Skelsey, C. R.: Simultaneous two-color, two-dimensional angular optical scattering patterns from airborne particulates: Scattering results and exploratory analysis, J. Quant. Spectrosc. Ra., 178, 167–175, https://doi.org/10.1016/j.jqsrt.2016.01.009, 2016.
Imhof, K., Probst, E., Seifert, B., Regenass, S., and Schmid-Grendelmeier, P.: Ash pollen allergy: reliable detection of sensitization on the basis of IgE to Ole e 1, Allergo Journal International, 23, 78–83, https://doi.org/10.1007/s40629-014-0010-8, 2014.
Iwai, T.: Polarization Analysis of Light Scattered by Pollen Grains of Cryptomeria japonica, Jpn. J. Appl. Phys., 52, 062404, https://doi.org/10.7567/JJAP.52.062404, 2013.
Jolliffe, I.: Principal Component Analysis, in: Encyclopedia of Statistics in Behavioral Science, edited by: Everitt, B. S. and Howell, D. C., American Cancer Society, https://doi.org/10.1002/0470013192.bsa501, 2005.
Kemppinen, O., Laning, J. C., Mersmann, R. D., Videen, G., and Berg, M. J.: Imaging atmospheric aerosol particles from a UAV with digital holography, Sci. Rep., 10, 16085, https://doi.org/10.1038/s41598-020-72411-x, 2020.
Kim, G., Lee, S., Shin, S., and Park, Y.: Three-dimensional label-free imaging and analysis of Pinus pollen grains using optical diffraction tomography, Sci. Rep., 8, 1782, https://doi.org/10.1038/s41598-018-20113-w, 2018.
Kiselev, D., Bonacina, L., and Wolf, J.-P.: A flash-lamp based device for fluorescence detection and identification of individual pollen grains, Rev. Sci. Instrum., 84, 033302, https://doi.org/10.1063/1.4793792, 2013.
Lake, I. R., Jones, N. R., Agnew, M., Goodess, C. M., Giorgi, F., Hamaoui-Laguel, L., Semenov, M. A., Solomon, F., Storkey, J., Vautard, R., and Epstein, M. M.: Climate Change and Future Pollen Allergy in Europe, Environ. Health Persp., 125, 385–391, https://doi.org/10.1289/EHP173, 2017.
Li, Y., Steiner, A., and Solmon, F.: Investigating the direct climatic forcing of pollen and subpollen particles, American Geophysical Union, Fall Meeting 2013, abstract id. A11B-0020, 2013.
Martinez, A. M. and Kak, A. C.: Pca versus lda, IEEE T. Pattern Anal., 23, 228–233, 2001.
Matsuda, S. and Kawashima, S.: Relationship between laser light scattering and physical properties of airborne pollen, J. Aerosol Sci., 124, 122–132, https://doi.org/10.1016/j.jaerosci.2018.07.009, 2018.
Miki, K. and Kawashima, S.: Estimation of pollen counts from light scattering intensity when sampling multiple pollen taxa – establishment of an automated multi-taxa pollen counting estimation system (AME system), Atmos. Meas. Tech., 14, 685–693, https://doi.org/10.5194/amt-14-685-2021, 2021.
Mishchenko, M. I., Travis, L. D., and Lacis, A. A.: Scattering, Absorption, and Emission of Light by Small Particles, Cambridge University Press, 492 pp., ISBN 9780521782524, 2002.
Mishchenko, M. I., Liu, L., and Videen, G.: Conditions of applicability of the single-scattering approximation, Opt. Express, 15, 7522, https://doi.org/10.1364/OE.15.007522, 2007.
Niederberger, V., Purohit, A., Oster, J. P., Spitzauer, S., Valenta, R., and Pauli, G.: The allergen profile of ash (Fraxinus excelsior) pollen: cross-reactivity with allergens from various plant species, Clin. Exp. Allergy, 32, 933–941, https://doi.org/10.1046/j.1365-2222.2002.01369.x, 2002.
Nouri, S. A., Gregory, D. A., and Fuller, K.: Development of an angle-scanning spectropolarimeter: Preliminary results, J. Quant. Spectrosc. Ra., 206, 342–354, https://doi.org/10.1016/j.jqsrt.2017.11.024, 2018.
PalDat: https://www.paldat.org/, last access: 21 June 2021.
Pan, Y.-L., Hill, S. C., Pinnick, R. G., House, J. M., Flagan, R. C., and Chang, R. K.: Dual-excitation-wavelength fluorescence spectra and elastic scattering for differentiation of single airborne pollen and fungal particles, Atmos. Environ., 45, 1555–1563, https://doi.org/10.1016/j.atmosenv.2010.12.042, 2011.
Petrov, D.: Photopolarimetrical properties of coronavirus model particles: Spike proteins number influence, J. Quant. Spectrosc. Ra., 248, 107005, https://doi.org/10.1016/j.jqsrt.2020.107005, 2020.
Pope, F. D.: Pollen grains are efficient cloud condensation nuclei, Environ. Res. Lett., 5, 044015, https://doi.org/10.1088/1748-9326/5/4/044015, 2010.
Prank, M., Chapman, D. S., Bullock, J. M., Belmonte, J., Berger, U., Dahl, A., Jäger, S., Kovtunenko, I., Magyar, D., Niemelä, S., Rantio-Lehtimäki, A., Rodinkova, V., Sauliene, I., Severova, E., Sikoparija, B., and Sofiev, M.: An operational model for forecasting ragweed pollen release and dispersion in Europe, Agr. Forest Meteorol., 182–183, 43–53, https://doi.org/10.1016/j.agrformet.2013.08.003, 2013.
Raman, P., Fuller, K. A., and Gregory, D. A.: Polarization signatures of airborne particulates, Opt. Eng., 52, 074106, https://doi.org/10.1117/1.OE.52.7.074106, 2013.
Šaulienė, I., Šukienė, L., Daunys, G., Valiulis, G., Vaitkevičius, L., Matavulj, P., Brdar, S., Panic, M., Sikoparija, B., Clot, B., Crouzy, B., and Sofiev, M.: Automatic pollen recognition with the Rapid-E particle counter: the first-level procedure, experience and next steps, Atmos. Meas. Tech., 12, 3435–3452, https://doi.org/10.5194/amt-12-3435-2019, 2019.
Sauvageat, E., Zeder, Y., Auderset, K., Calpini, B., Clot, B., Crouzy, B., Konzelmann, T., Lieberherr, G., Tummon, F., and Vasilatou, K.: Real-time pollen monitoring using digital holography, Atmos. Meas. Tech., 13, 1539–1550, https://doi.org/10.5194/amt-13-1539-2020, 2020.
Schaefer, J., Milling, M., Schuller, B. W., Bauer, B., Brunner, J. O., Traidl-Hoffmann, C., and Damialis, A.: Towards automatic airborne pollen monitoring: From commercial devices to operational by mitigating class-imbalance in a deep learning approach, Sci. Total Environ., 796, 148932, https://doi.org/10.1016/j.scitotenv.2021.148932, 2021.
Schaffner, U., Steinbach, S., Sun, Y., Skjøth, C. A., Weger, L. A. de, Lommen, S. T., Augustinus, B. A., Bonini, M., Karrer, G., Šikoparija, B., Thibaudon, M., and Müller-Schärer, H.: Biological weed control to relieve millions from Ambrosia allergies in Europe, Nat. Commun., 11, 1745, https://doi.org/10.1038/s41467-020-15586-1, 2020.
Schwendemann, A. B., Wang, G., Mertz, M. L., McWilliams, R. T., Thatcher, S. L., and Osborn, J. M.: Aerodynamics of saccate pollen and its implications for wind pollination, Am. J. Bot., 94, 1371–1381, https://doi.org/10.3732/ajb.94.8.1371, 2007.
Sicard, M., Jorba, O., Ho, J. J., Izquierdo, R., De Linares, C., Alarcón, M., Comerón, A., and Belmonte, J.: Measurement report: Characterization of the vertical distribution of airborne Pinus pollen in the atmosphere with lidar-derived profiles – a modeling case study in the region of Barcelona, NE Spain, Atmos. Chem. Phys., 21, 17807–17832, https://doi.org/10.5194/acp-21-17807-2021, 2021.
Siljamo, P., Sofiev, M., Filatova, E., Grewling, Ł., Jäger, S., Khoreva, E., Linkosalo, T., Ortega Jimenez, S., Ranta, H., Rantio-Lehtimäki, A., Svetlov, A., Veriankaite, L., Yakovleva, E., and Kukkonen, J.: A numerical model of birch pollen emission and dispersion in the atmosphere. Model evaluation and sensitivity analysis, Int. J. Biometeorol., 57, 125–136, https://doi.org/10.1007/s00484-012-0539-5, 2013.
Smith, M., Cecchi, L., Skjøth, C. A., Karrer, G., and Šikoparija, B.: Common ragweed: A threat to environmental health in Europe, Environ. Int., 61, 115–126, https://doi.org/10.1016/j.envint.2013.08.005, 2013.
Spänkuch, D., Döhler, W., and Güldner, J.: Effect of coarse biogenic aerosol on downwelling infrared flux at the surface, J. Geophys. Res., 105, 17341–17350, https://doi.org/10.1029/2000JD900173, 2000.
Surbek, M., Esen, C., Schweiger, G., and Ostendorf, A.: Pollen characterization and identification by elastically scattered light, J. Biophotonics, 4, 49–56, https://doi.org/10.1002/jbio.200900088, 2011.
Zhang, X., Rao, R., Huang, Y., Mao, M., Berg, M. J., and Sun, W.: Black carbon aerosols in urban central China, J. Quant. Spectrosc. Ra., 150, 3–11, https://doi.org/10.1016/j.jqsrt.2014.03.006, 2015.
Zink, K., Kaufmann, P., Petitpierre, B., Broennimann, O., Guisan, A., Gentilini, E., and Rotach, M. W.: Numerical ragweed pollen forecasts using different source maps: a comparison for France, Int. J. Biometeorol., 61, 23–33, https://doi.org/10.1007/s00484-016-1188-x, 2017.
Ziska, L., Knowlton, K., Rogers, C., Dalan, D., Tierney, N., Elder, M. A., Filley, W., Shropshire, J., Ford, L. B., Hedberg, C., Fleetwood, P., Hovanky, K. T., Kavanaugh, T., Fulford, G., Vrtis, R. F., Patz, J. A., Portnoy, J., Coates, F., Bielory, L., and Frenz, D.: Recent warming by latitude associated with increased length of ragweed pollen season in central North America, P. Natl. Acad. Sci. USA, 108, 4248–4251, https://doi.org/10.1073/pnas.1014107108, 2011.