the Creative Commons Attribution 4.0 License.
the Creative Commons Attribution 4.0 License.
 | 05 Apr 2022
Formaldehyde and glyoxal measurement deploying a selected ion flow tube mass spectrometer (SIFT-MS)
Antonia G. Zogka
Manolis N. Romanias
Frederic Thevenet
Formaldehyde (FM) and glyoxal (GL) are important atmospheric species of indoor and outdoor environments. They are either directly emitted in the atmosphere, or they are formed through the oxidation of organic compounds by indoor and/or outdoor atmospheric oxidants. Despite their importance, the real-time monitoring of these compounds with soft ionization mass spectrometric techniques, e.g., proton transfer mass spectrometry (PTR-MS), remains problematic and is accompanied by low sensitivity. In this study, we evaluate the performance of a multi-ion selected ion flow tube mass spectrometer (SIFT-MS) to monitor in real-time atmospherically relevant concentrations of FM and GL under controlled experimental conditions. The SIFT-MS used is operated under standard conditions (SCs), as proposed by the supplier, and custom conditions (CCs) to achieve higher sensitivity. In the case of FM, SIFT-MS sensitivity is marginally impacted by relative humidity (RH), and the detection limits achieved are below 200 ppt (parts per trillion). Contrariwise, in the case of GL, a sharp decrease of instrument sensitivity is observed with increasing RH when the H3O+ ion is used. Nevertheless, the detection of GL, using NO+ precursor ion, is moderately impacted by moisture with an actual positive sensitivity response. Therefore, we recommend the use of the NO+ precursor for the reliable detection and quantitation of GL. This work evidences that SIFT-MS can be considered as an efficient tool to monitor the concentration of FM and GL in laboratory experiments, and potentially in indoor or outdoor environments, capable of identifying their primary emission or secondary formation through (photo)oxidation processes. Furthermore, SIFT-MS technology still allows great possibilities for sensitivity improvement and high potential for monitoring low proton transfer affinity compounds.
- Article
(1222 KB) - Full-text XML
-
Supplement
(710 KB) - BibTeX
- EndNote


Formaldehyde (CH2O; FM) is the lightest aldehyde. It is a ubiquitous chemical compound in outdoor and indoor environments. FM is a toxic and carcinogenic air contaminant with adverse health effects to humans (Bernstein et al., 1984; Kim et al., 2011). In the open atmosphere, FM is mainly formed by the oxidation of volatile organic compounds (VOCs; Kefauver et al., 2014). Fuel combustion, forest fires, and agricultural activities are also important sources of FM outdoors (Kaiser et al., 2015; Lee et al., 1997; Luecken et al., 2012). FM plays an important role in atmospheric photochemistry since it is photolyzed, producing hydroxyl (OH) and hydroperoxy (HO2) radicals which drive ozone (O3) production (Atkinson, 2000). Thus, it enhances the formation of secondary organic aerosol (SOA; Li et al., 2011). In indoor environments, FM can be emitted directly from wood-based materials, construction materials, paintings, anthropogenic activities such as smoking, cooking, and cleaning, or by the oxidation of indoor VOCs, especially terpenes, with high yields (Salthammer, 2019). Indoor concentrations of FM can reach significantly higher levels than outdoors (Crump et al., 1997; Langer et al., 2015; Liu et al., 2006).
Glyoxal (C2H2O2; GL) is the lightest α-dicarbonyl compound. GL has been identified as precursor of secondary organic aerosol (SOA) outdoors (Fu et al., 2008; Liggio et al., 2005; Volkamer et al., 2007; Rossignol et al., 2014). GL is formed in the atmosphere by the oxidation of biogenic and anthropogenic VOCs, such as isoprene (the highest emitted VOC in the atmosphere), and acetylene (Fu et al., 2008; Xiao et al., 2007; Myriokefalitakis et al., 2008). The oxidation of aromatic compounds in the presence of NOx (NO and NO2) also produces GL. Other sources of GL are biomass burning, fossil and biofuel combustion, (Grosjean et al., 2001; Hays et al., 2002; Kean et al., 2001) and oceans, but studies in the literature report a high variability (Mahajan et al., 2014; Sinreich et al., 2010). In the literature, it has also been reported that the photochemical oxidation of GL in the troposphere leads to HOx radical formations (Salter et al., 2013). In indoor environments, to the best of our knowledge, there are no studies reporting the direct emission or secondary formation of GL, but, considering emerging research activities dealing with indoor air quality, this should not be excluded.
Due to their important role of outdoor and indoor environments in the chemistry, the monitoring of the FM and GL in laboratory experiments (e.g., simulation chamber experiments and photochemical reactors) or in the field (indoor and outdoor) is of significant importance in order to evaluate and understand the underlying chemistry. Nevertheless, the real-time measurement of FM and GL is not a trivial process. The sensitivity of the classically used proton transfer mass spectrometry (PTR-MS) technique for these compounds is quite limited and is strongly impacted by relative humidity (RH; Inomata et al., 2008; Stönner et al., 2017; Vlasenko et al., 2010; Yuan et al., 2017). Limitations are mainly due to the low proton transfer affinities (PA) of both compounds of interest, i.e., PAFM = 713 kJ mol−1 and PAGL = 675–690 kJ mol−1 (Wróblewski et al., 2007), and is thus very close to the PA of water, i.e., PA = 691 kJ mol−1. Quite recently, electron attachment reaction (EAR) ionization mass spectrometry has been used for real-time measurements of GL in ambient air. Nevertheless, this technique does not seem to be sensitive enough for other volatile organic compounds (VOCs; Lu et al., 2019). It should be noted that mass spectrometric techniques are widely applied in atmospheric science for three main reasons. First, they are sensitive tools that are able to monitor simultaneously and in real-time a wide range of VOCs. Second, they are robust, user-friendly, and mobile systems. Third, they require a relatively low sampling flow (of the order of 100 cm3 min−1) and can be easily coupled to small-scale laboratory experiments or with other instrumentation without a significant extra demand on air sampling flow.
Alternatively, the monitoring of FM and GL is achieved using VOC-selective spectroscopic techniques such as Fourier transform infrared spectroscopy (FTIR; Catoire et al., 2012), differential optical absorption spectroscopy (DOAS; Coburn et al., 2014), tunable diode laser absorption spectrometer (TDLAS; Catoire et al., 2012), or incoherent broadband cavity-enhanced absorption spectrometer (IBBCEAS; Liu et al., 2019; Lu et al., 2019). FTIR spectroscopy is mostly used in lab experiments (Catoire et al., 2012) deployed in situ or in line configuration inside atmospheric simulation chambers or photoreactors (Wisthaler et al., 2008). However, the sensitivity is relatively poor, and even long optical path FTIR systems achieve detection limits (DLs) of the order of several parts per billion (ppb). In addition, long path FTIR systems are not mobile, or are of limited mobility, and the selective detection of FM and GL is relatively difficult due to the complex IR pattern in the presence of other VOCs. Other VOC-selective spectroscopic tools, such as DOAS and IBBCEAS, are mostly used in outdoor field studies (Coburn et al., 2014; Lu et al., 2019). These are expensive and delicate systems that can achieve detection limits in the sub-ppb level. However, these techniques require a high-volume sampling flow of several liters per minute (L min−1; Coburn et al., 2014; Lu et al., 2019). Thus, they are not commonly deployed in laboratory studies or indoor field measurements. Therefore, low time resolution techniques, such as offline analytical approaches, are used for the selective determination of FM and GL. In particular, gas chromatography and mass spectrometry (GC-MS) or high-performance liquid chromatography (HPLC) are used for offline analysis of sampling cartridges (Ban-Weiss et al., 2008; Gómez Alvarez et al., 2012; Wisthaler et al., 2008).
A response to the need for real-time, selective, and sensitive monitoring of FM and GL could be the selected multi-ion flow tube mass spectrometry (SIFT-MS). SIFT-MS is a soft ionization analytical technique, mainly used for the real-time monitoring (identification and quantification) of a wide diversity of VOCs, and some inorganic species (e.g., NO2 and HONO). SIFT-MS attains the advantages of the typical mass spectrometric techniques described above. SIFT-MS is essentially a double quadrupole chemical ionization mass spectrometer simultaneously using H3O+, NO+, and O precursor ions for the ionization and the subsequent detection of the analytes. SIFT-MS has extensively been used for breath analysis and in food science, but it is not commonly used in atmospheric science, where, traditionally, PTR-MS is widely applied. Nevertheless, in the last decade, the application of SIFT-MS technology for the study of atmospherically relevant processes became more frequent, where SIFT-MS is either coupled to experimental chambers with various volumes for indoor studies (Caron et al., 2016, 2020; Thevenet et al., 2021) or atmospheric simulation chambers for the study of VOC degradation (Osseiran et al., 2020; Allani et al., 2021).
Quite recently, Lacko et al. (2020) have reported, for the first time, the detection of FM and GL deploying a custom-made SIFT-MS. In their study, authors mainly focus on the ion chemistry occurring inside the flow tube of the instrument and how it is impacted by humidity. These authors have also applied chemical modeling in an attempt to interpret their experimental results. Nevertheless, Lacko et al. (2020) used a custom-made SIFT-MS instrument that was operated in a tailored mode, injecting the corresponding VOC in a humidified airflow of helium bath gas. Their measurements were carried out at low levels of relative humidity, never exceeding 10 %, and using constant concentrations of VOCs in the parts per million (ppm) range. Therefore, the authors did not evaluate the response of the instrument in a VOC concentration span of sub-ppm range, typical of indoor and outdoor environments, and they did not report the corresponding detection limits (DLs). Furthermore, their study was solely focused on the chemistry of the H3O+ precursor ion.
In this paper, we present a series of calibration experiments of FM and GL, deploying a commercially available SIFT-MS Voice200 ULTRA instrument. The main objective of this work is to evaluate the sensitivity of SIFT-MS towards FM and GL and elucidate whether it can (i) be used to monitor the concentrations of the title compound in laboratory-scale or ambient indoor/outdoor air conditions and (ii) overcome the limitations encountered in conventional PTR-MS studies, as highlighted above. In addition, for the first time in the literature, we aim to emphasize the importance of NO+ charge transfer reactions on the detection of GL. To meet these objectives, FM and GL calibration measurements are carried out under dynamic flow conditions using a wide range of VOC concentrations in the ppb level, varying the relative humidity (RH) from dry conditions to 70 %. Within that framework, we assess the impact of RH and the instrument operational conditions (i.e., pressure and temperature) to its performance.
The structure of the article is as follows: first, we present a detailed description of the experimental setup, the methods deployed, and protocols followed in this work. Thereafter, in Sect. 3, we provide (i) the literature and experimental evidences that impact the charge transfer reactions in SIFT-MS and PTR-MS, and (ii) the actions made in the framework of our study to improve the SIFT-MS performance. Subsequently, the results and discussion on FM and GL are presented separately in two different sections. Each of the two subsections include the presentation of our experimental observations and a thorough discussion that contains comparison with PTR-MS or other SIFT-MS studies and a comprehensive assessment of the charge transfer reactions involved in the detection of the compound of interest.
2.1 Materials
2.1.1 Formaldehyde source
A gas cylinder of FM purchased from Praxair, Inc. (12 ppm in N2) is used as a source for the calibration experiments. The purity and stability of the gas mixture is regularly tested by sampling FM gas on dinitrophenylhydrazine (DNPH) cartridges that are (water) eluted and analyzed offline, using the UltiMate 3000 HPLC instrument (Thermo Fisher) coupled with an ultraviolet detector.
2.1.2 Glyoxal source
The monomer of pure GL is synthesized by applying a similar method with to that in the literature (Volkamer et al., 2005). In particular, equal amounts (ca. 0.6 g) of GL trimer dihydrate (purity ≥ 97 %; Sigma-Aldrich) and di-phosphorous pentoxide (purity > 98 %; Avantor) are mixed in a glass bulb and are progressively heated up under vacuum conditions (1.5 × 10⁻³ Torr) from room temperature to 453 K. The evolving gas is collected in a glass trap immersed into liquid nitrogen, where the bright yellow pure GL solid crystals appear. Subsequently, after synthesis, the cold trap containing the monomer of GL is placed in a liquid nitrogen/ethanol bath maintained at 230 K and is degassed under vacuum conditions several times to remove volatile by-products (purification process). The vapors of pure GL are collected in a 10 L Pyrex glass bulb that has been darkened to minimize exposure of the sample to room light. The purity of the gas is verified by FTIR spectroscopy deploying an Antaris FTIR spectrophotometer (Thermo Fisher) equipped with a 2 L optical gas cell with 10 m optical path length. The temperature of the optical cell is maintained at 353 K. The FTIR spectra collected are of a high quality and identical to those presented in the literature for pure GL monomers (Volkamer et al., 2005). The thermal stability of the GL is also verified, and we evidence that no thermal decomposition occurs, in accordance with the literature (Feierabend et al., 2008; Saito et al., 1984). Considering the detection limits of the instrument for CO, CO2 (of the order of 0.1 ppm), and FM (of the order of 1 ppm), the purity of GL is greater than 99 %. After the quality control experiments, dilutions of GL gas in He are prepared manometrically in another glass bulb, with mixing ratios of ca. 1 % for a total pressure of 400 Torr. For the sake of simplicity, it will be referred to as mixture 1 (GL diluted in He) in the following. Mixture 1 is used as a source to prepare more diluted GL/He gas mixtures (in the range of 50 to 120 ppm) with total pressure of 1550 Torr inside a 6 L Silonite treated canister. The exact concentration of GL in the canister is determined with FTIR spectroscopy, using the well-defined broadband IR absorption cross section coefficients provided in the literature for the characteristic band of GL between 2724–2940 cm−1 (Volkamer et al., 2005). These mixtures are used for the calibration of the SIFT-MS instrument, and their stability is evaluated on a daily basis. It should be noted that two different GL syntheses were carried out and four different GL+He canister mixtures are used for the calibration experiments to evaluate uncertainties related to GL concentration.
2.2 Experimental setup
2.2.1 General description
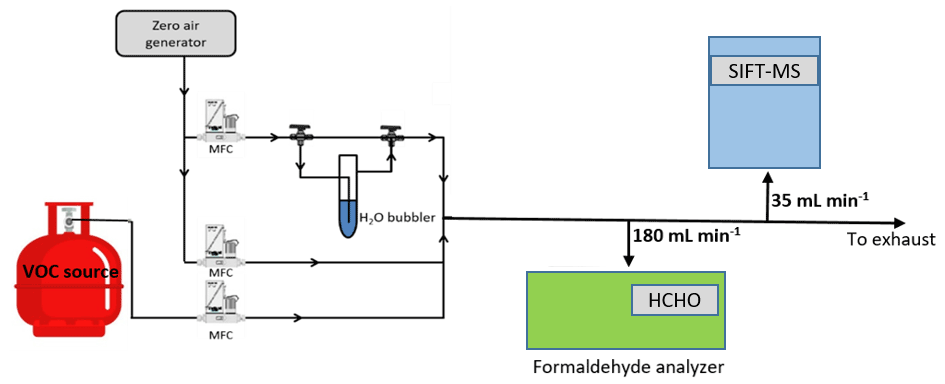
The experimental setup used in the current study is reported in Fig. 1. The gas flow generation lines are made of Teflon. Calibrated mass flow controllers (MFCs) are used to mix the flow of the target VOC (i.e., FM or GL) with dry or humid zero air (impurity levels are VOCs < 0.1 ppb, CO2 < 10 ppb, and CO < 80 ppb; moisture level is ca. 2 ppm). The total gas flow rates in the calibration measurements are of the order of 1000 mL min−1. Nevertheless, experiments are also performed by varying the flow rate between 300 to 1600 mL min−1, aiming to evaluate the possible loss of compounds on gas lines. The total concentration of the target VOCs in the diluted gas flow are between 40 to 1200 ppb. In the case of FM, the diluted gas stream is sampled by an Ap2e ProCeas® FM analyzer (sampling rate 180 mL min−1) and the SIFT-MS (sampling rate 35 mL min−1) connected in parallel. Concerning GL calibration experiments, the FM analyzer and the long path FTIR were occasionally used to evaluate possible impurities in the canister or transformation of GL in the gas lines, but the majority of the measurements are carried out in a manner that bypasses them.
2.2.2 Formaldehyde analyzer ap2e ProCeas®
The real-time measurement of FM in the gas flow is achieved deploying an Ap2e ProCeas® gas analyzer. The gas flow is sampled through a sonic orifice with a diameter of few micrometers. Then, the gas is driven to an optical cell and analyzed employing patented laser optical feedback cavity-enhanced absorption infrared spectroscopy. The instrument response is ca. 2 s, and the detection limit (3σ) of FM is 1 ppb for an integration time of 1 min.
2.2.3 SIFT-MS
The SIFT-MS voice 200 ultra (Syft Technologies Limited) is a double quadrupole chemical ionization mass spectrometer. A microwave discharge simultaneously generates three precursor ions, H3O+, NO+, and O, which are sequentially selected by a first quadrupole mass filter (Smith and Španěl, 2005). Then, under a flow of He, used as carrier gas, the precursor ions are driven inside a low-pressure flow tube reactor. At the same time, the sampling flow is injected at the upstream end of the reactor. The precursor ions react with the analytes along the flow tube to form characteristic ionized molecules as reaction products (Smith and Španěl, 2005). The temperature of the sampling port and the flow tube are temperature regulated (293–393 K) to avoid contaminations of the sampling line and adsorption of reactants along the flow tube. Subsequently, the gas stream passes through a skimmer, located at the downstream end of the flow tube reactor and, finally, is injected in a high vacuum chamber where both the precursor and reaction product ions are focused, via electrostatic lenses, into a second quadrupole for mass analysis and ion counting. At this point it should be noted that the simultaneous presence of the three precursor ions allows the real-time monitoring of several VOCs, eliminating the effect of mass peak overlapping due to the use of a quadrupole mass filter with a low mass resolution. Interestingly, this multi-ion chemistry allows SIFT-MS to discriminate isobaric compounds (Guimbaud et al., 2007), which is not a trivial task – even for time-of-flight (TOF) techniques (Stönner et al., 2017; Yuan et al., 2017).
2.2.4 FTIR
The purity of the glyoxal is verified by FTIR spectroscopy deploying an Antaris FTIR spectrophotometer equipped with a 2 L optical gas cell with 10 m optical path length and zinc selenide transmission windows. The temperature of the optical white cell is maintained at 353 K. A liquid-N2-cooled mercury cadmium telluride (MCT) detector was attached and 64 co-added IR spectra were recorded between 650 and 4000 cm−1, with 1 cm−1 resolution, using RESULT™ v.3 software. Quantification and data processing were performed using a thermos scientific software, TQ Analyst™.
2.3 Experimental procedure and detection limits
Figure 2 displays the experimental strategy followed in the framework of the current study to calibrate the SIFT-MS. In a typical calibration experiment, the background of the VOC of interest is initially monitored for at least 20 min under a stream of zero air at the selected RH. Then the desired level of VOC is introduced in the gas stream, and its concentration is monitored in real time. In each calibration step, the flows are kept constant for around 20 min. In the case of FM, the stabilization of its concentration in the gas flow is achieved within the first 10 min after its introduction in the gas flow, while, in the case of GL, its concentration is stabilized almost instantaneously. Typically, four to six different concentration levels of the VOC of interest are set in each calibration experiment. At the end, the background is recorded again. This experimental procedure is repeated for each level of RH and for each VOC individually. In the case of FM, the calibration factor is determined by plotting the SIFT-MS response (in counts) versus the concentration reported by the FM analyzer, while in the case of GL it is done by plotting the SIFT-MS response as a function of GL concentration determined by the measured flow rate and the sample mixing ratio.
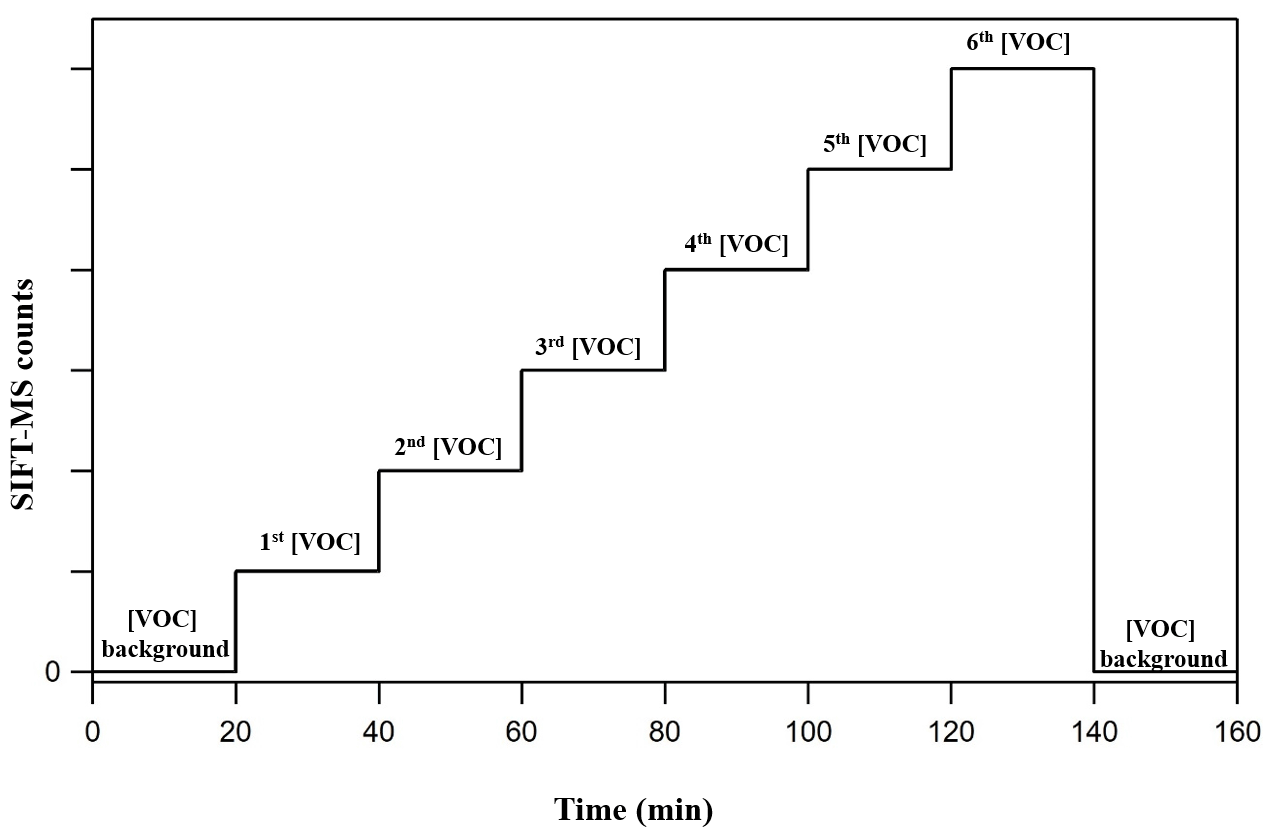
Figure 2Strategy followed during a typical calibration experiment. At first, the background of the VOC at the corresponding mass peak(s) is recorded. Then its concentration is progressively increased and monitored with SIFT-MS. Typically, four to six different concentrations of the VOC of interest are set before returning to background monitoring.
The time resolution of the SIFT-MS instrument in the calibration experiments is set to 1 s. FM is monitored at the mass peak = 31 (CH3O+ and FM-H+) arising from the H3O+ precursor ion, while in the case of GL the mass peaks = 59 (C2H3O) and = 88 (C2H2O2•NO+), originating from H3O+ and NO+, respectively, are used.
To determine the detection limits (DLs) of the SIFT-MS, Eq. (1) is used as follows:
where SD is the standard deviation of the background signal. A similar criterion has been used in the literature to determine the detection limits of PTR-MS instruments for FM and GL. Therefore, it will allow us to make a direct comparison between the instrument sensitivities.
Results and discussion section is divided in three parts. In the first one, we discuss the optimization of the operational parameters and conditions of the SIFT-MS and the strategy followed to improve the method and the performance of the instrument. The second and the third subsections are dedicated to the calibration measurements of FM and GL, respectively, as a function of RH under standard and custom SIFT-MS operational conditions.
3.1 From the standard to the custom method for the SIFT-MS determination of FM and GL
The standard operational conditions (SCs) of the SIFT-MS, as recommended by the supplier, correspond to a (i) temperature of 393 K for the sampling plate and the flow tube, (ii) He flow rate of 380 mL min−1 as bath gas, and (iii) sampling flow rate of 35 mL min−1, resulting in a total pressure inside the flow tube of 0.65 Torr (Table 1). Table 1 summarizes other characteristic parameters of the SIFT-MS, such as carrier gas (νg) and ion flow (νi) velocities, reaction time inside the flow tube of the instrument (tr), and mean kinetic energy between reactants (KEcm). However, the studies in the literature have reported that FM and GL detection is highly sensitive to operational conditions of soft ionization mass spectrometers (Lacko et al., 2020; Stönner et al., 2017; Yuan et al., 2017). In particular, the detection of FM and GL is based on association reactions (Lacko et al., 2020; Michel et al., 2005; Stönner et al., 2017; Yuan et al., 2017), and thus, the pressure and temperature of the flow tube can play a dominant role since association reactions are favored at higher pressures. Furthermore, in the literature, the fragmentation of GL has been reported, leading to reduced sensitivity and a more complex chemistry inside the reaction tube of the corresponding mass spectrometer (Lacko et al., 2020; Stönner et al., 2017). A crucial role for the detection of both FM and GL is also played by the KEcm (Hansel et al., 1997).
Table 1SIFT-MS parameters and conditions used in the framework of the current study.
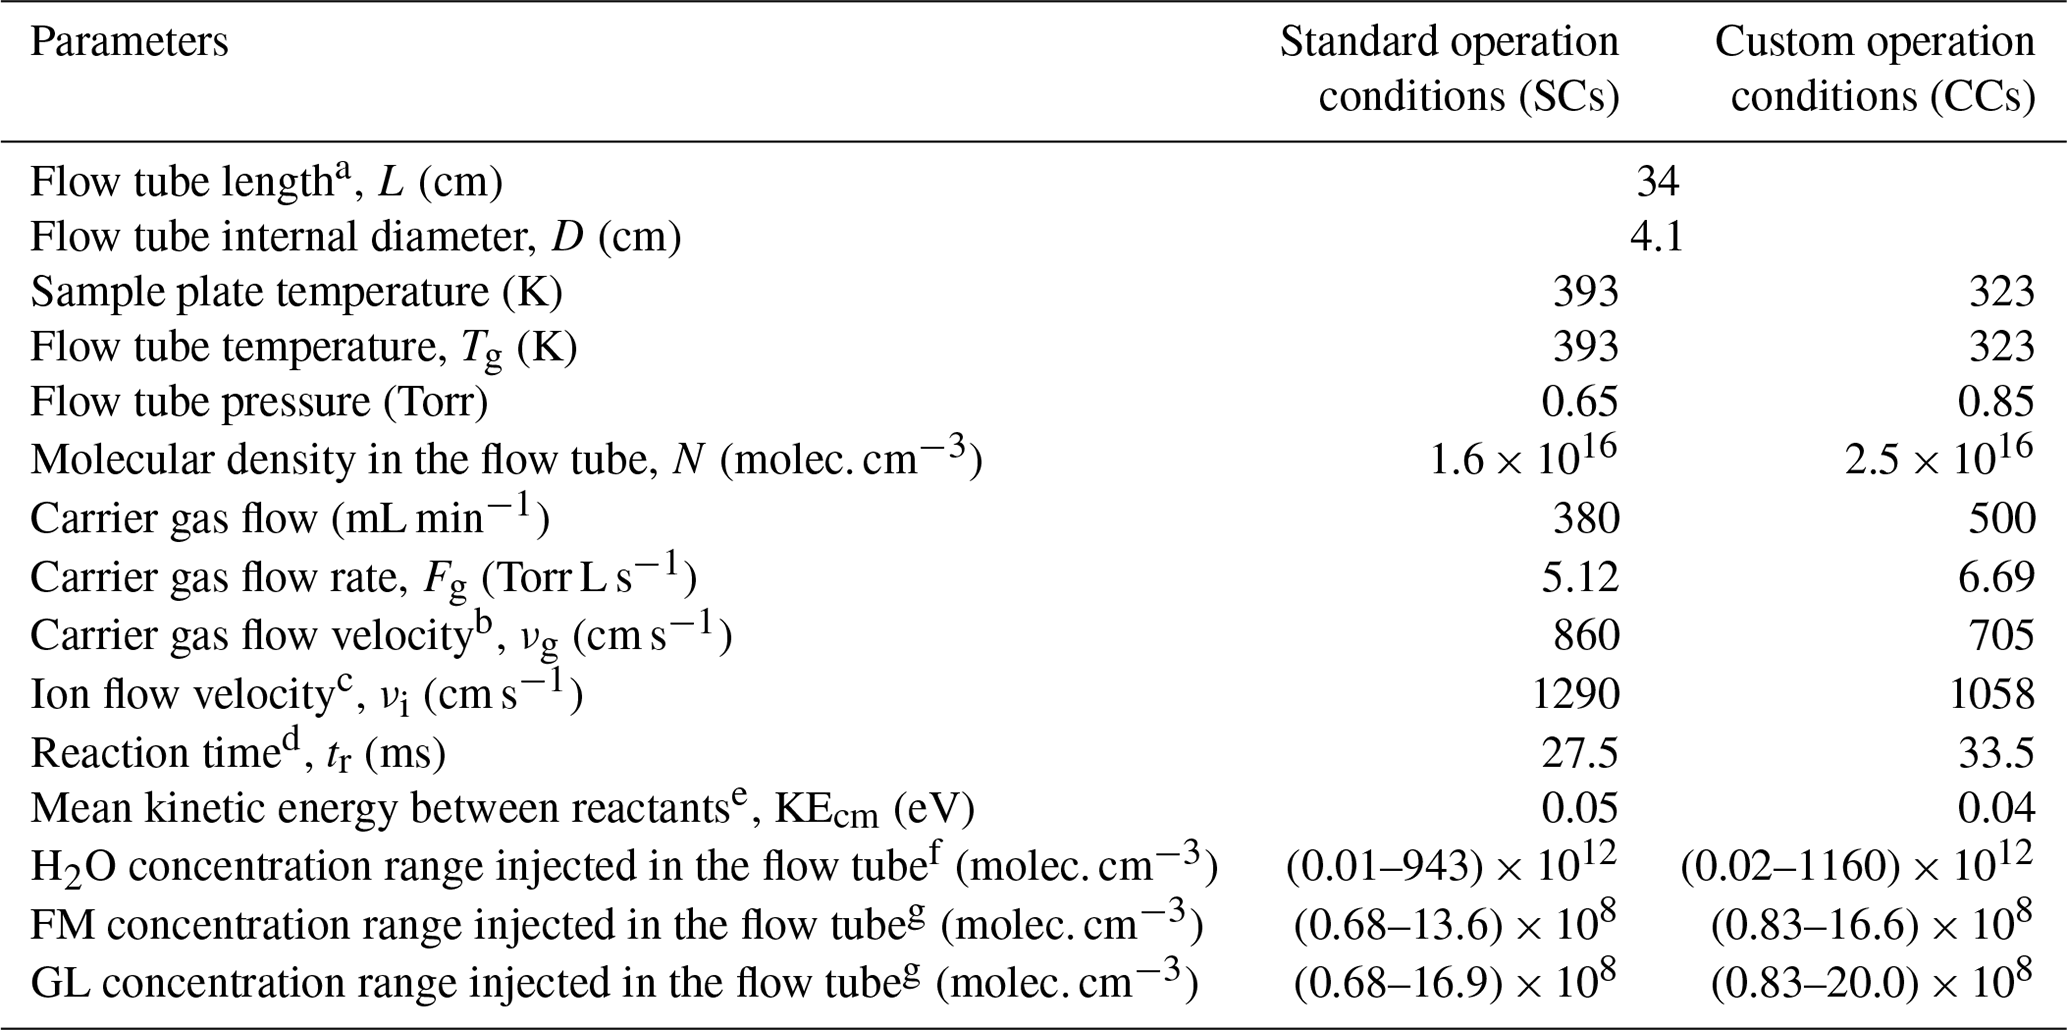
a Distance between sample flow injection point and the end of the flow tube. b Calculated from the expression , where Fg is the carrier gas flow rate, Tg is the temperature of the carrier gas, Pg is the pressure in flow tube, and D is the flow tube internal diameter (Španěl and Smith, 1996). c Calculated as (Smith and Adams, 1988). d Estimated from the expression , where ε=1.5, and it corresponds to the distance for a full mixing of neutral molecules with the carrier gas in the flow tube. e Calculated using the recommended expressions by Hansel et al. (1997). KE, where m and M are the masses of the carrier gas and the neutral reactant, respectively, kB is the Boltzmann constant, and KEion is the kinetic energy of ions obtained by the expression KE, where Mion is the mass of reactant ion. f Estimated using the following expression: , where is the sample flow of pure water in the sample flow calculated as the product of RH with the total sample flow rate (35 mL min−1), Ftotal is the total flow rate inside the flow tube, and N is the number density. g Calculated in a similar way with water concentrations, , where FVOC is the sample flow of pure VOC in the sample flow calculated as the product of VOC mixing ratio in the total sample flow (35 mL min−1).
Considering the abovementioned challenges related to the sensitive detection of FM and GL, to improve the sensitivity of the SIFT-MS, we modified the pressure and temperature conditions of the SIFT-MS compared with SCs. In particular, we indirectly increased the pressure inside the flow tube, by increasing the He flow to its maximum value of 500 mL min−1 under constant pumping. This increase in He flow results in a 23 % higher pressure compared with SCs. The temperature of the flow tube and sampling plate has been decreased to 323 K. The temperature decrease results in lower KEcm. Combined with increasing pressure, it leads to lower gas and ion flow velocities and longer reaction times in the flow tube. Based on the literature (as described below and experimentally validated in our study), these modifications are anticipated to increase the sensitivity of the instrument. These modified operation conditions of the SIFT-MS are summarized in Table 1. In the rest of the paper, they are referred to as custom conditions (CCs). In order to assess the relevance of CCs, calibration experiments described in the remainder of the paper are carried out under both SC and CC conditions.
We observed that operating the instrument under SC or CC modes has a negligible impact on the concentration of the NO+ and O primary ions. However, the distribution of H3O+ and H3O+•H2O clusters is influenced. The hydronium water cluster can be formed from Reaction (R1), as follows:
The rate coefficient of Reaction (R1) is cm6 s−1. It is an average value retrieved from three studies in the literature (Bierbaum et al., 1976; Bolden and Twiddy, 1972; Španěl and Smith, 2001). The errors quoted correspond to the standard deviation of the measurements.
Reaction (R1) is an association reaction, and therefore, the rate coefficient depends on the thermal stabilization of the adduct leading to the formation of H3O+•H2O, which is favored at low temperatures and high pressures. Consequently, both temperature and pressure modifications, applied to establish CCs, enhance the formation of H3O+•H2O clusters. In addition, the reaction time also plays a role. Under CCs, tr is increased by a factor of 1.22 compared to SCs, and thus an increase in the concentration of H3O+•H2O is expected. In order to establish a criterion for the humidity adjustments during the calibration experiments and the different operation modes of the instrument, the ratio of the signals for the H3O+•H2O cluster at the 37 (I37) and H3O+ at the 19 (I19) is considered. Note that similar approaches have been applied in the literature (Inomata et al., 2008; Stönner et al., 2017). In Fig. S1 in the Supplement, these relative ratios of versus the RH in the gas flow for the two different operation modes of the SIFT-MS are presented. It should be noted that, as displayed in Fig. S1, when the ambient water vapor concentration is close to zero level, i.e., close to dry conditions, then the ratio approaches zero, pointing out that the water coming from the discharge ion source entering the flow tube is negligible compared to the water vapor from the sampled dry air. This is in contrast with what has been noted in PTR-MS studies (Inomata et al., 2008; Stönner et al., 2017).
In theory, it is possible to estimate the water concentration inside the flow tube to better predict the changes in the abundances of H3O+ and H3O+•H2O ions. Lacko et al. (2020) applied the following expression to estimate the water concentration:
where
However, in the literature, k1 has solely been determined at room temperature; thus, extrapolation cannot be directly performed to SCs or CCs. Alternatively we can use the mixing ratios of water in the sample flow to estimate the concentration of water molecules introduced in the flow tube (Table 1). The background [H2O] has been estimated in the range of 1010 molec. cm−3 (based on H2O residual levels in the zero airflow, with < 2 ppm corresponding to RH < 0.01 %), while the increase in RH resulted in water concentrations introduced in the flow tube of the order of 1014 molec. cm−3, corresponding to around 5 % of the total number density. A similar approach was applied to estimate the concentrations of FM and GL inside the flow tube. Using mixing ratios of 50 up to 1200 ppb in the sample flow, the concentrations of the title VOCs were in the range of 108 molec. cm−3 and is thus several order of magnitude lower than [H2O].
3.2 Formaldehyde determination using SIFT-MS
3.2.1 Experimental calibration of formaldehyde under SCs and CCs
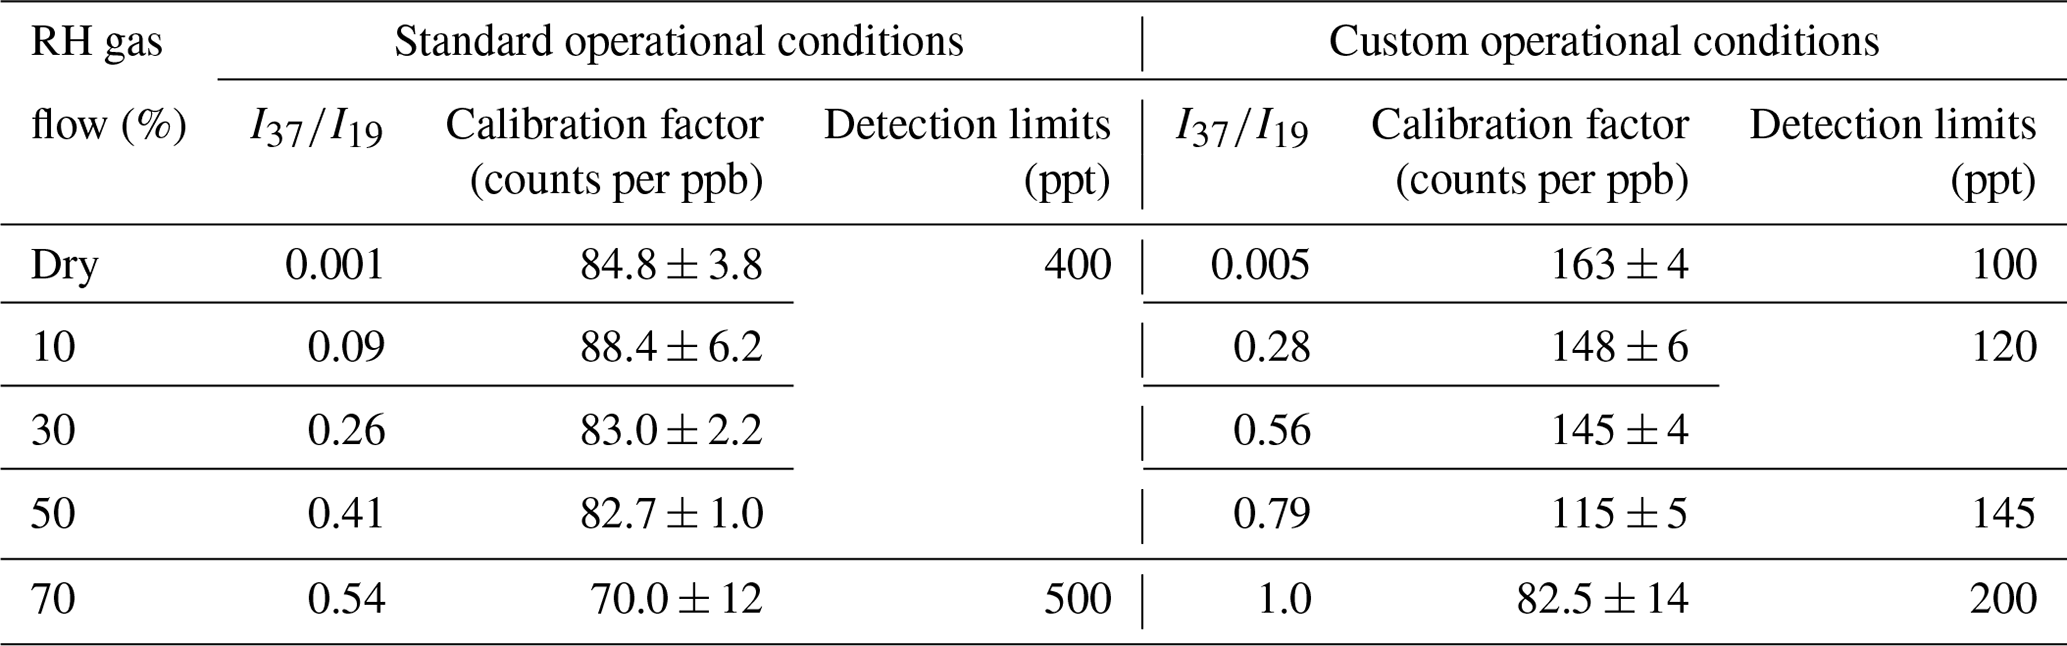
Figure 3 displays the typical calibration curves of FM operating SIFT-MS under standard and custom conditions. The slope of the linear fit of experimental results corresponds to the calibration factor of the compound of interest. In both cases, a linear response (R2 > 0.997) of the instrument is noticed on the entire concentration range explored. However, at 70 % of RH, the experimental data points are more scattered, resulting in a lower precision fit. In Table 2, the calibration factors at each ratio are summarized. Under CCs, the sensitivity of SIFT-MS towards FM is increased by a factor of ca. 2, compared to SCs. In addition, considering the experimental uncertainties, under SCs, the SIFT-MS response is not influenced by the level of RH used, while under CCs the sensitivity of the instrument is reduced by a factor of 2 from dry conditions ( < 0.01) to 70 % (). Actually, a careful look at the data presented in Table 2 points out that SIFT-MS sensitivity is not impacted by water presence when the relative ratio of is below ca. 0.55, irrespective of the SIFT-MS operation mode. Under CCs, to express the relative humidity dependence of the instrument sensitivity at the mass peak of 31, the calibration factors were plotted as a function of the ratio, using a weighted fit power function (Fig. S2). The weighted fitting considers the uncertainties denoted for each calibration factor. The following expression describes the instrument sensitivity under the SCs for the mass peak of 31:
Contrariwise, in the literature it is reported that the sensitivity of a PTR-MS is massively reduced with RH. For instance, in the study of Stönner et al. (2017), the PTR-MS sensitivity was reduced by a factor of 5 or even greater when the relative ratio of H3O+•H2O to H3O+ masses (measured as ) varies from < 0.1 to 0.4.
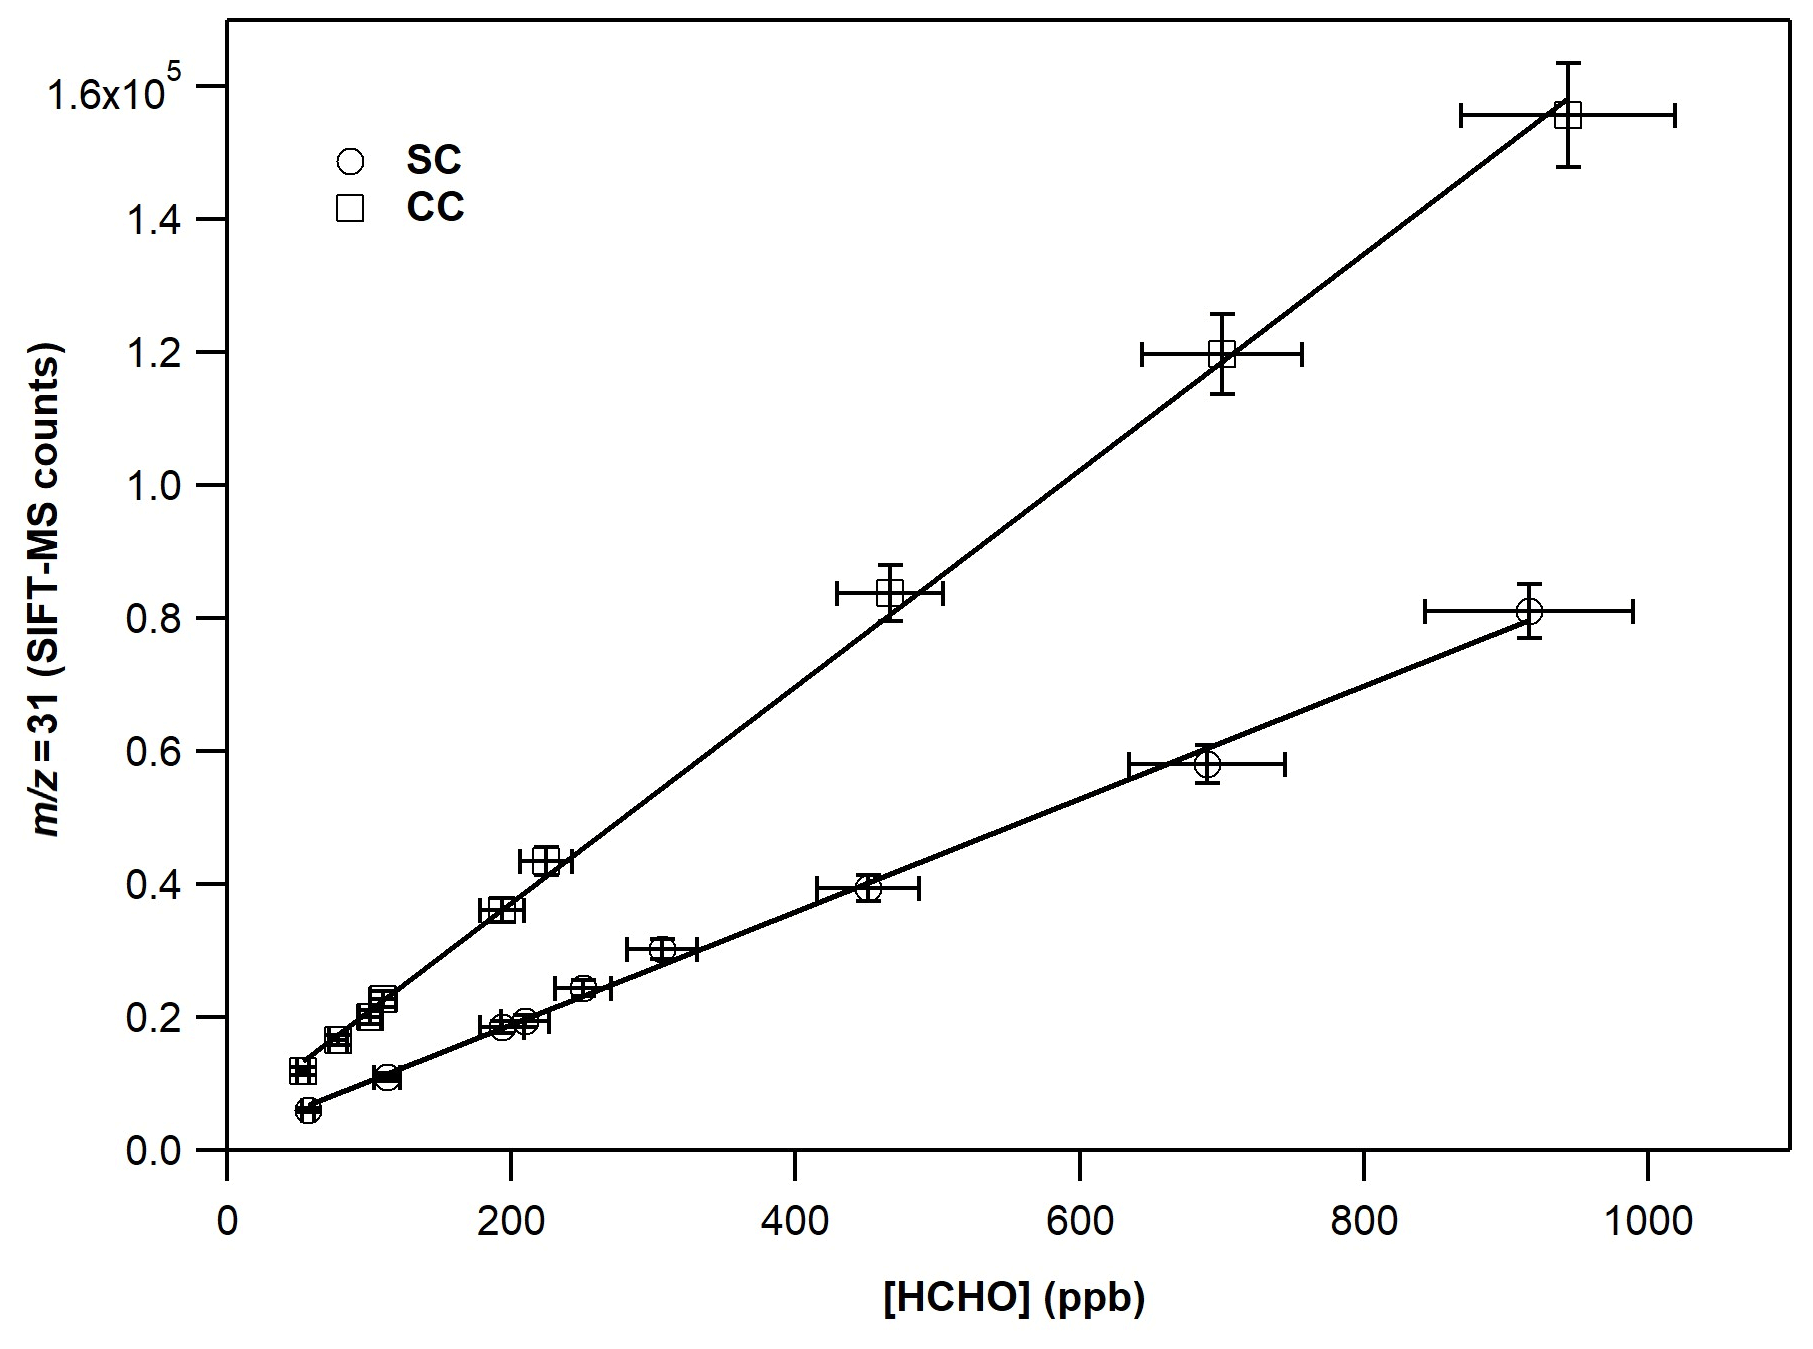
Figure 3Calibration curves of FM at the 31, derived from the H3O+ precursor ion under dry conditions. The error bars on the y axis are 5 % (extreme value) and correspond to the 2σ standard deviation of the averaged value of the SIFT-MS signal for each measurement. The errors reported on the x axis are 8 % and correspond to the uncertainty given for the cross section value of FM (4 %) and other systematic uncertainties (in the flow of the mixture, sampling flow of the instrument, etc.) added in quadrature.
Table 2Calibration factors and detection limits of FM at the = 31 as a function of relative humidity for standard and custom operational conditions of the SIFT-MS. The calibration factor is derived from the slope of a typical experiment shown in Fig. 3. The errors given in the calibration factors are the 2σ precision of the linear fit.
3.2.2 Comparison of formaldehyde determination between SIFT-MS and PTR-MS
The contrasting behavior between the SIFT-MS and PTR-MS instruments is related to their distinct operational principles and chemical reactions. Therefore, before proceeding with the chemistry of proton transfer reactions for FM measurement, it is essential to discuss the major differences between the conditions inside the flow tube of the SIFT-MS used in the current study and inside the drift tube of the PTR-MS instruments deployed in the literature for FM characterization (Inomata et al., 2008; Stönner et al., 2017; Vlasenko et al., 2010; Warneke et al., 2011).
The pressure inside the flow tube of the Voice200 ULTRA instrument SIFT-MS instrument ranges between 0.6 and 0.9 Torr (Table 1), which is a factor of 2 lower than the pressure inside the drift tube in a PTR-MS. This pressure difference can impact the ion chemistry and, mainly, the formation of H3O+•H2O clusters. Besides the pressure, the main difference between the two instruments relies on the mean relative kinetic energy of reactants (KEcm). In the flow tube of the SIFT-MS, the KEcm of the analytes and precursor ions depend mainly on the temperature of the tube. Under the SCs and CCs, the kinetic energy was calculated to be ca. 0.05 and 0.04 eV, respectively (Table 1). On the contrary, the application of an electrical field inside the drift tube of a PTR-MS leads to significantly higher KEcmvalues, reducing the sensitivity of the instrument. Typical values of KEcm range between 0.10 to 0.23 eV in studies using PTR-MS for FM monitoring (Table 3; Inomata et al., 2008).
Table 3Rate coefficients of ion molecule chemical reactions of FM under typical PTR-MS studies retrieved from the literature and the conditions in which SIFT-MS is deployed in this work.
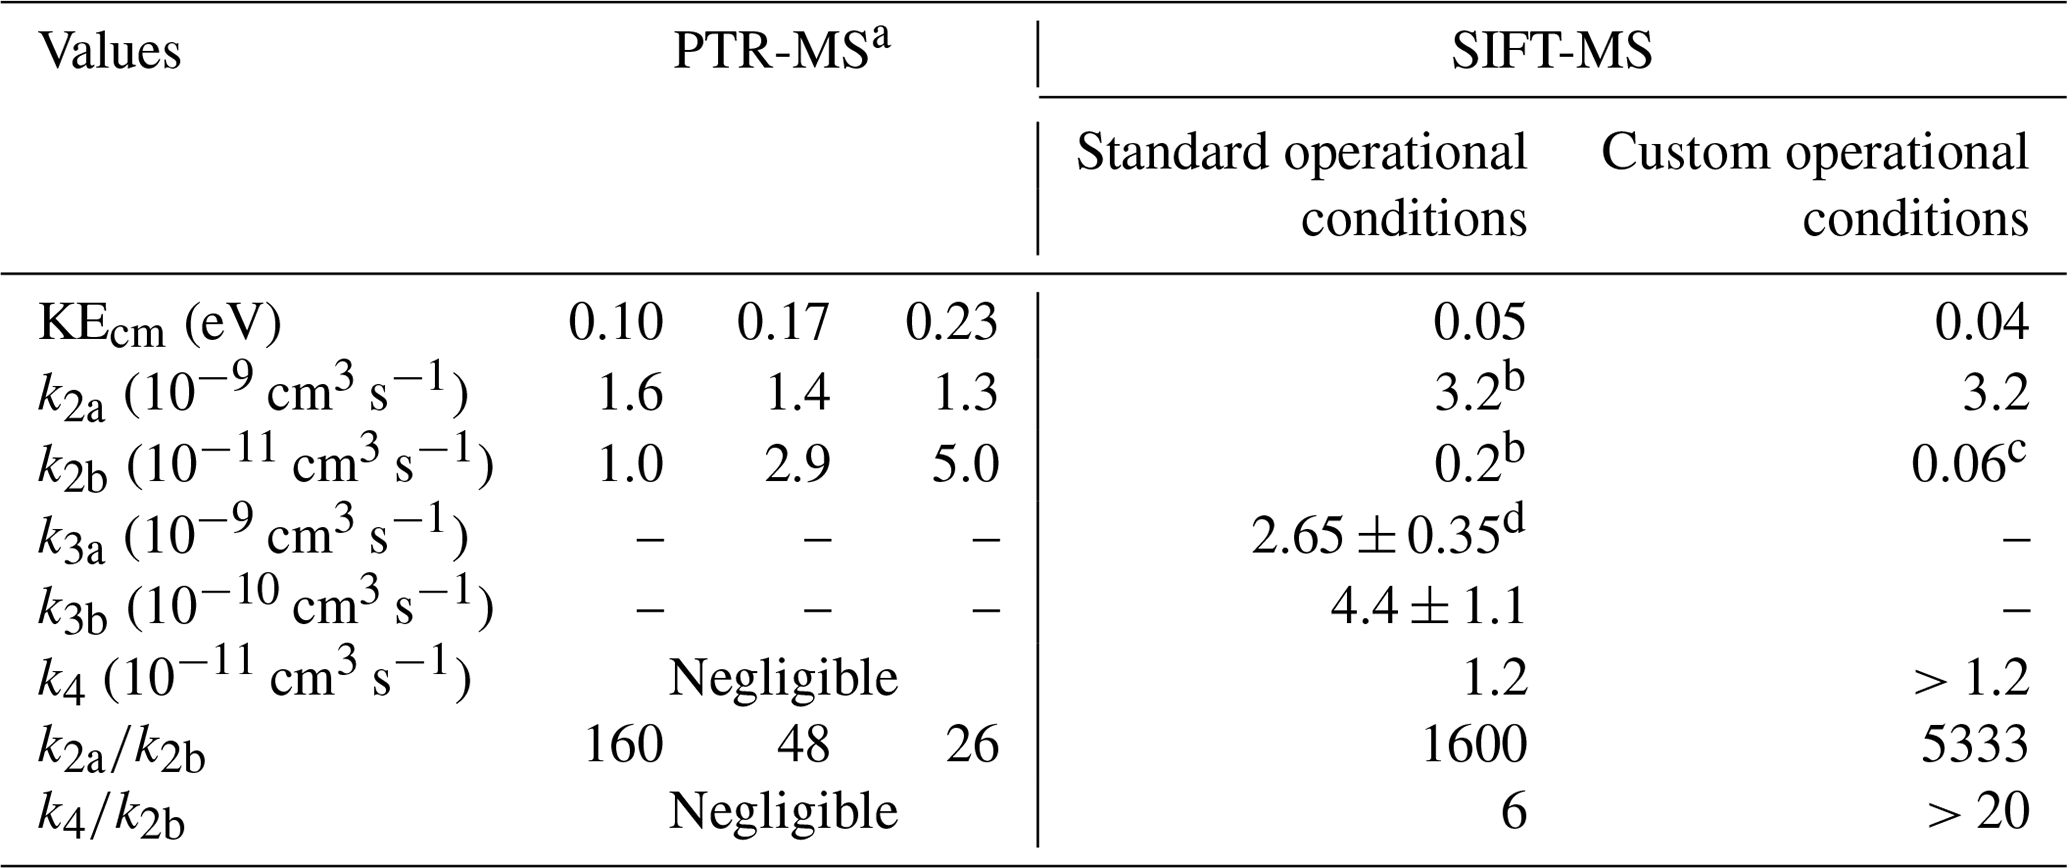
a Data retrieved from the work of Inomata et al. (2008). Authors extracted the k2a and k2b values, based on the work of Hansel et al. (1997). b Average value determined by Hansel et al. (1997). c Calculated by Bohme et al. (1979). d Average value in the literature from the studies of Bohme et al. (1979) and Midey et al. (2000). The error corresponds to the standard deviation of the measurements.
Ion chemistry involved in formaldehyde measurement with H3O+ precursor ion
The proton transfer reaction in the case of FM can occur according to the following reaction:
The rate coefficient of Reaction (R2a), k2a, is of the order of 3 × 10⁻⁹ cm3 s−1 at 297 ± 3 K (Michel et al., 2005; Table 3) and slightly dependent on KEcm.
However, due to the low exothermicity of Reaction (R2a), the back reaction is also possible, as follows:
Hansel et al. (1997) evidenced that Reaction (R2b) is strongly dependent on the KEcm values of reactants. The highest the KEcm of the protonated FM (FM-H+), the highest the probability for a successful collision. Thus, the rate coefficient of deprotonation reaction k2b increases. Table 3 summarizes the values of k2b for different KEcm used in PTR-MS studies and under SC or CC conditions of the SIFT-MS. Furthermore, Reaction (R2b) also depends on the concentration of water molecules when evaluating the response of the SIFT-MS and PTR-MS instruments as a function of RH. Therefore, the contribution of these two parameters, i.e., KEcm of reactants and water concentration inside the reaction tubes, may explain the contrasting behavior between the two instruments. In SIFT-MS, due to the low kinetic energy of the reactants, the protonation of FM is strongly favored. Indeed, the ratio is ca. 1600 and ca. 5300, respectively, under SCs and CCs. It has to be noted that an increase in the water concentration due to the RH variation in the analytes shows a negligible impact on the ratio. It can also be suggested that the higher ratio under CCs could explain the amplification by a factor of ca. 1.9 of the FM sensitivity compared to SCs. On the contrary, in the case of PTR-MS where higher kinetic energies are achieved, the relative ratio of remains below 160 and possibly goes down to 26. Thus, a substantial increase in the water concentration makes Reaction (R2b) more impactful, and the sensitivity of the instrument is strongly decreased.
Although solely the = 31 is used to monitor FM, in SIFT-MS other ion reactions can occur and form a protonated methyl hydroperoxide (PMH) complex with = 49 (Hansel et al., 1997). These ion reactions are not expected to occur in PTR-MS due to the high KEcm values. These reactions are strongly dependent on water concentrations in the flow tube, and they are competitive with Reactions (R2a) and (R2b). However, their contribution to the ion chemistry inside the flow tube of the SIFT-MS is expected to be of minor importance, especially under SCs. Indeed, under SCs, the calibration factor of FM is not impacted by increasing water concentration by almost 540 times (considering the ratios calculated under dry and 70 % of RH). However, since their occurrence cannot be excluded, and they could play a role for ratios above 0.55, these reactions are discussed in the following.
The protonation of FM can occur through ligand switching from the hydronium water cluster, H3O+•H2O, to form PMH through the following reaction:
At room temperature, the rate coefficient of this reaction has been estimated to be (2.65 ± 0.35) × 10−9 cm3 s−1, which is calculated from the average of the values in the literature (Bohme et al., 1979; Midey et al., 2000), and the error corresponds to the standard deviation of the measurements. The rate coefficient of the back Reaction (R3b) was estimated to be around 6 times lower (4.4 ± 1.1) × 10−10 cm3 s−1, as follows:
Reaction (R3) is expected to be highly sensitive to RH, i.e., the water concentrations in the flow tube. On the one hand, the increase in water concentration will increase the concentration of H3O+•H2O, enhancing Reaction (R3a). On the other hand, the excess of water compared to FM enhances Reaction (R3b). Therefore, the impact of Reaction (R3) in the ion chemistry occurring in the flow tube of SIFT-MS is linked with the relative ratio of . However, as mentioned above, under SCs, the calibration factor at 31 remains constant within the experimental uncertainties and the RH range studied (0 %–70 %), and thus, Reaction (R3) seems to have a insignificant impact on the sensitivity of the instrument. However, in case of CCs, where the is greater than 0.55, the gradual reduction in FM sensitivity could be due to the competition between Reactions (R2a) and (R3a).
An alternative pathway of the PMH formation is through Reaction (R4) in presence of a third body and water molecules, as follows:
Reaction (R4) is an association reaction competitive with Reaction (R2b) and depends on the total pressure of the reaction system and the kinetic energy of reactants. In the presence of a third body, the FM-H+ and water molecules can lose part of their energy through collisions and further stabilize to form PMH, increasing the rate coefficient of k4. Therefore, it is expected that the rate coefficient of this association reaction is enhanced with increasing pressure. Under a given pressure, k4 is reduced as KEcm increases because the third body fails to stabilize reactants. Hansel et al. (1997) have studied the pressure dependence of the rate coefficient k4 at 0.05 eV, i.e., with KEcm values similar to SIFT-MS SCs used in the present study. The rate coefficient of the ternary association at room temperature proposed by these authors was k4 = 5.7 × 10⁻²⁸ cm6 s−1. They concluded that, for KEcm greater than 0.06 eV, k4 is negligible compared to k2b. For that reason, this reaction is not taken into account in most of the PTR-MS studies. Nevertheless, Reaction (R4) could contribute to SIFT-MS response.
Indeed, we estimated that, under SCs and CCs of SIFT-MS, the binary rate coefficient of the association reaction at room temperature and the established pressures is greater than 1.2 × 10⁻¹¹ cm3 s−1 and, thus, higher than k2b (Table 3). This value is calculated as the product of k4 with the number density inside the flow tube of SIFT-MS. However, it remains around 260 times lower than FM protonation. At this point, it should be noted that the value of 1.2 × 10⁻¹¹ cm3 s−1 should be considered as un upper limit of the contribution of k4 reaction, since, under both SCs and CCs, the flow tube was operated above room temperature, and thus, a lower rate coefficient for k4 is anticipated (ternary association reactions decrease with increasing temperature). The importance of Reaction (R4) is expected to be enhanced at high water concentrations. Hansel et al. (1997) reported that k4 is increasing from dry conditions to low concentrations of water to reach a maximum value, and then it decreases with the extra addition of water due to Reaction (R3b), which is around 37 times faster than Reaction (R4). Note that the absolute values cannot be extrapolated from their data. To determine the role of Reaction (R4), it is essential to remember that it is competing with Reaction (R1) for hydronium ion formation. Although k1 has not been determined for the temperatures of 323 and 393 K, considering that H3O+ is in high excess compared to FM, Reaction (R1) is expected to be the dominant one.
Wrap up on formaldehyde determination
In the case of SIFT-MS, the ion chemistry of FM is mainly controlled by Reactions (R2a) and (R2b). The increased sensitivity observed under CC conditions is mainly linked to the higher values achieved compared with SCs. The low kinetic energy of reactants in the SIFT-MS flow tube is the reason why the sensitivity of the instrument is not significantly impacted by RH. This behavior contrasts with PTR-MS. Reactions (R3) and (R4), involving PMH production and inducing a lower sensitivity at the mass peak of 31, seem to be of minor importance or at least to be in an equilibrium state for below 0.55. Above that threshold, their occurrence could explain a lower sensitivity, but this point needs further investigation to be experimentally validated. The detection limit of FM is 450 ± 50 ppt under SCs. The CCs allow decreasing the detection limits of the SIFT MS instrument by a factor of ca. 4 for 0 %–50 % RH (100 ppt) and by a factor of 2 under 70 % RH (200 ppt; Table 2). These detection limits, based on a signal to noise ratio, = 3.3, are comparable to, or lower than, those reported in the PTR-MS studies that mentioned DLs between 200–500 ppt with = 2 (Inomata et al., 2008) and DLs of 100 ppt under dry and 300 ppt under humid conditions, using = 1 (Warneke et al., 2011), and close to the most performance spectroscopic techniques noting DLs at around 80 ppt (Catoire et al., 2012; Winkowski and Stacewicz, 2020).
3.3 Glyoxal determination with SIFT-MS
This section is dedicated to the evaluation of the performances of the SIFT-MS instrument to determine GL in the ppb range as a function of RH. To that end, SIFT-MS is operated under both SCs and CCs, with a focus on the chemistry of H3O+ and NO+ ions. Note that, O ion is not considered in the present study due to a significant fragmentation of the molecular GL induced by these ions and a subsequent lower sensitivity that is strongly impacted by RH.
3.3.1 Experimental calibration of glyoxal as a function of RH
Figure 4 displays a typical calibration experiment of GL deploying SIFT-MS under SCs and recording the mass peak of 59 (C2H3O), with H3O+ as precursor ion. A linear response (R2 > 0.999) of the instrument is noticed on the entire concentration range explored. The data points presented in Fig. 4 are obtained from two different GL syntheses and on 3 different days dispatched over 3 months. Table 4 summarizes the calibration factors and corresponding uncertainties retrieved for the mass peaks used to record GL under SCs and CCs.

Figure 4Calibration curves of GL at the 59 derived from the H3O+ precursor ion under dry conditions. The error bars on the y axis are 5 % (extreme value) and correspond to the 2σ standard deviation of the averaged value of the SIFT-MS signal for each measurement. The errors on the x axis are 8 % and correspond to the uncertainty given for the cross section value of GL (4 %) and other systematic uncertainties (in the flow of the mixture, sampling flow of the instrument, etc.) added in quadrature. Circles correspond to experiments carried out on different days (13 and 16 March 2020) from the same gas mixture. Squares correspond to experiments carried out almost 3 months later (5 June 2020) with a new gas mixture and synthesis of GL.
Table 4Calibration factors and relative ratios determined for GL under SCs and CCs at the 59 (C2H3O) and 88 (C2H2O2•NO+), using the H3O+ and NO+ precursor ions, respectively. The errors quoted correspond to the 2σ precision of the fit to obtain the calibration factors.
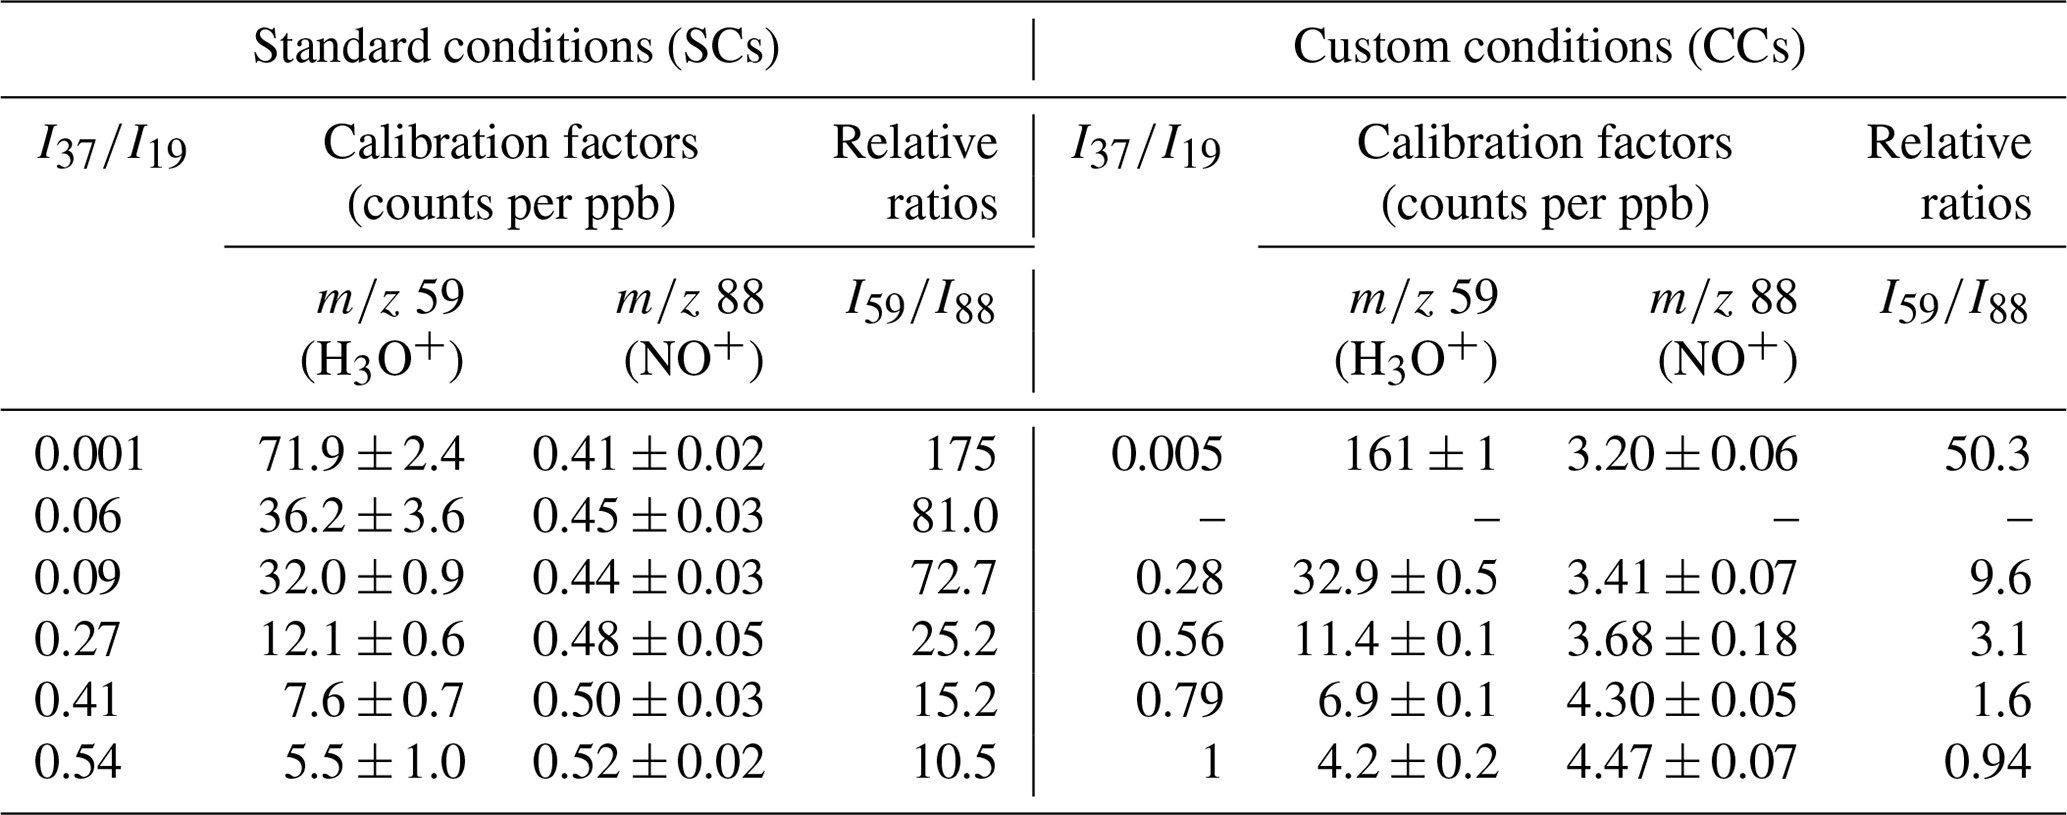
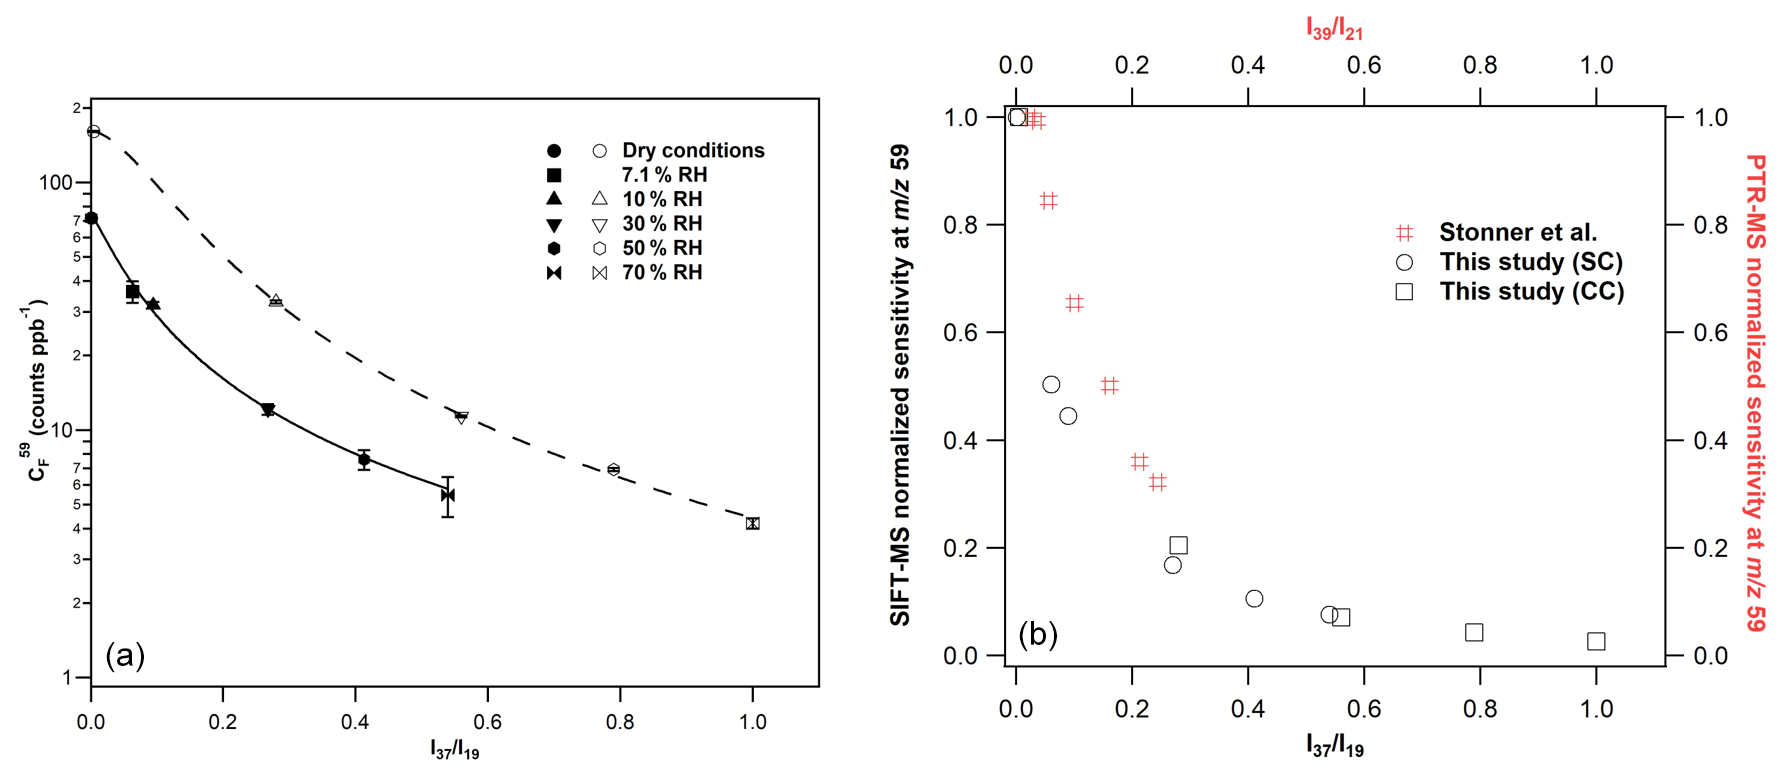
Figure 5(a) Calibration factors of GL at 59, derived from the H3O+ precursor ion under SC (filled symbols) and CC (open symbols) conditions. The errors quoted correspond to the 2σ precision of the fit to obtain the calibration factors. The lines are the fitting of calibration factors with the following empirical expression: , where, for SCs a = 2.99, b = 0.04, and c = 1.20 and CCs a = 4.53, b = 0.03, and c = 1.74. (b) GL normalized sensitivity at the mass peak of 59 of SIFT-MS (in black) and PTR-MS (in red) versus the and ratios. For SIFT-MS, the reduction in instrument sensitivity is similar for both SC and CC conditions. For comparison purposes, the data presented in Fig. 5 of Stönner et al. (2017) study were extracted and displayed in the graph. A steeper decrease in GL sensitivity is noticed with SIFT-MS at lower levels of humidity than PTR-MS.
Considering the H3O+ precursor ion and the mass peak of 59, an increase in the sensitivity of the instrument by a factor of 2 is noticed under CCs compared to SCs (left panel of Fig. 5). Note that a similar enhancement is observed for FM (Fig. 3 and Table 2). Nevertheless, the sensitivity is diminished with increasing RH under both SCs and CCs. To evaluate whether the impact of water to GL detection is similar under both operational conditions, we plotted the normalized sensitivity (calibration factor drycalibration factor humid) versus ratios, and the results are also displayed in Fig. 5 (right panel). It seems that the impact of water to the sensitivity of the instrument at the mass peak of 59 is similar for both SCs and CCs. The calibration factors were fitted versus the ratios, and the sensitivity of the instrument under SCs and CCs are given by the following expression:
where a = 2.99, b = 0.04, and c = 1.20 for SCs and a = 4.53, b = 0.03, and c = 1.74 for CCs, respectively.
Under dry conditions, the detection limits for GL at the mass peak of 59 are determined as 280 ± 30 and 120 ± 12 ppt for SCs and CCs, respectively, for 1 min integration time (Tables S1 and S2). Nevertheless, with the increase in relative humidity to 70 %, detection limits are increased up to 6 ± 1 ppb.
The detection of GL was also achieved using the NO+ precursor ion at the mass peak of 88. Table 4 displays the calibration factors determined. Under SCs, we noticed a weaker response of the instrument when using the NO+ precursor ion compared to H3O+ ion. Remarkably, the introduction of water had no significant impact on the sensitivity of the mass peak of 88. In fact, at the highest RH corresponding to = 0.54, the instrument was 20 % more sensitive than under dry conditions. Operating the instrument under CCs, increased the sensitivity at the mass peak of 88 by a factor of 8. Again, the introduction of water improved the detection of GL at the mass peak of 88 but by around 28 % this time. Interestingly, as displayed in Table 4 at high water concentrations, peak 88 is more sensitive than mass peak of 59.
3.3.2 Comparison of glyoxal determination between SIFT-MS and PTR-MS
There are only a few studies in the literature exploring the measurement of GL using PTR-MS. Thalman et al. (2015) performed a thorough inter-comparison study of spectrometric and spectroscopic techniques for the detection of GL in an atmospheric simulation chamber. In their experiments, the authors used concentrations of GL up to 32 ppb, but they were unable to detect GL with their PTR-MS, attesting of the low sensitivity of the instrument (Thalman et al., 2015). However, in the recent study of Stönner et al. (2017), GL was detected at low concentrations deploying an IONICON PTR-TOF-MS 8000 instrument. Interestingly, these authors observed a decreasing sensitivity of the PTR-MS instrument with the increasing water concentration, which is similar to our study. As can be seen in Fig. 5, the decrease in GL sensitivity at the mass peak of 59 is steeper in our SIFT-MS compared with PTR-MS (data are also presented in Table S3). Stönner et al. (2017), estimated the detection limits for GL at 250 ppt under dry and 700 ppt at the highest level of RH used.
Ion chemistry involved in glyoxal measurement with H3O+ precursor ion
Considering the ion chemistry of H3O+, the protonation of GL can occur through the following reaction:
The rate coefficient of Reaction (R5a), k5a, is 1.9 × 10⁻⁹ cm3 s−1 and is competitive with the hydronium formation (Reaction R1). Due to the low proton affinity of GL, the deprotonation reaction is expected to occur, as reported by Reaction (R5b), as follows:
The rate coefficient of Reaction (R5b) has not been determined in literature, and, similarly to Reaction (R2b), it could depend on KEcm. Considering this scenario, the increased sensitivity of the instrument under CCs could be due to higher relative ratios, which is similar to what is noticed for FM. The decreasing sensitivity of the SIFT-MS with an increasing water concentration could also be due to the competition between Reactions (R5a) and (R5b). In this case, Reaction (R5b) should be relatively fast, even under dry conditions. Its impact would be enhanced with the addition of water to the reaction system, leading to initial reactants. Note that Stönner at al. (2017) made a similar hypothesis to explain the decreased sensitivity with the water concentration of their PTR-MS.
Another plausible explanation for the decreasing sensitivity of the SIFT-MS at the mass peak of 59 with increasing RH could be Reaction (R6), which acts competitively with Reaction (R5a), due to the increase in water clustering in the flow tube of the SIFT-MS. Reaction (R6) leads to the formation of the mass peak with = 77.
To evaluate the effect of water clustering, the complete mass spectrum pattern of GL (concentration of 300 ppb) was recorded for all RH levels under SCs and CCs. Typical normalized spectra under CCs for dry and 50 % of RH are presented in Fig. S4. Note that the CC operational conditions enhance the water clustering due to the lower temperature and higher pressure in the flow tube (reflected also in the ratios). Under dry conditions, the main peak observed is the = 59. The intensity of the = 77 corresponds solely to 1 % of the peak at 59. Interestingly, a peak at = 31 was observed, corresponding to ca. 14 % of the peak at 59. Under 50 % of RH, the intensity of the mass peak of 59 is diminished, and the primary peak in the mass spectrum is the 31. However, the mass peak of 77 is not impacted by RH and has a similar absolute intensity with dry conditions. Therefore, our results clearly demonstrated that the decrease in the instrument sensitivity in the mass of 59 with the increasing RH is not due to water clustering, and thus Reaction (R6) has a negligible contribution to the sensitivity of our SIFT-MS.
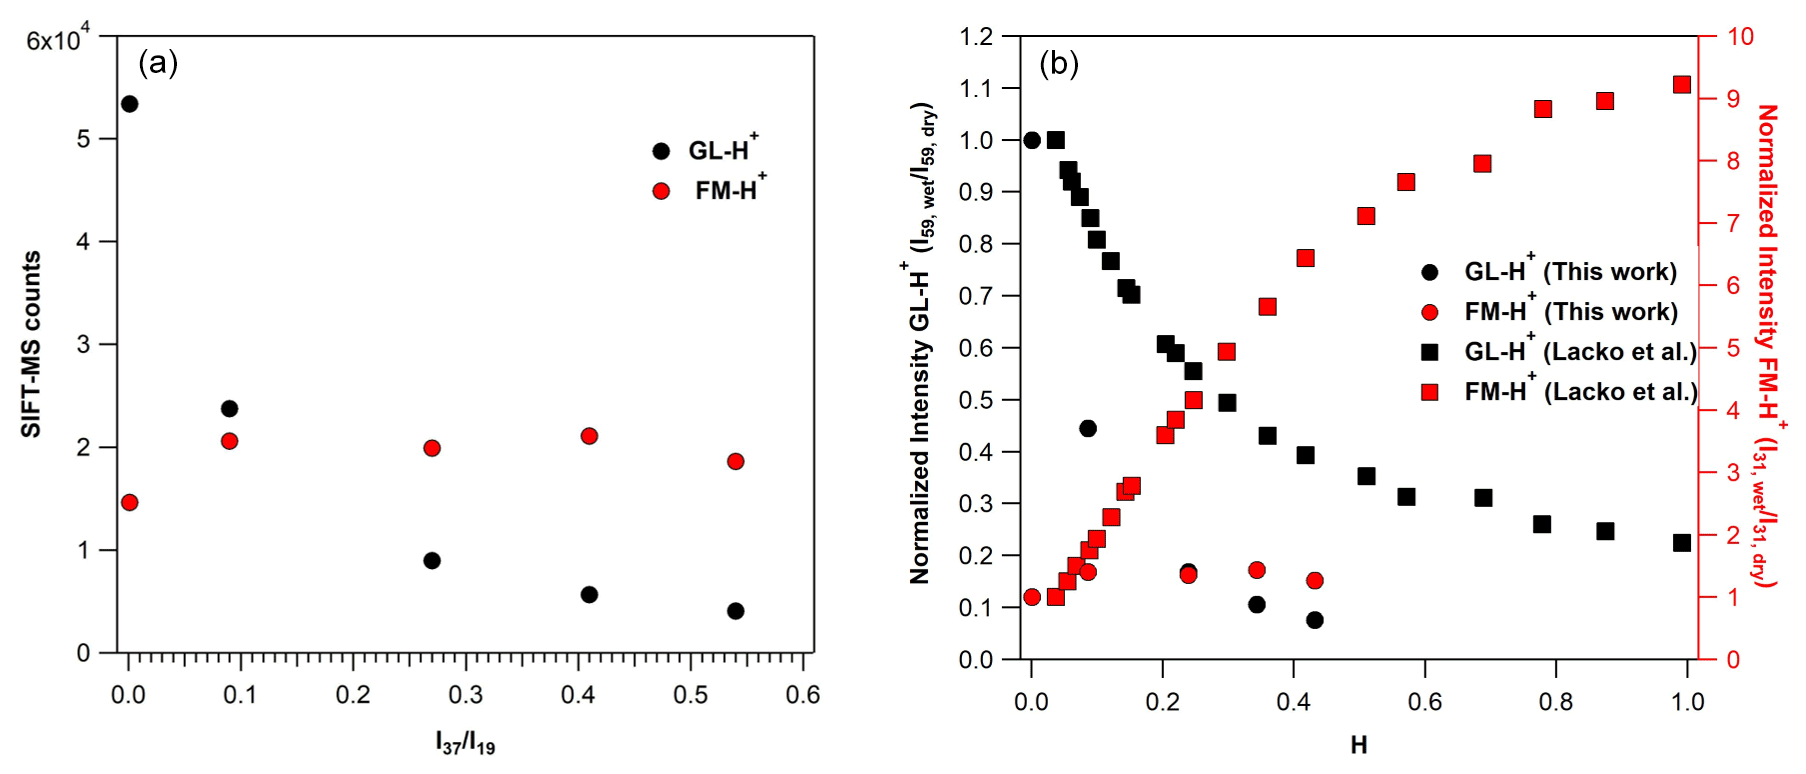
Figure 6(a) SIFT-MS counts at the mass peak of 59 (in black) of GL-H+ and the mass peak of 31 (in red) of FM-H+, recorded by SIFT-MS under SC conditions, using around 750 ppb of GL operating the instrument under SCs. (b) Normalized sensitivity at the mass peak of 59 (in black) of GL-H+ and the mass peak of 31 (in red) of FM-H+ recorded with SIFT-MS under SCs, based on the results of the current study (circles) and Lacko et al. (2020; squares; data extracted from their Fig. 3) versus the H value Eq. (3).
The observation of the mass peak of 31 in the mass spectrum of GL could arise from the fragmentation of protonated GL (C2H3O or GL-H+) to protonated FM (CH3O+ or FM-H+, with = 31) inside the flow tube. The latter has been observed in the drift tube of the PTR-MS used by Stönner et al. (2017). Authors report a considerably larger signal on FM-H+ than GL-H+. In a recent study, Lacko et al. (2020) studied the fragmentation of GL-H+ deploying a SIFT-MS. The authors evidenced the strong impact of water concentration on GL-H+ fragmentation, leading to FM-H+. Interestingly, they have not observed FM-H+ under dry conditions. Thus, the authors proposed that it should be formed only in the presence of water. Similar conclusions are reported by Michel et al. (2005). Finally, Lacko et al. (2020) combined their experimental observations with numerical modeling and proposed a sequence of reactions to explain the fragmentation of GL-H+ to FM-H+. The discussion of these reaction pathways is beyond the scope of this study. Nevertheless, to feed the discussion of the paper, we present them with the following simple expression reported by Reaction (R7):
In this study, we have further explored the possible fragmentation of GL-H+ to FM-H+. These experiments have been performed under both SCs and CCs. Note that our observations were found to be independent of the GL concentration introduced. First, we discuss our observations under SCs and then under CCs. The left panel of Fig. 6 displays the variation in the signals recorded for FM-H+ and GL-H+ with ratios. For comparison purposes, we present the normalized signals versus H factor as determined in the study of Lacko et al. (2020), i.e., Eq. (3), in the right panel of Fig. 6 (data are also given in Table S4).
Fragmentation of GL-H+ under SCs and dry conditions. In contrast with the work of Lacko et al. (2020), we observe the formation of FM-H+ even under dry conditions (Lacko et al., 2020).
The FM-H+ signal recorded corresponds to 27 % of GL-H+. Therefore, it is possible that, in our SIFT-MS, FM-H+ is formed through alternative pathways. We propose that, under our experimental conditions, GL-H+ can either thermally decompose inside the flow tube (operated at 393 K under SCs; Table 1) or fragmentizes through collisions with ions inside the flow tube, leading to FM-H+ Reaction (R8). Both pathways are expected to be enhanced at higher temperatures and higher KEcm. Note that GL-H+ thermal fragmentation is expected to be significantly lower in the system of Lacko et al. (2020), where the flow tube temperature was 300 K, and in the PTR-MS, where the drift tube temperature was set to 333 K and higher pressure (Stönner et al., 2017).
We expect that both the thermal decomposition and collision fragmentation pathways are independent of the water concentration inside the SIFT flow tube. At this point, it should be noted that possible thermal decomposition of molecular GL in the sample plate or inside the flow tube should be considered negligible. In particular, the most probable thermal decomposition pathway of molecular GL is through the following reaction (Saito et al., 1984):
The molecular FM could then react with H3O+ through Reaction (R2a) and lead to the formation of FM-H+. However, the energy barrier for the thermal decomposition of the lowest transition state to give products in Reaction (R9) is around 230 kJ mol−1 (Koch et al., 2001). Therefore, it is unlikely to occur at these temperatures and in our system. To further validate this point, we have performed a series of experiments introducing GL inside the optical cell of the FTIR spectrometer operated at 393 K and recording sequential spectra of GL for several hours. No thermal decomposition was noticed as previously reported in the literature (Feierabend et al., 2008).
Fragmentation of GL-H+ under SCs and humid conditions. By increasing the water concentration from dry conditions to 10 % of RH (corresponding to an increase by a factor of 90 to the ratios; Table 4), the signal of GL-H+ is reduced by 56 %, while the formation of FM-H+ is enhanced by 40 % (see also Fig. 6). This clearly shows that water plays a role in the formation of FM-H+, meaning that the reduced sensitivity of GL and the processes proposed by Lacko et al. (2020), Reaction (R7), are probably taking place. A further increase in the water concentrations in the flow tube had no impact on the formation FM-H+, but GL sensitivity is still reduced. Essentially, using SIFT-MS under SC conditions, the formation of FM-H+ is less impacted by water concentrations than in other studies in the literature. Indeed, as displayed in the right panel of Fig. 6, although the GL sensitivity loss is steeper in our study compared to Lacko et al. (2020), the corresponding formation of FM-H+ is substantially lower.
To conclude, under SC conditions, the fragmentation of GL-H+ to FM-H+ occurs in the flow tube of the SIFT-MS, but it is less impacted by water concentrations than PTR-MS. Alternatively, we propose that GL-H+ decomposes either thermally or through ion collisions, leading to FM-H+. Therefore, it seems that the abrupt loss of GL sensitivity with water concentrations is mainly due to the competition of Reactions (R5a) and (R5b). Especially under the temperature of 393 K, the deprotonation Reaction (R5b) is expected to be faster than room temperature and to play a more significant role than in the work of Lacko et al. (2020).
Fragmentation of GL-H+ under CCs and dry conditions. Under custom conditions (CCs) of the SIFT-MS, the formation of FM-H+ from the fragmentation of GL-H+, is also observed. Nevertheless, the ratio of FM-H+ to GL-H+ signals is significantly diminished. Indeed, under dry conditions the fragmentation is reduced from 27 % to ca. 14 % for SCs and CCs, respectively. This observation supports our previous hypothesis, which is that GL-H+ could decompose inside our SIFT-MS flow tube. Both the temperature decrease and pressure increase, changing from SCs to CCs, tend to suppress the decomposition of GL-H+.
Fragmentation of GL-H+ under CCs and humid conditions. A similar reduction in the fragmentation of GL-H+ was noticed in presence of water when comparing the signals recorded under SCs and CCs for equal to 0.27 ± 0.01 and 0.55 ± 0.01. As displayed in Fig. S3, the decreased sensitivity of GL is similar under both SCs and CCs. Note that Fig. S3 should be viewed as a way to compare the impact of water concentrations on the fragmentation of GL-H+ and the appearance of FM-H+. Essentially, the impact of water to the sensitivity of SIFT-MS to GL is independent of the operational conditions of the instrument. However, with the increase in water concentration inside the flow tube from dry conditions to a value of 0.28 for ratio (an increase by a factor of 56), the signal of FM-H+ increases by almost a factor of 3. Therefore, water plays a more important role for the presence of FM-H+ under CCs, and we anticipate that reactions proposed by Lacko et al. (2020) can dominate Reaction (R7). Further increase in the water concentration in the flow tube reduced the signal of FM-H+. Although this looks like a paradox and in contradiction with the abovementioned discussion, we suggest that this decrease is related to the competition between Reactions (R7) and (R8), i.e., the deprotonation reaction of FM-H+ Reaction (R2b). Nevertheless, a more thorough investigation is necessary to support this point.
Therefore, we propose that the increased sensitivity of the instrument under CCs is mainly due to higher ratios. The expected lower values of this ratio could explain the lower sensitivity to detecting GL in the presence of water. Nevertheless, the decreasing GL sensitivity with increasing RH could be also attributed to fragmentation of GL-H+ to FM-H+, which are both linked to thermal decomposition and reactions involving water molecules, as discussed by Lacko et al. (2020).
Ion chemistry involved in glyoxal measurement using NO+ precursor ion
The detection of GL in the flow tube of the SIFT-MS proceeds through the following reaction:
The rate coefficient measured at room temperature for Reaction (R10) is 8 × 10⁻¹¹ cm3 s−1 (Michel et al., 2005), i.e., around 24 times below the protonation reaction of GL Reaction (R5a). The latter could explain the reduced sensitivity at the mass peak of 88 compared to the mass of 59 under dry conditions. Furthermore, Reaction (R10) is a three-body association reaction. In an association process, an intermediate species is formed before the formation of the final products. The stability of this intermediate is both temperature and pressure dependent and determines the overall rate coefficient of the reaction. The increased sensitivity to the detection of GL under custom conditions is related to the temperature and pressure conditions existing in the flow tube. In particular, the decrease in the flow tube temperature, combined with a 20 % increase in the total pressure (from 0.65 to 0.85 Torr), resulted in a better stabilization of the adduct that leads to product formation for Reaction (R10) and, thus, improved sensitivity. Apparently, under our experimental conditions, the reaction of NO+ with GL is in the exponential part of a typical fall-off graph of an association reaction (Guimbaud et al., 2007).
The positive impact of water concentrations on the detection of GL at the mass peak of 88 could be linked with the formation of a H2O•NO+ hydrate cluster at the mass peak of 48. Indeed, we have observed an increase in the abundance of the cluster with increasing RH. The following reaction could be proposed:
Although the rate coefficient of Reaction (R10) has not been measured in the literature, it has been showed that the reactions of H2O•NO+ with several VOCs are just as fast as, or even faster than, those with NO+ ion (Michel et al., 2005). Mass scan spectra using the NO+ ion were also collected, but besides the mass peak of 88, no other peaks that could be attributed to GL were observed.
SIFT-MS appears to be a powerful and reliable analytical tool for the real-time quantification of FM in laboratory studies and outdoor/indoor field environments. Remarkably, under SCs, the sensitivity of the instrument is not impacted by RH with a corresponding detection limit of ca. 500 ppt. Operating the instrument under CCs increased the sensitivity; however, for above 0.58 the sensitivity is reduced and a correction factor should be applied. We recommend the operation of SIFT-MS under SCs for the measurement of ambient FM greater than 500 ppt. Furthermore, our strategy to operate the SIFT-MS instrument under different modes allowed us to shed light on the ion chemistry occurring in the flow tube and to identify the key reactions and processes that define the sensitivity of the instrument towards FM. A thorough comparison of our observations with the studies in the literature that are carried out with PTR-MS evidences that the strong decay of PTR-MS sensitivity with increasing RH is related to the application of the electrical field in the DRIFT tube. It enhances the rate coefficient of the deprotonation reaction of FM. Regarding GL, we have performed a detailed research on the ion chemistry related to H3O+ and NO+ ions. Regarding H3O+, we evidenced a sharp decrease in the instrument sensitivity with increasing RH, similar to previous PTR-MS and SIFT-MS studies, due to GL-H+ fragmentation. Nevertheless, based on our experimental observations, we propose alternative pathways of GL-H+ fragmentation, such as GL-H+ decomposition, which seems to be of greater importance than it has been considered previously in the literature. Based on the detection limits achieved with the H3O+ ion, we suggest that SIFT-MS is not able to monitor GL in outdoor ambient air due to the strong impact of RH on SIFT-MS sensitivity. It should be clarified that, as shown in Fig. 5, the fitting of calibration factors with ratio is feasible (see Fig. 5 caption), and thus the concentrations of glyoxal can be retrieved even under environments where the RH changes during the experiment by following the ratio. Therefore, the major limitation is the instrument sensitivity and not the variation in the RH of the ambient environment. On the contrary, SIFT-MS can be deployed efficiently in laboratory-scale studies (i.e., atmospheric simulation chambers and photochemical reactors) or indoor experimental rooms where GL concentrations are in the ppb range. In addition, we recommend that using the H3O+ ion for the monitoring of GL concentrations should be performed with great caution due to the strong RH dependence and contribution to the signal of FM-H+. Nevertheless, deploying the NO+ precursor ion for the monitoring of GL seems to be ideal since the sensitivity of the instrument is slightly impacted by RH. The GL detection limits using NO+ are in the ppb range; however, we evidence that the slight pressure increase in the flow tube of the instrument can result in a vigorous increase in instrument sensitivity. Certainly, our research on the NO+ chemistry opens new pathways for GL quantification and detection in ambient air deploying soft ionization techniques, such as PTR-MS with a NO+ ion, which are generally operated at higher pressures than SIFT-MS. Ultimately, our observations indicate that there is potential for sensitivity improvement for the SIFT-MS, and that it should be considered as a promising tool for the real-time monitoring of VOCs with low proton transfer affinity.
| CCs | Custom operational conditions of the SIFT-MS |
| Calibration factor of formaldehyde at the mass peak of 31 | |
| Calibration factor of glyoxal at the mass peak of 59 | |
| D | Internal diameter of the flow tube |
| DL | Detection limit |
| DNPH | Dinitrophenylhydrazine |
| DOAS | Differential optical absorption spectroscopy |
| EAR | Electron attachment reaction |
| ε | Distance for a full mixing of neutral molecules with the carrier gas in the flow tube |
| Fg | Carrier gas flow rate |
| Sample flow of pure water in the sample flow | |
| Ftotal | Total flow rate inside the flow tube |
| FVOC | Sample flow of pure VOC (formaldehyde or glyoxal) in the sample flow |
| FM | Formaldehyde |
| FM-H+ | Protonated formaldehyde |
| FTIR spectroscopy | Fourier transform infrared spectroscopy |
| GL | Glyoxal |
| GL-H+ | Protonated glyoxal |
| HPLC | High-performance liquid chromatography |
| IBBCEAS | Incoherent broadband cavity-enhanced absorption spectrometer |
| kB | Boltzmann constant |
| KEcm | Mean kinetic energy between reactants |
| KEion | Kinetic energy of ions |
| L | Length of the flow tube |
| m and M | Masses of the carrier gas and the neutral reactant, respectively |
| Mion | Mass of reactant ion |
| MFC | Mass flow controller |
| N | Molecular density in the flow tube |
| SCs | Standard operational conditions of the SIFT-MS |
| SIFT-MS | Selected ion flow tube mass spectrometer |
| SOA | Secondary aerosol formation |
| Pg | Pressure in flow tube |
| PMH | Protonated methyl hydroperoxide |
| PTR-MS | Proton transfer mass spectrometry |
| RH | Relative humidity |
| TDLAS | Tunable diode laser absorption spectrometer |
| tr | Reaction time inside the flow tube of the SIFT-MS |
| Tg | Flow tube temperature |
| νg | Carrier gas velocity |
| νi | Ions flow velocity |
| [H2O] | H2O concentration in the flow tube |
| [VOC] | VOC (i.e., formaldehyde or glyoxal) concentration in the flow tube |
All relevant data and supporting information have been provided in the Supplement.
The supplement related to this article is available online at: https://doi.org/10.5194/amt-15-2001-2022-supplement.
AGZ realized the experiments and did the data treatment with MNR. MNR and FT designed the experiments and wrote the paper.
The contact author has declared that neither they nor their co-authors have any competing interests.
Publisher’s note: Copernicus Publications remains neutral with regard to jurisdictional claims in published maps and institutional affiliations.
The authors would like to thank Vincent Gaudion, for the technical support, and the reactivity group (GT réactivité), for the fruitful discussions.
This work was achieved in the framework of CLIMDO project funded by ANR (grant no. ANR-19-CE01-0008), Labex CaPPA, funded by ANR through the PIA (grant no. ANR-11-LABX-0005-01), and CPER CLIMIBIO project, both funded by the Hauts-de-France Regional Council and the European Regional Development Fund (ERDF).
This paper was edited by Hendrik Fuchs and reviewed by two anonymous referees.
Allani, A., Bedjanian, Y., Papanastasiou, D. K., and Romanias, M. N.: Reaction Rate Coefficient of OH Radicals with d9-Butanol as a Function of Temperature, ACS Omega, 6, 18123–18134, https://doi.org/10.1021/acsomega.1c01942, 2021.
Atkinson, R.: Atmospheric Chemistry of VOCs and NOx, Atmos. Environ., 34, 2063–2101, https://doi.org/10.1016/S1352-2310(99)00460-4, 2000.
Ban-Weiss, G. A., McLaughlin, J. P., Harley, R. A., Kean, A. J., Grosjean, E., and Grosjean, D.: Carbonyl and Nitrogen Dioxide Emissions From Gasoline- and Diesel-Powered Motor Vehicles, Environ. Sci. Technol., 42, 3944–3950, https://doi.org/10.1021/es8002487, 2008.
Bernstein, R. S., Stayner, L. T., Elliott, L. J., Kimbrough, R., Falk, H., and Blade, L. E. O.: Inhalation Exposure to Formaldehyde: An Overview of Its Toxicology, Epidemiology, Monitoring, and Control, Am. Ind. Hyg, 45, 778–785, https://doi.org/10.1080/15298668491400601, 1984.
Bierbaum, V. M., Golde, M. F., and Kaufman, F.: Flowing Afterglow Studies of Hydronium Ion Clustering Including Diffusion Effects, J. Chem. Phys., 65, 2715–2724, https://doi.org/10.1063/1.433415, 1976.
Bohme, D. K., Mackay, G. I., and Tanner, S. D.: An Experimental Study of the Gas-Phase Kinetics of Reactions with Hydrated Hydronium(1+) Ions(n = 1–3) at 298 K, J. Am. Chem. Soc., 101, 3724–3730, https://doi.org/10.1021/ja00508a003, 1979.
Bolden, R. C. and Twiddy, N. D.: A Flowing Afterglow Study of Water Vapour, Faraday Discuss. Chem. Soc., 53, 192–200, https://doi.org/10.1039/DC9725300192, 1972.
Caron, A., Redon, N., Thevenet, F., Hanoune, B., and Coddeville, P.: Performances and limitations of electronic gas sensors to investigate an indoor air quality event, Build. Environ., 107, 19–28, https://doi.org/10.1016/j.buildenv.2016.07.006, 2016.
Caron, F., Guichard, R., Robert, L., Verriele, M., and Thevenet, F.: Behaviour of individual VOCs in indoor environments: How ventilation affects emission from materials, Atmos. Environ., 243, 117713, https://doi.org/10.1016/j.atmosenv.2020.117713, 2020.
Catoire, V., Bernard, F., Mébarki, Y., Mellouki, A., Eyglunent, G., Daële, V., and Robert, C.: A Tunable Diode Laser Absorption Spectrometer for Formaldehyde Atmospheric Measurements Validated by Simulation Chamber Instrumentation, J. Environ. Sci., 24, 22–33, https://doi.org/10.1016/S1001-0742(11)60726-2, 2012.
Coburn, S., Ortega, I., Thalman, R., Blomquist, B., Fairall, C. W., and Volkamer, R.: Measurements of diurnal variations and eddy covariance (EC) fluxes of glyoxal in the tropical marine boundary layer: description of the Fast LED-CE-DOAS instrument, Atmos. Meas. Tech., 7, 3579–3595, https://doi.org/10.5194/amt-7-3579-2014, 2014.
Crump, D. R., Squire, R. W., and Yu, C. W. F.: Sources and Concentrations of Formaldehyde and Other Volatile Organic Compounds in the Indoor Air of Four Newly Built Unoccupied Test Houses, Indoor Built Environ., 6, 45–55, https://doi.org/10.1177/1420326x9700600106, 1997.
Feierabend, K. J., Zhu, L., Talukdar, R. K., and Burkholder, J. B.: Rate Coefficients for the OH + HC(O)C(O)H (Glyoxal) Reaction between 210 and 390 K, J. Phys. Chem. A., 112, 73–82, https://doi.org/10.1021/jp0768571, 2008.
Fu, T.-M., Jacob, D. J., Wittrock, F., Burrows, J. P., Vrekoussis, M., and Henze, D. K.: Global Budgets of Atmospheric Glyoxal and Methylglyoxal, and Implications for Formation of Secondary Organic Aerosols, J. Geophys. Res.-Atmos., 113, D15303, https://doi.org/10.1029/2007JD009505, 2008.
Gómez Alvarez, E., Moreno, M. V., Gligorovski, S., Wortham, H., and Cases, M. V.: Characterisation and Calibration of Active Sampling Solid Phase Microextraction Applied to Sensitive Determination of Gaseous Carbonyls, Talanta, 88, 252–258, https://doi.org/10.1016/j.talanta.2011.10.039, 2012.
Grosjean, D., Grosjean, E., and Gertler, A. W.: On-Road Emissions of Carbonyls from Light-Duty and Heavy-Duty Vehicles, Environ. Sci. Technol, 35, 45–53, https://doi.org/10.1021/es001326a, 2001.
Guimbaud, C., Catoire, V., Bergeat, A., Michel, E., Schoon, N., Amelynck, C., Labonnette, D., and Poulet, G.: Kinetics of the reactions of acetone and glyoxal with O2+ and NO+ ions and application to the detection of oxygenated volatile organic compounds in the atmosphere by chemical ionization mass spectrometry, I. J. Mass Spectrom., 263, 276–288, https://doi.org/10.1016/j.ijms.2007.03.006, 2007.
Hansel, A., Singer, W., Wisthaler, A., Schwarzmann, M., and Lindinger, W.: Energy Dependencies of the Proton Transfer Reactions H3O+ + CH2O ⇔ CH2OH+ + H2O, Int. J. Mass Spectrom. Ion Process, 167–168, 697–703, https://doi.org/10.1016/S0168-1176(97)00128-6, 1997.
Hays, M. D., Geron, C. D., Linna, K. J., Smith, N. D., and Schauer, J. J.: Speciation of Gas-Phase and Fine Particle Emissions from Burning of Foliar Fuels, Environ. Sci. Technol., 36, 2281–2295, https://doi.org/10.1021/es0111683, 2002.
Inomata, S., Tanimoto, H., Kameyama, S., Tsunogai, U., Irie, H., Kanaya, Y., and Wang, Z.: Technical Note: Determination of formaldehyde mixing ratios in air with PTR-MS: laboratory experiments and field measurements, Atmos. Chem. Phys., 8, 273–284, https://doi.org/10.5194/acp-8-273-2008, 2008.
Kaiser, J., Wolfe, G. M., Bohn, B., Broch, S., Fuchs, H., Ganzeveld, L. N., Gomm, S., Häseler, R., Hofzumahaus, A., Holland, F., Jäger, J., Li, X., Lohse, I., Lu, K., Prévôt, A. S. H., Rohrer, F., Wegener, R., Wolf, R., Mentel, T. F., Kiendler-Scharr, A., Wahner, A., and Keutsch, F. N.: Evidence for an unidentified non-photochemical ground-level source of formaldehyde in the Po Valley with potential implications for ozone production, Atmos. Chem. Phys., 15, 1289–1298, https://doi.org/10.5194/acp-15-1289-2015, 2015.
Kean, A. J., Grosjean, E., Grosjean, D., and Harley, R. A.: On-Road Measurement of Carbonyls in California Light-Duty Vehicle Emissions, Environ. Sci. Technol, 35, 4198–4204, https://doi.org/10.1021/es010814v, 2001.
Kefauver, S. C., Filella, I., and Peñuelas, J.: Remote Sensing of Atmospheric Biogenic Volatile Organic Compounds (BVOCs) via Satellite-Based Formaldehyde Vertical Column Assessments, Int. J. Remote Sens., 35, 7519–7542, https://doi.org/10.1080/01431161.2014.968690, 2014.
Kim, K.-H., Jahan, S. A., and Lee, J.-T.: Exposure to Formaldehyde and Its Potential Human Health Hazards, J. Environ. Sci. Health C, 29, 277–299, https://doi.org/10.1080/10590501.2011.629972, 2011.
Koch, D. M., Khieu, N. H., and Peslherbe, G. H.: Ab Initio Studies of the Glyoxal Unimolecular Dissociation Pathways, J. Phys. Chem. A., 105, 3598–3604, https://doi.org/10.1021/jp0039013, 2001.
Lacko, M., Piel, F., Mauracher, A., and Španěl, P.: Chemical Ionization of Glyoxal and Formaldehyde with H3O+ Ions using SIFT-MS Under Variable System Humidity, Phys. Chem. Chem. Phys., 22, 10170–10178, https://doi.org/10.1039/D0CP00297F, 2020.
Langer, S., Bekö, G., Bloom, E., Widheden, A., and Ekberg, L.: Indoor air quality in passive and conventional new houses in Sweden, Build. Environ., 93, 92–100, https://doi.org/10.1016/j.buildenv.2015.02.004, 2015.
Lee, M., Heikes, B. G., Jacob, D. J., Sachse, G., and Anderson, B.: Hydrogen Peroxide, Organic Hydroperoxide, and Formaldehyde as Primary Pollutants from Biomass Burning, J. Geophys. Res.-Atmos., 102, 1301–1309, https://doi.org/10.1029/96JD01709, 1997.
Li, Z., Schwier, A. N., Sareen, N., and McNeill, V. F.: Reactive processing of formaldehyde and acetaldehyde in aqueous aerosol mimics: surface tension depression and secondary organic products, Atmos. Chem. Phys., 11, 11617–11629, https://doi.org/10.5194/acp-11-11617-2011, 2011.
Liggio, J., Li, S.-M., and McLaren, R.: Reactive Uptake of Glyoxal by Particulate Matter, J. Geophys. Res.-Atmos., 110, D10304, https://doi.org/10.1029/2004JD005113, 2005.
Liu, J., Li, X., Yang, Y., Wang, H., Wu, Y., Lu, X., Chen, M., Hu, J., Fan, X., Zeng, L., and Zhang, Y.: An IBBCEAS system for atmospheric measurements of glyoxal and methylglyoxal in the presence of high NO2 concentrations, Atmos. Meas. Tech., 12, 4439–4453, https://doi.org/10.5194/amt-12-4439-2019, 2019.
Liu, W., Zhang, J., Zhang, L., Turpin, B. J., Weisel, C. P., Morandi, M. T., Stock, T. H., Colome, S., and Korn, L. R.: Estimating contributions of indoor and outdoor sources to indoor carbonyl concentrations in three urban areas of the United States, Atmos. Environ., 40, 2202–2214, https://doi.org/10.1016/j.atmosenv.2005.12.005, 2006.
Lu, X.-W., Jiang, L.-X., Liu, J., Yang, Y., Liu, Q.-Y., Ren, Y., Li, X., and He, S.-G.: Sensitive Detection of Gas-Phase Glyoxal by Electron Attachment Reaction Ionization Mass Spectrometry, Anal. Chem., 91, 12688–12695, https://doi.org/10.1021/acs.analchem.9b02029, 2019.
Luecken, D. J., Hutzell, W. T., Strum, M. L., and Pouliot, G. A.: Regional Sources of Atmospheric Formaldehyde and Acetaldehyde, and Implications for Atmospheric Modeling, Atmos. Environ., 47, 477–490, https://doi.org/10.1016/j.atmosenv.2011.10.005, 2012.
Mahajan, A. S., Prados-Roman, C., Hay, T. D., Lampel, J., Pöhler, D., Groâmann, K., Tschritter, J., Frieß, U., Platt, U., Johnston, P., Kreher, K., Wittrock, F., Burrows, J. P., Plane, J. M. C., and Saiz-Lopez, A.: Glyoxal Observations in the Global Marine Boundary Layer, J. Geophys. Res.-Atmos., 119, 6160–6169, https://doi.org/10.1002/2013JD021388, 2014.
Michel, E., Schoon, N., Amelynck, C., Guimbaud, C., Catoire, V., and Arijs, E.: A Selected Ion Flow Tube Study of the Reactions of H3O+, NO+ and O with Methyl Vinyl Ketone and Some Atmospherically Important Aldehydes, Int. J. Mass Spectrom., 244, 50–59, https://doi.org/10.1016/j.ijms.2005.04.005, 2005.
Midey, A. J., Arnold, S. T., and Viggiano, A. A.: Reactions of H3O+(H2O)n with Formaldehyde and Acetaldehyde, J. Phys. Chem. A., 104, 2706–2709, https://doi.org/10.1021/jp993797t, 2000.
Myriokefalitakis, S., Vrekoussis, M., Tsigaridis, K., Wittrock, F., Richter, A., Brühl, C., Volkamer, R., Burrows, J. P., and Kanakidou, M.: The influence of natural and anthropogenic secondary sources on the glyoxal global distribution, Atmos. Chem. Phys., 8, 4965–4981, https://doi.org/10.5194/acp-8-4965-2008, 2008.
Osseiran, N., Romanias, M. N., Gaudion, V., Angelaki, M. E., Papadimitriou, V. C., Tomas, A., Coddeville, P., and Thevenet, F.: Development and Validation of a Thermally Regulated Atmospheric Simulation Chamber (THALAMOS): A Versatile Tool to Simulate Atmospheric Processes, J. Environ. Sci., 95, 141–154, https://doi.org/10.1016/j.jes.2020.03.036, 2020.
Rossignol, S., Aregahegn, K. Z., Tinel, L., Fine, L., Nozière, B., and George, C.: Glyoxal Induced Atmospheric Photosensitized Chemistry Leading to Organic Aerosol Growth, Environ. Sci. Technol., 48, 3218–3227, https://doi.org/10.1021/es405581g, 2014.
Saito, K., Kakumoto, T., and Murakami, I.: Thermal Unimolecular Decomposition of Glyoxal, J. Phys. Chem., 88, 1182–1187, https://doi.org/10.1021/j150650a033, 1984.
Salter, R. J., Blitz, M. A., Heard, D. E., Kovács, T., Pilling, M. J., Rickard, A. R., and Seakins, P. W.: Quantum yields for the photolysis of glyoxal below 350 nm and parameterisations for its photolysis rate in the troposphere, Phys. Chem. Chem. Phys., 15, 4984–4994, https://doi.org/10.1039/C3CP43597K, 2013.
Salthammer, T.: Formaldehyde Sources, Formaldehyde Concentrations and Air Exchange Rates in European Housings, Build. Environ., 150, 219–232, https://doi.org/10.1016/j.buildenv.2018.12.042, 2019.
Sinreich, R., Coburn, S., Dix, B., and Volkamer, R.: Ship-based detection of glyoxal over the remote tropical Pacific Ocean, Atmos. Chem. Phys., 10, 11359–11371, https://doi.org/10.5194/acp-10-11359-2010, 2010.
Smith, D. and Adams, N. G.: The Selected Ion Flow Tube (Sift): Studies of Ion-Neutral Reactions, in: Adv. At. Mol. Phys., edited by: Bates, D. and Bederson, B., Academic Press, 1–49, https://doi.org/10.1016/S0065-2199(08)60229-8, 1988.
Smith, D. and Španěl, P.: Selected Ion Flow Tube Mass Spectrometry (SIFT-MS) for On-line Trace Gas Analysis, Mass Spectrom. Rev., 24, 661–700, https://doi.org/10.1002/mas.20033, 2005.
Španěl, P. and Smith, D.: Selected Ion Flow Tube: a Technique for Quantitative Trace Gas Analysis of Air and Breath, Med. Biol. Eng. Comput., 34, 409–419, https://doi.org/10.1007/BF02523843, 1996.
Španěl, P. and Smith, D.: Quantitative Selected Ion Flow Tube Mass Spectrometry: The Influence of Ionic Diffusion and Mass Discrimination, J. Am. Soc. Mass Spectrom., 12, 863–872, https://doi.org/10.1016/S1044-0305(01)00253-7, 2001.
Stönner, C., Derstroff, B., Klüpfel, T., Crowley, J. N., and Williams, J.: Glyoxal Measurement with a Proton Transfer Reaction Time of Flight Mass Spectrometer (PTR-TOF-MS): Characterization and Calibration, J. Mass Spectrom., 52, 30–35, https://doi.org/10.1002/jms.3893, 2017.
Thalman, R., Baeza-Romero, M. T., Ball, S. M., Borrás, E., Daniels, M. J. S., Goodall, I. C. A., Henry, S. B., Karl, T., Keutsch, F. N., Kim, S., Mak, J., Monks, P. S., Muñoz, A., Orlando, J., Peppe, S., Rickard, A. R., Ródenas, M., Sánchez, P., Seco, R., Su, L., Tyndall, G., Vázquez, M., Vera, T., Waxman, E., and Volkamer, R.: Instrument intercomparison of glyoxal, methyl glyoxal and NO2 under simulated atmospheric conditions, Atmos. Meas. Tech., 8, 1835–1862, https://doi.org/10.5194/amt-8-1835-2015, 2015.
Thevenet, F., Verriele, M., Harb, P., Thlaijeh, S., Brun, R., Nicolas, M., and Angulo-Milhem, S.: The indoor fate of terpenes: Quantification of the limonene uptake by materials, Build. Environ., 188, 107433, https://doi.org/10.1016/j.buildenv.2020.107433, 2021.
Vlasenko, A., Macdonald, A. M., Sjostedt, S. J., and Abbatt, J. P. D.: Formaldehyde measurements by Proton transfer reaction – Mass Spectrometry (PTR-MS): correction for humidity effects, Atmos. Meas. Tech., 3, 1055–1062, https://doi.org/10.5194/amt-3-1055-2010, 2010.
Volkamer, R., Spietz, P., Burrows, J., and Platt, U.: High-Resolution Absorption Cross-Section of Glyoxal in the UV–vis and IR Spectral Ranges, J. Photochem. Photobiol. A, 172, 35–46, https://doi.org/10.1016/j.jphotochem.2004.11.011, 2005.
Volkamer, R., San Martini, F., Molina, L. T., Salcedo, D., Jimenez, J. L., and Molina, M. J.: A Missing Sink for Gas-Phase Glyoxal in Mexico City: Formation of Secondary Organic Aerosol, Geophys. Res. Lett, 34, L19807, https://doi.org/10.1029/2007GL030752, 2007.
Warneke, C., Veres, P., Holloway, J. S., Stutz, J., Tsai, C., Alvarez, S., Rappenglueck, B., Fehsenfeld, F. C., Graus, M., Gilman, J. B., and de Gouw, J. A.: Airborne formaldehyde measurements using PTR-MS: calibration, humidity dependence, inter-comparison and initial results, Atmos. Meas. Tech., 4, 2345–2358, https://doi.org/10.5194/amt-4-2345-2011, 2011.
Winkowski, M. and Stacewicz, T.: Optical Detection of Formaldehyde in Air in the 3.6 µm Range, Biomed. Opt. Express, 11, 7019–7031, https://doi.org/10.1364/BOE.405384, 2020.
Wisthaler, A., Apel, E. C., Bossmeyer, J., Hansel, A., Junkermann, W., Koppmann, R., Meier, R., Müller, K., Solomon, S. J., Steinbrecher, R., Tillmann, R., and Brauers, T.: Technical Note: Intercomparison of formaldehyde measurements at the atmosphere simulation chamber SAPHIR, Atmos. Chem. Phys., 8, 2189–2200, https://doi.org/10.5194/acp-8-2189-2008, 2008.
Wróblewski, T., Ziemczonek, L., Alhasan, A. M., and Karwasz, G. P.: Ab Initio and Density Functional Theory Calculations of Proton Affinities for Volatile Organic Compounds, Eur. Phys. J. Spec. Top., 144, 191–195, https://doi.org/10.1140/epjst/e2007-00126-7, 2007.
Xiao, Y., Jacob, D. J., and Turquety, S.: Atmospheric Acetylene and its Relationship with CO as an Indicator of Air Mass Age, J. Geophys. Res.-Atmos., 112, D12305, https://doi.org/10.1029/2006JD008268, 2007.
Yuan, B., Koss, A. R., Warneke, C., Coggon, M., Sekimoto, K., and de Gouw, J. A.: Proton-Transfer-Reaction Mass Spectrometry: Applications in Atmospheric Sciences, Chem. Rev., 117, 13187–13229, https://doi.org/10.1021/acs.chemrev.7b00325, 2017.