the Creative Commons Attribution 4.0 License.
the Creative Commons Attribution 4.0 License.
 | 05 Apr 2022
Enhancing MAX-DOAS atmospheric state retrievals by multispectral polarimetry – studies using synthetic data
Jan-Lukas Tirpitz
Udo Frieß
Robert Spurr
Ulrich Platt
Ground-based multi-axis differential optical absorption spectroscopy (MAX-DOAS) is a widely used measurement technique for the remote detection of atmospheric aerosol and trace gases. The technique relies on the analysis of ultra-violet and visible radiation spectra of scattered sunlight (skylight) to obtain information on different atmospheric parameters. From an appropriate set of spectra recorded under different viewing directions (typically a group of observations at different elevation angles) the retrieval of aerosol and trace gas vertical distributions is achieved through numerical inversion methods.
It is well known that the polarisation state of skylight is particularly sensitive to atmospheric aerosol content as well as aerosol properties and that polarimetric measurements could therefore provide additional information for MAX-DOAS profile retrievals; however, such measurements have not yet been used for this purpose. To address this issue, we have developed the RAPSODI (Retrieval of Atmospheric Parameters from Spectroscopic Observations using DOAS Instruments) algorithm. In contrast to existing MAX-DOAS algorithms, it can process polarimetric information, and it can retrieve simultaneously profiles of aerosols and various trace gases at multiple wavelengths in a single retrieval step; a further advantage is that it contains a Mie scattering model, allowing for the retrieval of aerosol microphysical properties. The forward-model component in RAPSODI is based on a linearised vector radiative transfer model with Jacobian facilities, and we have used this model to create a database of synthetic measurements in order to carry out sensitivity analyses aimed at assessing the potential of polarimetric MAX-DOAS observations. We find that multispectral polarimetry significantly enhances the sensitivity, particularly to aerosol-related quantities. Assuming typical viewing geometries, the degrees of freedom for signal (DOFS) increase by about 50 % and 70 % for aerosol vertical distributions and aerosol properties, respectively, and by approximately 10 % for trace gas vertical profiles. For an idealised scenario with a horizontally homogeneous atmosphere, our findings predict an improvement in the inversion results' accuracy (root-mean-square deviations to the true values) of about 60 % for aerosol vertical column densities (VCDs) as well as for aerosol surface concentrations and by 40 % for aerosol properties. For trace gas VCDs, very little improvement is apparent, although the accuracy of trace gas surface concentrations improves by about 50 %.
- Article
(2939 KB) - Full-text XML
-
Supplement
(1341 KB) - BibTeX
- EndNote


Multi-axis differential optical absorption spectroscopy (MAX-DOAS) (e.g. Hönninger and Platt, 2002; Hönninger et al., 2004; Wagner et al., 2004, 2011; Heckel et al., 2005; Frieß et al., 2006; Platt and Stutz, 2008; Irie et al., 2008; Clémer et al., 2010; Vlemmix et al., 2015) is a versatile passive remote sensing technique for the simultaneous detection of aerosol and trace gases. The typical MAX-DOAS instrument (see also Sect. 2) consists of a motorised telescope and a spectrometer unit measuring ultraviolet (UV) and visible (Vis) radiation spectra of scattered sunlight in different viewing directions (multi-axis). The spectra are analysed using differential optical absorption spectroscopy (DOAS, Platt and Stutz, 2008) to obtain information on different atmospheric parameters, integrated over the effective light path from the top of the atmosphere (TOA) to the instrument. From these spectra, one can retrieve tropospheric aerosol and trace gas vertical distributions as well as aerosol properties by applying inverse modelling approaches using dedicated retrieval algorithms. Throughout this study we focus on the ground-based application of MAX-DOAS. It is widely used, not least because it allows us to measure the atmospheric state with modest financial and logistical effort and with relatively simple instrumentation.
Due to limitations in instrument design and retrieval algorithm applicability, MAX-DOAS measurements at present do not exploit the full information contained in skylight observations. For instance, information from broadband spectral features, inelastic scattering, and saturation effects is either ignored or at best partially included in retrievals. Most important for this study, however, is the information contained in the light's polarisation state and its spectral dependence. It has largely been ignored (apart from a few investigations e.g. by Seidler, 2008, and Bernal, 2017), even though it is well known that its consideration enhances the sensitivity of passive remote sensing to aerosol abundances and properties (e.g. Herman et al., 1971; Mishchenko and Travis, 1997; Boesche et al., 2006; Hasekamp and Landgraf, 2007; Hansen and Travis, 1974). Indeed, polarimetry has been extensively utilised in recent decades for aerosol detection with radiometers/polarimeters, most prominently in the Aerosol Robotic Network (AERONET Holben et al., 1998; Li et al., 2009) and the POLarization and Directionality of Earth's Reflectances (POLDER) satellite instrument (Deschamps et al., 1994). Such polarimeters derive aerosol abundances and properties from measurements of the polarisation state and absolute radiance of direct and scattered solar radiation at low spectral resolution (applying narrow-band optical bandpass filters at a few individual wavelengths typically covering a spectral range from approximately 400 to 1000 nm).
Despite these advances within the radiometer community, the application of polarimetry for MAX-DOAS measurements comes with fundamentally new aspects, challenges, and possibilities arising from crucial differences between the MAX-DOAS technique and radiometer observations. Firstly, MAX-DOAS instruments are typically not radiometrically calibrated and therefore do not provide absolute radiances. Instead, observations performed at different viewing directions are evaluated against each other to obtain differential quantities (see also Sect. 2.2). Compared to radiometers, this process significantly simplifies the instrumental set-up and calibration and improves long-term stability; however, it comes with a certain loss of information from the measurements. Secondly, MAX-DOAS focusses on the detection of atmospheric trace gases with characteristic narrow-band absorption features that require much higher spectral resolution (≈1 nm; see also Sect. 2.1) than the coarser spectral bands typical of radiometers. Information on atmospheric aerosols is primarily required to confine the radiative transport. It is not inferred from radiance measurements, but indirectly by analysing narrow-band absorption features of proxy gases with well-known vertical distributions (e.g. the oxygen collision complex O4; see also Sect. 2.3; (Wagner et al., 2004; Frieß et al., 2006)).
The major aim of this study is to assess the potential of polarimetry for the retrieval of trace gas and aerosol vertical distributions as well as aerosol properties from ground-based MAX-DOAS observations. For this purpose we have developed a novel MAX-DOAS inversion algorithm called RAPSODI (Retrieval of Atmospheric Parameters from Spectroscopic Observations using DOAS Instruments) with the capability to process polarimetric information. Our investigations are based on synthetic data: using the RAPSODI forward model (see Sect. 5.3), measurements are simulated for a wide range of atmospheric conditions, measurement scenarios, and retrieval settings. The simulated measurements are then fed back to the retrieval to investigate how well the original atmospheric state can be reproduced.
Using synthetic data instead of field measurements for the assessment of the retrieval's performance has several advantages (Frieß et al., 2006, 2019): firstly, the validation of real MAX-DOAS measurements is extremely difficult and cumbersome since representative and accurate independent observations for the entire set of retrieved atmospheric parameters are required. Secondly, measurements need to be performed over long time periods to sample a wide range of atmospheric conditions, thereby covering the entire parameter space of interest. In contrast, when using synthetic measurements, the underlying atmospheric conditions can be arbitrarily chosen and are perfectly known beforehand; this allows us to carry out a controlled and systematic analysis.
The paper is structured as follows. Section 2 describes the general MAX-DOAS technique as it is typically applied. Sections 3 and 4 describe and motivate the major modifications in the instrumental set-up, the measurement procedure, and the inversion algorithm that are required to extend conventional MAX-DOAS by polarimetry. Section 5 describes the RAPSODI retrieval algorithm. Strategy, set-up, and results of our investigations are presented in Sects. 6–11 and are summarised in Sect. 12.
The procedure to determine the atmospheric state from MAX-DOAS observations can be subdivided into three major steps, to be discussed in the following subsections: (1) the actual measurement process (acquisition of skylight spectra); (2) the DOAS spectral analysis, which enables us to derive suitable intermediate quantities from the raw spectra; (3) based on these intermediate results, the inversion procedure to determine the desired atmospheric parameters. The synthetic data used in this study comprise groups of directly simulated DOAS spectral analysis results. Therefore, steps (1) and (2) are not of critical importance in this study; however, they will be described briefly in order to provide a complete picture of the method.
2.1 Spectra acquisition
Currently, a large number of different MAX-DOAS instrument prototypes are in existence; all are different in detailed implementation, and sometimes they are optimised for special purposes. However, most of them share essential properties that have been established over recent years (see e.g. Kreher et al., 2020) and will be outlined here. The typical MAX-DOAS instrument consists of a telescope and a grating spectrometer unit. The telescope features a narrow field of view (FOV), with full aperture angles of approximately 0.5∘ (10 mrad). It is motorised to realise multiple viewing directions in rather quick succession (≈1 min per viewing direction). Telescopes are either installed at a fixed viewing azimuth angle (1-D MAX-DOAS), automatically changing the viewing elevation angle, or they have motors for both azimuth and elevation angles (2-D MAX-DOAS). There are different approaches to guide the gathered light from the telescope to the spectrometer, the most common being to use fused silica optical fibres. Typical spectral coverages and resolving powers of the spectrometer unit are on the order of 150 nm and 103 (resolution of ≈1 nm), respectively. It is not unusual to apply multiple spectrometers, commonly two, dedicated to UV and Vis spectral ranges with approximate coverages of 300–400 and 400–500 nm, respectively.
In the following we will consider spectra I(λ,Ω). Here, I is the radiance at wavelength λ, detected at the viewing geometry configuration , with θ, ϕ, and α the solar zenith angle (SZA), relative azimuth angle (RAA), and viewing elevation angle (EA), respectively. A typical data set required for a single MAX-DOAS retrieval consists of 5 to 10 spectra recorded for different geometrical configurations. It is most common to perform so-called elevation scans, in which spectra are recorded at a fixed value of RAA for a range of EAs between a few degrees and the zenith.
2.2 DOAS spectral analysis
The first processing step in a MAX-DOAS evaluation is the DOAS analysis of the observed skylight spectra I(λ,Ω). I(λ,Ω) corresponds to the solar spectrum Itoa(λ) at TOA, altered by extinction of the light on molecules, particles and the Earth's surface on its way (actually the superposition of a multitude of ways) through the atmosphere to the instrument. The observed slant optical thickness (SOT) is defined as
To a good approximation, τ(λ,Ω) can be expressed according to the well-known DOAS model
For readability, we have omitted the Ω symbol here. The first term represents absorption by a series of trace gases, with absorption cross sections σs(λ) and slant column densities (SCDs) Ss given by
Here, cs is the trace gas concentration integrated along the effective light path L through the atmosphere. The second term in Eq. (2) is a polynomial (N≈5) with coefficients bi that accounts for spectral broadband features caused by scattering (into as well as out of the light path), aerosol absorption and reflectance from the Earth's surface. R(λ) is the Raman optical depth with amplitude k. This represents those narrowband features caused by the filling-in of Fraunhofer lines and trace gas absorption signatures due to inelastic rotational-Raman scattering by air molecules (Grainger and Ring, 1962; Solomon et al., 1987; Bussemer, 1993; Wagner, 1999). C(λ) represents other potentially non-linear correction terms (arising for example from spectral shifts or from limited instrumental resolution); this term is not really relevant for our purposes, and we will not consider it further in this work. For the detection of most trace gases, differences in optical depth smaller than 10−3 have to be detected reliably. Due to instrumental imperfections, this is typically not possible when using independent solar spectra Itoa(λ) from the literature in Eq. (1). Instead, SOTs are compared against spectra from the same instrument but at another viewing geometry Ω0, yielding the so-called differential slant optical thicknesses (dSOT)
This is equivalent to the formulation in Eq. (2) but with the SCD Ss replaced by the differential SCD (dSCD) ΔSs:
Taking reference data from the literature for σs(λ), the modelled dSOT in Eq. (5) can be fitted to the observed dSOT in Eq. (4) using least-squares methods, with the fitting parameters being ΔSs, bi, and k.
The set of dSCDs ΔSs for the different trace gases constitutes the main output of the DOAS analysis, and this output is typically the sole input for conventional MAX-DOAS inversion algorithms. Indeed, in most applications the broadband information contained in the parameter set bi is discarded. In this study we also ignore bi at this point and instead re-incorporate the broadband information into the inversion in terms of dSOTs at discrete wavelengths (see Sect. 5). The information inherent in the Ring-effect scaling parameter k will be ignored in this study, even though it has been shown to provide additional information on aerosols (Wagner et al., 2009).
2.3 Inversion procedure
Inferring the state of the atmosphere (SOA) from the measured quantities (as introduced in Sect. 2.2) represents a non-linear inverse problem. The SOA is characterised by a number of parameters, such as the aerosol and trace gas vertical concentrations, aerosol optical properties, and Earth surface reflection. In most cases, only a subset of these parameters is actually retrieved (see also Sect. 5.4).
Retrieval algorithms for the SOA make use of a radiative transport model (RTM) to reproduce the measurements (typically the dSCDs obtained from the DOAS spectral analysis) given a model atmosphere input. During the inversion, the model parameters are iteratively adapted to bring simulated and real measurements into closure, thereby approaching the real atmospheric state. In recent years, a multitude of MAX-DOAS inversion algorithms have been implemented that apply different approaches in terms of parameterisation, a priori constraints, and optimisation schemes (Irie et al., 2008; Clémer et al., 2010; Wang et al., 2013; Yilmaz, 2012; Bösch et al., 2018; Chan et al., 2019; Vlemmix et al., 2011; Beirle et al., 2019).
In these retrievals, information on aerosols is typically inferred from the oxygen collision complex (O2-O2, in the following referred to as O4). Its atmospheric concentration is proportional to the square of the O2 concentration, and thus its vertical distribution is well known. The depth of O4 absorption features in a skylight spectrum therefore provides information on the effective light path through the atmosphere. The latter is mostly driven by the abundance and properties of aerosol. Hence, accurate detection of O4 absorption features not only allows us to fine-tune the radiative transfer, but also enables us to retrieve aerosol vertical distributions and properties (Wagner et al., 2004; Frieß et al., 2006).
In this section we outline briefly the major modifications (on instrumental aspects as well as data evaluation) necessary to incorporate polarimetric information into the MAX-DOAS measurement procedure.
Regarding the implementation of a polarimetric MAX-DOAS (PMAX-DOAS) instrument, various instrumental set-ups are conceivable. In this study we assume a PMAX-DOAS instrument that features a motorised linear polariser inside the telescope; this will record spectra of scattered skylight at arbitrary polarisation orientations or polariser angles (PAs) δ. For such spectra (in the following referred to as “polarimetric spectra”), the viewing geometry configuration Ω introduced in Sect. 2.2 is extended by δ, and hence . Throughout this study, the PA describes the orientation of the polariser's transmitting axis with respect to the horizon, increasing clockwise when looking towards the instrument. In the atmosphere, the contribution of circularly polarised light is negligibly small and usually ignored (Hansen, 1971). Information on skylight radiant intensity and state of polarisation (SOP) can then be fully captured by performing three radiance measurements Iδ at three different PAs, ideally in steps of (see e.g. Xu and Wang, 2015). In this study, we assume for the most part that our PMAX-DOAS instrument records three spectra at PAs of in each viewing direction.
The DOAS spectral analysis is readily applicable to polarimetric spectra in the same manner as that described in Sect. 2.2, yielding what in the following will be referred to as “polarimetric dSCDs”. Note, however, that the information on the SOP of skylight needs to be incorporated into the inversion to exploit the full potential of polarimetry. This information is not contained in the polarimetric dSCDs themselves, but rather in the intensity ratios between spectra recorded at different δ. Therefore, in addition to the polarimetric dSCDs, “polarimetric dSOTs” (between polarimetric spectra, according to Eq. 4) at discrete wavelengths will also be provided as additional input to the inversion algorithm. This issue is discussed in more detail in Sect. 5.2.
The major requirement for the retrieval algorithm is a forward model that is able to simulate both polarimetric dSCDs and polarimetric dSOTs by means of a vectorised radiative transfer model (RTM). In this study, we use the vector discrete ordinate model VLIDORT (Spurr, 2006, 2008). Forward-model aspects are discussed in more detail in the description of the RAPSODI algorithm in Sect. 5.2.
The SOP of skylight can be characterised in terms of the Stokes parameters I, Q, U and V (Stokes, 1851; Chandrasekhar, 2013). Here, I (denoting the total radiance), Q (radiance difference between electromagnetic wave components parallel and perpendicular to the reference plane) and U (radiance difference between electromagnetic wave components at 45 and 135∘ to the reference plane) carry information on the state of linear polarisation, while parameter V is linked to circular polarisation. These Stokes parameters are related to our measurements according to
Further useful quantities are the degree of linear polarisation (DOLP)
and the angle of polarisation (AOP) χ
which corresponds to the polariser angle δ at which the observed intensity is maximised. However, in the present work, Eqs. (7)–(14) will play only a minor role, since the RAPSODI forward model directly simulates dSCDs and dSOTs (see Sect. 5.3) and a transformation between measurements Iδ and Stokes parameters is therefore not necessary for the inversion.
In this section, we outline briefly the reasons why the application of polarimetry is expected to improve MAX-DOAS atmospheric state retrievals. Sunlight at TOA is initially unpolarised but becomes partially polarised through scattering processes in the Earth's atmosphere. Pioneering work in this direction dates back to the 19th century, notably with the discovery of skylight polarisation and its basic properties by François Arago in 1809 (Arago, 1862) as well as the first theoretical explanation by Strutt (1871). Different scatterers (molecules as well as aerosols) have very different effects on the SOP. Hence, the observed SOP of skylight, including its angular distribution and broadband spectral patterns, depends strongly on atmospheric aerosol abundances and properties and can therefore be expected to provide significant amounts of additional information in retrievals. In recent decades, extensive investigations on the use of polarisation measurements have been performed e.g. by Herman et al. (1971), Hansen and Travis (1974), Mishchenko and Travis (1997), Boesche et al. (2006), Dubovik et al. (2006), Hasekamp and Landgraf (2007), Li et al. (2009), and Emde et al. (2010). In contrast, very little attention has been paid to the fact that the light fields of different polarisation orientations arriving at the Earth's surface have taken different effective paths through the atmosphere. Polarimetric measurements therefore allow us to access new light path geometries; this is of particular importance for applications such as MAX-DOAS, which aim at the retrieval of spatial distributions of atmospheric species. This effect is reflected by variation of air-mass factors and box air-mass factors with polariser angle δ as explained and illustrated in Sect. S1 in the Supplement. In a Rayleigh atmosphere (no aerosols), variations of the O4 SCD by up to 60 % in a single viewing direction can be achieved just by varying δ. Even though SCD variation is lower for trace gases at low altitudes and in scenarios with enhanced aerosol loading, this polarisation effect is expected to improve the retrieval of vertical profiles for any species.
As mentioned in Sect. 1, the basis for our studies is the RAPSODI retrieval algorithm, which has been developed to overcome some of the current limitations of the above-described (Sect. 2.3) MAX-DOAS retrieval algorithms. RAPSODI's most notable features are the following.
-
It is the first MAX-DOAS retrieval algorithm with the ability to account for the polarisation state of skylight, which is the key feature for the presented study.
-
It is the first algorithm to retrieve simultaneously all species of interest (aerosols and trace gases) from observations at multiple wavelengths (multi-spectral) in a single inverse-model step. Former algorithms performed separate inversions for aerosols (from the O4 dSCDs) and each trace gas.
-
It is the first algorithm to retrieve information on aerosol microphysical properties (size distribution parameters and complex refractive indices) by making use of a Mie model. Formerly, information on aerosol properties was either prescribed or derived in terms of simplified optical parameters (for example, the asymmetry parameter characterising the Henyey–Greenstein phase function model).
RAPSODI is fully backward-compatible, meaning that non-polarimetric monochromatic retrievals performed separately for aerosol and trace gases at a single wavelength are still possible, and Mie model output can be replaced by the Henyey–Greenstein approximation by setting corresponding flags in the retrieval configuration. Figure 1 represents a schematic overview of the algorithm. The crucial components and functionalities are described in the following subsections. For a detailed description of the algorithm, the reader is referred to Tirpitz (2021).
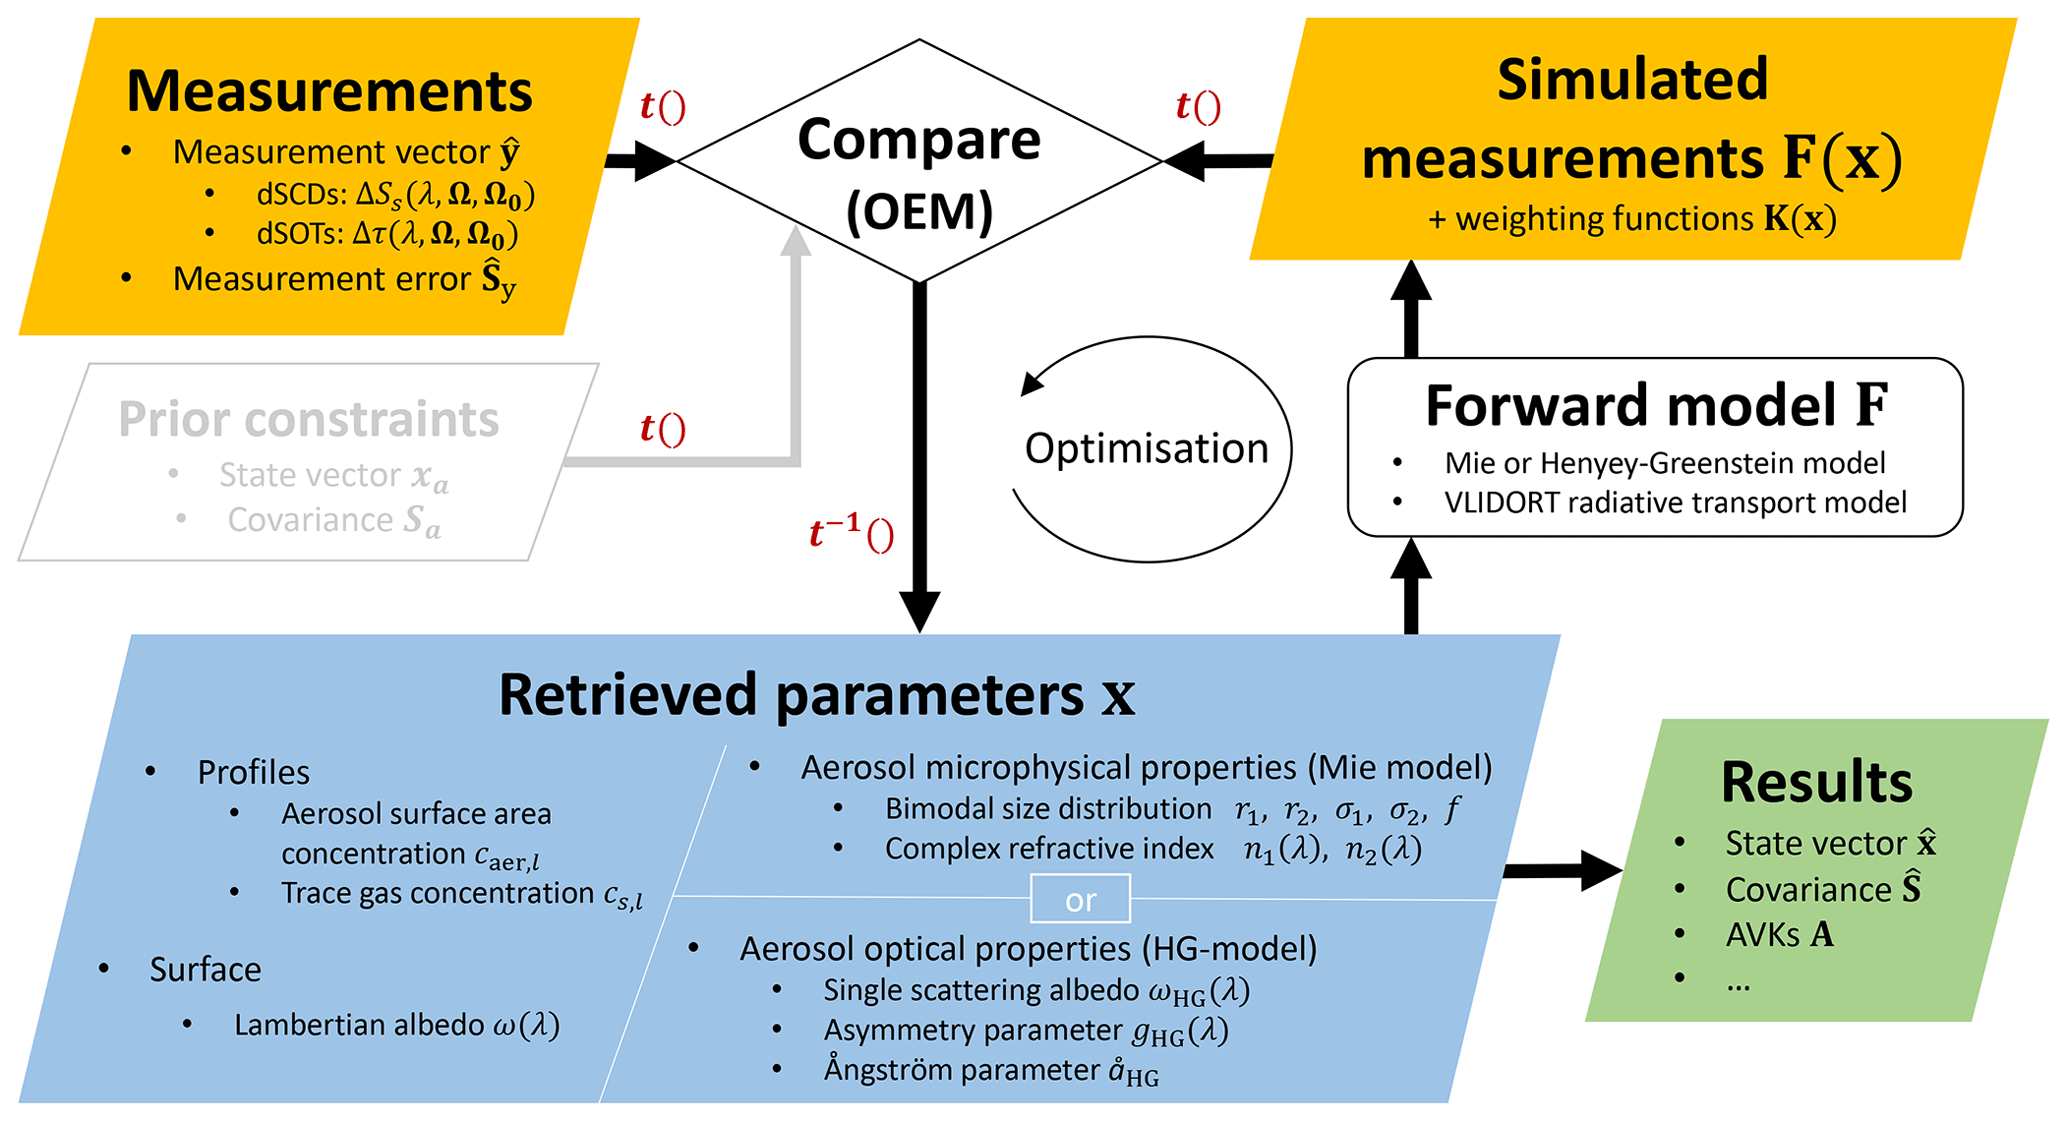
Figure 1Schematic overview of the RAPSODI retrieval algorithm. The individual components are discussed in detail in the following subsections. Red labels next to arrows indicate transformations to/from optimised units, as described in Sect. 5.4.
5.1 Optimal estimation formalism
As with earlier MAX-DOAS algorithms, RAPSODI is based on the optimal estimation (OEM) inversion formalism described in detail in Rodgers (2000). The aim of inverse modelling is to find that SOA (described by a set of parameters summarised in the state vector x) which best reproduces a set of real observations , given a forward model F. This is achieved by minimising the cost function
Here, xa is the a priori state vector. Sy and Sa are the measurement and a priori covariance matrices. xa and Sa describe estimates of the most likely atmospheric state and its variability prior to the inversion. Ideally, their values are inferred from climatologies or other independent data sets. The first and second terms in Eq. (15) tend to counterbalance each other, and this aspect is crucial to the understanding of some of the approaches taken in this study: the first term dominates for those state vector elements x with high measurement sensitivity. In contrast, if the sensitivity of the measurements to x is low, the second term dominates and x is drawn towards its a priori value xa. The minimisation problem is non-linear, and the solution is found iteratively by applying a Levenberg–Marquardt optimisation scheme:
The index i indicates the current iteration, and is the weighting function matrix, representing the linearisation of the forward model for a distinct atmospheric state x. Once the solution has been found, its covariance is calculated according to
A useful measure for the amount of information obtained on the different state vector elements is the averaging kernel (AVK) matrix, defined as
The diagonal elements Ajj lie between zero and unity for each state vector element xj; they indicate the relative amount of information on xj gleaned from the measurements in relation to that from a priori knowledge. The trace of A is often referred to as the degrees of freedom for signal (DOFS), a quantity that will play a crucial role in this study. Note that, in the following, we will sometimes refer by “DOFS” to the sum over only a few values (or even just a single value) of the AVK diagonal. The off-diagonal entries Ajk (j≠k) contain information on the cross-sensitivity of xj to all other parameters xk. In the ideal case of a retrieval achieving full sensitivity with respect to all state vector elements and no cross-correlations, A=1 (the identity matrix).
5.2 Measurement vector
The RAPSODI measurement vector consists of dSCDs and dSOTs for different trace gas species s (including O4), viewing geometry Ω, reference geometry Ω0, and radiation wavelength λ. With conventional non-polarimetric dSOTs and dSCDs, Ω and Ω0 comprise just the viewing direction (θ, ϕ, and α), whereas with polarimetric dSOTs and dSCDs, these configurations also contain the polariser angle δ.
dSCDs carry information on trace gas abundances and, in the case of O4, on the effective light path. Most conventional MAX-DOAS retrieval algorithms accept dSCDs as the only input. RAPSODI also accepts dSOTs, to allow for the incorporation of two further kinds of information: (1) dSOTs between spectra recorded in the same viewing direction (θ, ϕ, α) but at different PAs δ contain information on the light's SOP and – if dSOTs are provided at multiple wavelengths – the SOP's spectral dependence. (2) In contrast, dSOTs between spectra of different viewing directions but with the same δ contain information on the spectral broadband variation of the radiance over the sky hemisphere.
5.3 Forward model
The RAPSODI forward model is based on VLIDORT (Spurr, 2006, 2008), a pseudo-spherical 1-D vector discrete ordinate RTM. VLIDORT has the ability to generate fields of analytically derived weighting functions (Jacobians) with respect to any atmospheric and/or surface properties. VLIDORT is coupled with a Mie scattering model (De Rooij and Van der Stap, 1984; Spurr et al., 2012) that calculates the aerosol optical properties of relevance for the RTM from a set of aerosol microphysical properties; the Mie model is also analytically differentiable with respect to the aerosol microphysical parameter inputs. Thus, the forward model not only simulates dSCDs and dSOTs, but also generates the corresponding weighting functions K.
For the Mie model we have assumed a bimodal log-normal size distribution as described in more detail in Sect. 5.4. The Mie scattering model can be replaced by the Henyey–Greenstein (HG) approximate phase function by setting a corresponding flag in the retrieval settings.
5.4 State vector
Elements of the state vector x are the desired retrieval parameters. These include the concentrations cs,l of species s (aerosols and various trace gases, O4 excluded) in each model layer l, the Lambertian surface albedo ωsurf(λ), and – depending on the aerosol model used – optical or microphysical aerosol properties. A λ dependency indicates that the corresponding parameter is treated as spectrally resolved, meaning that separate values are retrieved at each wavelength for which measurements (either dSCDs or dSOTs) are present. If the HG approximation is in force, the asymmetry parameters ghg,l(λ), the single scattering albedos ωhg,l(λ), and the Ångström parameter appear in the state vector. If the Mie model is used, the state vector contains the median radii rl,m of each mode , the modal widths σl,m, the modal fraction fl, and the complex refractive indices nl,m(λ). All aerosol parameters can be linked over λ, l, or m, thereby allowing us to retrieve average values over altitude, wavelength, or size distribution modes. RAPSODI has the ability to define and retrieve up to three different aerosol types, which can be assigned to different atmospheric layers.
For the present study, we will make use of the Mie model as the HG model cannot reproduce a realistic state of skylight polarisation (Tirpitz, 2021) and therefore does not represent a suitable approximation for polarimetric retrievals. Furthermore, we will assume the same aerosol properties for all model layers; thus we omit the layer index l in the following discussion. Hence, in this study aerosol property parameters contained in state vector are the median radii rm of each mode , the modal widths σm, the modal fraction f and the complex refractive index nm. rm, σm and f parameterise the bimodal log-normal aerosol size distribution according to
with being the normalised number of particles N per radius interval.
Conventional algorithms retrieve the aerosol abundances in terms of an extinction coefficient μaer that generally depends on λ; this is not convenient for multispectral retrievals, where a single aerosol profile shall be inferred from observations at multiple wavelengths. RAPSODI therefore quantifies aerosol in terms of the λ-independent surface area concentration caer in units of µm2 cm−3, and so vertical columns Vaer are not expressed in terms of the familiar aerosol optical thickness (AOT) but instead in units of µm2 cm−2. Also, the results of this study are presented in these units. Note that μaer and AOT are related to caer and Vaer according to
with E(λ) being the aerosol bulk extinction efficiency which depends on the aerosol properties. It can be determined by Mie calculations and ranges between 0.5 and 3 for typical atmospheric aerosol in the UV-Vis spectral range. Note that Eq. (21) only applies if aerosol properties are assumed to be constant with altitude, as is the case in the present study.
As is the case with earlier OEM retrieval algorithms (Yilmaz, 2012; Friedrich et al., 2019; Wang et al., 2013), RAPSODI can transform individual state vector elements to numerically more favourable quantities x′ before the OEM formalism is applied (in Fig. 1, these transformations are indicated by “t()”). In this work, we make use of two kinds of transformations: (1) the “log” transformation allowing us to retrieve parameters in logarithmic space, and hence . In this way, negative values in x are avoided and larger values of x are allowed. (2) The “frac” transformation maps fractional quantities specified over the interval [0,1] (such as albedos, asymmetry parameters, and modal fractions) into the space through the transformation , which is the inverse of a Fermi–Dirac distribution. The main motivations for these transformations are that (1) they avoid unphysical results and numerical failures due to discrete boundaries in the parameter values and that (2) the OE inversion formalism by Rodgers (2000) assumes parameter variations and uncertainties to be normally distributed, a condition which is often better fulfilled for suitably transformed parameter variables. Transformations for all parameters are listed in Table 4.
The synthetic data set for our studies was created by simulating measurements using the RAPSODI forward model. Where possible, the atmospheric scenarios and settings have been adapted from Frieß et al. (2019), who performed a comparison of eight retrieval algorithms also on the basis of synthetic measurements.
Table 1 provides an overview of the simulated observations. Simulations are performed at six different wavelengths . dSCDs are simulated for O4, formaldehyde (HCHO), and nitrogen dioxide (NO2). As shown in Table 1, dSOTs are simulated at all six wavelengths, whereas trace gas dSCDs are limited to those wavelengths where listed trace gases show significant OTs to be detected by DOAS. The dSCD simulation wavelengths are representative of typical DOAS spectral fitting ranges and were adapted from the settings used in Tirpitz et al. (2021). The use of two additional wavelengths (415 and 532 nm) ensures an equidistant spectral sampling of dSOTs in order to incorporate the full broadband polarisation and intensity information into the retrieval.
Thalman and Volkamer (2013)Meller and Moortgat (2000)Vandaele et al. (1998)Table 1Overview of the simulated observations. Wavelengths are in nanometres.
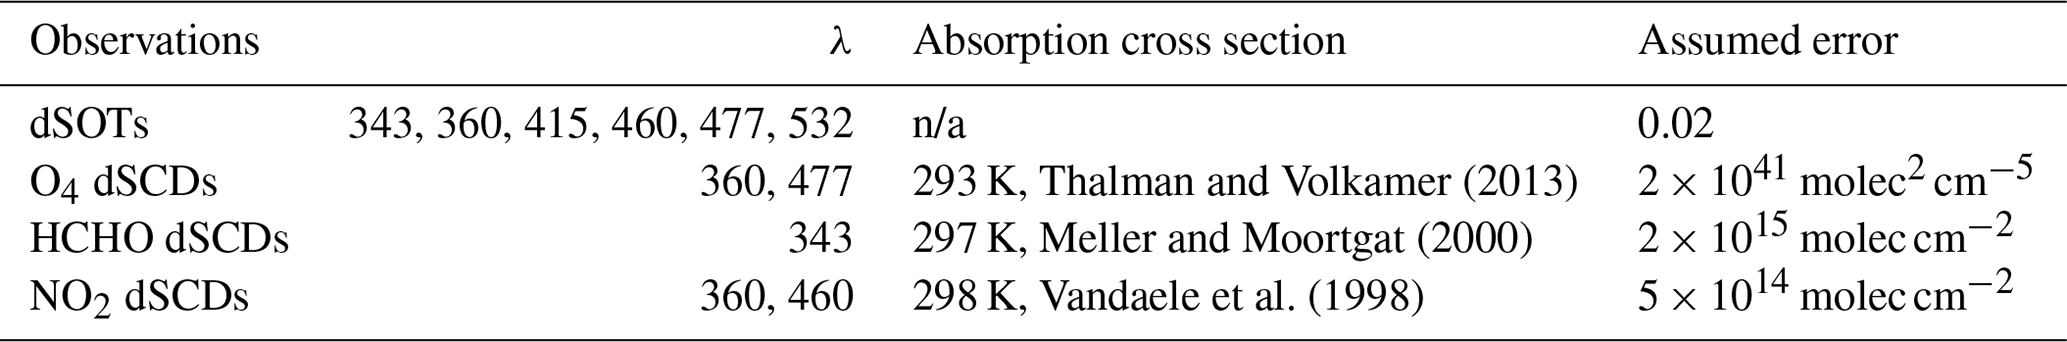
n/a: not applicable.
Assumed measurement uncertainties for dSCDs were taken from Frieß et al. (2019), while the uncertainties for dSOTs are inspired by investigations carried out on field data in Tirpitz (2021).
Vertical profiles of aerosol and trace gases used for the simulation calculations are shown in Fig. 2, and their key properties are listed in Table 2. Compared to Frieß et al. (2019), the number of different aerosol profiles is reduced in number: extreme cases with optically thick fog and cloud layers are not considered. Synthetic observations were simulated for all 63 combinations of aerosol and trace gas profiles, always applying a common trace gas profile for both NO2 and HCHO. For pressure, temperature, and humidity profiles, we assumed a U.S. Standard Atmosphere. Ozone absorption was not included.
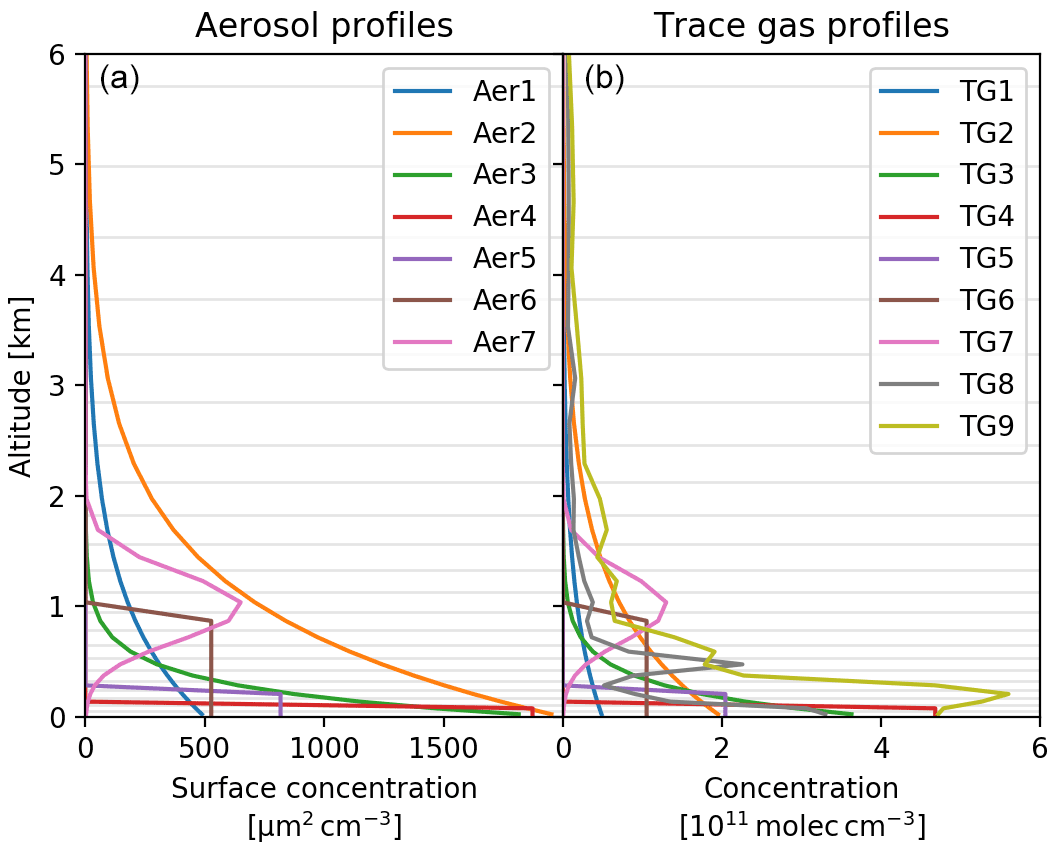
Figure 2Aerosol area concentrations (a) and trace gas concentrations (b, same profiles for HCHO and NO2) vertical profiles used as input for the forward modelling of synthetic data (see also Table 2).
Table 2Characterisation of the aerosol and trace gas profiles depicted in Fig. 2. Aerosol VCDs are in units of 108 µm2 cm−2, while trace gas VCDs have units of 1015 molec cm−2.
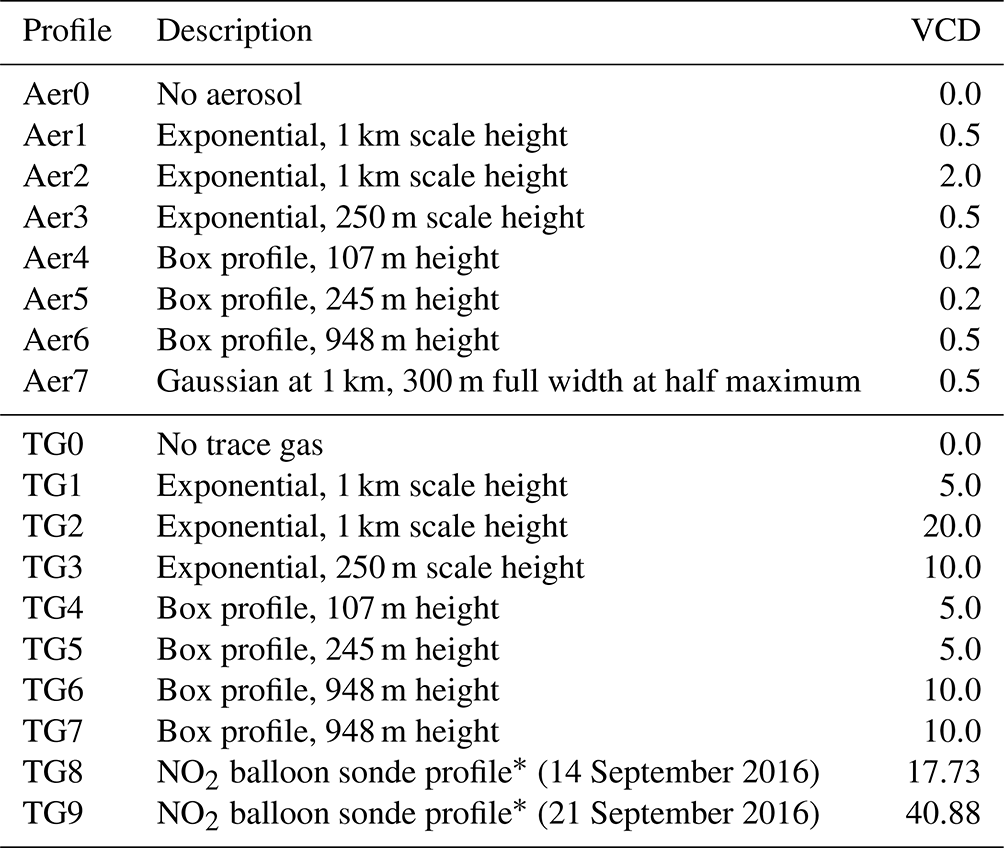
* Balloon sonde flights were performed during the CINDI-2 campaign in the Netherlands in 2016 (Kreher et al., 2020).
For the model atmosphere, we chose an exponential height grid (increasing layer thickness with altitude) with lmax=40 layers extending from 0 km to km and a surface-layer height of 50 m. The exponential grid reflects the fact that the sensitivity and vertical resolving power of ground-based MAX-DOAS observations decrease with altitude. Its advantages are (1) that the information content is more evenly distributed over the retrieved layers and (2) that accurate RT simulation results can be obtained with fewer simulation layers (and thus lower computational cost) if an exponential instead of regular grid is applied (see also Tirpitz, 2021). The layer boundary altitudes are given by
with and constants a=0.3676 and b=1.13602. The original regular-grid profiles used in Frieß et al. (2019) were interpolated to this grid, resulting in an occasional slight change in shape (however, total vertical columns were preserved). Even though 40 layers were considered for the forward-model vertical discretisation, only quantities in the lowest 25 layers between 0 and ≈8.5 km altitude were actually retrieved.
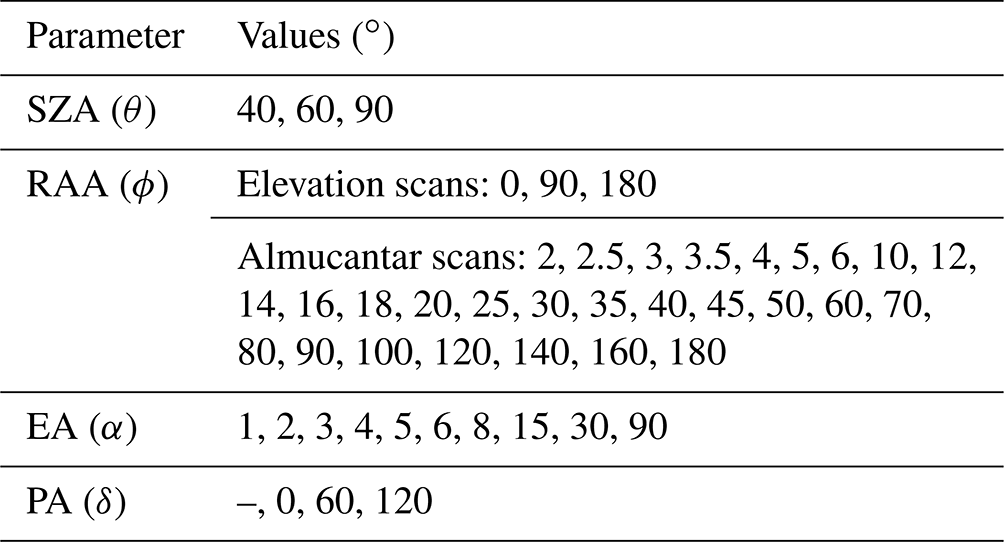
We performed simulations for the solar and instrument viewing geometries as listed in Table 3. Measurements without polariser are indicated by a dash (). In addition to the commonly performed elevation scans, we have included solar almucantar scans (RAA sequence at solar elevation); these are known to provide additional information on aerosol properties, in particular when the solar aureole region (viewing directions close to the Sun) is sampled (Herman et al., 1971). The RAA values applied in this study were taken from Dubovik and King (2000). Observations were simulated for each combination of EA, SZA, RAA and PA. We assume the instrument to be located on the ground at sea level. In the following, we will refer to the set comprising an aerosol profile, a trace gas profile, a distinct SZA and an elevation scan RAA as and “atmospheric scenario”.
Table 3Solar and instrument viewing geometries used for the simulation of synthetic observations. Simulations were performed for each combination of EA, SZA, RAA, and PA. A dash in the PA indicates non-polarimetric observations.
Aerosol microphysical parameter settings are noted in Table 4. These represent mixed aerosols (mixture of oceanic and industrial aerosol) as reported by Dubovik et al. (2002) for the Maldives, and they are the same in all simulations. The effect of different aerosol sizes is discussed separately (see Fig. 7). The size distributions, scattering matrix elements, and bulk optical properties are illustrated in Figs. S3 and S4 in the Supplement.
We have adopted a priori correlations for both spatially and spectrally resolved state vector elements. For vertical profiles, the correlation coefficient between concentrations at different altitudes decays exponentially with the vertical distance between the corresponding layers. Similarly, for ωsurf(λ), n1(λ), and n2(λ), correlations between state vector elements at different wavelengths decay with the spectral distance. Hence, off-diagonal elements of the sub-matrices of the a priori covariance Sa are given by
Here, l is the spatial or spectral distance, while l0 defines the correlation length. Values of l0 used in this work are listed in Table 4.
Table 4Settings for state vector elements x used in this study. The “true values” column indicates the values applied for the forward simulation of synthetic observations. Values for surface albedo and aerosols were adapted from Dubovik et al. (2002). Typically observed values for trace gas concentrations were derived from data presented in Tirpitz et al. (2021). Remaining columns enumerate the a priori settings used for the inversion procedure.
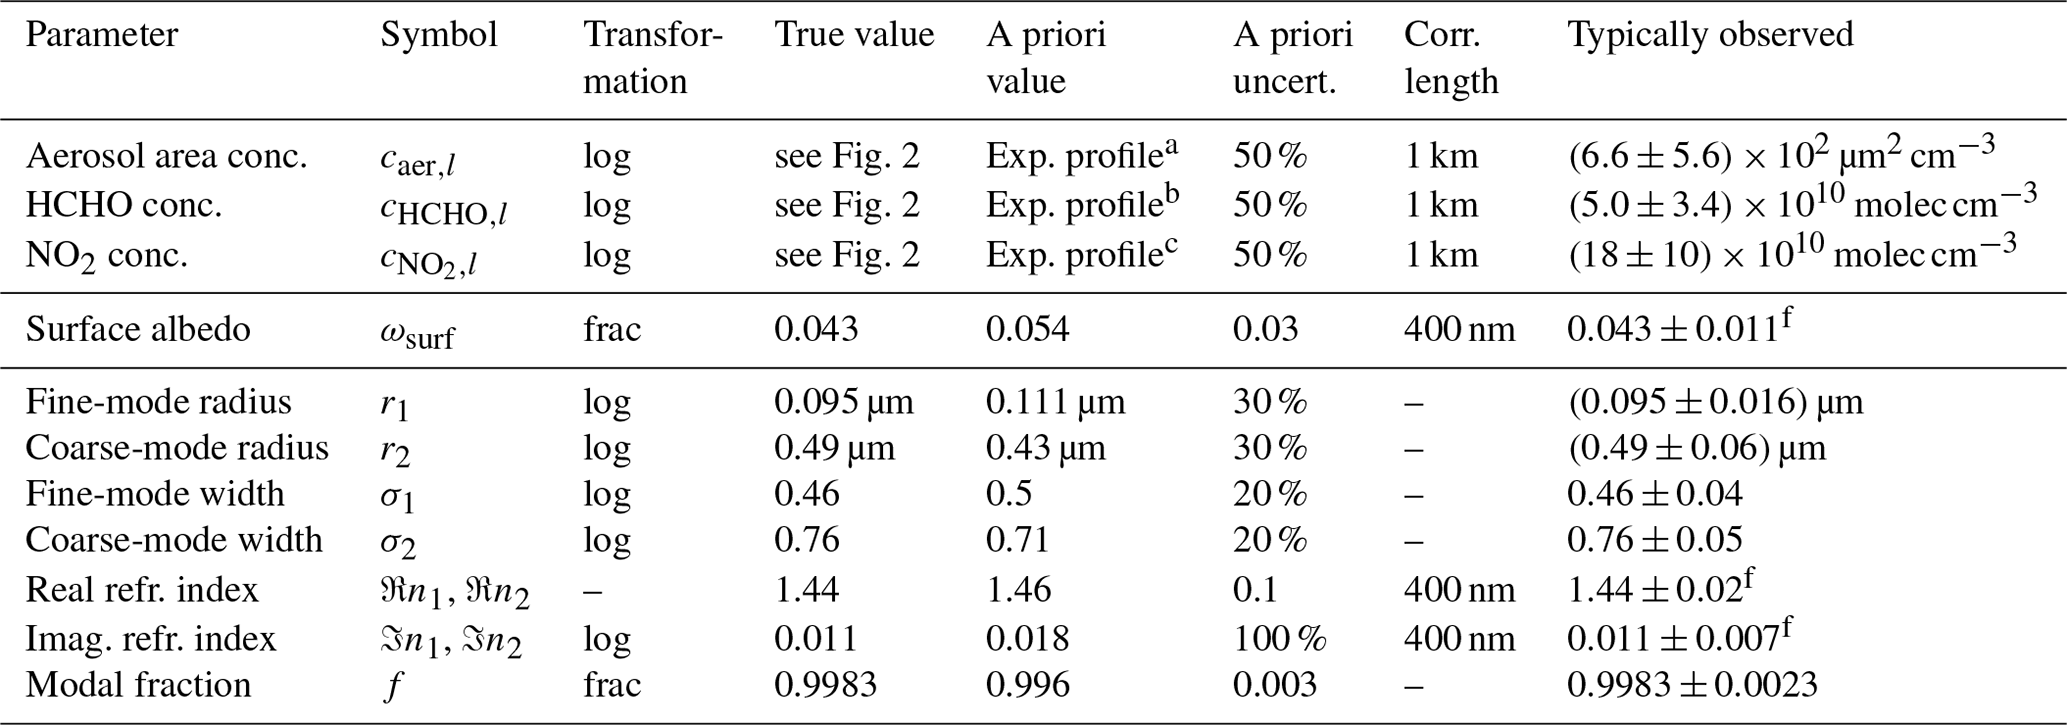
a 1 km scale height, VCD of 0.5×108 µm2 cm−2. b 1 km scale height, VCD of 8×10¹⁵ molec cm−2. c 1 km scale height, VCD of 9×10¹⁵ molec cm−2. f Value at 440 nm.
The resulting synthetic data set consists of nearly 1 million dSOTs and dSCDs and about 100 million associated weighting functions, simulated for all possible combinations of aerosol profiles, trace gas profiles, and viewing geometries as noted above. Any subset of the simulated observations can be condensed into a synthetic measurement vector to be ingested into the RAPSODI retrieval algorithm. In particular, observations can be added or removed, and the resulting effects on the inversion results can be examined systematically. We investigate various sets of measurements, in the following referred to as “measurement modes”. always includes a full elevation scan with 10 EAs as listed in Table 3. Depending on the measurement mode, the corresponding solar almucantar scan may be included. For convenience in the analysis, each measurement mode is labelled by a unique code, which consists of a series of several flags as defined in Table 5, these flags indicating which observations have been incorporated. A few examples are given here for illustration: the mode labels “UV” and “Vis” indicate conventional retrievals from non-polarimetric dSCDs for each species at a single wavelength in the UV and Vis spectral ranges, respectively; for these modes we assume that all species are retrieved separately. In contrast, the mode label “Multi-S-P-A” indicates that the measurement set was extended to all wavelengths, that all species are retrieved simultaneously, and that polarimetric observations as well as an almucantar scan have been included.

It should be noted that, depending on the measurement mode, the vector for a single retrieval can contain up to 1250 measurements (dSCDs and dSOTs for different species, wavelengths, and elevation scans as well as solar almucantar scan geometries), while the state vector can contain up to 110 parameters (profile concentrations of three different species in 25 layers plus surface albedo and aerosol parameters that may be spectrally resolved).
A major aim of this study is to investigate how the information content on the state vector elements x depends on different measurement modes, particularly with the addition of polarimetric observations. For the quantification of information, we employ the DOFS concept, as introduced in Sect. 5.1. Note that, for the calculation of DOFS, we do not need to perform an actual iterative OEM inversion, since the averaging kernel in Eq. (18) requires knowledge of the a priori covariance matrix Sa, the measurement covariance matrix Sy, in addition to the weighting function matrix K, calculated for a distinct atmospheric state . These weighting functions have been calculated already as part of the creation of the synthetic observation data set. It is now straightforward to derive DOFS for any atmospheric scenario, measurement mode, and state vector composition by including the respective elements in K, Sy, and Sa. Table 6 shows the average DOFS obtained for each retrieval parameter. We recall that concentration profiles cs are retrieved at 25 altitudes and that ωsurf, n1, and n2 are retrieved at six wavelengths. Here, the individual DOFS are summed up, therefore yielding values >1. The number of summed state vector elements, and hence the maximum possible number of DOFS, is indicated in the final row of this table. Figure 3 visualises these results for selected measurement modes.
Table 6DOFS achieved with different measurement modes (table rows) for individual state vector elements (table columns) averaged over the simulated atmospheric scenarios, namely all combinations of aerosol profiles, trace gas profiles, SZAs, and RAAs. The final row lists the total parameter numbers and hence the maximum possible DOFS values.
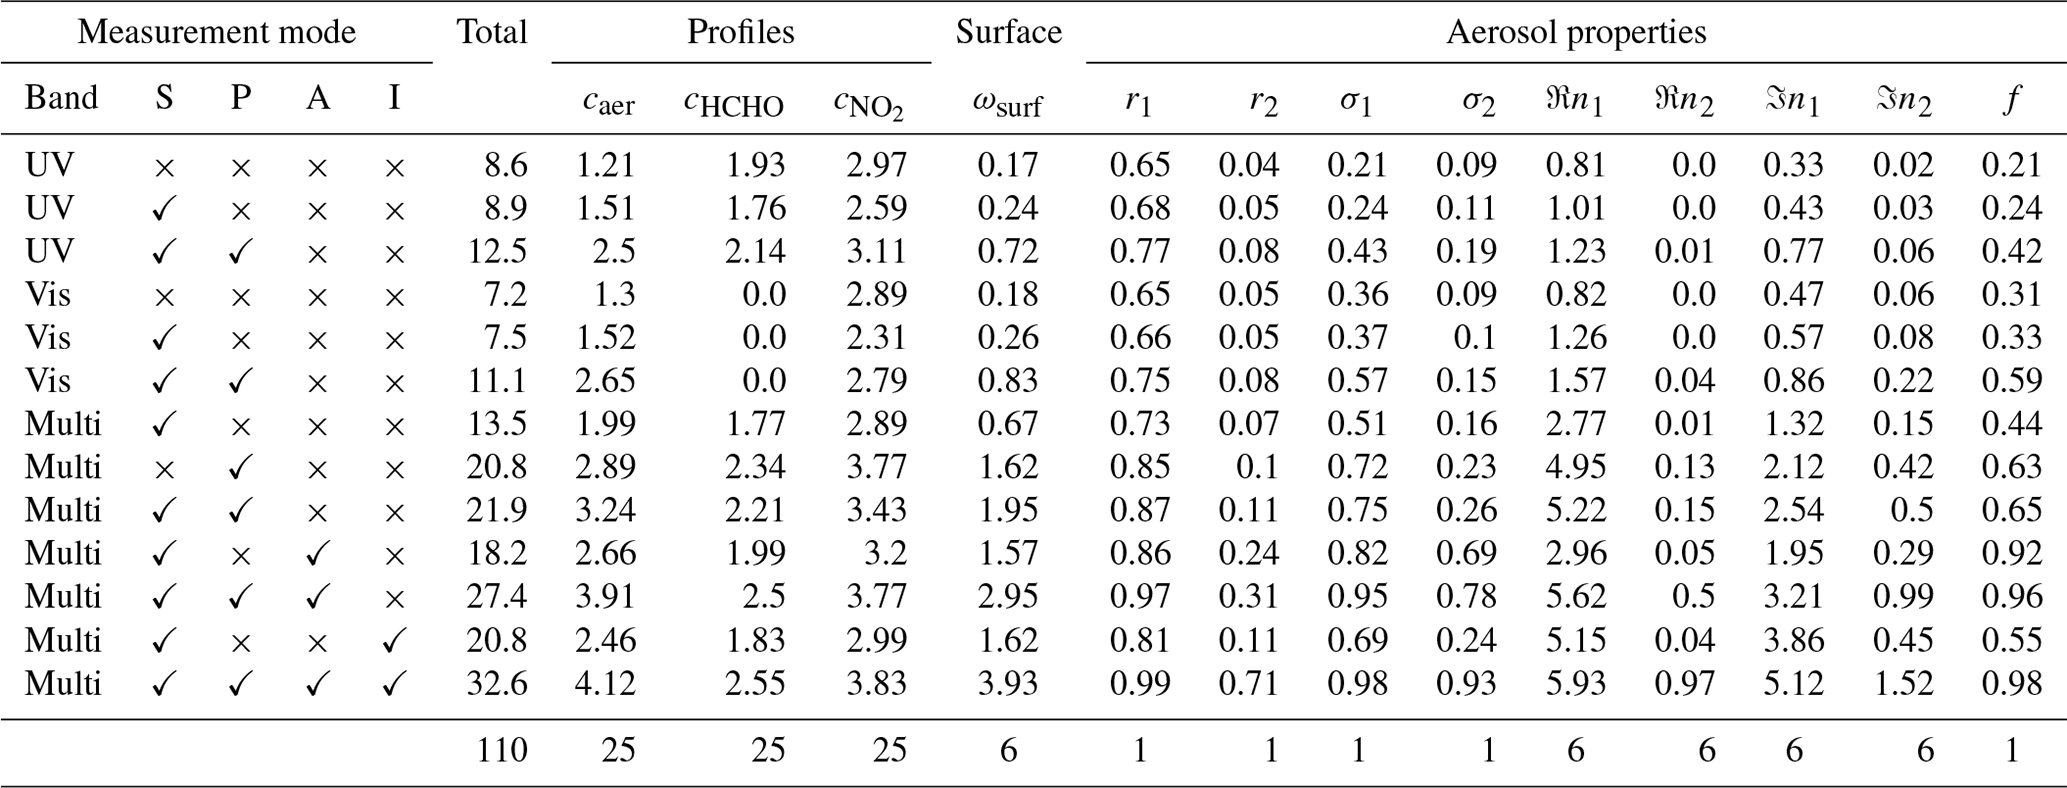
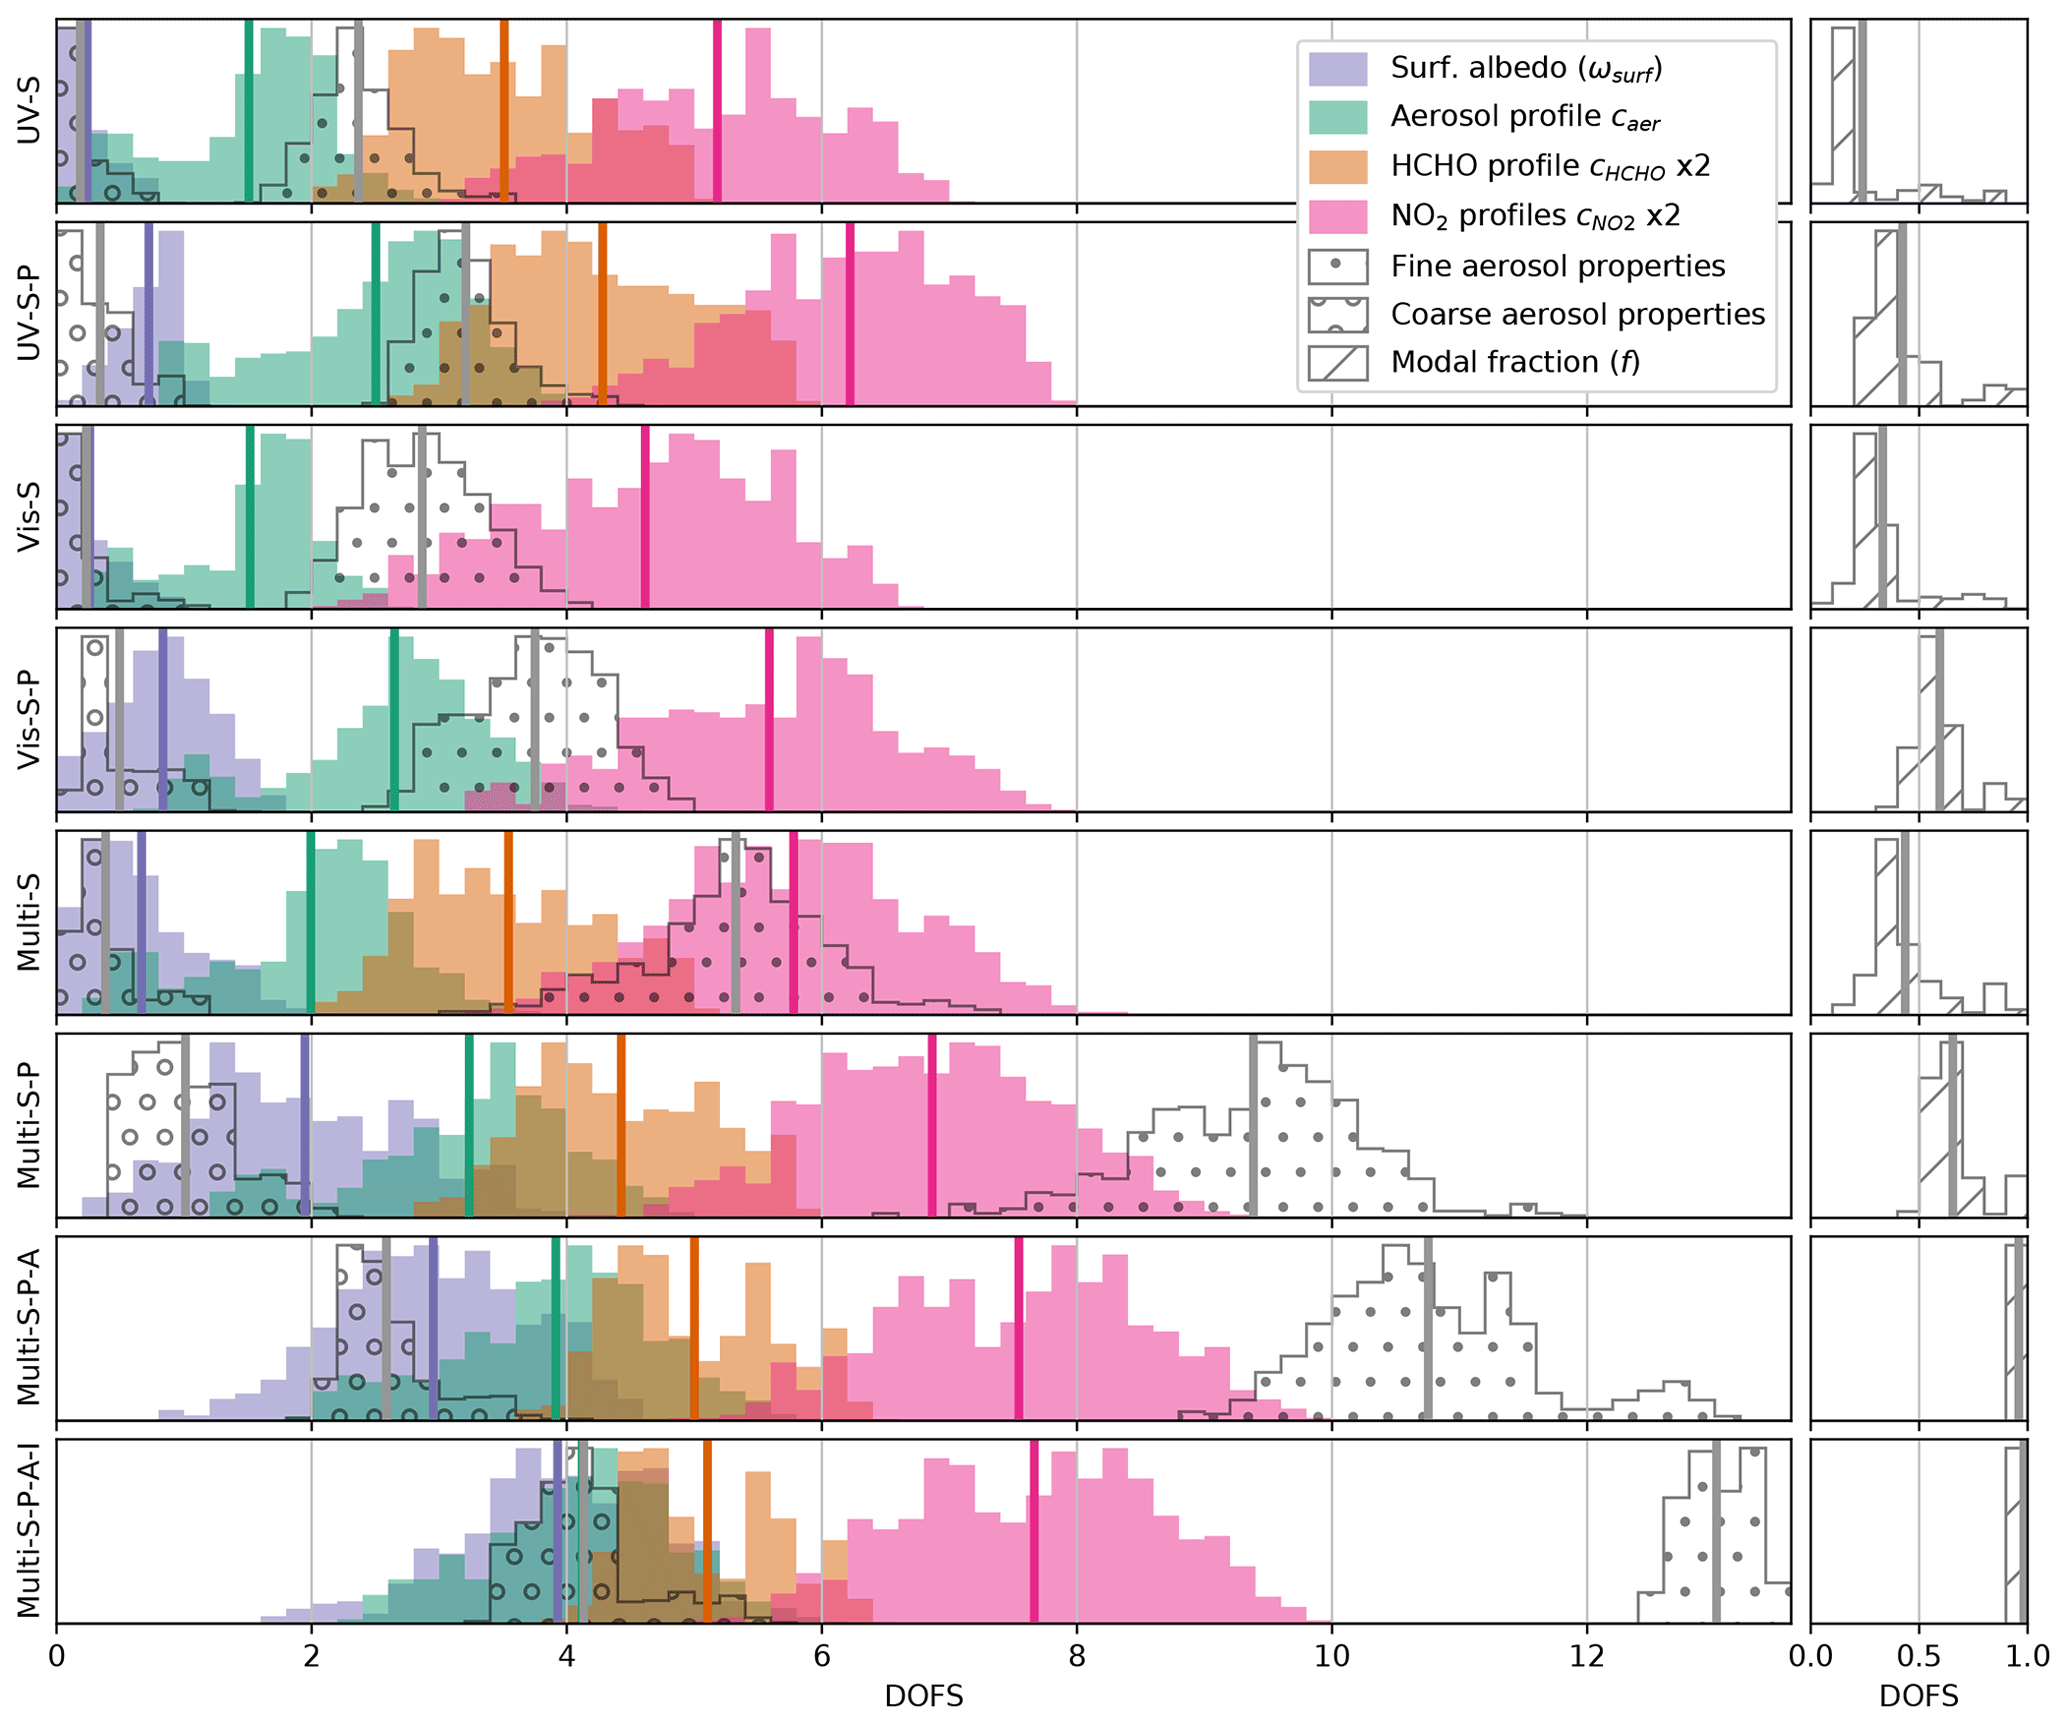
Figure 3Visualisation of the DOFS as shown in Table 6. Shown are histograms of the DOFS obtained for different parameter subgroups (see legend). Each occurrence corresponds to one atmospheric scenario. To reduce overlap between the histograms, HCHO and NO2 profile histogram values have been multiplied by 2. Subplot rows show different measurement modes according to the labels on the left axes. Thick vertical lines indicate median values. The histograms are peak-normalised, so that the vertical axes indicate the number of occurrences in arbitrary units. For extra clarity, histograms for the modal fraction f are shown in separate panels on the far right of the figure. For aerosol properties, the aerosol scenario Aer0 (no aerosol) was excluded here.
The effect of including polarimetric information (flag P) for different cases can be inferred by comparing UV-S and UV-S-P, Vis-S and Vis-S-P, Multi-S and Multi-S-P, and so on. A significant increase in information is observed for all these modes when adding polarimetric information, particularly on aerosol properties, aerosol profiles, and surface albedo. For the Multi-S-P mode, the increase is about 1.2 DOFS (60 %) for the aerosol profile, 0.5 DOFS (20 %) for trace gas profiles, 1.3 DOFS (190 %) in the surface albedo, and 4.7 DOFS (80 %) for aerosol properties. The trace gas histograms in Fig. 3 for Multi-S-P and Multi-S-P-A-I show double peaks, which appear to be related to the choice of aerosol scenarios. Those scenarios with high aerosol loading close to the surface (Aer3, Aer4, and Aer5) have reduced sensitivity to trace gases at lower altitudes and mostly contribute to the left peak of the histogram, whereas other aerosol scenarios mostly accumulate in the right peak.
We further calculated the DOFS for a reduced state vector x comprising just the concentration profiles, with the underlying aerosol parameters and surface albedos being set to their “true values” as listed in Table 4. DOFS results for this case are presented in Table S1 in the Supplement. We see that, for the concentration profiles, changes in DOFS between different measurement modes are significantly smaller (by about 50 % compared to the case with all parameters being retrieved), indicating that a large fraction of the increase in information on the profiles when retrieving the full state vector is an indirect effect of the improved knowledge on aerosol properties and surface albedo.
In addition to the information shown in the DOFS tables, it is worth discussing the individual effects of the incorporation of polarimetric dSCDs and polarimetric dSOTs, respectively. Exact DOFS values for these cases are given in Table S2 in the Supplement. While polarimetric dSCDs predominantly increase information content on vertical profiles, polarimetric dSOTs increase information mainly on aerosol properties. However, polarimetric dSCDs and dSOTs also carry significant amounts of equivalent information: starting from the Multi-S mode, the incorporation of polarimetric dSCDs increases the total DOFS from 13.5 to 17.8, whereas including only polarimetric dSOTs yields 18.8 DOFS. Including both yields the Multi-S-P mode with 21.9 DOFS.
Figure 4 shows the relative increase in DOFS (ΔDOFS) between the Multi-S and Multi-S-P measurement modes, grouped according to different aerosol scenarios. The effective light paths are generally determined by the atmospheric aerosol content. Dependence on the trace gas profiles is not shown here but was found to have a minor effect, at least for optically thin trace gases. ΔDOFS is particularly large for the Aer2 scenario, which features the largest aerosol VCD (exponential profile with 2×108 µm2 cm−2). A particularly small ΔDOFS is observed for the Aer0 (no aerosol) scenario. Of course, aerosol properties cannot be retrieved in this case, but the information increase for the aerosol profile is also significantly lower than for other scenarios. For aerosol scenarios with the same VCD, the variation in ΔDOFS is rather small, indicating that the benefit from the inclusion of polarimetric observations is mostly independent of the profile shape. However, there are indications that having a distribution of aerosols over a large altitude range is advantageous for the retrieval of aerosol properties.
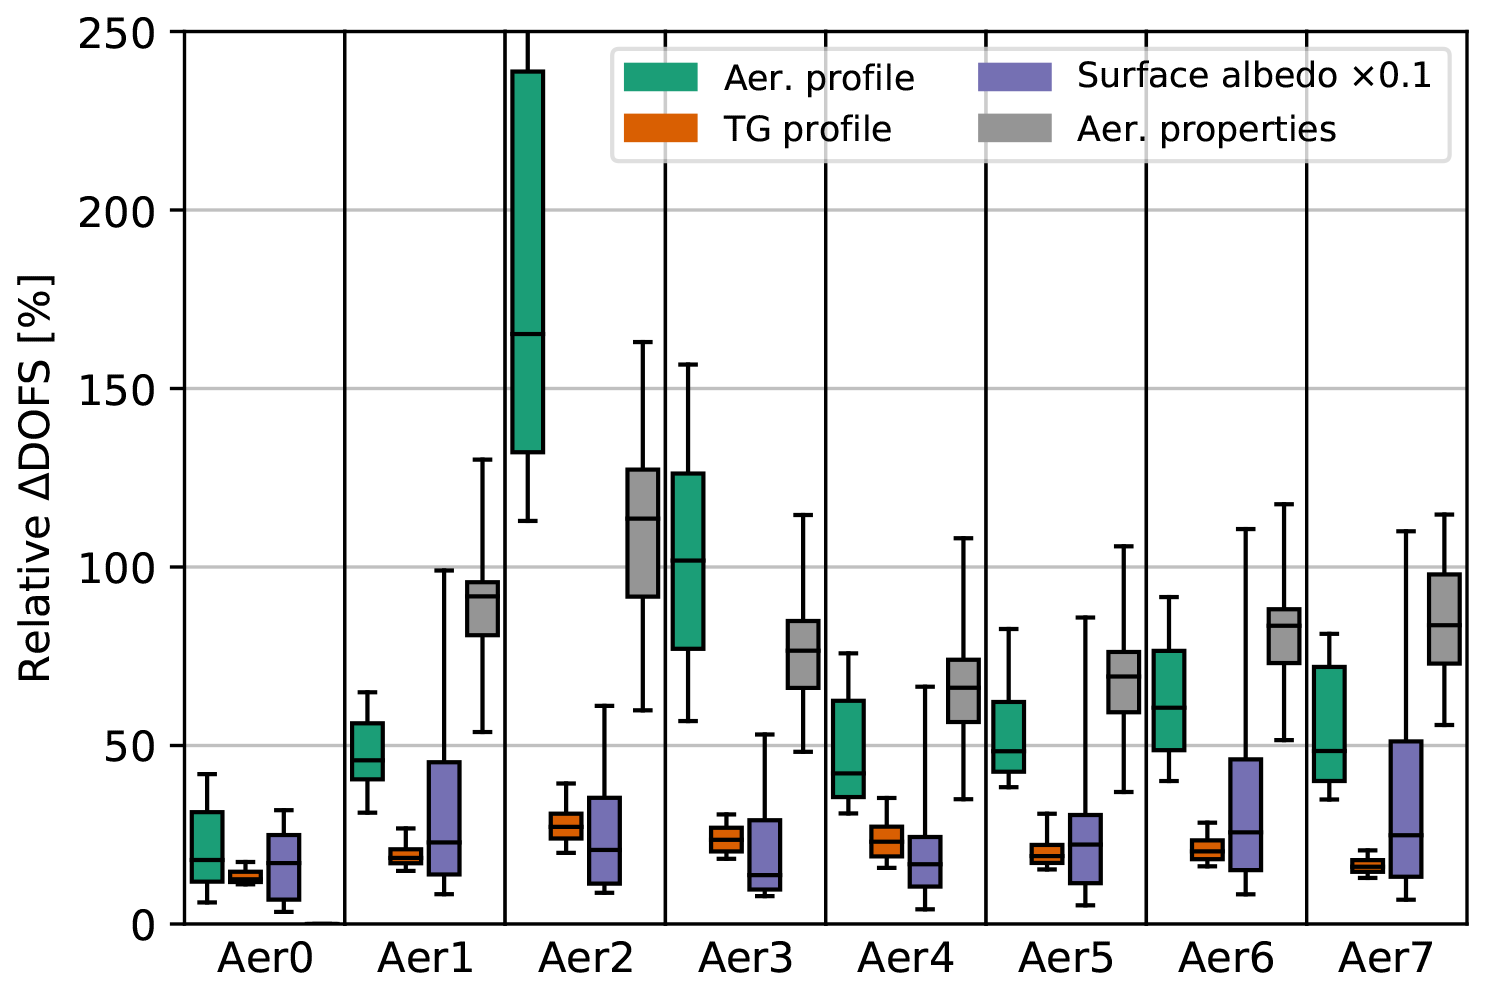
Figure 4Box–whisker plots of relative DOFS increases resulting from inclusion of polarimetric information, grouped by different aerosol profile scenarios (different subplots) and parameter subgroups (box colours). ΔDOFS is defined here as the difference in DOFS values obtained with the polarimetric (Multi-S-P) and non-polarimetric (Multi-S) measurement modes. In this plot, box–whiskers represent the distribution of observed values: boxes encompass values between the 25th and 75th percentiles, while whiskers indicate the 5th and 95th percentiles. Horizontal line markers within the boxes indicate median values.
Figure 5 shows DOFS for vertical profiles, obtained for the concentrations of different species in each retrieval layer. The DOFS profiles show a large relative increase in information on aerosol concentrations at higher altitudes between 1 and 4 km. However, the absolute values are still rather small (<0.2), so that aerosol abundances at these altitudes are still barely retrievable even with the inclusion of polarimetric MAX-DOAS observations.
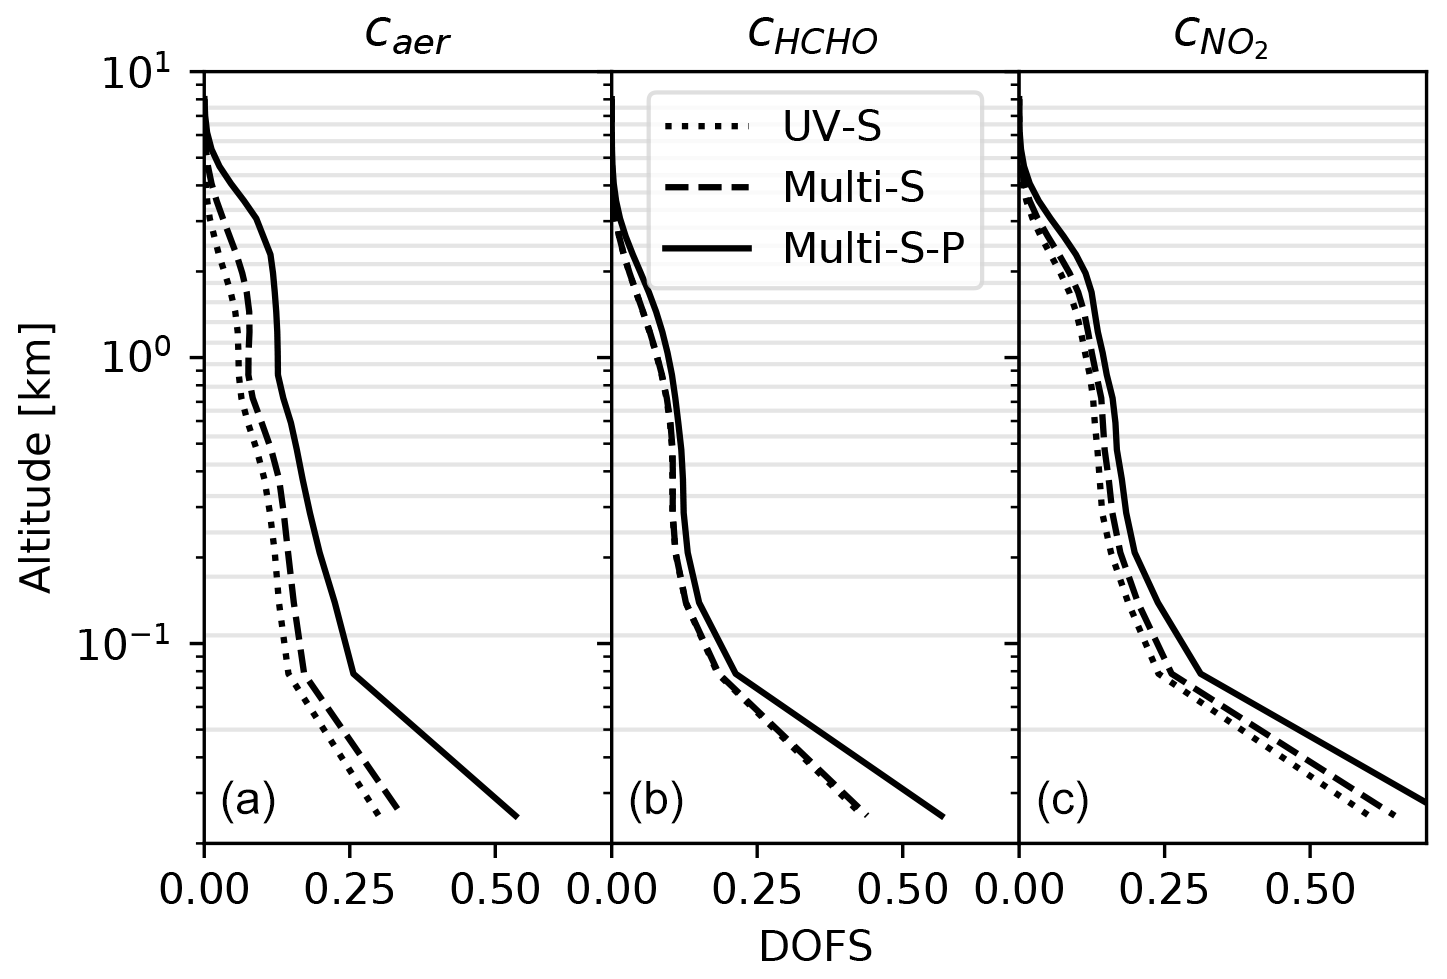
Figure 5Average DOFS vertical profiles for aerosol (a), HCHO (b), and NO2 (c) concentrations. Different measurement modes were simulated as indicated in the legend. Horizontal grey lines indicate model-layer boundaries.
The effect of the simultaneous retrieval of aerosol and trace gases (flag S) can be inferred by comparing the measurement modes UV and UV-S as well as Vis and Vis-S. As expected, the information content in aerosol profiles and properties is slightly enhanced (by about 0.3 and 0.4 DOFS, respectively), since both the O4 dSCDs and trace gas dSCDs are sensitive to aerosols (aerosols affect slant light paths). On the other hand, information on trace gas concentrations is reduced ( DOFS), since the retrieval now encompasses cross-sensitivity to aerosol parameters with concomitant propagation of retrieval errors. Both effects were absent in earlier MAX-DOAS retrieval algorithms, the latter effect causing an underestimation of the trace gas profile error. The gain in information slightly prevails, resulting in an increase of about 0.3 DOFS in the total information content.
The information content in the measurements can further be enhanced by including almucantar scans (flag A) and spectral broadband features (flag I). Our investigations show that, compared to conventional non-polarimetric monochromatic retrievals (even when summing the DOFS obtained for the UV and Vis modes), the total information content of MAX-DOAS observations can be more than doubled by including multi-spectral, polarimetric dSOT and dSCD observations under optimised viewing geometries. In general, information content on coarse-mode aerosol properties remains low (less than 5 of 14 possible DOFS) for all measurement modes, even for the Multi-S-P-A-I mode. The impact of the aerosol size distribution on the DOFS is discussed in more detail below.
We further investigated the manner in which the DOFS depend on aerosol VCDs. Simulations at , for different aerosol VCDs were performed, assuming an exponential caer profile with a scale height of 1 km. The TG1 scenario was chosen for the trace gas profiles. DOFS values for the three measurement modes and three parameter subgroups are illustrated in Fig. 6. For small AOTs (<0.2) the DOFS values for profiles remain constant. For higher values, the horizontal visibility range in the atmosphere and thus the sensitivity decreases. The DOFS for the surface albedo is generally low for non-polarimetric measurements. For multispectral measurements, highest values (DOFS of ≈5 for albedos at six different wavelengths) are obtained for low aerosol loads. The albedo sensitivity mostly originates from observations at low EAs, where a significant fraction of detected light experiences reflection from the depolarising Lambertian surface before being scattered into the line of sight. In conventional non-polarimetric aerosol retrievals from O4 dSCDs, this effect is barely noticeable, since the resulting light path enhancement is small. In contrast, the observed polarisation state is strongly affected and thus very sensitive to the surface properties. For aerosol properties, there are two limiting factors: with decreasing aerosol abundance, of course the sensitivity towards aerosol properties decreases. On the other hand, DOFS also decrease with high AOTs, again due to the reduced horizontal visibility range in the atmosphere. Maximum DOFS are achieved at AOTs around unity.
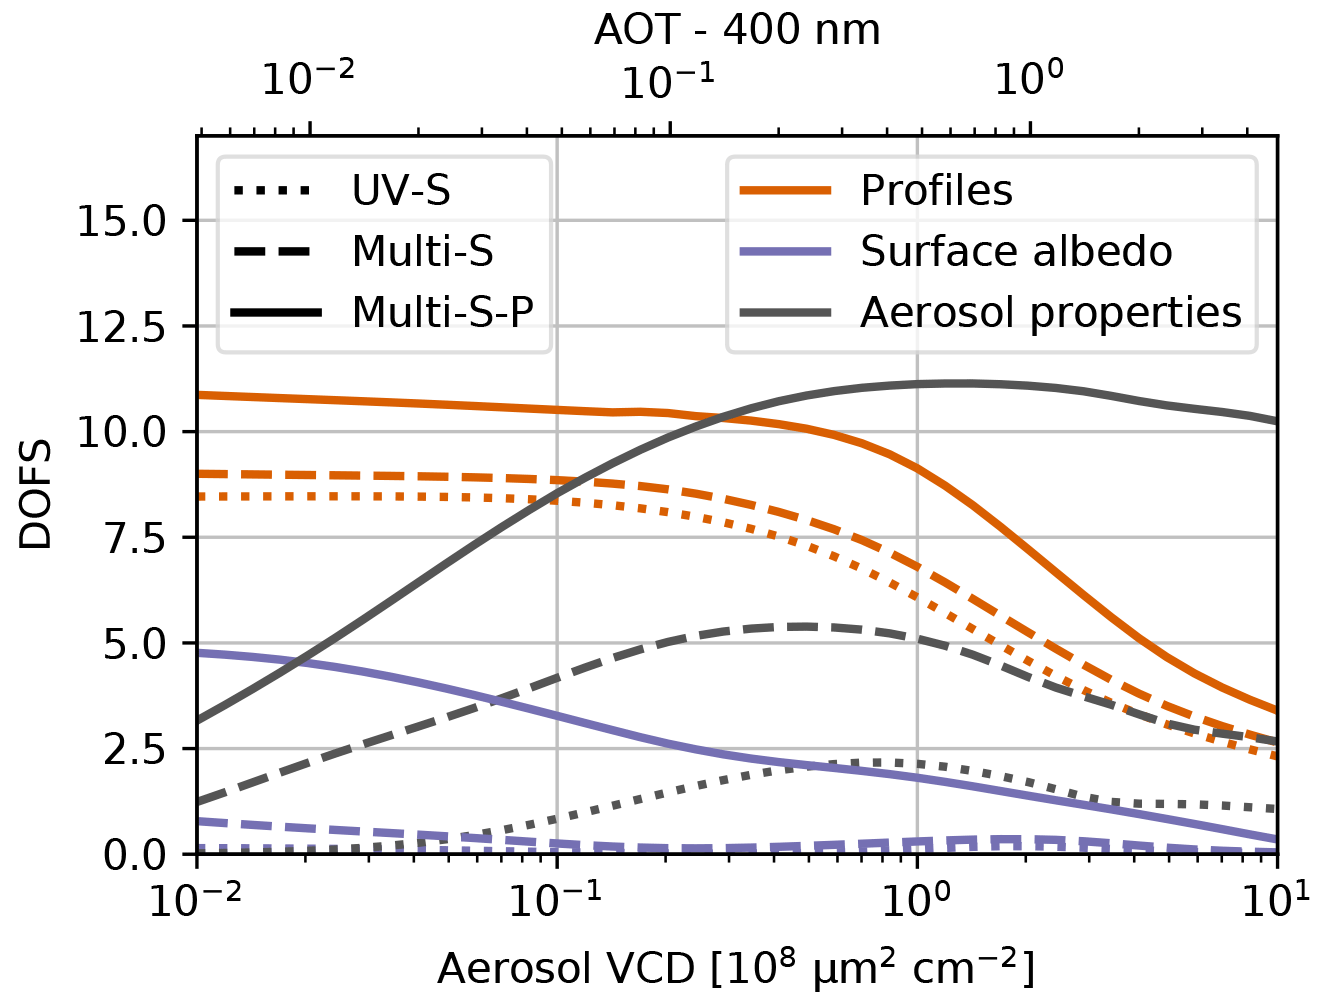
Figure 6Dependence of DOFS on aerosol VCD for different measurement modes. For the detailed settings, see the main text.
Figure 7 shows the dependence of DOFS on the aerosol size for monomodal Mie aerosol with properties as defined for the fine mode in Table 4, but with different mode radii r1. We assume profile scenarios Aer1-TG1, and . Note that the aerosol surface area is kept constant, whereas the AOT varies with r1, due to changes in aerosol scattering efficiency. For the UV-S and the Multi-S-P mode, there is a limited number of particle size ranges having significant sensitivity to all aerosol parameters. This is expected to some degree; the dependence of aerosol extinction efficiency on particle size parameter exhibits an abrupt rise at size parameters close to unity (the transition between Rayleigh and Mie scattering). The shape of this rise strongly depends on the aerosol microphysical properties, and thus observations at corresponding wavelengths are expected to yield most information. Consequently, for the Multi-S-P mode (which also includes the larger Vis wavelengths), the upper limit of the r1 range for which good information can be obtained is higher than that obtained with UV-S. By adding an almucantar scan (A), the range cannot be further extended (not shown in the figure). In contrast, including (P), (A) and (I) simultaneously yields DOFS close to unity for all aerosol parameters and sizes up to r1=2 µm. Recall, however, that in Fig. 7 we consider monomodal aerosol. The general lack of information on coarse aerosol indicated in Fig. 3 suggests that in the bi-modal case the modes are barely distinguishable. Sensitivity of the size range could be enhanced by further extending the spectral range of observations towards higher wavelengths. Interestingly, all measurement modes shown yield very good information on r1 for small radii, while the information on the modal width increases with r1.
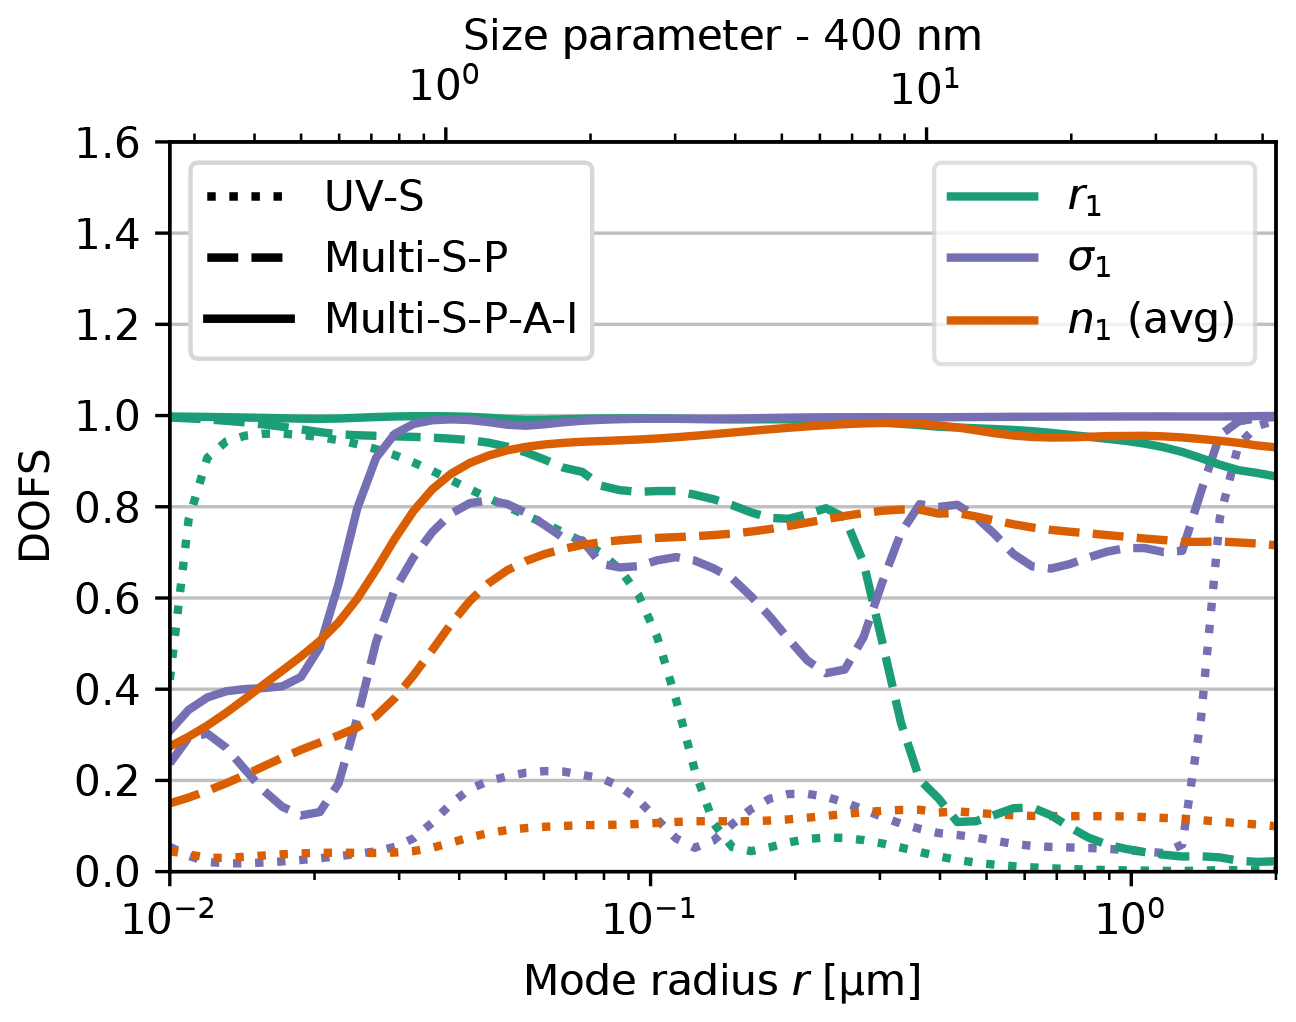
Figure 7Dependence of DOFS on the aerosol size for different measurement modes. n1 are the average DOFS per refractive index parameter (comprising real and imaginary parts at multiple wavelengths). The size parameter on the top axis was calculated from the mode effective radius. For details on the settings, see the main text.
The information content of polarimetric MAX-DOAS observations is expected to depend on the set of viewing geometries at which measurements are provided. Figure 8 shows the dependence of DOFS (for the Multi-S-P mode) on the SZA and the elevation scan RAA. Interestingly, for both aerosol and trace gas profiles the dependence is rather weak, whereas for the surface albedo and aerosol properties there is a stronger dependence with peak-to-peak changes of approximately 2 DOFS. The total information content is lowest for elevation scans close to the Sun, where the single scattering angles realised over the elevation scan are smaller than those at larger RAA values. This suggests that polarimetric information is maximised at viewing directions with single scattering angles close to 90∘ (where the largest DOLP values are expected). This is certainly the case for all EAs for instance if SZAs are large and elevation scan RAAs are close to 90∘. In fact, for SZA , (local) maxima in DOFS can be observed around RAAs for all parameter subgroups.
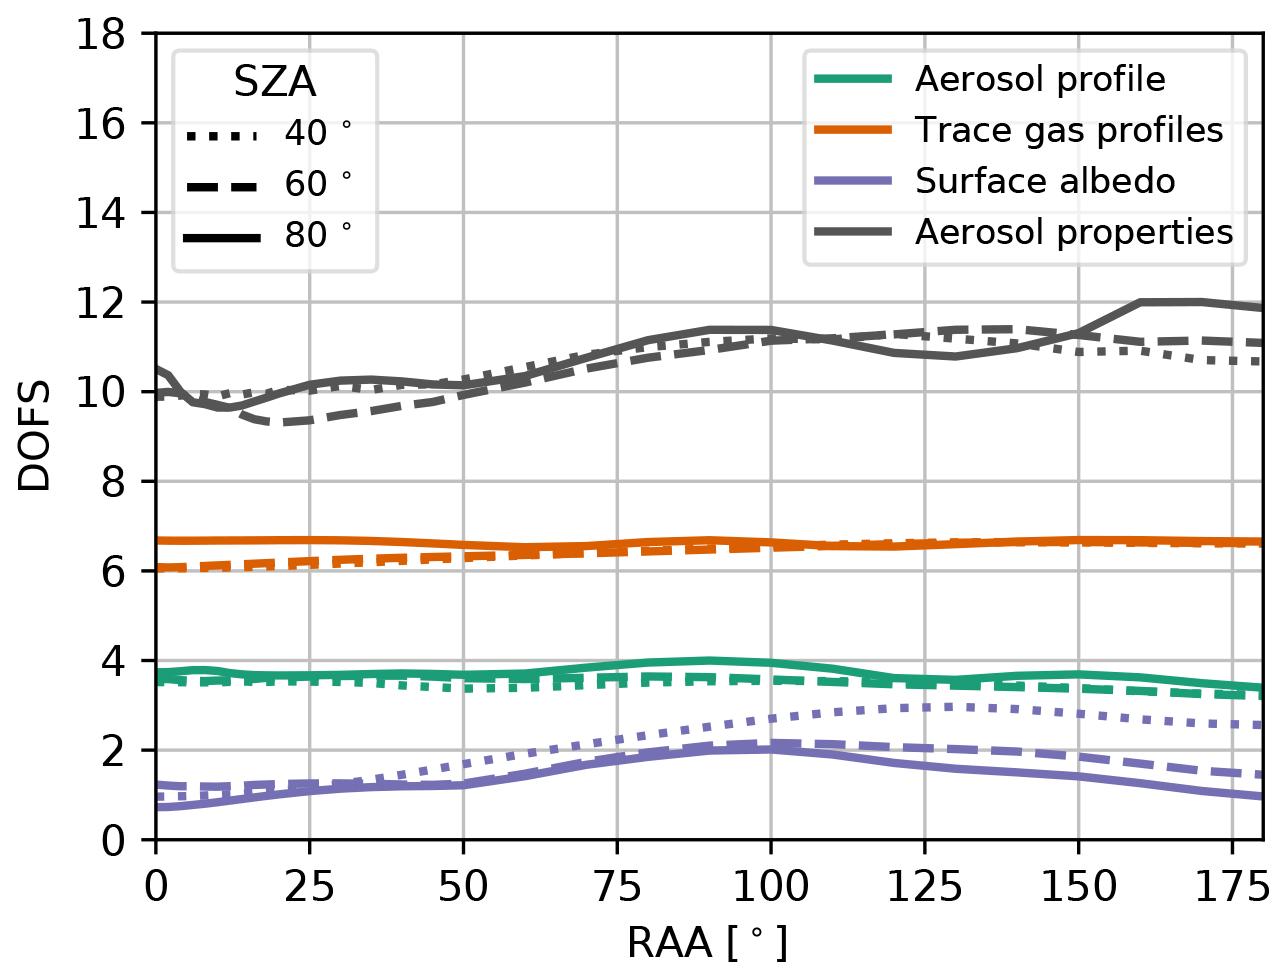
Figure 8Dependence of the DOFS for the Multi-S-P mode on the viewing geometry, namely different SZAs (line styles) and elevation scan RAAs (x axis). Simulations were performed for the profile scenario Aer1-TG1.
The question arises whether elevation scans performed at a fixed RAA are the ideal measurement geometry. To investigate this further, we tested information content with sets of measurements made with a “tilted elevation scan” geometrical configuration; for this, we assume the same set of EAs as before, but calculate RAAs for each EA according to
Here, ϕ90 represents the RAA at which the single scattering angle is closest to 90∘ for given SZA θ and EA α. The resulting geometry for is illustrated in Fig. S5. The total DOFS obtained for such a tilted elevation scan, assuming Aer1-TG1 profiles and measurement-mode Multi-S-P, yield 23.8. This is slightly smaller than the total DOFS of 24.4, achieved with a conventional vertical elevation scan at for the same atmospheric conditions (see Fig. 8). This suggests that the tilted elevation scan configuration has no advantage over conventional elevation scans performed at fixed RAA.
So far, we have assumed that measurements are performed at three fixed PAs . However, the DOFS can be increased if measurements are performed at only two optimised PAs. For many viewing directions and conditions, the orientation of the skylight polarisation χ can be reasonably predicted, since it is approximately perpendicular to the Sun's incident angle θ′ into the instrument FOV. It can be shown that
where θ′ is given with respect to the horizon, increasing clockwise when looking towards the instrument. Consequently, we find
Thus, two spectra recorded with the polariser's transmitting axis parallel and perpendicular to the predicted value of χ are then sufficient to constrain firmly the state of polarisation of skylight, and these two spectra should yield nearly the same information as that achieved with three PAs. In fact, simulations for , , Mie aerosol, and Aer1-TG1 profiles yield almost the same value of total DOFS for both approaches: with the two optimised PAs one achieves 22.7 DOFS; with three PAs 60∘ apart, the figure is 23.0 DOFS. The approach with two angles improves the temporal resolution by a factor of . Alternatively, the exposure times per spectrum could be enhanced by a factor of , which yields a corresponding gain in light, thus resulting in reduced dSCD uncertainties by a factor of (assuming that DOAS analysis results are photon shot-noise limited). Considering this, one obtains an increase in total DOFS of up to 23.5.
To further improve the temporal resolution of MAX-DOAS measurements, it is to determine to what extent the number of viewing directions might be reduced without significant loss of information. To test this idea, we used measurement-mode Multi-S-P-A, Mie aerosol, , , and Aer1-TG1 and calculated the total DOFS for two cases: (1) with the full elevation and almucantar scans according to Table 3 and (2) with reduced elevation () and solar almucantar scans (). The two cases yield total DOFS of 28.2 and 27.6, respectively. This is a surprisingly small decrease in information considering the strong reduction in the number of viewing directions (from 38 to 15).
From the results presented in this section we conclude that there is a high potential for the optimisation of measurement geometries. Looking ahead, optimal geometries for different numbers of viewing directions might be investigated by performing more comprehensive studies in this direction.
In this section, synthetic observations are used as input for RAPSODI to perform actual inversions. This was done for a reduced data set of observations corresponding to seven combinations of aerosol and trace gas profiles (Aer1-TG6, Aer2-TG5, Aer3-TG4, Aer4-TG1, Aer5-TG2, Aer6-TG7, and Aer7-TG3) for and . As before, different measurement modes are realised by providing different sets of observations to RAPSODI. Each inversion was performed 11 times: 10 times (to obtain some statistics) with a random noise component added to with standard deviations according to the assumed uncertainties in Table 1 and once more with having no noise (exact simulated observations). Figures 9 and 10 show the retrieval results for two selected Aer-TG scenarios, comparing the ground truth and a priori and retrieved state vector elements. Results for the remaining Aer-TG scenarios are shown in Figs. S6–S10. Figure S11 illustrates the quality of the retrieval convergence (comparison of the input observations with the modelled observations for the retrieved atmospheric states). Figure 11 shows a statistical representation of all retrieval results.
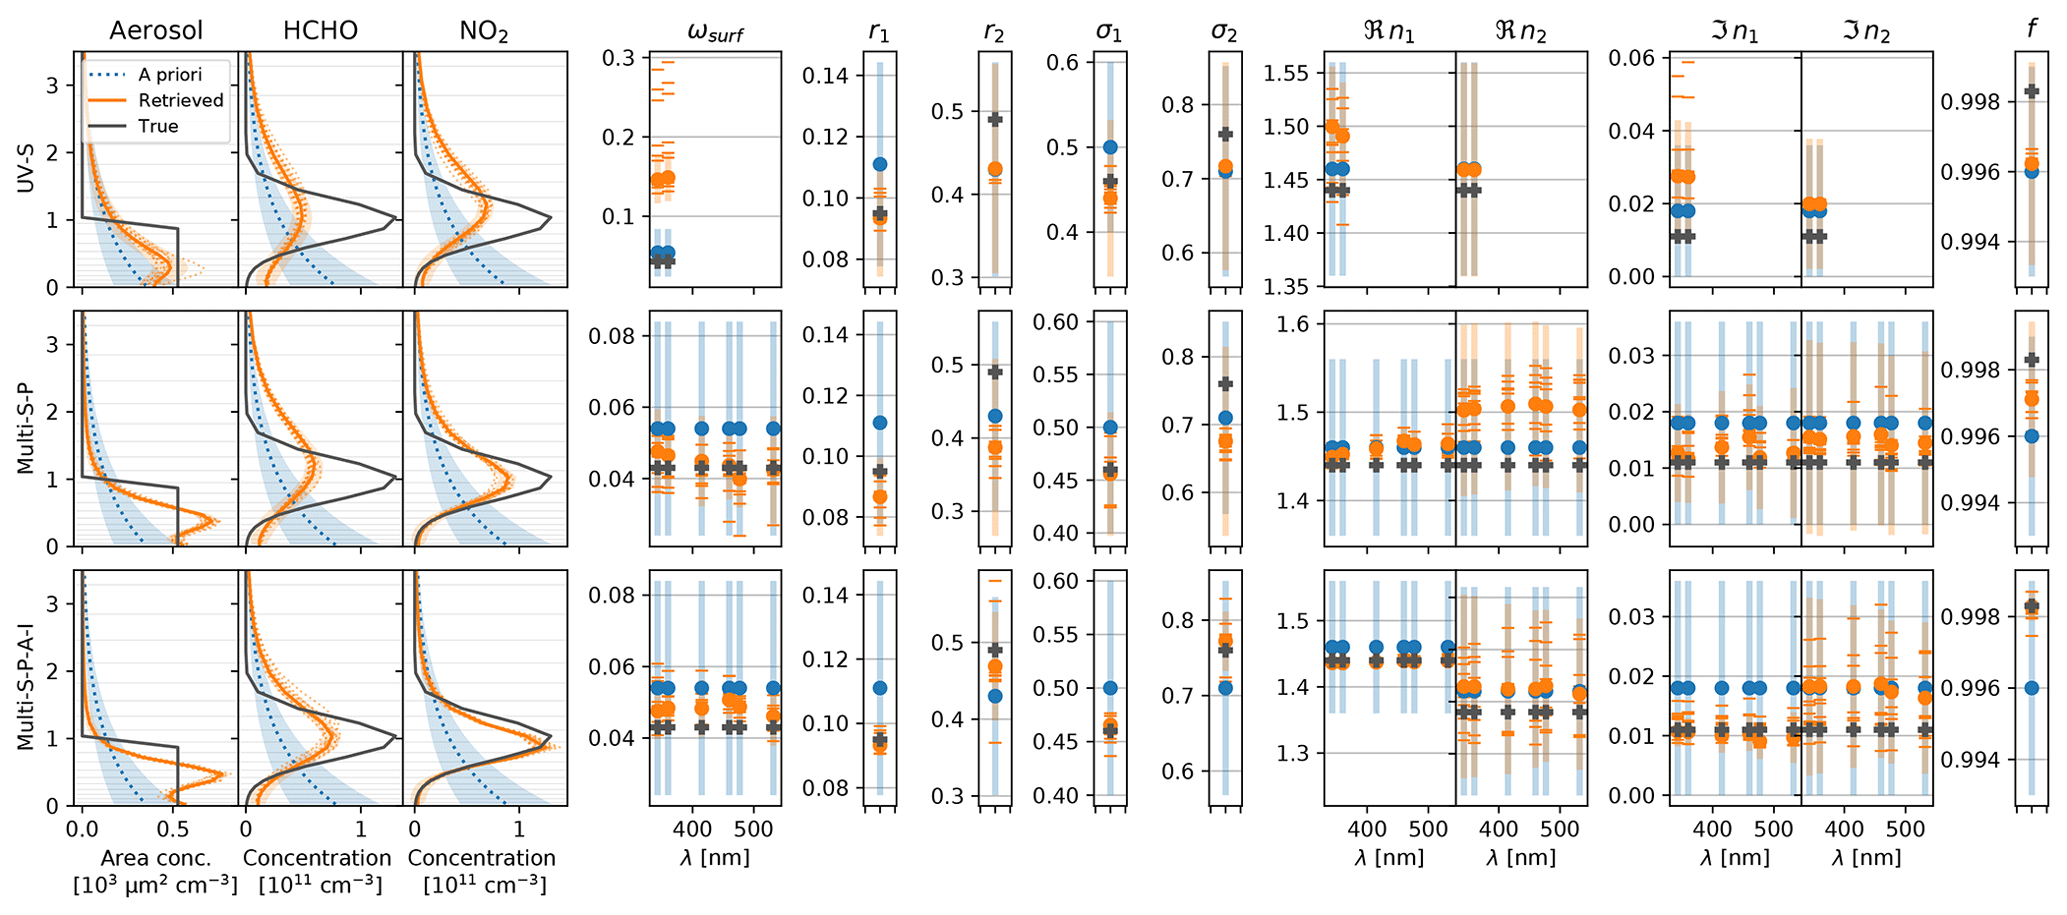
Figure 9Retrieval results for the Aer6-TG7 scenario. Different subplot rows show different measurement modes (see captions on the left). The first three subplot columns show profiles with altitude in kilometres on the y axis. The remaining columns show values (y axis) of other state vector elements (see captions at the top), occasionally for different wavelengths (x axis). Blue lines and symbols show a priori values, and dark grey lines and crosses show true values. Thick orange lines and circles indicate results for a noiseless retrieval, while thin dotted lines and dashes indicate the results of the 10 retrievals with random noise added to the observations. Transparent areas and bars indicate uncertainties.


Figure 11Statistical representation of all retrieval results, grouped by parameter (different subplots) and different measurement modes (box colours according to the legend). The y axis represents the difference to the true value, normalised by the a priori uncertainty. The latter is indicated by the grey shaded areas. Where possible, dotted grey lines indicate the a priori value. Deviations ≪1 with little bias towards the a priori indicate a successful retrieval. Boxes span the 25th to 75th, whiskers the 5th to 95th percentiles. Dashes indicate the median, and diamonds indicate the median of the retrievals from noiseless observations.
Generally, all retrievals converged well (see Fig. S11): deviations between and are mostly within the measurement uncertainties that define the magnitude of the synthetic random noise added to . Interestingly, these deviations are largest for the UV-S case even though, compared to the other modes, the retrieval fits fewer measurements by optimising the same set of state vector elements. The same is true when comparing Multi-S-P and Multi-S-P-A-I. This indicates that fewer observations increase the risk of the inversion ending up in a local minimum of the OEM cost function. This is supported by the retrieval results in Fig. 11: particularly for the UV-S mode, the retrieval sometimes diverges (e.g. for ωsurf, ωhg, and ℑn1) instead of converging to the a priori values (e.g. in the case of n2 or f). This phenomenon might be related to the non-linearity of the inverse problem. Nevertheless, the results mostly behave as one would expect from the information content analysis in Sect. 7. The example retrieval results shown in Figs. 9 and 10 demonstrate that the major features of the profiles are well captured by the retrieval, particularly with the Multi-S-P and Multi-S-P-A-I modes. The incorporation of polarisation (comparison between the Multi-S and Multi-S-P modes) significantly improves the results for aerosol columns and surface concentrations. Further, it strongly stabilises the retrieval with respect to surface albedo and fine-mode refractive indices. For some microphysical properties (e.g. r1, σ1, f), the results degrade. This can partly be attributed to stronger biases towards the a priori for the Multi-S mode, leading to more stable results. Nevertheless, the overall RMSD (root-mean-square deviation) between retrieved and true aerosol property values is reduced by about 40 %, this being mainly due to the strong improvement in the refractive index retrievals (note that they are retrieved at multiple wavelengths). In conclusion, the retrieval of microphysical properties is feasible, but useful results are mostly achieved only for fine-mode properties and only when the Multi-S-P-A-I mode is in force.
So far we have assumed equal uncertainties for non-polarimetric and polarimetric observations. This can only be achieved for polarimetric observations if the instrument has a higher light throughput or if measurement times are longer than those required for measurements without polarisation sensitivity. However, if the same type of instrument applies and a similar time resolution is desired, two aspects need to be considered: (1) for the type of instrument assumed for this work, on average half of the light entering the telescope will be rejected by the linear polariser, and (2) for non-polarimetric dSCDs, a single spectrum has to be recorded at each viewing direction, whereas for polarimetric observations as assumed above, three spectra need to be recorded in the same time period (neglecting any time losses due to repositioning of the polariser). Hence, regarding individual polarimetric observations, only one-sixth of the light will be available compared to the non-polarimetric equivalents (even though the effective loss of light is only by a factor of 2). With the precision of MAX-DOAS dSCDs typically limited by photon shot noise, the uncertainty of individual polarimetric dSCDs is therefore expected to increase by a factor of . The situation is different for dSOTs; here the initial uncertainty of 2 % is assumed to be dominated by systematic effects (e.g. instrumental misalignment) and is much larger than typical photon shot noise uncertainty in DOAS applications (). Hence, for dSOTs the loss of light is expected to have a negligible impact on the measurement accuracy.
From a practical standpoint, there are several considerations to bear in mind.
-
As discussed in Sect. 8, the polariser positions δ could be optimised during the measurement in order to enhance the information content per spectrum, as opposed to the approach with three fixed polariser positions taken here.
-
MAX-DOAS dSCDs are prone to systematic errors, for instance due to uncertainties in the literature cross-sections, instrumental effects or simplifying assumptions in the DOAS spectral analysis. Further, deviations between measured and modelled dSCDs that are much larger than the actual measurement accuracy might occur because of horizontal and temporal variability in the atmosphere.
-
Alternative instrumental set-ups detecting two polarisation directions simultaneously are conceivable.
To this end, we have repeated the above investigations assuming an increased uncertainty (factor ) for all polarimetric dSCDs. The results are shown in Sect. S5. However, for the reasons given above, the truth might lie somewhere between the idealised situation and the case with increased uncertainty. As expected, the information gain obtained from polarimetric observations is generally lower under enhanced noise conditions, in general this varies by different amounts for different parameter subgroups. The gain in information on aerosol properties is not much affected (ΔDOFS between Multi-S and Multi-S-P mode decreases by about 15 %), since a large part of the information here is inferred from the polarimetric dSOTs, rather than from the dSCDs. In contrast, the information gain for the vertical profiles is significantly reduced. For aerosol profiles, the increase in DOFS between the Multi-S and Multi-S-P measurement modes is ΔDOFS=0.6, instead of ΔDOFS=1.2 (as reported in Sect. 7). In particular, the use of polarimetric observations even reduces the information on trace gas profiles for both HCHO () and NO2 (), indicating that the disadvantage caused by reduction of light due to the presence of the polariser overrides any advantages to be gained through the use of polarimetry. Figure S13 shows a degradation of the retrieval accuracy for the polarisation incorporating measurement modes; nevertheless, the main conclusions drawn in Sect. 9 remain qualitatively valid.
The forward models in MAX-DOAS retrievals assume horizontally homogeneous atmospheres over typical MAX-DOAS horizontal sensitivity ranges of several kilometres. Furthermore, a single atmospheric state is retrieved from observations acquired over time periods of several minutes. Clearly, spatio-temporal variability can in principle cause deviations between modelled and measured observations that are much larger than actual measurement uncertainties. Ideally, the retrieved atmospheric state in such cases corresponds to a kind of spatio-temporal average. However, large variability is expected to induce significant biases in the results or even prevent the inversion from achieving reasonable convergence. In order to investigate the impact of spatio-temporal variability on the retrieval results, we simulated inhomogeneity by adding random noises of different relative magnitudes (0 %, 2 %, 4 %, 6 %, 8 %, and 10 %) to the observations (in addition to the noise that is expected from the measurement uncertainties) before performing the same retrievals as those discussed in Sect. 9, but this time limited to the Aer1-TG1 case. This “inhomogeneity noise” was assumed identical for all observations in the same viewing direction. For each inhomogeneity magnitude level, 10 retrievals were performed, each time recalculating the random noise pattern. To put the noise magnitudes into perspective: Frieß et al. (2019) for instance assume an inhomogeneity noise of 5 % for their synthetic studies, inspired by the dSCD RMSD observed between different MAX-DOAS instruments during the CINDI-2 campaign (Kreher et al., 2020). However, depending on location and conditions, variabilities can be much larger. Figure S14 shows a statistical representation of the results for the Multi-S-P and Multi-S-P-A-I measurement modes. In the most problematic cases – for instance coarse-mode aerosol properties and surface albedo – the results already exceed the a priori uncertainty (grey-shaded area) at noise levels of a few percent. In contrast, the effect on trace gas VCDs and surface concentrations is small. Also, the retrieval of fine-mode aerosol properties still yields useful results (deviations from the truth are smaller than the a priori uncertainty) in the presence of inhomogeneities, at least for the Multi-S-P-A-I mode.
In this work, we have developed and tested a novel retrieval algorithm (RAPSODI), capable of processing polarimetric MAX-DOAS observations; the algorithm utilises the corresponding information to retrieve vertical distributions of aerosol and trace gases as well as aerosol properties. Furthermore, in contrast to earlier MAX-DOAS algorithms, RAPSODI retrieves all species of interest simultaneously in a shared model atmosphere, enabling us to infer aerosol microphysical properties through the use of a Mie scattering model.
Based on the use of synthetic measurement data, the algorithm was used to assess the potential of polarimetry in ground-based MAX-DOAS applications. Our results suggest that polarimetric information significantly increases the total information content of MAX-DOAS observations (about 50 % increase in total DOFS), in particular for aerosol related quantities. Table 7 provides a succinct summary: it shows the relative improvement in information content (in terms of DOFS) and retrieval accuracy (in terms of RMSD between the retrieval results and the true values) for crucial parameters when going from non-polarimetric (Multi-S mode) to polarimetric (Multi-S-P) retrievals from elevation-scan data. All atmospheric parameters are retrieved (comprising aerosol profiles, trace gas profiles and aerosol microphysical properties, surface albedo and aerosol mode fraction). DOFS values represent averages over all atmospheric scenarios and viewing geometries as described and applied in Sects. 6 and 9. In the table we distinguish between an idealised case, which assumes the same measurement error for non-polarimetric and polarimetric observations (compare Sect. 7) and an increased-noise case, in which an increased noise (factor ) is assumed for the polarimetric dSCD observations (compare Sect. 10). The increase in total DOFS (sum over DOFS for all parameters) ranges between 40 % (increased-noise) and 60 % (idealised case). The increase in information is largest for aerosol-related quantities, whereas for trace gas profiles, the DOFS enhancement is generally small and even degrades for the increased-noise case. Similar patterns emerged in the retrieval accuracy: the RMSD decrease is largest for aerosol related quantities. A notable exception lies with concentrations in the surface layer, where the accuracy improves for all species (including trace gases) by about 70 % and 40 % in the idealised and the increased-noise cases, respectively. It seems that accurate knowledge of aerosol loading is much more important for the retrieval of surface trace gas concentrations than for the retrieval of trace gas VCDs.
Table 7Approximate relative changes in information (DOFS) and accuracy (RMSD between retrieval results and true values) between non-polarimetric (Multi-S mode) and polarimetric (Multi-S-P) retrievals from elevation-scan observations. Positive numbers indicate improvements (increase in DOFS or a decrease in RMSD).

a Identical measurement noise for non-polarimetric and polarimetric observations. b Increased noise for polarimetric observations. c Values refer to the concentrations in the surface layer.
In the Multi-S-P mode and assuming the idealised noise case, fine- and coarse-mode parameters can be retrieved to accuracies of 30 % and 70 % of the a priori uncertainty, respectively. However, some coarse-mode parameters (r2, ℑn, and also f) are still strongly biased towards the a priori, owing to limited information inherently available in the measurements. When a solar almucantar viewing configuration and broadband spectral information are also incorporated (Multi-S-P-A-I mode), the information can be further increased by about 50 % (relative increase in total DOFS compared to the Multi-S-P mode), with the largest increase for aerosol microphysical properties (70 %). Fine- and coarse-mode parameters can then be retrieved to accuracies of 10 % and 30 % of the a priori uncertainty, and a priori biases for coarse-mode parameters are strongly reduced.
Things change again when potential inhomogeneities in the atmosphere are taken into account (simulated by adding an additional noise of up to 10 % to the observations). In particular, the retrieval of surface albedo and coarse-mode microphysical properties becomes extremely unstable or even impossible. For other parameters, the results degrade but remain useful in the sense that deviations from the true values mostly remain smaller than a priori uncertainties. In future, the situation could be improved by extending the spectral range and by linking parameters of different aerosol size modes (e.g. assuming a common refractive index for both fine and coarse modes).
The ability of RAPSODI to retrieve all atmospheric species simultaneously in a single model atmosphere has some advantages: on the one hand, the algorithm exploits additional information on aerosol contained in the trace gas dSCDs (increasing the DOFS of aerosol profiles by about 20 %). Conversely, this approach for the first time propagates the uncertainties of the light path constraining aerosol abundances and aerosol properties into the trace gas profiles. As a consequence, the information on the latter is reduced by about 15 %.
Finally, it should be noted that results presented in this study depend on a priori assumptions. The DOFS is a measure of the information gain relative to the a priori knowledge (see Eq. 18). In addition, the a priori biases of the retrieval results are expected to change with the choice of xa and Sa. In an ideal case, Sa is calculated by inferring expected variability as well as retrieval parameter cross-correlations from climatologies. These are obviously space- and time-dependent, and the same applies to Sa. Furthermore, Sa often contains some arbitrary component, which may be introduced as a result of simplifying assumptions, and sometimes Sa is tweaked to prevent divergence of the inversion. The impact of the choice of Sa on the obtained DOFS is estimated in Fig. S15 in the Supplement. Our findings suggest that, even though the numbers may change, the major conclusions drawn in this study remain valid.
Outlook
Although our studies with synthetic data provide a first analysis of the potential of polarimetric MAX-DOAS measurements, the jury is still out until real observations have been thoroughly investigated and validated. To this end, we have constructed and operated a PMAX-DOAS instrument as described in Sect. 3, and we have taken a series of measurements at the Hohenpeißenberg site in southern Germany. Presentation of the campaign results is beyond the scope of the present paper. However, they are discussed in detail in Tirpitz (2021), and we summarise the major findings here: indeed, the first evaluations were successful and confirm our findings regarding the information content analysis in Sect. 7. However, validation of the retrieval results turned out to be difficult due to the lack of representative and accurate independent observations. Furthermore, there are indications that some of the assumptions made in the RAPSODI algorithm are too simple: in particular, the assumption of a Lambertian surface albedo and vertically homogeneous aerosol properties might be critical when performing polarimetric retrievals from field data. Another important aspect is the impact of clouds. While MAX-DOAS inversions of trace gas VCDs and surface concentrations from non-polarimetric dSCDs are surprisingly robust under cloudy conditions (e.g. Frieß et al., 2011, 2016), corresponding investigations for the retrieval of the full state vector (according to Sect. 5.4) from polarimetric observations still need to be performed. It is not yet clear to what extent and in what way clouds affect observed polarimetric dSOTs and dSCDs, nor is it known how reliably the individual state vector elements can be retrieved under cloudy conditions. Also, different cloud-filtering approaches might be investigated to improve such retrievals at the cost of available data.
The RAPSODI algorithm and the synthetic data set can be obtained from the authors on request.
The supplement related to this article is available online at: https://doi.org/10.5194/amt-15-2077-2022-supplement.
JLT implemented the RAPSODI retrieval algorithm, performed the presented investigations, and wrote the first draft of the manuscript. UF initiated the investigations and contributed to all activities in his role as the primary supervisor of the project. RS optimised the VLIDORT software package for the purposes described and provided support with its use. UP contributed to the conceptualisation, scientific discussion, and interpretation. All the authors contributed to the manuscript.
At least one of the (co-)authors is a member of the editorial board of Atmospheric Measurement Techniques. The peer-review process was guided by an independent editor, and the authors also have no other competing interests to declare.
Publisher's note: Copernicus Publications remains neutral with regard to jurisdictional claims in published maps and institutional affiliations.
Jan-Lukas Tirpitz thanks André Butz and Klaus Pfeilsticker for fruitful discussions on inversion theory. We were financially supported by the Heidelberg Graduate School for Physics and by André Butz. We are grateful for financial support by the Open Access Publishing Fund of Ruprecht-Karls-Universität Heidelberg.
This research has been partly supported by German Research Association (DFG) project RAPSODI (grant no. 272342164), the Heidelberg Graduate School for Physics, André Butz, and the Open Access Publishing Fund of Ruprecht-Karls-Universität Heidelberg.
This paper was edited by Michel Van Roozendael and reviewed by two anonymous referees.
Arago, F.: Oeuvres complètes de François Arago, vol. 17, Gide et J. baudry, 1862. a
Beirle, S., Dörner, S., Donner, S., Remmers, J., Wang, Y., and Wagner, T.: The Mainz profile algorithm (MAPA), Atmos. Meas. Tech., 12, 1785–1806, https://doi.org/10.5194/amt-12-1785-2019, 2019. a
Bernal, A.: Validation and application of SCIATRAN polarisation simulations for ground-based multi-axis DOAS measurements, Master's thesis, University of Bremen, Bremen, 2017. a
Boesche, E., Stammes, P., Ruhtz, T., Preusker, R., and Fischer, J.: Effect of aerosol microphysical properties on polarization of skylight: sensitivity study and measurements, Appl. Optics, 45, 8790–8805, https://doi.org/10.1364/AO.45.008790, 2006. a, b
Bösch, T., Rozanov, V., Richter, A., Peters, E., Rozanov, A., Wittrock, F., Merlaud, A., Lampel, J., Schmitt, S., de Haij, M., Berkhout, S., Henzing, B., Apituley, A., den Hoed, M., Vonk, J., Tiefengraber, M., Müller, M., and Burrows, J. P.: BOREAS – a new MAX-DOAS profile retrieval algorithm for aerosols and trace gases, Atmos. Meas. Tech., 11, 6833–6859, https://doi.org/10.5194/amt-11-6833-2018, 2018. a
Bussemer, M.: Der Ring-Effekt: Ursachen und Einfluß auf die spektroskopische Messung stratosphärischer Spurenstoffe, Master's thesis, University of Heidelberg, Heidelberg, 1993. a
Chan, K. L., Wang, Z., Ding, A., Heue, K.-P., Shen, Y., Wang, J., Zhang, F., Shi, Y., Hao, N., and Wenig, M.: MAX-DOAS measurements of tropospheric NO2 and HCHO in Nanjing and a comparison to ozone monitoring instrument observations, Atmos. Chem. Phys., 19, 10051–10071, https://doi.org/10.5194/acp-19-10051-2019, 2019. a
Chandrasekhar, S.: Radiative transfer, Courier Corporation, ISBN 0486605906, 2013. a
Clémer, K., Van Roozendael, M., Fayt, C., Hendrick, F., Hermans, C., Pinardi, G., Spurr, R., Wang, P., and De Mazière, M.: Multiple wavelength retrieval of tropospheric aerosol optical properties from MAXDOAS measurements in Beijing, Atmos. Meas. Tech., 3, 863–878, https://doi.org/10.5194/amt-3-863-2010, 2010. a, b
De Rooij, W. and Van der Stap, C.: Expansion of Mie scattering matrices in generalized spherical functions, Astron. Astrophys., 131, 237–248, 1984. a
Deschamps, P., Breon, F., Leroy, M., Podaire, A., Bricaud, A., Buriez, J., and Seze, G.: The POLDER mission: instrument characteristics and scientific objectives, IEEE T. Geosci. Remote, 32, 598–615, https://doi.org/10.1109/36.297978, 1994. a
Dubovik, O. and King, M. D.: A flexible inversion algorithm for retrieval of aerosol optical properties from Sun and sky radiance measurements, J. Geophys. Res.-Atmos., 105, 20673–20696, https://doi.org/10.1029/2000jd900282, 2000. a
Dubovik, O., Holben, B., Eck, T. F., Smirnov, A., Kaufman, Y. J., King, M. D., Tanré, D., and Slutsker, I.: Variability of absorption and optical properties of key aerosol types observed in worldwide locations, J. Atmos. Sci., 59, 590–608, 2002. a, b
Dubovik, O., Sinyuk, A., Lapyonok, T., Holben, B. N., Mishchenko, M., Yang, P., Eck, T. F., Volten, H., Muñoz, O., Veihelmann, B., van der Zande, W. J., Leon, J.-F., Sorokin, M., and Slutsker, I.: Application of spheroid models to account for aerosol particle nonsphericity in remote sensing of desert dust, J. Geophys. Res., 111, D11208, https://doi.org/10.1029/2005JD006619, 2006. a
Emde, C., Buras, R., Mayer, B., and Blumthaler, M.: The impact of aerosols on polarized sky radiance: model development, validation, and applications, Atmos. Chem. Phys., 10, 383–396, https://doi.org/10.5194/acp-10-383-2010, 2010. a
Friedrich, M. M., Rivera, C., Stremme, W., Ojeda, Z., Arellano, J., Bezanilla, A., García-Reynoso, J. A., and Grutter, M.: NO2 vertical profiles and column densities from MAX-DOAS measurements in Mexico City, Atmos. Meas. Tech., 12, 2545–2565, https://doi.org/10.5194/amt-12-2545-2019, 2019. a
Frieß, U., Monks, P., Remedios, J., Rozanov, A., Sinreich, R., Wagner, T., and Platt, U.: MAX-DOAS O4 measurements: A new technique to derive information on atmospheric aerosols: 2. Modeling studies, J. Geophys. Res., 111, D14203, https://doi.org/10.1029/2005JD006618, 2006. a, b, c, d
Frieß, U., Sihler, H., Sander, R., Pöhler, D., Yilmaz, S., and Platt, U.: The vertical distribution of BrO and aerosols in the Arctic: Measurements by active and passive differential optical absorption spectroscopy, J. Geophys. Res., 116, D00R04, https://doi.org/10.1029/2011JD015938, 2011. a
Frieß, U., Klein Baltink, H., Beirle, S., Clémer, K., Hendrick, F., Henzing, B., Irie, H., de Leeuw, G., Li, A., Moerman, M. M., van Roozendael, M., Shaiganfar, R., Wagner, T., Wang, Y., Xie, P., Yilmaz, S., and Zieger, P.: Intercomparison of aerosol extinction profiles retrieved from MAX-DOAS measurements, Atmos. Meas. Tech., 9, 3205–3222, https://doi.org/10.5194/amt-9-3205-2016, 2016. a
Frieß, U., Beirle, S., Alvarado Bonilla, L., Bösch, T., Friedrich, M. M., Hendrick, F., Piters, A., Richter, A., van Roozendael, M., Rozanov, V. V., Spinei, E., Tirpitz, J.-L., Vlemmix, T., Wagner, T., and Wang, Y.: Intercomparison of MAX-DOAS vertical profile retrieval algorithms: studies using synthetic data, Atmos. Meas. Tech., 12, 2155–2181, https://doi.org/10.5194/amt-12-2155-2019, 2019. a, b, c, d, e, f
Grainger, J. and Ring, J.: Anomalous Fraunhofer line profiles, Nature, 193, 762, https://doi.org/10.1038/193762a0, 1962. a
Hansen, J. E.: Circular Polarization of Sunlight Reflected by Clouds, J. Atmos. Sci., 28, 1515–1516, https://doi.org/10.1175/1520-0469(1971)028<1515:CPOSRB>2.0.CO;2, 1971. a
Hansen, J. E. and Travis, L. D.: Light scattering in planetary atmospheres, Space Sci. Rev., 16, 527–610, 1974. a, b
Hasekamp, O. P. and Landgraf, J.: Retrieval of aerosol properties over land surfaces: capabilities of multiple-viewing-angle intensity and polarization measurements, Appl. Optics, 46, 3332–3344, https://doi.org/10.1364/AO.46.003332, 2007. a, b
Heckel, A., Richter, A., Tarsu, T., Wittrock, F., Hak, C., Pundt, I., Junkermann, W., and Burrows, J. P.: MAX-DOAS measurements of formaldehyde in the Po-Valley, Atmos. Chem. Phys., 5, 909–918, https://doi.org/10.5194/acp-5-909-2005, 2005. a
Herman, B. M., Browning, S. R., and Curran, R. J.: The effect of atmospheric aerosols on scattered sunlight, J. Atmos. Sci., 28, 419–428, 1971. a, b, c
Holben, B. N., Eck, T. F., Slutsker, I., Tanré, D., Buis, J. P., Setzer, A., Vermote, E., Reagan, J. A., Kaufman, Y. J., Nakajima, T., Lavenu, F., Jankowiak, I., and Smirnov, A.: AERONET – A federated instrument network and data archive for aerosol characterization, Remote Sens. Environ., 66, 1–16, 1998. a
Hönninger, G. and Platt, U.: Observations of BrO and its vertical distribution during surface ozone depletion at Alert, Special Issue Air/Snow/Ice Interactions in the Arctic: Results from ALERT 2000 and SUMMIT 2000, Atmos. Environ., 36, 2481–2489, https://doi.org/10.1016/S1352-2310(02)00104-8, 2002. a
Hönninger, G., von Friedeburg, C., and Platt, U.: Multi axis differential optical absorption spectroscopy (MAX-DOAS), Atmos. Chem. Phys., 4, 231–254, https://doi.org/10.5194/acp-4-231-2004, 2004. a
Irie, H., Kanaya, Y., Akimoto, H., Iwabuchi, H., Shimizu, A., and Aoki, K.: First retrieval of tropospheric aerosol profiles using MAX-DOAS and comparison with lidar and sky radiometer measurements, Atmos. Chem. Phys., 8, 341–350, https://doi.org/10.5194/acp-8-341-2008, 2008. a, b
Kreher, K., Van Roozendael, M., Hendrick, F., Apituley, A., Dimitropoulou, E., Frieß, U., Richter, A., Wagner, T., Lampel, J., Abuhassan, N., Ang, L., Anguas, M., Bais, A., Benavent, N., Bösch, T., Bognar, K., Borovski, A., Bruchkouski, I., Cede, A., Chan, K. L., Donner, S., Drosoglou, T., Fayt, C., Finkenzeller, H., Garcia-Nieto, D., Gielen, C., Gómez-Martín, L., Hao, N., Henzing, B., Herman, J. R., Hermans, C., Hoque, S., Irie, H., Jin, J., Johnston, P., Khayyam Butt, J., Khokhar, F., Koenig, T. K., Kuhn, J., Kumar, V., Liu, C., Ma, J., Merlaud, A., Mishra, A. K., Müller, M., Navarro-Comas, M., Ostendorf, M., Pazmino, A., Peters, E., Pinardi, G., Pinharanda, M., Piters, A., Platt, U., Postylyakov, O., Prados-Roman, C., Puentedura, O., Querel, R., Saiz-Lopez, A., Schönhardt, A., Schreier, S. F., Seyler, A., Sinha, V., Spinei, E., Strong, K., Tack, F., Tian, X., Tiefengraber, M., Tirpitz, J.-L., van Gent, J., Volkamer, R., Vrekoussis, M., Wang, S., Wang, Z., Wenig, M., Wittrock, F., Xie, P. H., Xu, J., Yela, M., Zhang, C., and Zhao, X.: Intercomparison of NO2, O4, O3 and HCHO slant column measurements by MAX-DOAS and zenith-sky UV–visible spectrometers during CINDI-2, Atmos. Meas. Tech., 13, 2169–2208, https://doi.org/10.5194/amt-13-2169-2020, 2020. a, b, c
Li, Z., Goloub, P., Dubovik, O., Blarel, L., Zhang, W., Podvin, T., Sinyuk, A., Sorokin, M., Chen, H., Holben, B., Tanré, D., Canini, M., and Buis, J.-P.: Improvements for ground-based remote sensing of atmospheric aerosol properties by additional polarimetric measurements, J. Quant. Spectrosc. Ra., 110, 1954–1961, https://doi.org/10.1016/j.jqsrt.2009.04.009, 2009. a, b
Meller, R. and Moortgat, G. K.: Temperature dependence of the absorption cross sections of formaldehyde between 223 and 323 K in the wavelength range 225–375 nm, J. Geophys. Res.-Atmos., 105, 7089–7101, https://doi.org/10.1029/1999JD901074, 2000. a
Mishchenko, M. I. and Travis, L. D.: Satellite retrieval of aerosol properties over the ocean using polarization as well as intensity of reflected sunlight, J. Geophys. Res.-Atmos., 102, 16989–17013, https://doi.org/10.1029/96JD02425, 1997. a, b
Platt, U. and Stutz, J.: Differential Optical Absorption Spectroscopy, vol. 1, Springer Berlin Heidelberg, https://doi.org/10.1007/978-3-540-75776-4, 2008. a, b
Rodgers, C. D.: Inverse methods for atmospheric sounding: theory and practice, World Scientific Publishing, ISBN 978-981-02-2740-1, 2000. a, b
Seidler, T.: PMAX-DOAS – Eine neue Methode zur Bestimmung von Aerosolprofilen mittels polarisationsabhängiger MAX-DOAS Messungen, Master's thesis, University of Heidelberg, Heidelberg, 2008. a
Solomon, S., Schmeltekopf, A. L., and Sanders, R. W.: On the interpretation of zenith sky absorption measurements, J. Geophys. Res.-Atmos., 92, 8311–8319, https://doi.org/10.1029/JD092iD07p08311, 1987. a
Spurr, R.: LIDORT and VLIDORT: Linearized pseudo-spherical scalar and vector discrete ordinate radiative transfer models for use in remote sensing retrieval problems, Springer, Berlin, Heidelberg, 229–275, https://doi.org/10.1007/978-3-540-48546-9_7, 2008. a, b
Spurr, R., Wang, J., Zeng, J., and Mishchenko, M.: Linearized T-matrix and Mie scattering computations, J. Quant. Spectrosc. Ra., 113, 425–439, 2012. a
Spurr, R. J.: VLIDORT: A linearized pseudo-spherical vector discrete ordinate radiative transfer code for forward model and retrieval studies in multilayer multiple scattering media, J. Quant. Spectrosc. Ra., 102, 316–342, https://doi.org/10.1016/j.jqsrt.2006.05.005, 2006. a, b
Stokes, G. G.: On the composition and resolution of streams of polarized light from different sources, Transactions of the Cambridge Philosophical Society, 9, p. 399, 1851. a
Strutt, J.: On the light from the sky, its polarization and colour, The London, Edinburgh, and Dublin Philosophical Magazine and Journal of Science, 41, 107–120, https://doi.org/10.1080/14786447108640452, 1871. a
Thalman, R. and Volkamer, R.: Temperature dependent absorption cross-sections of O2–O2 collision pairs between 340 and 630 nm and at atmospherically relevant pressure, Phys. Chem. Chem. Phys., 15, 15371–15381, https://doi.org/10.1039/C3CP50968K, 2013. a
Tirpitz, J.-L.: Enhancing MAX-DOAS atmospheric remote sensing by multispectral polarimetry, PhD thesis, University of Heidelberg, Heidelberg, https://doi.org/10.11588/heidok.00030159, 2021. a, b, c, d, e
Tirpitz, J.-L., Frieß, U., Hendrick, F., Alberti, C., Allaart, M., Apituley, A., Bais, A., Beirle, S., Berkhout, S., Bognar, K., Bösch, T., Bruchkouski, I., Cede, A., Chan, K. L., den Hoed, M., Donner, S., Drosoglou, T., Fayt, C., Friedrich, M. M., Frumau, A., Gast, L., Gielen, C., Gomez-Martín, L., Hao, N., Hensen, A., Henzing, B., Hermans, C., Jin, J., Kreher, K., Kuhn, J., Lampel, J., Li, A., Liu, C., Liu, H., Ma, J., Merlaud, A., Peters, E., Pinardi, G., Piters, A., Platt, U., Puentedura, O., Richter, A., Schmitt, S., Spinei, E., Stein Zweers, D., Strong, K., Swart, D., Tack, F., Tiefengraber, M., van der Hoff, R., van Roozendael, M., Vlemmix, T., Vonk, J., Wagner, T., Wang, Y., Wang, Z., Wenig, M., Wiegner, M., Wittrock, F., Xie, P., Xing, C., Xu, J., Yela, M., Zhang, C., and Zhao, X.: Intercomparison of MAX-DOAS vertical profile retrieval algorithms: studies on field data from the CINDI-2 campaign, Atmos. Meas. Tech., 14, 1–35, https://doi.org/10.5194/amt-14-1-2021, 2021. a, b
Vandaele, A., Hermans, C., Simon, P., Carleer, M., Colin, R., Fally, S., Mérienne, M., Jenouvrier, A., and Coquart, B.: Measurements of the NO2 absorption cross-section from 42 000 cm−1 to 10 000 cm−1 (238–1000 nm) at 220 K and 294 K, Special Issue Atmospheric Spectroscopy Applications 96, J. Quant. Spectrosc. Ra., 59, 171–184, https://doi.org/10.1016/S0022-4073(97)00168-4, 1998. a
Vlemmix, T., Piters, A. J. M., Berkhout, A. J. C., Gast, L. F. L., Wang, P., and Levelt, P. F.: Ability of the MAX-DOAS method to derive profile information for NO2: can the boundary layer and free troposphere be separated?, Atmos. Meas. Tech., 4, 2659–2684, https://doi.org/10.5194/amt-4-2659-2011, 2011. a
Vlemmix, T., Hendrick, F., Pinardi, G., De Smedt, I., Fayt, C., Hermans, C., Piters, A., Wang, P., Levelt, P., and Van Roozendael, M.: MAX-DOAS observations of aerosols, formaldehyde and nitrogen dioxide in the Beijing area: comparison of two profile retrieval approaches, Atmos. Meas. Tech., 8, 941–963, https://doi.org/10.5194/amt-8-941-2015, 2015. a
Wagner, T.: Satellite observations of atmospheric halogen oxides, PhD thesis, University of Heidelberg, Heidelberg, 1999. a
Wagner, T., Dix, B., Friedeburg, C. V., Frieß, U., Sanghavi, S., Sinreich, R., and Platt, U. : MAX-DOAS O4 measurements: A new technique to derive information on atmospheric aerosols – Principles and information content, J. Geophys. Res., 109, D22205, https://doi.org/10.1029/2004JD004904, 2004. a, b, c
Wagner, T., Deutschmann, T., and Platt, U.: Determination of aerosol properties from MAX-DOAS observations of the Ring effect, Atmos. Meas. Tech., 2, 495–512, https://doi.org/10.5194/amt-2-495-2009, 2009. a
Wagner, T., Beirle, S., Brauers, T., Deutschmann, T., Frieß, U., Hak, C., Halla, J. D., Heue, K. P., Junkermann, W., Li, X., Platt, U., and Pundt-Gruber, I.: Inversion of tropospheric profiles of aerosol extinction and HCHO and NO2 mixing ratios from MAX-DOAS observations in Milano during the summer of 2003 and comparison with independent data sets, Atmos. Meas. Tech., 4, 2685–2715, https://doi.org/10.5194/amt-4-2685-2011, 2011. a
Wang, Y., Li, A., Xie, P.-H., Chen, H., Xu, J., Wu, F.-C., Liu, J.-G., and Liu, W.-Q.: Retrieving vertical profile of aerosol extinction by multi-axis differential optical absorption spectroscopy, Acta Phys. Sin., 62, 180705, https://doi.org/10.7498/aps.62.180705, 2013. a, b
Xu, X. and Wang, J.: Retrieval of aerosol microphysical properties from AERONET photopolarimetric measurements: 1. Information content analysis, J. Geophys. Res.-Atmos., 120, 7059–7078, https://doi.org/10.1002/2015JD023108, 2015. a
Yilmaz, S.: Retrieval of atmospheric aerosol and trace gas vertical profiles using multi-axis differential optical absorption spectroscopy, Dissertation, Heidelberg University, Heidelberg, https://doi.org/10.11588/heidok.00013128, 2012. a, b
- Abstract
- Introduction
- The MAX-DOAS technique
- From conventional to polarimetric MAX-DOAS
- Remarks on skylight polarisation
- The RAPSODI retrieval algorithm
- Synthetic scenarios and RTM settings
- Analysis of the measurements' information content
- Considerations on viewing geometries
- Retrieval results
- The effect of increased noise for polarimetric observations
- Effect of spatio-temporal variability in atmospheric composition
- Conclusions
- Code and data availability
- Author contributions
- Competing interests
- Disclaimer
- Acknowledgements
- Financial support
- Review statement
- References
- Supplement