the Creative Commons Attribution 4.0 License.
the Creative Commons Attribution 4.0 License.
 | 19 Jan 2022
Measurement of black carbon emissions from multiple engine and source types using laser-induced incandescence: sensitivity to laser fluence
Ruoyang Yuan
Prem Lobo
Greg J. Smallwood
Mark P. Johnson
Matthew C. Parker
Daniel Butcher
Adrian Spencer
A new regulatory standard for non-volatile particulate matter (nvPM) mass-based emissions from aircraft engines has been adopted by the International Civil Aviation Organisation. One of the instruments used for the regulatory nvPM mass emissions measurements in aircraft engine certification tests is the Artium Technologies LII 300, which is based on laser-induced incandescence. The LII 300 response has been shown in some cases to vary with the type of black carbon particle measured. Hence it is important to identify a suitable black carbon emission source for instrument calibration. In this study, the relationship between the nvPM emissions produced by different engine sources and the response of the LII 300 instrument utilising the auto-compensating laser-induced incandescence (AC-LII) method was investigated. Six different sources were used, including a turboshaft helicopter engine, a diesel generator, an intermediate pressure test rig of a single-sector combustor, an auxiliary power unit gas turbine engine, a medium-sized diesel engine, and a downsized turbocharged direct-injection gasoline engine. Optimum LII 300 laser fluence levels were determined for each source and operating condition evaluated. It was found that an optimised laser fluence can be valid for real-time measurements from a variety of sources, where the mass concentration was independent of laser fluence levels covering the typical operating ranges for the various sources. However, it is important to perform laser fluence sweeps to determine the optimum fluence range as differences were observed in the laser fluence required between sources and fuels. We discuss the measurement merits, variability, and best practices in the real-time quantification of nvPM mass concentration using the LII 300 instrument and compare that with other diagnostic techniques, namely absorption-based methods such as photoacoustic spectroscopy (using a photoacoustic extinctiometer, PAX, and a micro soot sensor, MSS) and thermal-optical analysis (TOA). Particle size distributions were also measured using a scanning mobility particle sizer (SMPS). Overall, the LII 300 provides robust and consistent results when compared with the other diagnostic techniques across multiple engine sources and fuels. The results from this study will inform the development of updated calibration protocols to ensure repeatable and reproducible measurements of nvPM mass emissions from aircraft engines using the LII 300.
- Article
(3461 KB) - Full-text XML
- BibTeX
- EndNote


The works published in this journal are distributed under the Creative Commons Attribution 4.0 License. This license does not affect the Crown copyright work, which is re-usable under the Open Government Licence (OGL). The Creative Commons Attribution 4.0 License and the OGL are interoperable and do not conflict with, reduce, or limit each other. The co-authors Prem Lobo and Greg J. Smallwood are employees of the Canadian Government and therefore claim Crown copyright for the respective contributions.
© Crown copyright 2022.
Short- and long-term exposure to particulate matter (PM) can lead to serious health problems such as lung or heart disease (AQEQ, 2005). There is increasing emphasis on reducing PM emissions from energy conversion systems, especially for the transport sector. The World Health Organisation (WHO) reported that up to 50 % of PM emissions in OECD countries were caused by road transport, in which diesel traffic was the majority (United Nations Environment Programme World Health Organisation, 2009). In addition to road traffic, aviation and shipping are also significant sources of PM emissions in the transport sector. Therefore, it is strategically important to limit the exposure to PM from various sources, and accurate measurement of PM is a key enabler to achieving this goal and developing low-PM-emission transport solutions.
The International Civil Aviation Organisation (ICAO) Committee on Aviation Environmental Protection has adopted new standards and recommended practices limiting aircraft engine non-volatile particulate matter (nvPM) (also referred to as soot or black carbon) number and mass emissions to mitigate the impact of aircraft engine emissions on local air quality (ICAO, 2017). The nvPM refers to the particles that exist at the aircraft engine exhaust nozzle exit plane that do not volatilise at temperatures greater than 350 ∘C (ICAO, 2017). A standardised sampling and measurement methodology for aircraft engine nvPM emissions has been developed by the Society of Automotive Engineers (SAE), which has been detailed in Aerospace Information Report (AIR) 6241 (SAE, 2013) and Aerospace Recommended Practice (ARP) 6320 (SAE, 2018) and adopted by ICAO (ICAO, 2017). The SAE and ICAO documents also define the performance criteria and calibration protocols for the instruments to be used in the standardised measurements. Currently, the two instruments that satisfy the performance criteria for nvPM mass measurements are the Artium Technologies LII 300, based on laser-induced incandescence (LII), and the AVL micro soot sensor (MSS), based on photoacoustic spectroscopy. The standardised systems for aircraft engine nvPM emissions measurements using these instruments have been previously evaluated and inter-compared (Lobo et al., 2015a, 2020).
The instruments used to measure nvPM mass concentration in the exhaust of aircraft engines are calibrated by reference to elemental carbon (EC) content, as determined by thermal-optical analysis (TOA) of a diffusion flame combustion aerosol source (Durdina et al., 2016). TOA is an industry-accepted method for measuring the mass of both organic carbon (OC) and elemental carbon (EC) aerosols sampled on a quartz filter (Baumgardner et al., 2012). The only criteria for the source used for calibrating nvPM mass instruments is that it be capable of producing an average EC content of the collected mass on the filter of ≥80 % (SAE, 2018).
The LII techniques have been shown to be sensitive to different black carbon types, for both continuous-wave laser LII (Baumgardner et al., 2012; Gysel et al., 2012; Laborde et al., 2012) and pulsed laser LII, as used in the LII 300 (Durdina et al., 2016). The relationship between the nvPM emissions produced by these different sources and the response of the LII 300 instruments has not been fully investigated. It is important to identify a suitable nvPM emissions source that meets the requirements to provide reliable and robust calibration of the LII 300 instrument used in the emissions certification of aircraft engines.
The LII technique has been widely applied in combustion studies to obtain in situ black carbon characteristics, such as soot volume fraction (Boiarciuc et al., 2006; Choi and Jensen, 1998; Liu et al., 2011; Melton, 1984; Quay et al., 1994; Zhang et al., 2019) and primary particle size measurements (Axelsson et al., 2000; Boiarciuc et al., 2006; Boies et al., 2015; Mewes and Seitzman, 1997) from both laboratory flames (Axelsson et al., 2000; Mewes and Seitzman, 1997; Tian et al., 2017; Zhang et al., 2019) and aircraft engines (soot concentration: Schäfer et al., 2000; Delhay et al., 2009; Black and Johnson, 2010; Petzold et al., 2011; Lobo et al., 2015a; soot particle sizes: Boies et al., 2015). Previous reviews on LII have provided insight on current challenges, questions associated with this technique (Schulz et al., 2006), and current model developments (Michelsen et al., 2015). Several models of the LII technique have been reviewed to quantify the soot concentration, primary particle size, and peak temperature (Eckbreth, 1977; Melton, 1984; Roth and Filippov, 1996; Smallwood et al., 2001; Schittkowski et al., 2002; Lehre et al., 2003; Snelling et al., 2004; Kock et al., 2006; Michelsen et al., 2007; Sipkens and Daun, 2017). These were required because the complex mechanisms incorporated in the LII model strongly influenced the predicted signal magnitudes and time evolution. The signal dependence on the laser fluence and in turn the quantification of soot concentration were highlighted in each model. As the laser fluence increases, soot absorbs increasing amounts of light energy, resulting in greater particle peak temperature and radiation magnitude. The subsequent decay rate of this radiation is related to the particle temperature, which in turn is related to the primary particle size. Sublimation can also occur at excessively high laser fluence levels, characterised by the particle-volume reduction. According to the model by Michelsen et al. (2003), the maximum LII signal may level off or be reduced due to this mass loss. Although there are differences in the temporal profiles, the various models provide similar results for the relative signal magnitudes as a function of laser fluence (Schulz et al., 2006; Sipkens and Daun, 2017). In conventional LII techniques, the determination of the LII fluence level directly affects the accuracy of the quantitative measure of the soot concentration. Additionally, further calibration (via laser extinction for example) is required to obtain absolute rather than relative measurements. The requirement to accurately represent the target nvPM absorption and sublimation characteristic during calibration is an additional complexity associated with the LII technique. An improved approach, described in the literature (Snelling et al., 2005; Thomson et al., 2006), utilises an auto-compensating laser-induced incandescence (AC-LII) method. By measuring LII signals at two separate wavelengths and temporally resolved decay rates, AC-LII has the potential to resolve the soot temperature, volume fraction, and particle size without the need for additional calibration sources. This method was incorporated into the commercial LII 300 instrument by Artium Technologies Inc.
The goal of this study is to assess the suitability of the nvPM emissions from a variety of different engine sources and fuels to be used as a calibration source for the LII 300 instrument for application to the emissions certification of aircraft engines. It was important to identify a source that met all the requirements, produced a similar response from the LII 300 to that obtained from nvPM emissions from an aircraft gas turbine engine, and was economical and practical to operate. In this study, we evaluated a range of different combustion sources that could potentially be used as calibration sources, including a turboshaft helicopter engine (already verified as an applicable aircraft engine calibration source for LII 300), an intermediate-pressure single-injector combustor test rig, an auxiliary power unit gas turbine engine, a diesel generator, a medium-sized diesel engine, and a downsized turbocharged direct-injection gasoline engine. The turboshaft helicopter engine, intermediate-pressure single-injector combustor test rig, and auxiliary power unit gas turbine engine were fuelled with kerosene, while the diesel generator and medium-sized diesel engine burned diesel, and the downsized turbocharged direct-injection gasoline engine utilised gasoline. The relationship between the nvPM emissions produced by the different engine sources and the response of the LII 300 instrument was investigated. Laser fluence sweeps were performed at different operating conditions, and the fluence dependence of and variability in the technique for field measurements of different nvPM sources were studied. The measurements using the LII 300 were compared with other diagnostic techniques, including thermal-optical analysis and photoacoustic spectroscopy, for comparison. The relationship between laser fluence and nvPM mass concentration measurement is discussed. The results from this study will help identify nvPM sources that can be used to calibrate the LII 300 instrument and inform the development of updated calibration protocols to ensure repeatable and reproducible measurements of nvPM mass emissions from aircraft engines using the LII 300, including a procedure to optimise the laser fluence.
2.1 Diagnostics methods
2.1.1 Laser-induced incandescence (LII)
Laser-induced incandescence (LII) measures the thermal emission from soot particles heated by a laser to temperatures in the 2500–4500 K range (Bachalo et al., 2002). Assuming that all the volatile and semi-volatile OC that condenses on the BC particles will be evaporated promptly at these temperatures, the LII signals are directly related to the non-volatile particles, primarily refractory black carbon (rBC), a form of carbon directly related to EC (Baumgardner et al., 2012). The LII 300 instrument calculates a mass concentration from the particle emission signal and the temperature determined from the signal at two wavelengths (446 and 720 nm) using two-colour pyrometry. As the optical properties of the particle may vary from source to source, a correlation factor may need to be applied to this optical determination of the mass concentration to relate the result to that of EC determined from TOA. A multimode pulsed Nd:YAG laser, operating at a fundamental wavelength of 1064 nm, with a pulse duration of 7 ns full width half maximum (FWHM) and a repetition rate of 20 Hz was used as the excitation source. The laser beam passed through a set of optics and formed into a square cross-section light beam uniformly incident throughout the probe volume. The measurement volume is approximate 14.7 mm3, and the range of fluence levels is typically 0.6–3.2 mJ mm−2.
At low laser fluence levels, the peak LII signal intensity rises with the laser fluence as peak particle temperatures increase. As laser fluence is increased, a threshold is reached where the measured mass concentration becomes independent of laser fluence. This plateau region extends for a range of increasing laser fluence until a level is reached where soot sublimation begins to dominate. At these very high laser fluences, the mass loss associated with soot sublimation has an influence, and a reduction in the mass concentration may be observed (Michelsen et al., 2015). Various soot fragments evaporate from the particle surface when sublimation occurs (Schulz et al., 2006). Models usually assume these to range from C1 to C7 (molecules having one to seven carbon atoms), dependent on the particle temperature (Leider et al., 1973). Additional research is required to understand the sublimation loss, which is complicated by uncertainties in physical parameters of the carbon species, limiting the ability of the models to fully predict phenomena in this regime (Michelsen et al., 2015).
In the AC-LII technique (Snelling et al., 2005), the soot temperatures are determined by the two-colour pyrometry method (in the LII 300, narrow bandpass filters centred at ∼446 nm and ∼720 nm are used with bandwidths of 40 and 20 nm, respectively). The peak soot temperature and absolute intensity of the LII signal were used to calculate soot volume fraction (fv). With soot particle material density (ρs) from the literature, the mass concentrations of the non-volatile particles, or EC, are obtained from fv × ρs. The primary particle sizes are determined from the temperature decay rates with the assumption that conduction dominates the particle cooling rates for conditions below the sublimation limit (Smallwood, 2008).
Theoretically, the mass concentration obtained from the two-colour method is valid regardless of the laser fluence applied, and a lower laser fluence level might be preferred to avoid the reduction in particle volume (sublimation) at high laser fluence. Practically, care should be taken with low laser fluence levels for particles from unknown sources with unknown combination of size distributions and morphologies as the assumption of the uniform temperature in the sampling volume could be invalid (Liu et al., 2016). The particles with various sizes could reach different peak temperatures at separate times, which induce uncertainties with the determination of the effective peak particle temperatures and in turn uncertainties with the derived mass concentration values. For a typical effective soot temperature of 4000 K, a 100 K error (2.5 % of the soot temperature) can lead to 15 % error in the estimated soot volume fraction value (Boiarciuc et al., 2006). It is therefore important to operate the LII 300 with optimum laser fluence, in a region of laser fluence where the reported mass concentration is relatively independent of fluence, to minimise uncertainties. In the current work, laser fluence sweep experiments (varying laser fluence from low levels to high fluence conditions with all other parameters held constant) were performed for each source at different operating conditions. This was performed to examine the relationship between the measured mass concentrations and LII fluence levels for multiple sources and to subsequently determine the optimum laser fluence level for both calibration and application to real-time nvPM mass measurements from aircraft engines.
2.1.2 Thermal-optical analysis (TOA)
TOA measures the mass of both organic carbon (OC) and elemental carbon (EC) of the particulate matter sampled on a quartz filter mounted in a stainless steel filter holder. This is not a gravimetric measurement where the mass of the elemental carbon was measured, but rather a chemical analysis of the black carbon on the filter. The NIOSH 5040 (NIOSH, 2003) standard method was used for the TOA, with a modified temperature ramp as specified by ARP 6320 (SAE, 2018), to obtain the EC mass concentrations. The uncertainty associated with this method for EC mass concentration is stated to be 16.7 % (NIOSH, 2003) due to additional uncertainty in assigning the split between OC and EC. The uncertainty associated with the total carbon (TC) mass concentration is 8.4 % (Conrad and Johnson, 2019). A basic overview of the process is presented here. The sample flow through the quartz filters was set to 22.7 slpm for all measurement conditions, which was controlled by a calibrated mass flow controller. Mass flow controllers were calibrated using a Sensidyne Gillibrator-2 bubble flow meter and corrected to the standard temperature and pressure reference conditions of 0 ∘C and 1 atm. The total volume of sample on the quartz filters varied from 360 to 1820 L, depending on the loading for a particular condition to achieve a target mass density of >10 mg cm−2. The particulate matter (mostly black carbon) in the sample flow was captured by the filter. After collection, a 1 cm × 1 cm punch from the filter was cut out and mounted in an analyser (Sunset Laboratory OC-EC Aerosol Analyser) to obtain the EC and OC content. The filter punch was heated in the analyser oven in stages. From 0 to 425 s, the sample was surrounded by an inert helium atmosphere, and the heating process drove off any embedded volatile organic compounds (VOCs) from the sample. The desorbed VOCs were further drawn into a series of catalyst beds, where they were converted to CO2 and then to methane, whose concentration was measured by a flame ionisation detector (FID) to give a measure of the organic carbon fraction on the filter punch. As the VOCs are heated, it is possible that some were pyrolysed and converted to char, which stayed on the filter punch, instead of being driven off the surface. The quantity of the char was measured via laser extinction propagated through the sampled filter punch. From 425 to 800 s, the sample was surrounded by a reactive oxygen–helium atmosphere. As the oven heated the sample, the elemental carbon reacted with the oxygen to form CO2, which was again converted to methane and measured by the FID. The elemental carbon fraction of black carbon on the filter punch was then measured by subtracting the char (which was originally organic carbon) content from the total. With the two mass values quantified, i.e. the OC mass fraction and the EC mass fraction, the total carbon (TC) on the filter punch can be obtained. By multiplying by the stain area of the filter, the total mass of EC, OC, and TC on the entire filter was quantified. Having also measured the total volume of sampled gas, the mass concentration of the EC, OC, and TC was obtained. One uncertainty in the OC quantification from the TOA measurements was the artefact effect caused by the gas-phase semi-volatile organic compounds absorbed on the filter (Durdina et al., 2016). To correct this artefact, the OC determined from a secondary filter that contained exclusively absorbed gas-phase OC was subtracted from the OC mass determined from the primary filter.
2.1.3 Photoacoustic spectroscopy
In this study, a photoacoustic extinctiometer (PAX; Droplet Measurement Technologies, Inc.) and a micro soot sensor (MSS; AVL, model 483) were used to provide additional measurements for nvPM mass concentrations. Both the PAX and MSS are based on the photoacoustic method (Adams et al., 1989), measuring the acoustic wave generated by the heated gases surrounding the light-absorbing particles due to their increased temperature after interaction with a laser. Unlike filter-based absorption methods, where uncertainties related to organic aerosol coating and light-absorbing properties are issues (Baumgardner et al., 2012; Corbin et al., 2019), photoacoustic measurements can potentially be affected by the humidity via latent heat and mass transfer from volatile droplets (Arnott, 2003) and absorption by molecular species present in the gaseous medium. The PAX and the MSS measurements rely on the light-absorption properties of the PM sources, for which a mass absorption cross-section (MAC) is usually assumed. In this work, a MAC of 7.5 ± 1.2 m2 g−1 at a wavelength of 550 nm was applied to the PAX following the recommendation by Bond and Bergstrom (2006), noting that the MAC will vary with the black carbon source and operating condition. The MAC for the PAX (with a measured absorption at a wavelength λ of 870 nm) was converted using MAC(λ) = MAC(550 nm) × (550 nm), assuming the refractive index was the same at those wavelengths, equivalent to stating that the aerosol Ångström exponent (AAE) is 1. The PAX operates at a wavelength of 870 nm and the MSS at 808 nm. The MSS was previously calibrated with a soot source (CAST) of known concentration (determined by comparison with EC from TOA), while the PAX was calibrated separately with ammonium sulfate and Aquadag solutions.
2.1.4 Scanning mobility particle sizing
Although the focus in this work was on the quantification of nvPM mass concentration, the particle size distributions from different engine sources were measured using a scanning mobility particle sizer (SMPS; TSI, USA). The SMPS consisted of an electrostatic classifier (model 3082), a differential mobility analyser (model 3081), a soft X-ray neutraliser (model 3088), and an ultrafine condensation particle counter (model 3776). The particle size distribution data of the nvPM emissions from the various sources provide additional information on the physical properties of the particles. This will also provide information for the LII model development in terms of particle size distribution functions. The typical size range for a SMPS scan was 7–206 nm.
2.2 Test rigs and fuels
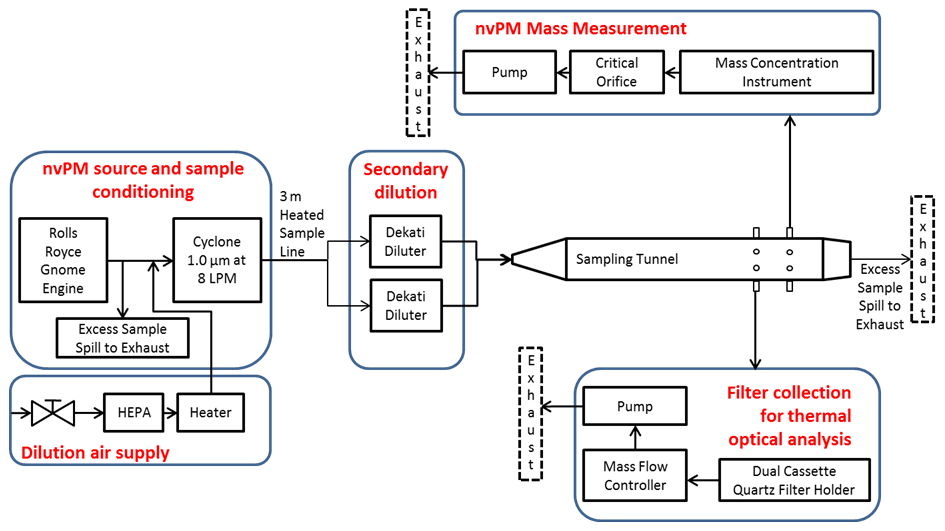
Multiple sources (test rigs) were used to study the LII 300 instrument's response to the nvPM exhaust emissions at steady-state conditions. These rigs included an aircraft gas turbine turboshaft engine (Rolls-Royce Gnome helicopter engine, Rig A), an intermediate-pressure gas turbine combustor rig (Rolls-Royce IP rig, Rig B), a gas turbine auxiliary power unit (Rover 2S/150 APU, Rig C), a diesel generator (Stephill Generators SE6000D4, Rig D), a naturally aspirated medium-sized (4.4 L) diesel engine (Rig E), and a downsized (1.0 L) turbocharged gasoline direct-injection (GDI) engine (Rig F). A schematic of the typical experimental set-up for the different sources is shown in Fig. 1. The source exhaust was diluted with HEPA-filtered air heated to 160 ∘C. A cyclone with a 1 µm cut size at a flow rate of 8 L min−1 was installed immediately downstream of the diluted engine exhaust. The output flow from the cyclone was transferred using a 3 m long heated (100 ∘C) carbon-loaded PTFE sample line and split to a pair of ejector diluters (Dekati, Model DI-1000), operating in parallel to further dilute the sample. The flow from the ejector diluters was combined and transported through a mixing section to the inlet of a custom-built sampling tunnel with 12 ports, which was used to distribute the diluted exhaust sample while ensuring there was excess flow. Carbon-impregnated silicone tubing (nominal ”) was used to transfer the sample to the real-time instruments and the filter holders (for TOA, URG Corp. model URG-2000-30FVT). Quartz filter cassettes (model URG-2000-30FL) mounted in the filter holder were used to hold the quartz filters.
In this study, the focus was not on the performance of the test rig or the operating conditions but rather the response of the diagnostic instruments for a range of different combustion emission sources and associated fuel types – kerosene (Jet A-1) for the gas turbine engines and IP rig, diesel (EN590) for the diesel engines, and gasoline (EN228) for the GDI engine. The IP combustor rig design was developed as a tool for gas turbine fuel spray nozzle hardware ranking for soot production, similar to Makida et al. (2006). The soot formation–oxidation process and maturity are different to those of typical rich-quench-lean gas turbine combustion. The real-time measurements of the nvPM mass emissions from these rigs using the LII 300 and the other diagnostic instruments were recorded and compared. Table 1 summarises the operating conditions of the various test rigs. Fuel samples were acquired from each of the test rigs and were subsequently analysed (Table 2). The Jet A-1 fuels used in test rigs A, B, and C had similar properties, as did the EN590 fuels for test rigs D and E.
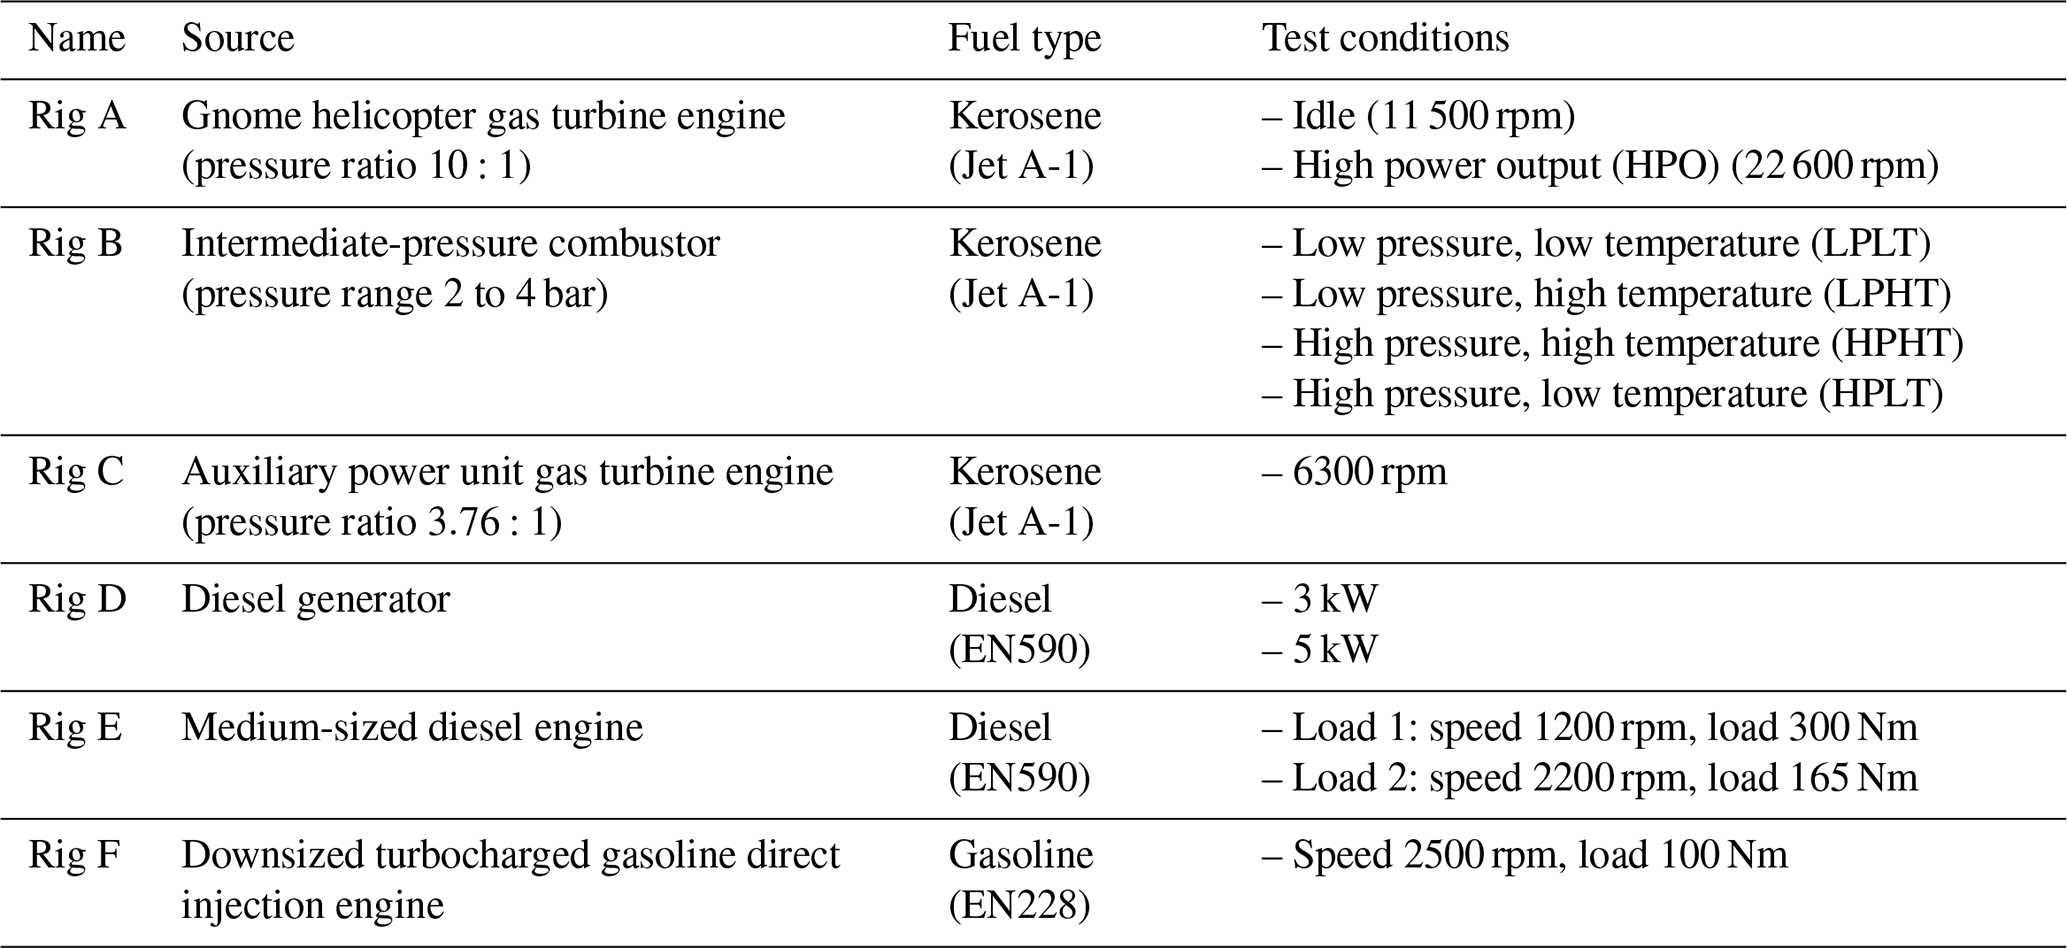
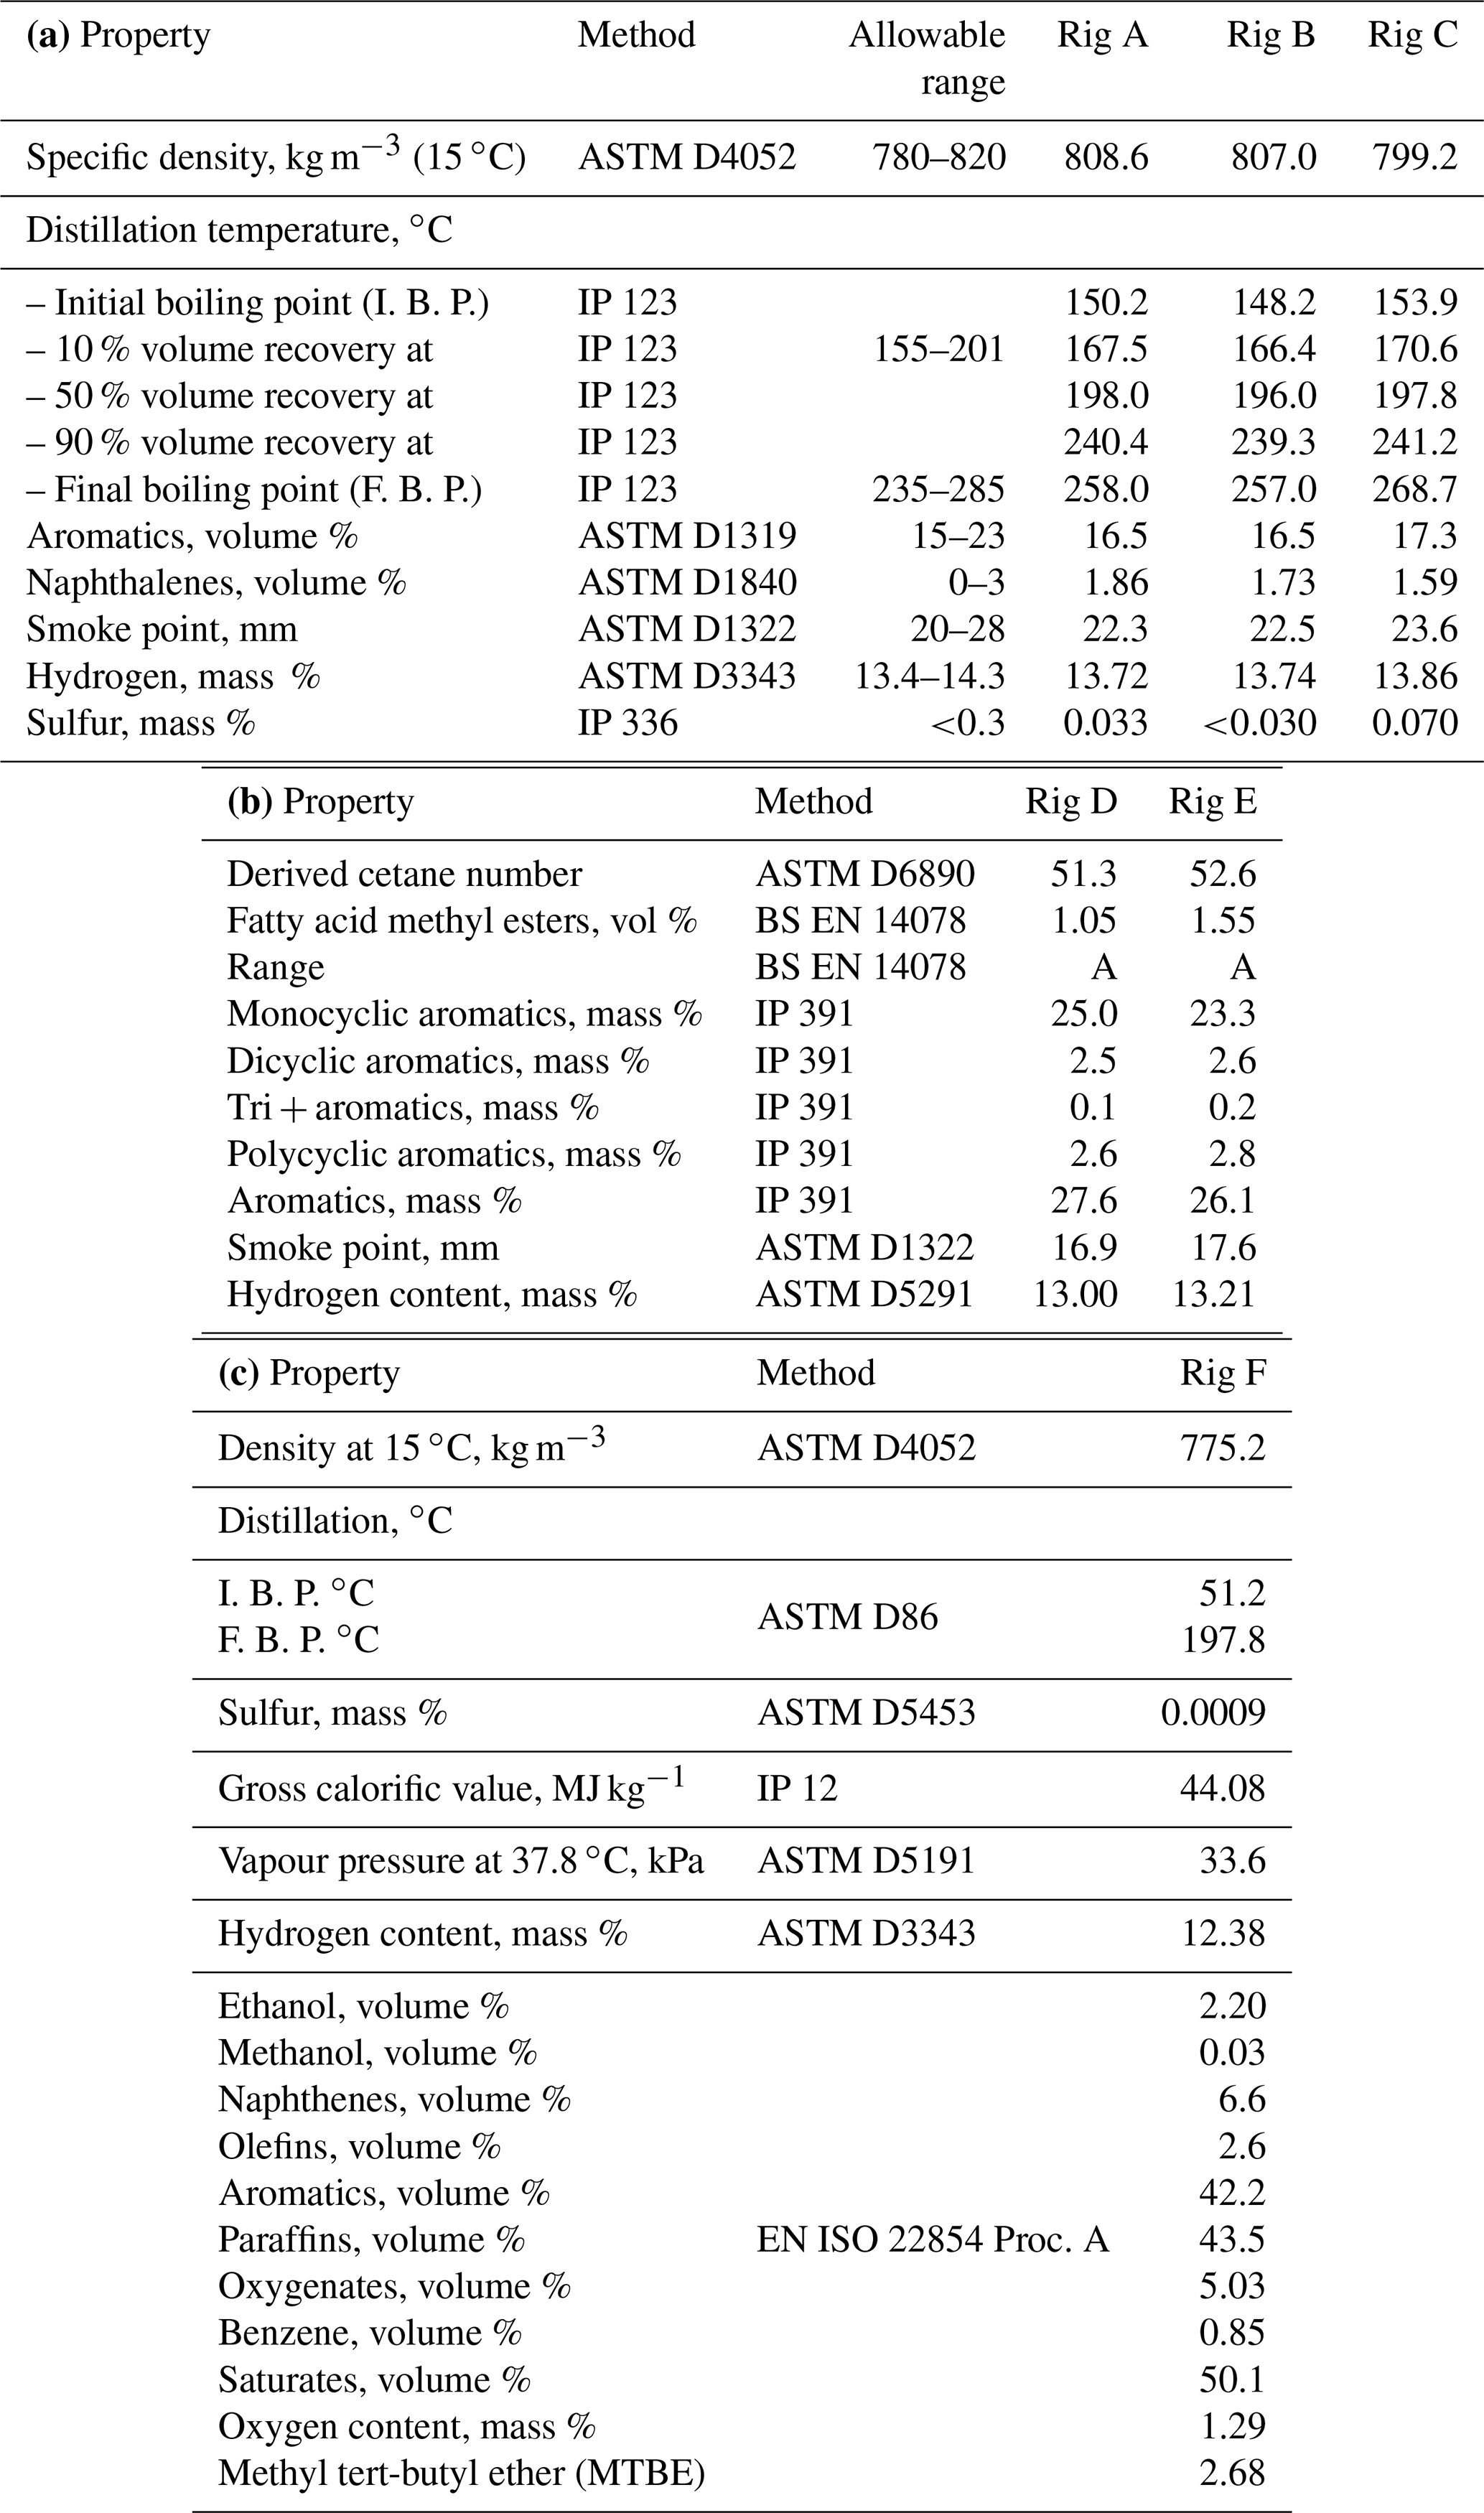
Table 2(a) Physical and chemical properties for the Jet A-1 fuels (kerosene) used in Rigs A, B, and C. (b) Physical and chemical properties for the EN590 fuels (diesel) used in Rigs D and E. (c) Physical and chemical properties for the EN228 fuel (gasoline) used in Rig F.
To ensure stabilised conditions were reached, the sources (test rigs) were operated at the set point for a short period prior to nvPM data collection. The exhaust temperature, measured with a thermocouple fitted to the exhaust of each rig, along with other operating condition data was monitored and available as an indication of combustion stability. Once these operational parameters were determined to be stable, the data collection for that particular set point was initiated. There were no exhaust aftertreatment devices on any of the rigs in the current work.
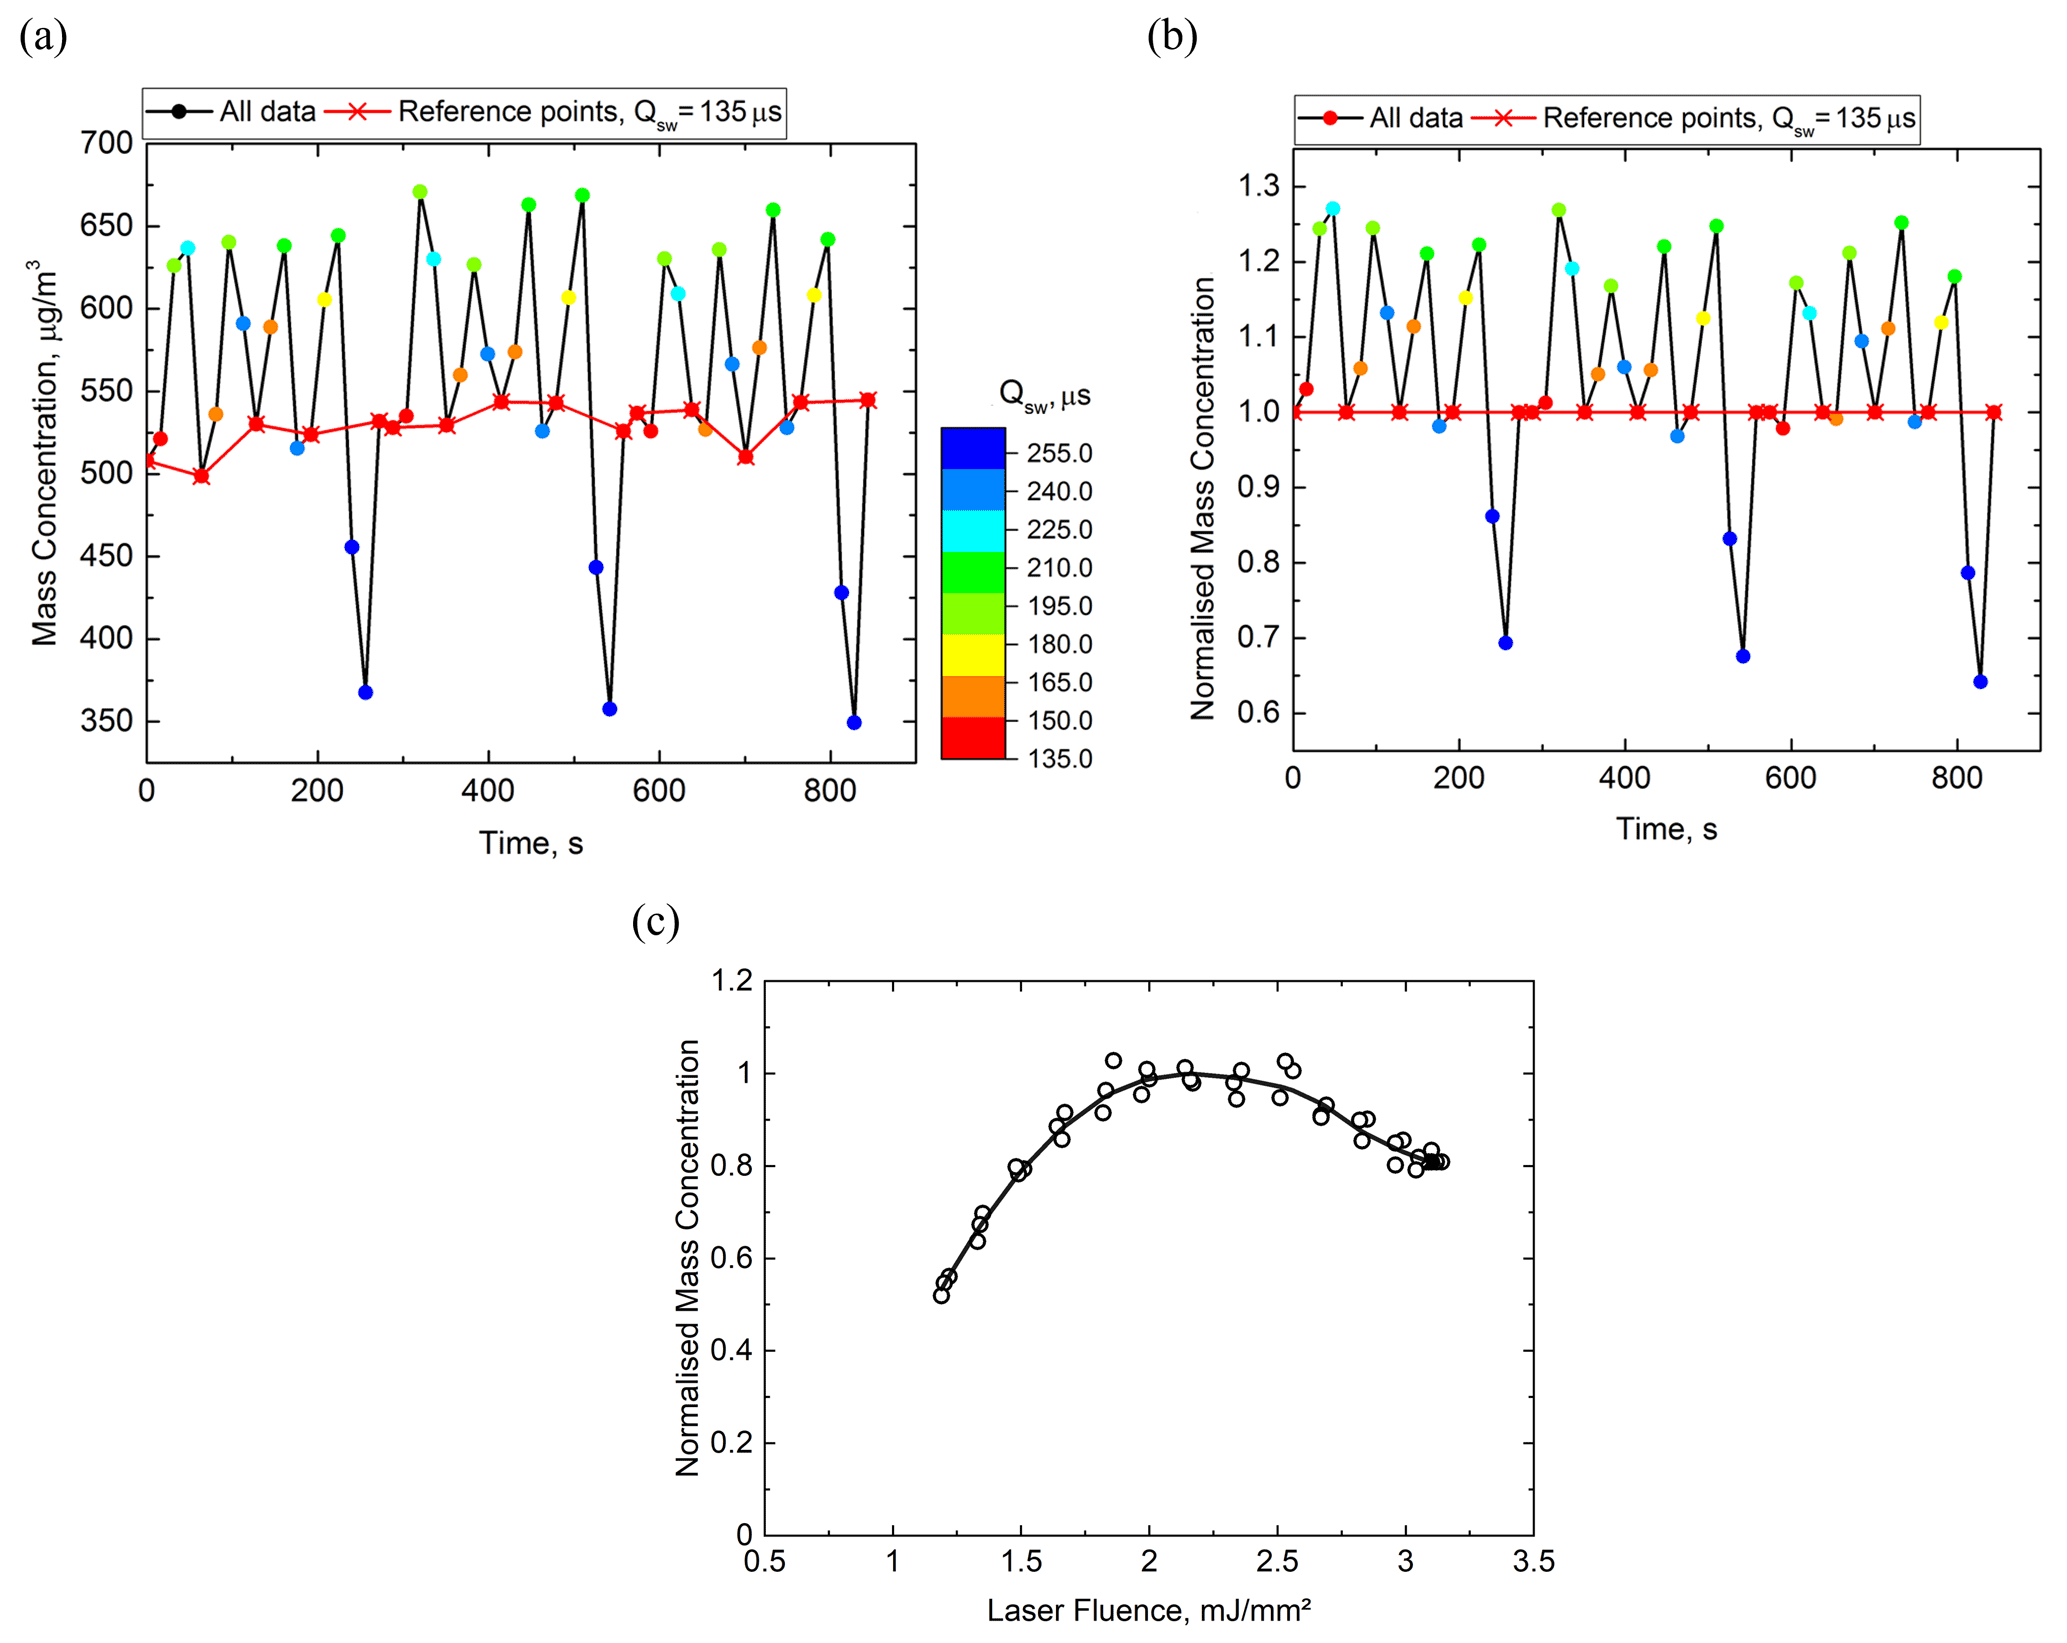
Figure 2Laser fluence optimisation procedure for mass concentration showing (a) all raw measurements; (b) initially normalised measurements using the TN method; and (c) laser fluence sweep, superimposed with the best-fit curve (black) of the normalised mass concentration data using the Loess method with a second-order local polynomial regression.
3.1 LII 300 fluence optimisation
For real-time nvPM mass quantification with the LII 300, a single laser fluence level is typically used for the emission sources of interest. The laser fluence level is important for the calibration of the instrument and its application. For the experiments reported here, the laser fluence levels were deliberately tuned over a wide range, from low to sublimation levels of fluence, by adjusting the Q-switch (Qsw) delay settings. Laser fluence sweep measurements (adjusting from low to high fluence with a number of discrete steps) were performed at steady-state engine operating conditions to determine the optimum fluence for a particular nvPM source and operating condition. For the laser fluence sweep tests at steady-state engine operation, measurements are unlikely to be influenced by substantial variation in the source emissions. A time-weighted normalisation (TN) method was used to account for fluctuations in the measured concentration caused by any modest variations in the concentration of the source emissions. This involved many repeats at a reference Q-switch delay during the fluence sweep and using the mean value at this reference Q-switch delay for initial normalisation of all data. Figure 2 shows an example of the mass concentration time series during one laser fluence sweep while measuring the nvPM emissions from the IP gas turbine (Rig B). The red line denotes the reference points at which the Q-switch setting was fixed corresponding to the maximum laser energy output. The colour map of data points shown in Fig. 2a correlates to the Q-switch settings applied. Figure 2b is a time series of the normalised mass concentration results from the time-weighted method. A best fit was calculated on the TN-normalised mass concentrations using the local polynomial regression method (Loess method). The final normalisation was achieved by normalising the TN values to the peak value of the best-fit curve, as shown in Fig. 2c. Fluence levels shown in Fig. 2c and in this work are estimated from an internal energy meter and the laser beam dimensions (measured by a beam profile camera) in the probe volume.
To further examine the role of source emissions variability in the LII 300 fluence sweep measurements, the reference points of the 135 µs Q-switch delay from the LII 300 were plotted together with the data simultaneously acquired by the PAX in Fig. 3. Results from the two sources (nvPM emissions from the IP rig (Rig B) and from the diesel engine (Rig E)) are presented. Despite subtle differences in the variability in the two sources, the trends of the two signals between the PAX and the LII 300 are similar for both cases, suggesting that the uncertainties observed in the LII 300 fluence sweep measurements at the reference fluence points (red line in Fig. 2a) were likely influenced by the variability in the source. The trend also suggests engine thermal equilibrium was achieved after 600 s, and there was ∼2 % variability in mass concentration following this. In the subsequent analysis, the TN method was used for the normalisation to minimise the impact of source variability.

Figure 3Mass concentration (normalised) measurements by the PAX and the LII 300 at its reference laser fluence points during fluence sweep tests using two different sources: nvPM emissions from the IP combustor (Rig B) and from the diesel engine (Rig E).
3.2 Laser fluence dependence – Rig A
3.2.1 Profiles of the measured mass concentrations
Figure 4 shows the LII 300 laser fluence sweep vs. normalised mass concentration (solid symbols) from the Gnome engine exhaust (Rig A) fuelled with kerosene at two different steady-state engine operating conditions – (1) idle and (2) high power output (HPO). It is anticipated that the idle and HPO conditions are two extremes in terms of the properties of the nvPM being emitted from Rig A, with those at idle being less mature and with more volatile organic compounds and the opposite for the HPO condition. Performing fluence sweep tests at these two conditions aided in determining an optimum laser fluence level to cover the full range of conditions from this source for real-time nvPM mass measurements. At laser fluence levels below 1.7 mJ mm−2 (Fig. 4), the measurements showed an almost monotonic increase with fluence between the measured nvPM mass concentrations and the laser fluence. The measurement of nvPM mass concentration was independent of the laser fluence levels in the range of 1.9 to 2.5 mJ mm−2 for the HPO condition and 2.2 to 3.2 mJ mm−2 for the idle condition. The shaded area in Fig. 4 corresponds to the data range that is within 2 % of the peak value of the Loess best-fit curve1 from the HPO condition. To determine an optimum laser fluence level for real-time nvPM mass concentration measurements, a fluence level at which the normalised mass concentration (NMC) data fell within the optimum range (within 2 % error) at both conditions would be ideal as these two engine conditions are anticipated to represent the extremes in terms of the properties of the nvPM emissions. For the Gnome engine, a fluence level at 2.4 mJ mm−2 (Fig. 4 arrow) was selected as optimum for this source across all operating conditions and used in subsequent comparisons with results from the other diagnostic techniques (as discussed in Sect. 3.5). While not the focus of this study, it is interesting to note the impact of laser fluence and source operating condition on the effective primary particle diameters (ePPDs) resulting from the LII 300 measurements, as shown in Fig.4 (via the decay rate of the LII signal) (Schulz et al., 2006). The relationship between the effective primary particle diameter and the laser fluence is most significant at low fluence levels (<1.9 mJ mm−2). As the reported sizes are larger than those reported for similar sources (Saffaripour et al., 2017) and as the ePPD is dependent on the rate of cooling of the particles, it is likely that there is an additional mechanism inhibiting the conduction of energy from the particles at low fluences. At high fluence levels (>2.5 mJ mm−2) sublimation occurs, and there may be a modest mass loss and potential reduction in particle size. In the region of optimum fluence the effective primary particle diameter is relatively insensitive to laser fluence. At all fluence levels, the effective primary particle diameters measured at idle were larger than those measured at the HPO condition. The obtained ePPDs at optimum fluence levels are within a similar range (6–19 nm by LII) reported for other gas turbine engines (Boies et al., 2015; Saffaripour et al., 2020). Further investigation into the ePPD measured by the LII 300 and corresponding size comparisons with other techniques such as transmission electron microscopy (TEM) images will be addressed in future work and is not discussed further as the focus of this study is on nvPM mass concentration measurements.

Figure 4Normalised mass concentration (NMC) mean and the derived effective primary particle diameter (ePPD) mean across the different laser fluence levels using the nvPM source from the kerosene-fuelled Rig A at high power output (HPO) and at idle conditions (idle). The shaded area indicates the ±2 % data range of the HPO case. The arrow indicates an optimum laser fluence level for real-time nvPM mass concentration measurements for all power conditions.
3.2.2 Sublimation
It was observed that at the HPO condition for Rig A, the maximum nvPM mass concentration was reached at a laser fluence of ∼2.25 mJ mm−2, beyond which the nvPM mass concentration decreased moderately with increasing laser fluence, attributable to sublimation of the particles. However, at the idle condition, no obvious sublimation was observed over the range investigated for this laser fluence sweep experiment. The peak particle temperatures reported by the LII 300, shown in Fig. 5a, permit further investigation into the difference in response to the nvPM produced at the idle and HPO conditions. The particles reach a lower peak temperature2 for the idle condition compared with that for HPO across the range of laser fluence levels applied. The combustion is fairly inefficient at the idle condition for Rig A, and >2000 ppm of unburnt hydrocarbons has been previously observed at this condition. It is suspected that due to the combustion inefficiency at the idle condition, the soot particles measured at the engine exit plane were coated with VOCs (Olfert et al., 2017). To overcome this, additional laser energy was required to vaporise the VOCs, energy that was no longer available to heat the nvPM. To illustrate the potential for this phenomenon, the data obtained at the idle condition was aligned (via a shift by an arbitrary laser fluence) with the HPO condition and replotted (Fig. 5b), with the mass concentrations normalised as described previously. It was observed that the relationship between the normalised mass concentration and laser fluence exhibit very similar behaviour at both the HPO and idle conditions. At both conditions, measured nvPM mass concentrations were found to be independent of laser fluence levels in the range 1.8–2.7 mJ mm−2, noting that the scale for the idle condition has been shifted.
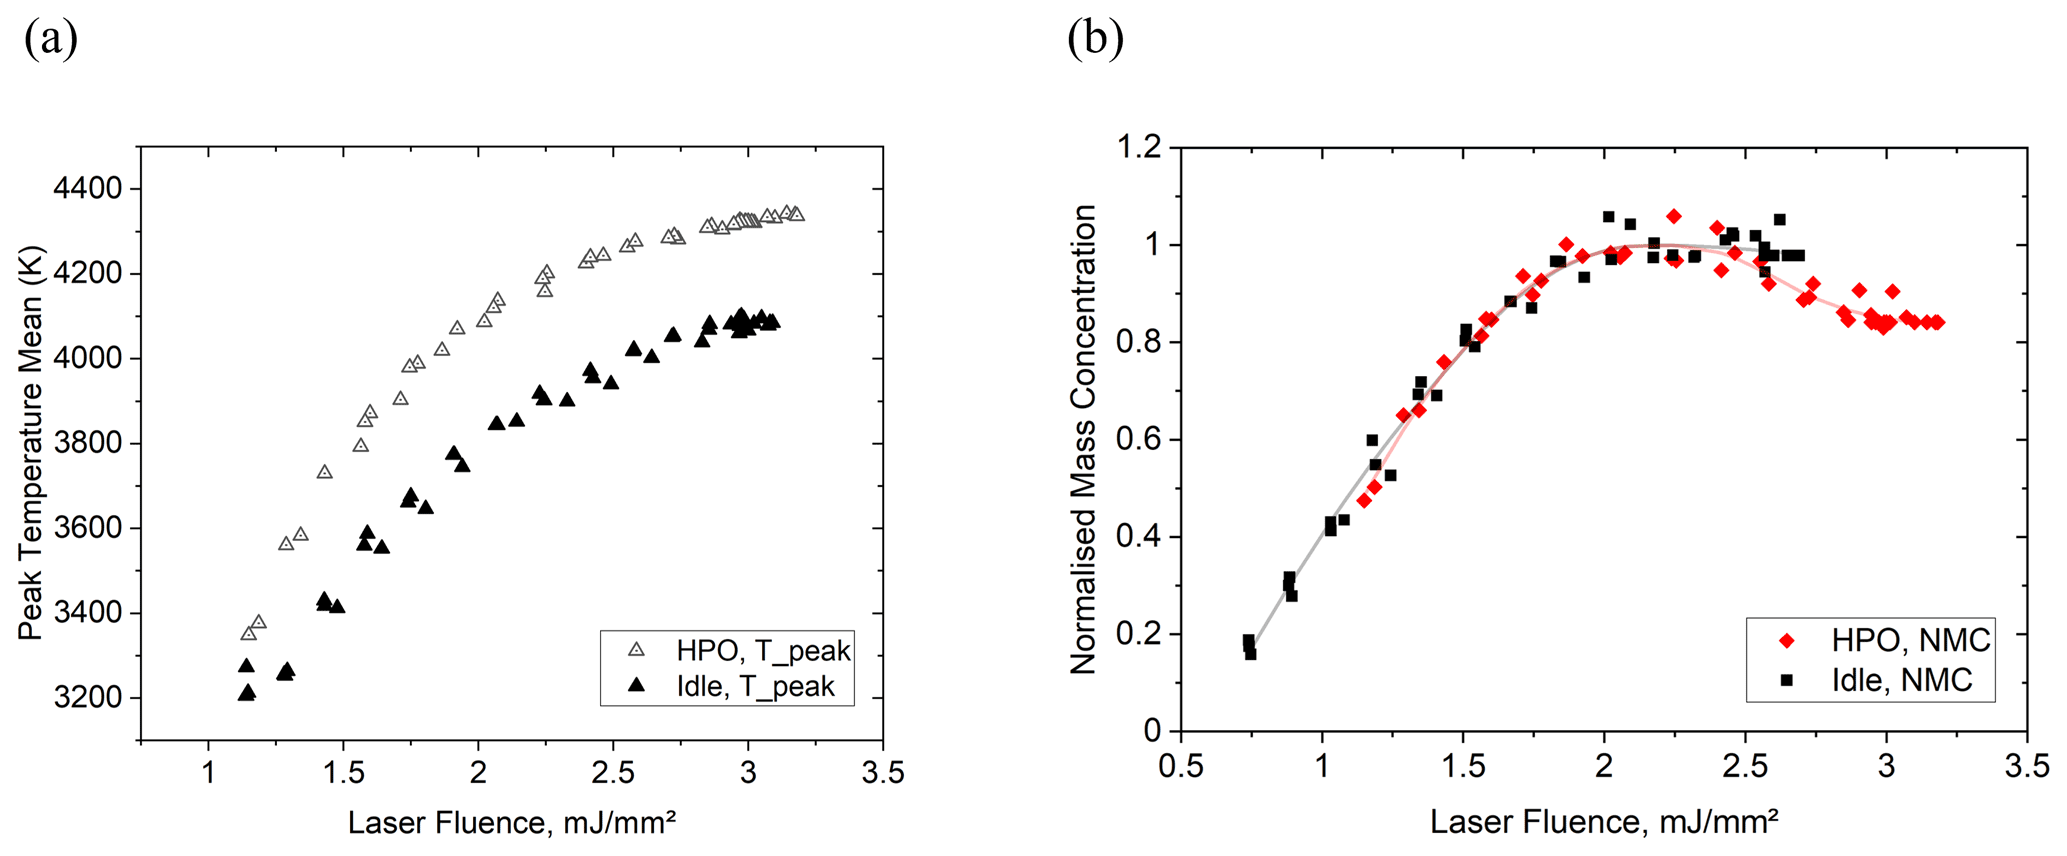
Figure 5(a) Peak particle temperature mean from the LII 300 for the range of laser fluence levels at the two operating conditions. (b) Shifting of the data in Fig. 4 with the idle condition's data aligned with that for HPO. NMC (normalised mass concentration) using the nvPM source from the kerosene-fuelled Rig A.
3.2.3 Repeatability
The impact of the laser fluence on the mass concentration measurements shown in Fig. 4 were also evaluated across multiple LII 300 instruments (LII 1 to LII 4) using the same nvPM source from Rig A to better understand instrument-to-instrument differences and exclude potential single-instrument anomalies in the observed trends with laser fluence levels. The results obtained from the HPO condition are plotted in Fig. 6a. The trends of mass concentration measurements during the laser fluence sweep analysis across the four different LII 300 instruments were similar, with minor differences observed between the individual LII 300 instruments likely due to modest variations in the beam profiles from the lasers, the specifications of the optics, and the resulting shape and size of the laser sheet in the probe volume location. All the instruments demonstrated the existence of a plateau region, identified as the range of fluence levels where the mass concentration was independent of the fluence level applied. The fluence levels from each instrument were estimated from the energy meter in the instruments and laser beam cross-section area in the probe volume, obtained from a beam profile camera, as mentioned previously. It should be noted that while the internal meter in the LII 300 used for determining fluence is not a precision instrument, it does provide representative and consistent fluence values. However, without calibrated energy meters, the fluences reported for each instrument may not be directly compared to the other instruments. To aid in interpretation of the results, fluence shifts were applied for different operating conditions (HPO, Idle in Fig. 5b) and different instruments (LIIs 1 to 4 in Fig. 6b) and can be used for different rigs (Rigs A, C–F in Fig. 11b) to align the fluence sweep data. The data from LII 3 and LII 4 were shifted with an offset laser fluence value to fit with the data from LII 1 in Fig. 6b. The data from LII 2 did not require shifting as the fit with the data from LII 1 was good. The normalised and shifted mass concentration profiles from the four different LII 300 instruments were found to repeatedly demonstrate similar behaviour. While interpretation of the behaviour in the low fluence region (fluence <1.8 mJ mm−2 for Rig A) remains a topic to be explored, it is recommended that measurements be acquired in the plateau region (1.8< fluence <2.7 mJ mm−2 for Rig A; Fig. 6b) and that extra care be taken in interpreting the results from the low fluence and sublimation regions.
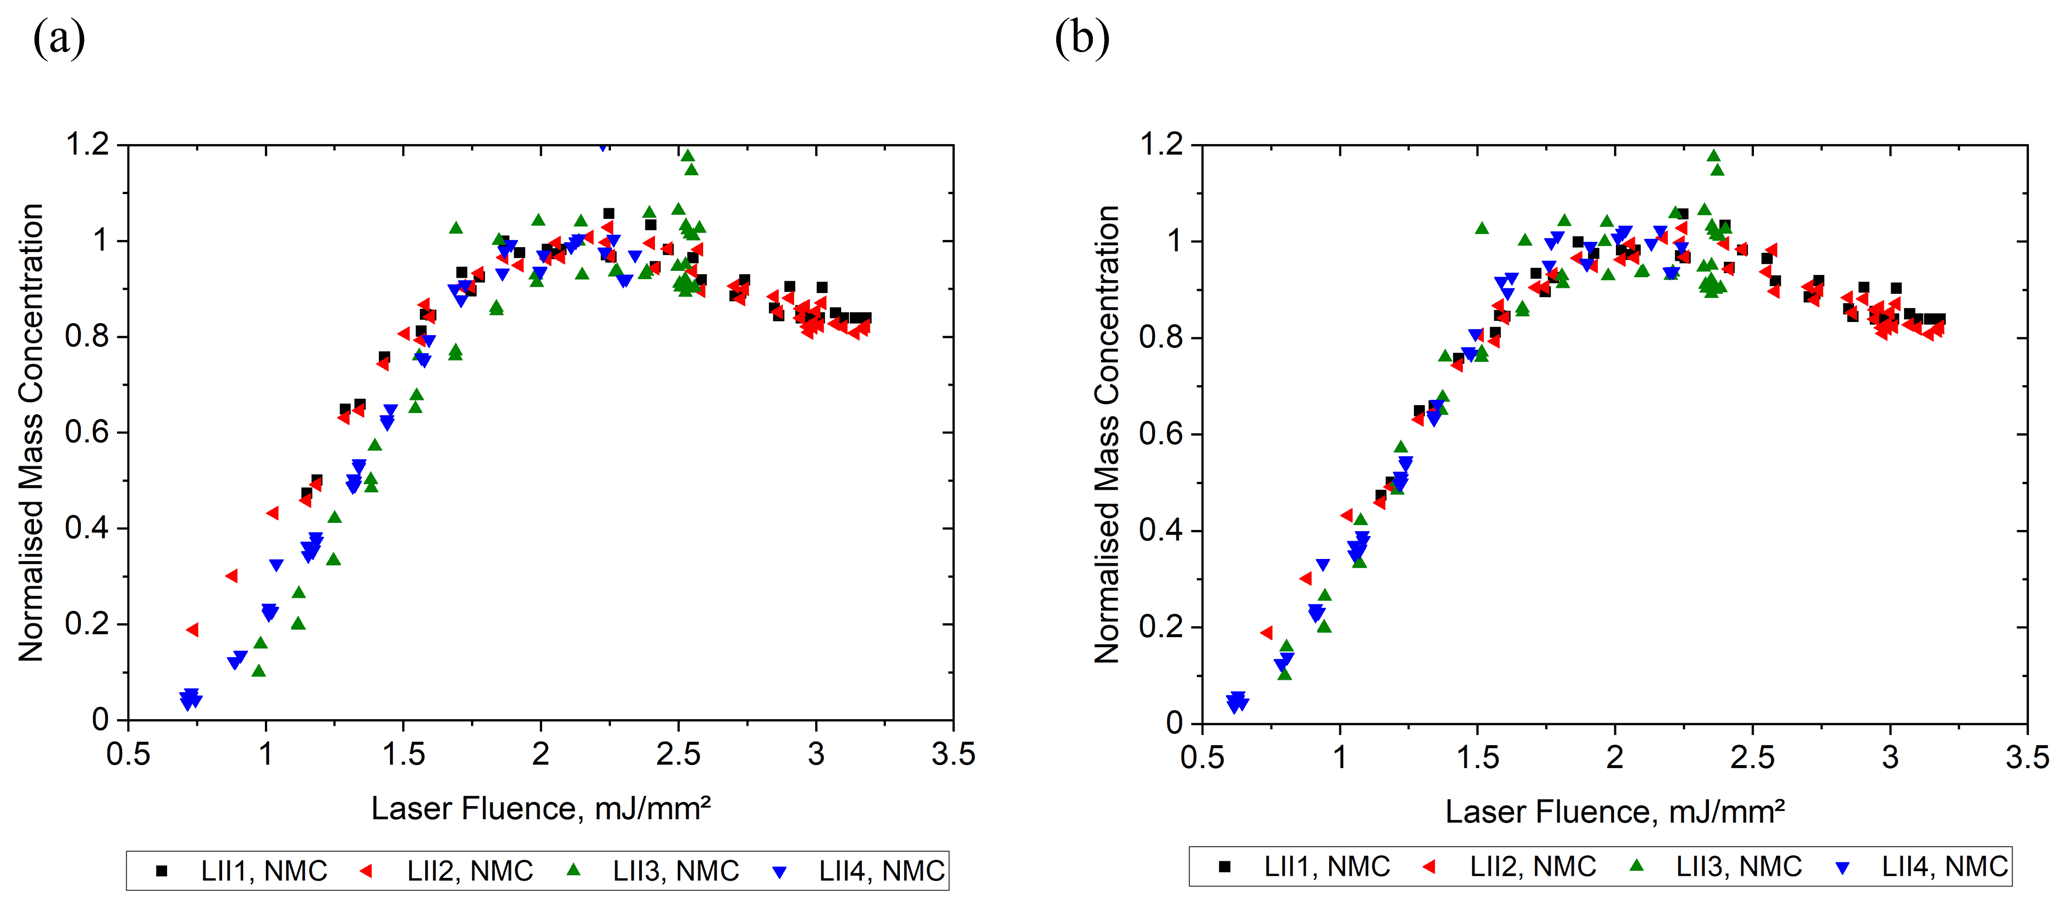
Figure 6Normalised mass concentration (NMC) mean across the different laser fluence measured from the kerosene-fuelled Rig A by multiple LII instruments (LIIs 1 to 4): (a) original output from the multiple LII instruments and (b) the laser fluence axis of instruments LII 3 and LII 4 was shifted to fit the data from LII 1.
3.2.4 Laser fluence – Q-switch delay mapping
During the laser fluence sweep tests, the laser fluence levels were adjusted by changing the Q-switch delay settings. The correlations in between the Q-switch delay settings and the laser fluence levels from the multiple LII instruments are different due to modest variations in the characteristics of each laser used in the LII 300 instruments. The correlation maps obtained during the laser fluence sweep tests at the HPO condition of Rig A are shown in Fig. 7. Each point indicates an average fluence over a period of 15 s duration. Raw data are shown here with no normalisation or adjustments included. A fifth-order polynomial function was fit to the data from each instrument and shown as a solid line in Fig. 7. The fit was essentially linear except at the lowest Q-switch delay settings, where there was evidence of saturation observed for the four different LII 300 instruments. LII 1 was also used for measurements from Rigs C to F. For the test on Rig B (IP rig) the LII 1 was not available, and LII 2 was used instead. LII 1 and LII 2 have a very similar relationship between laser fluence and normalised mass concentration, as shown in Fig. 6.

Figure 7Correlation between the Q-switch delay settings and the laser fluence levels from the LII 300 instruments (LIIs 1–4).
3.2.5 Particle size distribution
Figure 8a shows the particle size distributions in electrical mobility diameter (dm) measured using the SMPS in this study from multiple sources. For spherical particles, dm is equivalent to the volume equivalent diameter dve, whereas for aggregate particles, dm is larger than dve (Decarlo et al., 2004). In Fig. 8b and c, example images of the typical soot morphology collected in a previous study (Saffaripour et al., 2017) from a turboshaft engine exhaust are also shown for reference. The TEM images from two conditions are shown here: condition E1-1 (speed of 13 000 rpm, load 70 shaft horse power (shp), and the estimated global equivalence ratio φ of 0.25) and condition E1-2 (speed of 21 000 rpm, load 630 shp, and φ of 0.18). The image shows the primary particles and the fractal-shaped soot aggregate analysed via transmission electron microscope (TEM). In general, the primary particle diameters were small (17.2 nm (condition E1-1) and 20.8 nm (condition E1-2)), as were the aggregates, and they were non-volatile, with no evidence of significant semi-volatile coatings (clear boundaries) (Saffaripour et al., 2017). The aggregate sizes that were determined by projected equivalent-area diameter from TEM images were 33.5 nm (condition E1-1) and 45.7 nm (condition E1-2) (Saffaripour et al., 2017). The geometric mean diameter determined from the particle size distributions from Rig A is in close agreement with the prior results of aggregate diameter from TEM image analysis by Saffaripour et al. (2017).
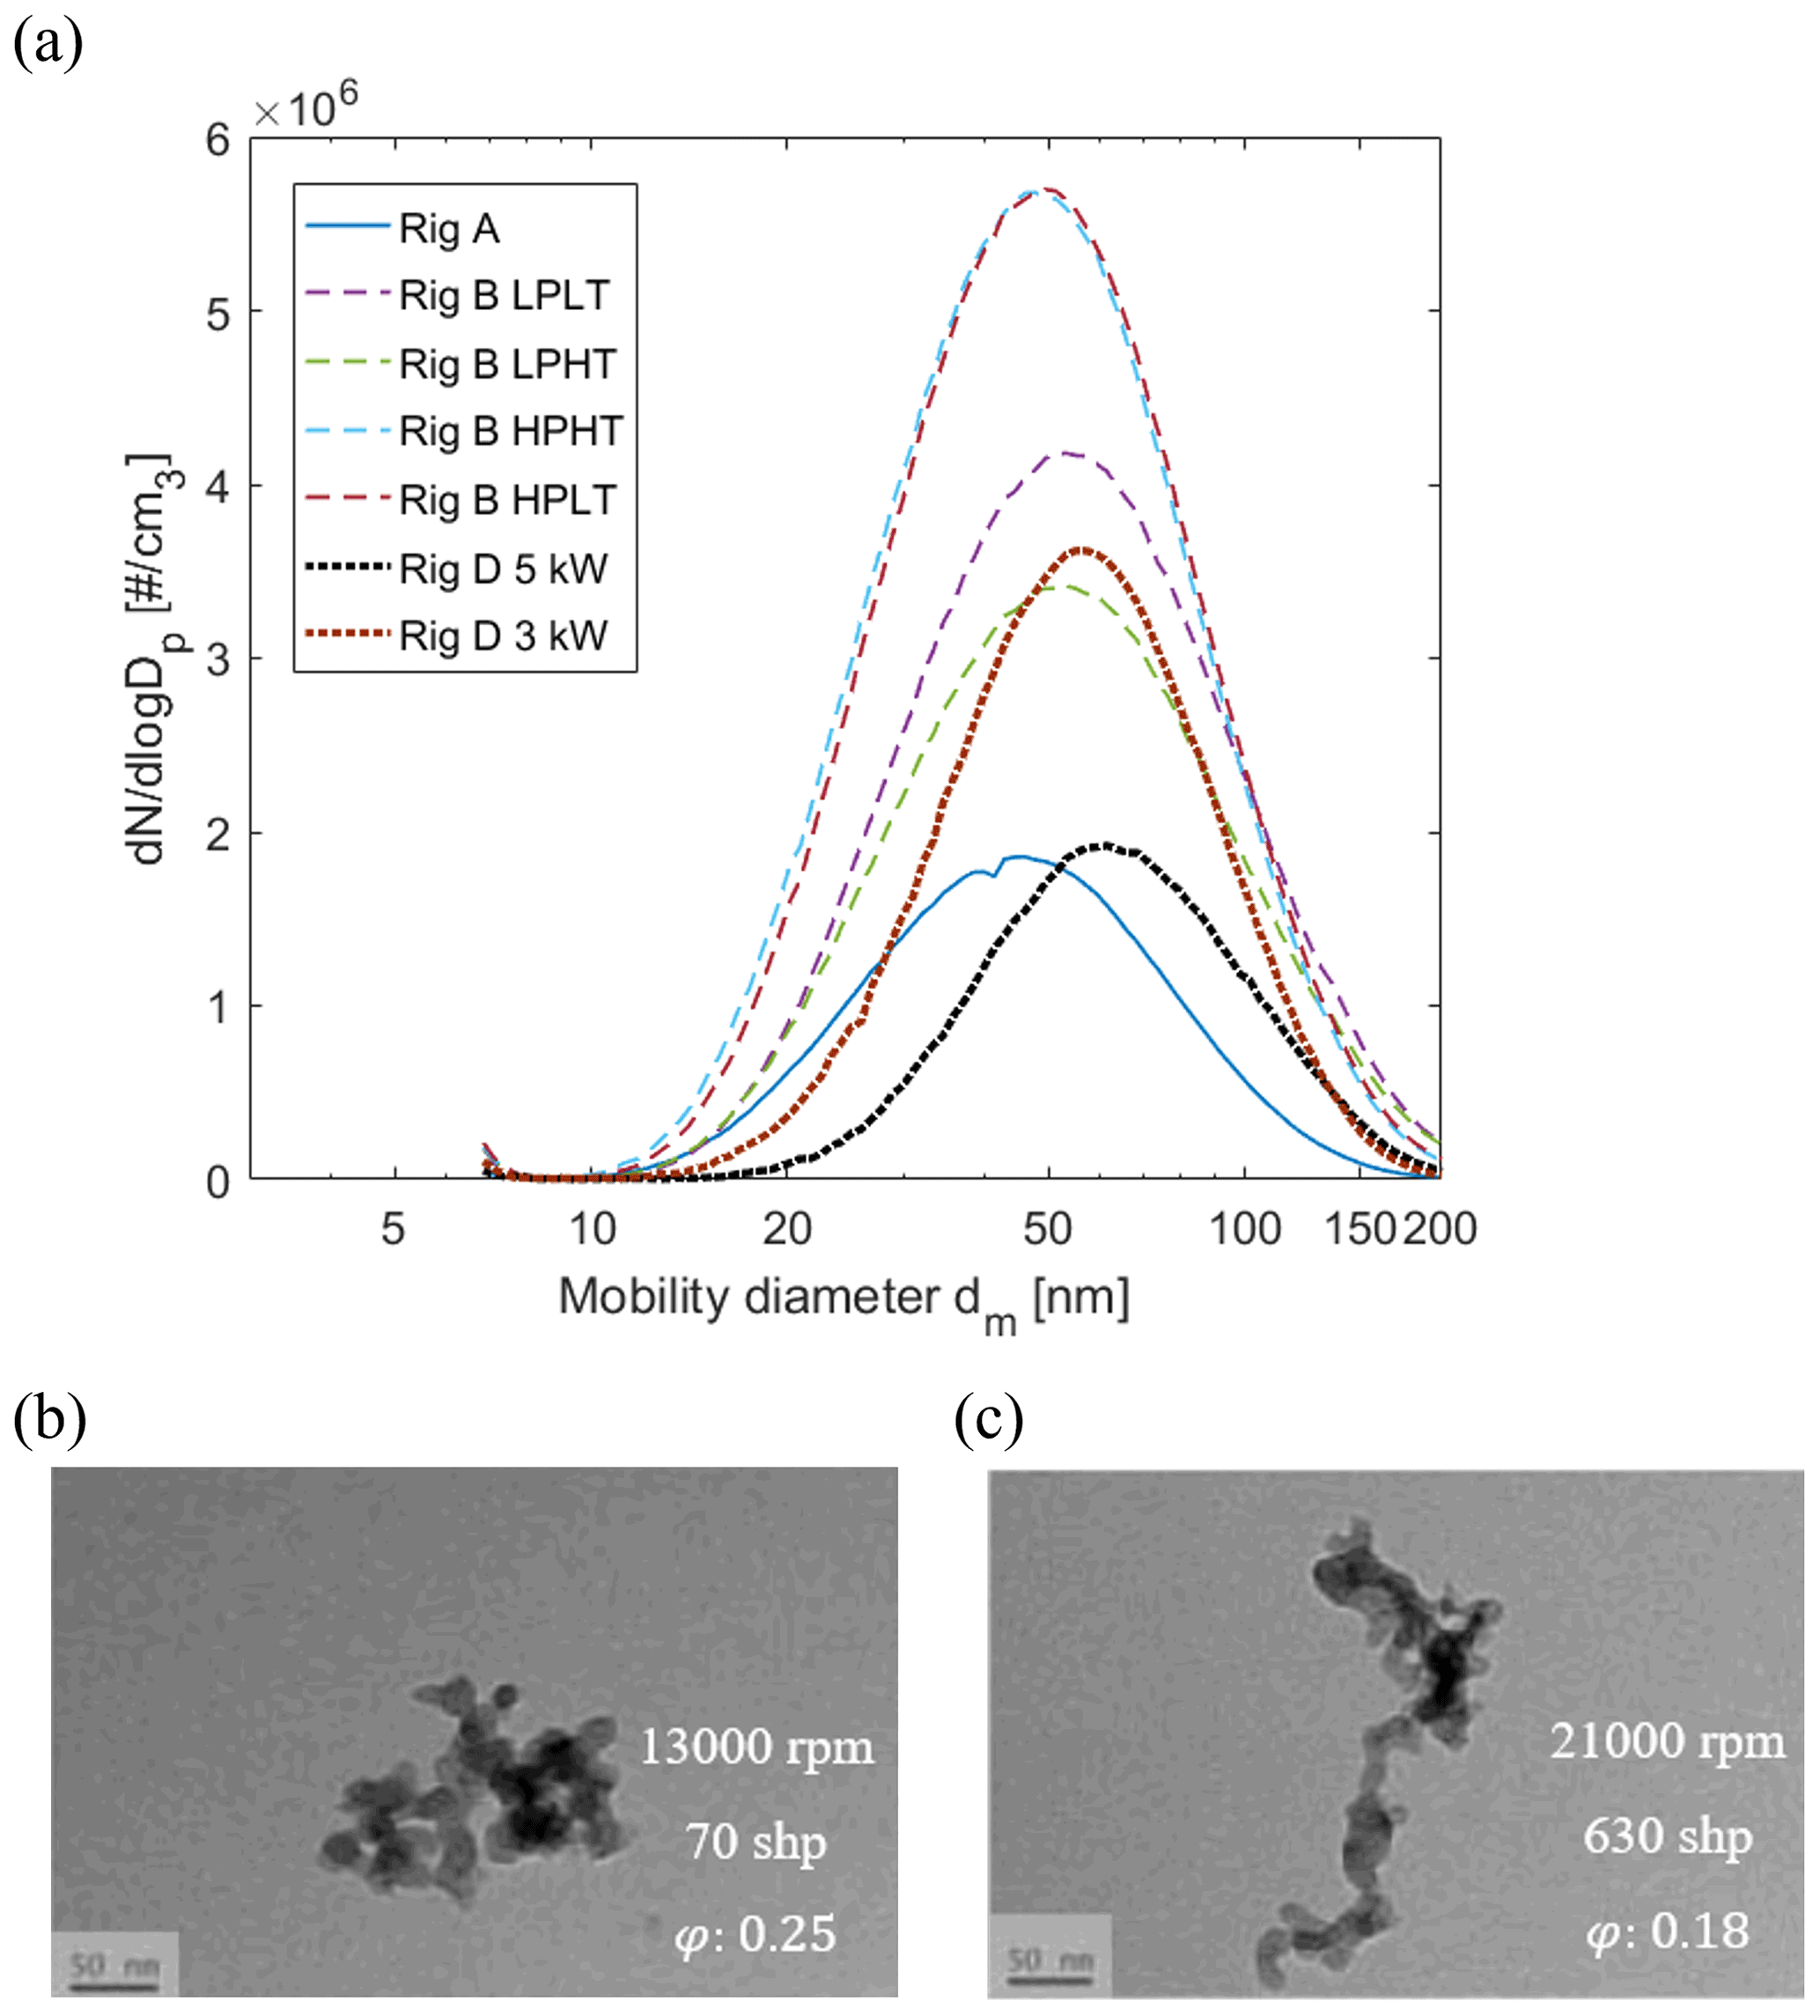
Figure 8(a) Typical particle size distributions measured using the SMPS for the multiple sources and operating conditions: Rig A (kerosene-fuelled, HPO condition), Rig B (kerosene-fuelled, four operating conditions), and Rig D (diesel-fuelled, two load conditions); (b, c) typical TEM images of soot produced by a turboshaft engine (speed: 13 000 (b) and 21 000 rpm (c); shaft horse power: 70 (b) and 630 shp (c); and the estimated global equivalence ratio of 0.25 (b) and 0.18 (c), respectively) at a magnification of 45 000× (Saffaripour et al., 2017).
3.3 LII 300 fluence sweeps from multiple kerosene-fuelled rigs – Rigs B and C
Figures 9 and 10 compare the mass concentration profiles as a function of laser fluence levels from the different test rigs, Rig B (IP rig) and Rig C (APU), respectively, both operating with kerosene fuel. The laser fluence sweep tests for the four operation conditions of Rig B (Fig. 9) resulted in similar trends with fluence for the NMC. In general, the mass concentration results (Fig. 9a, original output) were less dependent on the laser fluence levels (plateau) over the fluence range of 1.8 to 2.5 mJ mm−2, where peak mass concentration was observed at ∼2.1 mJ mm−2 for the two low-pressure cases and ∼2.2 mJ mm−2 for the two high-pressure cases. For the NMC at the low-pressure (LP) condition, both the low-temperature (LT) and high-temperature (HT) cases were coincident; however, the two high-pressure (HP) cases were modestly shifted to higher fluence, with the high-pressure, low-temperature (HPLT) results having the larger shift, only 0.12 mJ mm−2. Sublimation was observed above a fluence of 2.5 mJ mm−2 for all four test conditions, with the HPLT condition requiring slightly more fluence than the other conditions. The TOA measurements for the four cases indicate similar organic carbon content, with the OCTC ratio of 0.43 (LPLT), 0.41 (LPHT), 0.43 (HPHT), and 0.47 (HPLT). The relatively high OCTC ratio suggests that additional laser energy was used to evaporate volatile organic material coating the nvPM. The higher OCTC for the HPLT condition compared to the rest of the conditions is consistent with requiring additional fluence across the entire range, from low fluence to sublimation. Shifts to the laser fluence axis were applied to the HP cases to account for evaporation of organics, shown in Fig. 9b, demonstrating the self-similarity of the fluence data observed for all four conditions with Rig B.

Figure 9Laser fluence sweep performance using Rig B as the nvPM source, with four operating conditions. NMC – normalised mass concentration. Superimposed are the best-fit curves from the Loess method. (a) Original output from the LII instrument and (b) the laser fluence axis of HPHT and HPLT was shifted (left shift of 0.05 and 0.12, respectively) to fit the LP curves.
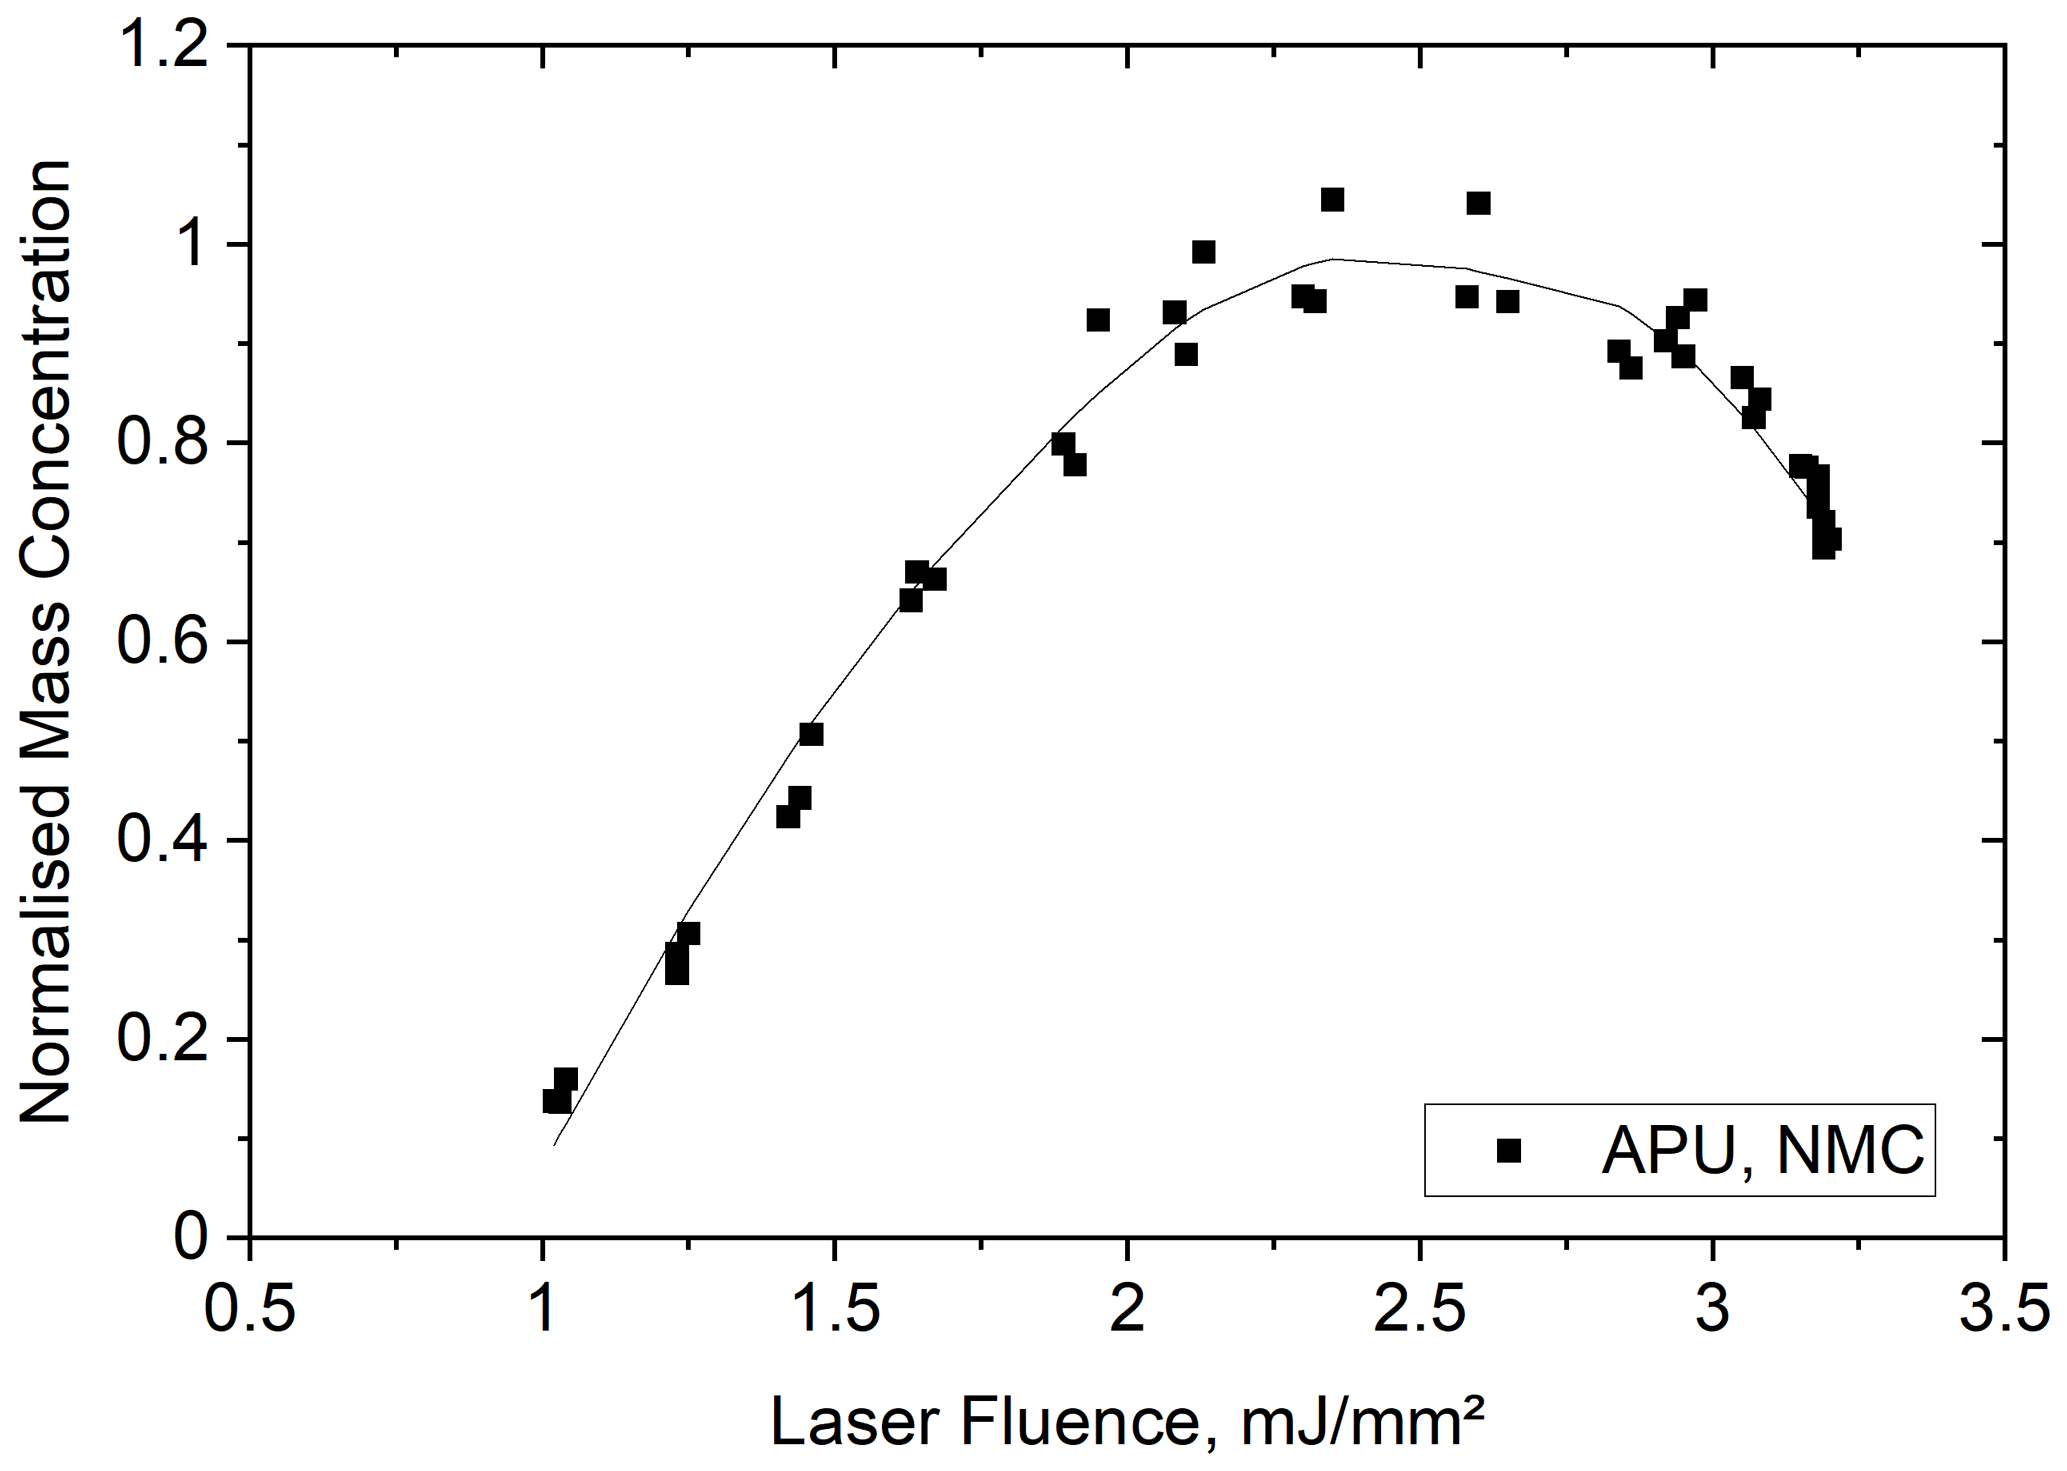
Figure 10Laser fluence sweep results using sources from Rig C. NMC – normalised mass concentration. The best-fit curve from the Loess method is shown with a black line.
The laser fluence sweep measurements using the nvPM source from Rig C are shown in Fig. 10. Peak mass concentration was obtained at ∼2.25 mJ mm−2 laser fluence of Rig C, similar to that from Rig A (∼2.25 mJ mm−2) and Rig B (2.2–2.5 mJ mm−2), operating with the same fuel (kerosene). Mass concentration measurements were less dependent on the laser fluences in the range of 2 to 3 mJ mm−2 for Rig C.
The similar performance of the LII 300 measurements from multiple rigs demonstrated the robustness of this technique and revealed that an optimised laser fluence can be valid for real-time measurements from a variety of sources. On the other hand, it is shown that laser fluence shifts may be required to align the fluence sweeps for different operating conditions, even from the same sources (such as shown in Figs. 4–5 from Rig A). This suggests that possible differences in the composition (such as volatile organic coatings), morphological characteristics (internal structure of the primary particles or aggregation), or optical absorption properties of the particles at different operating conditions may be important. This observation suggests that care must be taken in selecting the optimum laser fluence when using a single or different source (such as a laboratory flame) for calibrating LII 300 instruments such that it is valid (in the plateau regime) for both the calibration source and the intended application. In most cases it is possible to select one laser fluence that is in the plateau regime for all operating conditions for a single source.
3.4 LII 300 fluence dependence – different sources and fuels
The laser fluence dependence was further investigated for Rigs D–F, which were reciprocating engine sources with intermittent combustion and burned diesel or gasoline fuels, unlike Rigs A–C, which were steady-state combustion sources with kerosene fuel. The results are shown in Fig. 11a and demonstrate that, similar to the results for Rigs A–C, there is a wide range of laser fluence levels (1.7–2.7 mJ mm−2) where the measurements of mass concentrations were insensitive to the laser fluence levels (plateau regime). This allows a moderate laser fluence to be applied in practical applications to avoid the mass loss due to sublimation and at the same time reduce the reliance on a critical laser fluence value as the same result is obtained across this range of laser fluences. Mass concentrations obtained from Rigs D–F were normalised by the maximum of each rig individually and plotted together with those from Rig A and Rig C in Fig. 11b, with all the data acquired using the same instrument (LII 1). As with Rigs A–C, it should be noted that at low fluence levels (<1.7 mJ mm−2 for Rigs D–F), the reported mass concentrations were lower than those measured when the laser fluence level is in the plateau regime.
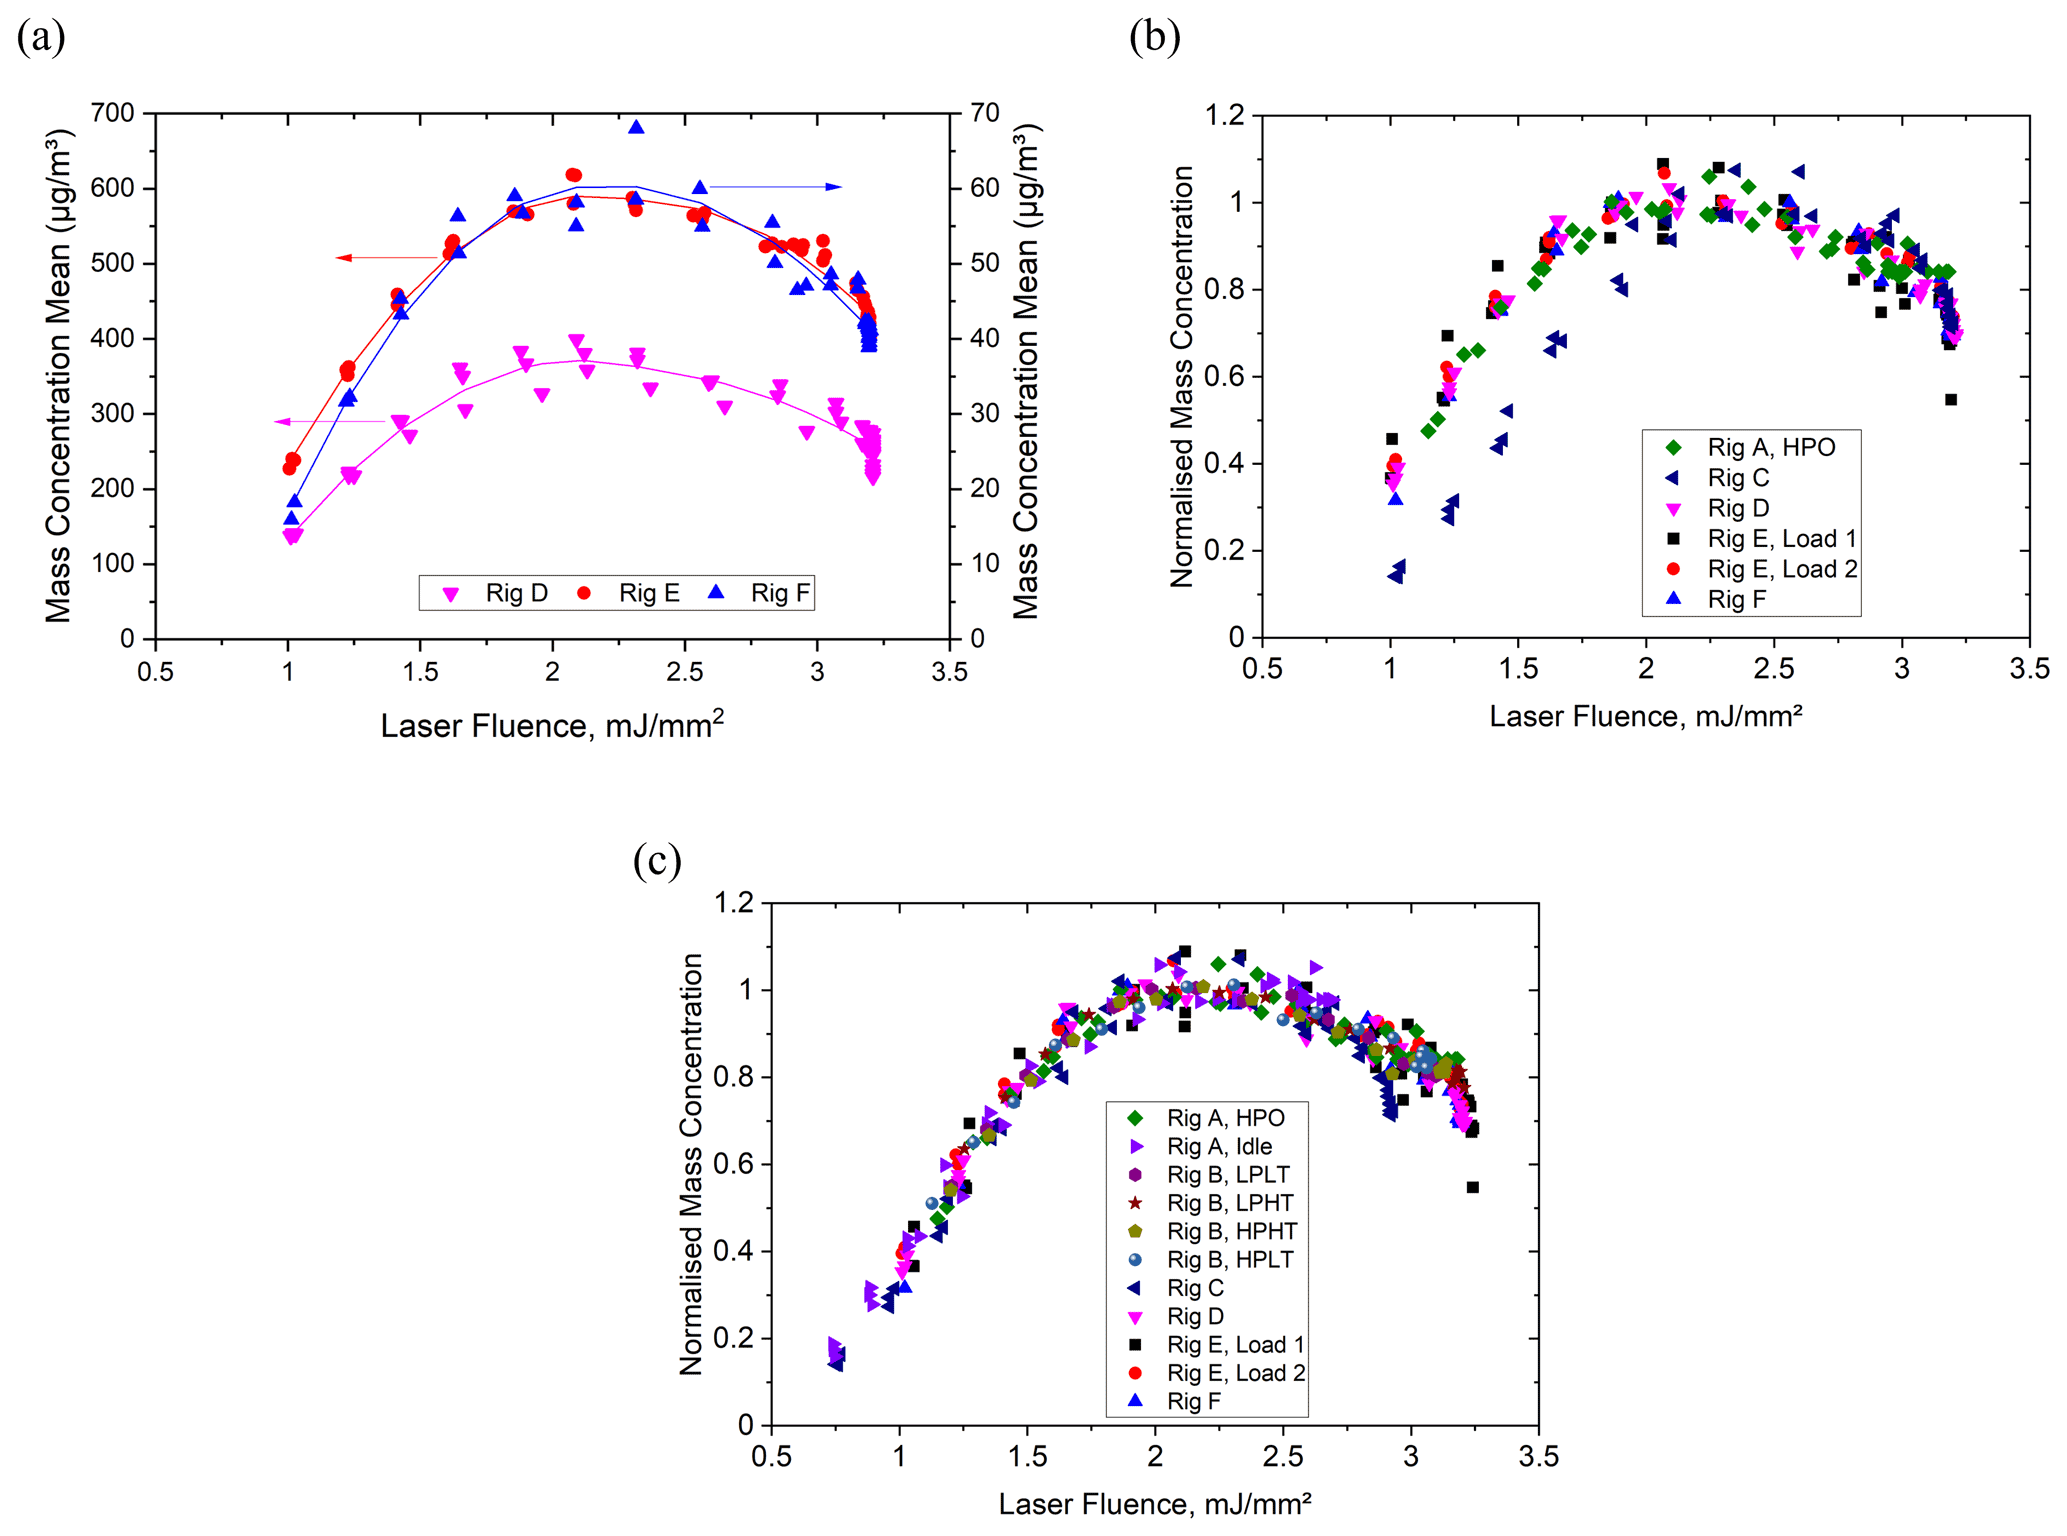
Figure 11(a) Laser fluence dependence of mass concentration measurements from LII 300 using multiple nvPM sources from diesel- (Rigs D and E, Load 2) and gasoline-fuelled (Rig F) engine exhausts at typical operation conditions. Superimposed are the best-fit curves from the Loess method. (Arrows point at the corresponding y axis.) (b) Normalised mass concentration vs. laser fluences from Rigs A and C to F. Measurements were carried out by the same instrument LII 1 for the kerosene cases (Rigs A, C) as for the diesel and gasoline cases (Rigs D to F). Rig E, Load 1: speed 1200 rpm, load 165 Nm; Load 2: speed 2200 rpm, load 300 Nm. (c) Combined data from all rigs with the laser fluence axis of Rig C and Rig E, Load 1, shifted to the left by 0.27 and −0.05 mJ mm−2, respectively.
In general, similar behaviour is observed in the normalised data from all the rigs and fuels in the plateau ranges. Figure 11b illustrates that the optimum fluence from Rig A overlaps well with that from other rigs, except for Rig C. The results from Rig C require a shift on the fluence axis (of around 0.3 mJ mm−2) in order to align with those from Rig A (HPO condition), as shown in Fig. 9c, where the fluence data from 6 rigs and a total of 11 conditions converge after the fluence shifts were applied. This shift was due to the combustion-formed soot particles emitted from Rig C, which had different physical and chemical characteristics compared to the soot formed from Rig A. Further analysis would require much greater understanding of the soot morphology, structure, and composition characteristics from the various operation conditions, which is beyond the scope of this paper.
The laser fluence sweeps showed similar results in terms of achieving an optimum fluence range with a plateau regime for the NMC measurements across multiple rigs and fuels, which may suggest the option of utilising cost-effective rigs as nvPM sources for calibration prior to measurements on aircraft gas turbine engines. The data suggest a near universality of the fluence sweeps, with the need to shift some by a fixed amount of fluence to compensate for differences in the particle properties, but all with the same shape and exhibiting a plateau regime over which the response is uniform for a range of laser fluence values. Utilising an optimum fluence level of 2.2 mJ mm−2, which corresponds to the peak of the best fit from Rigs D to F, will fall within the 2 % error band, which defines the plateau regime for the HPO condition of Rig A. It should be noted that the shift in the fluence levels measured on Rig A (shown in Fig. 4) required to align the fluence sweeps at the idle and HPO conditions (shown in Fig. 5b) would lead to a 4 % bias error for the idle condition of Rig A if the fluence is set at 2.2 mJ mm−2. At engine idle or at conditions where less mature soot (Migliorini et al., 2011) or fewer volatile coatings are encountered, the laser fluence range for the plateau regime (with a 2 % error band) will need to be shifted to a higher fluence level, covering the range from 2.4 to 3.2 mJ mm−2. The optimum fluence to cover the full range of operating conditions for Rig A is the region where these two plateau regime ranges overlap in the range of 2.4 to 2.5 mJ mm−2.
3.5 Comparison of mass concentration results from different diagnostic techniques
The nvPM mass concentration was simultaneously measured using LII 300, PAX, and MSS for a range of conditions for Rigs A–F. Here the real-time nvPM mass concentration measurements from Rig A are discussed (Fig. 12) as an example for interpreting the results from the laser-induced incandescence and photoacoustic real-time diagnostic techniques.
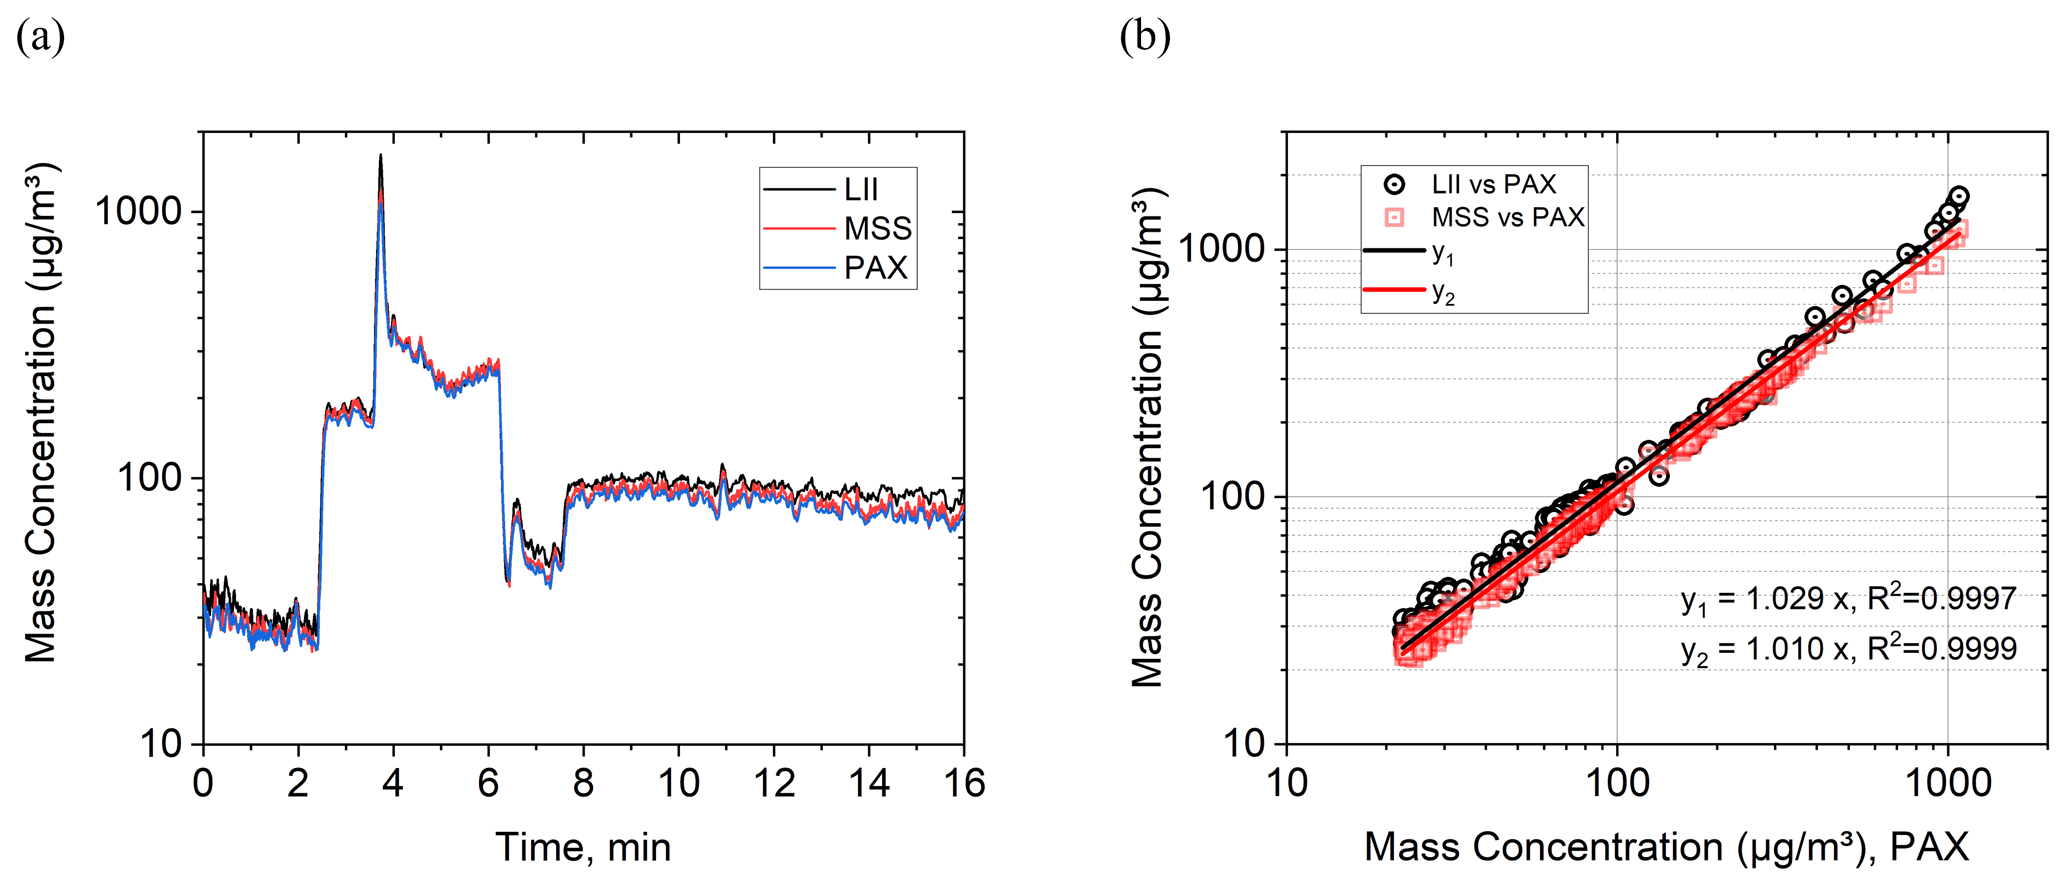
Figure 12(a) Mass concentration profiles for LII 300, PAX, and MSS and (b) correlations between LII 300 and MSS nvPM mass concentrations to those from PAX (Rig A).
Figure 12 shows that a high degree of correlation was found between the LII 300, PAX, and MSS for nvPM mass concentration measurements. From the linear curve fits over nearly 2 orders of magnitude (y1 – LII vs. PAX – and y2 – MSS vs. PAX – with an intercept value 0), the mass concentrations from the LII 300 and PAX are within 2.9 % of each other, and the mass concentrations from the LII 300 and MSS are within 1.9 % of each other, much less than the measurement uncertainties associated with each of the instruments.
The LII 300 measurements for nvPM mass concentrations were further compared with the EC results obtained from TOA. The results from the multiple rigs are shown in Fig. 13, normalised to the EC results. The measurements from the PAX and MSS instruments are also included for comparison. The nvPM mass concentrations measured by the real-time instruments, i.e. LII 300, PAX, and MSS, were averaged for the same duration as the filter collection by the corresponding TOA measurements. The error bars of real-time instruments were computed by calculating the relative standard deviation, RSD (standard deviation of the sampled mass concentration data normalised to their average value), indicating the variability in the nvPM mass measurement. The LII 300, PAX, and MSS results generally are not significantly different than those for EC from TOA, with error bars overlapping within the uncertainty (16.7 %) of the TOA EC determination. The real-time instruments' results were higher (1 %–20 %) than the EC results from TOA on nvPM emissions from most rigs, except the PAX result from Rig D (3 kW). The PAX result from Rig D (3 kW) was 4 % lower than that for the EC result; however, it was still within the uncertainty in the TOA EC measurement. Unlike other cases investigated where the nvPM mass concentrations were observed to be in the range of 100–800 µg m−3, the nvPM mass emissions of Rig F were lower, ∼40 µg m−3. The TOA EC uncertainty from the NIOSH method is greatest at the lowest mass concentrations (NIOSH, 2003) and is reduced at higher mass concentrations. In comparison of the real-time instruments' performance, for the cases investigated, PAX results were on average 6 % lower than those for the LII 300 from the kerosene-fuelled rigs, 10 % lower than those for the LII 300 from the diesel-fuelled rigs, and 6 % lower than those for the LII 300 from the gasoline-fuelled rig. MSS results were on average 7 % higher than those for the PAX from both kerosene-fuelled and diesel-fuelled rigs. This agrees in general with the finding of previous studies (Smallwood et al., 2010; Durdina et al., 2016; Lobo et al., 2020; Corbin et al., 2020), and the discrepancy between the various instruments from source to source and amongst the different fuels is likely caused by difference in the properties of the particles (morphology, structure, and optical absorption), the different content of non-refractory components of the particles (i.e. quantities of bound H and O, volatiles, nitrates, ash, sulfates, etc.) (Smallwood et al., 2010), and uncertainties associated with varying relative humidity content in the heated sampling cell (for photoacoustic instruments) (Arnott, 2003) as well as the choice of the split point in determining EC from TOA (Baumgardner et al., 2012). In terms of identifying a substitute for the aircraft gas turbine helicopter engine (Rig A) for calibrating the LII 300, Rig C (APU) appears to be the closest in terms of LII 300 response, 1 % higher than EC from TOA on the same source, well within the uncertainty in the methods. In terms of the variability in nvPM mass concentrations results, the LII 300 exhibited a lower variation of 5 % on average among all the rigs and operating conditions investigated compared to that for the other instruments, which was 6 % for PAX, 7 % for MSS, and 7 % for EC from TOA. A higher variability was shown for cases of low nvPM mass emissions (such as from Rig F or Rig D at 3 kW; refer to nvPM mass concentrations' ranges detail in Fig. 13 caption) for both PAX and MSS than the variability exhibited for cases of high nvPM mass emissions (such as in Rigs B and E). This trend of a low variability in nvPM mass at high concentrations is consistent with results from emissions measurements of the miniCAST soot generator (Lobo et al., 2020) and other aircraft engines (Lobo et al., 2015b, 2016).

Figure 13Comparison of the mass concentration results from the multiple rigs and diagnostic techniques. The shaded area marks the 16.7 % uncertainty in the TOA from the NIOSH method (NIOSH, 2003). The nvPM mass concentrations are in the range of 90–470 µg m−3 from Rig A, 500–600 µg m−3 from Rig B, 670–780 µg m−3 from Rig C, 300–550 µg m−3 from Rig D 5 kW, 200–270 µg m−3 from Rig D 3 kW, 230–590 µg m−3 from Rig E, and 20–70 µg m−3 from Rig F.
New standards and recommended practices adopted by the ICAO require the nvPM mass and number emissions from aircraft engines to be quantified during emissions certification tests. The LII 300, the only commercial LII instrument utilising the AC-LII method, has been used to measure nvPM mass emissions from aircraft engines. Previous studies reported the sensitivity of the LII technique to the type of black carbon sources. In this study the response of the LII 300 instrument to different nvPM from a range of different sources and fuels was investigated to understand the relationship between the laser fluence values and the resulting nvPM mass concentrations and to evaluate the suitability of different sources and fuels to be used as an nvPM calibration source for the LII 300. For all the tests using multiple rigs as sources of nvPM emissions, LII 300 measurements demonstrated a plateau regime with a range of laser fluence values where the resulting nvPM mass concentration measurements were insensitive to the laser fluence levels applied. The shape of the fluence sweep curves was nearly universal for all sources, operating conditions, and fuels investigated. Optimising the laser fluence for the plateau regime over the range of source operating conditions was shown to reduce potential uncertainties for the LII 300 associated with the corresponding range of nvPM properties.
Data demonstrated that the LII 300, PAX, and MSS had similar response and performance in the real-time measurements of nvPM emissions from multiple rigs studied. Compared to other diagnostic instruments, the real-time measurement output of LII 300 exhibited no significant differences and high correlation (>97 %) with the photoacoustic instruments. To assess suitability of replacing an aircraft gas turbine engine as a calibration source, further work is required to establish the repeatability and reproducibility of particle sources as well as investigating additional laboratory sources, including the miniCAST, MISG (mini-inverted soot generator), and nebulised carbon black particles. In addition, future work should include investigating the morphology characteristics, composition, and optical absorption of the various particulate matter sources from multiple operating conditions to further understand the relationship between soot particle characteristics and the response of real-time instruments used for the measurement of nvPM mass concentration.
The datasets analysed during the current study are available from the corresponding author on request.
GJS, MPJ, PL, MCP, and AS conceived and planned the study and performed the experiments. RY processed the experimental data and performed the analysis. RY drafted the manuscript with input from PL and GJS and designed the figures. PL and GJS assisted in interpreting the results. DB contributed to the discussion on the time-weighted normalisation method. All authors discussed the results and contributed to the final paper.
The contact author has declared that neither they nor their co-authors have any competing interests.
Publisher’s note: Copernicus Publications remains neutral with regard to jurisdictional claims in published maps and institutional affiliations.
The authors would like to acknowledge the funding from Transport Canada for this project and support from Rolls-Royce. The authors also thank Dan Clavel and Brett Smith, who assisted with the data collection. Ruoyang Yuan would like to acknowledge the funding from the EPSRC and the David Clarke Fellowship to support her work.
This research has been supported by Transport Canada and the Engineering and Physical Sciences Research Council (grant no. EP/S017259/2).
This paper was edited by Pierre Herckes and reviewed by four anonymous referees.
Adams, K. M., Davis, L. I., Japar, S. M., and Pierson, W. R.: Real-time, in situ measurements of atmospheric optical absorption in the visible via photoacoustic spectroscopy-II. Validation for atmospheric elemental carbon aerosol, Atmos. Environ., 23, 693–700, https://doi.org/10.1016/0004-6981(89)90017-6, 1989.
Air quality expert group (AQEQ): Particulate Matter in the UK: Summary, Defra, London, ISBN 0-85521-144-X, available at: https://uk-air.defra.gov.uk/library/assets/documents/reports/aqeg/Particulate_Matter_in_The_UK_2005_Summary.pdf (last access: 10 December 2020), 2005.
Arnott, W. P.: Photoacoustic and filter-based ambient aerosol light absorption measurements: Instrument comparisons and the role of relative humidity, J. Geophys. Res., 108, 4034, https://doi.org/10.1029/2002JD002165, 2003.
Axelsson, B., Collin, R., and Bengtsson, P.-E.: Laser-induced incandescence for soot particle size measurements in premixed flat flames, Appl. Optics, 39, 3683, https://doi.org/10.1364/ao.39.003683, 2000.
Bachalo, W. D., Sankar, S. V, Smallwood, G. J., and Snelling, D. R.: Development of the Laser-Induced Incandescence Method for the Reliable Characterization of Particulate Emissions, in: the International Symposia on Applications of Laser Techniques to Fluid Mechanics, Lisbon, 2002.
Baumgardner, D., Popovicheva, O., Allan, J., Bernardoni, V., Cao, J., Cavalli, F., Cozic, J., Diapouli, E., Eleftheriadis, K., Genberg, P. J., Gonzalez, C., Gysel, M., John, A., Kirchstetter, T. W., Kuhlbusch, T. A. J., Laborde, M., Lack, D., Müller, T., Niessner, R., Petzold, A., Piazzalunga, A., Putaud, J. P., Schwarz, J., Sheridan, P., Subramanian, R., Swietlicki, E., Valli, G., Vecchi, R., and Viana, M.: Soot reference materials for instrument calibration and intercomparisons: a workshop summary with recommendations, Atmos. Meas. Tech., 5, 1869–1887, https://doi.org/10.5194/amt-5-1869-2012, 2012.
Black, J. D. and Johnson, M. P.: In-situ laser-induced incandescence of soot in an aero-engine exhaust: Comparison with certification style measurements, Aerosp. Sci. Technol., 14, 329–337, https://doi.org/10.1016/j.ast.2010.02.007, 2010.
Boiarciuc, A., Foucher, F., and Mounaïm-Rousselle, C.: Soot volume fractions and primary particle size estimate by means of the simultaneous two-color-time-resolved and 2D laser-induced incandescence, Appl. Phys. B, 83, 413–421, https://doi.org/10.1007/s00340-006-2236-8, 2006.
Boies, A. M., Stettler, M. E. J., Swanson, J. J., Johnson, T. J., Olfert, J. S., Johnson, M., Eggersdorfer, M. L., Rindlisbacher, T., Wang, J., Thomson, K., Smallwood, G., Sevcenco, Y., Walters, D., Williams, P. I., Corbin, J., Mensah, A. A., Symonds, J., Dastanpour, R., and Rogak, S. N.: Particle emission characteristics of a gas turbine with a double annular combustor, Aerosol Sci. Technol., 49, 842–855, https://doi.org/10.1080/02786826.2015.1078452, 2015.
Bond, T. C. and Bergstrom, R. W.: Light absorption by carbonaceous particles: An investigative review, Aerosol Sci. Technol., 40, 27–67, https://doi.org/10.1080/02786820500421521, 2006.
Choi, M. Y. and Jensen, K. A.: Calibration and correction of laser-induced incandescence for soot volume fraction measurements, Combust. Flame, 112, 485–491, https://doi.org/10.1016/S0010-2180(97)00139-9, 1998.
Conrad, B. M. and Johnson, M. R.: Split point analysis and uncertainty quantification of thermal-optical organic/elemental carbon measurements, J. Vis. Exp., 151, e59742, https://doi.org/10.3791/59742, 2019.
Corbin, J. C., Czech, H., Massabò, D., de Mongeot, F. B., Jakobi, G., Liu, F., Lobo, P., Mennucci, C., Mensah, A. A., Orasche, J., Pieber, S. M., Prévôt, A. S. H., Stengel, B., Tay, L.-L., Zanatta, M., Zimmermann, R., El Haddad, I., and Gysel, M.: Infrared-absorbing carbonaceous tar can dominate light absorption by marine-engine exhaust, npj Clim. Atmos. Sci., 2, 12, https://doi.org/10.1038/s41612-019-0069-5, 2019.
Corbin, J. C., Peng, W., Yang, J., Sommer, D. E., Trivanovic, U., Kirchen, P., Miller, J. W., Rogak, S., Cocker, D. R., Smallwood, G. J., Lobo, P., and Gagné, S.: Characterization of particulate matter emitted by a marine engine operated with liquefied natural gas and diesel fuels, Atmos. Environ., 220, 117030, https://doi.org/10.1016/j.atmosenv.2019.117030, 2020.
Decarlo, P. F., Slowik, J. G., Worsnop, D. R., Davidovits, P., and Jimenez, J. L.: Particle Morphology and Density Characterization by Combined Mobility and Aerodynamic Diameter Measurements. Part 1: Theory, Aerosol Sci. Technol., 38, 1185–1205, https://doi.org/10.1080/027868290903907, 2004.
Delhay, J., Desgroux, P., Therssen, E., Bladh, H., Bengtsson, P. E., Hönen, H., Black, J. D., and Vallet, I.: Soot volume fraction measurements in aero-engine exhausts using extinction-calibrated backward laser-induced incandescence, Appl. Phys. B-Lasers O., 95, 825–838, https://doi.org/10.1007/s00340-009-3534-8, 2009.
Durdina, L., Lobo, P., Trueblood, M. B., Black, E. A., Achterberg, S., Hagen, D. E., Brem, B. T., and Wang, J.: Response of real-time black carbon mass instruments to mini-CAST soot, Aerosol Sci. Technol., 50, 906–918, https://doi.org/10.1080/02786826.2016.1204423, 2016.
Eckbreth, A. C.: Effects of laser-modulated particulate incandescence on Raman scattering diagnostics, J. Appl. Phys., 48, 4473–4479, https://doi.org/10.1063/1.323458, 1977.
Gysel, M., Laborde, M., Mensah, A. A., Corbin, J. C., Keller, A., Kim, J., Petzold, A., and Sierau, B.: Technical Note: The single particle soot photometer fails to reliably detect PALAS soot nanoparticles, Atmos. Meas. Tech., 5, 3099–3107, https://doi.org/10.5194/amt-5-3099-2012, 2012.
International Civil Aviation Organization (ICAO): International Standards and Recommended Practices – Annex 16 to the Convention on International Civil Aviation: Environmental Protection, Volume II – Aircraft Engine Emissions, 4th edn., Montreal, QC, Canada, ISBN 978-92-9258-314-9, 2017.
Kock, B., Tribalet, B., Schulz, C., and Roth, P.: Two-color time-resolved LII applied to soot particle sizing in the cylinder of a Diesel engine, Combust. Flame, 147, 79–92, https://doi.org/10.1016/j.combustflame.2006.07.009, 2006.
Laborde, M., Mertes, P., Zieger, P., Dommen, J., Baltensperger, U., and Gysel, M.: Sensitivity of the Single Particle Soot Photometer to different black carbon types, Atmos. Meas. Tech., 5, 1031–1043, https://doi.org/10.5194/amt-5-1031-2012, 2012.
Lehre, T., Jungfleisch, B., Suntz, R., and Bockhorn, H.: Size distributions of nanoscaled particles and gas temperatures from time-resolved laser-induced-incandescence measurements, Appl. Optics, 42, 2021, https://doi.org/10.1364/ao.42.002021, 2003.
Leider, H. R., Krikorian, O. H., and Young, D. A.: Thermodynamic properties of carbon up to the critical point, Carbon, 11, 555–563, https://doi.org/10.1016/0008-6223(73)90316-3, 1973.
Liu, F., He, X., Ma, X., Zhang, Q., Thomson, M. J., Guo, H., Smallwood, G. J., Shuai, S., and Wang, J.: An experimental and numerical study of the effects of dimethyl ether addition to fuel on polycyclic aromatic hydrocarbon and soot formation in laminar coflow ethylene/air diffusion flames, Combust. Flame, 158, 547–563, https://doi.org/10.1016/j.combustflame.2010.10.005, 2011.
Liu, F., Rogak, S., Snelling, D. R., Saffaripour, M., Thomson, K. A., and Smallwood, G. J.: Effects of laser fluence non-uniformity on ambient-temperature soot measurements using the auto-compensating laser-induced incandescence technique, Appl. Phys. B, 122, 286, https://doi.org/10.1007/s00340-016-6553-2, 2016.
Lobo, P., Durdina, L., Smallwood, G. J., Rindlisbacher, T., Siegerist, F., Black, E. A., Yu, Z., Mensah, A. A., Hagen, D. E., Miake-Lye, R. C., Thomson, K. A., Brem, B. T., Corbin, J. C., Abegglen, M., Sierau, B., Whitefield, P. D., and Wang, J.: Measurement of Aircraft Engine Non-Volatile PM Emissions: Results of the Aviation-Particle Regulatory Instrumentation Demonstration Experiment (A-PRIDE) 4 Campaign, Aerosol Sci. Technol., 49, 472–484, https://doi.org/10.1080/02786826.2015.1047012, 2015a.
Lobo, P., Hagen, D. E., Whitefield, P. D., and Raper, D.: PM emissions measurements of in-service commercial aircraft engines during the Delta-Atlanta Hartsfield study, Atmos. Environ., 104, 237–245, https://doi.org/10.1016/j.atmosenv.2015.01.020, 2015b.
Lobo, P., Condevaux, J., Yu, Z., Kuhlmann, J., Hagen, D. E., Miake-Lye, R. C., Whitefield, P. D., and Raper, D: Demonstration of a regulatory method for aircraft engine nonvolatile PM emissions measurements with conventional and isoparaffinic kerosene fuels, Energ. Fuel., 30, 7770–7777, https://doi.org/10.1021/acs.energyfuels.6b01581, 2016.
Lobo, P., Durdina, L., Brem, B. T., Crayford, A. P., Johnson, M. P., Smallwood, G. J., Siegerist, F., Williams, P. I., Black, E. A., Llamedo, A., Thomson, K. A., Trueblood, M. B., Yu, Z., Hagen, D. E., Whitefield, P. D., Miake-Lye, R. C., and Rindlisbacher, T.: Comparison of Standardized Sampling and Measurement Reference Systems for Aircraft Engine Non-volatile Particulate Matter Emissions, J. Aerosol Sci., 145, 105557, https://doi.org/10.1016/j.jaerosci.2020.105557, 2020.
Makida, M., Yamada, H., Kurosawa, Y., Yamamoto, T., Matsuura, K., and Hayashi, S.: Preliminary Experimental Research to Develop A Combustor for Small Class Aircraft Engine Utilizing Primary Rich Combustion Approach, ASME Turbo Expo 2006: Power for Land, Sea and Air, Barcelona, Spain, 8–11 May 2006, 835–842, https://doi.org/10.1115/GT2006-91156, 2006.
Melton, L. A.: Soot diagnostics based on laser heating, Appl. Optics, 23, 2201, https://doi.org/10.1364/AO.23.002201, 1984.
Mewes, B. and Seitzman, J. M.: Soot volume fraction and particle size measurements with laser-induced incandescence, Appl. Optics, 36, 709, https://doi.org/10.1364/ao.36.000709, 1997.
Michelsen, H. A., Witze, P. O., Kayes, D., and Hochgreb, S.: Time-resolved laser-induced incandescence of soot: the influence of experimental factors and microphysical mechanisms, Appl. Optics, 42, 5577, https://doi.org/10.1364/ao.42.005577, 2003.
Michelsen, H. A., Liu, F., Kock, B. F., Bladh, H., Boiarciuc, A., Charwath, M., Dreier, T., Hadef, R., Hofmann, M., Reimann, J., Will, S., Bengtsson, P. E., Bockhorn, H., Foucher, F., Geigle, K. P., Mounaïm-Rousselle, C., Schulz, C., Stirn, R., Tribalet, B., and Suntz, R.: Modeling laser-induced incandescence of soot: A summary and comparison of LII models, Appl. Phys. B-Lasers O., 87, 503–521, https://doi.org/10.1007/s00340-007-2619-5, 2007.
Michelsen, H. A., Schulz, C., Smallwood, G. J., and Will, S.: Laser-induced incandescence: Particulate diagnostics for combustion, atmospheric, and industrial applications, Prog. Energ. Combust., 51, 2–48, https://doi.org/10.1016/j.pecs.2015.07.001, 2015.
Migliorini, F., Thomson, K. A., and Smallwood, G. J.: Investigation of optical properties of aging soot, Appl. Phys. B-Lasers O., 104, 273–283, https://doi.org/10.1007/s00340-011-4396-4, 2011.
National Institute of Occupational Safety and Health (NIOSH): Elemental Carbon (Diesel Particulate) Method 5040, issue 3, in: NIOSH Manual of Analytical Methods, 4th edn., Cincinnati, OH, available at: https://www.cdc.gov/niosh/docs/2003-154/pdfs/5040.pdf (last access: 10 December 2020), 2003.
Olfert, J. S., Dickau, M., Momenimovahed, A., Saffaripour, M., Thomson, K., Smallwood, G., Stettler, M. E. J., Boies, A., Sevcenco, Y., Crayford, A., and Johnson M.: Effective density and volatility of particles sampled from a helicopter gas turbine engine, Aerosol Sci. Tech., 51, 704–714, https://doi.org/10.1080/02786826.2017.1292346, 2017.
Petzold, A., Marsh, R., Johnson, M., Miller, M., Sevcenco, Y., Delhaye, D., Ibrahim, A., Williams, P., Bauer, H., Crayford, A., Bachalo, W. D., and Raper, D.: Evaluation of methods for measuring particulate matter emissions from gas turbines, Environ. Sci. Technol., 45, 3562–3568, https://doi.org/10.1021/es103969v, 2011.
Quay, B., Lee, T. W., Ni, T., and Santoro, R. J.: Spatially resolved measurements of soot volume fraction using laser-induced incandescence, Combust. Flame, 97, 384–392, https://doi.org/10.1016/0010-2180(94)90029-9, 1994.
Roth, P. and Filippov, A. V.: In situ ultrafine particle sizing by a combination of pulsed laser heatup and particle thermal emission, J. Aerosol Sci., 27, 95–104, https://doi.org/10.1016/0021-8502(95)00531-5, 1996.
Saffaripour, M., Tay, L.-L., Thomson, K. A., Smallwood, G. J., Brem, B. T., Durdina, L., and Johnson, M.: Raman spectroscopy and TEM characterization of solid particulate matter emitted from soot generators and aircraft turbine engines, Aerosol Sci. Technol., 51, 518–531, https://doi.org/10.1080/02786826.2016.1274368, 2017.
Saffaripour, M., Thomson, K. A., Smallwood, G. J., and Lobo P.: A review on the morphological properties of non-volatile particulate matter emissions from aircraft turbine engines, J. Aerosol Sci., 139, 105467, https://doi.org/10.1016/j.jaerosci.2019.105467, 2020
Schäfer, K., Heland, J., Lister, D. H., Wilson, C. W., Howes, R. J., Falk, R. S., Lindermeir, E., Birk, M., Wagner, G., Haschberger, P., Bernard, M., Legras, O., Wiesen, P., Kurtenbach, R., Brockmann, K. J., Kriesche, V., Hilton, M., Bishop, G., Clarke, R., Workman, J., Caola, M., Geatches, R., Burrows, R., Black, J. D., Hervé, P., and Vally, J.: Nonintrusive optical measurements of aircraft engine exhaust emissions and comparison with standard intrusive techniques, Appl. Optics, 39, 441, https://doi.org/10.1364/ao.39.000441, 2000.
Schittkowski, T., Mewes, B., and Brüggemann, D.: Laser-induced incandescence and Raman measurements in sooting methane and ethylene flames, Phys. Chem. Chem. Phys., 4, 2063–2071, https://doi.org/10.1039/b111335f, 2002.
Schulz, C., Kock, B. F., Hofmann, M., Michelsen, H., Will, S., Bougie, B., Suntz, R., and Smallwood, G.: Laser-induced incandescence: recent trends and current questions, Appl. Phys. B-Lasers O., 83, 333–354, https://doi.org/10.1007/s00340-006-2260-8, 2006.
Sipkens, T. A. and Daun, K. J.: Defining regimes and analytical expressions for fluence curves in pulsed laser heating of aerosolized nanoparticles, Opt. Express, 25, 5684–5696, https://doi.org/10.1364/OE.25.005684, 2017.
Smallwood, G. J.: A Critique of Laser-Induced Incandescence for the Measurement of Soot, PhD Thesis, Cranfield University, available at: https://dspace.lib.cranfield.ac.uk/handle/1826/5407 (last access: 10 December 2020), 2008.
Smallwood, G. J., Snelling, D. R., Liu, F., and Gülder, Ö. L.: Clouds over shoot evaporation: Errors in modeling laser-induced incandescence of soot, J. Heat Transf., 123, 814–818, https://doi.org/10.1115/1.1370507, 2001.
Smallwood, G. J., Thomson, K., Snelling, D., and Greenhalgh, D.: Mass Concentration of Nonvolatile Nanoparticle Emissions: Comparison of Autocompensating Laser-Induced Incandescence (AC-LII) to Other Techniques, in: Proceedings International Energy Agency 32nd Task Leaders Meeting on Energy Conservation and Emissions Reduction in Combustion, Nara, Japan, 25–29 July 2010, available at: https://publications-cnrc.canada.ca/fra/voir/objet/?id=cdc5bd11-1bd3-44c7-9e68-fed417767f5a (last access: 10 December 2020), 2010.
Snelling, D. R., Liu, F., Smallwood, G. J., and Gülder, Ö. L.: Determination of the soot absorption function and thermal accommodation coefficient using low-fluence LII in a laminar coflow ethylene diffusion flame, Combust. Flame, 136, 180–190, https://doi.org/10.1016/j.combustflame.2003.09.013, 2004.
Snelling, D. R., Smallwood, G. J., Liu, F., Gülder, Ö. L., and Bachalo, W. D.: A calibration-independent laser-induced incandescence technique for soot measurement by detecting absolute light intensity, Appl. Optics, 44, 6773–6785, https://doi.org/10.1364/AO.44.006773, 2005.
Society of Automotive Engineers (SAE): Procedure for the Continuous Sampling and Measurement of Non-Volatile Particle Emissions from Aircraft Turbine Engines, SAE Aerospace Information Report, 6241, https://doi.org/10.4271/AIR6241, 2013.
Society of Automotive Engineers (SAE): Procedure for the Continuous Sampling and Measurement of Non-Volatile Particulate Matter Emissions from Aircraft Turbine Engines, SAE Aerospace Recommended Practice, 6320, https://doi.org/10.4271/ARP6320, 2018.
Thomson, K. A., Snelling, D. R., Smallwood, G. J., and Liu, F.: Laser induced incandescence measurements of soot volume fraction and effective particle size in a laminar co-annular non-premixed methane/air flame at pressures between 0.5–4.0 MPa, Appl. Phys. B-Lasers O., 83, 469–475, https://doi.org/10.1007/s00340-006-2198-x, 2006.
Tian, B., Zhang, C., Gao, Y., and Hochgreb, S.: Planar 2-color time-resolved laser-induced incandescence measurements of soot in a diffusion flame, Aerosol Sci. Technol., 51, 1345–1353, https://doi.org/10.1080/02786826.2017.1366644, 2017.
United Nations Environment Programme World Health Organization: Healthy Transport in Developing Cities, Geneva, available at: https://www.who.int/heli/risks/urban/transportpolicybrief2010.pdf (last access: 24 October 2019), 2009.
Zhang, Y., Liu, F., Clavel, D., Smallwood, G. J., and Lou, C.: Measurement of soot volume fraction and primary particle diameter in oxygen enriched ethylene diffusion flames using the laser-induced incandescence technique, Energy, 177, 421–432, https://doi.org/10.1016/j.energy.2019.04.062, 2019.
The region near the peak of the Loess best fit within the 2 % error band is defined and referred to as a plateau regime (relatively uniform response to the fluence level) in the following sections. The optimum fluence discussed later is in the plateau regime.
The temperature is determined by two-colour pyrometry and therefore influenced by the nvPM optical properties, i.e. the relative value of E(m) between the two detection wavelengths. In this study, it is assumed that the value of the absorption function, E(m), is the same at both wavelengths (Snelling et al., 2005). The different particle properties at HPO and idle may invalidate this assumption, but the potential effect would only account for <100 K (Snelling et al., 2004) of the observed difference in the peak temperatures.