the Creative Commons Attribution 4.0 License.
the Creative Commons Attribution 4.0 License.
 | 22 Apr 2022
Improved calibration procedures for the EM27/SUN spectrometers of the COllaborative Carbon Column Observing Network (COCCON)
Frank Hase
Matthias Frey
Darko Dubravica
Thomas Blumenstock
Angelika Dehn
Paolo Castracane
Gregor Surawicz
Roland Harig
Bianca C. Baier
Caroline Bès
Jianrong Bi
Hartmut Boesch
André Butz
Zhaonan Cai
Sean M. Crowell
Nicholas M. Deutscher
Dragos Ene
Jonathan E. Franklin
Omaira García
David Griffith
Bruno Grouiez
Michel Grutter
Abdelhamid Hamdouni
Sander Houweling
Neil Humpage
Nicole Jacobs
Sujong Jeong
Lilian Joly
Nicholas B. Jones
Denis Jouglet
Rigel Kivi
Ralph Kleinschek
Morgan Lopez
Diogo J. Medeiros
Isamu Morino
Nasrin Mostafavipak
Astrid Müller
Hirofumi Ohyama
Paul I. Palmer
Mahesh Pathakoti
David F. Pollard
Uwe Raffalski
Michel Ramonet
Robbie Ramsay
Mahesh Kumar Sha
Kei Shiomi
William Simpson
Wolfgang Stremme
Youwen Sun
Hiroshi Tanimoto
Gizaw Mengistu Tsidu
Voltaire A. Velazco
Felix Vogel
Masataka Watanabe
Chong Wei
Debra Wunch
Marcia Yamasoe
Lu Zhang
Johannes Orphal
In this study, an extension on the previously reported status of the COllaborative Carbon Column Observing Network's (COCCON) calibration procedures incorporating refined methods is presented. COCCON is a global network of portable Bruker EM27/SUN FTIR spectrometers for deriving column-averaged atmospheric abundances of greenhouse gases. The original laboratory open-path lamp measurements for deriving the instrumental line shape (ILS) of the spectrometer from water vapour lines have been refined and extended to the secondary detector channel incorporated in the EM27/SUN spectrometer for detection of carbon monoxide (CO). The refinements encompass improved spectroscopic line lists for the relevant water lines and a revision of the laboratory pressure measurements used for the analysis of the spectra. The new results are found to be in good agreement with those reported by Frey et al. (2019) and discussed in detail. In addition, a new calibration cell for ILS measurements was designed, constructed and put into service. Spectrometers calibrated since January 2020 were tested using both methods for ILS characterization, open-path (OP) and cell measurements. We demonstrate that both methods can detect the small variations in ILS characteristics between different spectrometers, but the results of the cell method indicate a systematic bias of the OP method. Finally, a revision and extension of the COCCON network instrument-to-instrument calibration factors for XCO2, XCO and XCH4 is presented, incorporating 47 new spectrometers (of 83 in total by now). This calibration is based on the reference EM27/SUN spectrometer operated by the Karlsruhe Institute of Technology (KIT) and spectra collected by the collocated TCCON station Karlsruhe. Variations in the instrumental characteristics of the reference EM27/SUN from 2014 to 2017 were detected, probably arising from realignment and the dual-channel upgrade performed in early 2018. These variations are considered in the evaluation of the instrument-specific calibration factors in order to keep all tabulated calibration results consistent.
- Article
(9438 KB) - Full-text XML
-
Supplement
(123 KB) - BibTeX
- EndNote


The activities of modern humans have detectable negative impacts on the atmosphere, including the release of various trace substances into it, mainly due to industrialization, to the globalization of the economy and related transport, and to increasing power generation and land use. Among them, greenhouse gases (GHGs) directly affect the Earth's radiative balance because they reduce the thermal infrared emission to space. Due to their long lifetime, those gases affect the climate for decades or centuries. The reduction of GHG emissions is thus recognized as an important and urgent political and societal task. Although there are several species categorized as GHGs, the gases mainly responsible for the increasing global warming are carbon dioxide (CO2) and methane (CH4). The anthropogenic emissions of CO2 from fossil fuel combustion are the main driver of global warming, which will reach and most likely exceed 1.5 ∘C within the next coming 2 decades (IPCC, 2021). Methods for monitoring and quantifying those gases – thereby pinning down their sources and sinks as well as their links with various human activities – are essential for appropriate decision-making to mitigate climate change. In general, atmospheric concentrations of GHGs are categorized into in situ and remote sensing techniques; the first of these techniques offers very high accuracy but faces problems due to its high sensitivity to emitting sources in the vicinity and to details of the vertical transport. Ground-based remote sensing techniques using solar absorption spectroscopy deliver column-averaged atmospheric GHG abundances but suffer from lower precision and accuracy and lower sensitivity for local sources. These observations are, however, well suited for the validation of satellite missions and observations of larger source regions. Currently, several dedicated GHG satellite missions are in orbit: the Greenhouse Gases Observing Satellite (GOSAT) and GOSAT-2 (Kuze et al., 2009; Morino et al., 2011; Yoshida et al., 2013; Suto et al., 2021), the Orbiting Carbon Observatory-2 (OCO-2) and OCO-3 (Frankenberg et al., 2015; Crisp et al., 2017; Eldering et al., 2017, 2019), the Copernicus Sentinel-5 Precursor (S5P) (Veefkind et al., 2012), and the Chinese Carbon Dioxide Observation Satellite (TanSat) (Liu et al., 2018). The ground-based Total Carbon Column Observing Network (TCCON) (Wunch et al., 2011) is the most important source for reference validation data and has been recently supplemented by the portable EM27/SUN spectrometers managed by the COllaborative Carbon Column Observing Network (COCCON, Frey et al., 2019). Both networks use solar-viewing Fourier transform infrared (FTIR) spectrometers. There, column-averaged atmospheric abundances of GHGs are derived from the observed near-infrared spectra.
The TCCON was established in 2004 to obtain accurate measurements of column-averaged dry-air mole fractions of CO2, CO, CH4 and N2O (denoted as Xgas, e.g. XCO2). The TCCON stations operate high-resolution Fourier transform IFS125HR spectrometers (FTS) manufactured by Bruker. Nowadays the network has 29 operational sites worldwide (Wunch et al., 2011). Although these TCCON stations are distributed around the globe, there are still considerable geographic gaps lacking measurements. The COCCON network emerged in 2016, based on the low-resolution (0.5 cm−1) EM27/SUN FTIR spectrometer developed by KIT in cooperation with Bruker (Gisi et al., 2012; Hase et al., 2016), which delivers similar precision and accuracy as TCCON, assuming a careful calibration of each spectrometer. Several studies have revealed its previously unprecedented high level of performance and stability (Frey et al., 2015, 2019; Sha et al., 2020). In addition, the portability of the EM27/SUN spectrometer favours campaign use, and a series of such campaigns have already successfully been conducted by various investigators (Hase et al., 2015; Hedelius et al., 2016; Butz et al., 2017; Viatte et al., 2017; Chen et al., 2016, 2020; Kille et al., 2019; Vogel et al., 2019; Luther et al., 2019; Makarova et al., 2021; Dietrich et al., 2021; Jones et al., 2021).
As the number of EM27/SUN spectrometers being deployed across the world continues to grow, it is essential in order to maintain and further improve the reliability of the network to keep up with proper quality assurance/quality control (QC/QA) work and to apply the best available procedures for instrumental characterization on new units before they go into operation. In this regard one of the most important parameters that needs to be specified for a defined FTIR spectrometer prior to the analysis of its atmospheric measurements is the instrumental line shape (ILS). Several studies have shown that the real ILS deviates from the ideal one (e.g. Hase, 2012; Hase et al., 1999; Bernardo and Griffith, 2005), e.g. due to interferometric misalignment, optical aberrations, or uneven illumination or sensitivity of the detector element. An out-of-range ILS result points to instrumental issues which need to be alleviated by realignment or replacement of optical or mechanical components. A good knowledge of the near-nominal ILS is imperative for a precise GHG retrieval. Portable spectrometers need to demonstrate their ability to preserve their ILS characteristics during transport events and over sufficiently long periods of time. Stable instrumental characteristics have been demonstrated despite harsh transport and conditions of operation for periods of up to several years (Frey et al., 2015).
The impacts of various error sources on retrieved gas columns and Xgas results have been discussed in detail by Tu (2019). The error propagation of the ILS uncertainty into retrieved gas columns and Xgas results is dominated by the modulation efficiency amplitude (MEA) parameter, which describes the deviation of the ILS width from the nominal value. We show the resulting error propagation for an assumed ±0.5 % error in MEA on the columns and Xgas results in Fig. 1 (similar to Fig. 3.7 presented by Tu, 2019, but covering a somewhat wider SZA range).
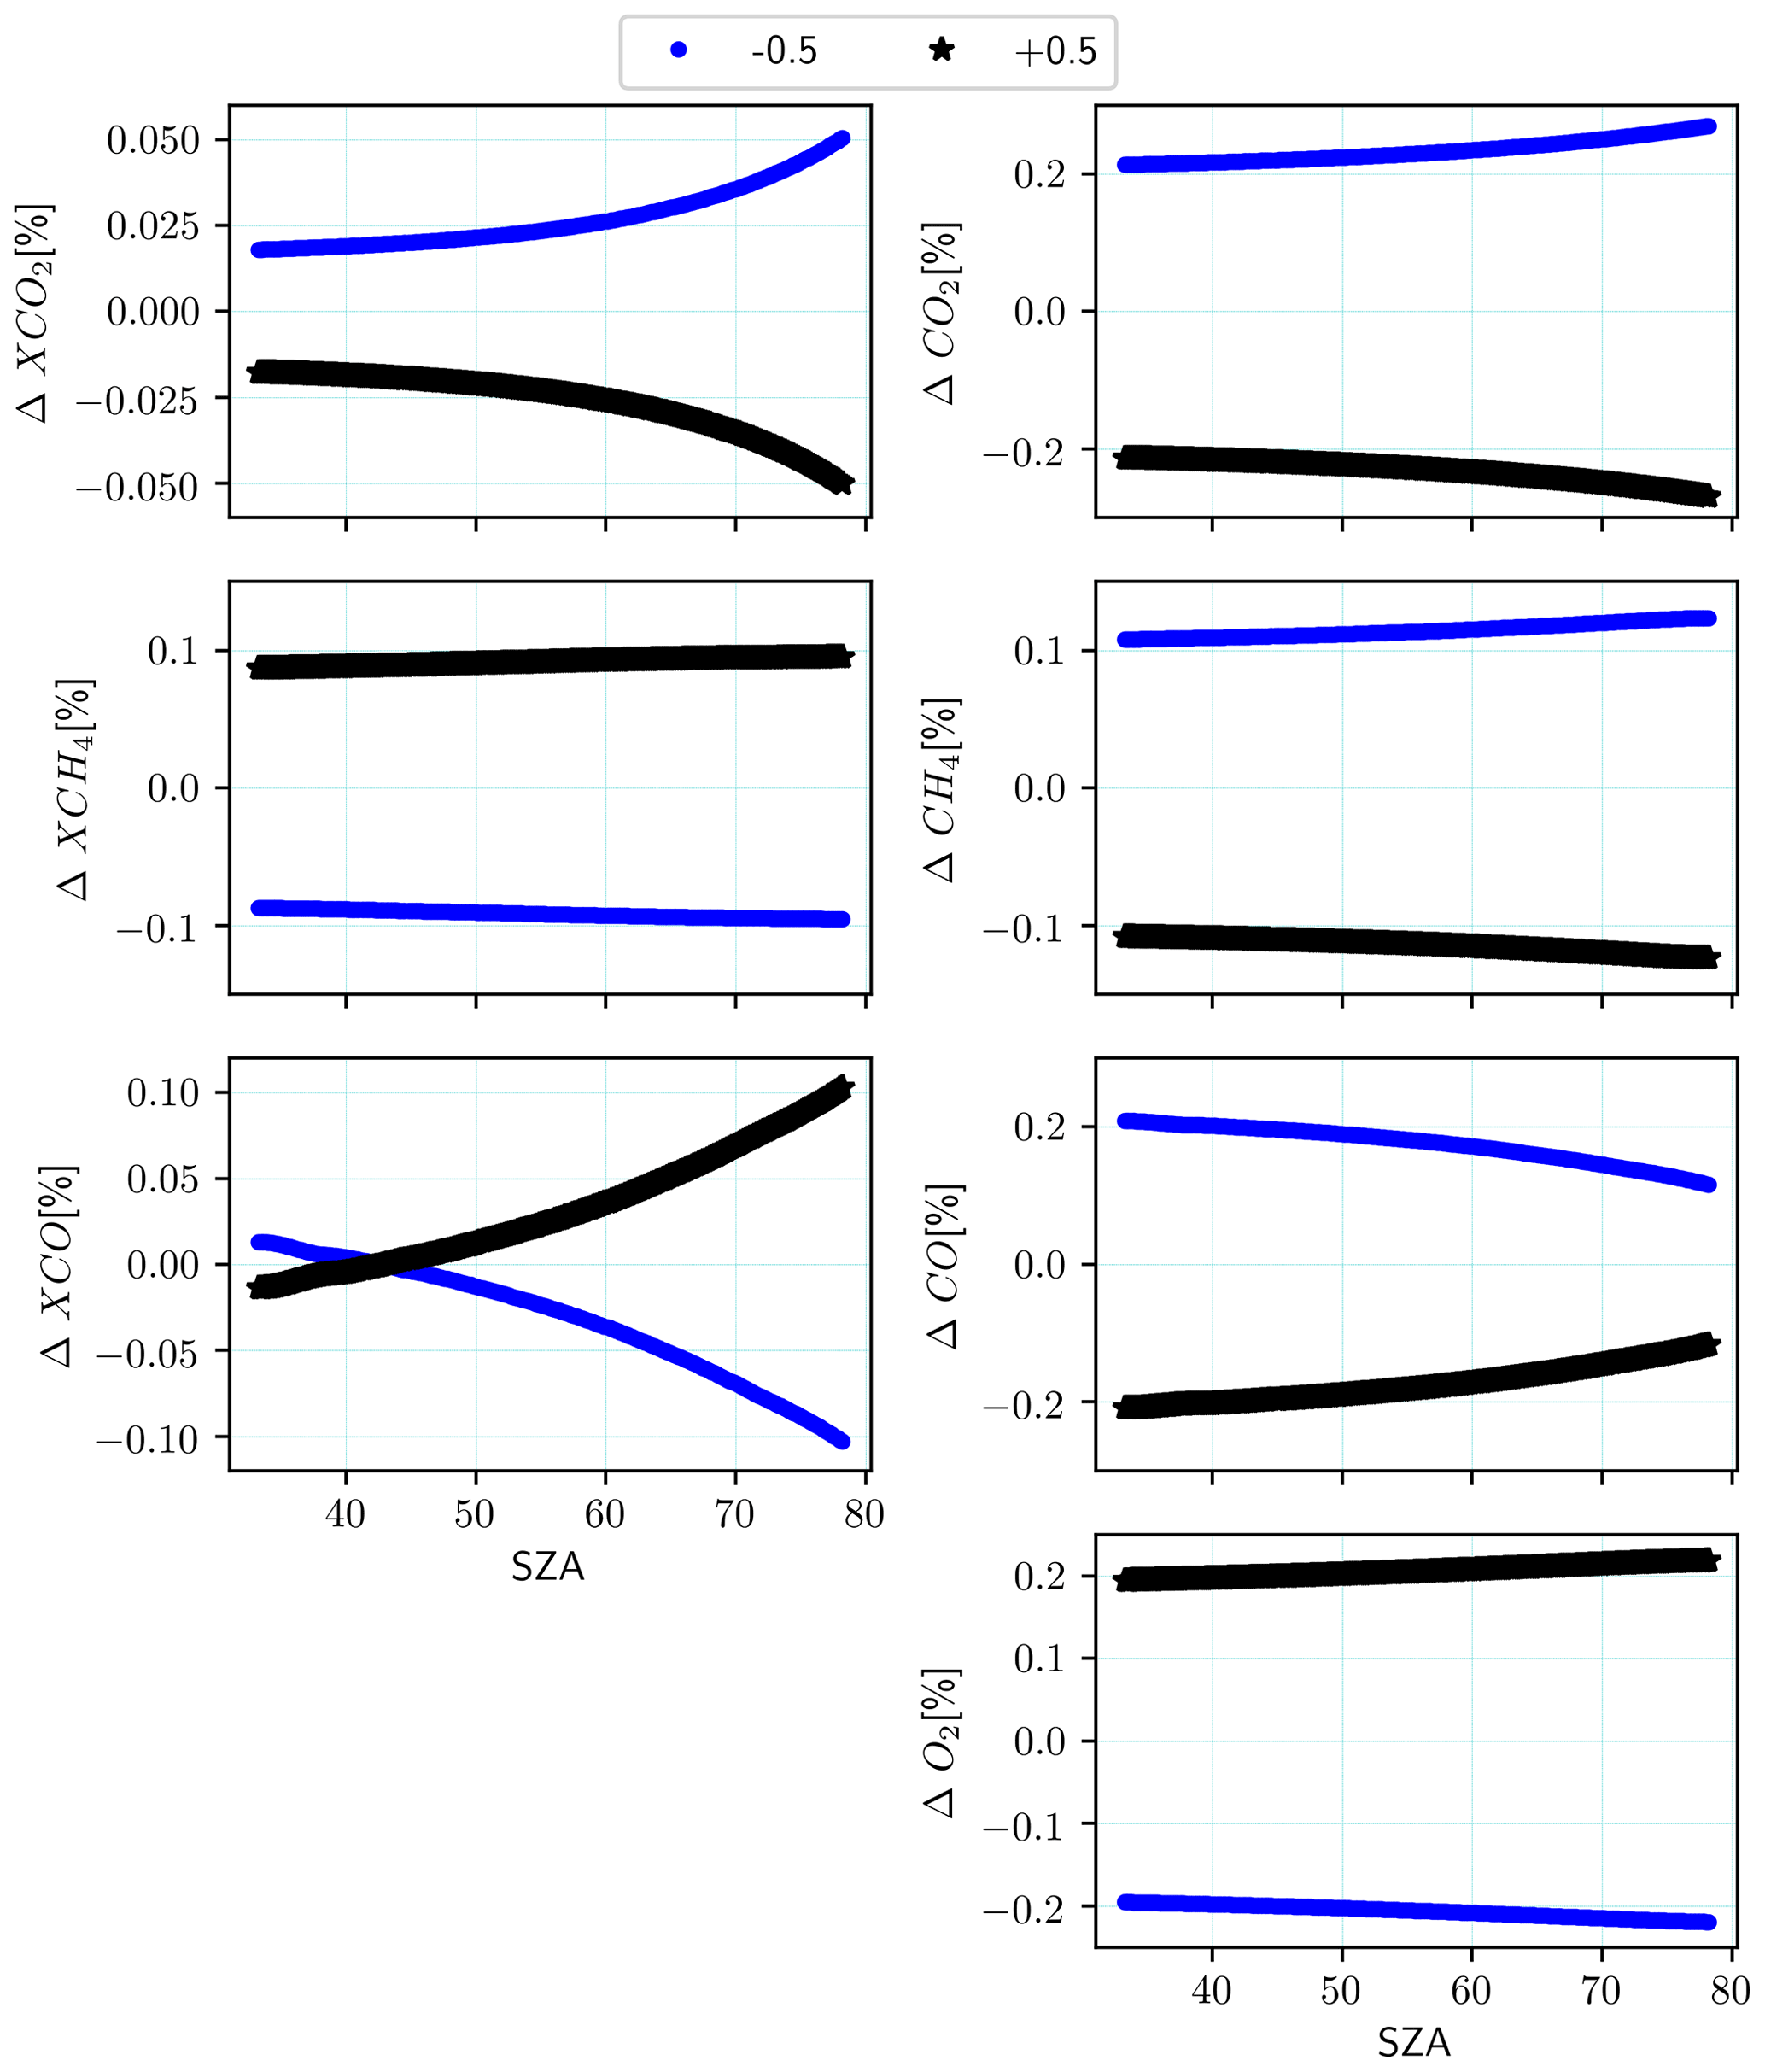
Figure 1Variation in the relative difference for dry-air gas and total column gas amounts as a function of solar zenith angle (SZA), for changes in the original ILS of ±0.5 % of the original ILS parameters for COCCON's reference unit SN37 on 31 May 2021 at Karlsruhe, Germany, for carbon dioxide, methane and carbon monoxide, respectively, and the total column amount for oxygen.
As can be seen from the Fig. 1, a 0.5 % MEA increase introduces an XCO2 decrease on the order of 0.025 %, while for XCH4 the opposite behaviour is observed. XCH4 shows an increase of ∼0.1 % with a very low SZA dependency. In the case of XCO, the resulting disturbance shows a zero crossing near 40∘ SZA and reaches a maximum value of ∼0.1 % change at the highest SZA.
In this paper, the open-path (OP) method for ILS calculation of EM27/SUN spectrometers as described by Frey et al. (2015) is significantly improved and applied to further spectrometers. Additionally, a new calibration cell filled with C2H2 was designed, built and used in addition to the open-path method since January 2020. The OP improvements are described in Sect. 2.2; the cell method is described in Sect. 3. This provides additional redundancy of the ILS characterization and allows the comparison of both approaches, OP and cell measurement. The results achieved with the OP and cell methods are described and compared in Sects. 4 and 5, respectively. We confirm that both methods have the ability to detect residual instrument-specific deviations from the nominal ILS. The cell method suggests that there is a bias in the open-path results, probably generated by incorrect pressure broadening parameters of the relevant H2O lines. Section 6 is devoted to the discussion of the solar side-by-side measurements. In Sect. 6.1, we present the continued long-term trace gas measurements of the reference EM27/SUN spectrometer used as a fixed point for the instrument-specific gas calibration factors of the other EM27/SUN units. This time series now spans 7 years. We compare these atmospheric measurements with the trace gas amounts derived from low-resolution spectra collected with the co-located 125HR spectrometer of the Karlsruhe TCCON station. Variations in the reference unit's instrumental characteristics connected to realignment and the dual-channel upgrade performed in early 2018 have been identified. In Sect. 6.2 we show the results from the re-evaluation of the open-path measurements and list the instrument-specific calibration factors for each spectrometer, considering the detected variations in the reference unit. The resulting survey of instrumental characteristics is a considerable extension of the work by Frey et al. (2019), as it contains results for 47 new spectrometers. In Sect. 6.3, the spectral signal-to-noise ratio characteristics for all investigated spectrometers are summarized. Finally, in Sect. 6.4, the effect of the refined calibration procedure on the consistency of the XCO2 calibration is investigated.
The method described in Frey et al. (2015), of characterizing the ILS of low-resolution spectrometers using open-path measurements, is improved and extended; the method is briefly summarized here along with a description of the main improvements. The idea of the approach is to use the absorption of infrared radiation from an external tungsten lamp by strong water vapour lines along a laboratory path of a few metres. A fit to the spectrum is performed by adjusting the H2O column, a spectral scaling factor, a spectrally variable background transmission level and a parameterized ILS. Two parameters are used for describing deviations from the nominal ILS shape: the “modulation efficiency amplitude” (MEA) describes a deviation from the expected ILS width, and the “phase error” (PE) quantifies the asymmetry of the ILS (Hase et al., 1999). Because the widths of the spectral lines generated along the open path depend on pressure and temperature, these parameters need to be recorded for the analysis of the measurements. The self-broadening of H2O is a non-negligible contribution; therefore, the absorption path length needs to be known. The H2O partial pressure is calculated from the retrieved H2O column amount, pressure and temperature, so the analysis of the spectrum is an iterative procedure (repeated until convergence to a self-consistent solution is reached).
2.1 Procedure and set-up
The general set-up is described by Gisi et al. (2012) and Frey et al. (2015) and illustrated in Fig. 2. At least 2 h before the first interferograms are collected, the spectrometer is powered up. Two openings in the spectrometer's shelter are uncovered for allowing exchange between the air trapped inside the spectrometer and the external laboratory air. This equilibrates the water vapour mixing ratio inside the spectrometer with the environment and allows the spectrometer to reach a stable operating temperature, thereby minimizing spectral drifts of the He–Ne laser which controls the interferogram sampling. For the radiation source, a commercial halogen lamp attached to a lens collimator is used. The lamp bulb is grounded on the outside and is tilted with respect to the optical axis to minimize channelling artefacts (Blumenstock et al., 2021). The spectrometer resides on a table, while the lamp is mounted on a tripod at about 4.20 m (4.0 m for instruments calibrated before January 2020) from the first mirror of the solar tracker attached to the spectrometer. The position of the lamp is level with the tracker, and the beam is steered towards the first tracker mirror.
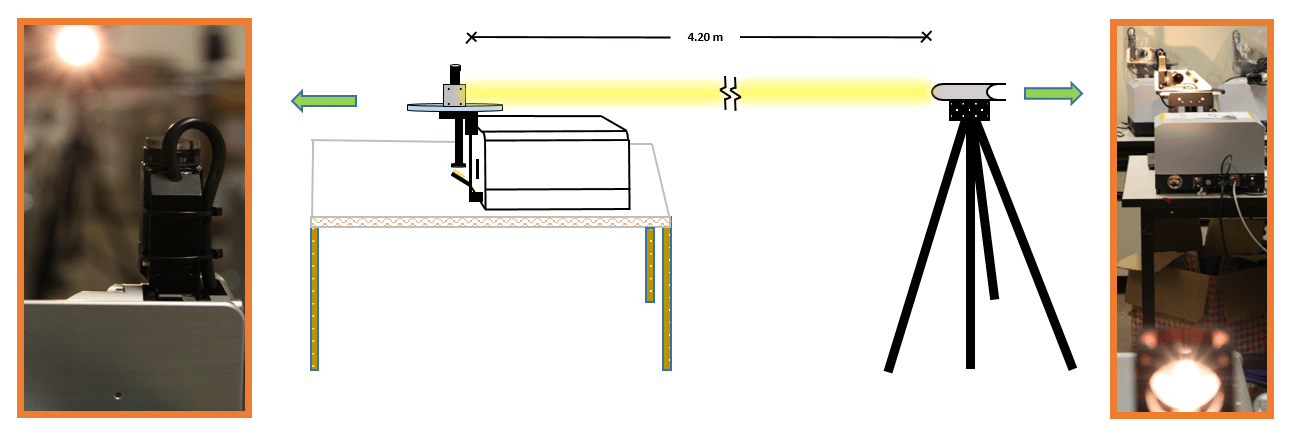
Figure 2Set-up of the open-path measurements. The central part of the illustration schematically shows all the components and the alignment of the experimental set-up, while in left and right sides photographic close-up views are presented. The left photograph shows the view in the opposite direction from the spectrometer towards the lamp unit, while the right photograph shows a view from the lamp unit (bottom) towards the spectrometer with its solar tracker (top): the lamp in the bottom part and the instrument located at a distance of 4.20 m.
2.2 Updated measurement procedures
The main changes with respect to the old method are described in the following sub-sections.
2.2.1 Geometry of the set-up
In addition to the open-path procedure (January 2020), a cell set-up has now been implemented for the calibration of the EM27/SUN spectrometers; the geometrical arrangement previously used was slightly reconfigured to support both OP and cell measurements. The spectrometer is now oriented in such a way that the cell can be conveniently located in the infrared beam on top of the spectrometer housing (see Figs. 2 and 5a and b). This modification results in a slightly larger distance between the lamp and the first tracking mirror; in the past that distance was 4.0 m, and it is now 4.2 m.
2.2.2 Distance travelled by the beam inside the instrument
We decided to re-check and thereby noticed that the previously assumed optical path length inside the spectrometer was underestimated. In order to derive this distance properly, an optical method was applied. The set-up of the method is illustrated in Fig. 3 and described as follows: it uses a digital camera J, a finely structured optical target printed on a piece of paper E' and pocket lamp E” for illumination of the target. The aim is to optically measure the inaccessible path section from the instrument entrance window E' until position E, as shown in that figure.
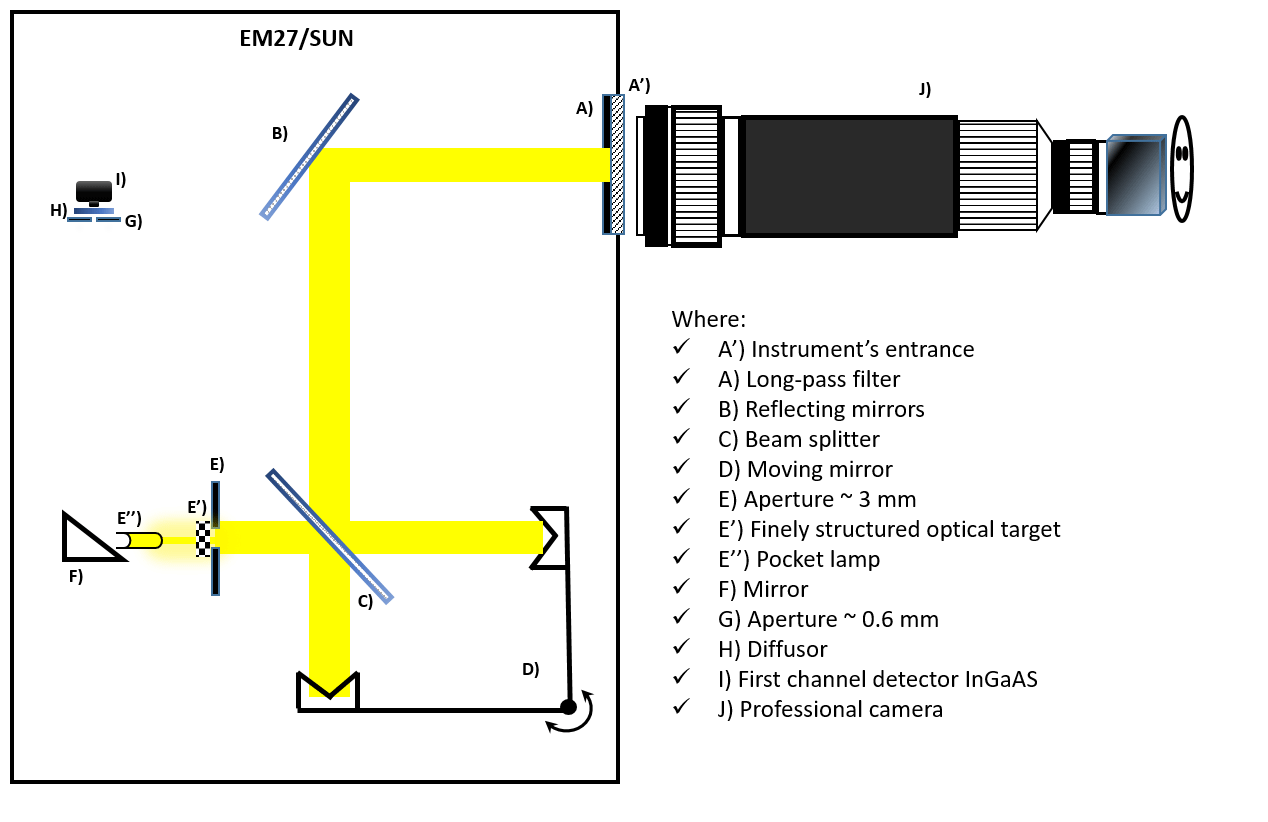
Figure 3Light path of the beam inside the instrument coming from the lamp in E” to the camera at the instrument's entrance A'.
For performing the distance measurement, the solar tracker was unmounted to gain access to the entrance window. The paper target was located at position E and illuminated with the pocket lamp. The digital camera equipped with a telescopic lens was positioned directly in front of the entrance window for observing the target. The target is focused properly, and the focus position of the lens is maintained while the spectrometer is removed. Next, the target is arranged at such a distance from the lens that a sharp image is re-created. This distance can easily be measured geometrically, and we estimate the accuracy of the method to be better than 5 cm. In order to determine the complete optical path inside the instrument, the distances E to F and F to I are measured with a conventional ruler and added to the distance calculated with the previously explained method.
Table 1Description of the main changes in the path distance used in the past and the current ones.

In Table 1, the old and new results for the relevant distances are presented. Note that the distance between lamp and first tracker mirror has been changed deliberately. The corrected other two contributions to the total path length, which are used for the proper calculation of the H2O partial pressure, have been considered in the reanalysis of the old lamp measurements. For the analysis of the lamp measurements after mid-January 2020, the updated values as provided in Table 1 have been used. The effect on the ILS parameters via the resulting change in H2O partial pressure is small, but detectable. We discuss this effect in Sect. 4.1.
2.2.3 Measurement procedure
Before the collection of measurements, the tracking mirrors (elevation and azimuth) are carefully adjusted in order to centre the lamp image on the field stop. The image of the lamp needs to surpass the field stop's diameter. This procedure is conveniently carried out using the camera, which is incorporated in the spectrometer for controlling the solar tracking.
2.3 Data acquisition and improved processing
Before the interferograms are recorded (either with or without the cell in the path), the pre-gain and gain settings of both detectors are checked. The manufacturer's data acquisition software OPUS is used to perform the measurements and to process the DC-coupled interferograms. Ten double-sided full-resolution scans recorded with 10 kHz scan speed are co-added into one averaged interferogram, and 30 to 40 averaged interferograms of this kind are recorded in total to achieve a spectral signal-to-noise ratio in the range of 2000 to 3000; see Sect. 6.3. As the DC level of the EM27/SUN is slightly variable as a function of optical path difference, a DC correction is applied (because the solar observations also undergo a DC correction). The resulting spectra are normalized to about unity in the spectral range required for the ILS analysis and are stored with a zero-filling factor of 8 to support the visual inspection of the spectral fit quality.
2.3.1 Required auxiliary data
In order to correctly derive the H2O column and ILS parameters, pressure and temperature need to be measured, both inside the instrument and outside in the laboratory. The temperature inside the spectrometer is recorded using the sensor built into the spectrometer by the manufacturer. The temperature of the laboratory air is recorded using digital thermometers offering 0.8 ∘C accuracy (Lutron MHB-382SD data loggers or thermo hygrometer barometers of type PCE-THB 40 were used). While in the previous data analysis the pressure readings of the aforementioned portable sensors were used, we migrated for the analysis of new measurements as well as for the re-analysis of previous measurements to the pressure record from the nearby meteorological tall tower. This tower is operated by the Institute for Meteorology and Climate Research – Department Troposphere (IMK-TRO), see Kohler et al. (2018). The pressure sensor used at the tower is calibrated in regular intervals, and the data accuracy is expected to be within 0.5 hPa. The tower is located at a distance of about 800 m from our laboratory. We apply a barometric correction to the pressure data measured at the tower, as the elevation of the laboratory is higher than the location of the pressure sensor by approximately 11 m.
2.3.2 Data processing
For the retrieval of the ILS parameters, the LINEFIT software version 14.8 (Hase et al., 1999) is used. In order to retrieve the H2O column, a simple two-parameter ILS model is utilized as described in Frey et al. (2015). The main extension in the retrieval set-up is that the ILS is now characterized for both the primary and the CO channel. Two different spectral regions are therefore investigated as shown in Fig. 4. The previously used spectral window covers 7000–7400 cm−1, and the newly added window covers 5275–5400 cm−1. The latter window resides in the spectral overlap region covered by both detectors, allowing a check for a possibly degraded ILS of the CO channel with respect to the primary channel, because in this spectral window the retrieval of ILS parameters can be performed from both main channel and CO channel spectra. A dedicated check of the CO channel seems advisable, because the primary channel is used as the reference for the interferometric alignment, while the CO channel is only adjusted to match the alignment of the primary channel. By comparing the ILS parameters retrieved from the same spectral window, biases introduced by spectroscopic inconsistencies cancel out. Therefore, according to the new scheme presented here, three sets of ILS parameters are retrieved, and the two additional retrievals performed in the new window are introduced for recognizing a potential misalignment of the CO detector.

Figure 4Typical spectra for both channels, obtained with the COCCON reference instrument SN37 on 19 March 2021. The highlighted regions (a) and (b) are the spectral windows used for the ILS retrievals.
2.3.3 Empirical update of H2O spectroscopic data
For the previous ILS analysis, the H2O line list provided by HITRAN version 2008 (including the corrections introduced in 2009) with some minor empirical adjustments was used. The work presented here uses a considerably revised line list. The HITRAN 2016 H2O list served as a starting point for fitting empirical H2O line parameters in the two relevant spectral regions using a pair of high-resolution open-path spectra recorded with the Bruker IFS125HR spectrometer of the TCCON station Karlsruhe. The air conditioning system of the laboratory container housing the spectrometer was used to adjust the air temperature to 15 and 30 ∘C, respectively. We assume that this span largely covers the conditions of laboratory ILS measurements. The pair of spectra were then used for a multi-spectrum fit of empirical H2O line parameters using the LINEFIT software with a wrapper for adjusting the line parameters. Line intensities, line positions and broadening parameters were adjusted (the ratios of the self and foreign broadening parameters were maintained as reported in the HITRAN line list). The fit residuals of the high-resolution spectra after the empirical adjustment are shown in Appendix A (see Figs. A1 and A2); the H2O line list is provided in the Supplement of this work. In order to avoid a significant bias between the ILS parameters reported by Frey et al. (2019) and the results of the reanalysis presented here, a global scaling factor was determined and applied to the new pressure broadening parameters. As expected, the fit quality of EM27/SUN open-path spectra using the new empirical line list are significantly improved, as discussed in Sect. 4.1.
In addition to the refinements introduced in the open-path method, a new gas cell was developed and has been used in parallel with the open-path measurements. This chapter presents the details of the cell.
3.1 Cell components
This new method developed for measuring the ILS for EM27/SUN instruments uses a gas cell filled with C2H2. This gas is a good choice, because it is easily accessible and easy to handle, and because it offers a strong absorption band at 6550 cm−1, a spectral region largely free from H2O contamination. In the context of calibration work for TCCON, experience with C2H2 has already been collected (see Sect. 3.2). The cell has an effective length of 200 mm and an internal diameter of 30 mm. Wedged fused silica windows are glued to the slightly angled end surfaces of the cell body. The cell is closed with a Teflon valve stem, sealing against a Schott Duran valve body. A temperature sensor is attached to the cell in order to monitor this variable during the experiment. To fix the cell into the lamp beam at the level of the tracker beam, a simple support has been built as shown in Fig. 5c. A cardboard screen is used to limit the heating of the cell body by the lamp.
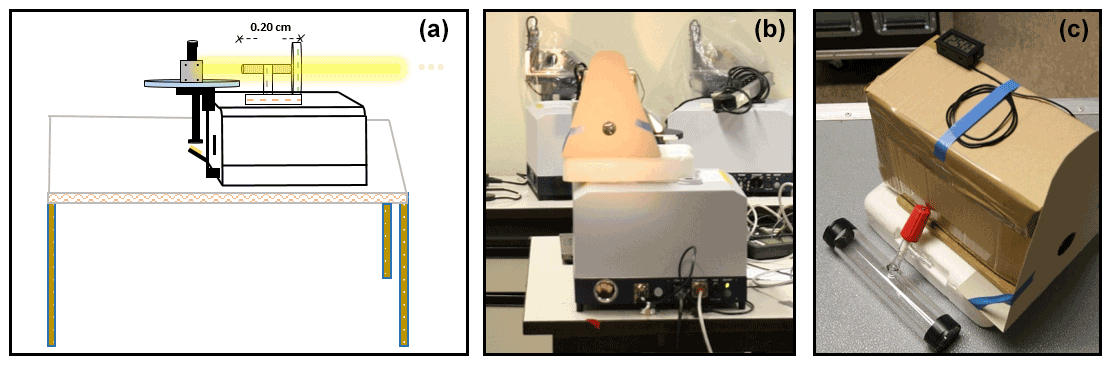
Figure 5The set-up of the cell measurements and the cell components used in this study are shown in (a), (b) and (c), respectively.
3.2 Cell content and calibration
A different cell, which is pressure-monitored and filled with 300 Pa of pure C2H2, is used at the TCCON station Karlsruhe for calibration work on the sealed HCl cell as used by the TCCON network; this cell and its application is described in Hase et al. (2013). Inspection of the fit residuals of high-resolution C2H2 spectra recorded with the IFS125HR spectrometer indicates that in particular the line positions of the HITRAN 2016 line list are slightly imperfect, so the line positions have been adjusted. This improved empirical C2H2 line list is also applied to the low-resolution work presented here. The empirical C2H2 line list is distributed with the LINEFIT code and also provided as a Supplement to this paper.
For low-resolution measurements, we require a higher filling pressure, as pressure broadening is needed to generate absorption lines of sufficient area. In the Doppler limit, even saturated lines generate a very weak signal in the convolved spectrum, because such lines are spectrally much narrower than the ILS of the EM27/SUN spectrometer. Using an available cell body of 200 mm length, a pressure on the order of 100 hPa was found to be a reasonable choice.
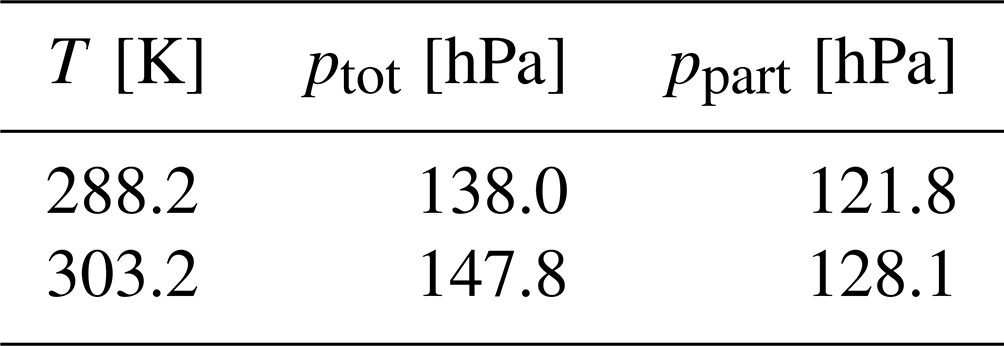
After filling of the cell, a pair of high-resolution reference cell spectra were recorded using the IFS125HR spectrometer at temperatures around 288 and 303 K. From these spectra, the amount of C2H2 contained in the cell was retrieved, which also sets the C2H2 partial pressure for a given cell temperature. Next, assuming an ideal ILS for the IFS125HR spectrometer, the relevant cell parameters were retrieved using LINEFIT. The results for C2H2 total and partial pressure are provided in Table 2. While the partial pressure results from the measured line area follow the ideal gas law, the retrieved total pressure which minimizes spectral residuals deviates from the ideal gas law. It should not be regarded as a physical parameter, and it is used to compensate for various imperfections (reported values of self and foreign pressure broadening parameters and their temperature dependence, possible air contamination in the cell, etc.). For adjusting these parameters to other working temperatures, we apply a linear interpolation in both tabulated parameters of the total and partial pressure.
Table 2Measured variables in the cell with respect to the IFS125HR spectrometer at Karlsruhe TCCON station.
3.3 Measurement set-up
When the cell is positioned in the open-path set-up, we maintain the 4 m distance between the lamp and spectrometer. This does not bring in complications, because the H2O lines superimposed to the observed C2H2 band are sufficiently weak. Therefore, we can easily go back and forth between the open-path and cell configuration. The C2H2 cell introduces a slight beam deviation because the window wedges do not fully compensate, but the camera incorporated in the EM27/SUN can be conveniently used for realigning the image of the lamp collimator on the spectrometer's entrance field stop. After the warm-up phase of the spectrometer discussed in Sect. 2.1, 10 to 16 interferograms are collected using a 10 kHz scan speed (each interferogram comprised of 10 co-added scans).
3.4 Error budget of the cell measurement for measuring ILS parameters of the EM27/SUN spectrometer
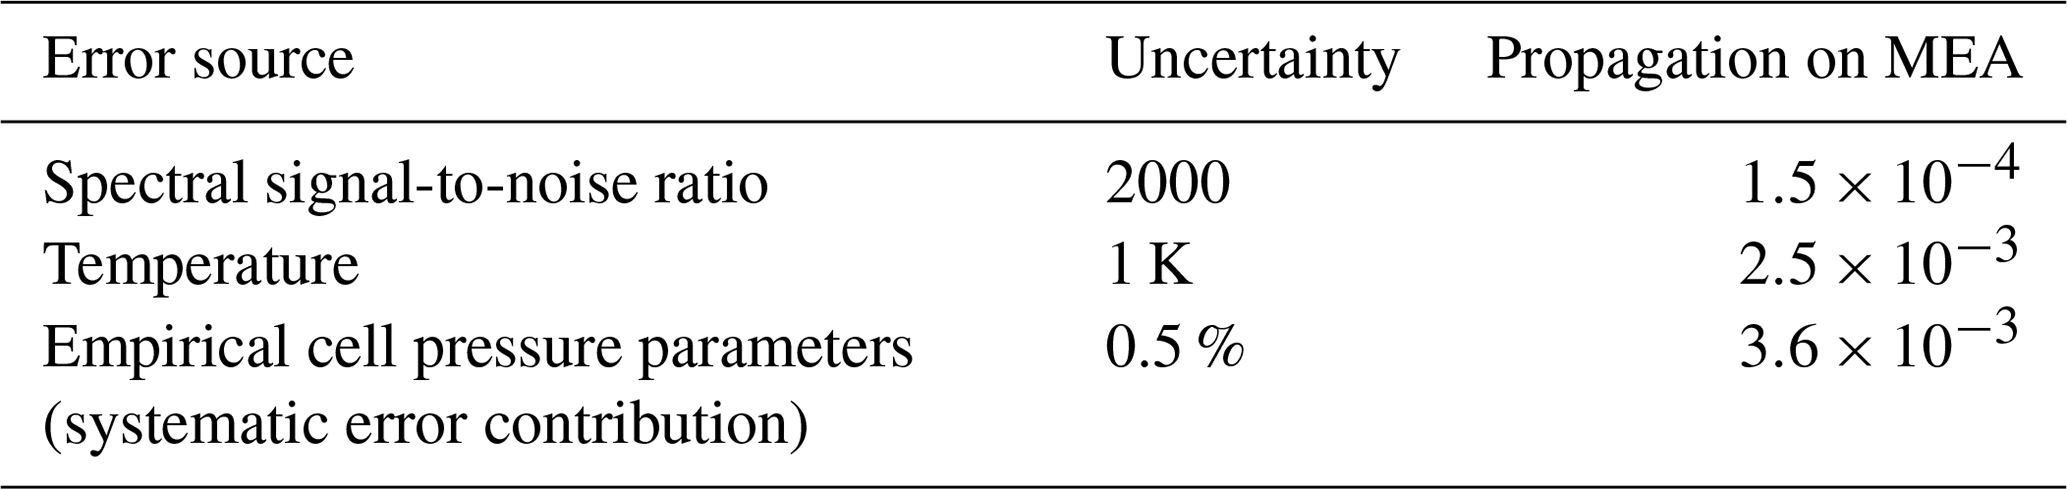
With the spectral noise level achieved by applying the measurement procedure outlined in Sect. 4.3, the propagation of spectral noise into the retrieved ILS parameters turns out to be a negligible contribution. The error budget of the ILS parameters is dominated by the knowledge of the gas cell temperature, which might vary while the measurement is performed and across the cell body. We assume that the knowledge of cell temperature during the measurement is on the order of 1 to 2 K. A change in the temperature by 1 K changes the retrieved modulation efficiency amplitude by about 0.25 %. The empirical cell pressure parameters described in Sect. 3.2 used for the analysis of cell spectra also suffer from experimental uncertainty. The IFS125HR spectrometer might deviate slightly from an ideal spectrometer, and the analysis of the spectra used for the calibration of the cell parameters suffers from imperfect measurement of cell temperature. In the subsequent application of the cell, we estimate an uncertainty of the cell pressure parameters on the order of 0.5 %, which produces a systematic error contribution of about 0.36 %. Table 3 summarizes the error budget of the cell measurement.
Table 3Estimated error budget of the MEA (modulation efficiency amplitude) ILS parameter for the C2H2 cell measurement procedure.
3.5 Data acquisition and pre-processing and final processing
The OPUS software provided by the manufacturer Bruker is used to collect the interferograms. The settings used for their acquisition are the same as for the open-path method. Once the interferograms are recorded, they are pre-processed using OPUS in the same way as explained in the open-path method; namely a DC correction is included. After generating a spectrum, the ILS is retrieved using LINEFIT 14.8. Figure 6 shows an open-path spectrum recorded with the C2H2 cell inserted in the beam. The C2H2 band located in the wavenumber range 6450–6630 cm−1 is utilized for the retrieval of ILS parameters.
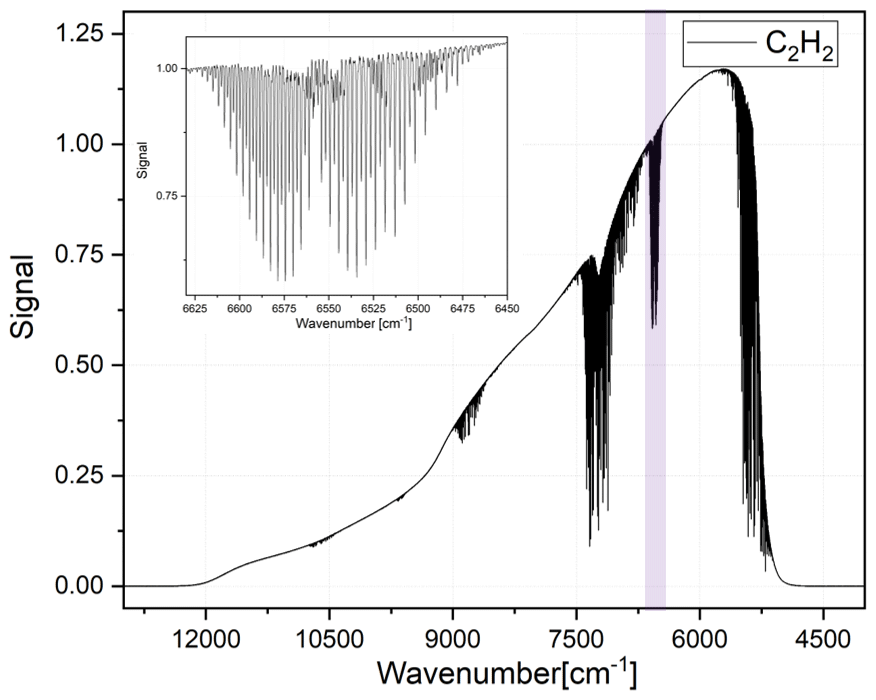
Figure 6An open-path spectrum recorded with the C2H2 cell inserted in the beam. The spectrum was recorded using COCCON's EM27/SUN reference spectrometer SN37. The insert shows a zoom-in of the wavenumber range used for the retrieval of ILS parameters from C2H2.
In this section, we will discuss the results of the open-path measurements, achieved by applying the improved and extended methods introduced in Sect. 2. Firstly, we apply the new refined analysis procedure to the open-path measurements collected by Frey et al. (2019), and we compare the results of this reanalysis with the previously reported results. Next, the results derived from the standard spectral window are compared with results obtained using the micro window in the spectral overlap region, which is accessible by both detectors. As described in Sect. 2.3, this additional spectral micro window was implemented for detecting a potential misalignment of the CO detector element. This performance test was not included in the previous open-path recipe. Finally, our best estimate of the instrumental line shape parameters is provided for all tested spectrometers. The table summarizing the revised results contains the revised values for those spectrometers investigated in the study by Frey et al. (2019) and new results for the spectrometers, which have been calibrated since then.
4.1 Reanalysis of previous open-path measurements
Figure 7 shows, for all spectrometers treated in the work of Frey et al. (2019), the old and newly derived modulation efficiency amplitudes (MEAs), the phase errors (PEs), the new-minus-old differences for both quantities and the empirical standard deviation of the spectral residuals. The use of the revised H2O line list significantly reduced the spectral residuals. Figure 8 shows an excellent correlation between old and new MEA and PE (R2=0.95) results. Figure 9a shows that due to the empirical calibration of the H2O broadening parameters mentioned in Sect. 2, only a small bias in MEA is seen, the mean of the new MEA results being higher by 0.04 %. Figure 8b indicates a significant reduction of PE values; so probably part of the previously diagnosed ILS asymmetry was introduced by systematic spectral residuals created by the HITRAN 2008 line parameters. Overall, the revised analysis recipe confirms the results by Frey et al. (2019), as spectrometers showing suspiciously high or low values of MEA or PE versus the average behaviour retain their characteristics. Although we are confident that the new method, using an improved line list, a correction of the optical distance (and thereby H2O self-broadening effects) and more reliable data for the total pressure, is superior to the original method, the overall effect is only a gradual improvement. The reanalysis of the old spectra is important mainly in order to avoid a systematic bias of reported ILS parameters between previous and current calibrations.
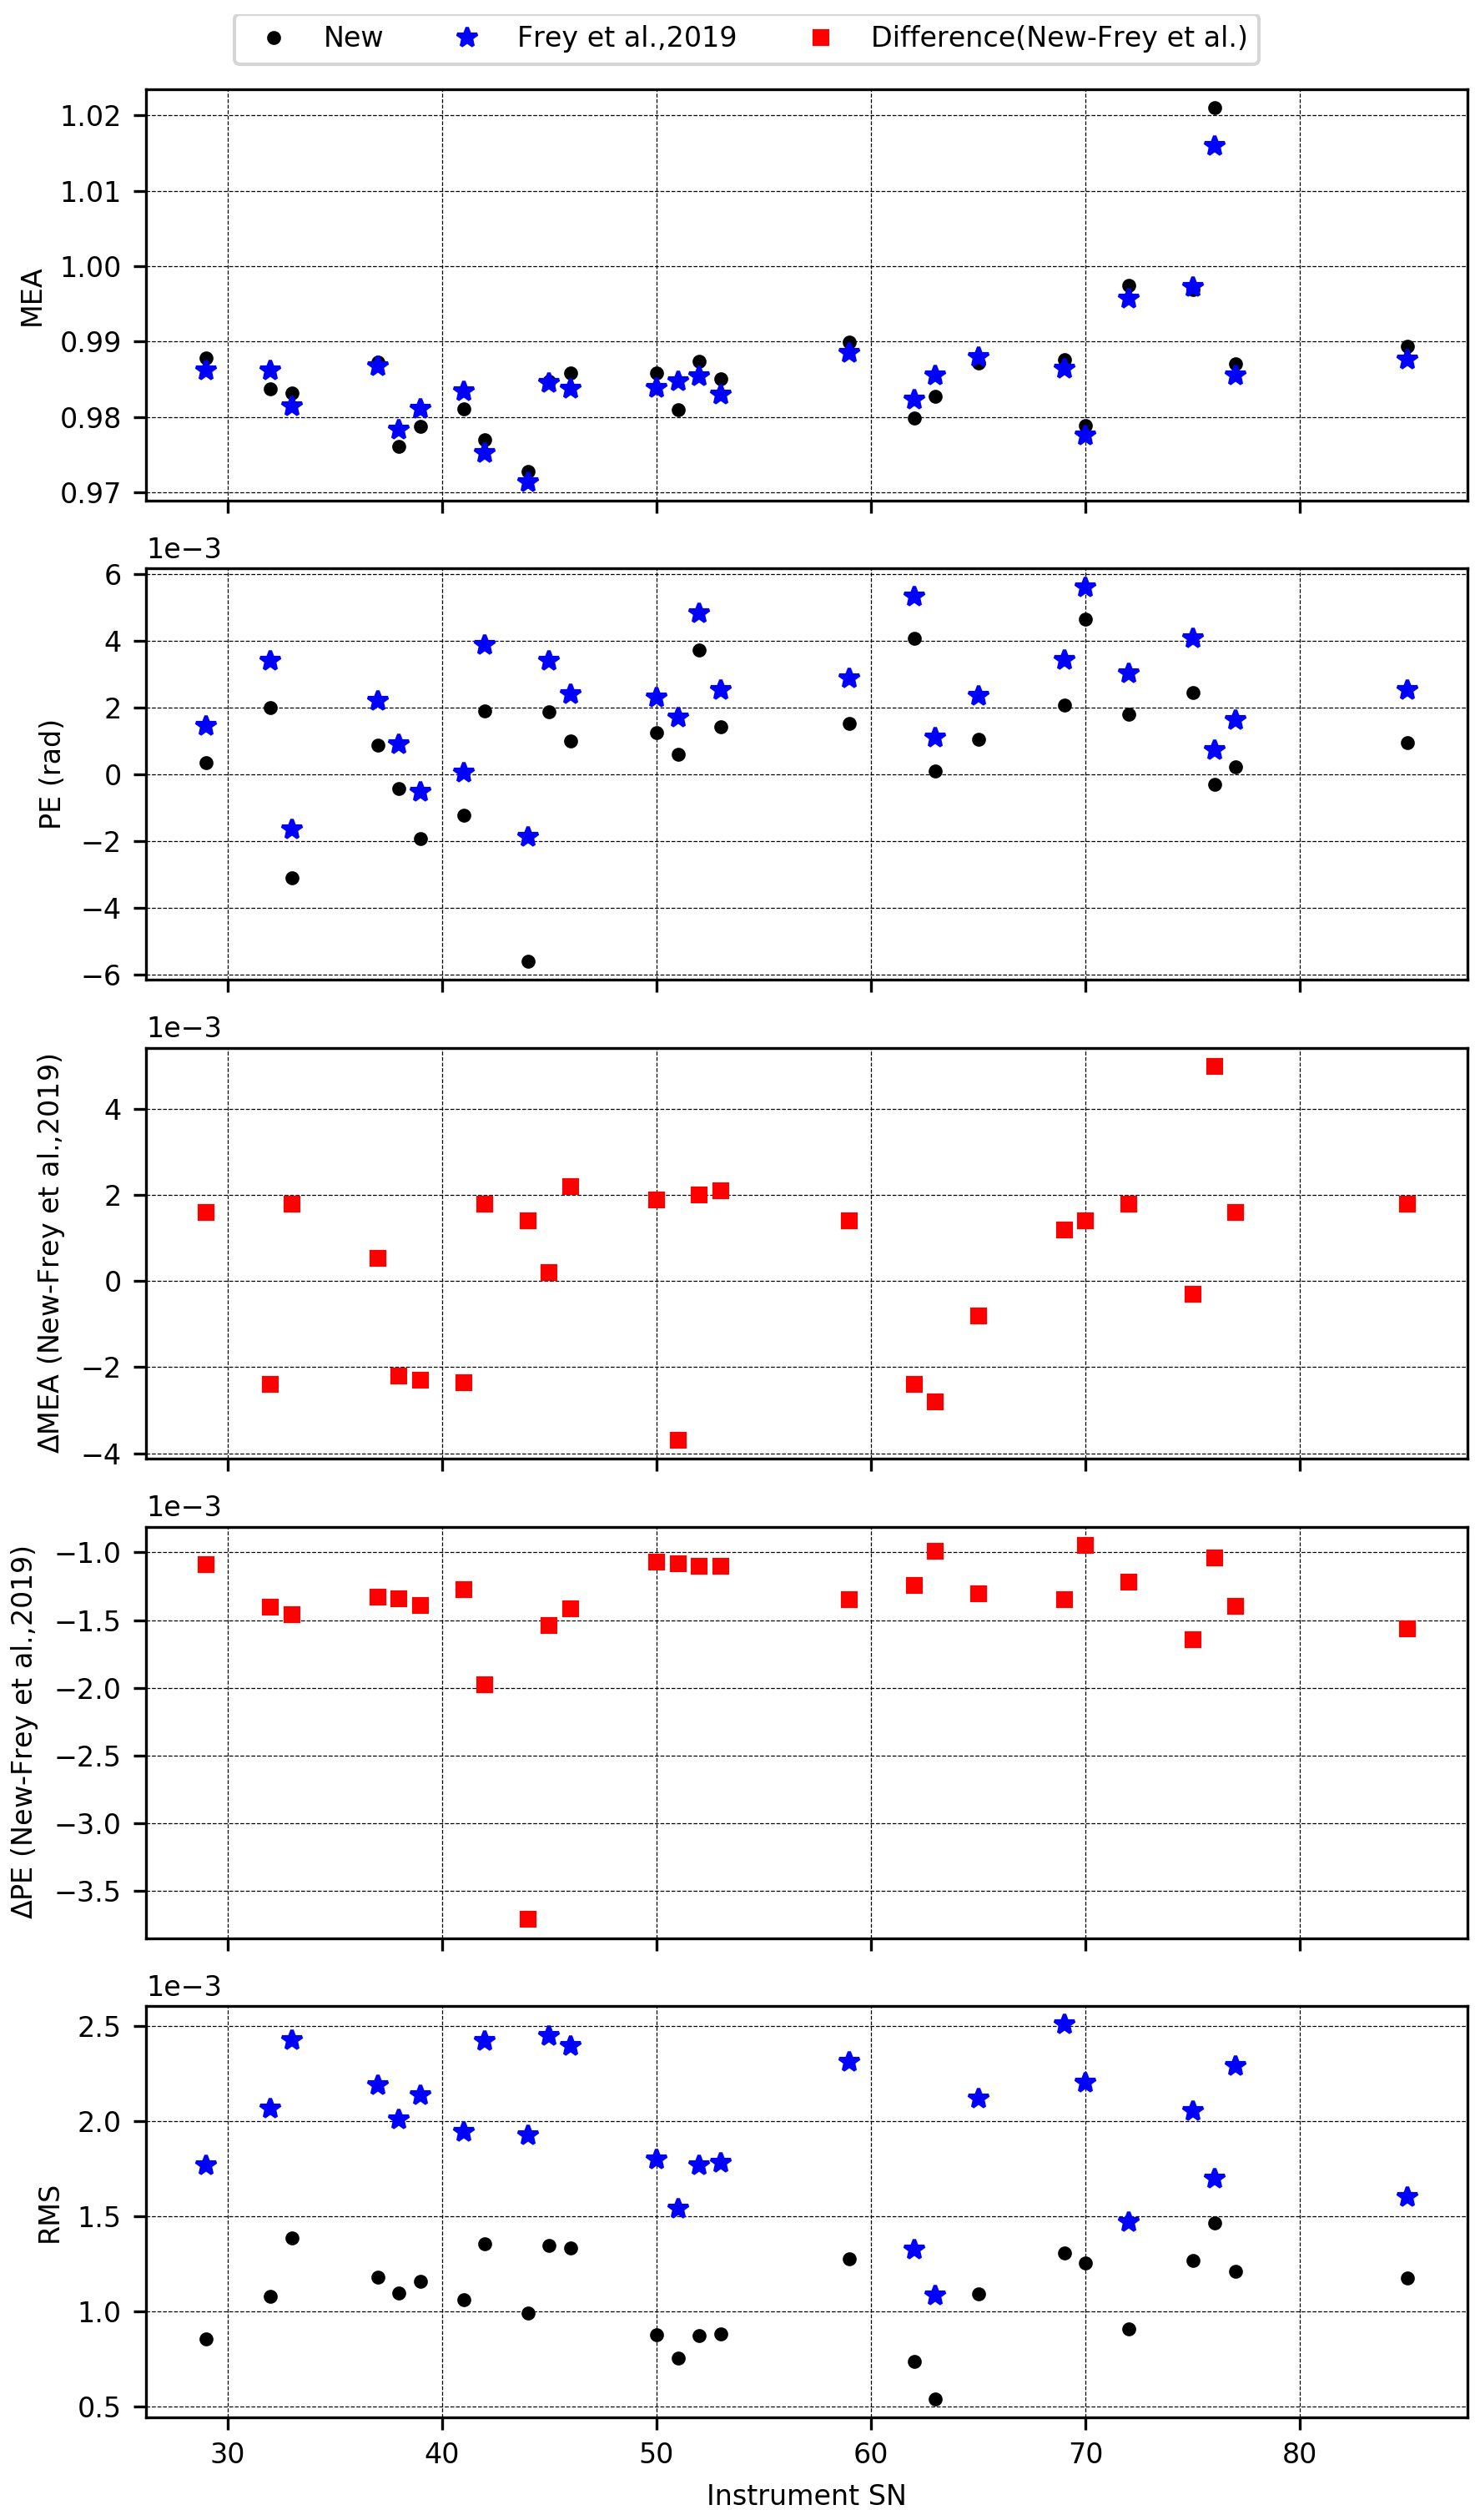
Figure 7Comparison between the old published values (blue star) and the improved ones (black dotes). The MEA, PE and new-minus-old difference for each spectrometer. The bottom panel shows the resulting empirical standard deviation of the spectral fit for the old and the new methods, respectively.
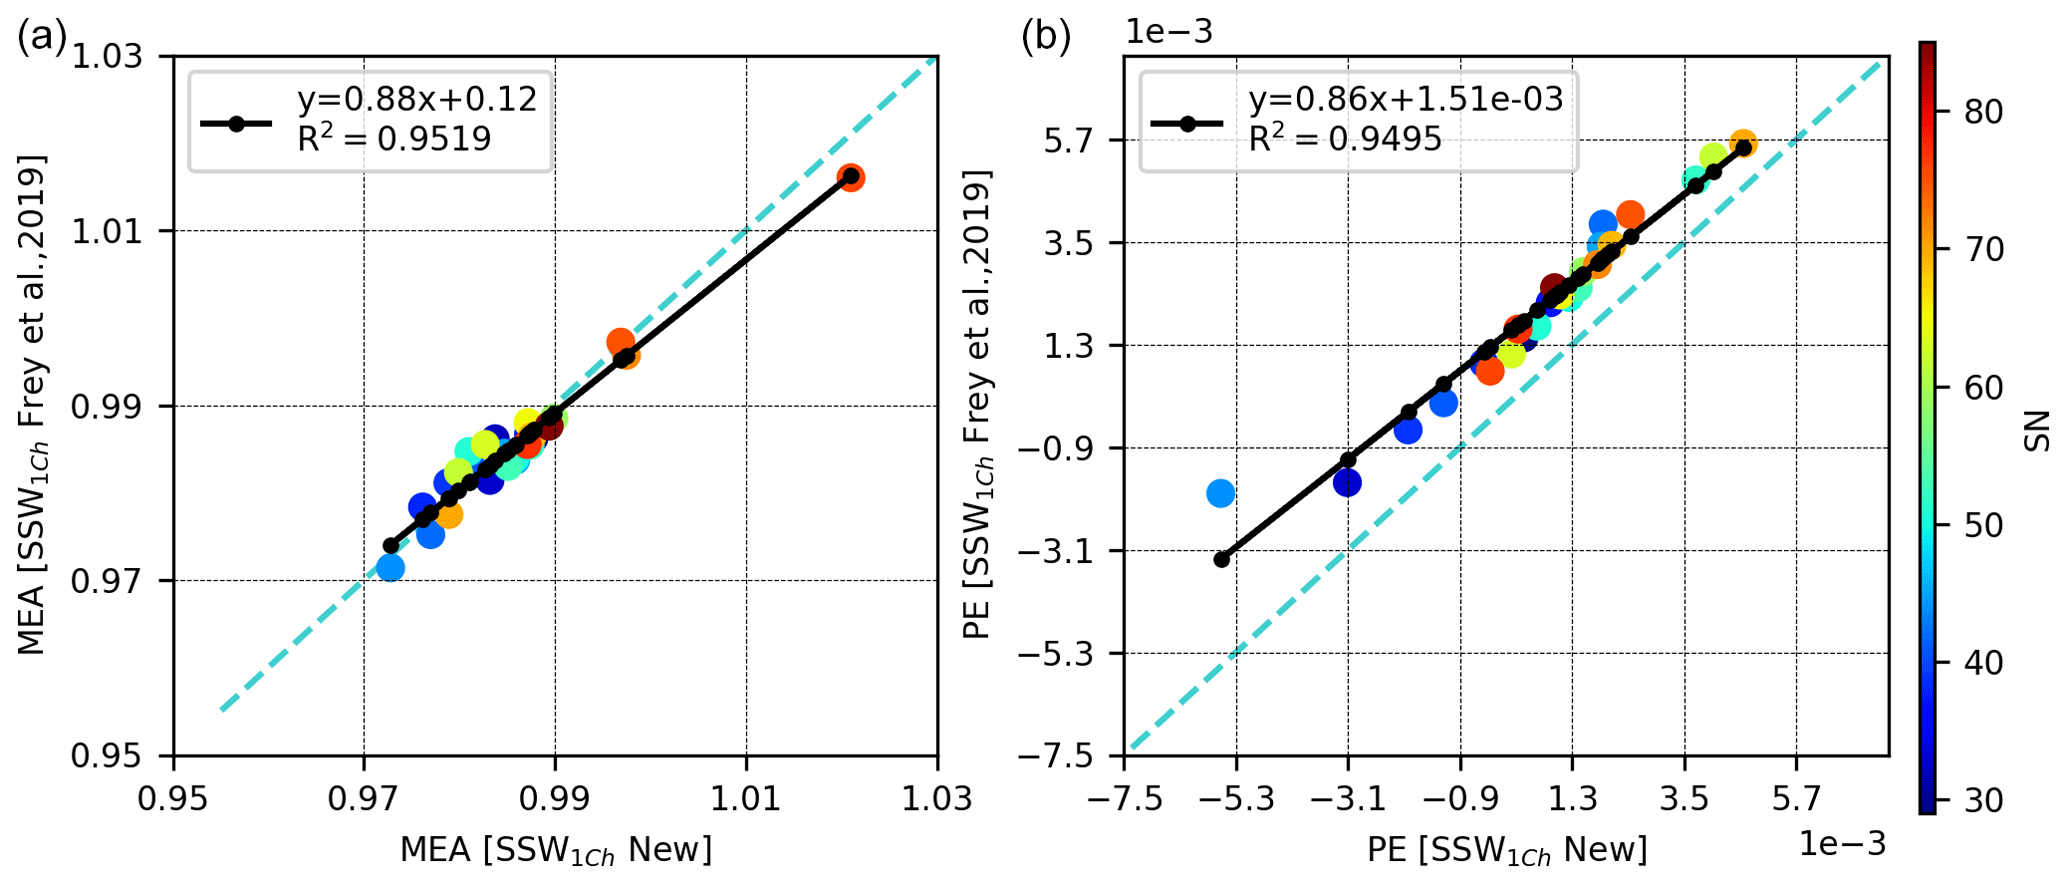
Figure 8(a) Correlation between the MEA obtained with the new and the old methods for the shortwave standard micro window (SSW). (b) Correlation between the PE obtained with the new and the old methods. The colour bar represents the serial number (SN) of the instruments.
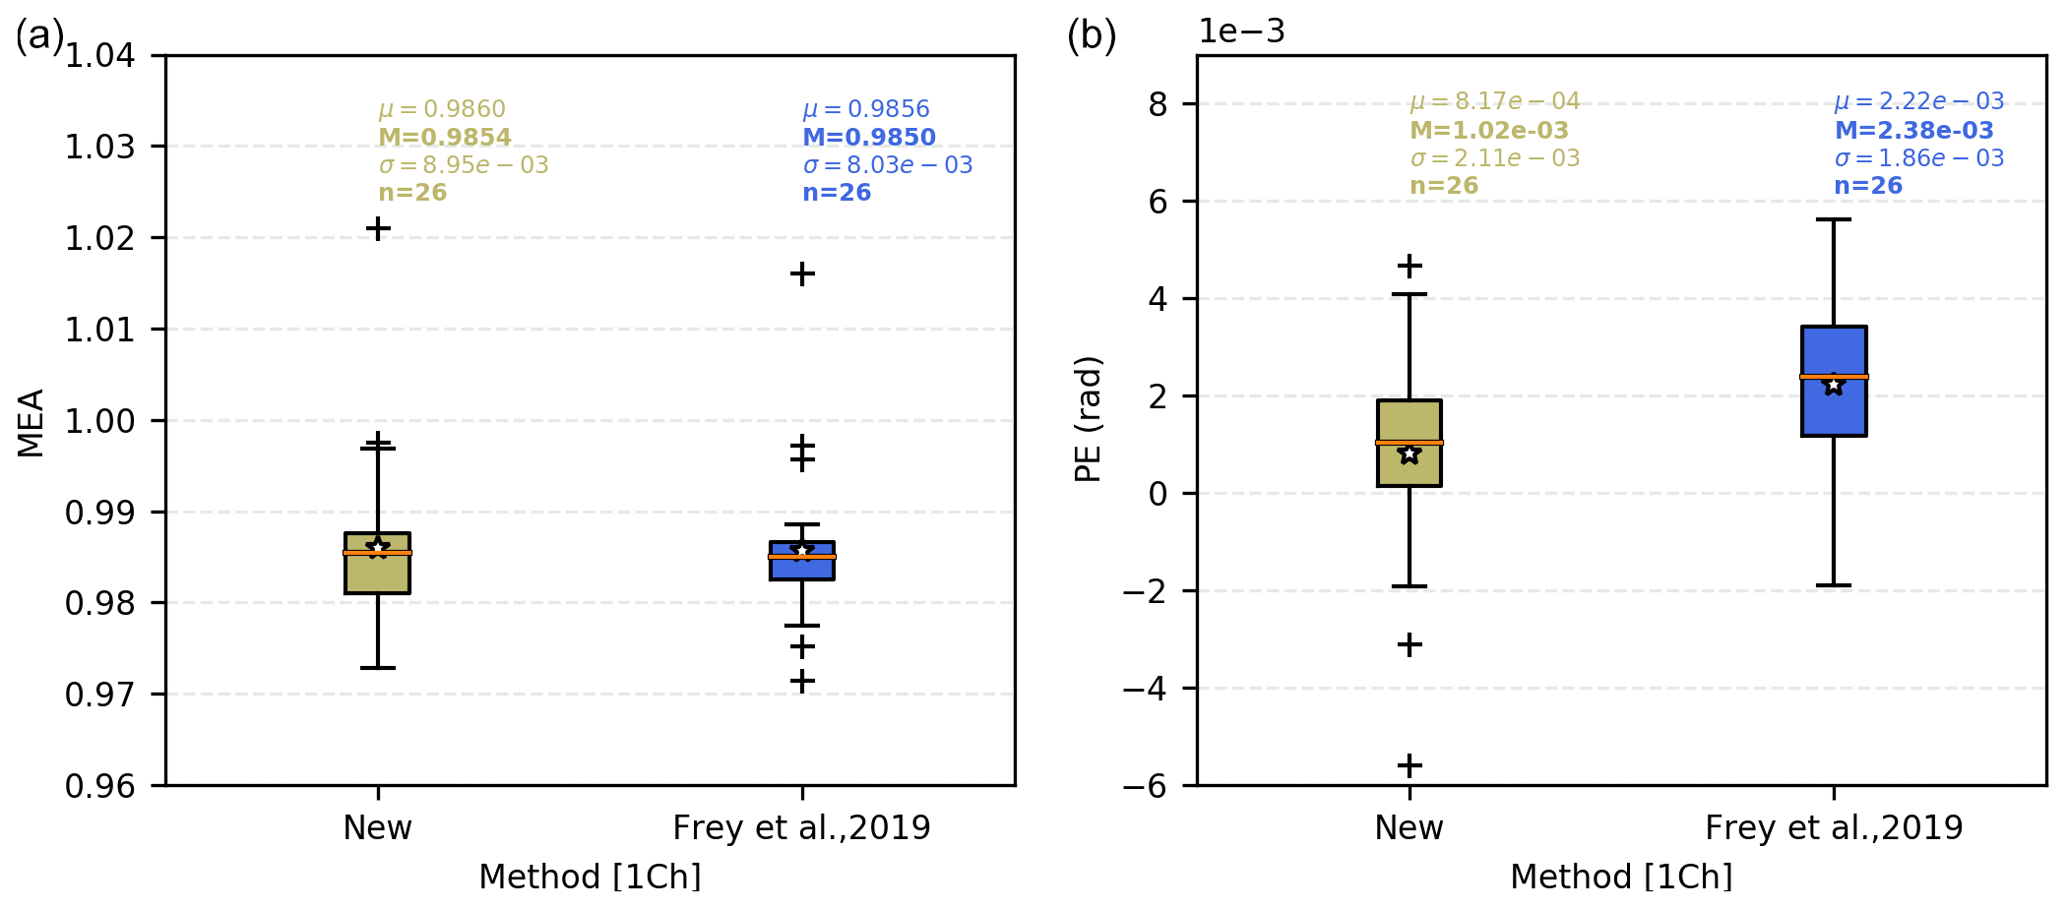
Figure 9Box-and-whisker plots showing the statistics of the original data analysis by Frey et al. (2019) and the reanalysis: median, mean, scatter and interquartile range are presented. (a) MEA. (b) PE.
4.2 Open-path results for all spectrometers
In this section, the ILS parameters for all spectrometers as retrieved with the improved analysis procedure are presented. The left panel of Fig. 10 provides a graphical overview of these new results, including the reanalysis results for the spectrometers already investigated by Frey et al. (2019). In total 47 new spectrometers were investigated. As can be seen from the figure, the results for new spectrometers are in line with the previous work, but the occurrence of outliers seems reduced (the clearly deviating behaviour of spectrometers 75 and 76 uncovered by the calibration work was later diagnosed to be caused by misassembled detector baseplates). Presumably, this reflects the gain of expert knowledge in the fabrication of the EM27/SUN spectrometer type and in the acceptance and calibration procedures. We suppose that the continued efforts for quality assurance presented in this work contribute to the high level of consistency achieved in the spectrometers' characteristics that is apparent today. Table S1 in the Supplement collects the ILS results for all spectrometers.
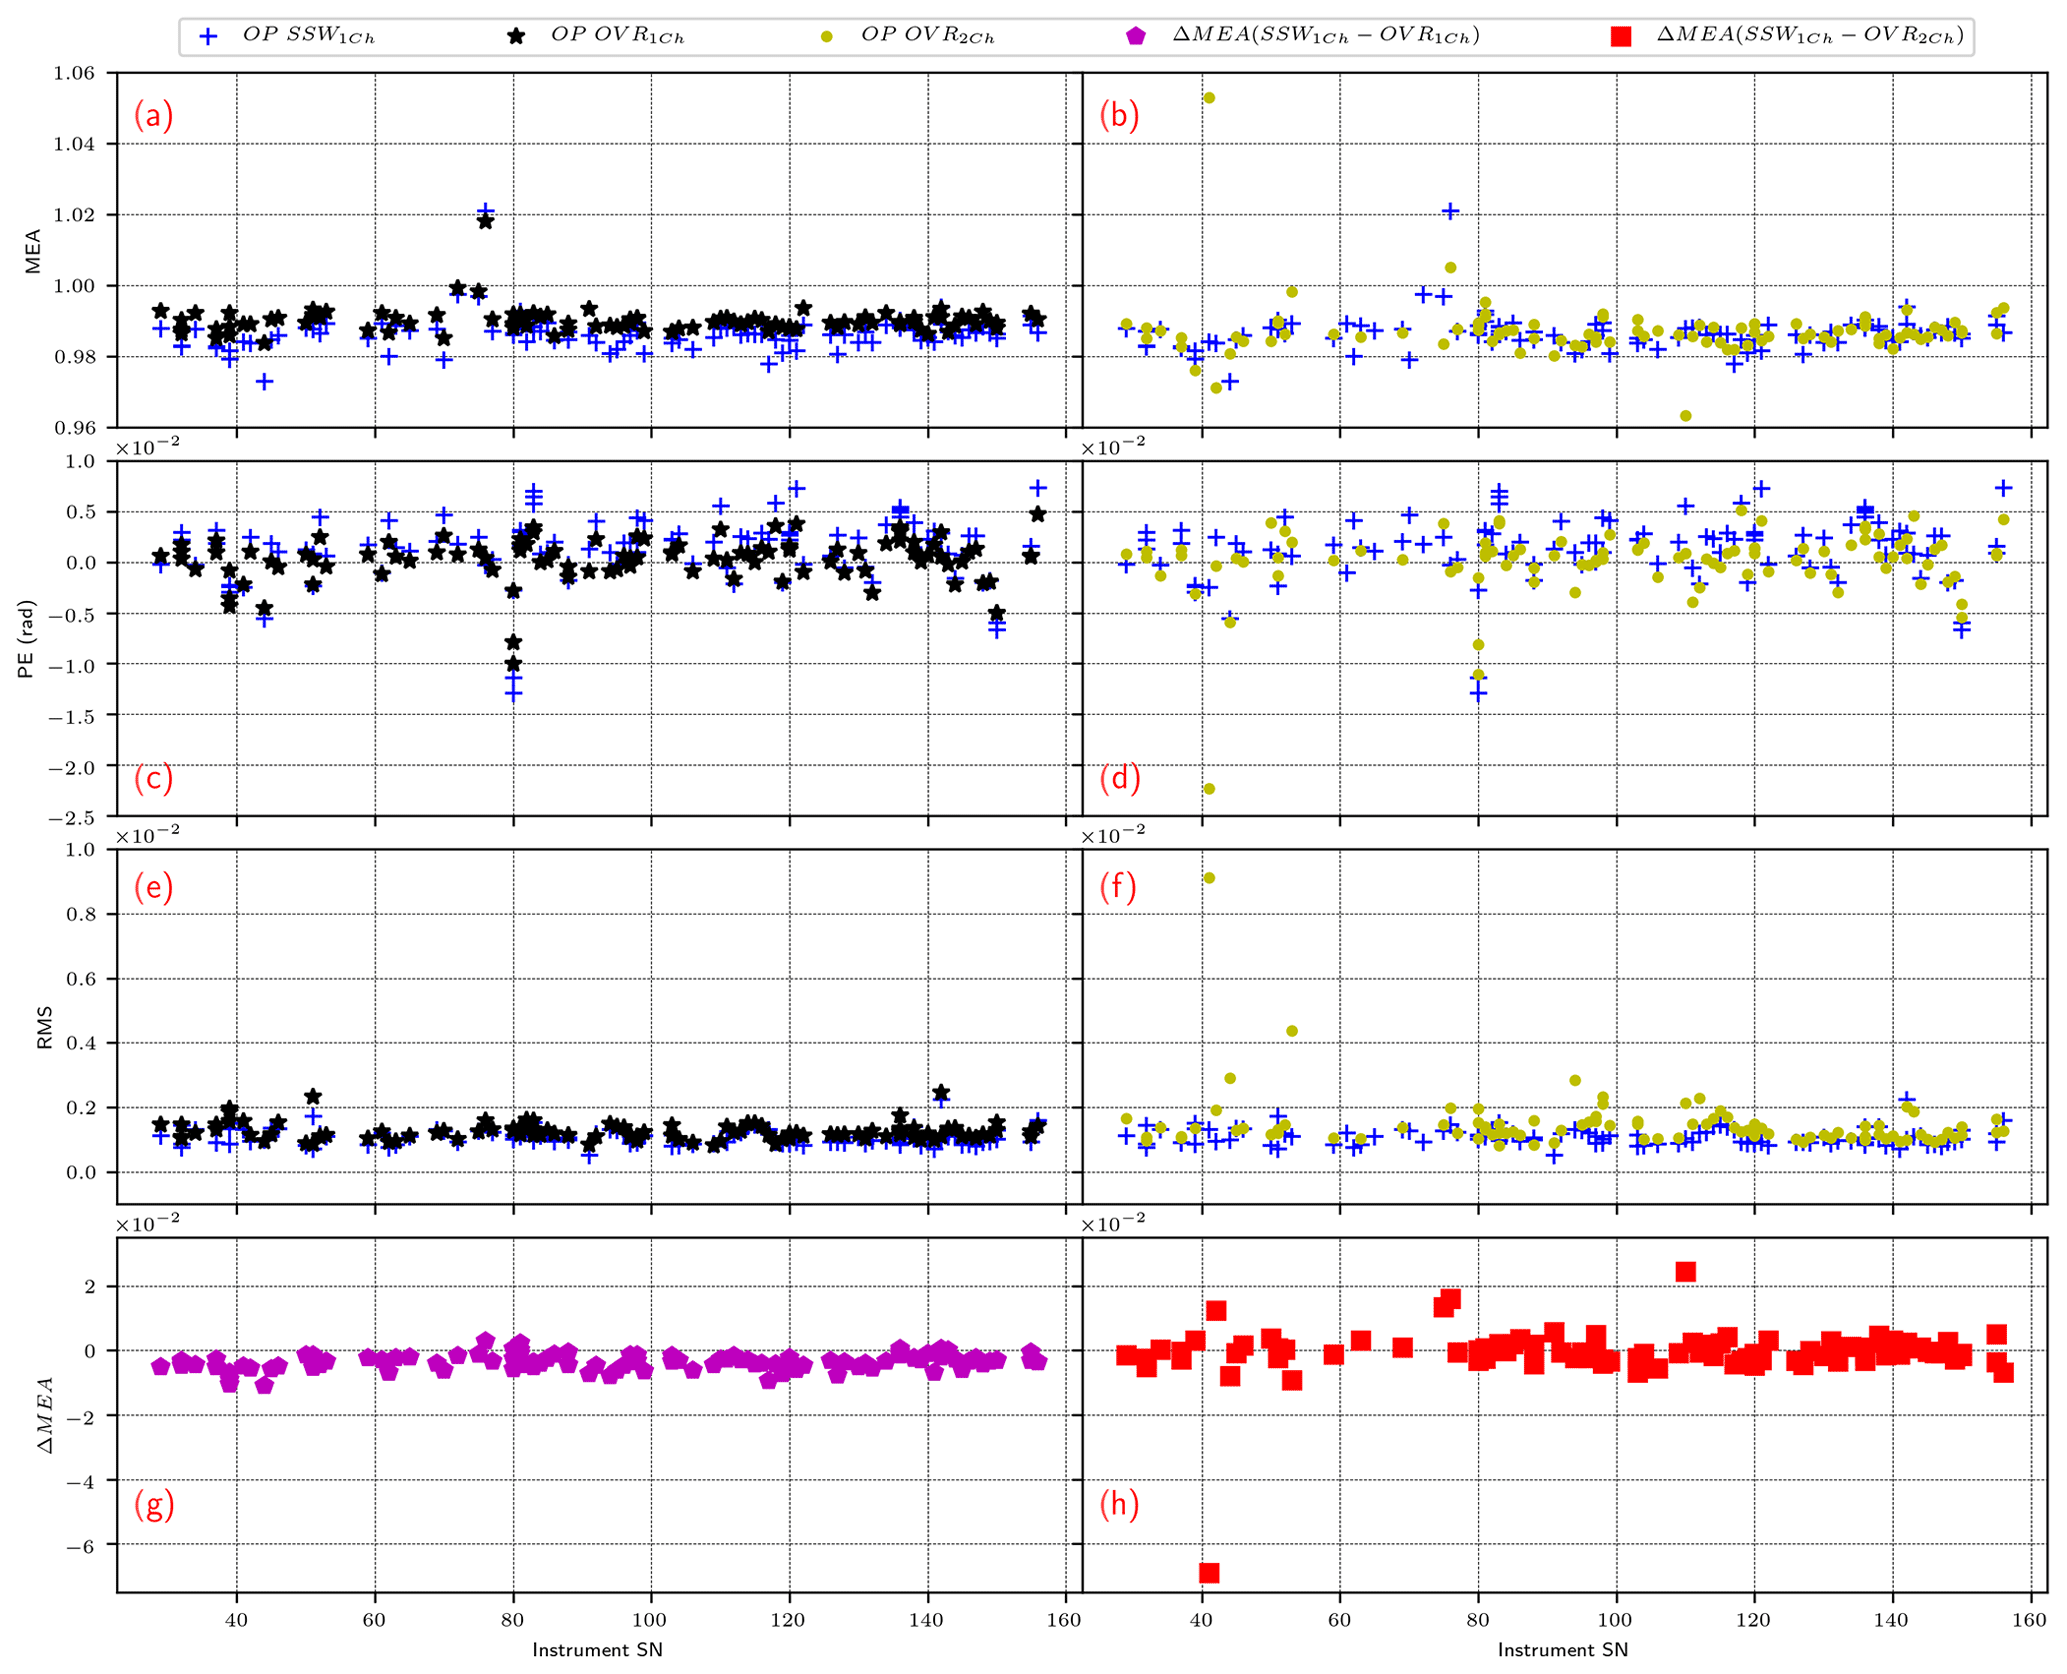
Figure 10Main results for the main (a, c, e, g) and CO detector channels (b, d, f, h) resulting from the revised open-path method. The modulation efficiency, phase error, rms and relative difference for the first channel by using SSW and OVR are shown in (a), (c), (e) and (g), respectively, while the modulation efficiency, phase error, rms and relative difference for the first and second channels using SSW and OVR are presented in (b), (d), (f) and (h), respectively.
4.3 Testing the alignment of the CO channel
The addition of a further spectral window to the open-path analysis in the spectral overlap region covered by both the main and the CO channel allows the extension of the open-path ILS analysis to the CO channel. The CO channel is an extension of the original design of the EM27/SUN (Hase et al., 2016). CO is an air pollutant and also useful for the source apportionment of CO2 emissions. CO is measured by space sensors as Measurement of Pollution in the Troposphere (MOPITT) (Drummond et al., 2010; Drummond and Mand, 1996) and the TROPOspheric Monitoring Instrument (TROPOMI) (Veefkind et al., 2012). Today, all EM27/SUN spectrometers incorporate both detector channels. Therefore, it is desirable to include a procedure in the calibration which recognizes the potential for a significant misalignment of the CO detector element with respect to the main detector. Such a misalignment of the CO detector would generate (1) deviating ILS parameters and (2) a deviating spectral scaling factor.
In this section we compare the consistency of spectral fits in the standard spectral window (SSW) and in the overlap region (OVR) using the spectra recorded with the main detector. We compare the retrieved ILS parameters (MEA and PE) and spectral scaling factors. In Sect. 4.3.1, we investigate the consistency of ILS results between the SSW and OVR windows using spectra recorded with the main detector channel.
In Sect. 4.3.2, we discuss the results from the OVR region, this time using spectra recorded with the CO detector instead of the main detector.
4.3.1 Consistency of spectral fitting in the standard spectral window and the overlap region
Figure 11 (top panel) compares the MEA and PE of retrievals performed in the SSW and in the OVR using the main detector. The results show good agreement (MEA: R2=0.78, PE=0.95). It is very interesting to observe that the regression line has a slope significantly below 1:1. Since parameters such as MEA and PE measure fractional wave front errors, their deviations from the nominal value are indeed expected to increase with increasing wavenumber. The wavenumber ratio between OVR and SSW is 0.74, while the slope of the MEA regression line is 0.63, which would support the assumption of a steeper-than-linear wavenumber dependence of the MEA parameter (∼ν1.5). The PE results are compatible with the assumption of a linear wavenumber dependence.
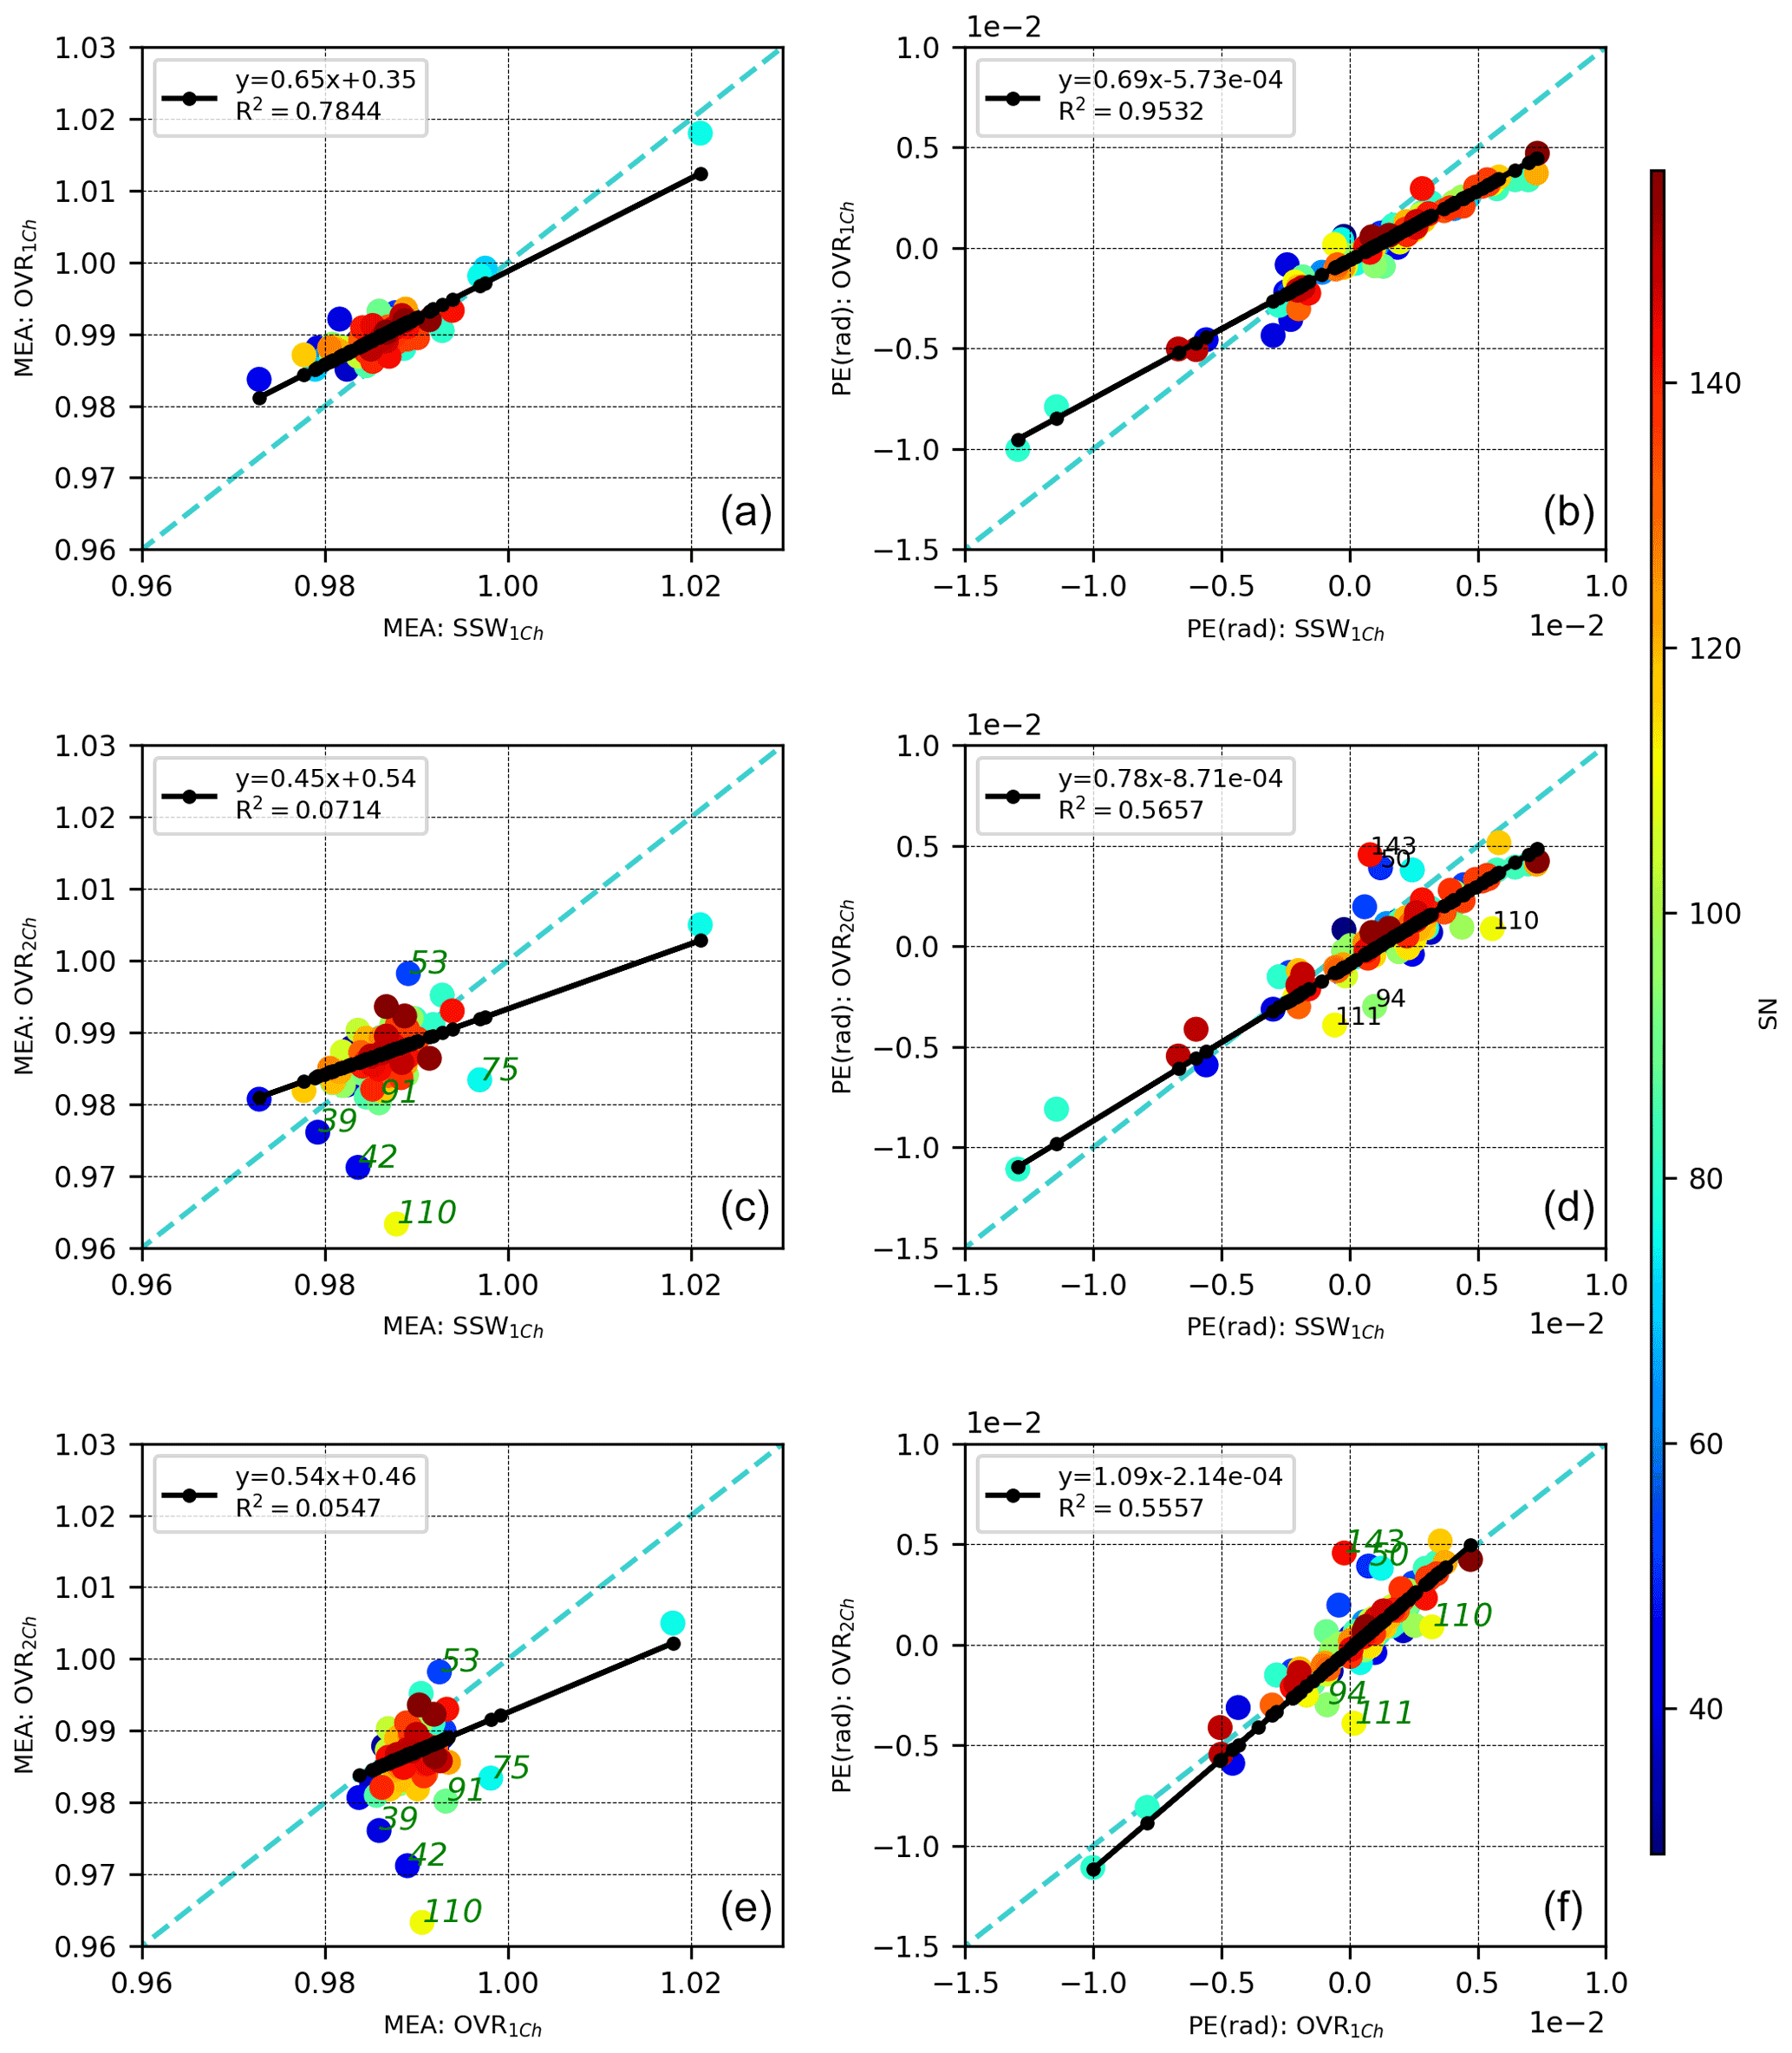
Figure 11Correlation plots between the MEAs (a, c, e) and PEs (b, d, f). (a, b) The first channel in the SSW and in the OVR region, (c, d) the first channel in the SSW and the second channel in the OVR region, and (e, f) the first channel in the OVR and the second channel in the OVR region. Additionally, the obvious outliers are labelled in order to assess them.
As can be seen from Fig. 12, there is a small bias of 0.3 % in MEA between the primary channel results deduced from the SSW and OVR spectral regions: the values retrieved in the OVR are slightly higher than those from the SSW. The PE retrieved in the OVR is significantly smaller, which might indicate that the revised spectroscopic description of the SSW spectral window – although the new line list reduced the retrieved PE by a factor of 2 (see Sect. 4.1) – still simulates a spurious PE bias. The spectral fit quality in the SSW and OVR regions is quite comparable for the primary channel (Fig. 11, bottom panels), while the OVR spectral fits to the measurements recorded with the CO detector indicate a somewhat higher noise level.
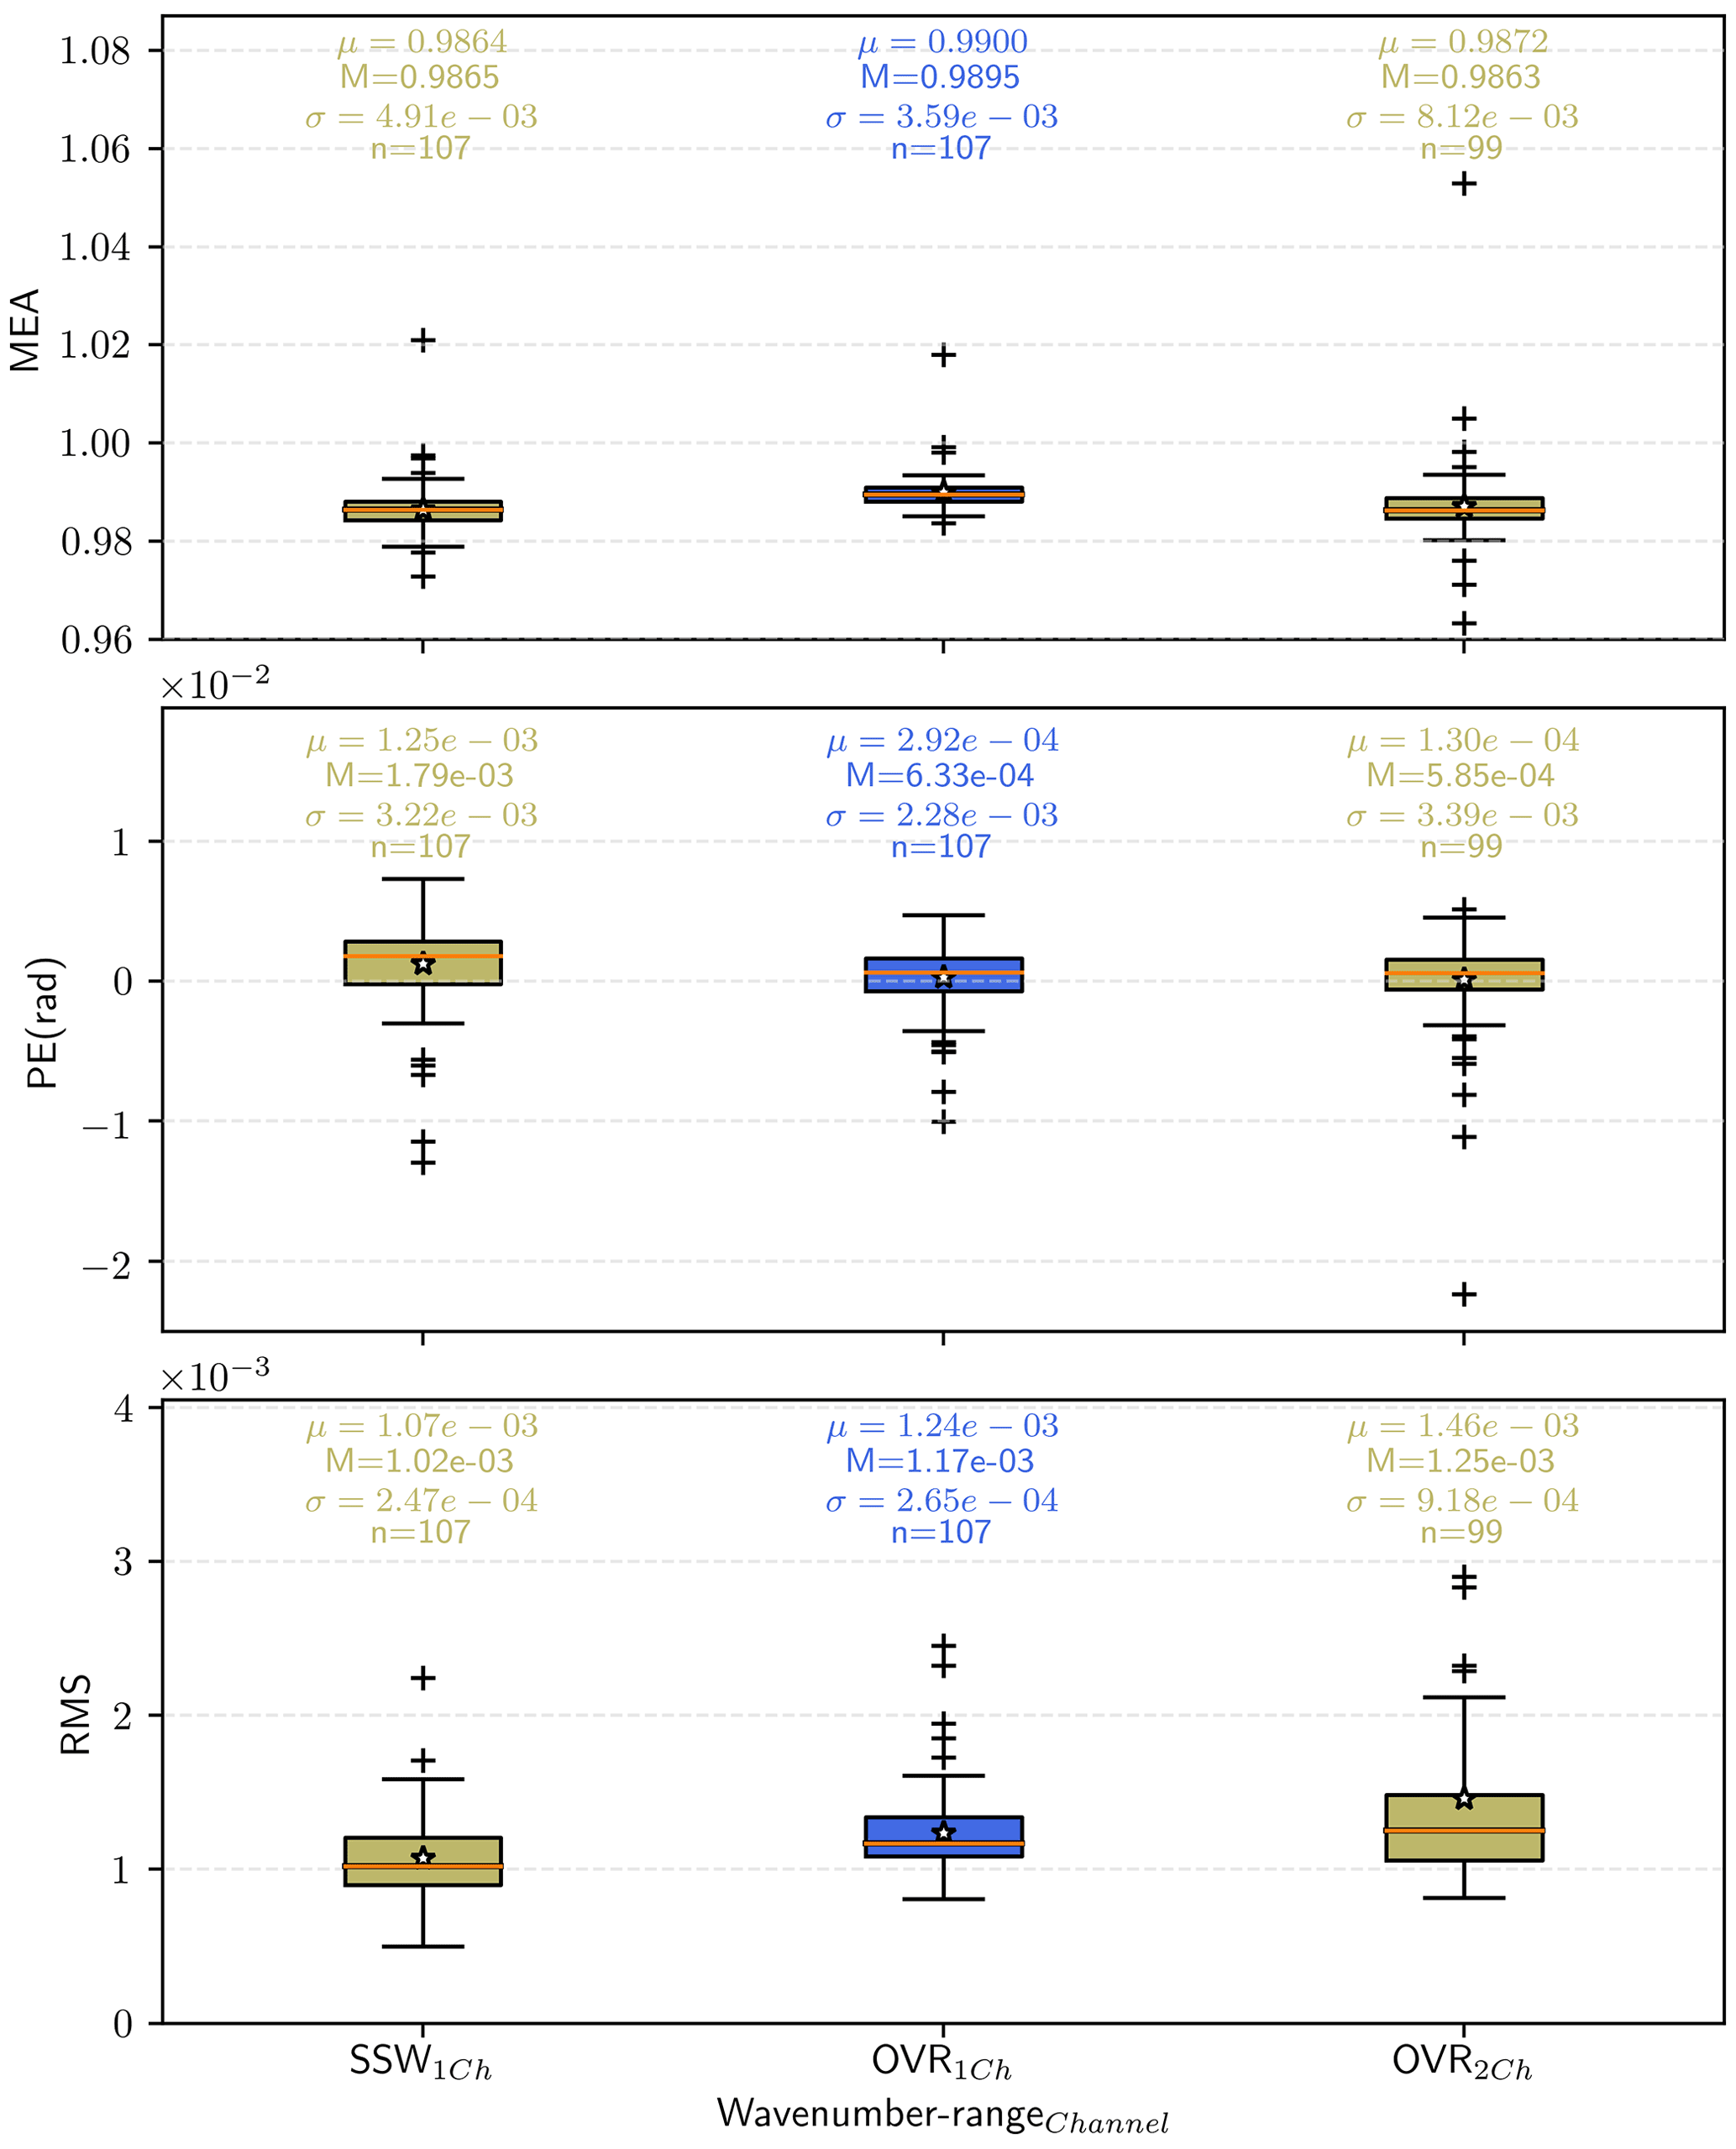
Figure 12Box plots comparison for the three-wavenumber ranges used with the open-path method showing the MEAs, PEs and rms.
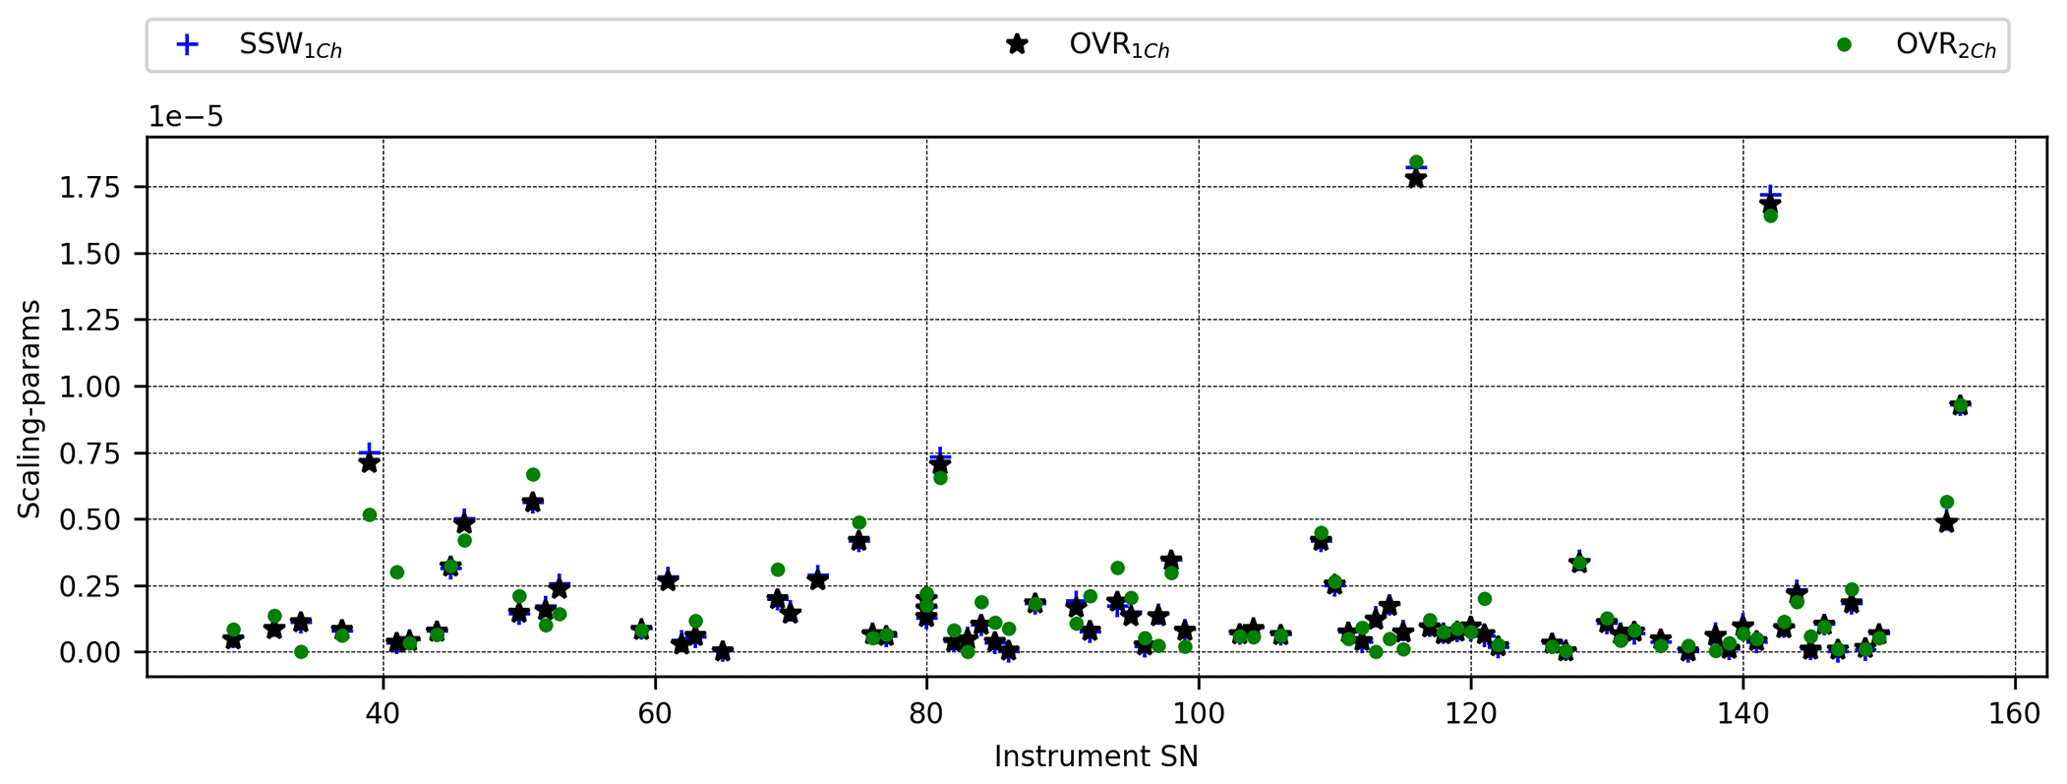
Figure 13Instrumental variation in the spectral scaling factors in each of the spectral windows used and for both channels.
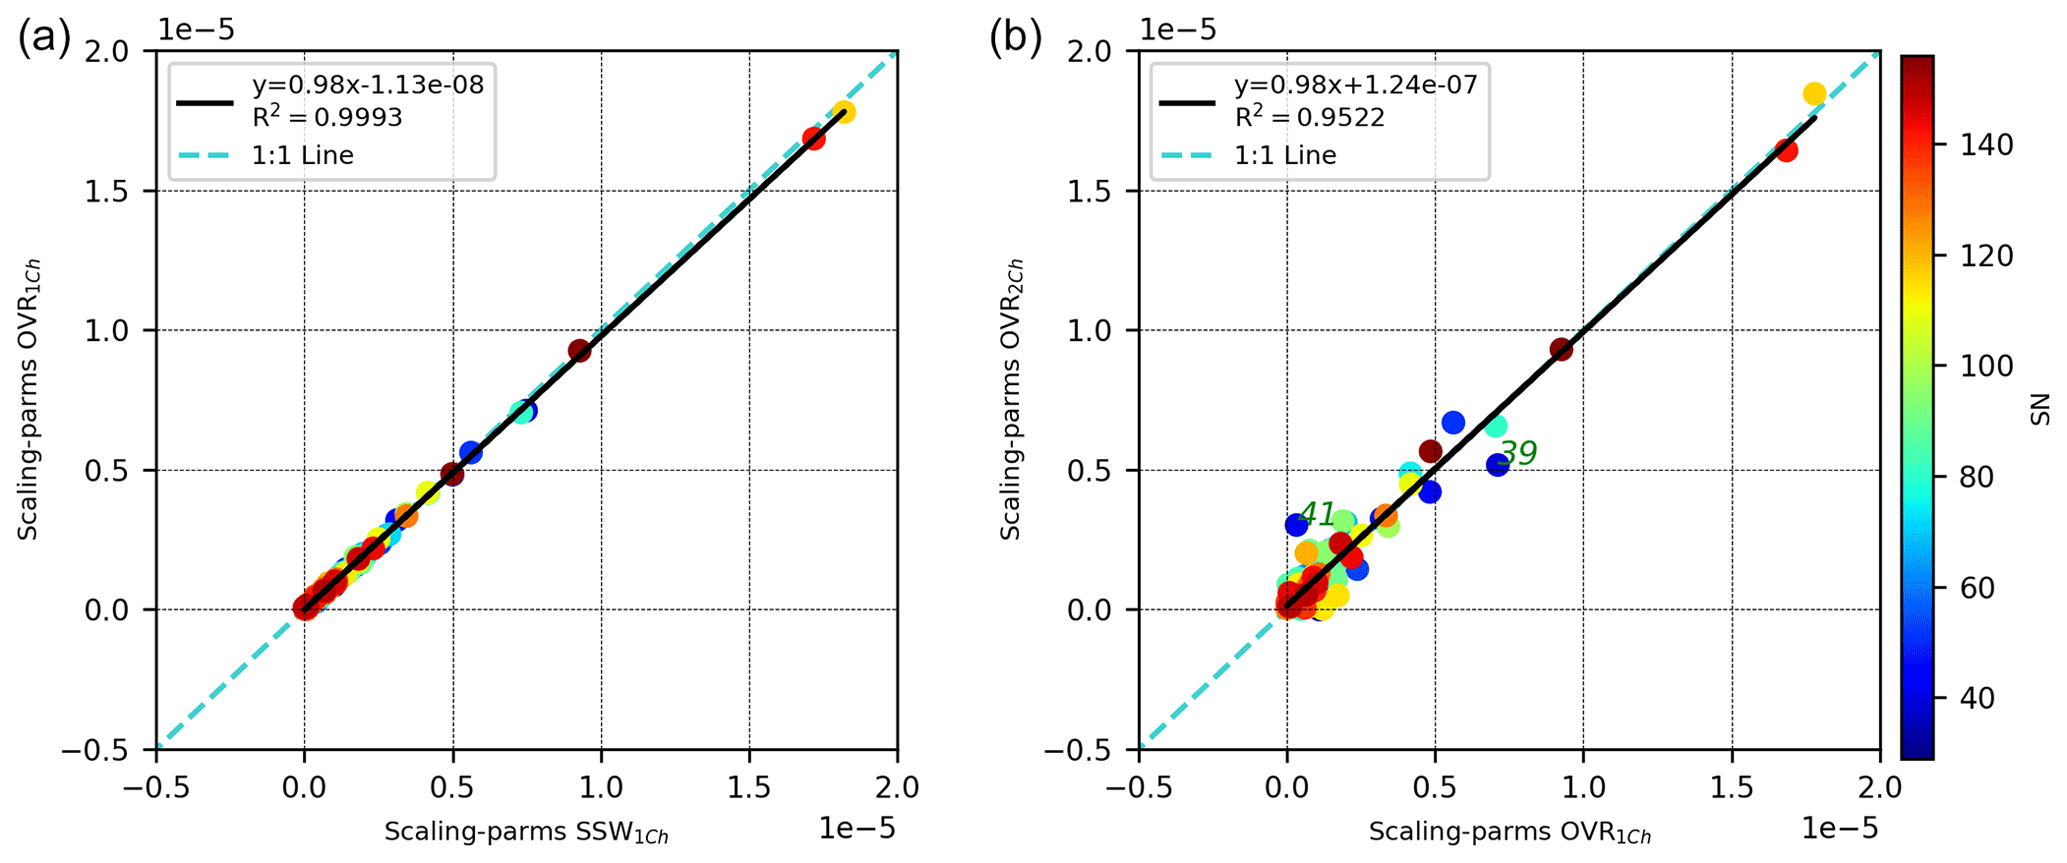
Figure 14Correlations between the scaling factors derived from OVR and SSW spectral windows using the main channel spectra (a) and using CO channel results for the OVR spectral window (b).
Figure 13 summarizes the results for the spectral scaling factors for both spectral windows as resulting from the LINEFIT fits. Figure 14a compares the spectral scaling factors of OVR and SSW fits as deduced from main detector spectra. As one would expect, the slope is near 1:1, and the correlation is very high.
4.3.2 Evaluation of the CO detector alignment using the spectral overlap region
Figure 11 (middle and lower panels) shows the MEA and PE correlations as deduced from the main detector and the CO detector, respectively. Figure 11, middle panel, shows the correlation of MEA between the CO detector (OVR) and main detector (SSW). While the shallower slope is comparable with the results reported in Sect. 4.3.1, the correlation between the two different detectors is significantly poorer. There are several outliers from the MEA regression line: these are spectrometers 39, 42, 53, 75, and 110. In the PE regression, the five results furthest from the regression line are 50, 94, 110, 111 and 143.
Figure 14b compares the spectral scaling factors of OVR fits for the two CO and main detectors. While the slope is in excellent agreement with the results derived from the main detector, there is more scatter (R2=0.95). The results for spectrometers 39 and 41 are furthest from the regression line.
In summary, although the correlation of ILS parameters and spectral scaling factors is noisier between the main and CO detectors, only one consistent outlier appears, which is spectrometer SN39. Altogether the applied OVR tests do not detect unacceptable misalignments of the CO detector. The relative spectral detuning of SN39 between SSW and OVR is on the order of , which, by applying using α∼1.5 mrad, is equivalent to about one-seventh of the apparent solar diameter. Here α denotes the maximum inclination of a ray still accepted by the interferometer. The effect of a misadjusted field stop on spectral scale is discussed by Kauppinen and Saarinen (1992). The majority of spectral detuning results are located within , equivalent to an angular misalignment of of the apparent solar diameter, which is in reasonable agreement with the expected alignment precision of the CO detector. Because the air mass reference is deduced from the oxygen band observed in the main channel, such a misalignment introduces an error in the XCO data. If we assume a misalignment of of the apparent solar disc diameter along the vertical, the resulting relative error in XCO at an 80∘ solar zenith angle amounts to 0.5 %.
In Sect. 3, the construction and calibration of a cell filled with C2H2 are described. Here, we compare in detail the results obtained from the open-path measurements (OP) using the H2O lines forming in the laboratory air with those obtained with the cell method. Because the cell measurements were implemented in the beginning of 2020, only for spectrometers tested afterwards are cell results available. The comparison is based on the standard H2O window covering 7000–7400 cm−1 discussed in Sect. 2 and the C2H2 spectral window covering 6450–6630 cm−1 discussed in Sect. 3, so spectra recorded with the main detector are used.
5.1 Intercomparison of repeated open-path and cell measurements using the reference spectrometer
In order to investigate the stability of both methods, OP and cell measurements were taken repeatedly under different laboratory conditions using the COCCON reference instrument SN37. On a total of 16 d, measurements were performed during February and March 2021. For each daily set of measurements, included sequential OP and cell measurements were taken within 45 min to ensure the laboratory conditions were comparable. We collected 15 interferograms for the cell test and 30 for the OP method.
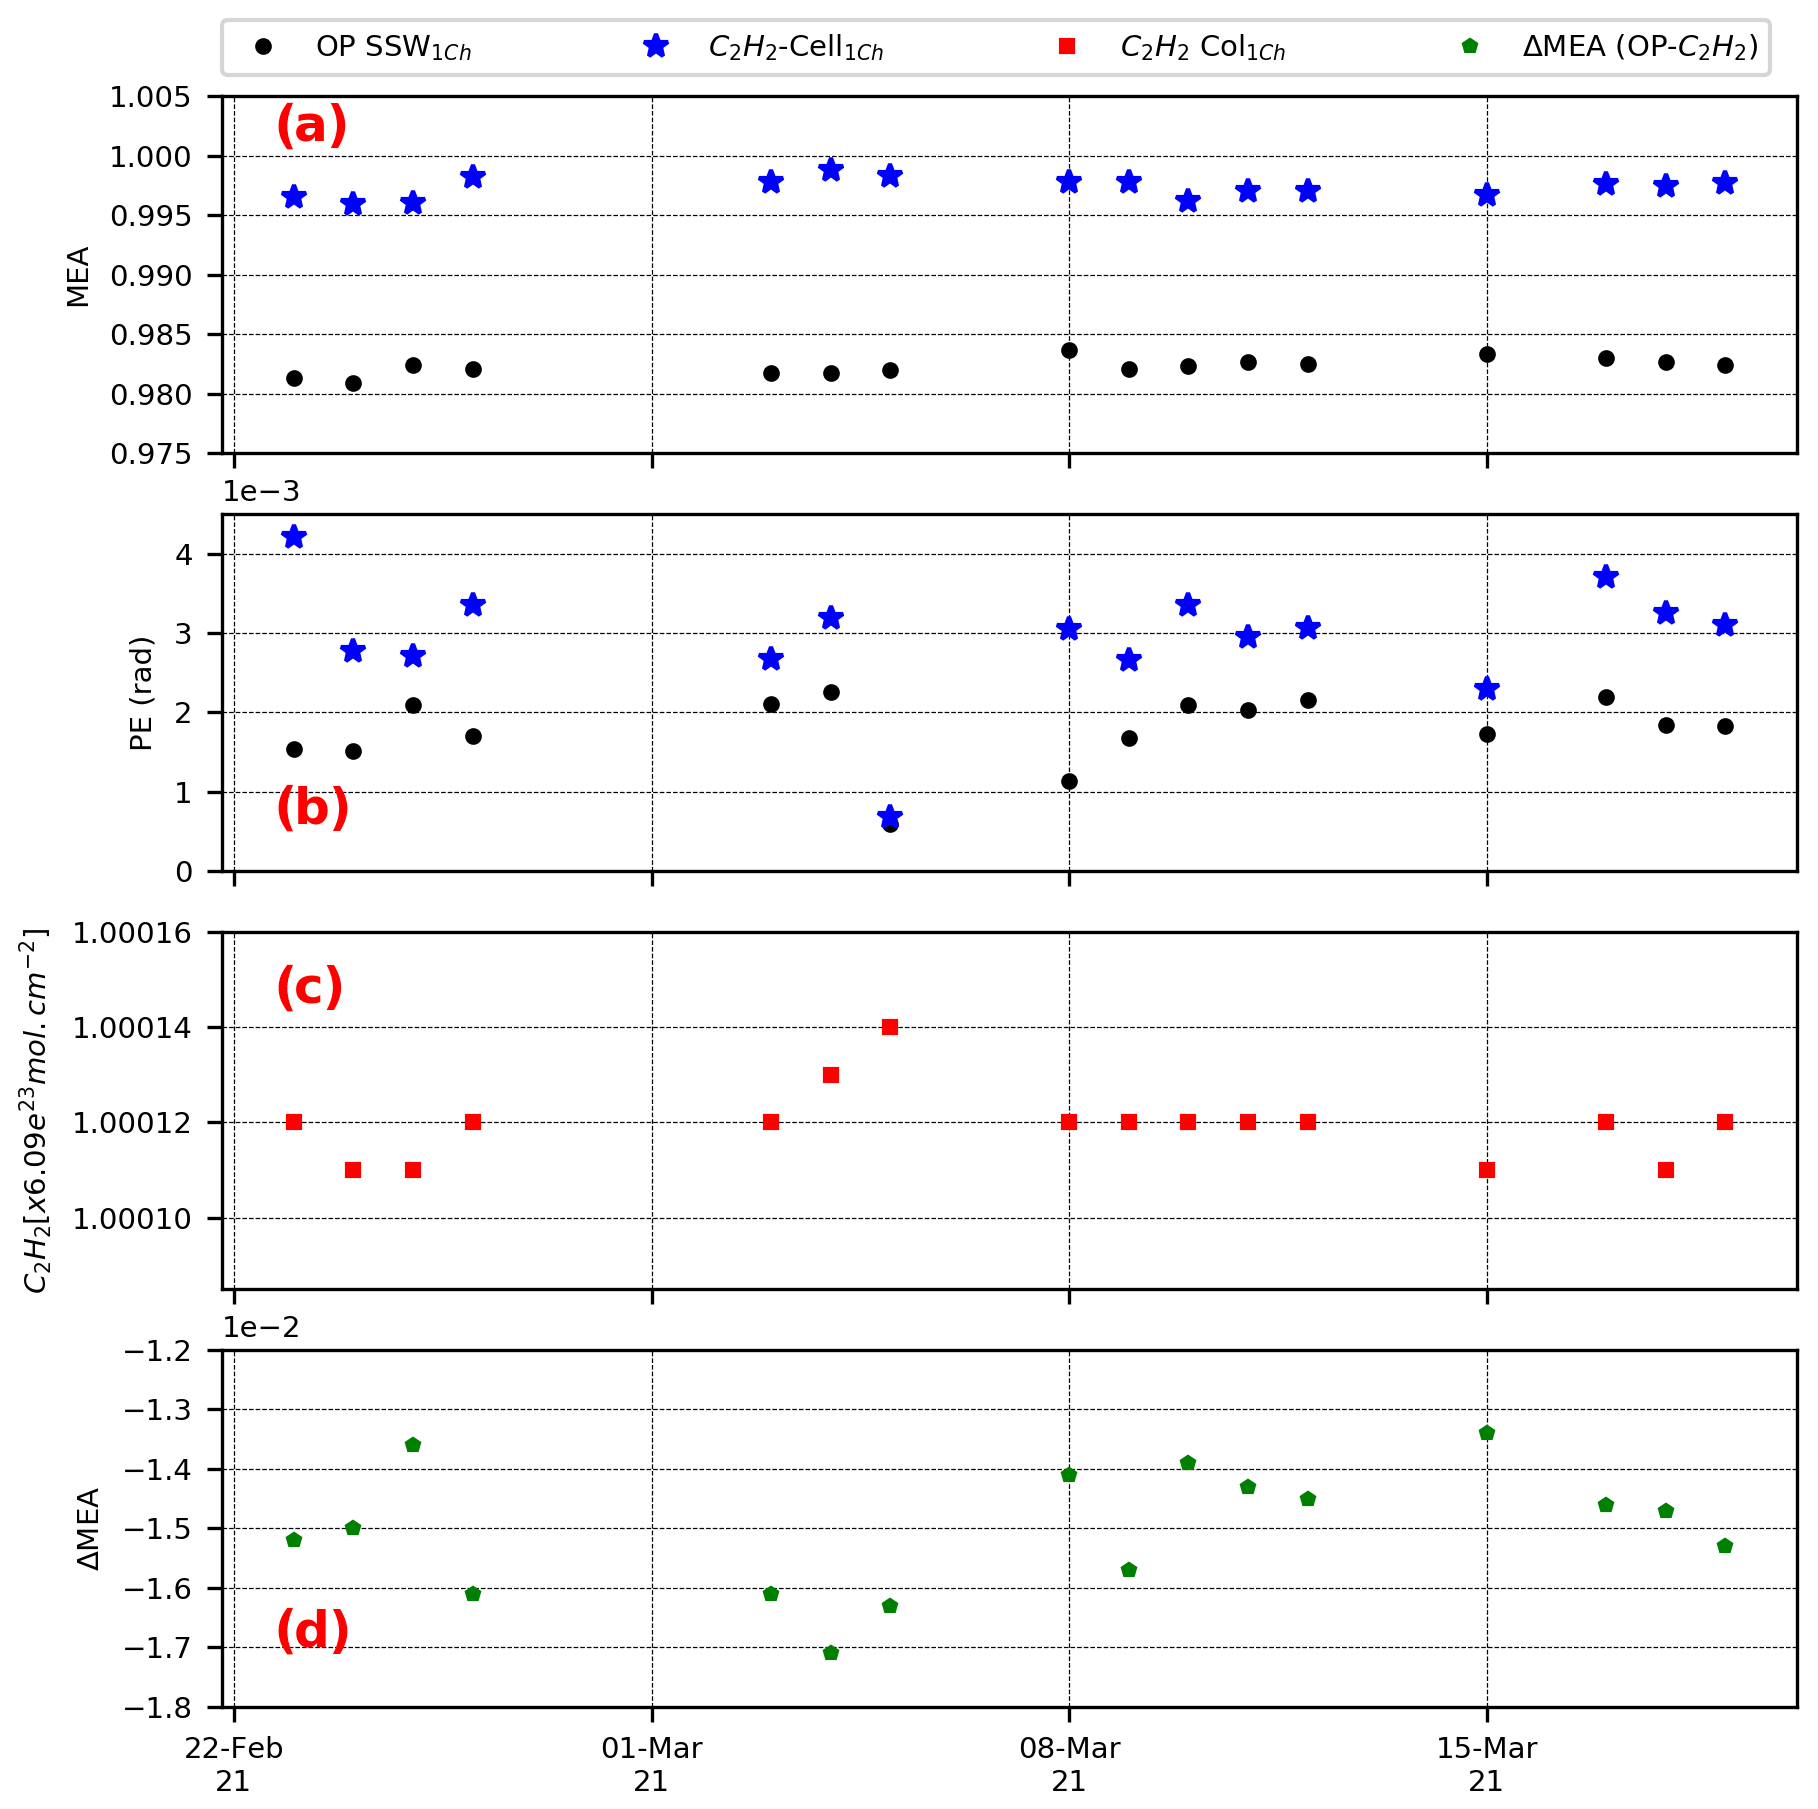
Figure 15Time series of the MEAs, PEs, C2H2 retrieved column and difference between the MEAs retrieved with OP and cell method for the COCCON reference instrument SN37 (a, b, c and d, respectively).
Figure 15 shows the internal variability of the results. Both methods seem to offer similar repeatability. While we do not see a clear advantage of the cell approach from the comparison in this regard, we need to acknowledge the fact that the C2H2 line widths are properly calibrated. If we assume that the TCCON spectrometer used to calibrate the empirical C2H2 cell parameters can be regarded as an ideal reference (see Sect. 3.2), this finding suggests that the OP MEA results indeed suffer from a systematic low bias of about 0.015 (1.5 %) and that the ILS performance of the EM27/SUN is on average closer to the nominal expectation than indicated by the OP measurements (see Fig. 16). This adjustment will be included in a future version of the PROFFAST software used by COCCON for the analysis of atmospheric spectra. The current version of the code uses the MEA values resulting from the OP measurements, so the currently incorporated values of the air-mass-independent and air-mass-dependent calibrations are partly mitigating the bias in MEA.
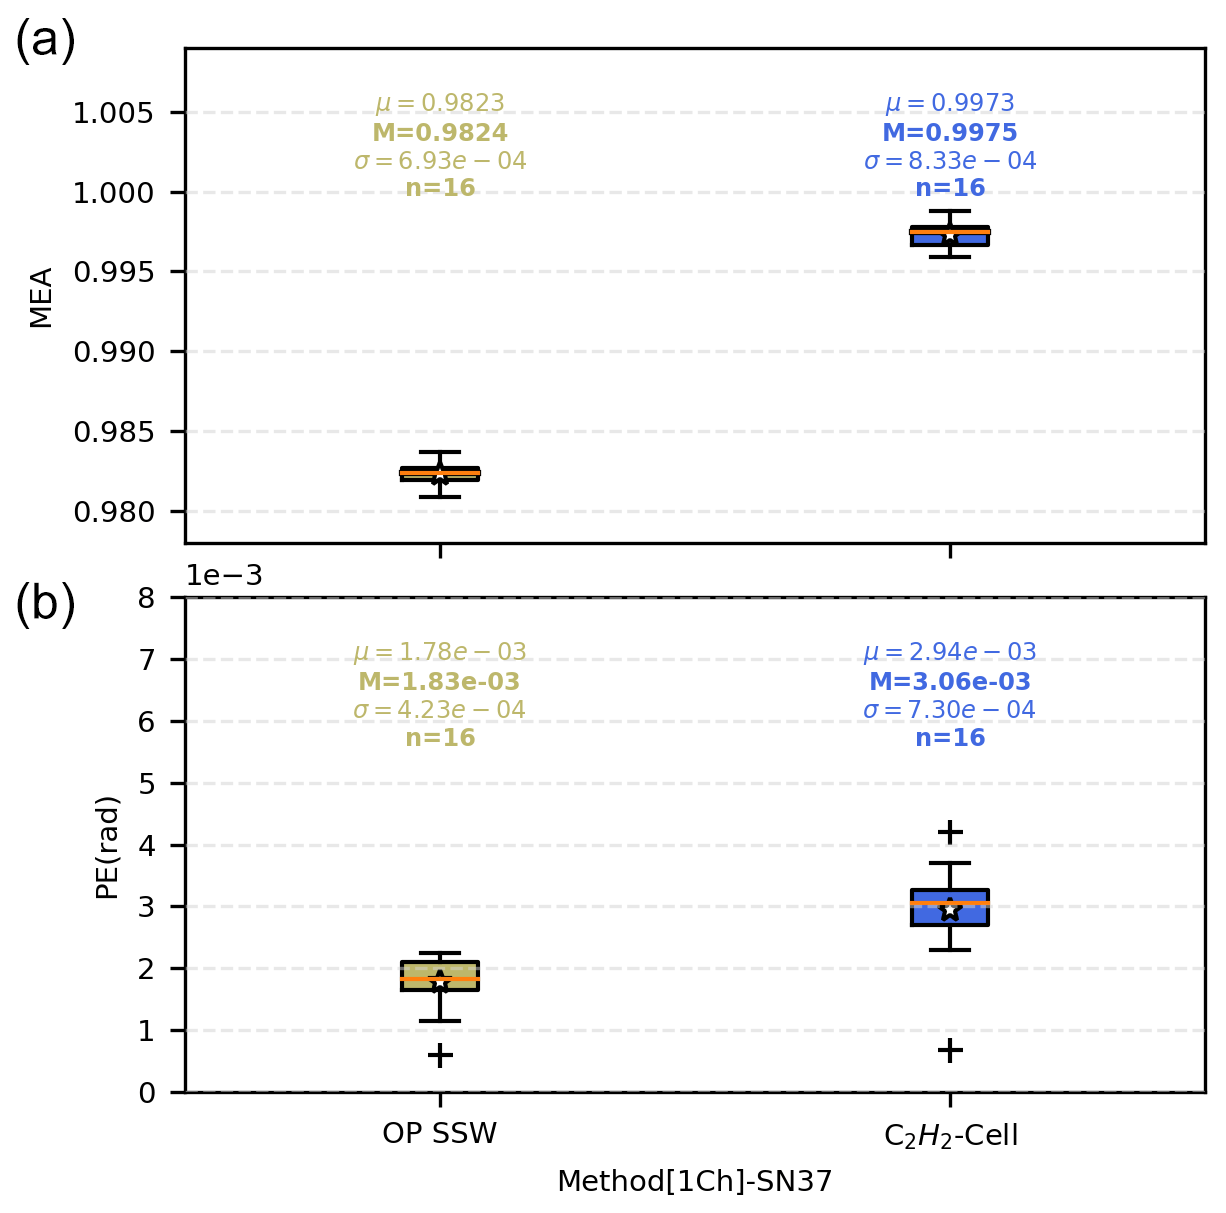
Figure 16Same as Fig. 9 but for the sensitivity study for the COCCON reference instrument SN37. Left part of the display: open-path results; right part: cell results.
Even though the cell method does not provide a significant improvement in the determination of MEA and PE values, we plan to maintain the cell measurements in the calibration procedure. That the cell measurement delivers a column value, which can be measured with excellent precision and provides an invariant for the comparison of different spectrometers, seems a useful addition. The relative 1-sigma standard deviation of the C2H2 column indicated by the repeated measurements is 0.0008 % (individual column results are shown in Fig. 15c).
5.2 Intercomparison of cell results with open-path results
This section summarizes the main results of the ILS characterization for the first channel by using the OP and the cell method for the spectrometers tested since 2020 (see Figs. 17–19). Figure 17 shows the instrumental variation in the MEA and PE, C2H2 column, and rms according to both methods. The MEA retrieved with the cell method is higher and closer to the ideal ILS in comparison with the OP method, which supports the finding discussed in the previous section that the cell method retrieves ∼1.5 % higher MEA values. The C2H2 columns do show more scatter between different spectrometers than the repeated measurements performed using the reference spectrometer, but still is very low, at a level of 0.0003 %. Figure 18 shows the correlation between the OP and the cell MEA and PE results, and Fig. 19 shows a statistical comparison. We find a reasonable correlation, which indicates that despite the tendency that the spectrometers become more uniform in their characteristics, we are still able to detect – using the described laboratory procedures – actual variations in the MEA and PE values. The sensitivities differ between the methods: while the slope of the MEA regression line is compatible with our assumption of a ∼ν1.5 wavenumber dependence of the MEA parameter (see discussion in Sect. 4.3.2), the slope of the PE regression line is surprisingly steep, as we would expect PE to be proportional to wavenumber. However, the spectral scenes are quite different; the C2H2 lines offer a significantly smaller width than the H2O lines. Therefore, the ILS deviations associated with contributions emerging from larger optical path difference (OPD) will gain importance in the C2H2 spectral fitting. The assumption of a constant PE might be too coarse and therefore introduces the observed discrepancy between the two methods. When regarded from this perspective, the continuation of the C2H2 measurements in addition to OP might also become useful for introducing further refinements of the ILS model in the future. Figure 19 summarizes the performance of both methods.
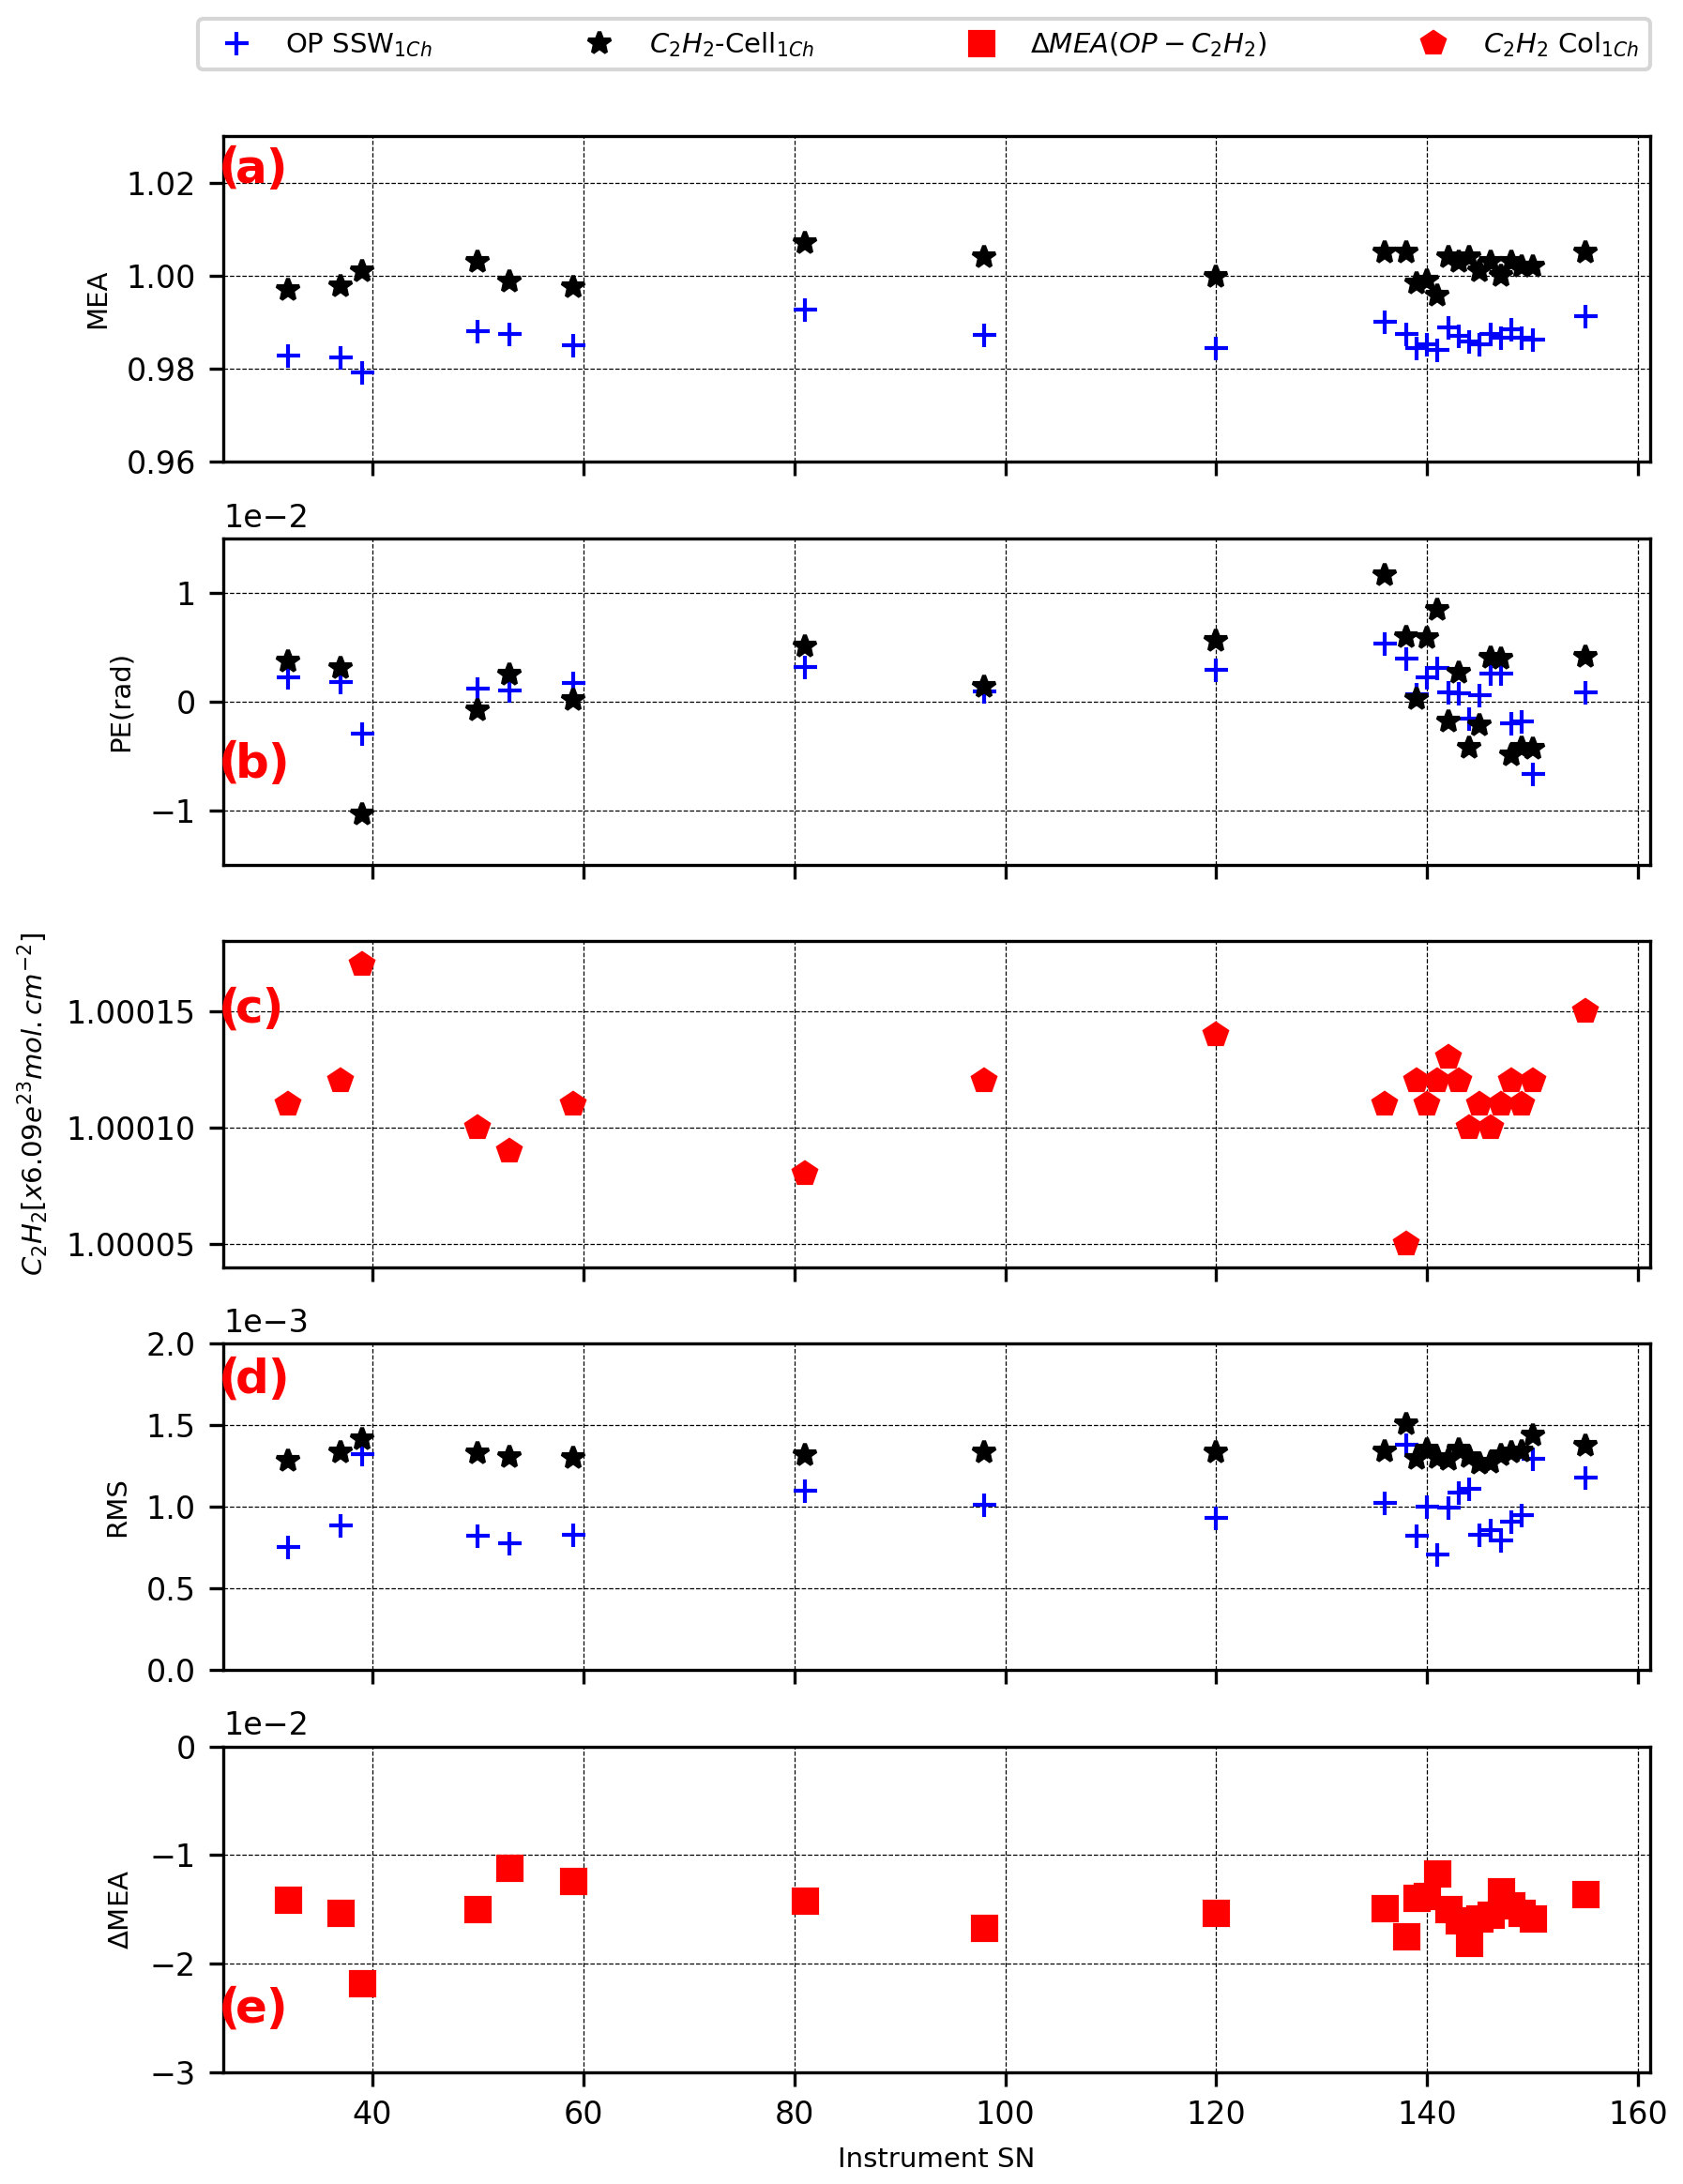
Figure 17The modulation efficiency as a function of the instrumental SN, phase error, C2H2 column, rms of the spectral fit and the relative difference between the open-path method and the cell method are presented in (a), (b), (c), (d) and (e), respectively.
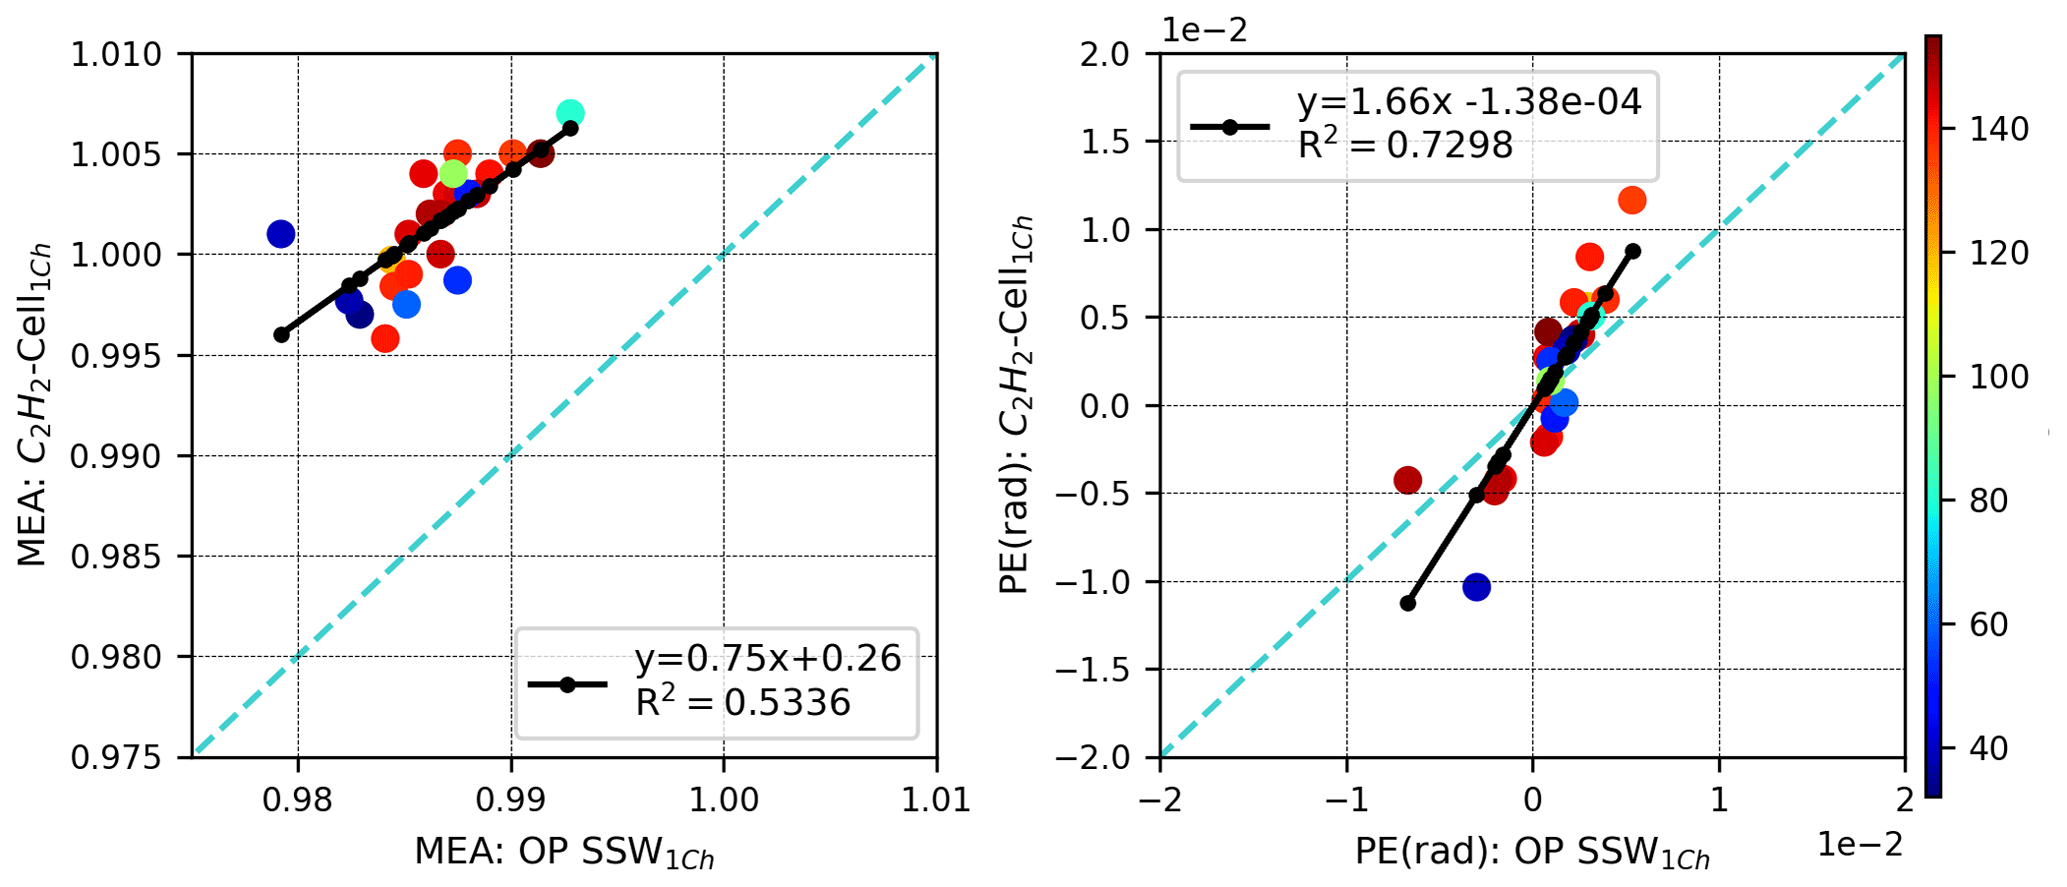
Figure 18Correlations between the MEAs obtained with the OP and cell methods for the first channel.
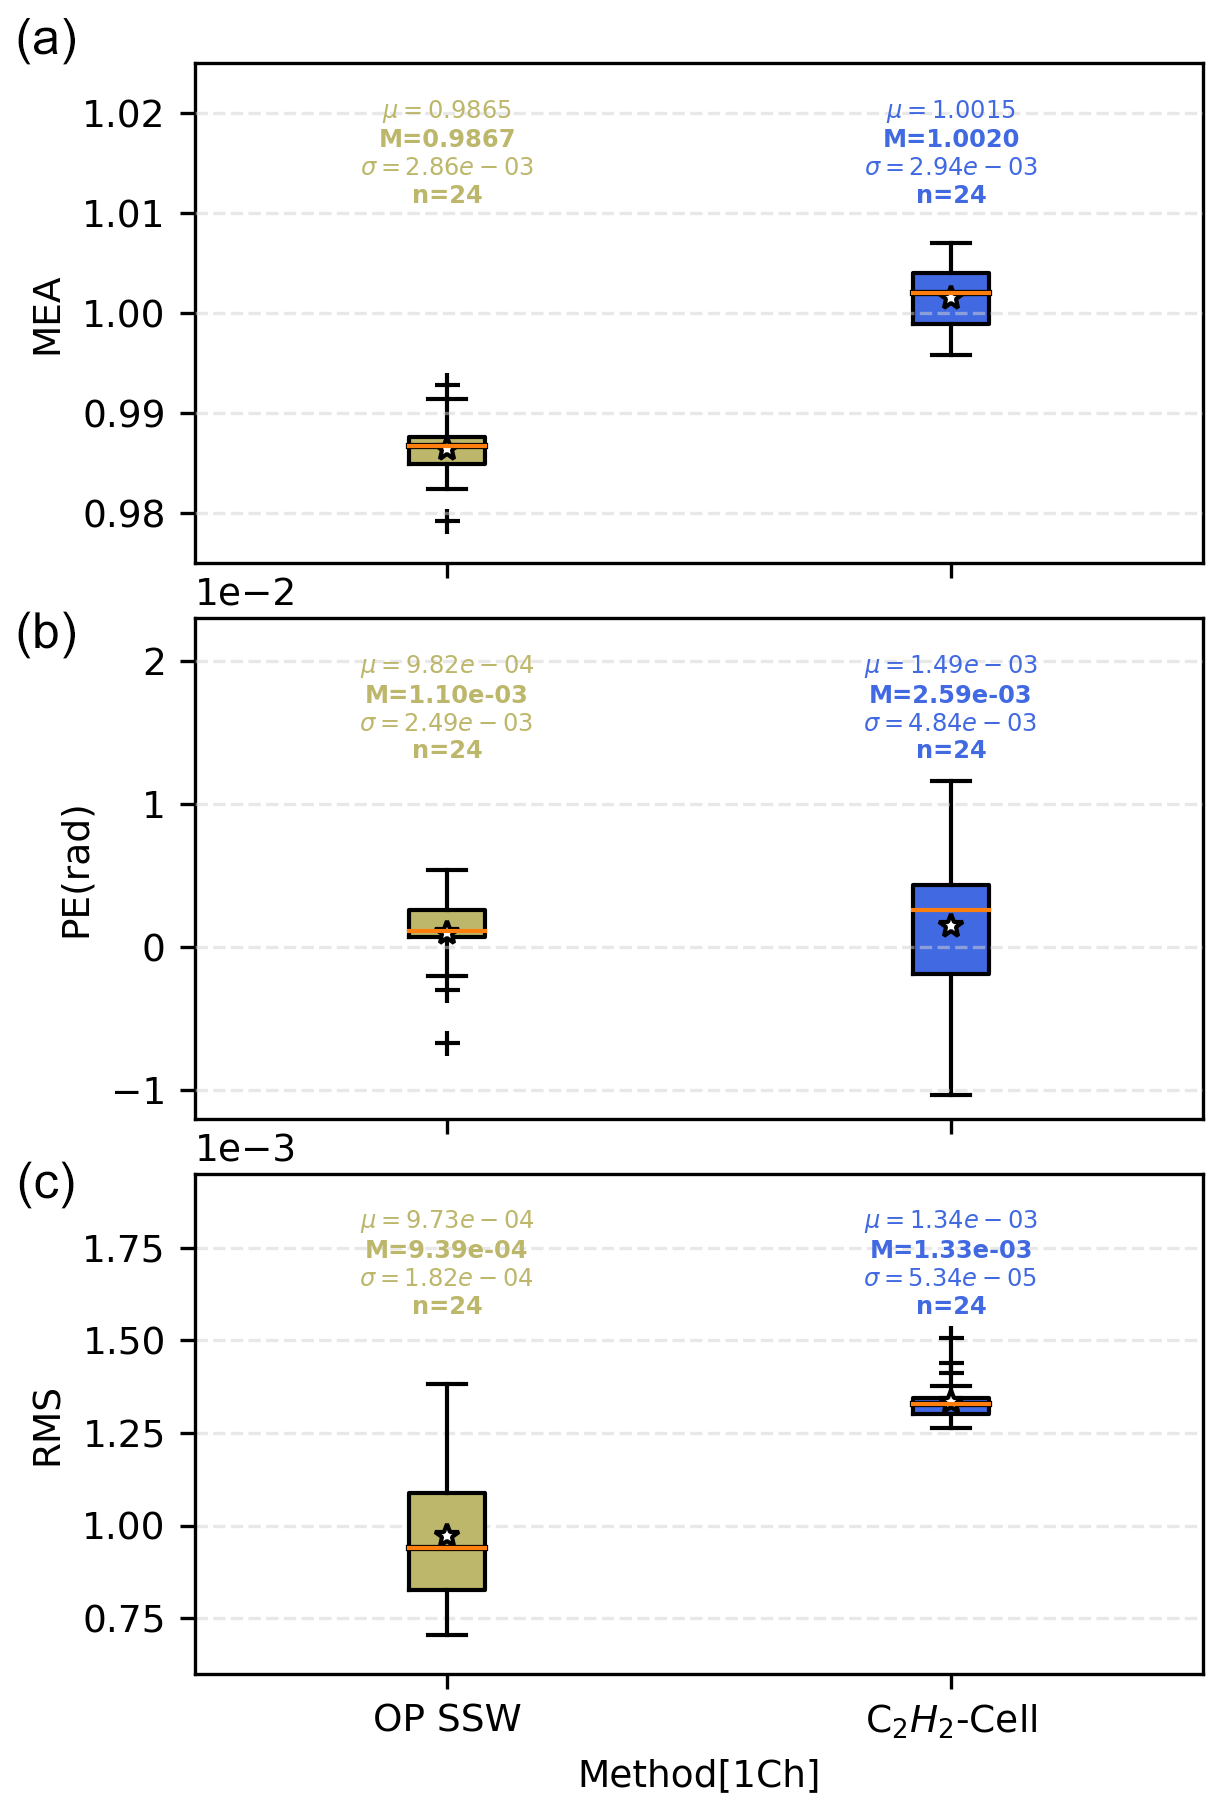
Figure 19MEA and rms statistical results from the ILS retrievals by using the OP and the cell methods for the first channel of the available instruments (left part of the display: open path; right part: cell).
6.1 Long-term stability of reference unit
In this section the historic time series of the COCCON reference instrument SN37 is assessed by comparing the main target gases: XCO2, XCO, XCH4 and XH2O with the results obtained from the high-resolution spectrometer IFS125HR located at KIT Campus North ( N, E, 112 m a.s.l.). This spectrometer contributes to the TCCON network. Two different kinds of measurements were collected with the IFS125HR spectrometer: standard TCCON measurements using a spectral resolution equivalent to max. OPD of 45 cm and double-sided low-resolution spectra for mimicking the EM27/SUN observations (maximum OPD 1.8 cm). The COCCON and the low-resolution data recorded with the IFS125HR were analysed using PROFFAST, while the high-resolution spectra were used for generating the official TCCON product using the GGG software suite version 2014 (Wunch et al., 2015). Because it provides a very sensitive indication for instrumental drifts and operation problems, we also investigate results for XAIR here. This quantity compares the spectroscopically determined dry-air column as extrapolated from the observed vertical column of O2 with the dry-air column calculated from ground pressure and spectroscopically observed water vapour column , as given in Eq. (1).
6.1.1 PROFFAST code and COCCON reference EM27/SUN spectrometer
The initial development and further improvements of the PROFFAST code are supported by the European Space Agency (ESA) in the framework of the COCCON-PROCEEDS project. The code aims at efficient analysis of greenhouse gases from ground-based near-infrared solar absorption spectra. Together with the pre-processing code PREPROCESS, it forms the data analysis chain of COCCON. The code is open source and freely available. It performs least-squares fitting of the spectra by adjusting scaling factors on the a priori profiles of the trace gases and auxiliary parameters. It is important in the context of this work that PROFFAST is capable of taking into account the ILS parameters as determined by the open-path measurements. If this information is neglected, additional scatter between the atmospheric trace gas results achieved with different spectrometers would result, and different gas-specific empirical calibration factors would result from the side-by-side solar observations for each spectrometer (these factors are reported in Sect. 6.2). Additional information on the code is provided by Frey et al. (2021) and Sha et al. (2020).
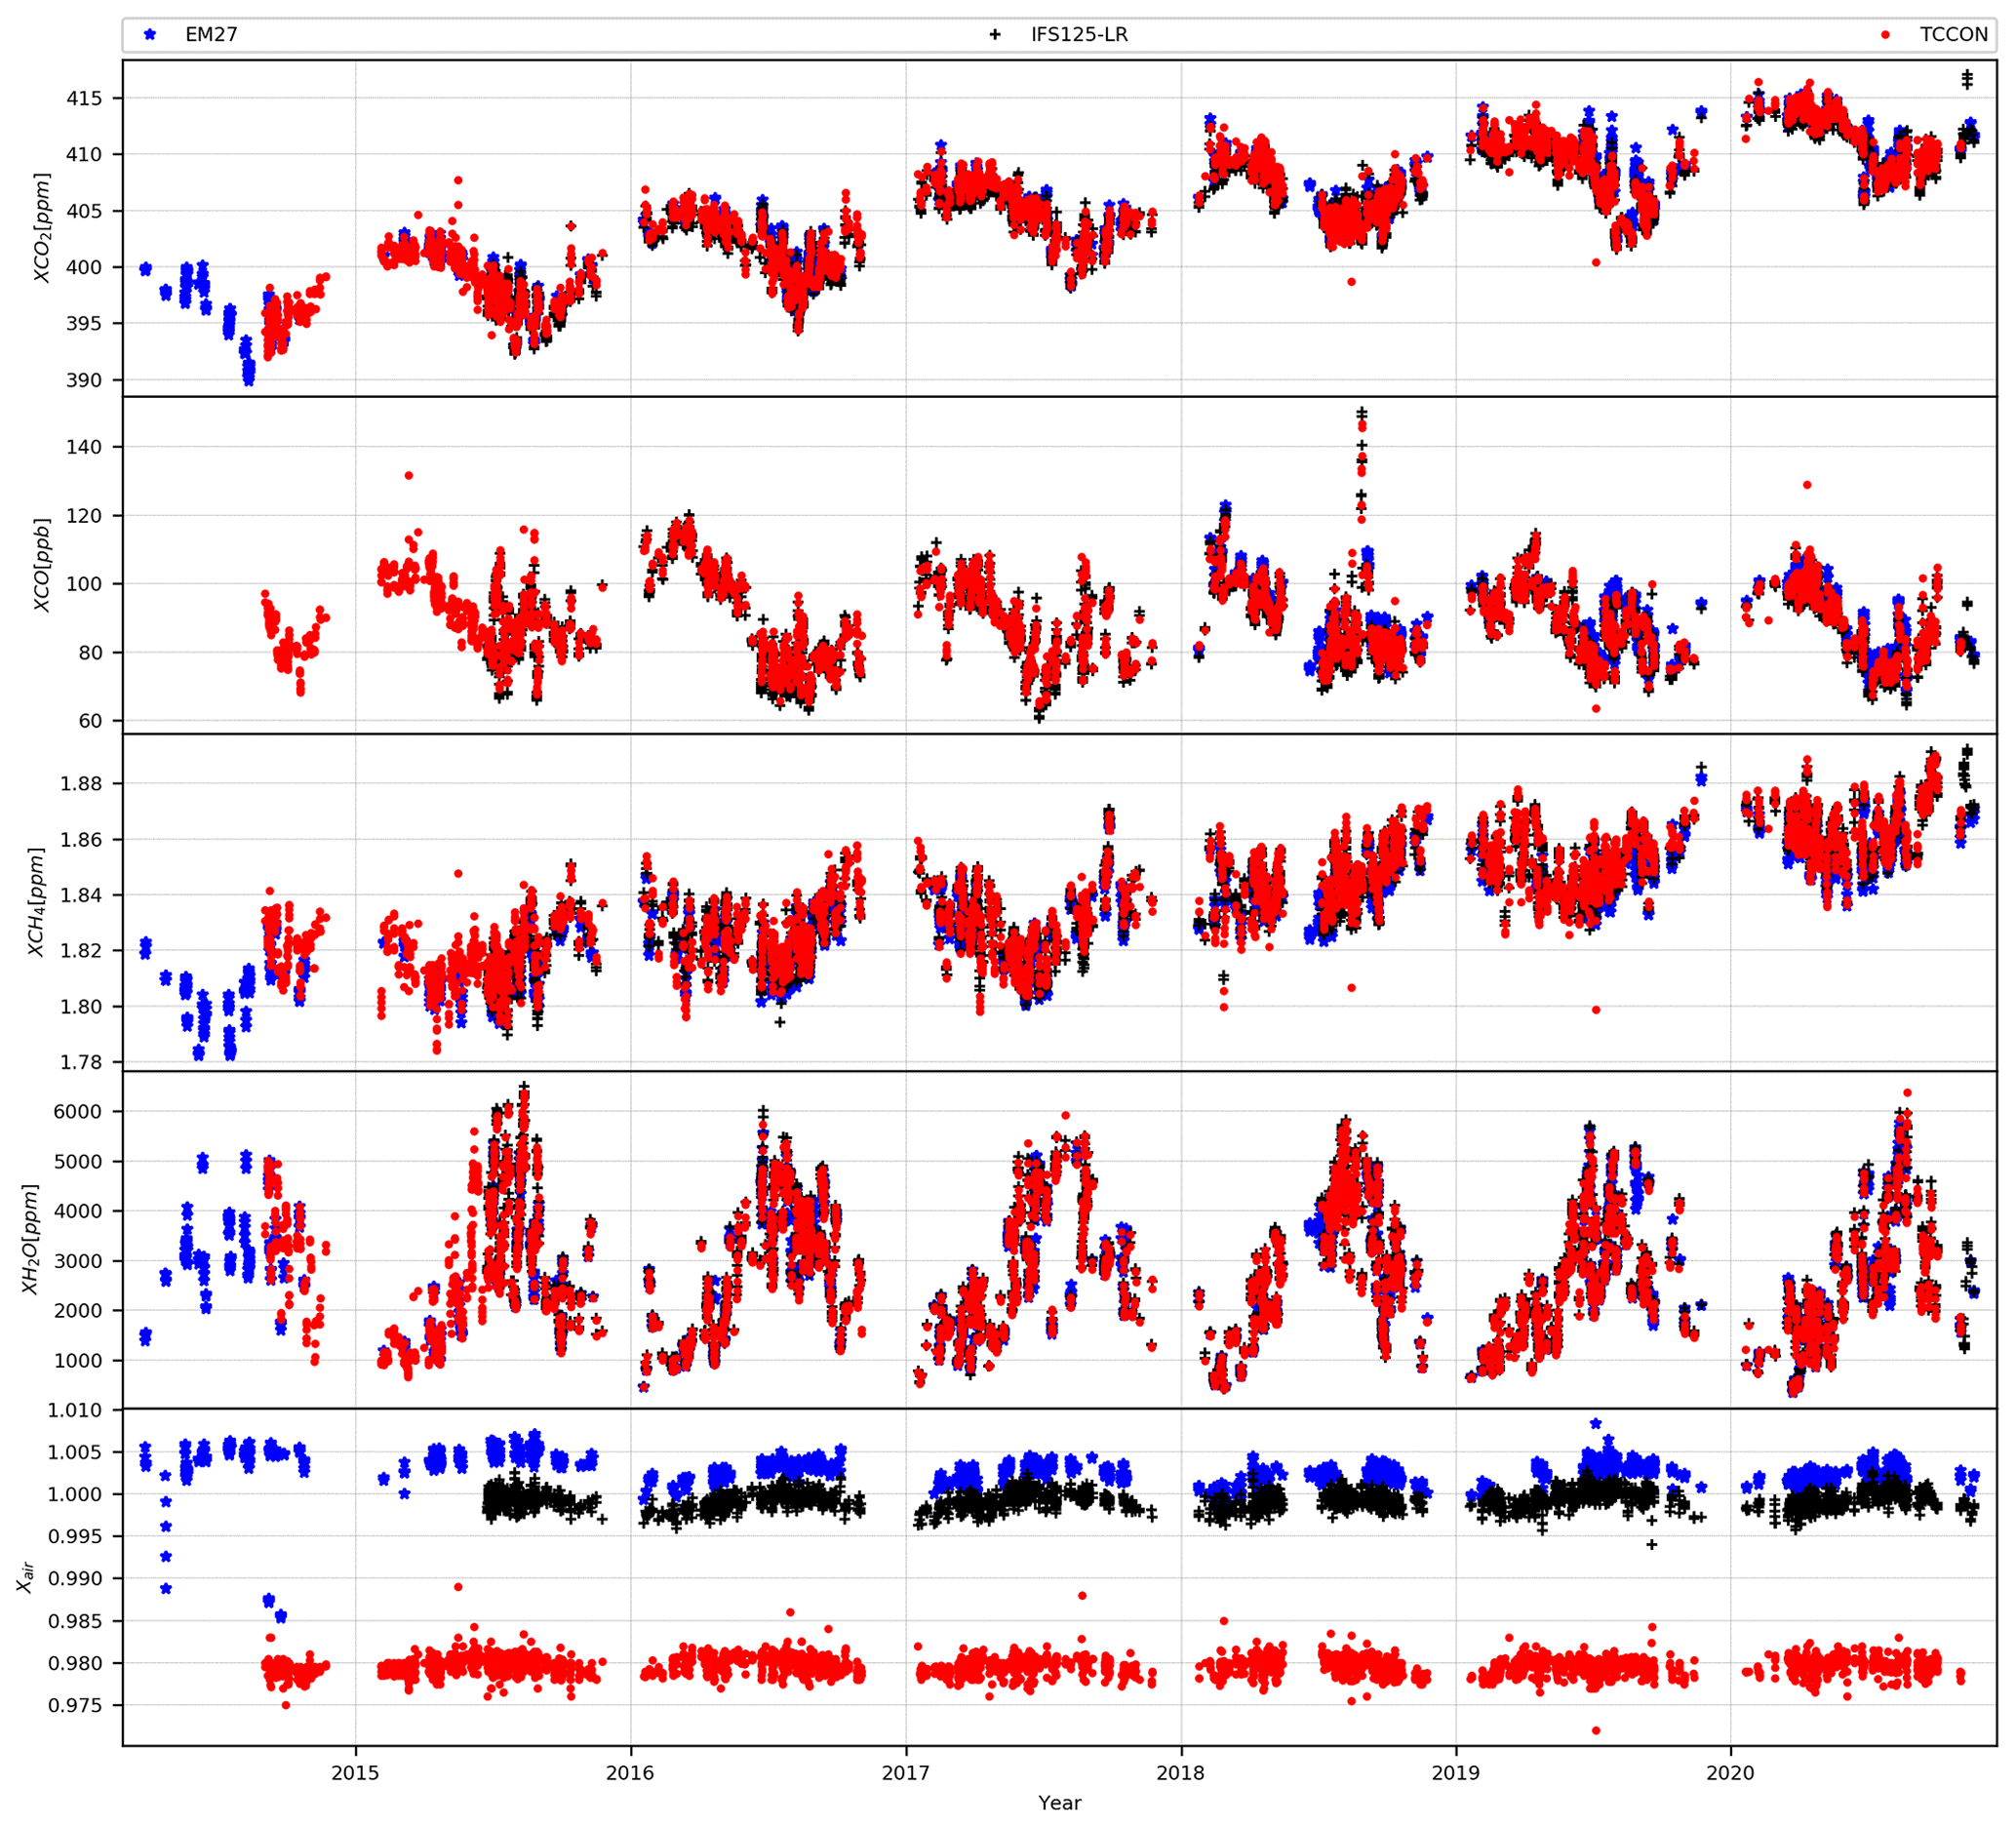
Figure 20Time series of XCO2, XCO, XCH4, XH2O and XAIR measured with the COCCON reference instrument (blue), from the TCCON station Karlsruhe (derived from high-resolution IFS125-HR spectra using GGG2014, red) and derived from low-resolution IFS125-HR spectra (black). The low-resolution measurements were processed with PROFFAST.
The EM27/SUN spectrometer SN37 has served as the COCCON reference spectrometer since 2014. The spectrometer participated in the Berlin campaign (Hase et at., 2015) and was upgraded with the CO channel in early 2018. Figure 20 presents the time series of XCO2, XCO, XCH4, XH2O and XAIR covering 2015 to the end of 2020. Shown are the official TCCON data generated with the GGG2014 software suite and data derived from the low-resolution spectra recorded with the IFS125HR spectrometer and the COCCON reference spectrometer, respectively, using the PROFFAST code. For the target gases, no obvious drifts are noticeable between the different data sets. The bias in XAIR between the TCCON and low-resolution data is due to the trivial fact that XAIR is not generated as a calibrated quantity by GGG2014, while PROFFAST attempts a normalization to unity. However, there is a change of XAIR apparent in the COCCON reference data during the first 4 years, which we investigate further in the next section. We will show that these changes are small enough not to detectably affect the results of the target gases apart from XCH4.
6.1.2 Changes of XAIR in time series of reference spectrometer
Figure 22 shows the variations in XAIR of the COCCON reference unit with respect to the low-resolution IFS125HR data. At least two step changes appear, at the end of 2015 and at the end of 2017. Since 2018, the results appear stable. The step change at the end of 2017 is very likely associated with the CO channel upgrade of the spectrometer, while the earlier event might be associated with a realignment of the spectrometer performed in the winter period after participation of the unit in the Berlin campaign between June and July 2014 (Hase et al., 2015). The analysis of atmospheric spectra collected with the reference unit was performed twice: in one analysis, it was assumed that the ILS is time independent (the ILS parameters used for the analysis were derived from averaging the parameters from all available ILS measurements performed with the reference spectrometer). In the other analysis, yearly values for the ILS parameters were applied as deduced from the available open-path measurements. With the exception of 2015, the XAIR results appear more consistent if time-dependent ILS parameters are used for the data analysis. In 2015, only a single ILS measurement was performed and might for some reason be of inferior quality. A reanalysis of the open-path spectra uncovered at least the use of an erroneous ground pressure value in the original analysis of this measurement reported by Frey et al. (2019) and resulted in less anomalous values for the ILS parameters. The revised set of values (MEA=0.98417 and 0.98430 and and −0.00068 instead of MEA=0.98555 and 0.98940 and and 0.08658) has been used in the current analysis for the 2014 and 2015 period, but the MEA value is still suspiciously high. The OP procedures were less refined in the beginning (e.g. no venting of the spectrometer was performed), so the measurements are less reliable than current OP measurements.
The consideration of the variable ILS brings the XAIR results from 2016 and 2017 in better agreement with the more recent results, with only the 2014 to 2015 period remaining as an outlier. We therefore conclude that the assumption that real ILS changes occurred in the early years due to instrumental interventions and upgrades is the best choice. The results shown in Figs. 20, 21 and 23 all refer to the analysis run using the variable ILS parameters.
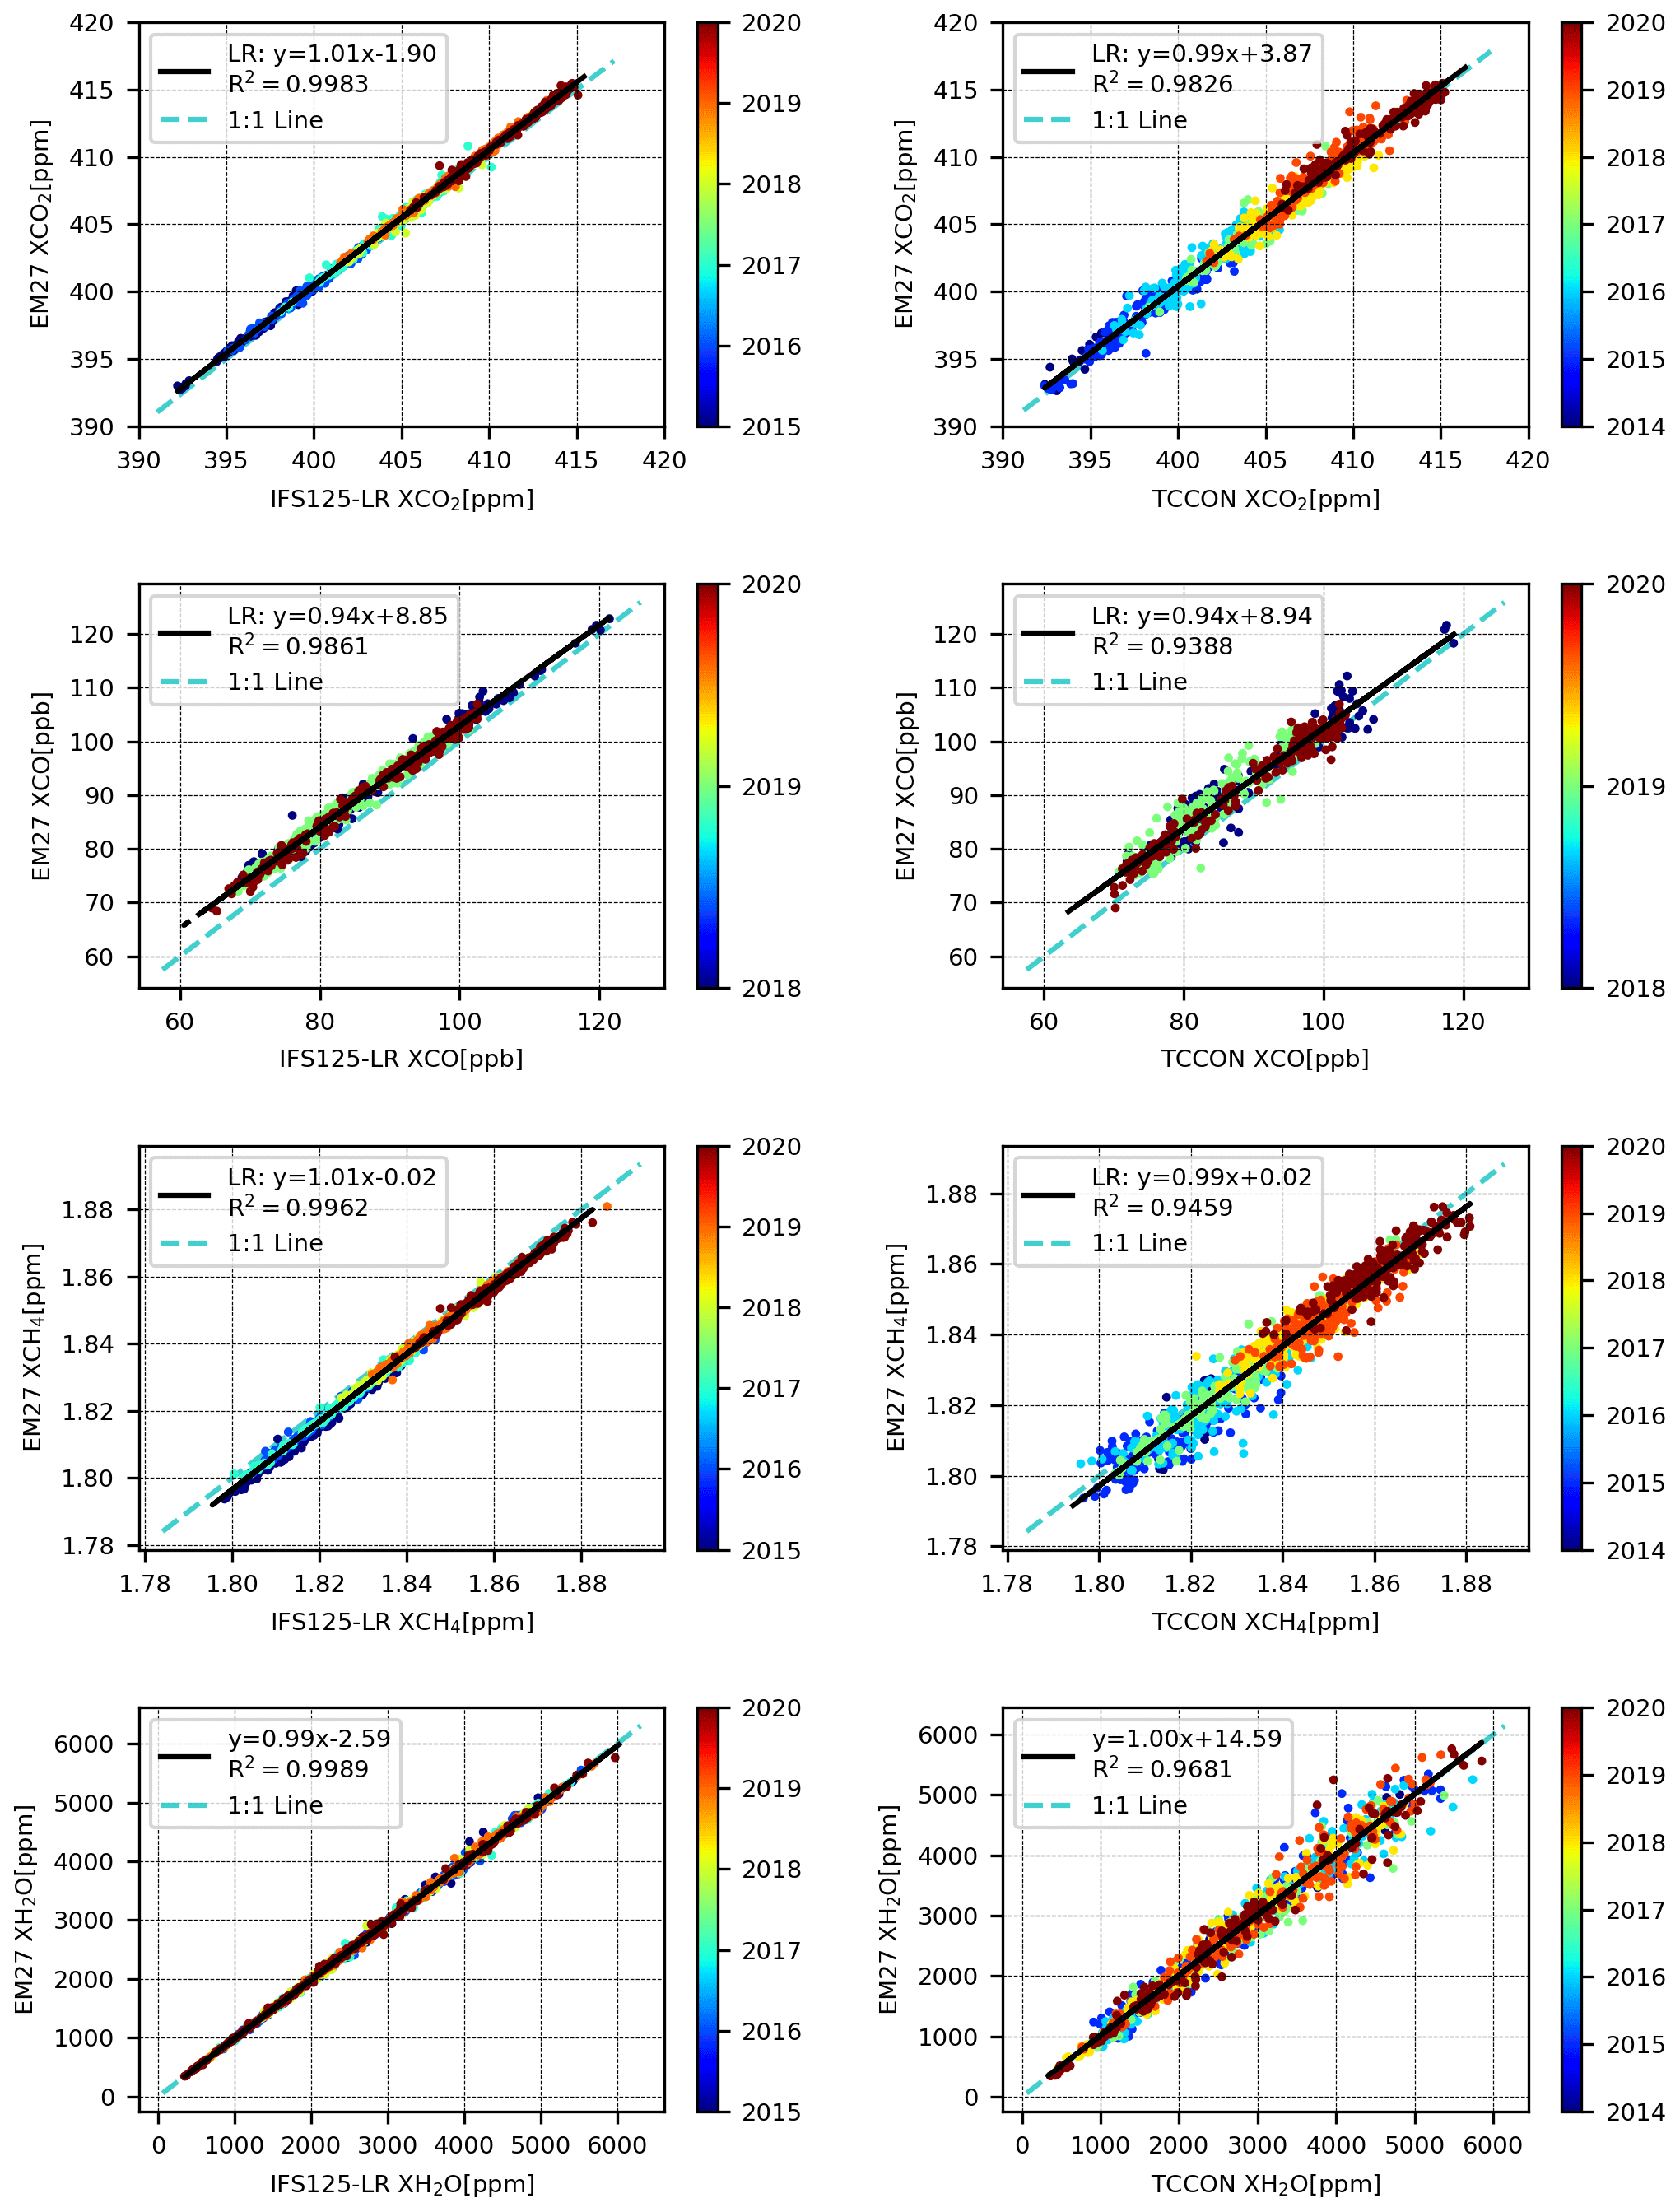
Figure 21Correlations between XCO2, XCO, XCH4 and XH2O between the ones retrieved by using the COCCON reference and the IFS125-LR low-resolution data (left panels) and between COCCON reference and TCCON station (right panels).
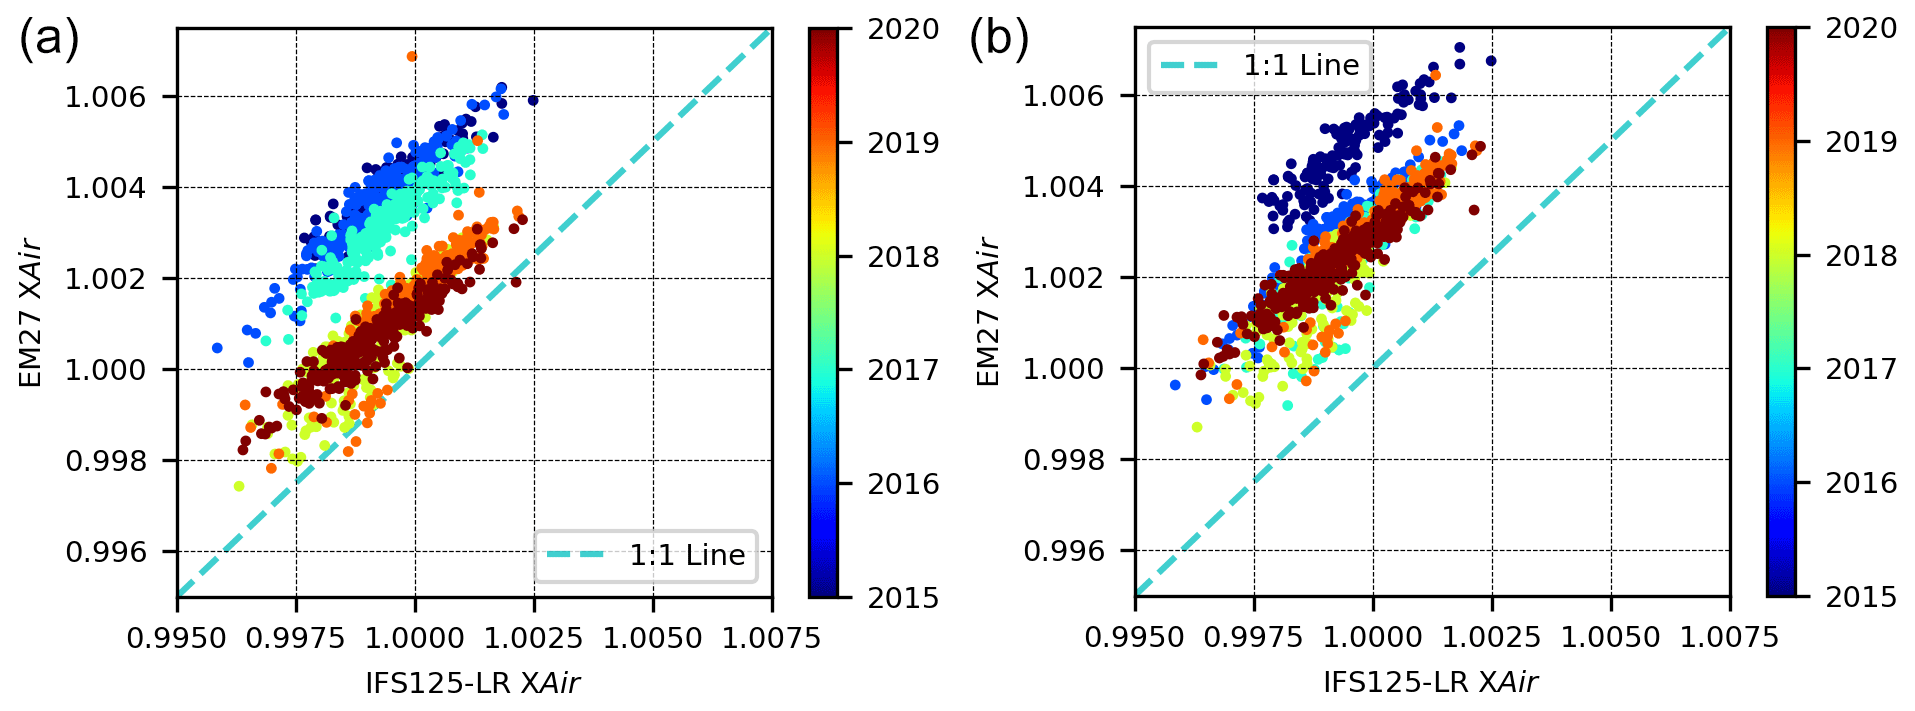
Figure 22Correlations for the retrieved XAIR by using the instrument SN37 and IFS125-LR. Panel (a) shows the results of the analysis of atmospheric spectra under the assumption of a constant ILS, and (b) shows the results under the assumption of a variable ILS (ILS parameters adjusted on a yearly basis).
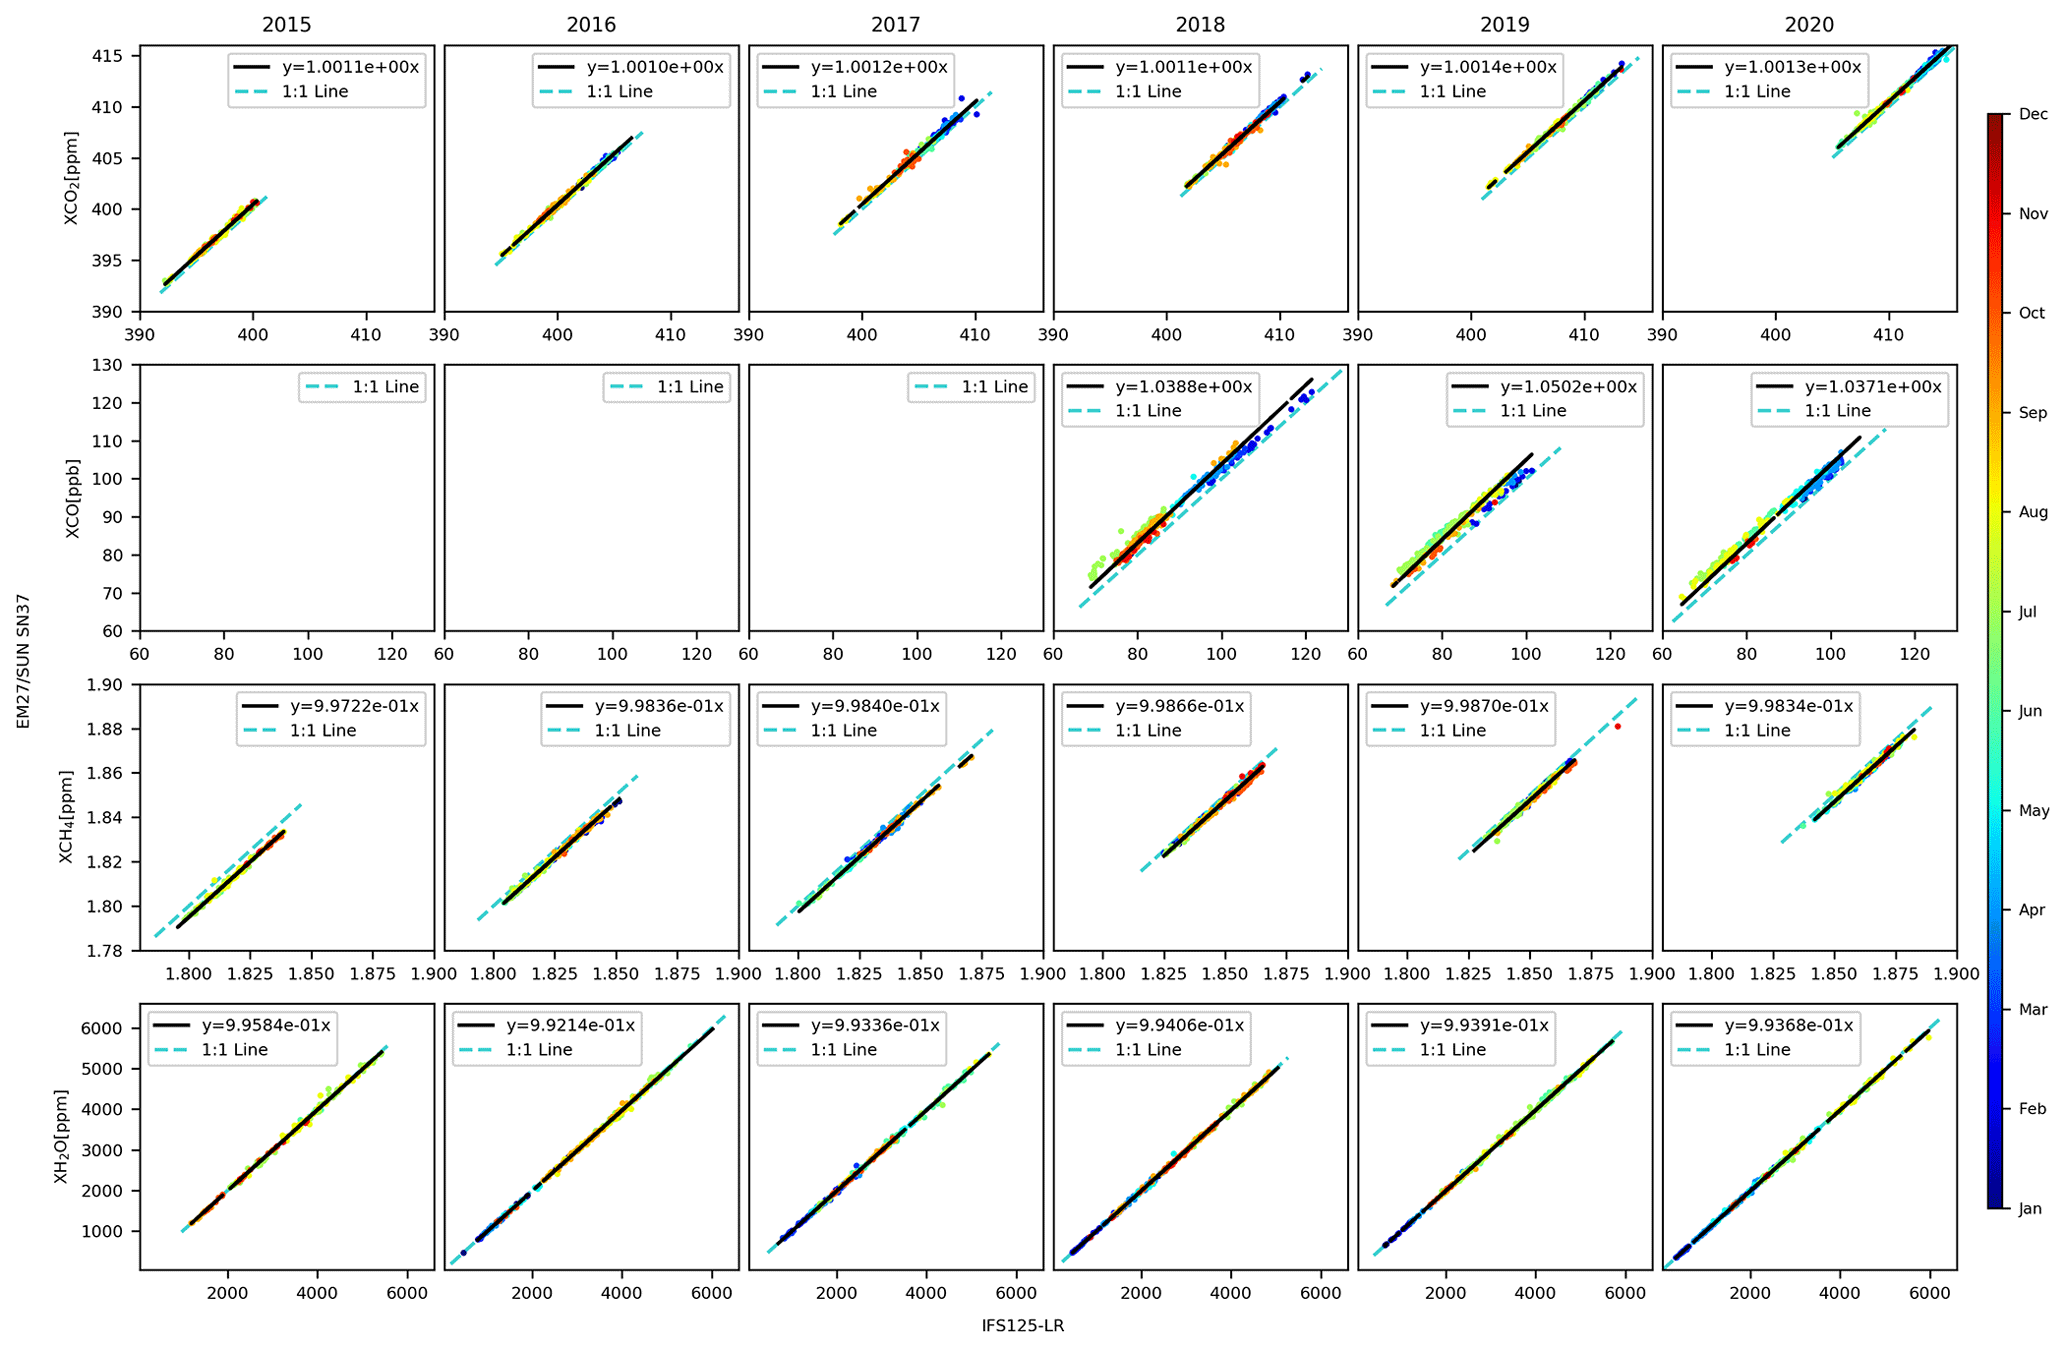
Figure 23Correlations between the species: XCO2, XCO, XCH4 and XH2O retrieved with the COCCON reference instrument and the TCCON instrument in low-resolution measurement mode in each row (top-down), respectively, treated separately by year from 2015 to 2020 in each column for each species.
Figures 21 and 23 investigate the correlation of the retrieved dry-air mole fractions between the reference spectrometer and the data derived from IFS125-LR measurements. While no significant changes are detectable for XCO2, XCO and XH2O, the XCH4 regression line in Fig. 21 is shallower than the 1:1 line. Figure 23 investigates the correlation year by year. Again, the changes for XCH4 become apparent. We therefore assume for the XCH4 time series from the COCCON reference unit the existence of a non-negligible drift over the first years. We assume that the reference spectrometer has reached a stable configuration since 2018, and during this period we use the XCH4 side-by-side results without further corrections. Before this period, we derive from Fig. 23 the existence of a low bias of the reference unit and therefore apply a low XCH4 bias of the reference unit of 0.0001 during 2017, 0.0002 in 2016, and 0.00135 in 2015 (relative detuning of XCH4 calibration). The instrument-specific XCH4 calibration factors provided in Sect. 6.2 and in Table S2 in the Supplement take these corrections of the reference unit into account.
The variable bias of the reference unit's XCH4 despite the fact that a time-dependent ILS is used in the data analysis might indicate that the ILS model currently used by PROFFAST is too simple or that the assumptions made on the wavenumber dependence of the ILS parameters are incorrect (the current version of PROFFAST assumes a linear wavenumber dependence for MEA and PE while the open-path analysis suggests a quadratic dependence for MEA; see Sect. 4.3.1) or that additional influencing factors are affecting the trace gas results.
6.2 Empirical XGAS calibration factors for all tested spectrometers
To harmonize the retrieved species when using any COCCON spectrometer, empirical instrument-specific calibration factors for XCO2, XCO, XCH4 and XH2O are calculated from the side-by-side solar measurements with the reference spectrometer SN37. The instruments are set up on the seventh floor at the Meteorology and Climate Research – Atmospheric Trace Gases and Remote Sensing (IMK-ASF) building located at KIT Campus North ( N, E, 134 m a.s.l.). After the measurements are taken, the data are processed using the PROFFAST software. In this processing, the ILS parameters derived previously from OP measurements are included for both spectrometers, the spectrometer under test and the reference unit. Ideally, the resulting gas abundances measured by the spectrometers would be found to be identical. The residual biases give rise to instrument-specific empirical calibration factors that are reported in the following for each spectrometer and target gas. These empirical adjustments consider all remaining instrumental imperfections which are not properly quantified in the calibration process or not properly reflected in the trace gas analysis.
The correction factors are defined in Eq. (2), where the is the correction factor and is the dry-air amount of a defined gas without any correction for a defined gas and instrument. The correction factors are calculated by comparing a defined gas retrieved with any EM27/SUN instrument with the reference instrument; a linear fit forced to zero intercept is performed, and then the slope is taken as its value.
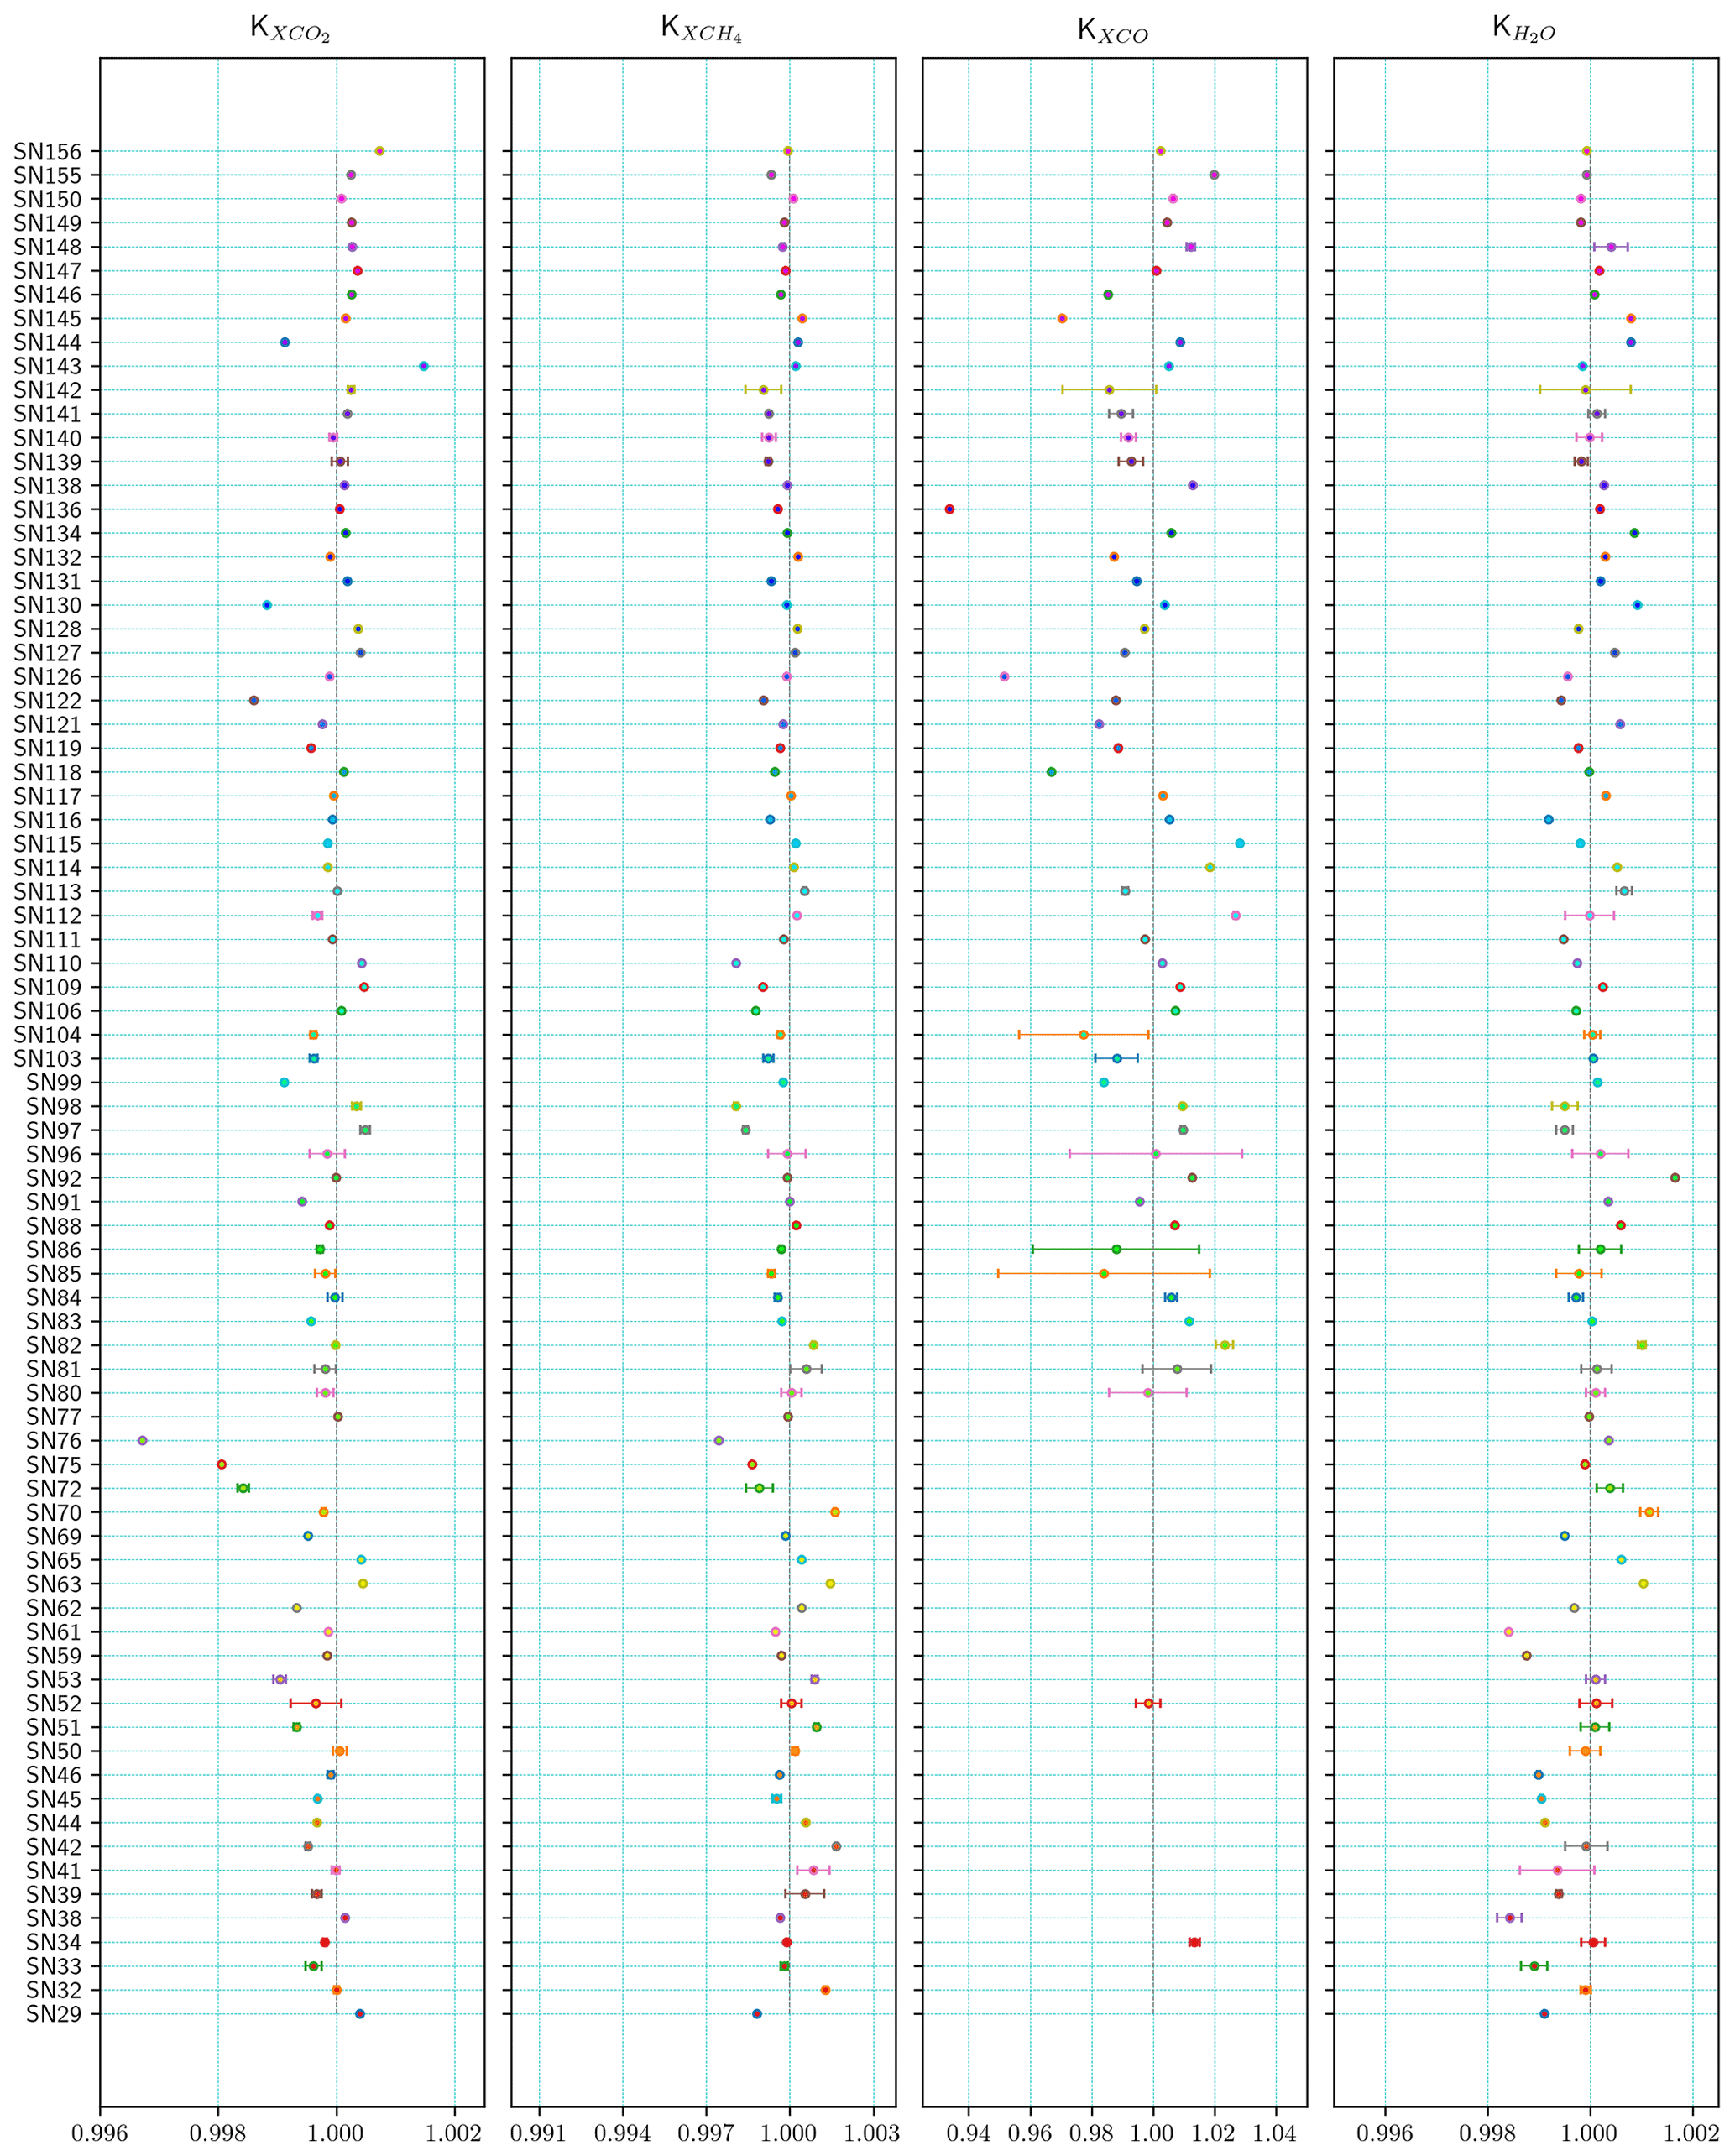
Figure 24Correction factors for XCO2, XCH4, XCO and XH2O from left to right, respectively, calculated for all EM27/SUN spectrometers. The error bar represents the standard deviation, and it is shown only for the instruments with more than one side-by-side measurement in Karlsruhe. The dashed line represents the ideal value “1.0” (practically realized by the COCCON reference spectrometer SN37).
Figure 24 shows and lists the empirical calibration factors for XCO2, XCH4, XCO and XH2O for each spectrometer investigated. Several spectrometers were calibrated repeatedly, in such cases the values are mean values (the individual results are provided in Table S2 in the Supplement). The table also provides the XAIR value for each spectrometer. While the Xgas values are derived from the measurements taken with the spectrometer under test and the reference unit, the XAIR result is independent of the reference unit.
Figure 24 provides a graphical overview of the tabulated values. The 1-sigma error bars are shown if several calibrations were performed on a spectrometer. Similar to what has been observed and discussed before for the ILS parameters (see Sect. 5.1), a trend towards improved consistency of the calibration factors is suggested, especially for XCO2 and XCH4. XCO is a very weak absorber, and therefore the scatter is largely dominated by residual channelling (Blumenstock et al., 2021), which continues to show variable characteristics between individual spectrometers.
6.3 Spectral signal-to-noise ratio of the EM27/SUN spectrometers
In order to assess the distribution of the spectral signal-to-noise ratio (SNR) of different instruments, these values were calculated for both solar and laboratory spectra. For both cases the SNR is calculated for several spectral windows covering both detector channels. The procedure applied is based on the formula described in the Bruker OPUS © software manual (Bruker, 2017); the SNR is calculated from the ratio of two consecutively measured spectra. A wavenumber region largely free of absorption gases lines is selected. A parabola is fitted to the ratio spectrum in the investigated spectral window and serves as a nominal signal. The rms of the fit residuals is calculated. This rms value is divided by to deliver the SNR of a single spectrum (because a pair of spectra is used in the procedure). The wavenumber ranges used for each kind of measurements in each channel are provided in Table 4. It is important to mention that for the evaluation of the SNR in solar measurements, two spectra recorded during noontime were selected in order to minimize the variability of the solar zenith angle and to use spectra recorded when solar intensity is maximal. For both solar and laboratory open-path spectra, 10 scans recorded with 10 kHz scan speed were coadded (total integration time 1 min).
Table 4Description of the wavenumber region utilized for each channel and for each kind of measurement.
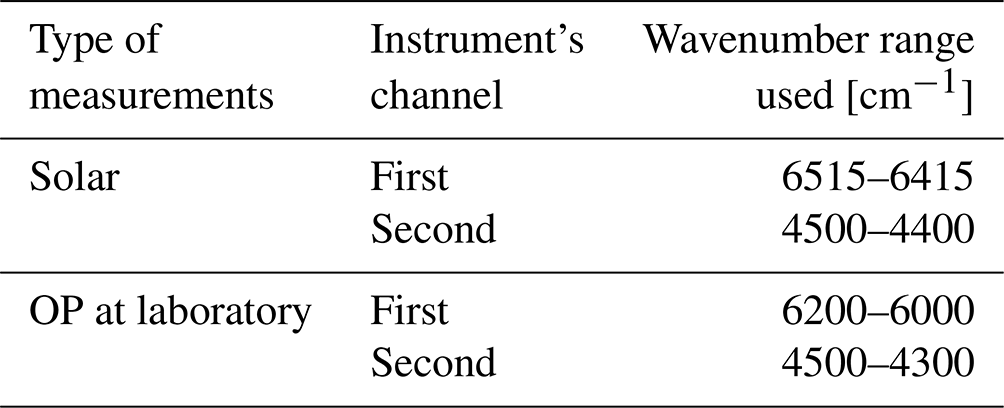
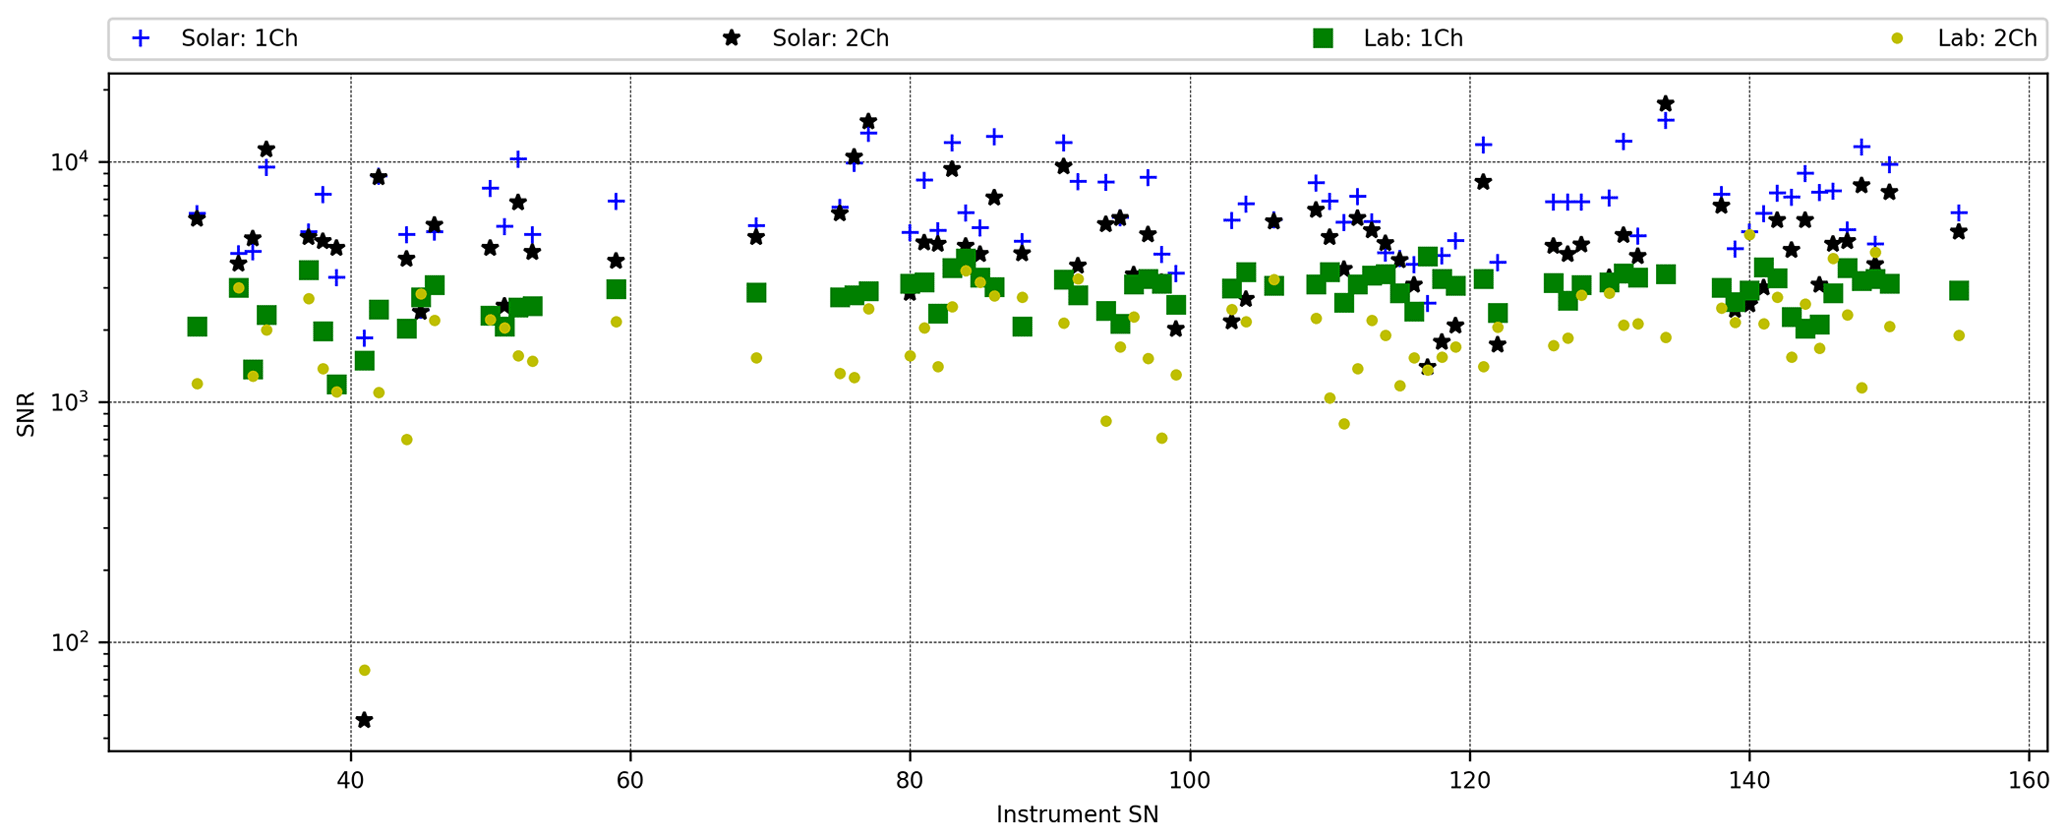
Figure 25Instrumental distribution of the SNR for both channels with both kinds of measurements: solar and OP in the laboratory.
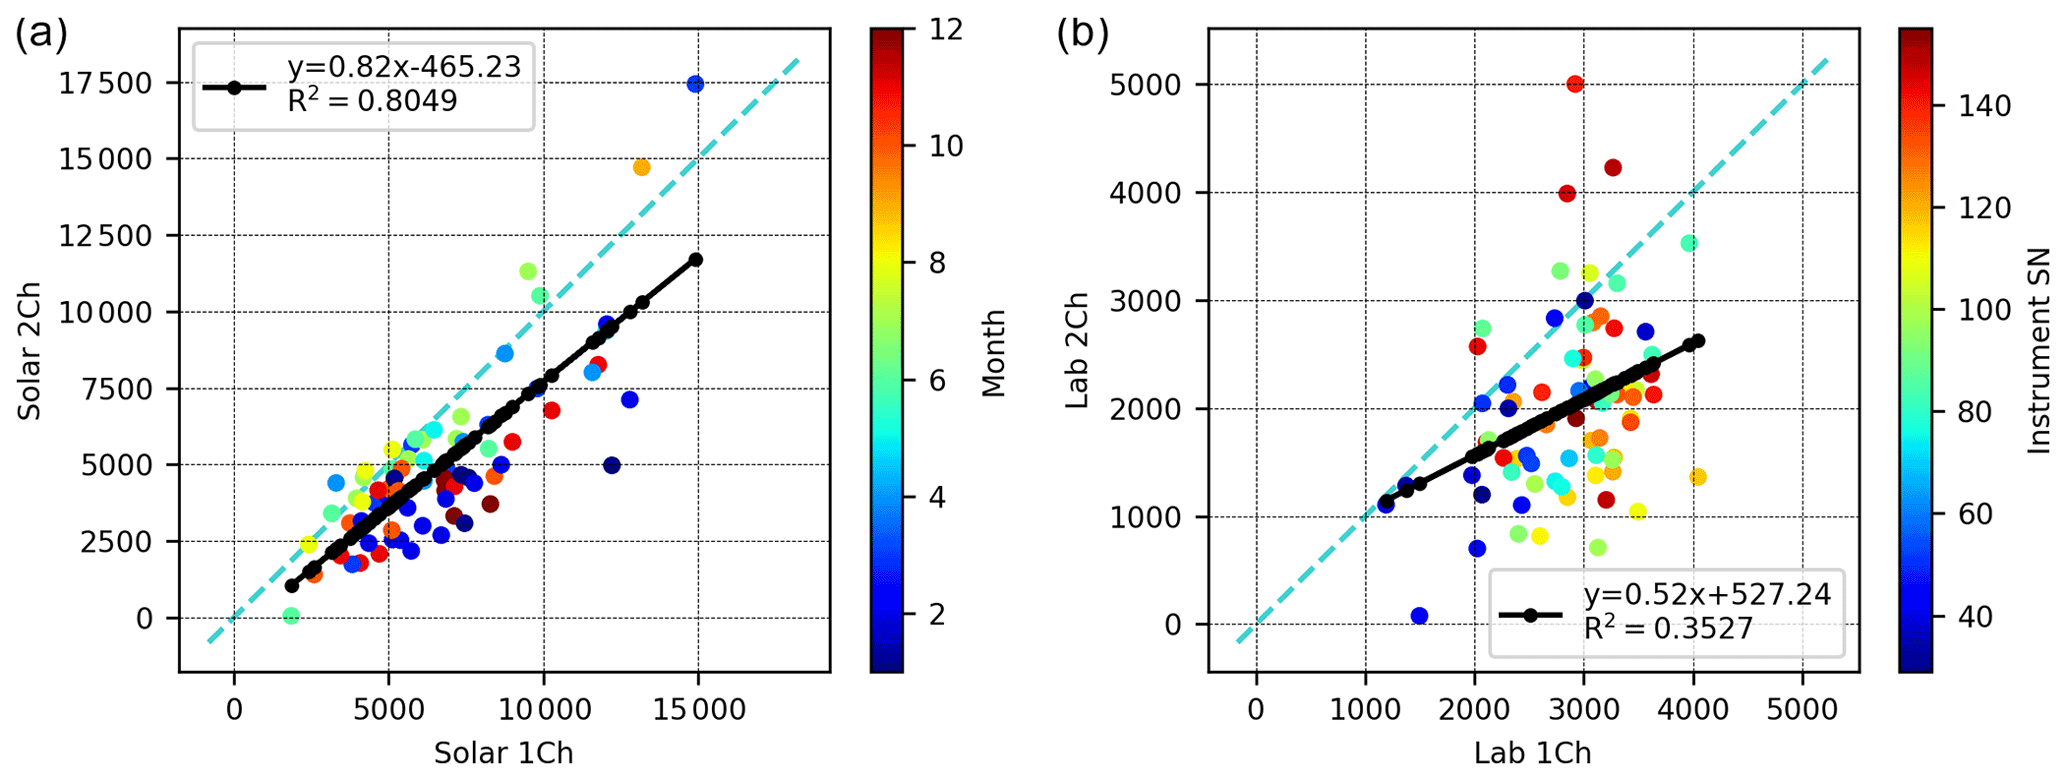
Figure 26Correlations of the SNR obtained in channels 1 and 2, for the solar and OP measurements in (a) and (b), respectively. In (a) the colour code represents the month of the year when the solar measurements were carried out, for demonstrating the absence of an obvious seasonal signal in the SNR characteristics. In (b), the colour code represents the instrument's serial number because these measurements are carried out under controlled laboratory conditions by using a lamp as a light source. There might be a slight tendency towards higher SNR in recently built spectrometers.
In Fig. 25, the SNR values in the selected spectral regions and both kinds of measurements – open-path and solar – are presented. For the solar measurements higher scatter of the SNR is found in comparison with the OP laboratory measurements, which are more consistent. The SNR values of the solar measurements show a much stronger correlation between the two channels than the SNR values of the open-path measurements (see Fig. 26). This higher level of correlation is expected if the variable SNR is due to variable weather conditions. Therefore, the SNR values deduced from the open-path measurements are better suited as an indicator of the SNR performance of each spectrometer. However, even for the laboratory measurements we expect some artificial variability, as the preamplifier stages are not identical. As a consequence different pre-gain and gain settings were used for optimally exploitation of the analog-to-digital converter (ADC) range. Nevertheless, we can conclude that the SNR typically achieved by the EM27/SUN in a solar spectrum spans the 3000 to 10 000 cm−1 range, and the SNR of a laboratory open-path spectrum is in the 2000 to 4000 cm−1 range for the main channel and 1000 to 3000 cm−1 for the CO channel.
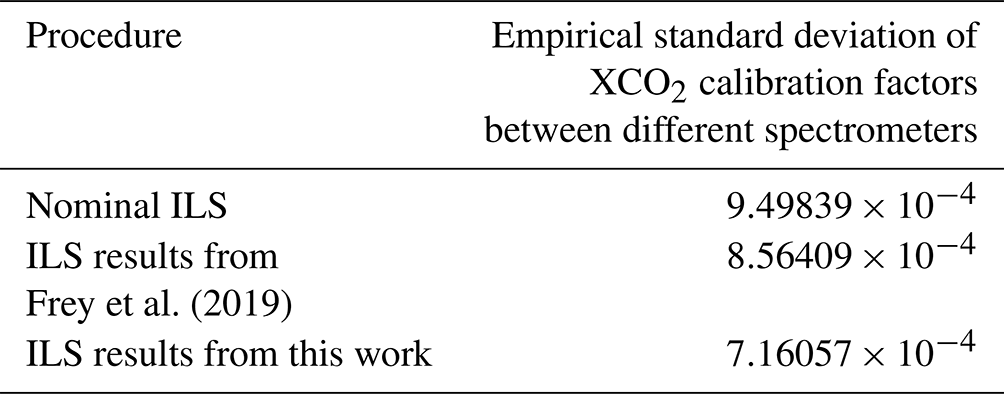
6.4 Effects of improved calibration procedures on XCO2 calibration
Ideally, the explicit description of the instrumental characteristics from the nominal behaviour as resulting from the calibration procedure would remove any discrepancy between Xgas results derived from different EM27/SUN spectrometers. Instrument-specific calibration factors for each gas as provided in Table S2 in the Supplement would not be required (they would have identical values across different spectrometers). In practice, this is not achievable; instead, the values should be reported and used in the retrieval work. This is due to the fact that (1) the use of instrument-specific ILS parameters very likely does not cover all kinds of possible instrumental imperfections and (2) the ILS description resulting from the calibration procedure itself has limited accuracy.
This opens up a way to test for verifying progress made in the calibration procedure; as such, progress is expected to make the resulting XGAS calibration factors more uniform across different spectrometers. However, the quality of the XCO calibration is limited by other factors not treated in this work: the main impact factor being weak channelling in the spectra (Blumenstock et al., 2021), because CO is a very weak absorber. In case of XCH4, we unfortunately face the drift of the reference spectrometer calibration during the early years; see Sect. 6.1. Therefore, the instrument-specific XCO2 calibration factor appears to be the best available diagnostic. Table 5 provides the scatter of the gas-specific calibration factor for XCO2 between different spectrometers following three different recipes: (1) assuming nominal ILS parameters, (2) using the ILS parameters of the previous work by Frey et al. (2019) and (3) using the ILS results obtained in this study. The numbers indicate that either method developing instrument-specific ILS parameters delivers more consistent calibration factors than the “nominal ILS” assumption, and the refined calibration approach creates the least amount of scatter.
Table 5Impact of ILS parameters on XCO2 calibration factors (this statistic encompasses the subset of spectrometers that has been treated in the study by Frey et al., 2019).
The analysis of the open-path measurements for deriving the ILS parameters of EM27/SUN FTIR spectrometers was improved, and all previous laboratory open-path measurements for the determination of ILS parameters were reanalysed. The revised empirical H2O line list allows for a significant reduction of fit residuals. The addition of a second spectral window, which can be observed in both channels of the EM27/SUN spectrometer, allows us to identify and quantify significant CO detector misalignments. We recommend the application of this new refined procedure for characterizing the ILS parameters of the EM27/SUN FTIR spectrometer from open-path measurements.
In addition to the open-path measurements, a cell filled with C2H2 was constructed and put into service. The cell measurement can be performed in sequence with the open-path measurement without significant additional effort. It offers similar sensitivity to the ILS parameters and adds redundancy to the calibration process, and the C2H2 column is expected to be invariant for all EM27/SUN spectrometers. We find an excellent agreement of the retrieved column amount between different spectrometers (1-sigma scatter on the order of 0.01 %; see Fig. 15c). Based on these encouraging results, we plan to circulate C2H2 cells for demonstrating the level of temporal stability of individual spectrometers and the level of instrument-to-instrument consistency across the network.
The stability of the COCCON reference spectrometer was investigated, and variations in XAIR were found in the 2015–2017 period. This variability has a non-negligible impact on the XCH4 calibration results during this period of up to 0.14 %. All previous side-by-side measurements reported by Frey et al. (2019) were reanalysed, using the revised ILS parameters and incorporating the correction of the XCH4 calibration factors for the 2015–2017 period.
Forty-seven new spectrometers were calibrated before going into operation, and several previously investigated spectrometers were recalibrated. The resulting ILS parameters and empirical calibration factors for each target gas are reported. We finally investigated the typical spectral SNR achieved by the EM27/SUN spectrometer in solar and open-path measurements.
We notice a tendency towards improved, more consistent performance of recent EM27/SUN spectrometers. We believe that the continued refinement and continuous application of the quality assurance procedures performed by COCCON in cooperation with the manufacturer of the spectrometers, Bruker, support this tendency.

Figure A1H2O spectroscopic lines used for this ILS calibration study. The fits (multi-spectrum fit performed) using HITRAN 2016 and the new empirical COCCON line list are presented in (a, b) and (c, d), respectively. The measured spectra were taken with the IFS125HR at KIT Karlsruhe, at 15 ∘C. The spectral residuals shown are multiplied by 5 in order to be visible.
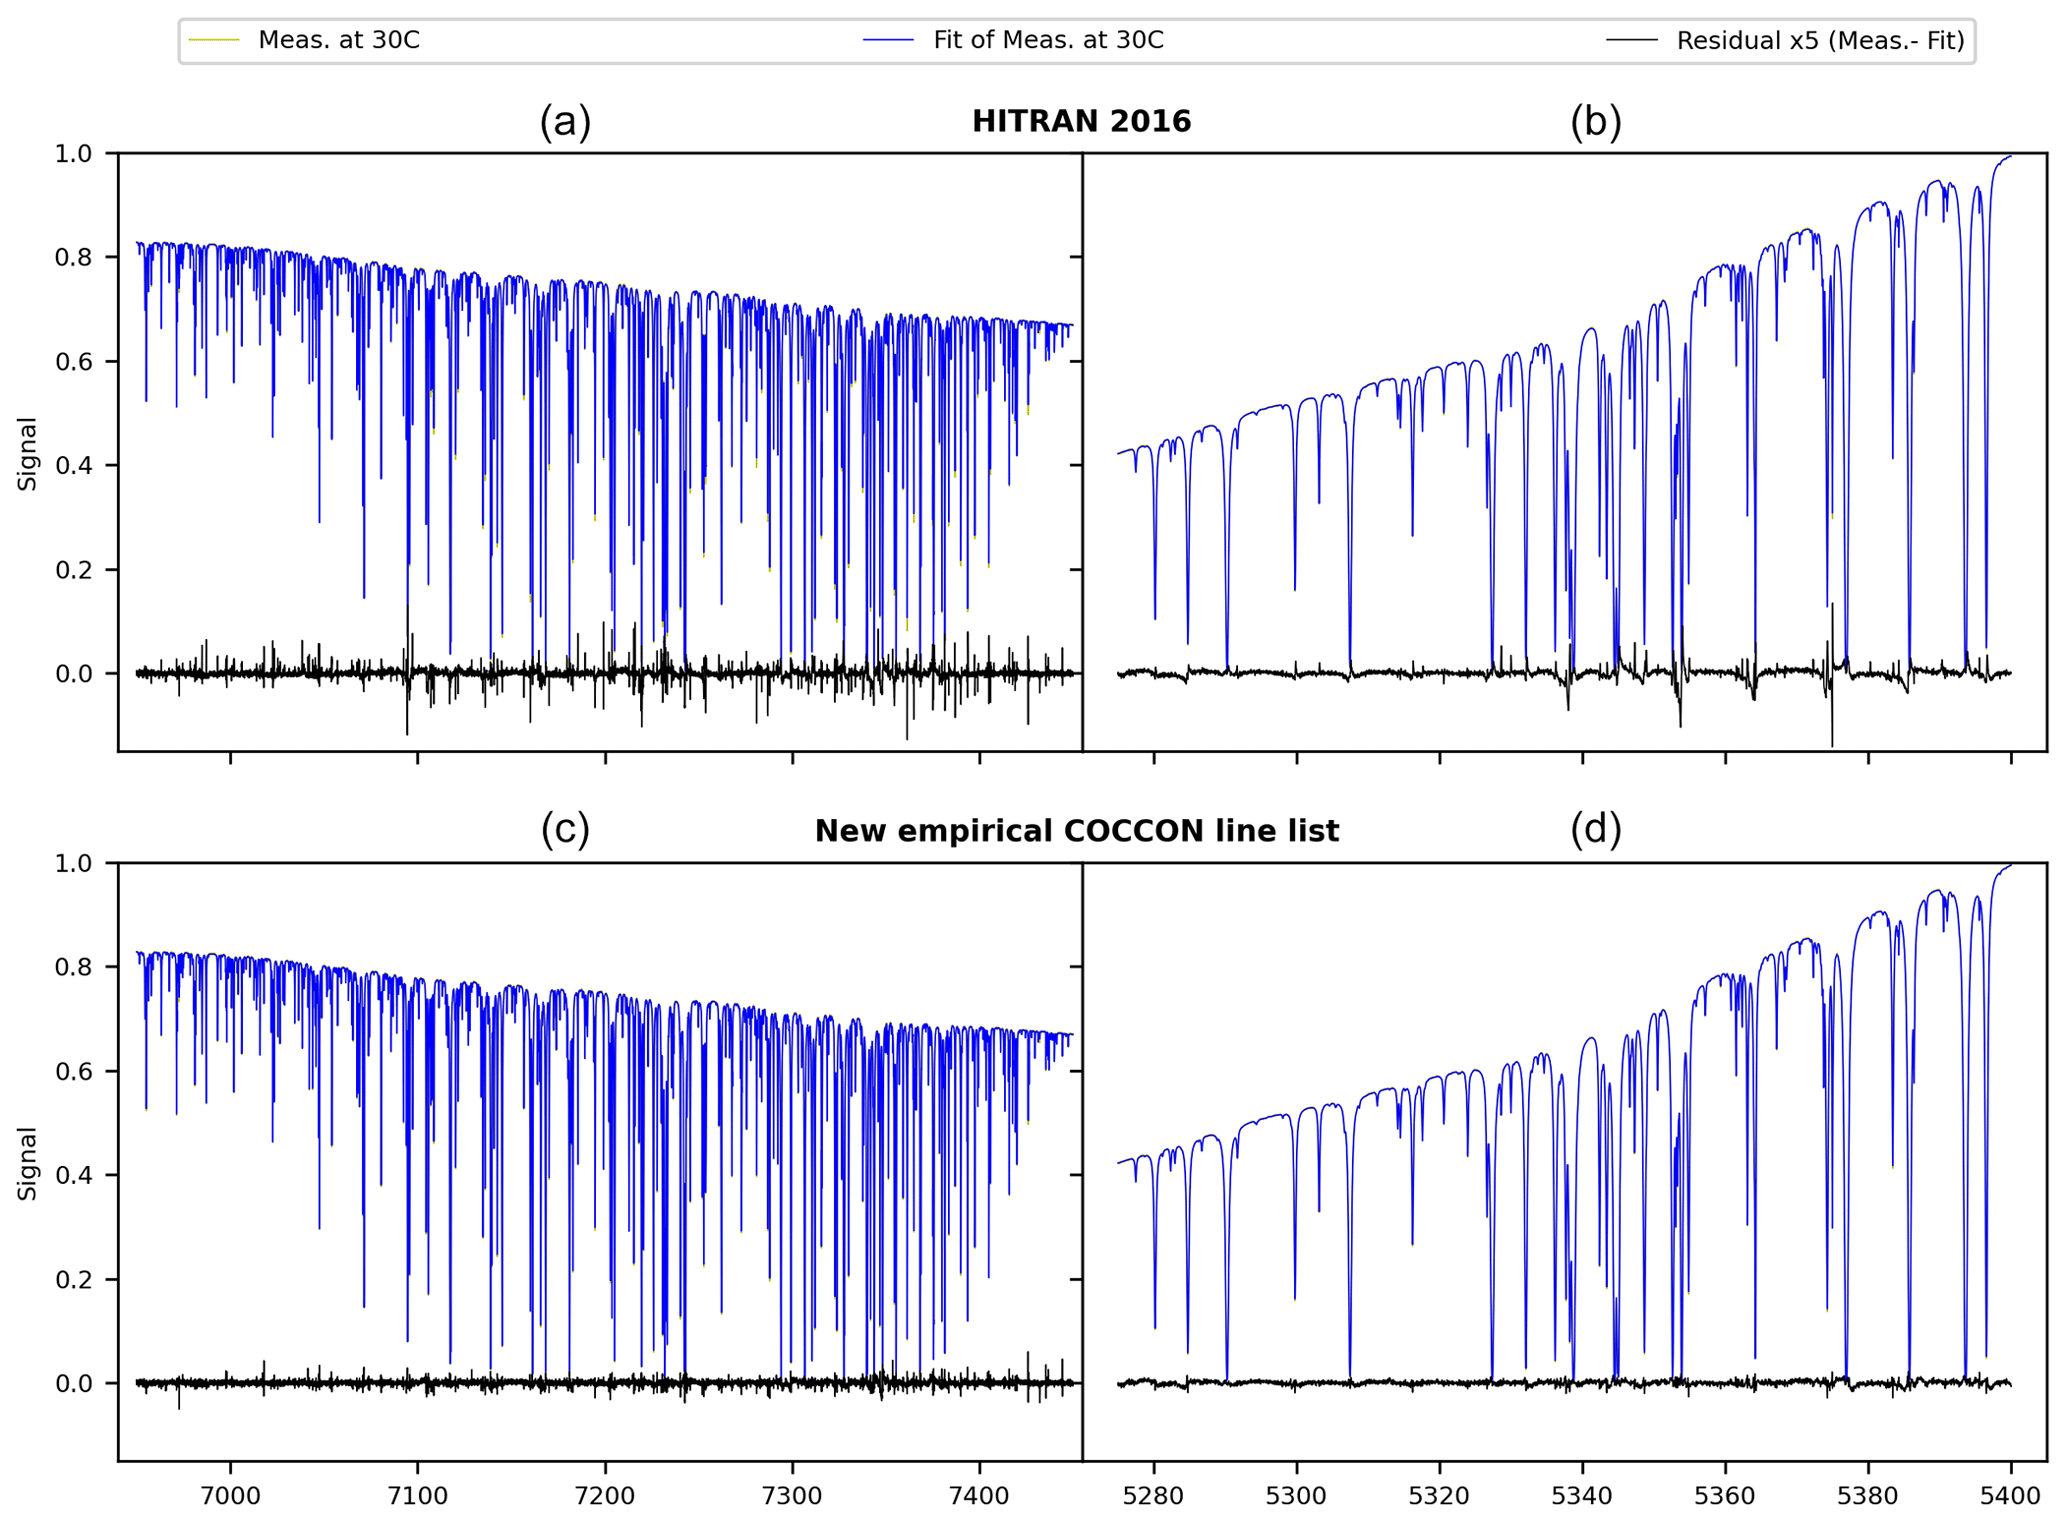
Figure A2Same as Fig. A1, but the measured spectra were taken with the IFS125HR at KIT Karlsruhe, at 30 ∘C.
Linefit v14.8 used for the ILS characterization can be obtained by contacting Frank Hase (frank.hase@kit.edu). The PROFFAST software is freely available using the following link: https://www.imk-asf.kit.edu/english/3225.php (last access: 14 April 2022; KIT-IMK-ASF, 2022).
All the data used for this study can be directly requested from the author: Carlos Alberti (carlos.alberti@kit.edu).
The supplement related to this article is available online at: https://doi.org/10.5194/amt-15-2433-2022-supplement.
CA and FH developed the experimental set-up and data analysis procedures and carried out the measurements. CA performed the data analysis and wrote the paper with support from FH. FH built and calibrated the cell. MF performed the laboratory measurements from the older instruments and proofread a previous version of the article. DD processed the EM27/SUN spectrometer reference unit and the IFS125-LR data set. TB contributed to the calibration effort, proofread and helped to improve the paper. AD monitors, steers and regularly reviews the calibration efforts undertaken for COCCON. GS and RH have contributed to the calibration effort by helping to diagnose and solve any device problem found. JO has continuously supported and encouraged the success of the COCCON project and contributed to the calibration efforts and improving the paper. All further co-authors collaborated on the calibration efforts and helped to improve the paper.
The contact author has declared that neither they nor their co-authors have any competing interests.
Publisher's note: Copernicus Publications remains neutral with regard to jurisdictional claims in published maps and institutional affiliations.
We thank Martin Kohler for providing the meteorological data sets from IMK-TRO's tower. Dragos Ene wants to acknowledge the Romanian National Core Program (contract no. 18N/2019) for funding his activities. Diogo J. Medeiros acknowledges the São Paulo Research Foundation (FAPESP) for financial support (grant 2019/27079-2). The Wollongong team want to acknowledge the Australian Research Council (ARC) for supporting their activities under the grants DP160101598 and LE0668470.
This research has been supported by the European Space Agency (COCCON-PROCEEDS, grant no. 4000121212/17/I-EF; QA4EOQA4EO, grant no. 4000128426/19/NL/FF/ab; and FRM4GHG 2.0, grant no. 4000136108/21/I-DT-lr).
The article processing charges for this open-access publication were covered by the Karlsruhe Institute of Technology (KIT).
This paper was edited by Rebecca Washenfelder and reviewed by two anonymous referees.
Bernardo, C. and Griffith, D. W. T.: Fourier transform spectrometer instrument lineshape (ILS) retrieval by Fourier deconvolution, J. Quant. Spectrosc. Ra., 95, 141–150, 2005.
Blumenstock, T., Hase, F., Keens, A., Czurlok, D., Colebatch, O., Garcia, O., Griffith, D. W. T., Grutter, M., Hannigan, J. W., Heikkinen, P., Jeseck, P., Jones, N., Kivi, R., Lutsch, E., Makarova, M., Imhasin, H. K., Mellqvist, J., Morino, I., Nagahama, T., Notholt, J., Ortega, I., Palm, M., Raffalski, U., Rettinger, M., Robinson, J., Schneider, M., Servais, C., Smale, D., Stremme, W., Strong, K., Sussmann, R., Té, Y., and Velazco, V. A.: Characterization and potential for reducing optical resonances in Fourier transform infrared spectrometers of the Network for the Detection of Atmospheric Composition Change (NDACC), Atmos. Meas. Tech., 14, 1239–1252, https://doi.org/10.5194/amt-14-1239-2021, 2021.
Bruker: OPUS/IR Reference Manual version 7.0, Bruker Optik GmbH, Ettlingen, 2017.
Butz, A., Dinger, A. S., Bobrowski, N., Kostinek, J., Fieber, L., Fischerkeller, C., Giuffrida, G. B., Hase, F., Klappenbach, F., Kuhn, J., Lübcke, P., Tirpitz, L., and Tu, Q.: Remote sensing of volcanic CO2, HF, HCl, SO2, and BrO in the downwind plume of Mt. Etna, Atmos. Meas. Tech., 10, 1–14, https://doi.org/10.5194/amt-10-1-2017, 2017.
Chen, J., Viatte, C., Hedelius, J. K., Jones, T., Franklin, J. E., Parker, H., Gottlieb, E. W., Wennberg, P. O., Dubey, M. K., and Wofsy, S. C.: Differential column measurements using compact solar-tracking spectrometers, Atmos. Chem. Phys., 16, 8479–8498, https://doi.org/10.5194/acp-16-8479-2016, 2016.
Chen, J., Dietrich, F., Maazallahi, H., Forstmaier, A., Winkler, D., Hofmann, M. E. G., Denier van der Gon, H., and Röckmann, T.: Methane emissions from the Munich Oktoberfest, Atmos. Chem. Phys., 20, 3683–3696, https://doi.org/10.5194/acp-20-3683-2020, 2020.
Crisp, D., Pollock, H. R., Rosenberg, R., Chapsky, L., Lee, R. A. M., Oyafuso, F. A., Frankenberg, C., O'Dell, C. W., Bruegge, C. J., Doran, G. B., Eldering, A., Fisher, B. M., Fu, D., Gunson, M. R., Mandrake, L., Osterman, G. B., Schwandner, F. M., Sun, K., Taylor, T. E., Wennberg, P. O., and Wunch, D.: The on-orbit performance of the Orbiting Carbon Observatory-2 (OCO-2) instrument and its radiometrically calibrated products, Atmos. Meas. Tech., 10, 59–81, https://doi.org/10.5194/amt-10-59-2017, 2017.
Dietrich, F., Chen, J., Voggenreiter, B., Aigner, P., Nachtigall, N., and Reger, B.: MUCCnet: Munich Urban Carbon Column network, Atmos. Meas. Tech., 14, 1111–1126, https://doi.org/10.5194/amt-14-1111-2021, 2021.
Drummond, J. R. and Mand, G. S.: The Measurements of Pollution in the Troposphere (MOPITT) Instrument: Overall Performance and Calibration Requirements, J. Atmos. Ocean. Tech., 13, 314–320, https://doi.org/10.1175/1520-0426(1996)013<0314:TMOPIT>2.0.CO;2, 1996.
Drummond, J. R., Zou, J., Nichitiu, F., Kar, J., Deschambaut, R., and Hackett, J.: A review of 9-year performance and operation of the MOPITT instrument, Adv. Space Res., 45, 760–774, https://doi.org/10.1016/j.asr.2009.11.019, 2010.
Eldering, A., O'Dell, C. W., Wennberg, P. O., Crisp, D., Gunson, M. R., Viatte, C., Avis, C., Braverman, A., Castano, R., Chang, A., Chapsky, L., Cheng, C., Connor, B., Dang, L., Doran, G., Fisher, B., Frankenberg, C., Fu, D., Granat, R., Hobbs, J., Lee, R. A. M., Mandrake, L., McDuffie, J., Miller, C. E., Myers, V., Natraj, V., O'Brien, D., Osterman, G. B., Oyafuso, F., Payne, V. H., Pollock, H. R., Polonsky, I., Roehl, C. M., Rosenberg, R., Schwandner, F., Smyth, M., Tang, V., Taylor, T. E., To, C., Wunch, D., and Yoshimizu, J.: The Orbiting Carbon Observatory-2: first 18 months of science data products, Atmos. Meas. Tech., 10, 549–563, https://doi.org/10.5194/amt-10-549-2017, 2017.
Eldering, A., Taylor, T. E., O'Dell, C. W., and Pavlick, R.: The OCO-3 mission: measurement objectives and expected performance based on 1 year of simulated data, Atmos. Meas. Tech., 12, 2341–2370, https://doi.org/10.5194/amt-12-2341-2019, 2019.
Frankenberg, C., Pollock, R., Lee, R. A. M., Rosenberg, R., Blavier, J.-F., Crisp, D., O'Dell, C. W., Osterman, G. B., Roehl, C., Wennberg, P. O., and Wunch, D.: The Orbiting Carbon Observatory (OCO-2): spectrometer performance evaluation using pre-launch direct sun measurements, Atmos. Meas. Tech., 8, 301–313, https://doi.org/10.5194/amt-8-301-2015, 2015.
Frey, M., Hase, F., Blumenstock, T., Groß, J., Kiel, M., Mengistu Tsidu, G., Schäfer, K., Sha, M. K., and Orphal, J.: Calibration and instrumental line shape characterization of a set of portable FTIR spectrometers for detecting greenhouse gas emissions, Atmos. Meas. Tech., 8, 3047–3057, https://doi.org/10.5194/amt-8-3047-2015, 2015.
Frey, M., Sha, M. K., Hase, F., Kiel, M., Blumenstock, T., Harig, R., Surawicz, G., Deutscher, N. M., Shiomi, K., Franklin, J. E., Bösch, H., Chen, J., Grutter, M., Ohyama, H., Sun, Y., Butz, A., Mengistu Tsidu, G., Ene, D., Wunch, D., Cao, Z., Garcia, O., Ramonet, M., Vogel, F., and Orphal, J.: Building the COllaborative Carbon Column Observing Network (COCCON): long-term stability and ensemble performance of the EM27/SUN Fourier transform spectrometer, Atmos. Meas. Tech., 12, 1513–1530, https://doi.org/10.5194/amt-12-1513-2019, 2019.
Frey, M. M., Hase, F., Blumenstock, T., Dubravica, D., Groß, J., Göttsche, F., Handjaba, M., Amadhila, P., Mushi, R., Morino, I., Shiomi, K., Sha, M. K., de Mazière, M., and Pollard, D. F.: Long-term column-averaged greenhouse gas observations using a COCCON spectrometer at the high-surface-albedo site in Gobabeb, Namibia, Atmos. Meas. Tech., 14, 5887–5911, https://doi.org/10.5194/amt-14-5887-2021, 2021.
Gisi, M., Hase, F., Dohe, S., Blumenstock, T., Simon, A., and Keens, A.: XCO2-measurements with a tabletop FTS using solar absorption spectroscopy, Atmos. Meas. Tech., 5, 2969–2980, https://doi.org/10.5194/amt-5-2969-2012, 2012.
Hase, F.: Improved instrumental line shape monitoring for the ground-based, high-resolution FTIR spectrometers of the Network for the Detection of Atmospheric Composition Change, Atmos. Meas. Tech., 5, 603–610, https://doi.org/10.5194/amt-5-603-2012, 2012.
Hase, F., Blumenstock, T., and Paton-Walsh, C.: Analysis of the instrumental line shape of high-resolution Fourier transform IR spectrometers with gas cell measurements and new retrieval software, Appl. Opt., 38, 3417–3422, https://doi.org/10.1364/AO.38.003417, 1999.
Hase, F., Drouin, B. J., Roehl, C. M., Toon, G. C., Wennberg, P. O., Wunch, D., Blumenstock, T., Desmet, F., Feist, D. G., Heikkinen, P., De Mazière, M., Rettinger, M., Robinson, J., Schneider, M., Sherlock, V., Sussmann, R., Té, Y., Warneke, T., and Weinzierl, C.: Calibration of sealed HCl cells used for TCCON instrumental line shape monitoring, Atmos. Meas. Tech., 6, 3527–3537, https://doi.org/10.5194/amt-6-3527-2013, 2013.
Hase, F., Frey, M., Blumenstock, T., Groß, J., Kiel, M., Kohlhepp, R., Mengistu Tsidu, G., Schäfer, K., Sha, M. K., and Orphal, J.: Application of portable FTIR spectrometers for detecting greenhouse gas emissions of the major city Berlin, Atmos. Meas. Tech., 8, 3059–3068, https://doi.org/10.5194/amt-8-3059-2015, 2015.
Hase, F., Frey, M., Kiel, M., Blumenstock, T., Harig, R., Keens, A., and Orphal, J.: Addition of a channel for XCO observations to a portable FTIR spectrometer for greenhouse gas measurements, Atmos. Meas. Tech., 9, 2303–2313, https://doi.org/10.5194/amt-9-2303-2016, 2016.
Hedelius, J. K., Viatte, C., Wunch, D., Roehl, C. M., Toon, G. C., Chen, J., Jones, T., Wofsy, S. C., Franklin, J. E., Parker, H., Dubey, M. K., and Wennberg, P. O.: Assessment of errors and biases in retrievals of , , XCO, and from a 0.5 cm−1 resolution solar-viewing spectrometer, Atmos. Meas. Tech., 9, 3527–3546, https://doi.org/10.5194/amt-9-3527-2016, 2016.
IPCC: Climate Change 2021: The Physical Science Basis. Contribution of Working Group I to the Sixth Assessment Report of the Intergovernmental Panel on Climate Change, edited by: Masson-Delmotte, V., Zhai, P., Pirani, A., Connors, S. L., Péan, C., Berger, S., Caud, N., Chen, Y., Goldfarb, L., Gomis, M. I., Huang, M., Leitzell, K., Lonnoy, E., Matthews, J. B. R., Maycock, T. K., Waterfield, T., Yelekçi, O., Yu, R., and Zhou, B., Cambridge University Press, in press, 2021.
Jones, T. S., Franklin, J. E., Chen, J., Dietrich, F., Hajny, K. D., Paetzold, J. C., Wenzel, A., Gately, C., Gottlieb, E., Parker, H., Dubey, M., Hase, F., Shepson, P. B., Mielke, L. H., and Wofsy, S. C.: Assessing urban methane emissions using column-observing portable Fourier transform infrared (FTIR) spectrometers and a novel Bayesian inversion framework, Atmos. Chem. Phys., 21, 13131–13147, https://doi.org/10.5194/acp-21-13131-2021, 2021.
Kauppinen, J. and Saarinen, P.: Line-shape distortions in misaligned cube corner interferometers, Appl. Opt., 31, 69–74, 1992.
Kille, N., Chiu, R., Frey, M., Hase, F., Sha, M. K., Blumenstock, T., Hannigan, J. W., Orphal, J., Bon, D., and Volkamer, R.: Separation of Methane Emissions From Agricultural and Natural Gas Sources in the Colorado Front Range, Geophys. Res. Lett., 46, 3990–3998, https://doi.org/10.1029/2019GL082132, 2019.
KIT-IMK-ASF: PROFFAST software, Institute of Meteorology and Climate Research – Atmosphereic Trace Gases and Remote Sensing (IMK-ASF) [code], https://www.imk-asf.kit.edu/english/3225.php, last access: 14 April 2022.
Kohler, M., Metzger, J., and Kalthoff, N.: Trends in temperature and wind speed from 40 years of observations at a 200 m high meteorological tower in Southwest Germany, Int. J. Climatol., 38, 23–34, https://doi.org/10.1002/joc.5157, 2018.
Kuze, A., Suto, H., Nakajima, M., and Hamazaki, T.: Thermal and near infrared sensor for carbon observation Fourier-transform spectrometer on the Greenhouse Gases Observing Satellite for greenhouse gases monitoring, Appl. Opt., 48, 6716–6733, https://doi.org/10.1364/AO.48.006716, 2009.
Liu, Y., Wang, J., Yao, L., Chen, X., Cai, Z., Yang, D., Yin, Z., Gu, S., Tian, L., Lu, N., and Lyu, D.: The TanSat mission:434 preliminary global observations, Sci. Bull., 63, 1200–1207, https://doi.org/10.1016/j.scib.2018.08.004, 2018.
Luther, A., Kleinschek, R., Scheidweiler, L., Defratyka, S., Stanisavljevic, M., Forstmaier, A., Dandocsi, A., Wolff, S., Dubravica, D., Wildmann, N., Kostinek, J., Jöckel, P., Nickl, A.-L., Klausner, T., Hase, F., Frey, M., Chen, J., Dietrich, F., Nȩcki, J., Swolkień, J., Fix, A., Roiger, A., and Butz, A.: Quantifying CH4 emissions from hard coal mines using mobile sun-viewing Fourier transform spectrometry, Atmos. Meas. Tech., 12, 5217–5230, https://doi.org/10.5194/amt-12-5217-2019, 2019.
Makarova, M. V., Alberti, C., Ionov, D. V., Hase, F., Foka, S. C., Blumenstock, T., Warneke, T., Virolainen, Y. A., Kostsov, V. S., Frey, M., Poberovskii, A. V., Timofeyev, Y. M., Paramonova, N. N., Volkova, K. A., Zaitsev, N. A., Biryukov, E. Y., Osipov, S. I., Makarov, B. K., Polyakov, A. V., Ivakhov, V. M., Imhasin, H. Kh., and Mikhailov, E. F.: Emission Monitoring Mobile Experiment (EMME): an overview and first results of the St. Petersburg megacity campaign 2019, Atmos. Meas. Tech., 14, 1047–1073, https://doi.org/10.5194/amt-14-1047-2021, 2021.
Morino, I., Uchino, O., Inoue, M., Yoshida, Y., Yokota, T., Wennberg, P. O., Toon, G. C., Wunch, D., Roehl, C. M., Notholt, J., Warneke, T., Messerschmidt, J., Griffith, D. W. T., Deutscher, N. M., Sherlock, V., Connor, B., Robinson, J., Sussmann, R., and Rettinger, M.: Preliminary validation of column-averaged volume mixing ratios of carbon dioxide and methane retrieved from GOSAT short-wavelength infrared spectra, Atmos. Meas. Tech., 4, 1061–1076, https://doi.org/10.5194/amt-4-1061-2011, 2011.
Sha, M. K., De Mazière, M., Notholt, J., Blumenstock, T., Chen, H., Dehn, A., Griffith, D. W. T., Hase, F., Heikkinen, P., Hermans, C., Hoffmann, A., Huebner, M., Jones, N., Kivi, R., Langerock, B., Petri, C., Scolas, F., Tu, Q., and Weidmann, D.: Intercomparison of low- and high-resolution infrared spectrometers for ground-based solar remote sensing measurements of total column concentrations of CO2, CH4, and CO, Atmos. Meas. Tech., 13, 4791–4839, https://doi.org/10.5194/amt-13-4791-2020, 2020.
Suto, H., Kataoka, F., Kikuchi, N., Knuteson, R. O., Butz, A., Haun, M., Buijs, H., Shiomi, K., Imai, H., and Kuze, A.: Thermal and near-infrared sensor for carbon observation Fourier transform spectrometer-2 (TANSO-FTS-2) on the Greenhouse gases Observing SATellite-2 (GOSAT-2) during its first year in orbit, Atmos. Meas. Tech., 14, 2013–2039, https://doi.org/10.5194/amt-14-2013-2021, 2021.
Tu, Q.: Observation of atmospheric greenhouse gas abundances on regional scales in boreal areas using portable FTIR Spectrometers, Dissertation, Karlsruhe Institute for Technolgy (KIT), Germany, https://doi.org/10.5445/IR/1000095901, 2019.
Veefkind, J. P., Aben, I., McMullan, K., Förster, H., de Vries, J., Otter, G., Claas, J., Eskes, H. J., de Haan, J. F., Kleipool, Q., van Weele, M., Hasekamp, O., Hoogeveen, R., Landgraf, J., Snel, R., Tol, P., Ingmann, P., Voors, R., Kruizinga, B., Vink, R., Visser, H., and Levelt, P. F.: TROPOMI on the ESA Sentinel-5 Precursor: A GMES mission for global observations of the atmospheric composition for climate, air quality and ozone layer applications, Remote Sens. Environ., 120, 70–83, https://doi.org/10.1016/j.rse.2011.09.027, 2012.
Viatte, C., Lauvaux, T., Hedelius, J. K., Parker, H., Chen, J., Jones, T., Franklin, J. E., Deng, A. J., Gaudet, B., Verhulst, K., Duren, R., Wunch, D., Roehl, C., Dubey, M. K., Wofsy, S., and Wennberg, P. O.: Methane emissions from dairies in the Los Angeles Basin, Atmos. Chem. Phys., 17, 7509–7528, https://doi.org/10.5194/acp-17-7509-2017, 2017.
Vogel, F. R., Frey, M., Staufer, J., Hase, F., Broquet, G., Xueref-Remy, I., Chevallier, F., Ciais, P., Sha, M. K., Chelin, P., Jeseck, P., Janssen, C., Té, Y., Groß, J., Blumenstock, T., Tu, Q., and Orphal, J.: XCO2 in an emission hot-spot region: the COCCON Paris campaign 2015, Atmos. Chem. Phys., 19, 3271–3285, https://doi.org/10.5194/acp-19-3271-2019, 2019.
Wunch, D., Toon, G. C., Blavier, J.-F. L., Washenfelder, R. A., Notholt, J., Connor, B. J., Griffith, D. W. T., Sherlock, V., and Wennberg, P. O.: The Total Carbon Column Observing Network, Philos. T. Roy. Soc. A, 369, 2087–2112, https://doi.org/10.1098/rsta.2010.0240, 2011.
Wunch, D., Toon, G., Sherlock, V., Deutscher, N. M., Liu, C., Feist, D. G., and Wennberg, P. O.: The Total Carbon Column Observing Network's GGG2014 Data Version, CaltechDATA [data set], https://doi.org/10.14291/tccon.ggg2014.documentation.R0/1221662, 2015.
Yoshida, Y., Kikuchi, N., Morino, I., Uchino, O., Oshchepkov, S., Bril, A., Saeki, T., Schutgens, N., Toon, G. C., Wunch, D., Roehl, C. M., Wennberg, P. O., Griffith, D. W. T., Deutscher, N. M., Warneke, T., Notholt, J., Robinson, J., Sherlock, V., Connor, B., Rettinger, M., Sussmann, R., Ahonen, P., Heikkinen, P., Kyrö, E., Mendonca, J., Strong, K., Hase, F., Dohe, S., and Yokota, T.: Improvement of the retrieval algorithm for GOSAT SWIR XCO2 and XCH4 and their validation using TCCON data, Atmos. Meas. Tech., 6, 1533–1547, https://doi.org/10.5194/amt-6-1533-2013, 2013.
- Abstract
- Introduction
- Advancing the open-path method for ILS characterization
- Use of a cell filled with a C2H2–air mixture for ILS characterization
- Discussion of open-path results
- Discussion of C2H2 cell results
- Discussion of solar side-by-side calibration measurements
- Summary and outlook
- Appendix A
- Code availability
- Data availability
- Author contributions
- Competing interests
- Disclaimer
- Acknowledgement
- Financial support
- Review statement
- References
- Supplement