the Creative Commons Attribution 4.0 License.
the Creative Commons Attribution 4.0 License.
 | 03 May 2022
Inter-comparison of online and offline methods for measuring ambient heavy and trace elements and water-soluble inorganic ions (NO3−, SO42−, NH4+, and Cl−) in PM2.5 over a heavily polluted megacity, Delhi
Himadri Sekhar Bhowmik
Ashutosh Shukla
Vipul Lalchandani
Jay Dave
Neeraj Rastogi
Mayank Kumar
Vikram Singh
Characterizing the chemical composition of ambient particulate matter (PM) provides valuable information on the concentration of secondary species and toxic metals and assists in the validation of abatement techniques. The chemical components of PM can be measured by sampling on filters and analyzing them in the laboratory or using real-time measurements of the species. It is important for the accuracy of the PM monitoring networks that measurements from the offline and online methods are comparable and biases are known. The concentrations of water-soluble inorganic ions (NO3−, SO42−, NH4+, and Cl−) in PM2.5 measured from 24 h filter samples using ion chromatography (IC) were compared with the online measurements of inorganics from an aerosol mass spectrometer (AMS) with a frequency of 2 min. Also, the concentrations of heavy and trace elements determined from 24 h filter samples using inductively coupled plasma mass spectroscopy (ICP-MS) were compared with the online measurements of half-hourly heavy and trace metal concentrations from an Xact 625i ambient metal mass monitor. The comparison was performed over two seasons (summer and winter) and at two sites (Indian Institute of Technology Delhi (IITD) and Indian Institute of Tropical Meteorology, Delhi (IITMD)) which are located in the Delhi National Capital Region (NCR), India, one of the most heavily polluted urban areas in the world. Collocated deployments of the instruments helped to quantify the differences between online and offline measurements and evaluate the possible reasons for positive and negative biases. The slopes for SO42− and NH4+ were closer to the 1:1 line during winter and decreased during summer at both sites. The higher concentrations on the filters were due to the formation of particulate (NH4)2SO4. Filter-based NO3− measurements were lower than online NO3− during summer at IITD and winter at IITMD due to the volatile nature of NO3− from the filter substrate. Offline-measured Cl− was consistently higher than AMS-derived Cl− during summer and winter at both sites. Based on their comparability characteristics, elements were grouped into three categories. The online element data were highly correlated (R2>0.8) with the offline measurements for Al, K, Ca, Ti, Zn, Mn, Fe, Ba, and Pb during summer at IITD and winter at both the sites. The higher correlation coefficient demonstrated the precision of the measurements of these elements by both the Xact 625i and ICP-MS. Some of these elements showed higher Xact 625i elemental concentrations than ICP-MS measurements by an average of 10 %–40 % depending on the season and site. The reasons for the differences in the concentration of the elements could be the distance between two inlets for the two methods, line interference between two elements in Xact measurements, the sampling strategy, variable concentrations of elements in blank filters, and the digestion protocol for ICP-MS measurements.
- Article
(2845 KB) - Full-text XML
-
Supplement
(1527 KB) - BibTeX
- EndNote


The adverse effect of ambient particulate matter (PM) on human health and the role of PM in visibility degradation, altering earth's radiation balance, and climate change have received global attention in the last 2 decades (Pope et al., 2009; Hong et al., 2019; Wang et al., 2019). To gain better insight into their properties, the chemical characterization of particulate matter and its source attribution are crucial. The National Capital Region (NCR), which includes India's capital (New Delhi) along with some districts (Gurugram, Faridabad, and Noida) of the adjoining states of Haryana, Rajasthan, and Uttar Pradesh, is one of the most polluted urban areas in northern India with a population of over 47 million (Bhowmik et al., 2021). According to the World Economic Forum, New Delhi has been listed as the most polluted city globally, with an annual average PM2.5 concentration of ∼140 µg m−3 (World Health Organization, 2018). Delhi NCR has been a specific area for researchers for the past couple of years due to its unprecedented PM2.5 levels. Various large- and small-scale industries, power plants, and construction activities and a rapid increase in the vehicle numbers (11 million in 2018) (Rai et al., 2020) are among the several causes for massively reducing the air quality index (AQI) (Rai et al., 2020; Sharma and Kulshrestha, 2014). Further, the crop residue burning during the months of October–November in the adjoining states of Haryana and Punjab on a larger scale worsens the air quality.
For decades, the mass concentrations of major water-soluble inorganic ions (WSIs) and heavy and trace metals in PM have been carried out by sampling them on filters and subsequently analyzing them in the laboratory. WSIs and heavy and trace elements from these filter samples are analyzed using ion chromatography (IC) (Bhowmik et al., 2021; Rengarajan et al., 2007; Rastogi and Sarin, 2005) and inductively coupled plasma mass spectroscopy (ICP-MS) and inductively coupled plasma optical emission spectroscopy (ICP-OES) (Patel et al., 2021). Usually, these filters are collected over a 24 h interval. Traditional receptor models usually use these offline-measured data of very low temporal resolution, making it challenging to characterize the short pollution episodes and dynamics of pollution sources. Further, un-denuded filter sampling can have both negative and positive artifacts due to volatile species (Lipfert, 1994; Pathak and Chan, 2005). If not removed prior to sampling, the absorption of acidic and alkaline gases on the filter substrates can give positive artifacts and result in overestimating species concentration. Likewise, the evaporation of semi-volatile compounds (ammonium nitrate) from filter substrates can give negative biases and result in underestimating aerosol concentration and its species (Pathak and Chan, 2005; Zhang and Mcmurryt, 1992). The degree of artifacts can be affected by several factors, including temperature, relative humidity, type of filter substrate, the aerosol loading on the filter substrate, etc. Transient events can also lead to mismatch. To overcome the limitations of low temporal resolution and avoid the artifacts associated with offline filter sampling, methods have been developed for measuring aerosol chemical composition at a higher time resolution on the order of hours or minutes.
An aerosol mass spectrometer (AMS) (Canagratna et al., 2007; Jayne et al., 2000; Jimenez et al., 2003) is one kind of instrument which provides the size-resolved chemical composition of non-refractory submicron aerosols, e.g., organics, sulfate, nitrate, ammonium, and chloride, on the order of hours or even minutes. For other important components, such as calcium (the main constituent of soil dust and construction activities) and potassium (a tracer of biomass burning), which AMSs cannot measure, an Xact ambient metal mass monitor can be used. It is capable of measuring 45 elements, i.e., Al, Si, P, S, Cl, K, Ca, Ti, V, Cr, Mn, Fe, Co, Ni, Cu, Zn, Ga, Ge, As, Se, Br, Rb, Sr, Y, Zr, Nb, Mo, Pd, Ag, Cd, In, Sn, Sb, Te, I, Cs, Ba, La, Ce, Pt, Au, Hg, Tl, Pb, and Bi, with a frequency of every 30 min to 4 h. However, the high-time-resolution instruments measure a lower range of species concentrations with a higher limit of detection (LOD) than the offline-based methods (Tremper et al., 2018). Both offline and online methods have their own strengths and weaknesses. Uncertainties in offline filter analysis methods have been extensively studied (Pathak and Chan, 2005; Viana et al., 2006), but the novel online methods pose new problems (Wu and Wang, 2007). For example, when the ambient concentrations are very low, online measurements are often close to the method detection limit (MDL) values due to the short integration times (Malaguti et al., 2015).
Previous studies in Delhi NCR have used low-time-resolution filter-based methods for chemical characterization of submicron aerosols (Bhowmik et al., 2020; Nagar et al., 2017; Pant et al., 2015; Sharma et al., 2016; Singhai et al., 2017). On the other hand, there are only a few studies in Delhi NCR that have used high-time-resolution methods (high-resolution time-of-flight aerosol mass spectrometer – HR-ToF-AMS, quadrupole aerosol chemical speciation monitor – Q-ACSM, Xact) for characterization and source apportionment of coarse and fine particulate matters (Gani et al., 2019; Lalchandani et al., 2021; Rai et al., 2020, 2021; Singh et al., 2021; Tobler et al., 2020). Online and offline measurements both have their advantages and limitations. For both these measurements, the quality of the data highly depends on the calibration of the instruments. For the Xact instrument, the multi-element mix standard might not represent the ambient elemental mix if the ambient particulate matters are too low or too high in concentration, affecting the collection properties of the filter (Indresand et al., 2013). For filter-based water-soluble inorganic ion and metal analysis, confidence in the data depends on the calibration as well as the volatility and solubility for the extraction of water-soluble inorganic ions and on the digestion protocol used for the extraction of elements. Thus, it is vital for monitoring networks that both the offline and the online measurement methods give comparable results. Few published studies have compared inorganics and elements from filter-based measurements and semi-continuous methods (e.g., Furger et al., 2017; Nie et al., 2010). The inter-comparison in these studies is unjustified for highly polluted areas, as the species values observed in these studies are far below the MDL due to the very low ambient concentration of secondary species and elements. It will be interesting to study the inter-comparison in highly polluted areas. To the best of our knowledge, there are neither any published seasonal and temporal comparisons of inorganics from high-time-resolution AMS measurements and filter-based measurements from ion chromatography nor any comparisons of heavy and trace metals from high-time-resolution Xact 625i ambient metal mass monitors and offline measurements from ICP-MS in the heavily polluted Delhi NCR region.
This study demonstrates a comparison between online and offline measurements of WSIs and heavy and trace metals at two sites in Delhi NCR during summer (June–July 2019), characterized by moderate levels of local pollution, and winter (October–December 2019), affected by high levels of pollution from local sources and regional transport of crop residue burning emissions from the adjoining states of Haryana and Punjab.
2.1 Sampling sites
Delhi NCR, a highly polluted urban area with an annual average PM2.5 concentration of 140 µg m−3 and a population of over 47 million, is surrounded by the Thar Desert to its west and the Indo-Gangetic Plain to its east to southeast. The temperature is about ∼35–48 ∘C during summer (April–June), and winter (December–February) is cooler, with temperature ranging from ∼2–15 ∘C (Bhowmik et al., 2020; Lalchandani et al., 2021; Tobler et al., 2020). The wind is mostly northwesterly during both summer and winter.
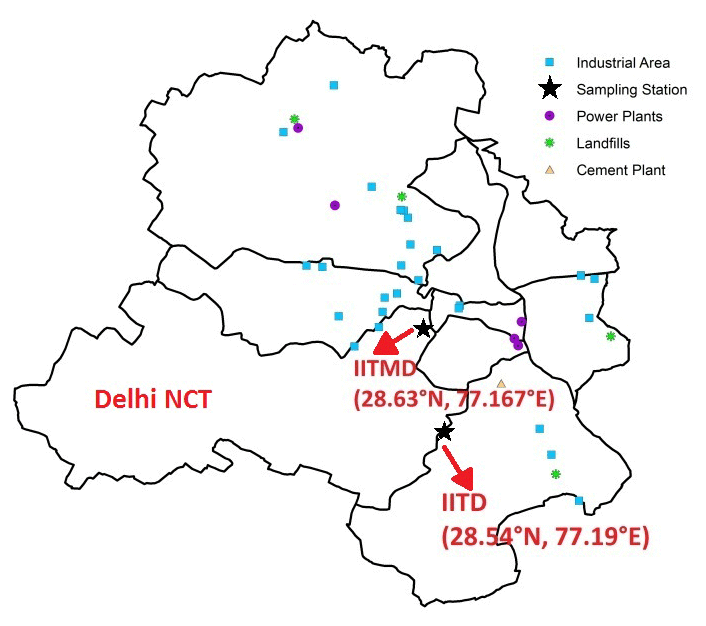
Figure 1Sampling sites with various emission sources like power plants, industries, landfills, etc.
2.1.1 Delhi NCR site 1 – IITD
High-volume PM2.5 samples were collected on the rooftop of the Centre for Atmospheric Science (CAS) building at the Indian Institute of Technology Delhi (IITD) (28.54∘ N, 77.19∘ E; ∼218 m a.m.s.l.) about ∼15 m a.g.l. Further, one HR-ToF-AMS and one Xact ambient metal mass monitor were deployed inside a temperature-controlled laboratory on the third floor of the same building at about ∼10 m a.g.l. The site is an educational institute as well as residential campus, having restaurants nearby and being very close to (<200 m) heavy road traffic. Lalchandani et al. (2021) and Rai et al. (2020) observed source signatures of emissions from industries, power plants, vehicles, and waste burning at this site.
2.1.2 Delhi NCR site 2 – IITMD
Offline PM2.5 sampling was carried out on the rooftop of the main building at the Indian Institute of Tropical Meteorology, Delhi (IITMD) (28.63∘ N, 77.167∘ E; ∼220 m a.m.s.l.), at about 15 m a.g.l. Moreover, an HR-ToF-AMS and an Xact ambient metal mass monitor were installed inside a temperature-controlled laboratory on the second floor of the same building at the height of ∼8 m a.g.l. This site is placed in the central urban area of Delhi and surrounded by Central Ridge reserve forest and residential areas (Tobler et al., 2020) and is around 14 km away in a northwest direction from IITD. A recent study by Lalchandani et al. (2021) observed that the site is dominated by emissions from traffic, solid fuel burning, and oxidized organic aerosols. The locations of the sampling sites are shown in Fig. 1.
2.2 Sampling details
2.2.1 Offline sampling
Biweekly 24 h (January–May and August–September 2019) and daily 24 h (June–July and October–December 2019) PM2.5 samples were collected on quartz filter substrates (Whatman; 8×12 in.) using a high-volume sampler (HVS) with a flow rate of 1.13 m3 min−1. Blanks were collected in the field by placing a fresh filter in the sampler while it was not running. A total of 64 filters (60 from the IITD site during June–July 2019 including 4 blanks) were collected in summer, whereas a total of 186 filters (90 from each site during October–December 2019 plus 6 blanks) were collected in winter. The collected filters, including field blanks, were zip-locked and stored in the freezer at each site and periodically transported to CESE (Centre for Environmental Science and Engineering), IIT Kanpur, where they were further stored at −20 ∘C in a deep freezer prior to analysis. For this study, the samples from the common period of offline and online sampling (October–December 2019) from the two sites were analyzed for WSIs (SO42−, NO3−, NH4+, and Cl−) using IC and 32 metals (Al, Na, K, Ca, Ti, V, Cr, Mn, Fe, Ni, Cu, Zn, As, Se, Rb, Sr, Zr, Cd, Sn, Sb, Ba, Pb, Cs, La, Ce, Pt, Tl, Mg, Li, Mo, Co, and Pd) using ICP-MS. More details of analytical procedures are given in the “Instrument details” section.
2.2.2 Online sampling
At both the IITD and the IITMD site, high-resolution time-of-flight aerosol mass spectrometers (HR-ToF-AMSs, Aerodyne Research Inc., Billerica, MA, USA) (Canagaratna et al., 2007; DeCarlo et al., 2006), equipped with PM2.5 aerodynamic lenses (Peck et al., 2016) (Aerodyne Research Inc., Billerica, MA, USA), were installed inside air-conditioned laboratories. Ambient fine particulate matters were sampled through a PM2.5 cyclone (BGI, Mesa Labs Inc.) inlet at IITD with a flow rate of 5 L min−1 using 2.44 m long stainless-steel tubing (0.3 in. i.d. and 0.4 in. o.d.) and through black silicon tubing (0.19 in. i.d.) at IITMD, placed 1.5 m above the rooftop. A Nafion dryer (MD-110-144P-4, Perma Pure, Halma, UK) was used to dry the ambient aerosols to maintain the output relative humidity (RH) at 20 %. At IITD, data were collected from 12 October 2019–31 December 2019 and 2 June 2019–21 July 2019 during the winter and summer campaigns, respectively. The data between 1 and 14 November were not available due to hardware issues in the AMS during that period. At IITMD, data were only collected during the winter campaign from 25 October 2019 to 31 December 2019.
Two Xact 625i ambient metal monitors (Cooper Environmental Services, Beaverton, OR, USA) were installed inside temperature-controlled laboratories at IITD and IITMD. Ambient aerosols were sampled through a PM2.5 inlet with a flow rate of 16.7 L min−1. A separate sampling line of 2.44 m (1.25 in. i.d.) for the Xact instrument which was made of aluminum was installed. A heater was set up at the end of the sampling line to ensure a 45 % RH set point. At IITD, sampling was carried out from 1 October 2019–31 December 2019 and 30 May 2019–25 July 2019 during the winter and summer campaign, respectively. However, data between 16 and 24 July were not available due to hardware breakdown. At IITMD, samples were collected from 1 October 2019–31 December 2019, but data from 18 to 26 November 2019 and 30 November to 14 December 2019 were not available due to instrumental problems.
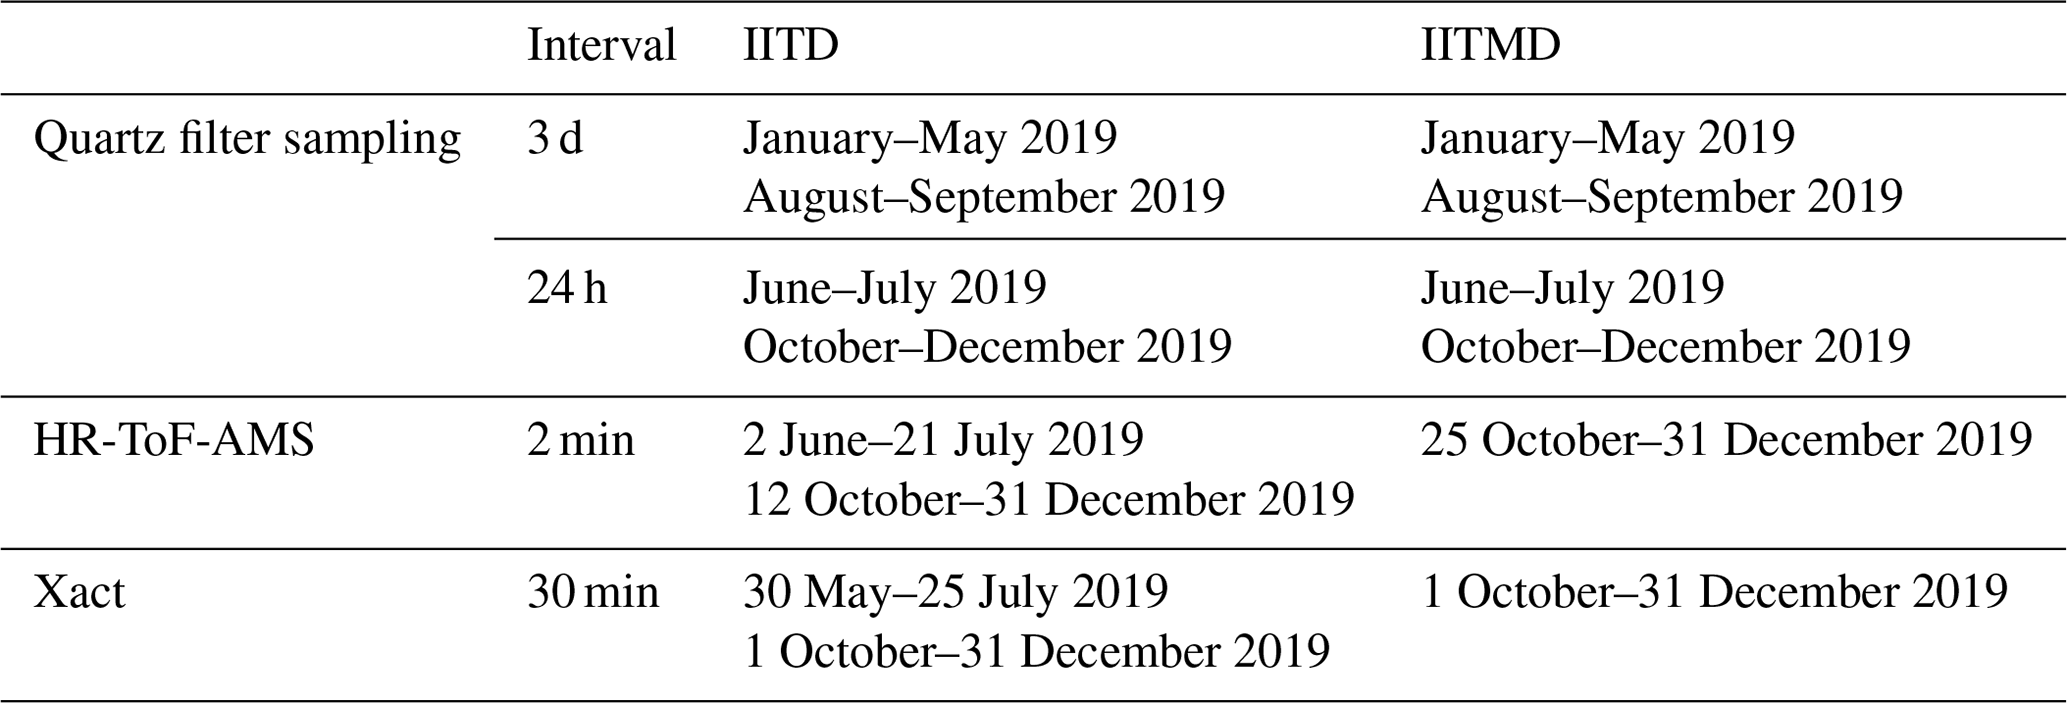
Online measurements of inorganic ions (SO42−, NO3−, NH4+, and Cl−) from the HR-ToF-AMS were compared with the WSIs using IC. Parallelly, heavy and trace metals obtained from the Xact ambient metal mass monitor were compared with the metal data from the offline filter measurements using ICP-MS. Though the sampling periods of the AMS, Xact, and HVS instruments were different for different seasons and different sites as well (Table 1), only the common periods of online and offline sampling have been discussed in this study for comparison.
Table 1Sampling strategy and instrumentation used.
Filters from the common periods were analyzed for WSIs and heavy and trace metals using IC and ICP-MS, respectively.
2.3 Instrument details
2.3.1 WSI measurements by IC and HR-ToF-AMS
For WSI analysis, a 9 cm2 punch area of each collected filter was soaked in 30 mL of high-purity Milli-Q water (resistivity 18.20 MΩ cm) for 12 h in pre-cleaned borosilicate test tubes to ensure maximum solubility. The amount of water added, soaking time, etc., affect the solubility of the ions as well as the extent of extraction. Details can be found in our previous paper (Bhowmik et al., 2020). Soaked samples were filtered through 0.22 µm quartz filter papers to remove any suspended contaminations after an ultrasonication for 50 min. Cl−, NO3−, SO42−, and NH4+ were measured for all the filter extracts by IC (Metrohm 883 Basic IC plus for cations and 882 Compact IC plus for anions). Separate columns for the analysis of cations and anions were installed in two separate modules. For anion and cation separation, an AS 5-250/4.0 chromatography column and a C 6 column were used, respectively. The sample carried by 3.2 mM Na2CO3 + 1 mM NaHCO3 solution and 2.7 mM HNO3 solution in the anion and cation module separately passes through the charged columns to analyze each ion according to their polarity. The calibration was performed by a seven-point method with a range of standards prepared by the serial dilution from the stock solution standard of 10 ppm purchased from Metrohm. The uncertainty in the water-soluble inorganic ions measured by IC was estimated as 4 % (coverage factor ∼2) by the approach described in Yardley et al. (2007).
The HR-ToF-AMS measures size-resolved mass spectra of non-refractory particles (PM components that vaporize at 600 ∘C and 10−5 Torr, e.g., organics, nitrate, sulfate, ammonium, and some chlorides) of submicron particulate matters. The details of this instrument can be found elsewhere (DeCarlo et al., 2006). Briefly, ambient aerosols are collected through an orifice of 100 µm diameter and focused into a narrow particle beam by an aerodynamic lens system installed inside the instrument, which has a transmission efficiency of >50 % for PM2.5 (DeCarlo et al., 2006; Peck et al., 2016). The particle size is determined after analyzing the time of flight, i.e., the time taken to travel along the length of the sizing chamber. The non-refractory (NR) PM is then vaporized by hitting the vaporizer at 600 ∘C and at a vacuum of 10−7 Torr. Further, the vaporized molecules are electronically ionized at 70 eV, followed by detection by a mass spectrometer as per their . The HR-ToF-AMS can be operated in W mode or V mode. For this study, it was operated in V mode with a sampling time of 2 min. The mass spectra mode, in which mass spectra of the components are measured, and the particle time-of-flight (PToF) mode, in which the size-resolved mass spectra are measured, are alternated in every 30 s in two cycles. The HR-ToF-AMS was calibrated using standard protocols provided in our previous publications (Lalchandani et al., 2021; Singh et al., 2019).
To determine the mass concentration of NR PM, Unit mass resolution (UMR) analysis was performed using the SQUIRREL data analysis toolkit (version 1.59) programmed in Igor Pro 6.37 software (WaveMetrics, Inc., Portland, OR, USA). High-resolution (HR) analysis was also performed on the data set using the Peak Integration by Key Analysis (PIKA version 1.19) toolkit. A recommended collection efficiency (CE) of 1 (Hu et al., 2017) was used for the capture vaporizer. At the beginning and in the middle of each campaign at the two sites, ionization efficiency (IE) calibration was performed by injecting mono-disperse 300 nm ammonium nitrate and ammonium sulfate particles into the AMS and a condensation particle counter (Jayne et al., 2000). A relative ionization efficiency (RIE) of 4.05 and 4.35 was used for the IITD and IITMD sites, respectively, in the case of NH4. RIE of SO4 was taken as 2.89 and 1.67 for IITD and IITMD, respectively. For organics and Cl, by default a RIE of 1.4 and 1.3, respectively, was taken. More details can be found in Lalchandani et al. (2022).
2.3.2 Heavy and trace metal measurements by ICP-MS and Xact 625i
For the analysis of heavy and trace metals, a 15 cm2 area of each collected filter was digested in an acid mix of 0.5 mL HF + 1.5 mL HNO3 for 4 h within closed HDPE Teflon tubes using a hot plate (Savillex HF-resistive model number 88888:00000). The temperature range should be ∼90–120 ∘C to ensure complete digestion of the elements. Further, 2.5 mL of HClO4 was added to the precipitates and left over the Teflon tube wall and the tubes were kept on the hot plate at 220–240 ∘C for another 4 h with the lids open for complete evaporation of the acid mix. Moreover, the residual was dissolved in 378.0768 g HNO3 in 1 L water and diluted with de-ionized water (resistivity 18.20 MΩ cm), followed by filtering through 0.22 µm quartz filter papers prior to analysis. Details can be found in our forthcoming paper. This method is well established and has been used in many studies (Minguillón et al., 2012; Querol et al., 2008).
Thirty-two metals (Al, Na, K, Ca, Ti, V, Cr, Mn, Fe, Ni, Cu, Zn, As, Se, Rb, Sr, Zr, Cd, Sn, Sb, Ba, Pb, Cs, La, Ce, Pt, Tl, Mg, Li, Mo, Co, and Pd) were analyzed for all filter extracts using ICP-MS (Thermo Scientific iCAP Q ICP-MS instrument) at the IIT Kanpur Environmental Engineering laboratory. Si could not be determined in the filter samples because Si is the primary constituent of the quartz filters and hence digested during sample preparation. Samples were first introduced to a nebulizer using an injector attached to an autosampler for transformation into fine aerosol droplets followed by ionization at a very high temperature (8000 K) in Ar plasma. The elements are eluted as per their . A known concentration (5 ppb) of Ge was used as an internal standard to monitor the instrumental drift during the analysis. The overall average drift was reported as ±10 %. The calibration was performed by a 10-point method with a range of mix standards prepared by the serial dilution from the high-purity multi-element (35 elements) standards (soluble in 1 % HNO3, 100 ppm) purchased from Sigma-Aldrich.
The Xact 625i Ambient Continuous Multi-Metals Monitor (Cooper Environmental Services (CES), Beaverton, OR, USA) uses X-ray fluorescence to measure the real-time elemental data in particulate matter. For this study, a PM2.5 inlet was used. Details of the instrument can be found in Furger et al. (2017). Briefly, aerosol samples were collected on a Teflon filter tape, which was followed by hitting the loaded area with X-rays, and the fluorescence was measured by a silicon drift detector (SDD). Thirty elements – Al, Si, S, Cl, K, Ca, Ti, Cr, Mn, Fe, Co, Ni, Cu, Zn, As, Se, Br, Rb, Sr, Zr, Mo, Cd, In, Sn, Sb, Te, Ba, Pb, Bi, and Bi – were measured with a 30 min time resolution. The Xact 625i was calibrated during each campaign using thin film standards for the individual elements. The reproducibility was observed to be within ±5 %. At midnight each day energy alignment checks were performed for 15 min (00:15 to 00:30 LT) (for Cr, Pb, Cd, and Nb). An uncertainty of ∼10 % was reported by the manufacturer in an interference-free situation (U.S. EPA and ETV, 2012). This included 1.73 % from flow (CEN, 2014), 5 % for standard reproducibility or uncertainty during calibration (U.S. EPA, 1999), and 2.9 % from term stability as reported in Tremper et al. (2018). More details on the instrumental setup and stability check during the summer and winter campaigns can be found in Rai et al. (2020) and Shukla et al. (2021).
3.1 Online and offline measurements of WSIs and their comparison
Large temporal variability was observed in both offline and online measurements of WSIs (NO3−, SO42−, and NH4+ and Cl−) during the winter campaign and summer campaign at both sites. The data of inorganics with a 2 min interval from the HR-ToF-AMS were averaged over the sampling period of the filters, i.e., 24 h. The time series of NO3−, SO42−, NH4+, and Cl− during the summer and winter campaigns at IITD and winter campaign at IITMD are shown in Fig. S1 in the Supplement. Higher peaks of inorganics were observed during 25 October–18 November during the winter campaign at IITD, which was the agricultural crop residue burning period (Nagar et al., 2017). During the winter campaign, NO3− was the most abundant ion followed by SO42−, NH4+, and Cl− for both offline and online measurements at both the sites, whereas, during the summer campaign at IITD, NO3− was the most abundant ion followed by NH4+, SO42−, and Cl− in online measurements (HR-ToF-AMS). Similar results were observed in our related paper, Shukla et al. (2021). Interestingly, in the case of offline measurements during the summer campaign at IITD, NO3− was least abundant, and the sequence changed as SO. The average concentrations with their ranges are tabulated in Table S1 in the Supplement, and the mean, maximum, and minimum concentrations are shown in Fig. 2 using box plots.

Figure 2Box plots of online- and offline-measured secondary species (NO3−, SO42−, and NH4+) and Cl− during the (a) summer campaign at IITD, (b) winter campaign at IITD, and (c) winter campaign at IITMD site. IQR denotes interquartile range.
Comparability and correlation between offline and online measurements were evaluated in this study by applying linear regression using offline data as the independent variable and online data as the dependent variable. The comparability of NH4+ measurements was observed to be good for both summer and winter campaigns at both sites. During the winter campaign, the correlations were R2=0.76 and R2=0.89 for IITD and IITMD, respectively, and the slopes were closer to 1 (0.99 for IITD and 0.93 for IITMD) (Fig. 3). Interestingly during the summer campaign at IITD, though the correlation improves (R2=0.91), the slope decreases to 0.49. This is likely because the vapor concentration of sulfuric acid (H2SO4) is higher during summers, as a result of which the adsorption of sulfuric acid on PM deposited on the filter papers happens during summers and reacts with gaseous ammonia (NH3) to form a relatively stable particulate (NH4)2SO4 (Zhang et al., 2000), thus increasing ammonium concentration in the offline measurements during the warmer season, especially in the presence of dust (Nicolás et al., 2009).
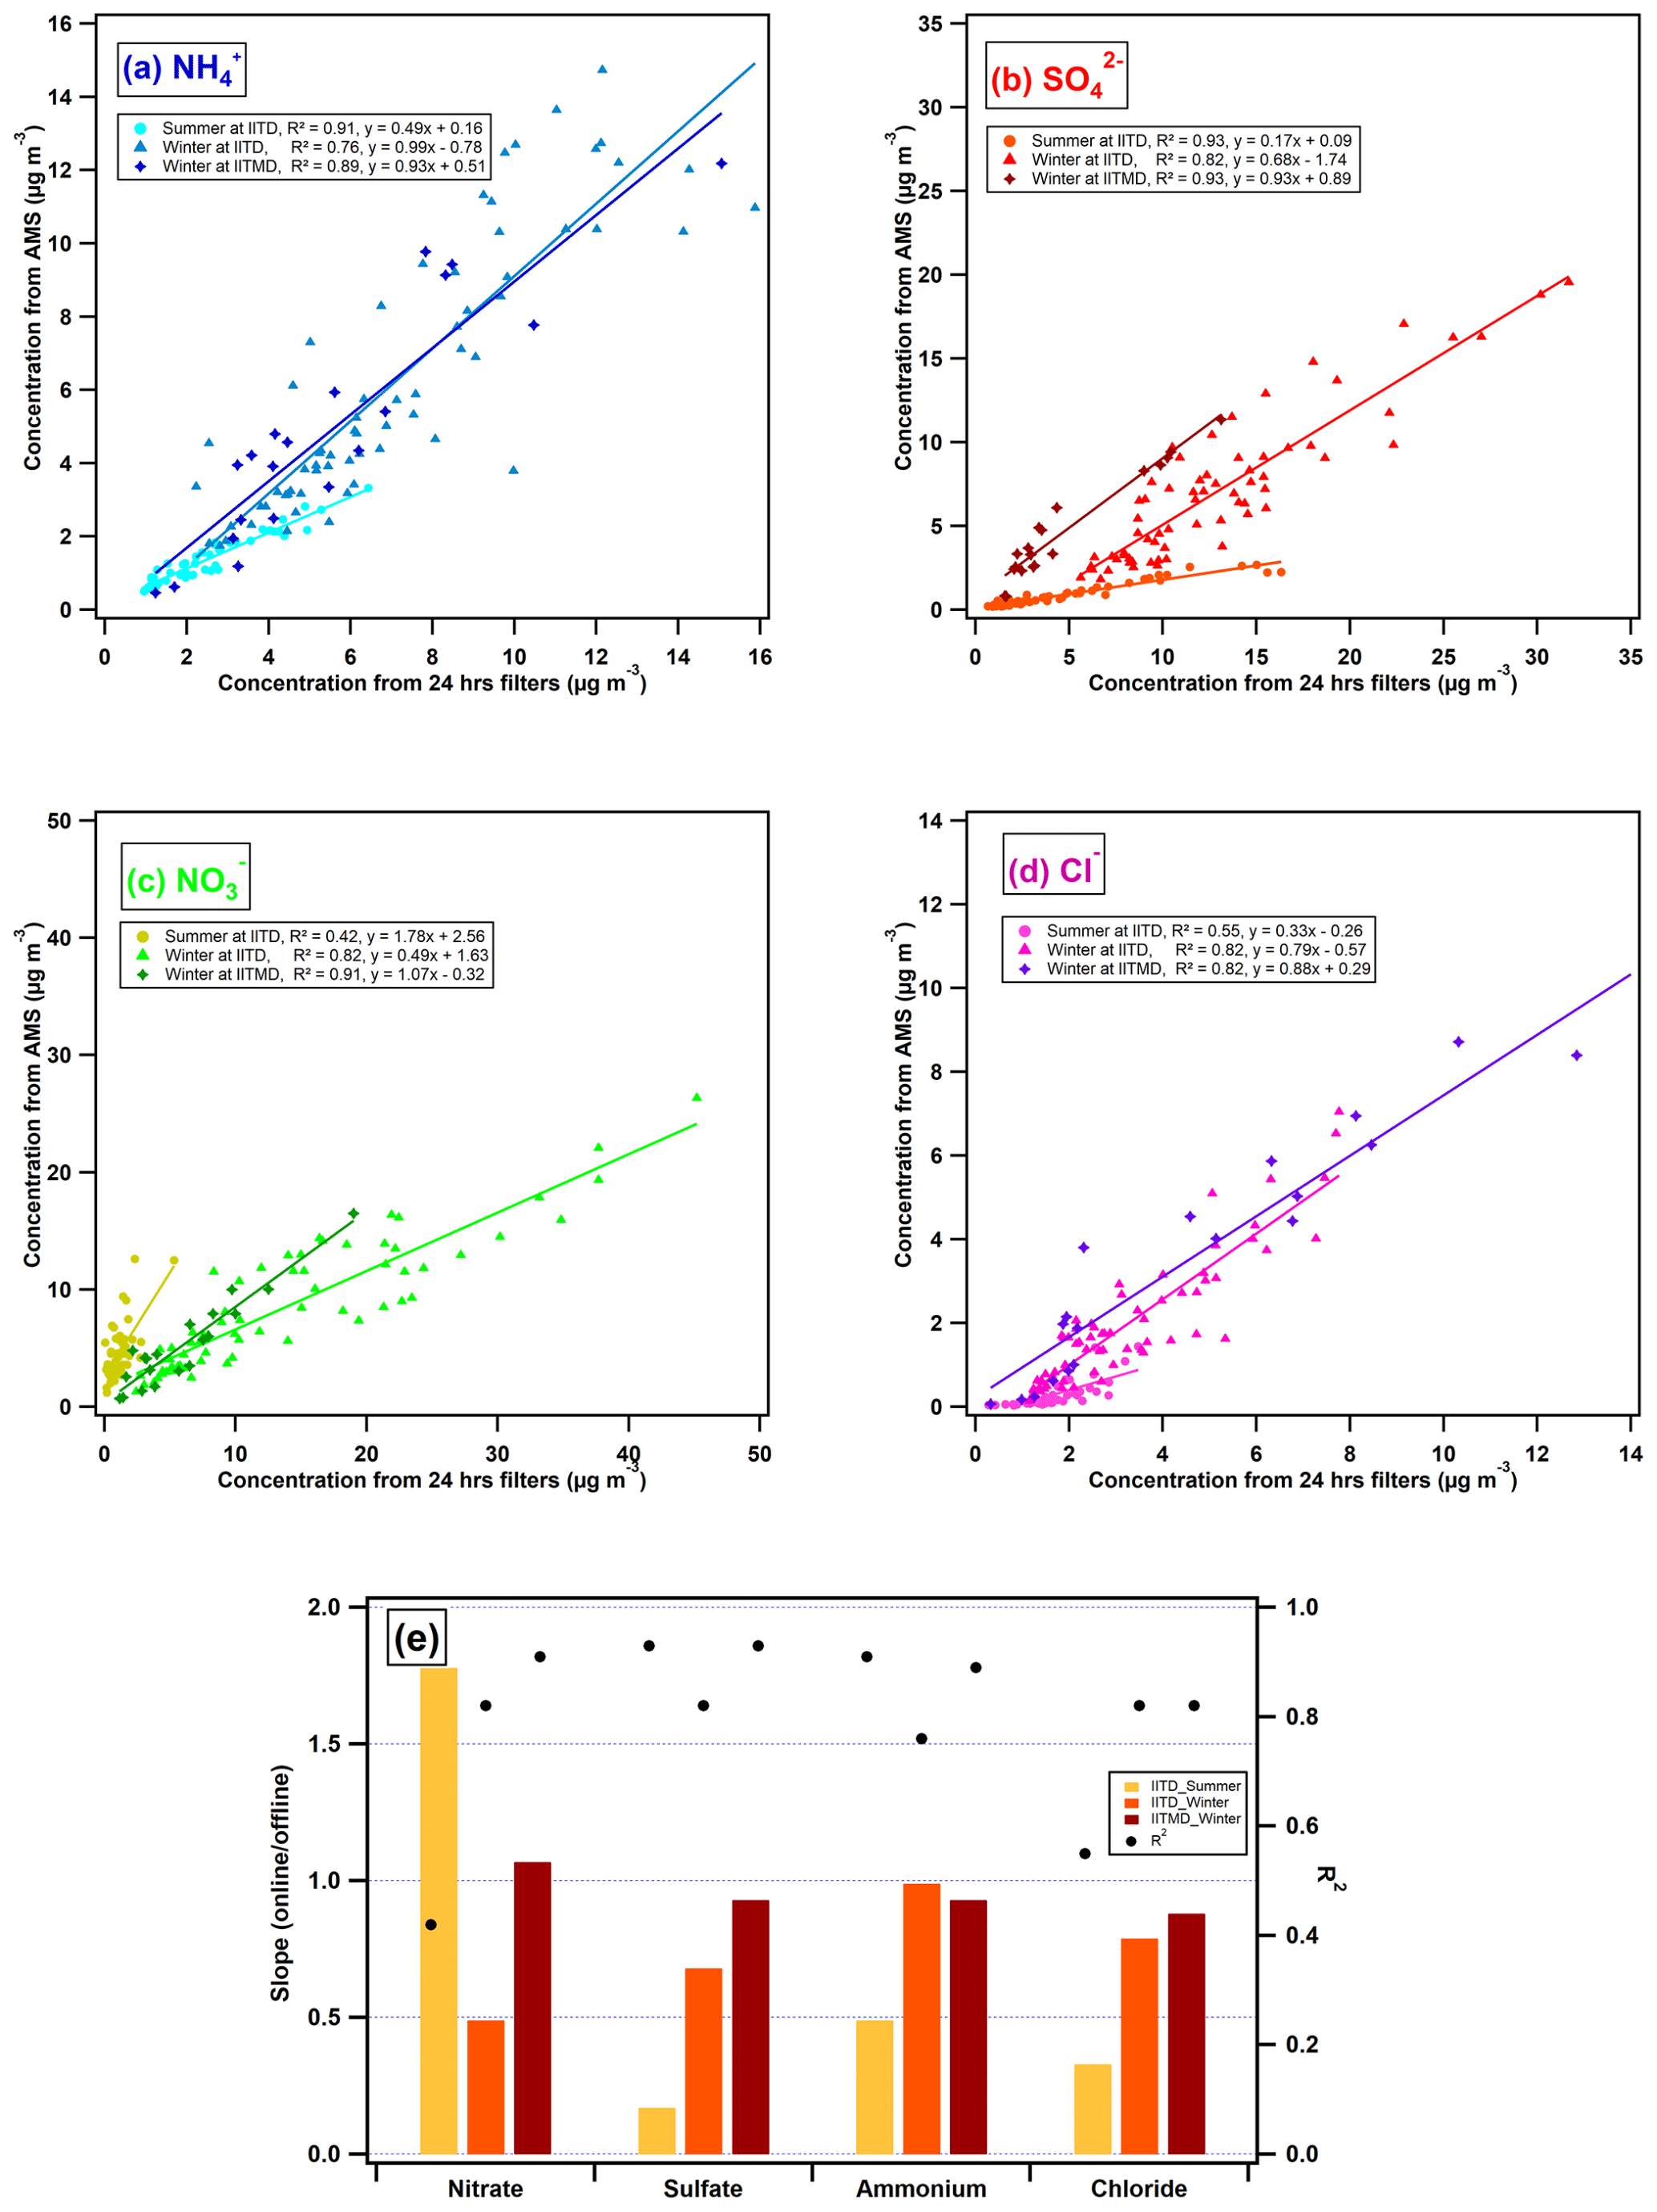
Figure 3Scatterplots between online- and offline-measured (a) NH4+, (b) SO42−, (c) NO3−, and (d) Cl− concentrations and (e) comparison of slopes (online offline) and R2 of the measured inorganic ions in PM2.5 during the summer and winter campaigns at IITD and during the winter campaign at IITMD.
The filter-based measurements of SO42− were higher than those from the online measurements for IITD and IITMD during both the seasons (Fig. 2). Their comparability is characterized by a correlation coefficient of R2=0.93 with a slope of 0.17 and R2=0.82 with a slope of 0.68 at IITD during the summer and winter campaigns, respectively. Interestingly, offline SO42− data correlate well with online SO42− data, having a correlation coefficient of R2=0.93 with a slope close to 1 (0.93) during the winter campaign at IITMD (Fig. 3). A slope of less than 0.5 was observed in Malaguti et al. (2015) in Italy during the warm period, whereas the offline measurement of SO42− was 34 % lower than the AMS measurements in Pandolfi et al. (2014). The higher SO42− concentrations on the un-denuded offline filter-based measurements could be due to refractory sulfate (e.g., potassium or calcium sulfate). The higher filter-sulfate could possibly also be because of the positive sampling artifact. The SO2 is absorbed on the filter by the collected alkaline particles (Nie et al., 2010). The higher concentration could also be due to the formation of ammonium bi-sulfate or ammonium sulfate because of the reaction between gas-phase ammonia and the acidic aerosols (Nicolás et al., 2009). Also, the un-denuded filter measurements could lead to higher filter-sulfate. The interaction of gas-phase ammonia with acidic aerosols can be minimized by using denuders while collecting aerosols on the filters (Nault et al., 2020). Some studies have suggested that the organic sulfate, nitrate, and reduced nitrogen thermally decompose and/or undergo electron ionization in the AMS, producing inorganic ions. NO+ and NO2+ contribute a significant fraction in organic nitrate (Day et al., 2022), whereas, for organic sulfates, a large fraction of the signal is contributed by SO+, SO2+, and SO3+ (Chen et al., 2019). Though the additional inorganics are minimal, this could lead to possible marginal biases between the online and offline measurement of the inorganics.
The online and offline NO3− measurements posed a good correlation during winter (R2=0.91 and slope of 1.07 at IITMD; R2=0.82 and slope of 0.49 at IITD), whereas the correlation worsens during summer at IITD (R2=0.42 and slope of 1.78) (Fig. 3). The slopes and correlation coefficients for the WSIs are listed in Table 2. The NO3− concentrations measured by the HR-ToF-AMS were higher than the offline data during summer at IITD and during winter at IITMD, whereas filter-based measurements of NO3− were higher during winter at IITD (Fig. 2). The higher offline NO3− concentrations during winter at IITD can possibly be because of the positive artifact due to the absorption of gas-phase nitric acid (HNO3) on the filter (Chow, 1995). Many studies (Chow et al., 2008; Kuokka et al., 2007; Malaguti et al., 2015) have reported higher concentrations of NO3− from high-time-resolution measurements than from filter-based measurements due to the evaporation of ammonium nitrate collected on filters over the duration of sample collection (Pakkanen and Hillamo, 2002; Schaap et al., 2004; Kuokka et al., 2007). Pandolfi et al. (2014) observed NO3− HR-AMS filter ratios of ∼1.7 at Barcelona and Montseny in Europe. This evaporation loss increases with decrease in humidity and increase in temperature (Chow et al., 2008; Takahama et al., 2004). Also, complete evaporation may occur beyond 25 ∘C (Schaap et al., 2004). Chow et al. (2008) observed the evaporation loss from quartz filters to be more than 80 % during the warm season in central California. The high temperature (35–48 ∘C) during the long sampling hours (24 h) may be a possible reason for the poor correlation between online and offline NO3− measurements during the summer campaign at IITD. Schaap et al. (2004) reported that the NO3− volatilization during a 24 h sampling period depends not only on the sampling instruments and ambient conditions but also on the sampling strategy. If the sampling strategy is evening to evening (24 h), the samples will lose the night NO3− sampled during the night with the increasing temperature during the day. However, during a morning-to-morning sampling strategy, the filters will collect the night NO3− quantitatively throughout the night, but the higher temperature in the afternoon of the previous day may promote the loss of afternoon NO3− from the filters (Malaguti et al., 2015). In this study, the sampling time was from 06:30 LT on the first day to 06:30 LT the next day. Therefore, the filter-based inorganic measurements suffered from a negative sampling artifact due to the evaporation of nitrate collected during the forenoon at a temperature of 20–25 ∘C during the winter campaign and ∼38–45 ∘C during the summer campaign.
Table 2Regression coefficients and slopes for the comparison of WSIs measured by the HR-ToF-AMS and IC.
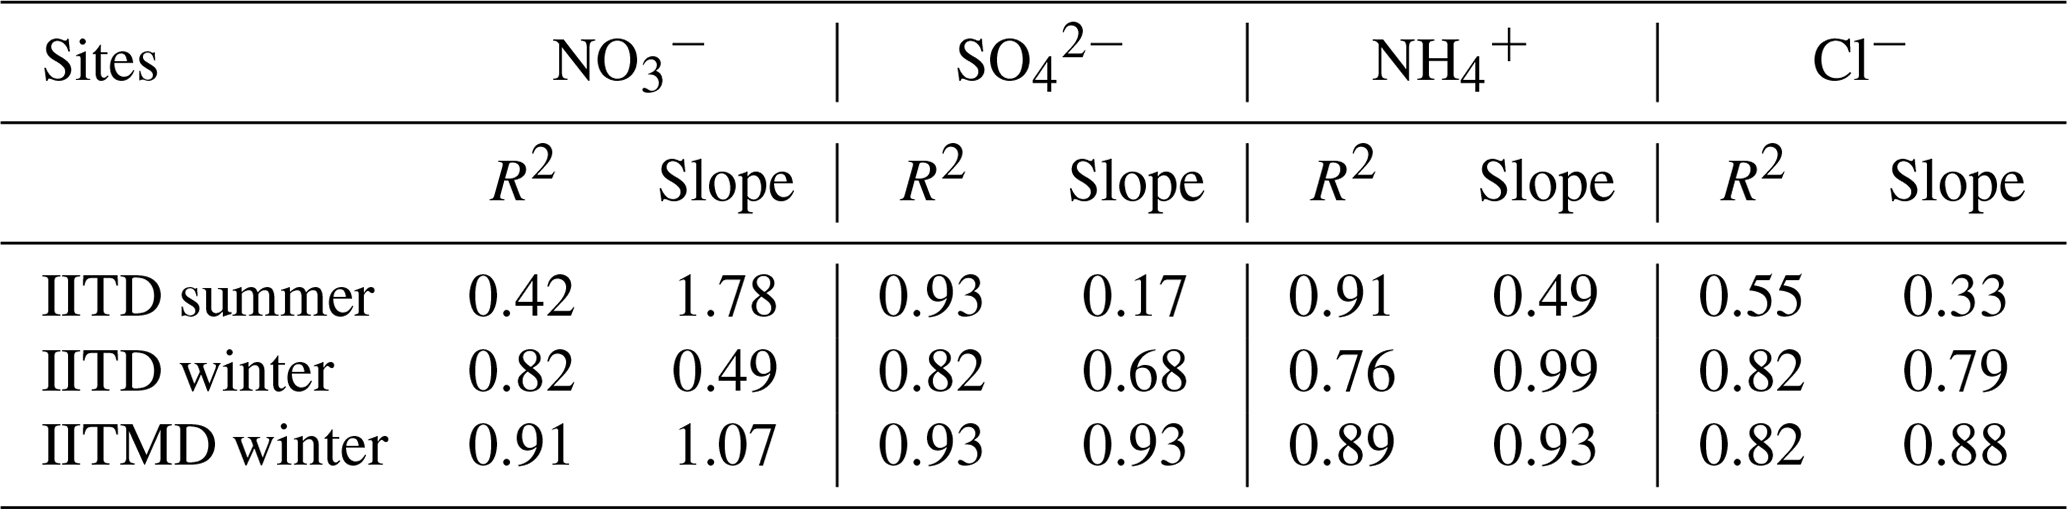
We observed higher Cl− concentration in filter-based measurement than online measurement using the HR-ToF-AMS during both campaigns at IITD and winter at IITMD. A good correlation of R2=0.82 with a slope of 0.79 and R2=0.82 with a slope of 0.88 was observed during the winter campaign at IITD and IITMD, respectively (Fig. 3). Interestingly, during the summer campaign at IITD the comparability was moderate with a correlation coefficient of R2=0.55 and a slope of 0.33. A correlation coefficient of R2=0.83 between Dp <10 µm measured with the MARGA system and analyzed from Teflon filters was reported in Makkonen et al. (2012) during February–May. Lower temperature and higher RH during winter retain Cl− in particulate phase for long enough to be detected, which is not the case in summer. Further, Cl− is predominantly found in the coarse fraction. Also, while the AMS only measures the NR Cl− (Manchanda et al., 2021), e.g., NH4Cl, which can vaporize at 600 ∘C but cannot measure Cl− from refractory KCl, IC measures chloride from all the water-soluble chloride salts, including NH4Cl and KCl. This probably justifies the lower concentration of Cl− in online measurement from the AMS than from filter-based measurements. We also compared Cl− measurements from the Xact 625i with the measurements from IC. Interestingly, IC measurements of Cl− were found to be higher than Xact 625i measurements during summer at IITD and winter at IITMD. The Cl measurements from Xact 625i were ∼1.9 times higher than the measurements from IC during winter at IITD (see Fig. S2). The correlations were found to be good during winter (R2=0.83 and R2=0.76 at IITD and IITMD, respectively) and worsen during summer (R2=0.27 at IITD), similarly to what we observed for AMS Cl− and IC Cl−. This could be due to the differences in water-soluble fraction of chloride in the samples, as ionic concentration represents the water-soluble fraction whereas elemental concentration (Xact 625i) represents total concentration. Also, a lot of particulate-bound chloride in the atmosphere is in the form of ammonium chloride (Manchanda et al., 2021). Part of the ammonium chloride collected during the day-long offline sampling would have vaporized, giving lower concentration from IC measurements. Further investigation is needed to draw a firm conclusion.
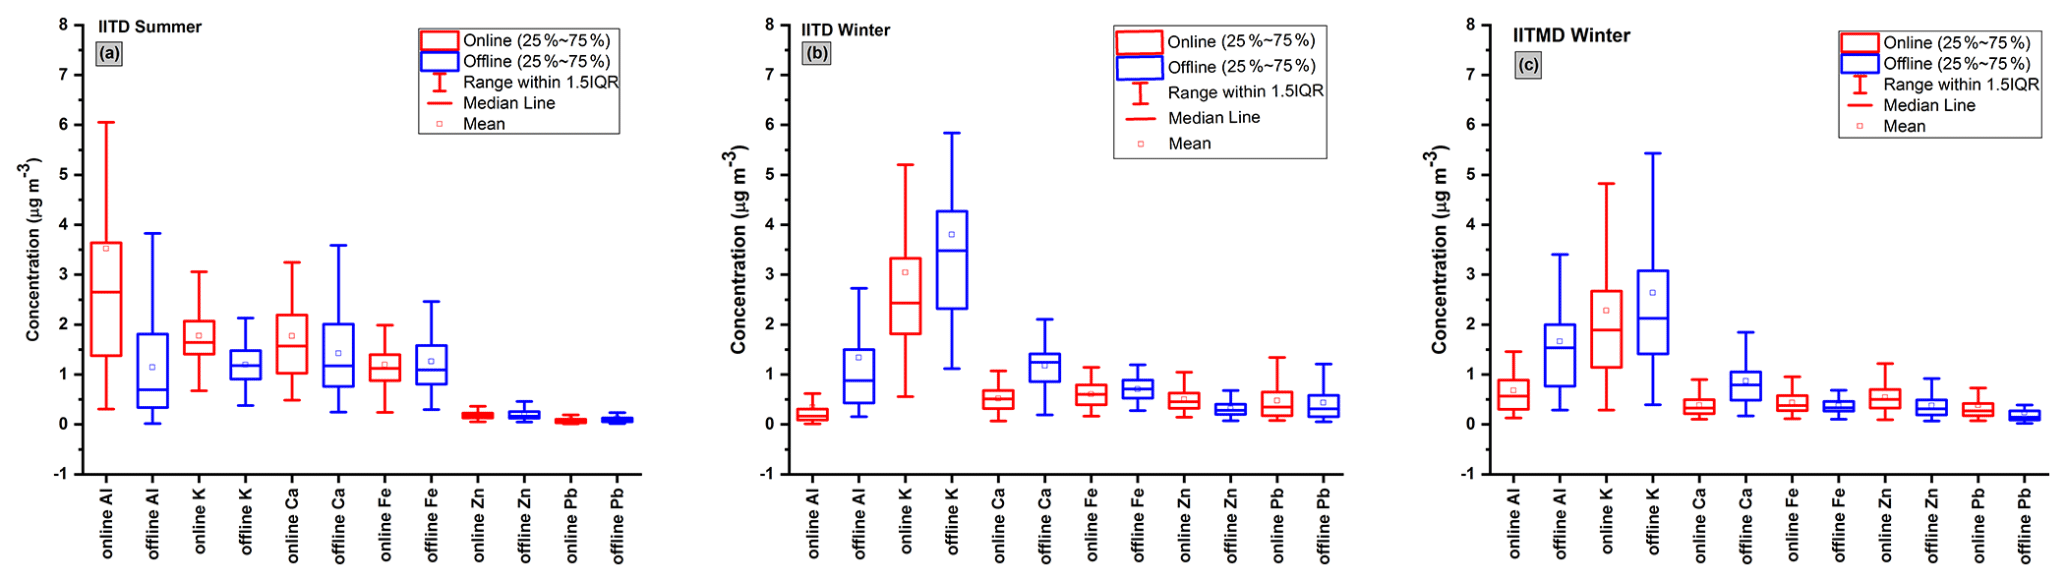
Figure 4Box plots of some major elements measured offline and online during the (a) summer campaign at IITD, (b) winter campaign at IITD, and (c) winter campaign at IITMD. The box plots for the rest of the heavy and trace elements are shown in Fig. S4.
3.2 Online and offline measurements of heavy and trace metals and their comparison
For the inter-comparison of heavy and trace metal concentrations from the Xact 625i and ICP-MS, the half-hourly Xact 625i data were averaged to a 24 h filter sampling interval. A total of 32 elements were analyzed on each filter using ICP-MS, while 27 elements were measured with the Xact 625i at IITD during the summer and winter campaigns and 30 elements were measured with the Xact 625i at IITMD during the winter campaign. The spatial and temporal variations in the crustal and trace elements are shown in Fig. S3. Al and Ca concentrations were the most abundant in ICP-MS and Xact measurements, respectively, during the summer season (Figs. 4a and 5a and b) because of the increase in the crustal activities, whereas K concentrations were significantly high for both the measurements during winter (Figs. 4d and g and 5c–f) due to mass-scale agricultural crop residue burning in the adjoining states of Punjab and Haryana. Elements emitted from anthropogenic activities, e.g., coal-fired power plants (As, Se, Hg, Pb), traffic emissions (Cr, Pb, Mn), and wear debris emissions (Cu, Cd, Fe, Ga, Mn, Mo), are found to be in higher concentrations during the winter campaign than the summer campaign for both the measurements. Similar results were observed in our companion paper (Shukla et al., 2021). The average values of metals along with their ranges are tabulated in Table S2, and the statistics involving the mean, upper, and lower values of some major elements are shown in Fig. 4. Box plots for the rest of the metals can be found in Fig. S4.
The trends of the elemental concentration in decreasing order for both ICP-MS and Xact measurements during summer and winter at IITD and winter at IITMD are shown in Fig. S5. The trace metals such as Cd, Mn, Mo, Ba, and Pd contribute a small portion of PM2.5 in terms of their mass concentration but have a significant effect on human health. Fractions of elements in the total element concentration for both the measurements during the summer and winter campaigns at IITD and during winter campaign at IITMD are shown in Fig. 5.
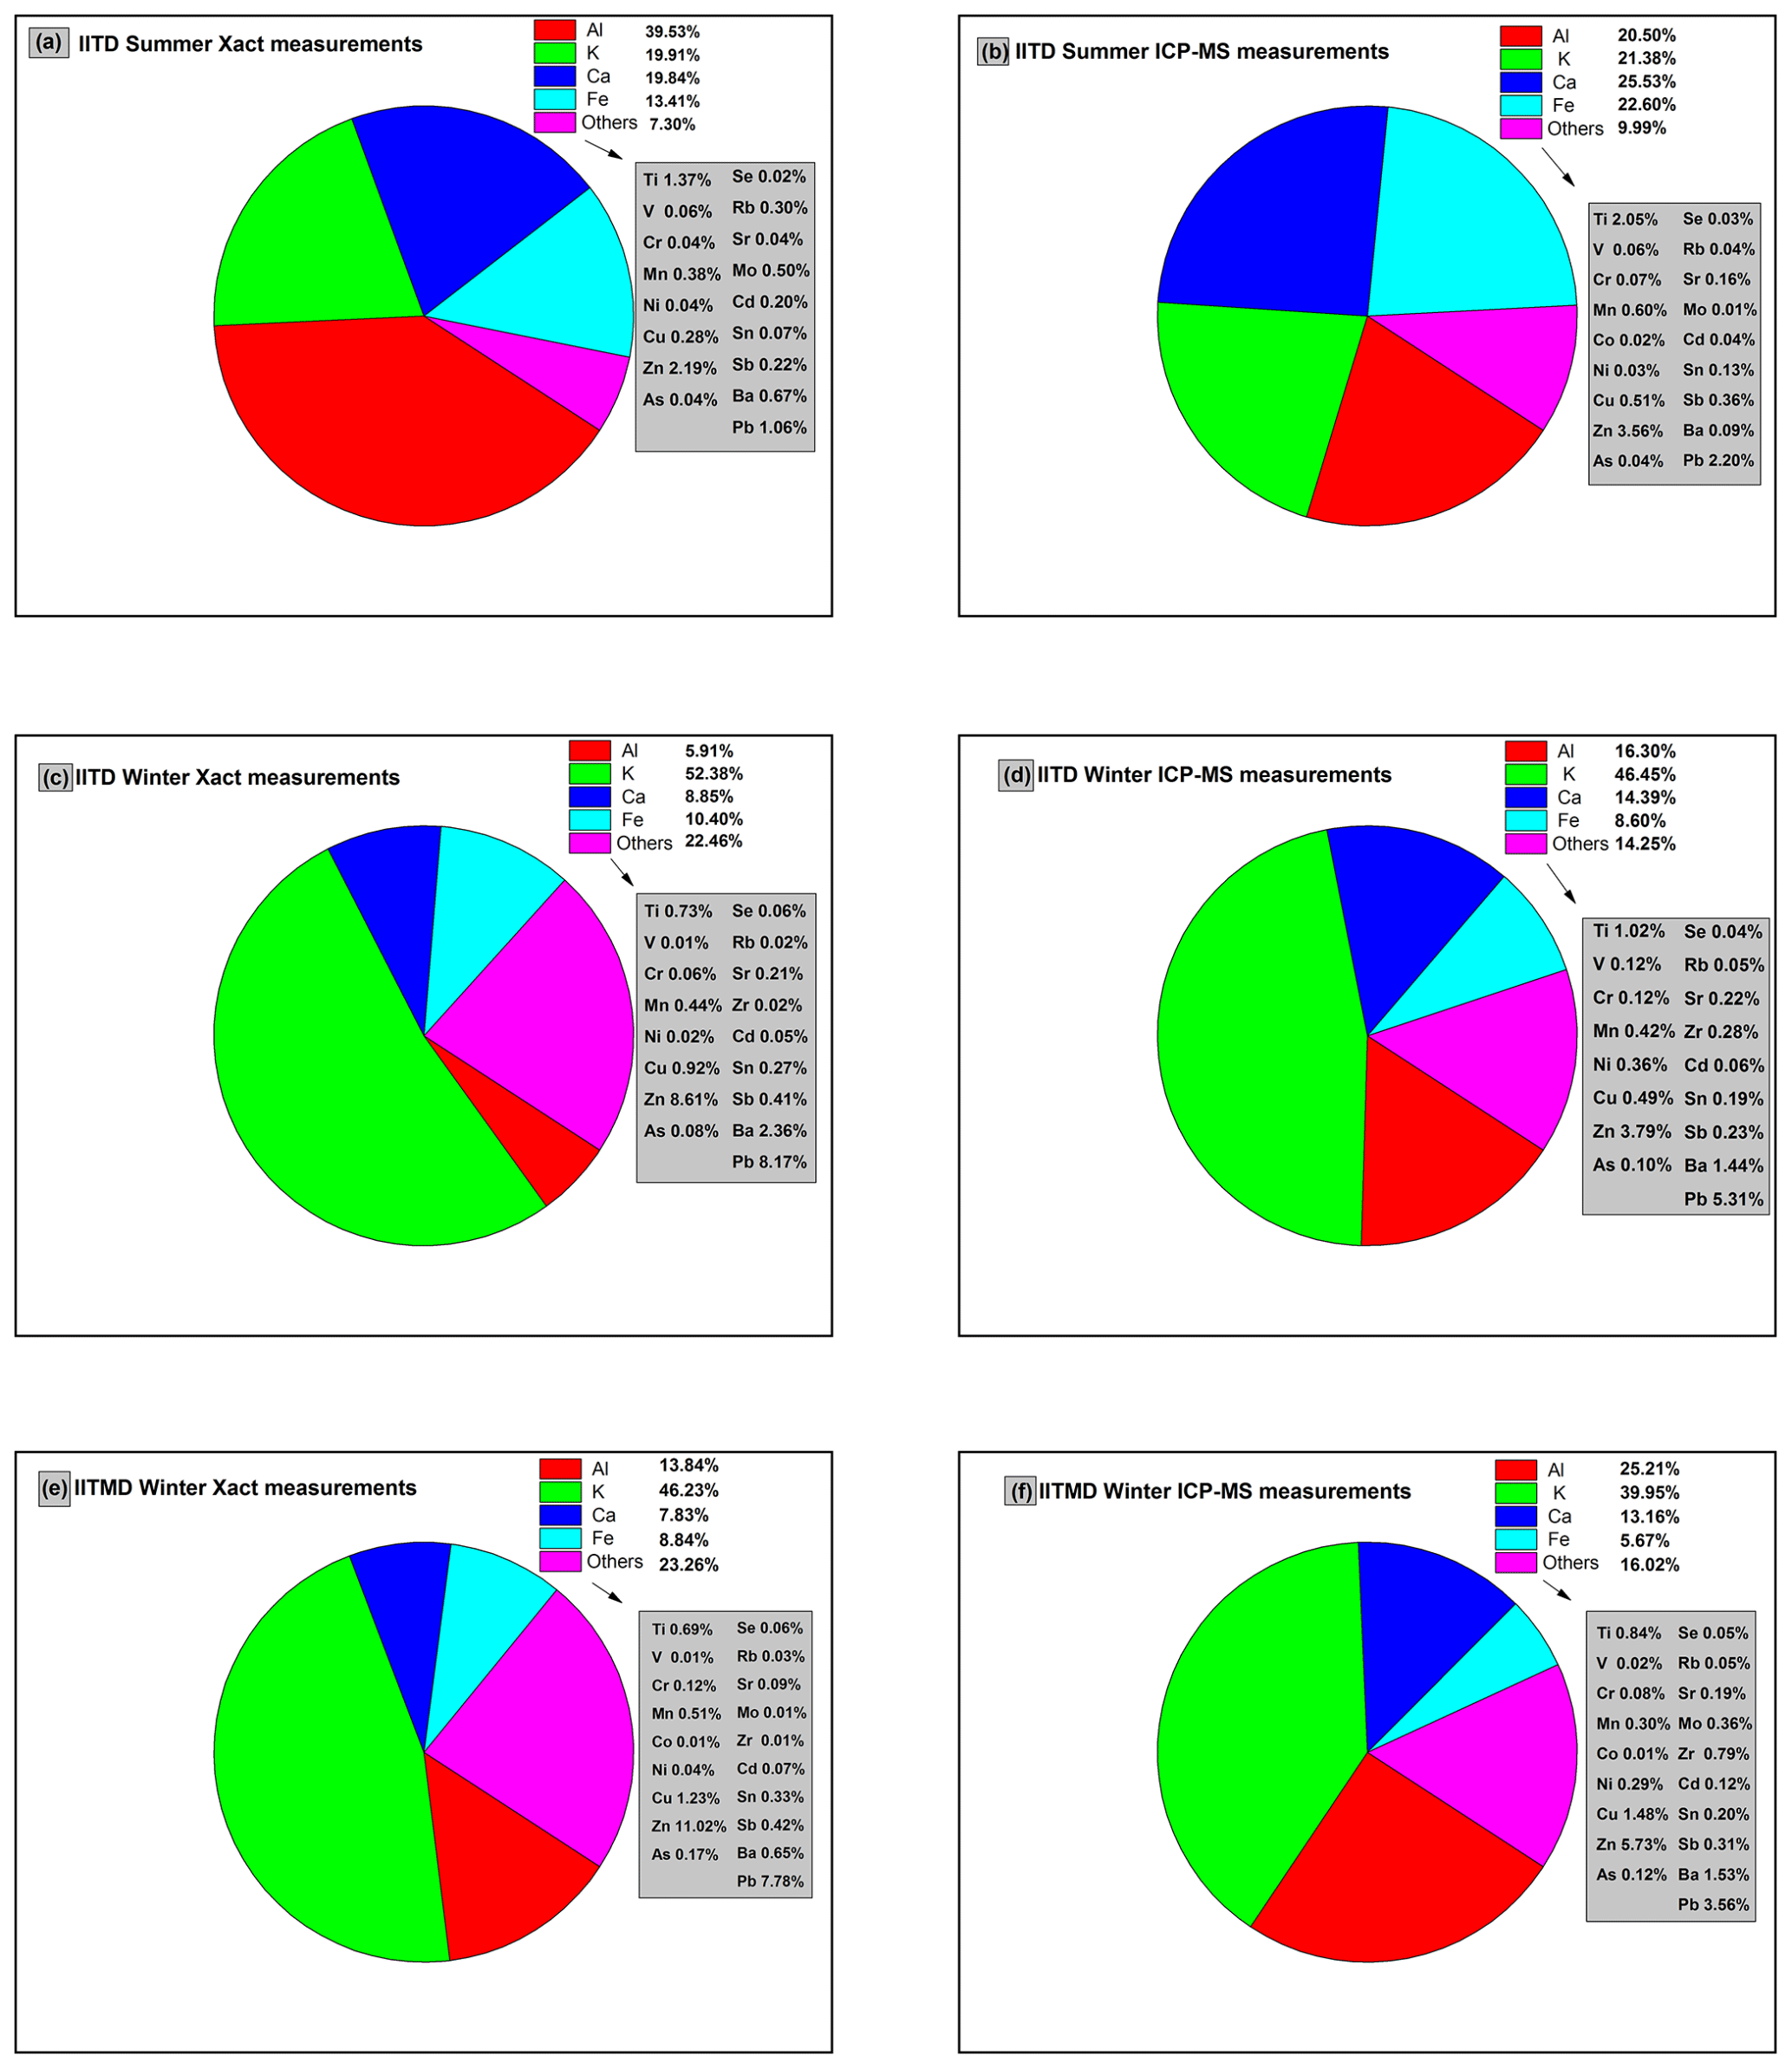
Figure 5Fractions (%) of elements in the total element concentration in PM2.5 presented in pie format for online (a, c, e) and offline (b, d, f) measurements during winter and summer at IITD and during winter at IITMD.
MDLs for ICP-MS measurements were calculated according to Escrig Vidal et al. (2009), and MDLs for the Xact 625i were obtained from the manufacturer. MDLs for the Xact 625i and ICP-MS are listed in Table S2. Though the half-hourly Xact data were averaged to the corresponding 24 h interval of the filter sampling, for a comparability check, MDLs of Xact 625i measurements were taken for a 30 min sampling time while MDLs of filter-based elemental measurements were calculated for 24 h. Elements having data below 3 × MDL were discarded from further examination and considered unreliable as values below 3 × MDL would lead to higher uncertainty (Furger et al., 2017). The elements K, Ca, Ti, Mn, Fe, Ba, and Pb have >80 % of their values above both offline and online MDLs, and thus the data quality is reliable. Further, Ni, Mo, and Zr have higher blank concentrations, and thus the data are not reliable for ICP-MS measurements. The comparability of the elements measured online using the Xact 625i with those analyzed using ICP-MS was checked for the common elements in these two measurements (21 elements for IITD and 23 elements for IITMD) and is shown in Fig. 6.
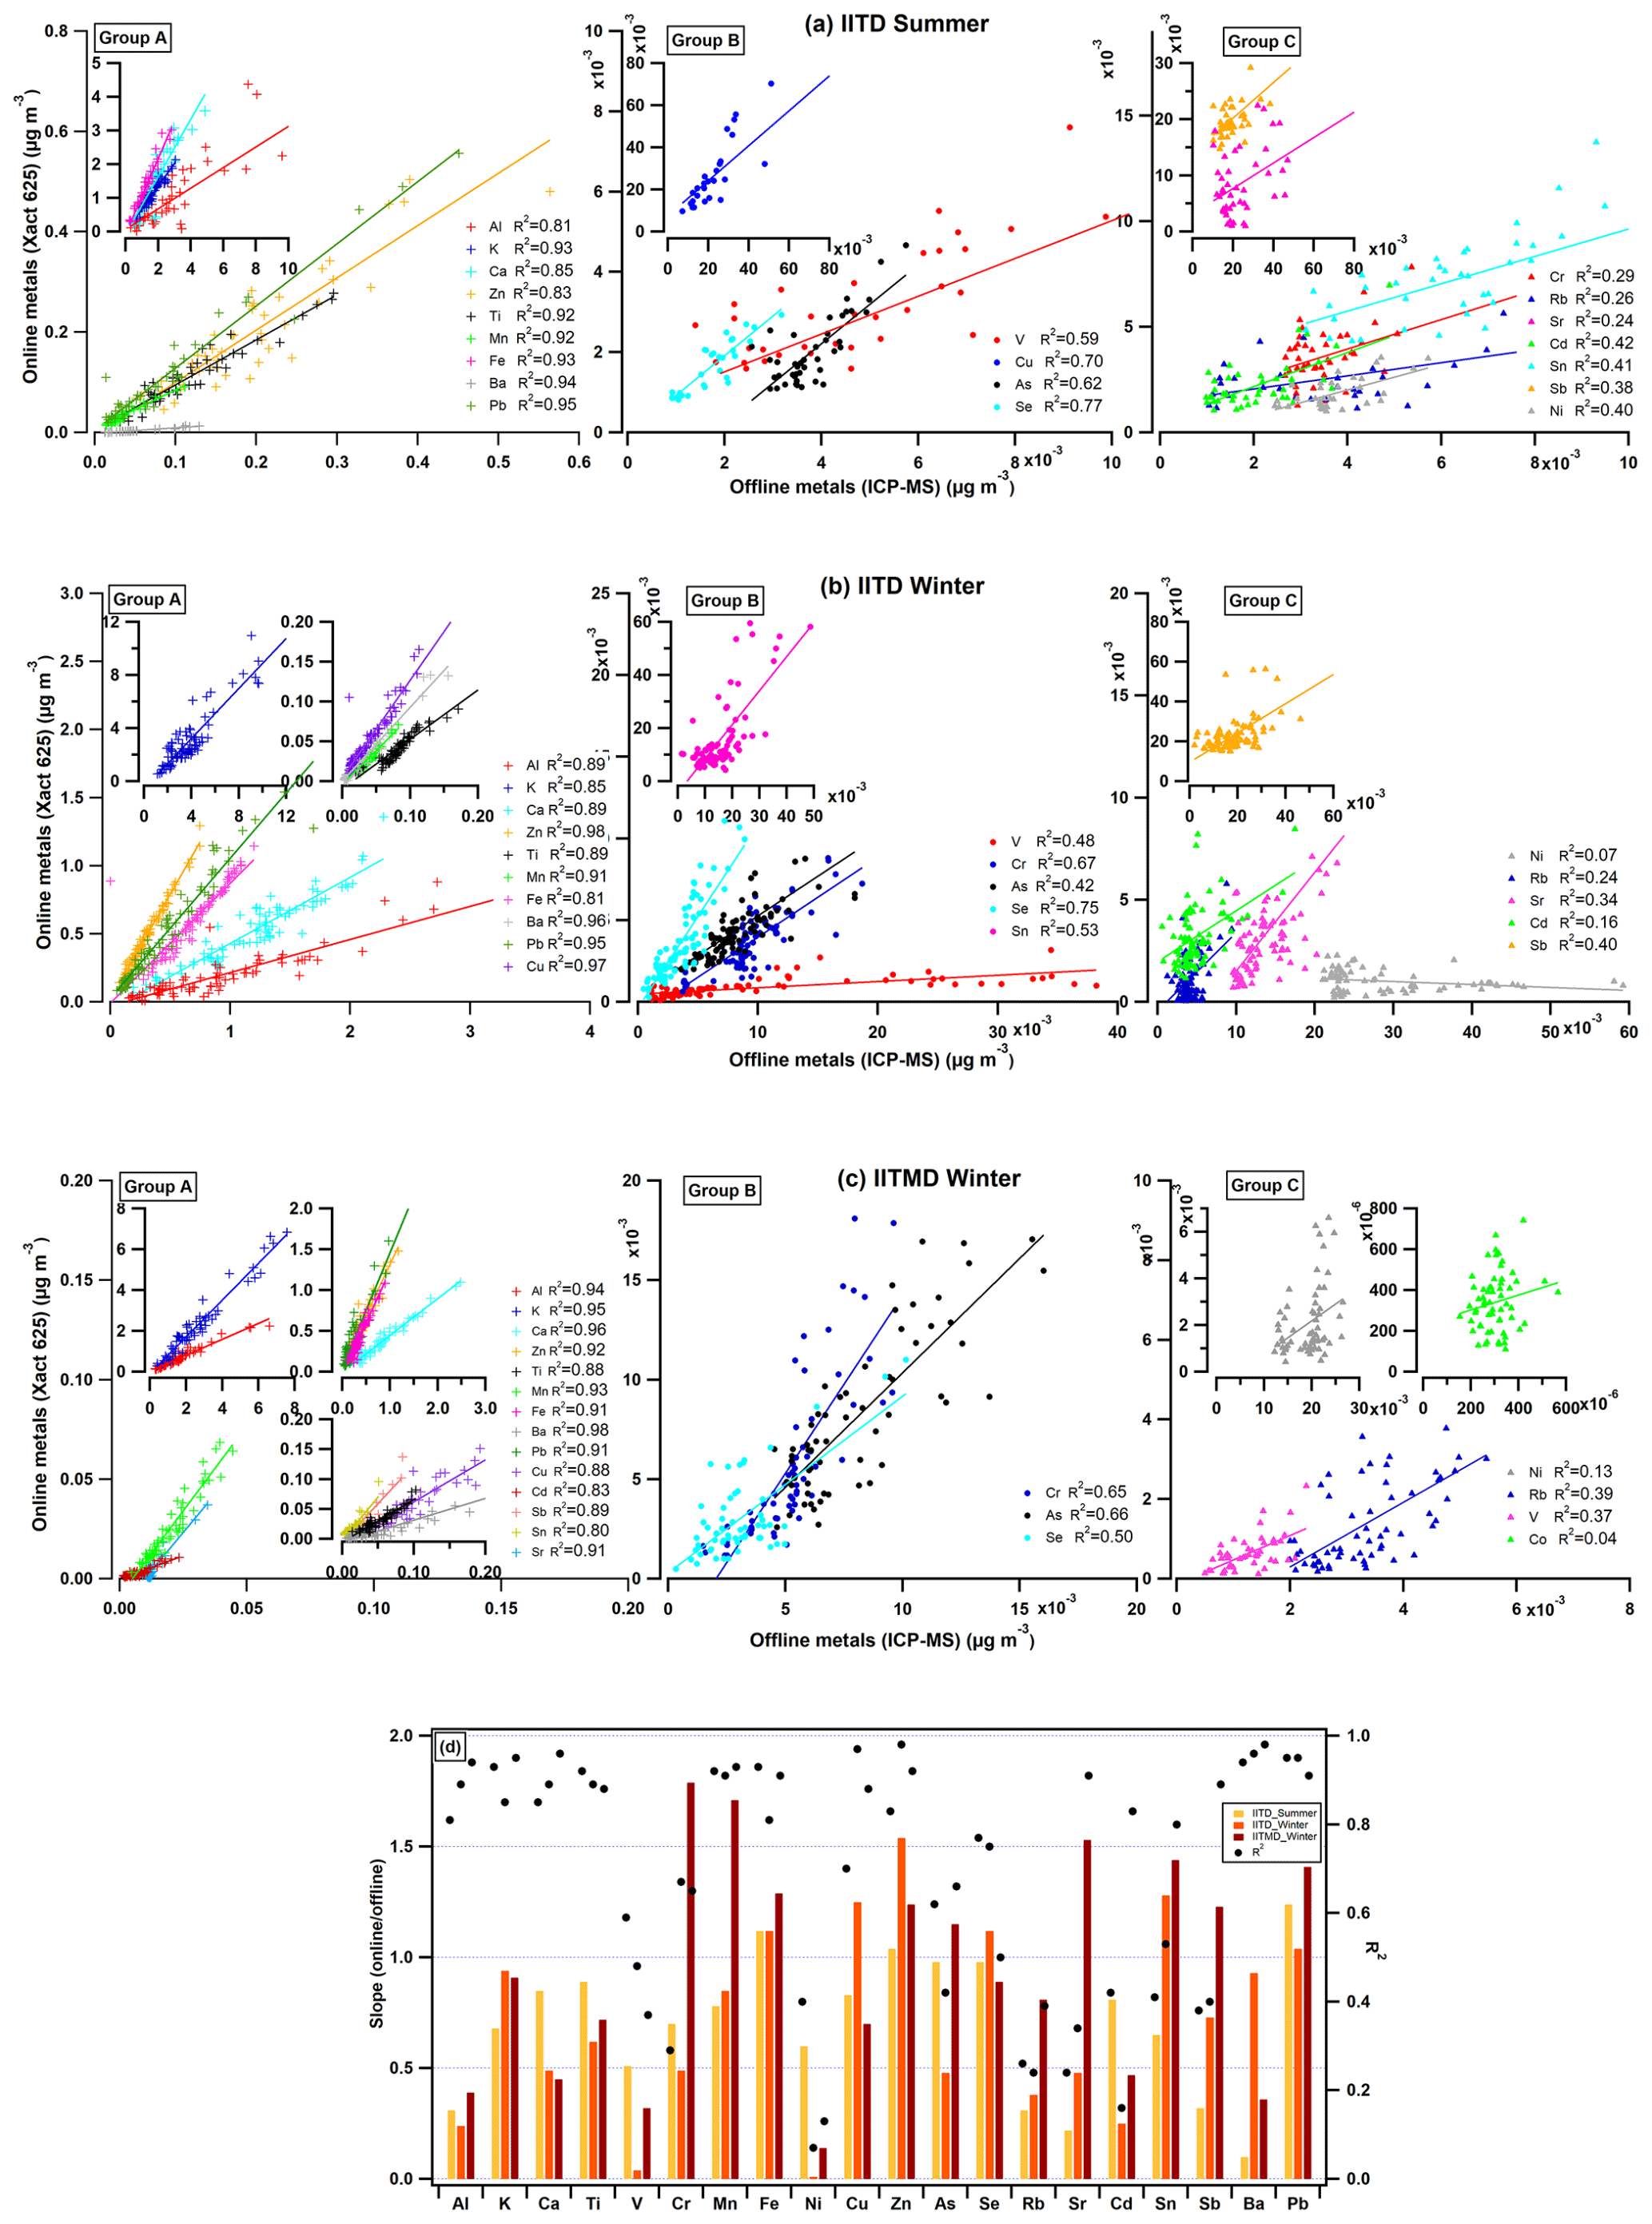
Figure 6Scatterplots and regression lines of Xact 625i vs. ICP-MS data for groups A, B, and C during (a) summer at IITD, (b) winter at IITD, and (c) winter at IITMD and (d) comparison of slopes (online offline) and R2 of the measured heavy and trace metals in PM2.5 during the summer and winter campaigns at IITD and winter campaign at IITMD.
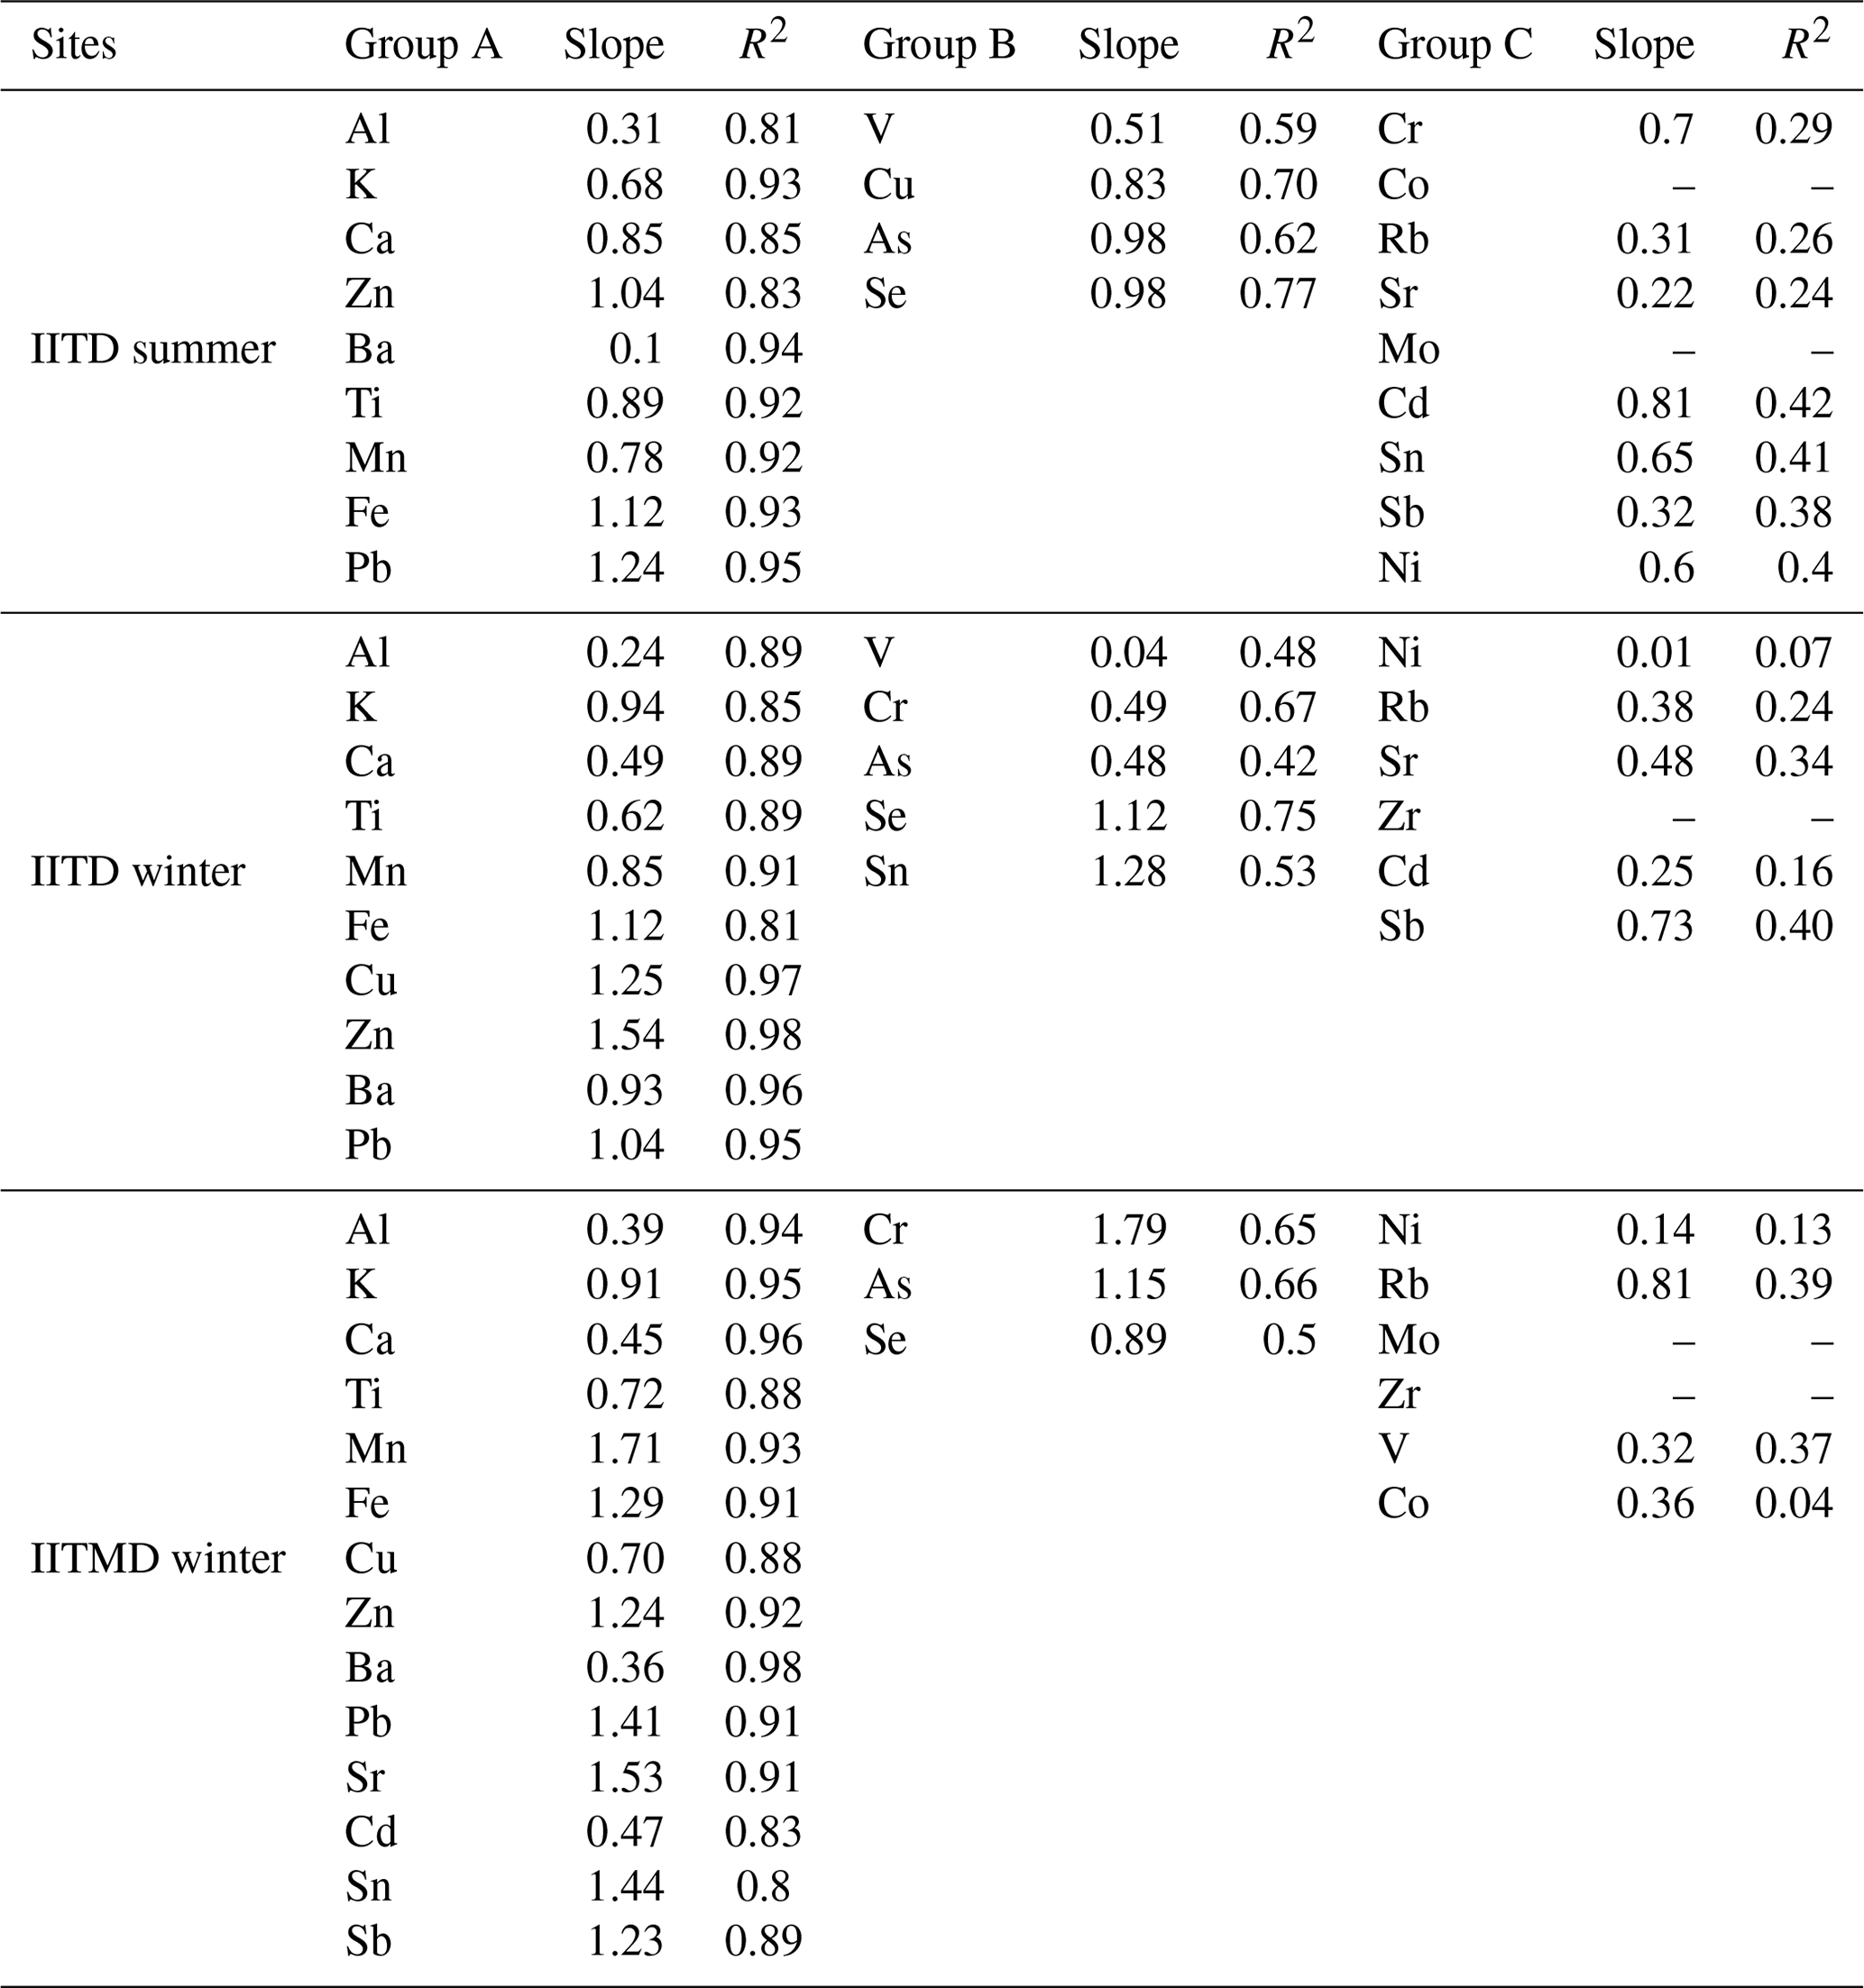
Based on their comparability characteristics, elements were grouped into three categories. Group A showed excellent linearity between the two methods with a correlation coefficient of R2>0.8. Overall, group A consists of Al, K, Ca, Ti, Mn, Fe, Cu, Zn, Ba, and Pb during winter at IITD, whereas Cu showed up in another group during summer at IITD. Though Sr, Cd, Sn, and Sb had average values below MDLs and posed a lower correlation coefficient at IITD, interestingly, they joined group A during winter at IITMD. To distinguish the potential difference in accuracy between the two methods, intercepts were not forced to be zero. The slopes are important, which indicates biases between the two measurements. The slopes of Zn, Fe, and Pb were closer to unity during summer at IITD (Fig. 6). K, Fe, Cu, Zn, Ba, and Pb achieved a slope of 0.94–1.25 during winter at IITD, whereas Mn, Fe, Zn, Pb, Sr, Sn, and Sb achieve a slope slightly higher than unity during winter at IITMD (Fig. 6). A slight difference in the cutoff value for the particle size can reduce the slopes from unity and produce ∼10 % difference in collected mass (Panteliadis et al., 2012). The slopes and the correlation coefficients are listed in Table 3.
Table 3Regression coefficients and slopes for the comparison of Xact 625i and ICP-MS measurements.
In a comparison study conducted by U.S. EPA and ETV (2012) between Xact 625i and ICP-MS measurements, Ca, Mn, Pb, Se, and Zn were highly correlated but Cu was not. Cu was close to the MDL values of ICP-MS and the Xact 625i. A good agreement was observed between Xact 625i and offline measurements using energy-dispersive X-ray fluorescence (ED-XRF) in South Korea by Park et al. (2014). The comparability between Xact measurements and ICP-MS measurements was checked for the elements As, Ba, Ca, Cr, Cu, Fe, K, Mn, Ni, Pb, Se, Sr, Ti, V, and Zn in Tremper et al. (2018). They observed an average R2 of 0.93 and a slope of 1.07 for these elements. In the study by Furger et al. (2017) during a warmer season in Switzerland, an excellent correlation (R2>0.95) was found for Xact, ICP-OES, and ICP-MS measurements of S, K, Ca, Ti, Mn, Fe, Cu, Zn, Ba, and Pb. However, they found that the elemental measurements by the Xact 625i were 28 % higher than ICP-OES and ICP-MS measurements for these 10 elements. In our study, Xact measurements of Fe, Cu, Zn, and Pb yielded an average of 24 % higher mass concentrations than ICP-MS measurements for group-A elements during winter at IITD. Xact measurements were systematically 10 % (average) higher than ICP-MS for Zn, Fe, and Pb during summer at IITD, whereas we obtained an average of 41 % higher Xact measurements than ICP-MS for Mn, Fe, Zn, Pb, Sr, Sn, and Sb during winter at IITMD in group-A elements.
Group B was characterized by moderate linearity, with R2∼0.4–0.8, and consisted of the elements V, Cu, As, and Se during summer at IITD; V, Cr, As, Se, and Sn during winter at IITD; and Cr, As, and Se during winter at IITMD. These elements in group B had their values very close to or below MDLs of at least one of the analysis methods. During winter at both sites, Cr and As from ICP-MS had ∼50 %–65 % of their values below MDLs, whereas ∼68 %–72 % of their values were above the MDLs of the Xact 625i. Though some of the elements in this group in different seasons have slopes near or greater than unity (see Table 3) like group A, their comparison is not statistically feasible.
The group-C elements, e.g., Ni, Rb, Sr, Zr, Cd, and Sb during summer at IITD; Cr, Co, Rb, Sr, Mo, Cd, Sn, Sb, and Ni during winter at IITD; and Ni, Rb, Mo, Zr, V, and Co during winter at IITMD are characterized by their bad correlation (R2<0.4). Interestingly, measurements of some elements, e.g., Mo during summer and winter at IITD and IITMD, respectively; Co during summer at IITD; and Zr during winter at both sites from both the methods, did not correlate at all. For most of the elements in this group, 70 %–85 % of measurements were below both methods' MDLs and the rest of the data were below 3 × MDL. The high and variable blank concentrations of these elements increased the MDL values in ICP-MS measurement. The particle-size-dependent self-absorption effect and line interference between different elements in Xact measurement could also increase the MDL values (Furger et al., 2017). This is probably the reason for the values lower than MDLs for the elements in this group.
Overall, we observed 10 %–40 % higher Xact measurements than ICP for some of the elements in group A during different seasons. The difference in the Xact and high-volume sampler inlet locations and their distance from the road can cause such difference in measurements (Furger et al., 2017). In the case of dust resuspension from vehicular traffic, the number concentration of finer particulate matter tends to decrease sharply within an increment of just 50 m from the roadway (Hagler et al., 2009). In this study, we tried to co-locate the two sample inlets, but the effect could not be avoided. Also, IITD and IITMD are both very close (<200 m) to a roadway with moderate to heavy traffic. The differences in online and offline measurements may indicate a gradient in some elements due to very close proximity to heavy traffic. Also, the different temperatures of the sample inlets may give rise to a difference in measured concentrations from both methods (Tremper et al., 2018). In this study, the blank-corrected ICP-MS measurements may result in overestimation or underestimation due to variable and high blank concentration. The difference can also occur due to the digestion recovery rate for the digestion protocol used for the filter analysis. Moreover, if the ambient elemental concentration is much lower than the standards used for calibration of the Xact instruments, such differences may occur (Indresand et al., 2013).
Atmospheric WSIs (NO3−, SO42−, NH4+, Cl−) and heavy and trace elements in PM2.5 were measured using offline methods (IC for WSIs and ICP-MS for elements) and online methods (HR-ToF-AMS for inorganics and Xact 625i for elements). These measurements were compared to assess the measurement quality and sampling artifacts of these measurement techniques in the heavily polluted Delhi NCR for two different metrological conditions (winter and summer seasons). Field campaigns were conducted at two Delhi NCR sites, namely, IITD during June–July 2019 and October–December 2019 and at IITMD during October–December 2019. The key findings of this study are summarized below:
-
NH4+ concentrations from IC and the HR-ToF-AMS compared well during winter with a slope of 0.99 at IITD and 0.93 at IITMD. Interestingly, NH4+ concentrations were higher in offline measurements during summer at IITD. The decrease in slope was probably due to the formation of particulate (NH4)2SO4.
-
Offline SO42− measurements were higher (with a slope of 0.17 during summer at IITD and 0.8 and 0.93 during winter at IITD and IITMD, respectively) during both seasons at both the sites due to the positive sampling artifact. The absorption of SO2 and the oxidation or condensation process may result in additional sulfate.
-
Lower NO3− concentrations (with a slope of 1.78 during summer at IITD and 1.07 during winter at IITMD) were observed in the offline measurement during summer at IITD and during winter at IITMD because of the evaporation of NH4NO3 from the filter substrates. The evaporative loss of nitrate from the filters was minimal in winter at IITMD. It was aggravated during summer at IITD due to the evaporation of ammonium nitrate in such a high-temperature range (35–48 ∘C). The higher NO3− concentrations (slope ∼0.49) in the filters than HR-ToF-AMS measurements during winter at IITD could be due to the absorption of gas-phase HNO3 on the filter.
-
Offline Cl− was consistently higher (with a slope of 0.33 during summer at IITD and 0.79 and 0.88 during winter at IITD and IITMD, respectively) than HR-ToF-AMS measurements during both seasons at both sites mainly because the HR-ToF-AMS only measures the NR Cl−, whereas the offline Cl− measurements includes chloride from all the water-soluble chloride salts. The comparability degrades during summer due to the volatile nature of Cl− in higher temperatures and lower RH.
-
The elements were grouped into three categories (groups A, B, and C) according to their comparability characteristics. The elemental data from the Xact 625i were highly correlated (R2>0.8) with ICP-MS measurements of the 24 h filters for group-A elements (Al, K, Ca, Ti, Zn, Mn, Fe, Ba, and Pb). The Cu also showed up in this group during winter at IITD. About 80 % of the data for these elements were above MDLs for both the methods. Though Sn, Sb, and Cd had values below MDLs of one or both the methods, interestingly, they were highly correlated (R2>0.8), and slopes are very close to unity for Sn and Sb during winter at IITMD. The correlation coefficients >0.8 for the elements in group A indicated the high precision of the online and offline measurements. Hence, these elements from any of these methods can be reliably used for modeling studies.
-
The elements under group B had their values closer to or below at least one of the method's MDLs. Cr and As had ∼50 %–65 % of their values below ICP-MS MDLs from ICP-MS, whereas ∼68 %–72 % of their values were above Xact 625i MDLs during winter at both sites.
-
Elements like Ni, Mo, and Zr measured from the ICP-MS were not reliable due to their higher and variable blank concentrations. No conclusion on their measurement accuracy by the two methods can be drawn.
-
In summary, the daily averaged half-hourly Xact 625i measurements were 10 %–40 % higher than 24 h filter measurements by ICP-MS depending upon the seasons, sites, and elements in group A. The distance between the two inlets for the two methods, the distance of the inlets from the roadway, line interference between two elements in Xact measurements, particle size, the sampling strategy, the filter type, higher and variable concentrations in blank filters, and the digestion protocol for ICP measurements could have caused the difference in measurements between the two methods.
The above findings highlight the measurement methods' accuracy and imply the particular type of measurements needed. Denuders could be effective in avoiding the overestimation problems of ammonium and sulfate in filter measurements and improving the comparison. Also, Teflon filters instead of quartz filters in the un-denuded sampler are reported to give better comparison for sulfate. The MDLs in the Xact 625i measurements are higher than the MDLs for the offline method. Depending on the objective of the campaign, the Xact 625i can be deployed for a longer time interval to analyze the elements that are below their MDLs. The high-resolution real-time monitoring of non-refractory organics and inorganics by the HR-ToF-AMS and elements by the Xact 625i comes at the cost of high sensitivity in MDLs, calibrations, and expense, whereas the cost effectiveness of conventional samplers makes it practical to deploy them in larger numbers at multiple sites simultaneously. Overall, high-resolution real-time sampling provides a rich data set for high- and low-pollution episodes. Future work should involve using different filter substrates and different digestion protocols to re-evaluate the difference between these online and offline methods. Although this study compares the PM species, a comparison of full source apportionment analysis between online and offline methods should be performed for more qualitative and quantitative insights.
Data are available upon request from the correspondence author.
The supplement related to this article is available online at: https://doi.org/10.5194/amt-15-2667-2022-supplement.
HSB performed the offline analysis and data processing and wrote the manuscript. JD collected the AMS data at IITD. AS and VL carried out the Xact and AMS data collection and processing, respectively. NR, MK, VS, and SNT were involved with supervision and conceptualization. All co-authors contributed to the paper discussion and revision.
The contact author has declared that neither they nor their co-authors have any competing interests.
Publisher's note: Copernicus Publications remains neutral with regard to jurisdictional claims in published maps and institutional affiliations.
The authors are thankful to Naba Hazarika and Mohd Faisal for collecting the Xact data at IITMD and Pawan Vats for the sampling and collection of the filters at IITD. The authors are also thankful to Amit Vishwakarma, Vaibhav Shrivastava, and Harishankar for helping in offline analysis.
This research has been supported by the Department of Biotechnology, Government of India (grant no. BT/IN/UK/APHH/41/KB/2016-17, dated 19 July 2017), and Central Pollution Control Board (CPCB), Government of India (grant no. AQM/Source apportionment_EPC Project/2017, dated 12 February 2019).
This paper was edited by Anna Novelli and reviewed by three anonymous referees.
Bhowmik, H. S., Naresh, S., Bhattu, D., Rastogi, N., Prévôt, A. S. H., and Tripathi, S. N.: Temporal and spatial variability of carbonaceous species (EC; OC; WSOC and SOA) in PM2.5 aerosol over five sites of Indo-Gangetic Plain, Atmos. Pollut. Res., 12, 375–390, https://doi.org/10.1016/j.apr.2020.09.019, 2021.
Canagaratna, M. R., Jayne, J. T., Jimenez, J. L., Allan, J. D., Alfarra, M. R., Zhang, Q., Onasch, T. B., Drewnick, F., Coe, H., Middlebrook, A., Delia, A., Williams, L. R., Trimborn, A. M., Northway, M. J., DeCarlo, P. F., Kolb, C. E., Davidovits, P., and Worsnop, D. R.: Chemical and microphysical characterization of ambient aerosols with the aerodyne aerosol mass spectrometer, Mass Spectrom. Rev., 26, 185–222, https://doi.org//10.1002/mas.20115, 2007.
CEN: Ambient air – Standard gravimetric measurement method for the determination of the PM10 or PM2.5 mass concentration of suspended particulate matter (EN 12341:2014), European Committee for Standardization (CEN), Brussels, https://www.en-standard.eu/csn-en-12341-ambient-air-standard-gravimetric-measurement (last access: 2 May 2022), 2014.
Chen, Y., Xu, L., Humphry, T., Hettiyadura, A. P. S., Ovadnevaite, J., Huang, S., Poulain, L., Schroder, J. C., Campuzano-Jost, P., Jimenez, J. L., Herrmann, H., O’Dowd, C., Stone, E. A., and Ng, N. L.: Response of the Aerodyne Aerosol Mass Spectrometer to Inorganic Sulfates and Organosulfur Compounds: Applications in Field and Laboratory Measurements, Environ. Sci. Technol., 53, 5176–5186, https://doi.org/10.1021/acs.est.9b00884, 2019.
Chow, J. C.: Measurement methods to determine compliance with ambient air quality standards for suspended particles, J. Air Waste Manag. Assoc., 45, 320–382, https://doi.org/10.1080/10473289.1995.10467369, 1995.
Chow, J. C., Watson, J. G., Lowenthal, D. H., Park, K., Doraiswamy, P., Bowers, K., and Bode, R.: Continuous and filter-based measurements of PM2.5 nitrate and sulfate at the Fresno Supersite, Environ. Monit. Assess., 144, 179–189, https://doi.org/10.1007/s10661-007-9987-5, 2008.
Day, D. A., Campuzano-Jost, P., Nault, B. A., Palm, B. B., Hu, W., Guo, H., Wooldridge, P. J., Cohen, R. C., Docherty, K. S., Huffman, J. A., de Sá, S. S., Martin, S. T., and Jimenez, J. L.: A systematic re-evaluation of methods for quantification of bulk particle-phase organic nitrates using real-time aerosol mass spectrometry, Atmos. Meas. Tech., 15, 459–483, https://doi.org/10.5194/amt-15-459-2022, 2022.
DeCarlo, P. F., Kimmel, J. R., Trimborn, A., Northway, M. J., Jayne, J. T., Aiken, A. C., Gonin, M., Fuhrer, K., Horvath, T., Docherty, K. S., Worsnop, D. R., and Jimenez, J. L.: Field-deployable, high-resolution, time-of-flight aerosol mass spectrometer, Anal. Chem., 78, 8281–8289, https://doi.org/10.1021/ac061249n, 2006.
Escrig Vidal, A., Monfort, E., Celades, I., Querol, X., Amato, F., Minguillón, M. C., and Hopke, P. K.: Application of optimally scaled target factor analysis for assessing source contribution of ambient PM10, J. Air Waste Manag. Assoc., 59, 1296–1307, https://doi.org/10.3155/1047-3289.59.11.1296, 2009.
Furger, M., Minguillón, M. C., Yadav, V., Slowik, J. G., Hüglin, C., Fröhlich, R., Petterson, K., Baltensperger, U., and Prévôt, A. S. H.: Elemental composition of ambient aerosols measured with high temporal resolution using an online XRF spectrometer, Atmos. Meas. Tech., 10, 2061–2076, https://doi.org/10.5194/amt-10-2061-2017, 2017.
Gani, S., Bhandari, S., Seraj, S., Wang, D. S., Patel, K., Soni, P., Arub, Z., Habib, G., Hildebrandt Ruiz, L., and Apte, J. S.: Submicron aerosol composition in the world's most polluted megacity: the Delhi Aerosol Supersite study, Atmos. Chem. Phys., 19, 6843–6859, https://doi.org/10.5194/acp-19-6843-2019, 2019.
Hagler, G. S. W., Baldauf, R. W., Thoma, E. D., Long, T. R., Snow, R. F., Kinsey, J. S., Oudejans, L., and Gullett, B. K.: Ultrafine particles near a major roadway in Raleigh, North Carolina: Downwind attenuation and correlation with traffic-related pollutants, Atmos. Environ., 43, 1229–1234, https://doi.org/10.1016/j.atmosenv.2008.11.024, 2009.
Hong, C., Zhang, Q., Zhang, Y., Davis, S. J., Tong, D., Zheng, Y., Liu, Z., Guan, D., He, K., and Schellnhuber, H. J.: Impacts of climate change on future air quality and human health in China, Proc. Natl. Acad. Sci. U. S. A., 116, 17193–17200, https://doi.org/10.1073/pnas.1812881116, 2019.
Hu, W., Campuzano-Jost, P., Day, D. A., Croteau, P., Canagaratna, M. R., Jayne, J. T., Worsnop, D. R., and Jimenez, J. L.: Evaluation of the new capture vaporizer for aerosol mass spectrometers (AMS) through field studies of inorganic species, Aerosol Sci. Technol., 51, 735–754, https://doi.org/10.1080/02786826.2017.1296104, 2017.
Indresand, H., White, W. H., Trzepla, K., and Dillner, A. M.: Preparation of sulfur reference materials that reproduce atmospheric particulate matter sample characteristics for XRF calibration, X-Ray Spectrom., 42, 359–367, https://doi.org/10.1002/xrs.2456, 2013.
Jayne, J. T., Leard, D. C., Zhang, X., Davidovits, P., Smith, K. A., Kolb, C. E., and Worsnop, D. R.: Development of an aerosol mass spectrometer for size and composition analysis of submicron particles, Aerosol Sci. Technol., 33, 49–70, https://doi.org/10.1080/027868200410840, 2000.
Jimenez, J. L., Jayne, J. T., Shi, Q., Kolb, C. E., Worsnop, D. R., Yourshaw, I., Seinfeld, J. H., Flagan, R. C., Zhang, X., Smith, K. A., Morris, J. W., and Davidovits, P.: Ambient aerosol sampling using the Aerodyne aerosol mass spectrometer, J. Geophys. Res.-Atmos., 108, D7, https://doi.org/10.1029/2001jd001213, 2003.
Kuokka, S., Teinilä, K., Saarnio, K., Aurela, M., Sillanpää, M., Hillamo, R., Kerminen, V.-M., Pyy, K., Vartiainen, E., Kulmala, M., Skorokhod, A. I., Elansky, N. F., and Belikov, I. B.: Using a moving measurement platform for determining the chemical composition of atmospheric aerosols between Moscow and Vladivostok, Atmos. Chem. Phys., 7, 4793–4805, https://doi.org/10.5194/acp-7-4793-2007, 2007.
Lalchandani, V., Kumar, V., Tobler, A., M. Thamban, N., Mishra, S., Slowik, J. G., Bhattu, D., Rai, P., Satish, R., Ganguly, D., Tiwari, S., Rastogi, N., Tiwari, S., Močnik, G., Prévôt, A. S. H., and Tripathi, S. N.: Real-time characterization and source apportionment of fine particulate matter in the Delhi megacity area during late winter, Sci. Total Environ., 770, 145324, https://doi.org/10.1016/j.scitotenv.2021.145324, 2021.
Lalchandani, V., Srivastava, D., Dave, J., Mishra, S., Tripathi, N., Shukla, A. K., Sahu, R., Thamban, N. M., Gaddamidi, S., Dixit, K., Ganguly, D., Tiwari, S., Srivastava, A. K., Sahu, L., Rastogi, N., Gargava, P., and Tripathi, S. N.: Effect of Biomass Burning on PM2.5 Composition and Secondary Aerosol Formation During Post-Monsoon and Winter Haze Episodes in Delhi, J. Geophys. Res.-Atmos., 127, 1–21, https://doi.org/10.1029/2021JD035232, 2022.
Lipfert, F. W.: Filter artifacts associated with particulate measurements: Recent evidence and effects on statistical relationships, Atmos. Environ., 28, 3233–3249, https://doi.org/10.1016/1352-2310(94)00167-J, 1994.
Makkonen, U., Virkkula, A., Mäntykenttä, J., Hakola, H., Keronen, P., Vakkari, V., and Aalto, P. P.: Semi-continuous gas and inorganic aerosol measurements at a Finnish urban site: comparisons with filters, nitrogen in aerosol and gas phases, and aerosol acidity, Atmos. Chem. Phys., 12, 5617–5631, https://doi.org/10.5194/acp-12-5617-2012, 2012.
Malaguti, A., Mircea, M., La Torretta, T. M. G., Telloli, C., Petralia, E., Stracquadanio, M., and Berico, M.: Comparison of online and offline methods for measuring fine secondary inorganic ions and carbonaceous aerosols in the central mediterranean area, Aerosol Air Qual. Res., 15, 2641–2653, https://doi.org/10.4209/aaqr.2015.04.0240, 2015.
Manchanda, C., Kumar, M., Singh, V., Faisal, M., Hazarika, N., Shukla, A., Lalchandani, V., Goel, V., Thamban, N., Ganguly, D., and Tripathi, S. N.: Variation in chemical composition and sources of PM2.5 during the COVID-19 lockdown in Delhi, Environ. Int., 153, 106541, https://doi.org/10.1016/j.envint.2021.106541, 2021.
Minguillón, M. C., Querol, X., Baltensperger, U., and Prévôt, A. S. H.: Fine and coarse PM composition and sources in rural and urban sites in Switzerland: Local or regional pollution?, Sci. Total Environ., 427–428, 191–202, https://doi.org/10.1016/j.scitotenv.2012.04.030, 2012.
Nagar, P. K., Singh, D., Sharma, M., Kumar, A., Aneja, V. P., George, M. P., Agarwal, N., and Shukla, S. P.: Characterization of PM2.5 in Delhi: role and impact of secondary aerosol, burning of biomass, and municipal solid waste and crustal matter, Environ. Sci. Pollut. Res., 24, 25179–25189, https://doi.org/10.1007/s11356-017-0171-3, 2017.
Nault, B. A., Campuzano-Jost, P., Day, D. A., Guo, H., Jo, D. S., Handschy, A. V., Pagonis, D., Schroder, J. C., Schueneman, M. K., Cubison, M. J., Dibb, J. E., Hodzic, A., Hu, W., Palm, B. B., and Jimenez, J. L.: Interferences with aerosol acidity quantification due to gas-phase ammonia uptake onto acidic sulfate filter samples, Atmos. Meas. Tech., 13, 6193–6213, https://doi.org/10.5194/amt-13-6193-2020, 2020.
Nicolás, J. F., Galindo, N., Yubero, E., Pastor, C., Esclapez, R., and Crespo, J.: Aerosol inorganic ions in a semiarid region on the Southeastern Spanish mediterranean coast, Water Air Soil Pollut., 201, 149–159, https://doi.org/10.1007/s11270-008-9934-2, 2009.
Nie, W., Wang, T., Gao, X., Pathak, R. K., Wang, X., Gao, R., Zhang, Q., Yang, L., and Wang, W.: Comparison among filter-based, impactor-based and continuous techniques for measuring atmospheric fine sulfate and nitrate, Atmos. Environ., 44, 4396–4403, https://doi.org/10.1016/j.atmosenv.2010.07.047, 2010.
Pakkanen, T. A. and Hillamo, R. E.: Comparison of sampling artifacts and ion balances for a Berner low-pressure impactor and a virtual impactor, Boreal Environ. Res., 7, 129–140, 2002.
Pandolfi, M., Querol, X., Alastuey, A., Jimenez, J. L., Jorba, O., Day, D., Ortega, A., Cubison, M. J., Comerón, A., Sicard, M., Mohr, C., Prévôt, A. S. H., Minguillón, M. C., Pey, J., Baldasano, J. M., Burkhart, J. F., Seco, R., Peñuelas, J., Van Drooge, B. L., Artiñano, B., DiMarco, C., Nemitz, E., Schallhart, S., Metzger, A., Hansel, A., Lorente, J., Ng, S., Jayne, J., and Szidat, S.: Effects of sources and meteorology on particulate matter in the Western Mediterranean Basin: An overview of the DAURE campaign, J. Geophys. Res., 119, 4978–5010, https://doi.org/10.1002/2013JD021079, 2014.
Pant, P., Shukla, A., Kohl, S. D., Chow, J. C., Watson, J. G., and Harrison, R. M.: Characterization of ambient PM2.5 at a pollution hotspot in New Delhi, India and inference of sources, Atmos. Environ., 109, 178–189, https://doi.org/10.1016/j.atmosenv.2015.02.074, 2015.
Panteliadis, P., Helmink, H. J. P., Koopman, P. C., Hoonhout, M., Jonge, D., and De Visser, J. H.: PM 10 sampling inlets comparison: EPA vs EU, 12341, https://www.researchgate.net/publication/306031326_PM10_sampling_inlets_comparison_EPA_vs_EU (last access: 29 April 2022), 2012.
Park, S. S., Cho, S. Y., Jo, M. R., Gong, B. J., Park, J. S., and Lee, S. J.: Field evaluation of a near-real time elemental monitor and identification of element sources observed at an air monitoring supersite in Korea, Atmos. Pollut. Res., 5, 119–128, https://doi.org/10.5094/APR.2014.015, 2014.
Patel, A., Rastogi, N., Gandhi, U., and Khatri, N.: Oxidative potential of atmospheric PM10 at five different sites of Ahmedabad, a big city in Western India, Environ. Pollut., 268, 115909, https://doi.org/10.1016/j.envpol.2020.115909, 2021.
Pathak, R. K. and Chan, C. K.: Inter-particle and gas-particle interactions in sampling artifacts of PM2.5 in filter-based samplers, Atmos. Environ., 39, 1597–1607, https://doi.org/10.1016/j.atmosenv.2004.10.018, 2005.
Peck, J., Gonzalez, L. A., Williams, L. R., Xu, W., Croteau, P. L., Timko, M. T., Jayne, J. T., Worsnop, D. R., Miake-Lye, R. C., and Smith, K. A.: Development of an aerosol mass spectrometer lens system for PM2.5, Aerosol Sci. Technol., 50, 781–789, https://doi.org/10.1080/02786826.2016.1190444, 2016.
Pope, C. A., Ezzati, M., and Dockery, D. W.: Fine-Particulate Air Pollution and Life Expectancy in the United States, N. Engl. J. Med., 360, 376–386, https://doi.org/10.1056/nejmsa0805646, 2009.
Querol, X., Pey, J., Minguillón, M. C., Pérez, N., Alastuey, A., Viana, M., Moreno, T., Bernabé, R. M., Blanco, S., Cárdenas, B., Vega, E., Sosa, G., Escalona, S., Ruiz, H., and Artíñano, B.: PM speciation and sources in Mexico during the MILAGRO-2006 Campaign, Atmos. Chem. Phys., 8, 111–128, https://doi.org/10.5194/acp-8-111-2008, 2008.
Rai, P., Furger, M., El Haddad, I., Kumar, V., Wang, L., Singh, A., Dixit, K., Bhattu, D., Petit, J. E., Ganguly, D., Rastogi, N., Baltensperger, U., Tripathi, S. N., Slowik, J. G., and Prévôt, A. S. H.: Real-time measurement and source apportionment of elements in Delhi's atmosphere, Sci. Total Environ., 742, 140332, https://doi.org/10.1016/j.scitotenv.2020.140332, 2020.
Rai, P., Slowik, J. G., Furger, M., El Haddad, I., Visser, S., Tong, Y., Singh, A., Wehrle, G., Kumar, V., Tobler, A. K., Bhattu, D., Wang, L., Ganguly, D., Rastogi, N., Huang, R.-J., Necki, J., Cao, J., Tripathi, S. N., Baltensperger, U., and Prévôt, A. S. H.: Highly time-resolved measurements of element concentrations in PM10 and PM2.5: comparison of Delhi, Beijing, London, and Krakow, Atmos. Chem. Phys., 21, 717–730, https://doi.org/10.5194/acp-21-717-2021, 2021.
Rastogi, N. and Sarin, M. M.: Long-term characterization of ionic species in aerosols from urban and high-altitude sites in western India: Role of mineral dust and anthropogenic sources, Atmos. Environ., 39, 5541–5554, https://doi.org/10.1016/j.atmosenv.2005.06.011, 2005.
Rengarajan, R., Sarin, M. M., and Sudheer, A. K.: Carbonaceous and inorganic species in atmospheric aerosols during wintertime over urban and high-altitude sites in North India, J. Geophys. Res.-Atmos., 112, 1–16, https://doi.org/10.1029/2006JD008150, 2007.
Schaap, M., Spindler, G., Schulz, M., Acker, K., Maenhaut, W., Berner, A., Wieprecht, W., Streit, N., Müller, K., Brüggemann, E., Chi, X., Putaud, J. P., Hitzenberger, R., Puxbaum, H., Baltensperger, U., and Ten Brink, H.: Artefacts in the sampling of nitrate studied in the “iNTERCOMP” campaigns of EUROTRAC-AEROSOL, Atmos. Environ., 38, 6487–6496, https://doi.org/10.1016/j.atmosenv.2004.08.026, 2004.
Sharma, D. and Kulshrestha, U. C.: Spatial and temporal patterns of air pollutants in rural and urban areas of India, Environ. Pollut., 195, 276–281, https://doi.org/10.1016/j.envpol.2014.08.026, 2014.
Sharma, S. K., Mandal, T. K., Jain, S., Saraswati, Sharma, A., and Saxena, M.: Source Apportionment of PM2.5 in Delhi, India Using PMF Model, Bull. Environ. Contam. Toxicol., 97, 286–293, https://doi.org/10.1007/s00128-016-1836-1, 2016.
Shukla, A. K., Lalchandani, V., Bhattu, D., Dave, J. S., Rai, P., Thamban, N. M., Mishra, S., Gaddamidi, S., Tripathi, N., Vats, P., Rastogi, N., Sahu, L., Ganguly, D., Kumar, M., Singh, V., Gargava, P., and Tripathi, S. N.: Real-time quantification and source apportionment of fine particulate matter including organics and elements in Delhi during summertime, Atmos. Environ., 261, 118598, https://doi.org/10.1016/j.atmosenv.2021.118598, 2021.
Singh, A., Satish, R. V., and Rastogi, N.: Characteristics and sources of fine organic aerosol over a big semi-arid urban city of western India using HR-ToF-AMS, Atmos. Environ., 208, 103–112, https://doi.org/10.1016/j.atmosenv.2019.04.009, 2019.
Singh, A., Rastogi, N., Kumar, V., Slowik, J. G., Satish, R., Lalchandani, V., Thamban, N. M., Rai, P., Bhattu, D., Vats, P., Ganguly, D., Tripathi, S. N., and Prévôt, A. S. H.: Sources and characteristics of light-absorbing fine particulates over Delhi through the synergy of real-time optical and chemical measurements, Atmos. Environ., 252, 118338, https://doi.org/10.1016/j.atmosenv.2021.118338, 2021.
Singhai, A., Habib, G., Raman, R. S., and Gupta, T.: Chemical characterization of PM1.0 aerosol in Delhi and source apportionment using positive matrix factorization, Environ. Sci. Pollut. Res., 24, 445–462, https://doi.org/10.1007/s11356-016-7708-8, 2017.
Takahama, S., Wittig, A. E., Vayenas, D. V., Davidson, C. I., and Pandis, S. N.: Modeling the diurnal variation of nitrate during the Pittsburgh Air Quality Study, J. Geophys. Res.-Atmos., 109, D16S06, https://doi.org/10.1029/2003JD004149, 2004.
Tobler, A., Bhattu, D., Canonaco, F., Lalchandani, V., Shukla, A., Thamban, N. M., Mishra, S., Srivastava, A. K., Bisht, D. S., Tiwari, S., Singh, S., Močnik, G., Baltensperger, U., Tripathi, S. N., Slowik, J. G., and Prévôt, A. S. H.: Chemical characterization of PM2.5 and source apportionment of organic aerosol in New Delhi, India, Sci. Total Environ., 745, 140924, https://doi.org/10.1016/j.scitotenv.2020.140924, 2020.
Tremper, A. H., Font, A., Priestman, M., Hamad, S. H., Chung, T.-C., Pribadi, A., Brown, R. J. C., Goddard, S. L., Grassineau, N., Petterson, K., Kelly, F. J., and Green, D. C.: Field and laboratory evaluation of a high time resolution x-ray fluorescence instrument for determining the elemental composition of ambient aerosols, Atmos. Meas. Tech., 11, 3541–3557, https://doi.org/10.5194/amt-11-3541-2018, 2018.
U.S. EPA (Ed.): Determination of metals in ambient particulate matter using X-Ray Fluorescence (XRF) Spectroscopy, Agency, Cincinnati, OH 45268, USA, https://fdocuments.in/document/determination-of-metals (last access: 29 April 2022) 1999.
U.S. EPA and ETV: Environmental Technology Verification Report – Cooper Environmental Services LLC† Xact 625 Particulate Metals Monitor, EPA/600/R-12/680, https://archive.epa.gov/nrmrl/archive-etv/web/pdf/p100fk6b.pdf, last access: September 2012.
Viana, M., Chi, X., Maenhaut, W., Cafmeyer, J., Querol, X., Alastuey, A., Mikuška, P., and Večeřa, Z.: Influence of sampling artefacts on measured PM, OC, and EC levels in carbonaceous aerosols in an urban area, Aerosol Sci. Technol., 40, 107–117, https://doi.org/10.1080/02786820500484388, 2006.
Wang, M., Aaron, C. P., Madrigano, J., Hoffman, E. A., Angelini, E., Yang, J., Laine, A., Vetterli, T. M., Kinney, P. L., Sampson, P. D., Sheppard, L. E., Szpiro, A. A., Adar, S. D., Kirwa, K., Smith, B., Lederer, D. J., Diez-Roux, A. V., Vedal, S., Kaufman, J. D., and Barr, R. G.: Association between long-term exposure to ambient air pollution and change in quantitatively assessed emphysema and lung function, J. Am. Med. Assoc., 322, 546–556, https://doi.org/10.1001/jama.2019.10255, 2019.
World Health Organisation (WHO): WHO global urban ambient air pollution database (update 2018, version 11), World Health Organization, Geneva, https://www.who.int/airpollution/data/cities/en/ (last access: 29 April 2022), 2018.
Wu, W. S. and Wang, T.: On the performance of a semi-continuous PM2.5 sulphate and nitrate instrument under high loadings of particulate and sulphur dioxide, Atmos. Environ., 41, 5442–5451, https://doi.org/10.1016/j.atmosenv.2007.02.025, 2007.
Yardley, R. E., Sweeney, B. P., Butterfield, D., Quincey, P., and Fuller, G. W.: Estimation of Measurement Uncertainty in Network Data, National Pysical Laboratory, 13–36, 2007.
Zhang, D., Shi, G. Y., Iwasaka, Y., and Hu, M.: Mixture of sulfate and nitrate in coastal atmospheric aerosols: Individual particle studies in Qingdao (36∘04'N, 120∘21'E), China, Atmos. Environ., 34, 2669–2679, https://doi.org/10.1016/S1352-2310(00)00078-9, 2000.
Zhang, X. and Mcmurryt, P. H.: Evaporative Losses Of Fine Particulate Nitrates During Sampling, Atmos. Environ., 26, 3305–3312, 1992.