the Creative Commons Attribution 4.0 License.
the Creative Commons Attribution 4.0 License.
 | 13 May 2022
Intercomparison of holographic imaging and single-particle forward light scattering in situ measurements of liquid clouds in changing atmospheric conditions
Ari Leskinen
Ville A. Kaikkonen
Eero O. Molkoselkä
Anssi J. Mäkynen
Jorma Joutsensaari
Silvia Calderon
Sami Romakkaniemi
Mika Komppula
Upon a new measurement technique, it is possible to sharpen the determination of microphysical properties of cloud droplets using high resolving power imaging. The shape, size, and position of each particle inside a well-defined, three-dimensional sample volume can be measured with holographic methods without assumptions of particle properties. In situ cloud measurements were carried out at the Puijo station in Kuopio, Finland, focusing on intercomparisons between cloud droplet analyzers over 2 months in September–November 2020. The novel holographic imaging instrument (ICEMET) was adapted to measure microphysical properties of liquid clouds, and these values were compared with parallel measurements of a cloud droplet spectrometer (FM-120) and particle measurements using a twin-inlet system. When the intercomparison was carried out during isoaxial sampling, our results showed good agreement in terms of variability between the instruments, with the averaged ratios between ICEMET and FM-120 being 0.6 ± 0.2, 1.0 ± 0.5, and 1.2 ± 0.2 for the total number concentration (Nd) of droplets, liquid water content (LWC), and median volume diameter (MVD), respectively. This agreement during isoaxial sampling was also confirmed by mutual correlation and Pearson correlation coefficients. The ICEMET-observed LWC was more reliable than FM-120 (without a swivel-head mount), which was verified by comparing the estimated LWC to measured values, whereas the twin-inlet DMPS system and FM-120 observations of Nd showed good agreement both in variability and amplitude. Field data revealed that ICEMET can detect small cloud droplets down to 5 µm via geometric magnification.
- Article
(4387 KB) - Full-text XML
-
Supplement
(473 KB) - BibTeX
- EndNote


Clouds are essential elements of the atmosphere, e.g., in regulating the earth's surface temperature, and therefore, understanding cloud properties is critical for exact predictions of climate evolution (Seinfeld and Pandis, 2006). Investigation of aerosol–cloud interactions and indirect aerosol effects on climate requires an accurate assessment of the cloud microphysical properties, such as the liquid water content (LWC) and droplet size distributions, for reducing the uncertainties in climate models (Boucher et al., 2013). Despite an overall improvement in quantification and process understanding, aerosol–cloud interactions remain as dominant contributors to the uncertainty regarding both, human-induced effective radiative forcing and temperature change, over the industrial era (IPCC, 2007, 2021). Cloud-related forcing is very difficult to estimate because it varies between cloud types, and every cloud type has distinctive hydrometeor microphysics as well as distinctive spatial and temporal distribution on the atmosphere (Wood, 2012).
Although remote sensing methods have been developed considerably in the past decade, in situ measurements are still the most accurate method to determine in-cloud droplet and ice particle size distributions. The remaining challenges for in situ measurements include the reduction in instruments' noise and identification of possible biases or retrieval problems by comparing different techniques and instruments, a problem that can be addressed through measurement redundancy studies (Madonna et al., 2014). In situ measurements can generate detailed information on the cloud microphysical properties which can be used for validation of the algorithms applied in the models for cloud properties or intercomparison with remote sensing applications such as lidar.
The two most typical types of online instruments for measuring in situ cloud droplet properties are cloud spectrometers that exploit light scattering from individual droplets and instruments that capture images from individual objects using methods of shadowgraphy or holography (Baumgardner et al., 2011). Instruments in the former category are, for example, the forward-scattering spectrometer probe (FSSP), the cloud droplet probe (CDP), and the fog droplet spectrometer (FM-100 and FM-120, Droplet Measurement Technologies) (e.g., Knollenberg et al., 1981; Baumgardner et al., 2011, 2014), and those in the latter category are, for example, the cloud particle imager (CPI) (Lawson et al., 2001), the 2D-S (stereo) probe (Lawson et al., 2006), the cloud imaging probe (CIP) (Droplet Measurement Technologies Inc., USA), the Oxford Lasers VisiSize D30 (Nowak et al., 2020), the Holographic Detector for Clouds (HOLODEC) (Fugal and Shaw, 2009), the HOLographic Imager for Microscopic Objects II (HOLIMO II) (Henneberger et al., 2013), HOLIMO 3G (Beck et al., 2017), and HALOHolo (Lloyd et al., 2020). Both methods have their advantages and disadvantages which are important to recognize in order to optimize the utility of cloud measurements and analyses in different conditions.
In all in situ instruments which use inlet for sampling, a part of the sample is lost along the line between the sampling inlet and the detector. One point of interest is the difference between the flow rate in the inlet and the prevailing wind speed and direction. When wind conditions are varied, the losses especially for the larger droplets are a typical source of uncertainty in surface-based cloud spectrometer measurements (e.g., Spiegel et al., 2012; Guyot et al., 2015; Doulgeris et al., 2020). Losses can be very high, particularly when calculating the LWC (Spiegel et al., 2012; Guyot et al., 2015; Doulgeris et al., 2020). These losses mainly occur because the sampling is usually non-ideal, meaning that the sample flow is neither isoaxial nor isokinetic. In addition, the assessment of the sampling volume can cause uncertainty for measurements (Guyot et al., 2015). Despite the above-mentioned uncertainties, previous studies have shown good correlations between the measurements with different cloud spectrometers for the sizing of droplets in well-characterized cases. Spiegel et al. (2012) demonstrated that there is typically only a minor inlet loss for the droplet sizes smaller than 10 µm in diameter, i.e., the sizes that are usually the most numerous in cloud droplets. An important feature of cloud spectrometers is that also tiny cloud particles down to 1 µm can be observed using light scattering techniques. In the instruments which utilize an open path sampling, such as CDP, CIP, and ICEMET, sampling biases may also be caused when the housings of instruments alter the airflow around the housing causing local flow speed and direction changes. The droplets may react to these airflow changes differently depending on their size.
Holographic imaging methods measure over a wide range of particle sizes. In comparison with cloud spectrometers, holographic imaging allows simultaneous measurements of particle position, size, and shape, meaning that not only spherical droplets but also ice crystals and, for example, pollen particles, could be analyzed through image analysis without additional assumptions of particle properties, such as shape or refractive index (e.g., Fugal and Shaw, 2009; Henneberger et al., 2013). Holographic systems have been successfully utilized in the research of ice crystals and mixed-phase clouds carried out on aircraft (Lloyd et al., 2020) and balloons (HoloBalloon; Ramelli et al., 2020), at mountain-based observatories (Henneberger et al., 2013; Lloyd et al., 2015; Hoyle et al., 2016; Schlenczek et al., 2017), and on a mountain cable car (HoloGondel, Beck et al., 2017) as well as recently to identify pollen particles (Sauvageat et al., 2020). The minimum detection limit of the whole sample volume in holographic instruments is a design compromise with the desired sample volume per hologram used. For these holographic instruments, the minimum particle detection limit varies between 6 and 10 µm. It is above the smallest diameter observed for cloud droplets which makes the measurements of full screening of the droplet size distributions difficult because the smallest liquid droplets cannot be detected. The challenge of the method is also that lots of computational power is required for data reconstruction and time-consuming image analyses. However, with the development of computer technology, the cost and time required for such a task have decreased.
In this paper, we intercompare the novel instrument ICEMET (Icing Condition Evaluation Method; Kaikkonen et al., 2020; Molkoselkä et al., 2021) to parallel measurements with a cloud spectrometer (FM-120) and to the cloud properties calculated from particle size distribution measurements (a twin-inlet system) utilizing on ground-based field measurements in Puijo, Station for Measuring Ecosystem-Atmosphere Relations (SMEAR IV), station. We also use mutual correlation analysis and LWC estimates in order to verify measurement-based results. Previously, the ICEMET has been tested in mixed-phase icing conditions in a wind tunnel and a wind turbine (Molkoselkä et al., 2021), and in this intercomparison, we focus on measurements of liquid clouds. Measurements at Puijo station allow intercomparison in different conditions varying from relatively clean to polluted air masses dominated with forest fire aerosols.
The in situ measurements were conducted at the Puijo measurement station in Kuopio, Finland, from 3 September 2020 to 3 November 2020. The station is located at the top of the Puijo tower (height 75 m) and suits well for in-cloud measurements (Leskinen et al., 2009; Portin et al., 2009; Leskinen et al., 2012; Portin et al., 2014; Ruuskanen et al., 2021), 306 m above sea level and 224 m above the surrounding lake level, in a semi-urban environment about 2 km northwest of the city center of Kuopio. The continuous measurements at the station include cloud droplet properties, aerosol size distribution, number concentration, and optical properties, as well as trace gas concentrations and several meteorological parameters (Fig. 1).
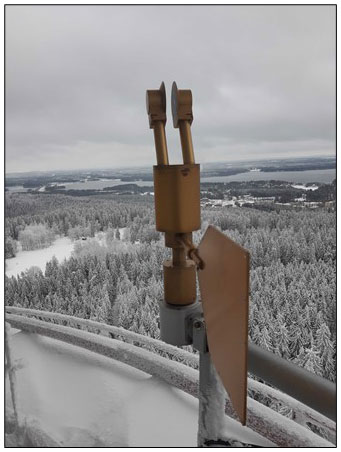
Figure 1ICEMET sensor located in Puijo tower. The height of the ICEMET sensor is 53 cm and the weight is 8 kg. The wind wing is used to align the sensor according to the wind direction. (Photo credit: Ari Leskinen).
2.1 The holographic imaging system (ICEMET)
The recorded holograms presented in this paper were reconstructed using the method described by Kaikkonen et al. (2020) and Molkoselkä et al. (2021) using the ICEMET-Server-software version 1.6.0 (Molkoselkä, 2020). The main components of a digital inline holographic imager are a laser functioning as a point light source and a digital camera to digitize and record the hologram images. A geometric magnification effect, due to the use of a point light source, enlarges the diffraction patterns of the objects (Fig. 2). The size and the location of cloud droplets are determined in the hologram imaging as diffraction patterns. The reconstructed light field, i.e., the grayscale shadow images of the cloud droplets, are formed by numerically focusing at different depths from the hologram. The ICEMET uses a 5.6 mm laser diode (Ushio Opto Semiconductors) operating at 660 nm wavelength as the point light source and a Sony IMX264 grayscale image sensor with resolution 2048×2048 of 3.45 µm size pixels and a maximum frame rate of 35 frames s−1 (fps). In this study, a frame rate of 1 Hz was used to decrease the amount of data during a 2-month measurement campaign. The anti-icing of the sensor is implemented with a temperature controller and heating elements at a total maximum power of 500 W, allowing the lowest operation temperature of −40 ∘C.
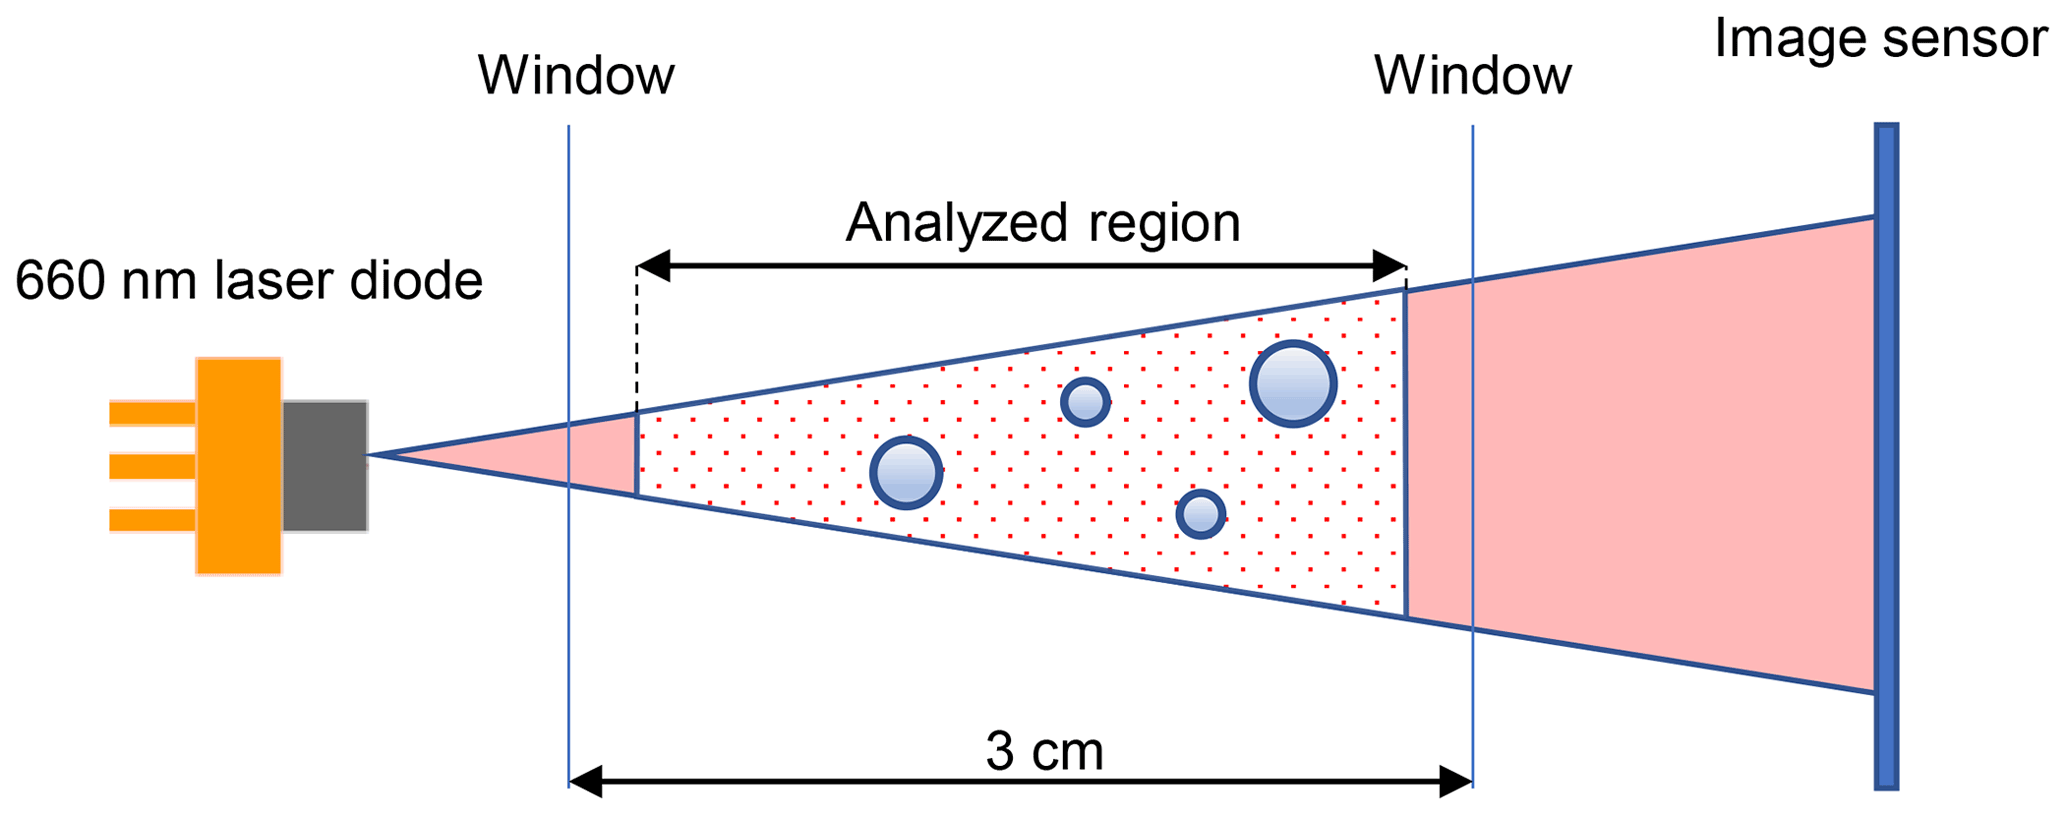
Figure 2A schematic of the lens-less holographic imaging where the analyzed region is marked as red dots.
The window disks are 10 cm in diameter, and the distance between the disks is 3 cm, limiting the sample region and the optical axis between the centers of the opposite disks (Figs. 1 and 2). The typical distance between the protective windows and analyzed region in cloud droplet measurements is typically 5 mm. This distance minimizes the boundary layer effect on the airflow from the sidewalls over a large wind speed range and maximizes the nearly isokinetic measurement volume size (Juttula et al., 2020). The resultant analyzed volume per frame is 0.3 cm3. The raw hologram is cropped, the background is subtracted, and the preprocessed shadow image is reconstructed using angular spectrum propagation to binarized individual images with custom-made software in ICEMET-Server (Molkoselkä et al., 2021) based on Fugal et al. (2009). An edge sharpness algorithm is used to calculate the position of each particle along the optical axis, and the centroid in the other two dimensions is calculated. The minimum particle detection size is defined as two times the effective pixel size. This is because at least two dark pixels along one axis of the hologram is needed to separate noise from particles, sometimes more, especially in high noise holograms. Due to varying geometric magnification inside the measurement volume, the effective pixel size is the largest at the outer plane of the measurement volume on the camera sensor side. The geometric magnification of the diffraction pattern at that plane is 1.3 fold, resulting in an effective pixel size of 2.65 µm and thus leading to a theoretical effective particle detection size limit (DLeff) of 5.3 µm.
On the laser diode side, the effective pixel size is not the limit of droplet detection lower bound, but the optical resolving power, defined by the numerical aperture of the imaging system. The theoretical optical resolving power limited by the numerical aperture, in this case, is defined by the camera sensor size and the object's distance from the camera. It has the lowest value at the laser diode side of the measurement volume, where the theoretical resolving power is 5.1 µm. From these theoretical calculations, it can be concluded that objects larger than 5.3 µm could be detected inside the whole measurement volume; however, it should be noted that this theoretical consideration neither takes into account the physical non-idealities of the sensor system nor the sub-pixel location differences of the particles with size close to the 2-effective-pixel detection limit. The laser diode, the camera sensor, and the selected parameters in the hologram analysis affect the practical particle detection limit and cause the limit to vary slightly inside the measurement volume. The sub-pixel position of the droplets with diameters close to the 2-pixel size limit related to the 2×2 camera pixel centroid has an effect on the droplet segmentation, as the displacement of a droplet from the 2×2 pixel centroid inevitably spreads the shadow image of the droplet also on to neighboring pixels. Then in the worst case, the intensity level on the closest 2×2 pixel area of the droplet centroid will fall under the set detection threshold and the droplet will not be segmented and detected. A more detailed description of the ICEMET-Server hologram analysis software can be found in Molkoselkä et al. (2021).
An equivalent diameter (De) of a particle is defined as the diameter of a circle having an equal area as the particle projection. For the shadow images, the De is calculated by counting the number of pixels per particle when the effective pixel size is known. The Heywood circularity factor (HCF), which is the particle circumference divided by the perimeter of a circle with the same area as the particle, is applied to distinguish circular droplets from ice crystals and other non-spherical objects. The droplet size distribution (DSDIM) is constructed by categorizing the observed droplets into 195 sizes 1 µm bins from 5 to 200 µm and total number concentration Nd,IM (cm−3) can be obtained from
where Ni is the number of droplets in ith size bin, Vs is the sampling volume (cm3), fps is the frame rate (s−1), Va is the analyzed volume (cm3), Δt is the sampling duration (s), and m is the total number of size channels. Sampling volume (Vs) is calculated by multiplying the volume of a single frame by the number of frames. Liquid water content LWCIM (mg m−3) of droplets can be calculated from
where ρw is the density of liquid water (kg m−3) and Di,e is the average diameter of the size channel (µm). The median volume diameter (MVD) is the size of the droplet (µm), below which 50 % of the total water resides, and it is calculated by linear interpolation over the droplet diameter using the cumulative LWC (e.g., Finstad et al., 1988).
The size calibration of the ICEMET sensor used in this study was conducted using 9.18, 11.58, 25.60, and 49.2 µm sized certified National Institute of Standards and Technology (NIST) traceable monodisperse standard glass microspheres, and 5 µm sized non-traceable monodisperse silica microspheres (Whitehouse Scientific Ltd). A specific glass microsphere dispenser tool for calibrating the ICEMET sensor was developed from a glass bottle, brass pipes, a hand blower, and a silicone tube. In order to ensure repeatable positioning, the calibration setup has a jig that is attached to the upper housing of the sensor and a sidearm that holds the dispenser outlet pipe. The sidearm can be moved with 5 mm steps to five different locations between the two window disks. In the glass microsphere dispenser, the glass beads are poured into a 4 mL glass bottle, and two 90∘ angled brass pipes are inserted through the bottle top inside the bottle. When forcing air using the hand blower, a portion of the glass beads is dispersed into the air and blown towards the measurement volume of the ICEMET sensor.
The particles close to the resolving power limit using inline holographic systems are known to have a particle edge “roll-off” effect in the reconstructed shadow images due to finite camera pixel size, which makes the smallest particles appear larger than their true size and the effect is typically corrected using a correction curve on the smallest particle sizes (Henneberger et al., 2013). The ICEMET sensor sizing correction is based on the measurement of the NIST traceable standard glass microsphere size of 9.18 µm and the non-certified 5 µm sized silica microspheres. As a result, a correction factor line was calculated to adjust the sizes of the smallest droplets from 5 to 12.39 µm. The correction was made only for droplets with a diameter between 5 and 12.39 µm, whereas for droplets with a diameter of 12.39–200 µm no sizing correction was needed. The size calibration of the ICEMET sensor gives median diameters of 5.2, 9.2 ± 0.2, 11.6 ± 0.2, 25.6 ± 0.7, and 49.2 ± 0.7 µm (Fig. 3a). An example of the measured cumulative size distribution for the 25.6 µm particles is shown in Fig. 3b.
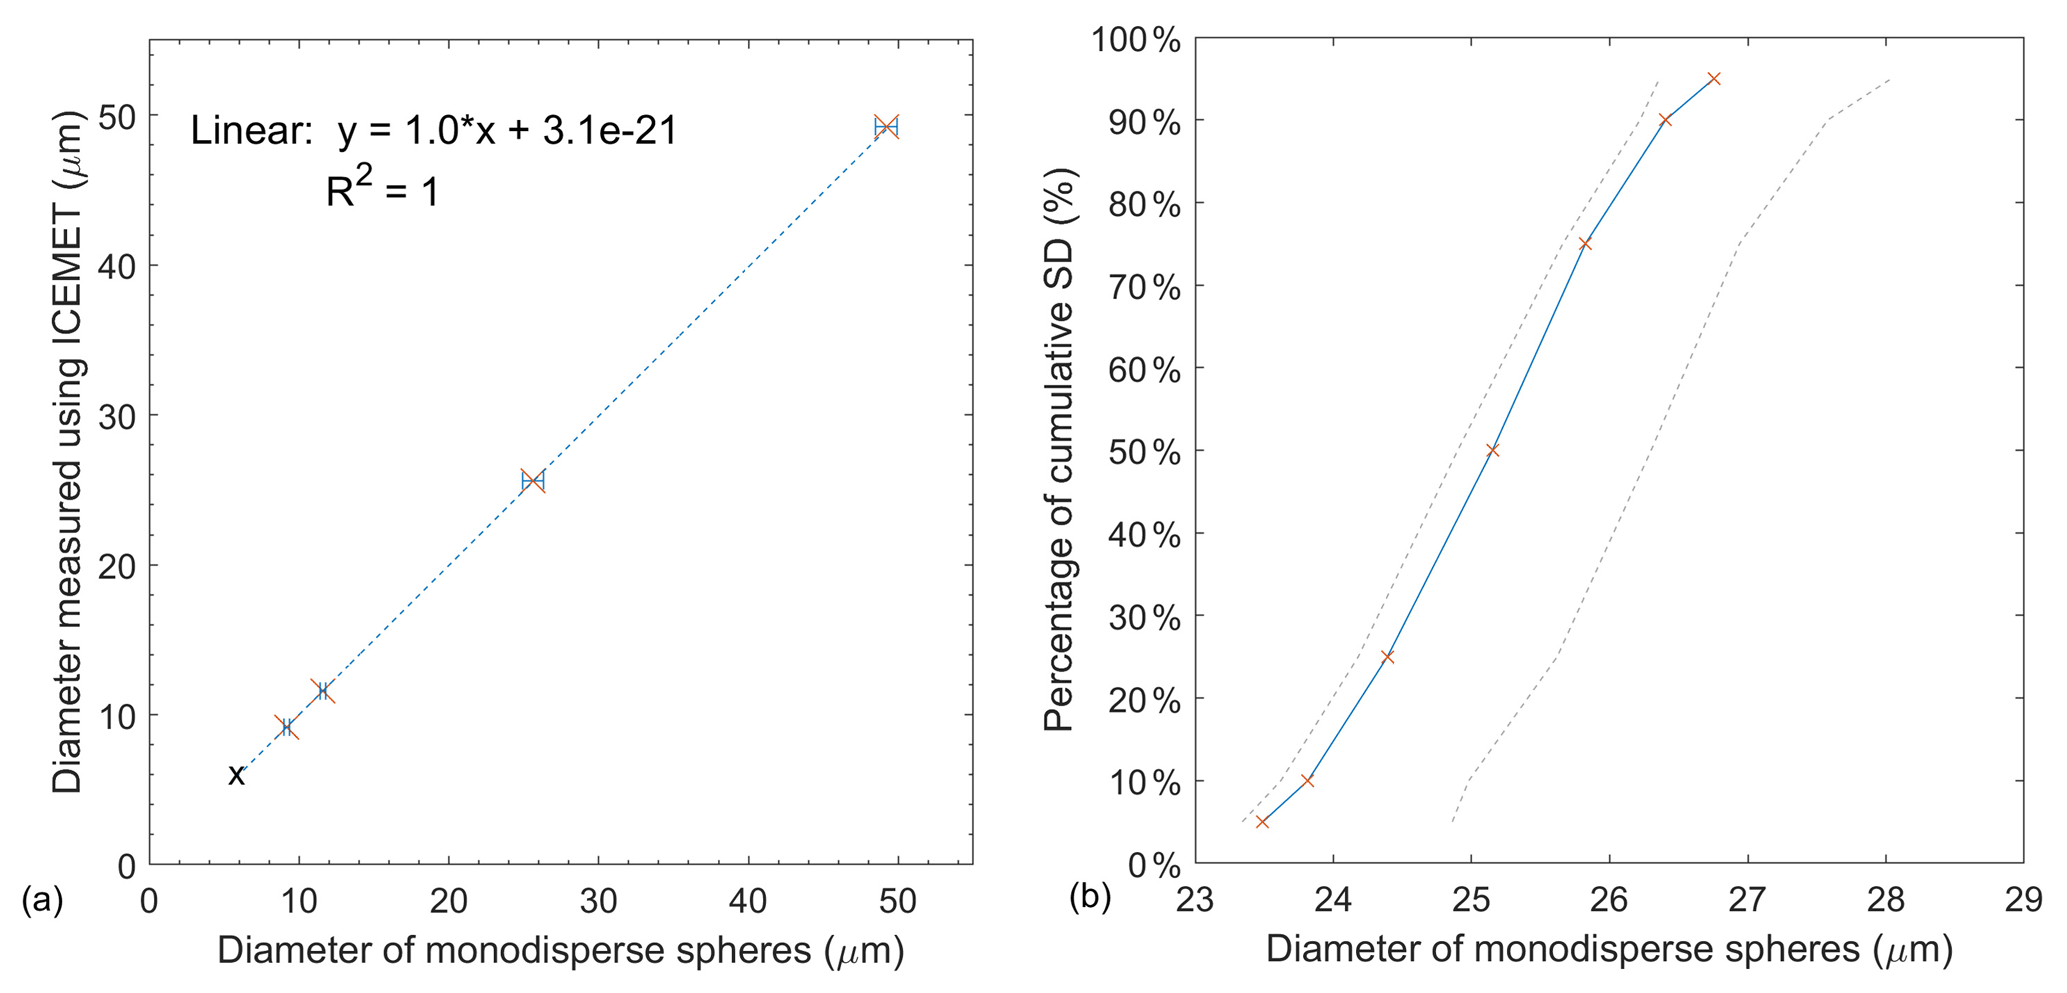
Figure 3(a) The results of calibration measurements for ICEMET with a 95 % confidence level given by the manufacturer after the size correction was applied as well as a 1:1 line (dashed). The 5 µm particles were not certified and therefore the uncertainty value was not defined (black cross). (b) The measured cumulative size distribution using the ICEMET sensor using 25.6 µm monodisperse microspheres. The uncertainty limits specified by the manufacturer are marked as dashed lines.
For the smallest glass microspheres, a visual inspection of the particle images has revealed that if two or more microspheres are in contact with each other, there can be uncertainties in the detection of particles smaller than 20 µm. Two spheres can be in contact in a way that one bead is almost fully behind the other in the hologram and the aggregate can be counted as a single particle thus broadening the size distributions of the measured particles. These grouped glass spheres can be mostly filtered out using the HCF as a limit for the minimum roundness of the particles. It was also noted that the 11.58 µm glass microsphere measurement was slightly undersized after applying the size correction curve. In the future development of ICEMET, an extended set of certified monodisperse standards, including also sizes below 9 µm, will be used. This will result in a fully traceable correction curve for the whole measurement range and particularly improve the calibration accuracy of the smallest droplet sizes.
Because the focus of this study was investigating only cloud droplets, the particle image data from ICEMET was filtered using the HCF of less than 1.23. The threshold value was obtained by visual inspection from the actual DSDIM and images from cloud event measurements in Puijo. Using this criterion, only cloud droplets were qualified and quantified, and all other objects and the noise were removed from further analyses (Fig. 4). ICEMET data quality was checked by monitoring the number of frames per 1 min sample. Heavy rain events sometimes cause large water splashes on the protective windows, which can result in a high number of detected OpenCV (a function which detects a change in the image color and marks it as contour; Bradski, 2000) contours in the reconstructed hologram. If the number of detected contours exceeds 2000, the frame is removed from the analysis, and when less than 59 frames min−1 were acquired, the measurement data were removed.
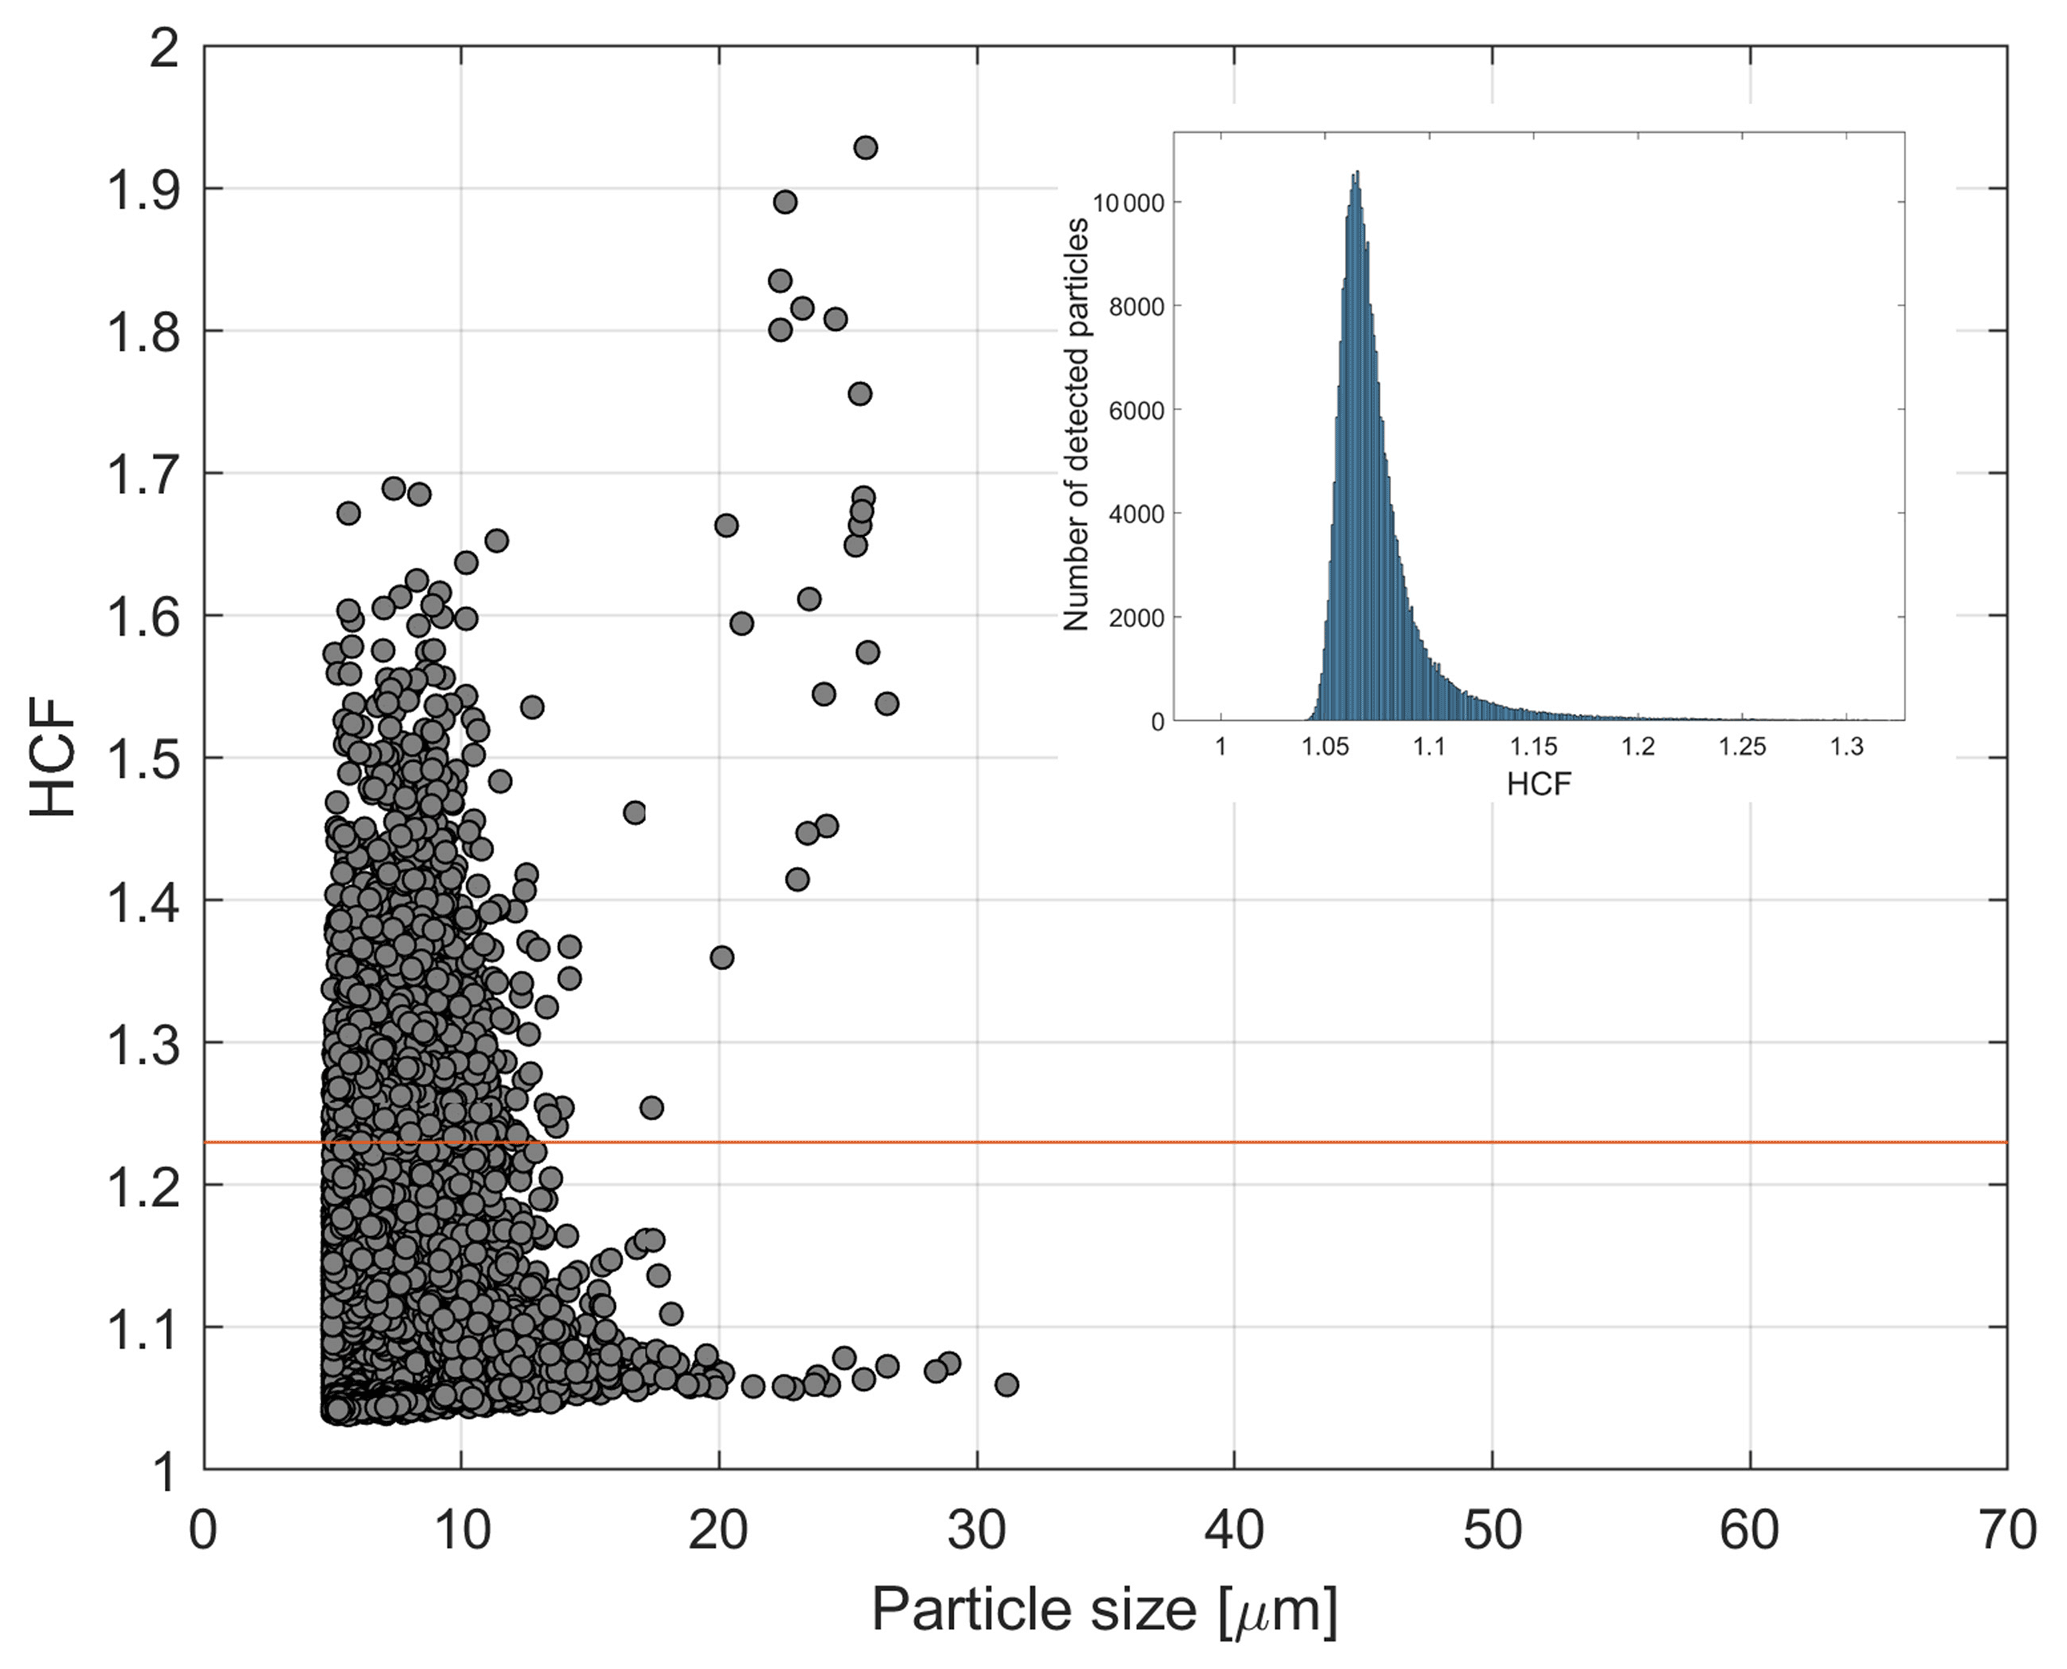
Figure 4Heywood circularity factor (HCF) values of observed objects during a cloud event on 3 October 2020 in different particle sizes and an HCF histogram (inset). All the particles with HCF > 1.23 were cropped and qualified cloud droplets are located below the orange line.
2.2 The fog monitor (FM-120)
The fog monitor (FM-120, Droplet Measurement Technologies Inc., USA) is a forward-scattering optical spectrometer that measures the intensity of the scattered light from the droplets that is proportional to the optical scattering cross section. The FM-120 records the pulse heights of the light scattered by individual particles that pass through a focused 685 nm laser beam. A digitalized signal from sizing and qualifying detectors is converted to an optical scattering cross section. Then the diameter of droplets is determined using a scale factor obtained from calibration through Mie-theory calculations (Bohren and Huffman, 1983). Droplets are assumed to be perfect spheres of pure water with a size-independent refractive index equal to 1.33 (Harvey et al., 1998). The scattering intensity of each particle is digitized and represents a single event that is added to the corresponding size bin. In this campaign, the true sample flow (TAS), determined using a Pitot tube, was around 13 m s−1, and the sample volume (Vs) was around 19 cm3 with a 5 s integration time (Δt) (maximum sampling rate of 20 Hz) and the detector in-focus area (S) of 0.29 mm2. The instrument had been recently calibrated by the manufacturer with glass beads, and the calibration was checked before and after the measurement campaigns by using similar glass beads of 5, 10, 20, 30, and 40 µm in diameter and found without apparent changes in instrument performance. Droplet size distributions (DSDFM) were calculated from the 30 size bins between 2 and 50 µm and total number concentration (Nd,FM, cm−3) was calculated from
where m is the number of channels used. The LWCFM (µg m−3) and MVDFM (µm) can be derived from the DSDFM when the sample volume is known (see Sect. 2.1). The accuracy of FM-120 is estimated to be ± 20 % for the Nd,FM and sizing, ± 40 % for the LWCFM when assuming spherical droplets with a density of water (Droplet Measurement Technologies, 2009).
2.3 Twin-inlet system
Beyond direct droplet observations, droplet number concentration was estimated using a twin-inlet DMPS system that collects particles and cloud hydrometeors through a total and an interstitial inlet installed on the top of the Puijo tower approximately 2.5 m above the roof (Portin et al., 2014). The total inlet sampled all aerosols and hydrometeors smaller than 40 µm in diameter, while those with diameters below 1 µm are measured in the interstitial sampling line. The upper part of the total inlet was heated to 30 ∘C in order to remove the cloud-condensed water from the hydrometeors resulting in the total sample that consists of the residuals of dried particle aerosol and the inactivated particles. In the interstitial inlet, a PM1 impactor (Digitel DMP10 with a PM1 nozzle plate) was used to remove aerosol particles and hydrometeors larger than 1.0 µm in diameter leaving only the interstitial particles into the sample. The difference between the aerosol particle number concentrations in the total and interstitial sampling lines is equal to the number concentration of the activated particles (Nact). In the calculation, the concentrations of particles larger than 70 nm in dry diameter were only considered (). The 70 nm size limit was chosen because most particles below this size remain unactivated and therefore their contributions to Nact cancel out and can be neglected for simplicity and possible inaccuracies in the lower ends of the spectra of the individual instruments. The N70_tot and N70_int were determined from the size distributions measured simultaneously from each inlet using a DMPS system in the size range of 27–520 nm. Each DMPS consisted of a differential mobility analyzer (DMA, a Hauke type 28 cm long), a bipolar charger to obtain charge equilibrium, and a condensation particle counter. The performance of each DMPS system was checked regularly. More information about this sampling procedure can be found in the literature (e.g., Portin et al., 2014).
During cloud-free periods, the obtained aerosol size distribution from the total and interstitial lines, after correcting for sampling line losses, should be the same. With this assumption, the interstitial number size distributions were corrected (zero correction) to match the total aerosol size distribution by using a size-dependent correction factor determined during the cloud-free periods of the measurement campaign. By doing this, we could eliminate, for example, the influence of unequal sampling line losses on the measured size distributions. The number of potential cloud condensation nuclei (CN70, i.e., concentration of particles larger than 70 nm) particles was calculated from the DMPS size distributions.
2.4 LWC estimation
We applied a simple adiabatic model to estimate the maximum amount of LWC based on the cloud base height retrieved from the ceilometer observation. Only data values where cloud base height (CLBH) was unequivocally determined, and the observation altitude was a minimum distance of 50 m from cloud boundaries, were accepted in this modeling study. Although this approach does not account for the entrainment mixing at the cloud top and is highly uncertain at low LWC values, it gives an estimate of the expected LWC values. Cloud top height (CTH) and CLBH were retrieved from time-dependent vertical profiles of radar reflectivity (dBz) measured with the cloud radar located at the Savilahti automated weather station. (See Sect. S1 in the Supplement for detailed supporting information.)
We also adapted a simple regression fog model to determine LWC (g m−3) using visibility measurements (Kunkel et al., 1983; Fišak et al., 2006):
where ε is the threshold of contrast (0.2) and visibility (VIS, km) is measured using a weather sensor (Vaisala PWD52) at Puijo measurement station.
2.5 Mutual correlation analysis
The mutual correlation (MC) between two data sets X and Y measures the X−Y covariability or the amount of information that Y contains about X. It is defined in terms of the Shannon-Wiener entropy measure (H) as
where H(X) and H(Y) are the marginal entropies or dispersion of the probabilistic uncertainty of X and Y, respectively (Madonna et al., 2014). The marginal entropy H(X) represents the dispersion of the probabilities of events p(x) in the data set X composed of x events. It is calculated as
Therefore, the mutual correlation MC(X,Y) can be expressed as
where p(x,y) is the joint probability density function for the sets X and Y (Dawe and Austin, 2013).
When MC(X,Y) is equal to zero, then X and Y are totally uncorrelated and perfectly independent (Glenn et al., 2020). For discrete calculations, it is necessary to find the optimal binning that maximizes the value of MC, as the terms of p(x), p(y), and p(x,y) are highly dependent on it. The MC is a robust statistical indicator because it does not constrain X and Y to a specific probability density function (PDF) and, therefore, it is less sensitive to the presence of outliers than other indicators such as the Pearson correlation coefficient (Madonna et al., 2014). With unconstrained X and Y, the MC preserves the intrinsic variability and therefore is able to capture both, linear and non-linear, relationships (Glenn et al., 2020).
In this way, the mutual correlation works as a reliable indicator of measurement uncertainty. It helps to explain the amount of information that is shared by X and Y or the degree of redundancy in the information given by X and Y. Nevertheless, it has the disadvantage of inaccuracy when data sets are not large enough to calculate representative probability values. If data sets are too small, histograms used for probability estimation can become strongly biased due to the lack of information or reduced amount available for specific variable ranges. A very simple rule to reduce uncertainty in histogram-based probabilities is choosing a size bin in such a way that the number of bins becomes equal to the expected number of components in the distribution (Batina et al., 2011).
We performed an MC analysis on our data sets containing time series of binned and total droplet concentrations, as well as variables retrieved from the DSD such as LWC and MVD. Droplet microphysics observed by the twin-inlet system is averaged as 15 min resolution time series. The fog monitor and ICEMET data sets have shorter time resolution, and therefore observations were averaged to have comparable observational intervals.
3.1 Overview of conditions during intercomparison campaign
On average, the Puijo station is found to be surrounded by clouds 8 % of the time, with the most frequent cloud season in the autumn and early winter when cloudy conditions are observed in the tower more than 13 % of the time (Ruuskanen et al., 2021). The criteria for the occurrence and intensity of cloud are typically visibility, Nd, LWC, or Nd and LWC together (Portin et al., 2009; Ragno and Hobbs, 2005; Hoyle et al., 2016; Li et al., 2020). In this study, the data points that were measured outside of clouds or on the edges of clouds were removed, and we defined a cloud event as follows: (1) cloud droplet number concentration >50 cm−3, and (2) LWC > 10 mg m−3 over 1 min averages. For the 2-month intercomparison period, a total of 35 cloud events were observed.
The mean temperature during the intercomparison campaign was 7.4 ∘C ranging from −3.7 to 17.7 ∘C (Fig. 5). the prevailing wind direction was around 160∘ with a mean wind speed of 8.9 m s−1 including winds from all directions. During the 2-month intercomparisons, different types of air masses mixed with various sources were observed, for example, elevated aerosol concentrations from 23 September to 9 October 2020 (Fig. 5). By inspecting the air mass back trajectories calculated with the PC-based HYSPLIT model (Stein et al., 2015; Rolph et al., 2017) we were able to connect the elevated concentrations to large forest wildfires that took place in central/eastern Europe at that time. In this case, the concentration of accumulation mode particles (100 nm <Dp<1 µm) was about five times higher (Fig. 5) compared with the typical values at the Puijo station. Consequently, the wildfire plume affected the Nact and CN70 by increasing the Nact from the mean value of 157–426 cm−3 and the CN70 from the mean value of 432–1190 cm−3, respectively, thus providing highly varying conditions for intercomparison.
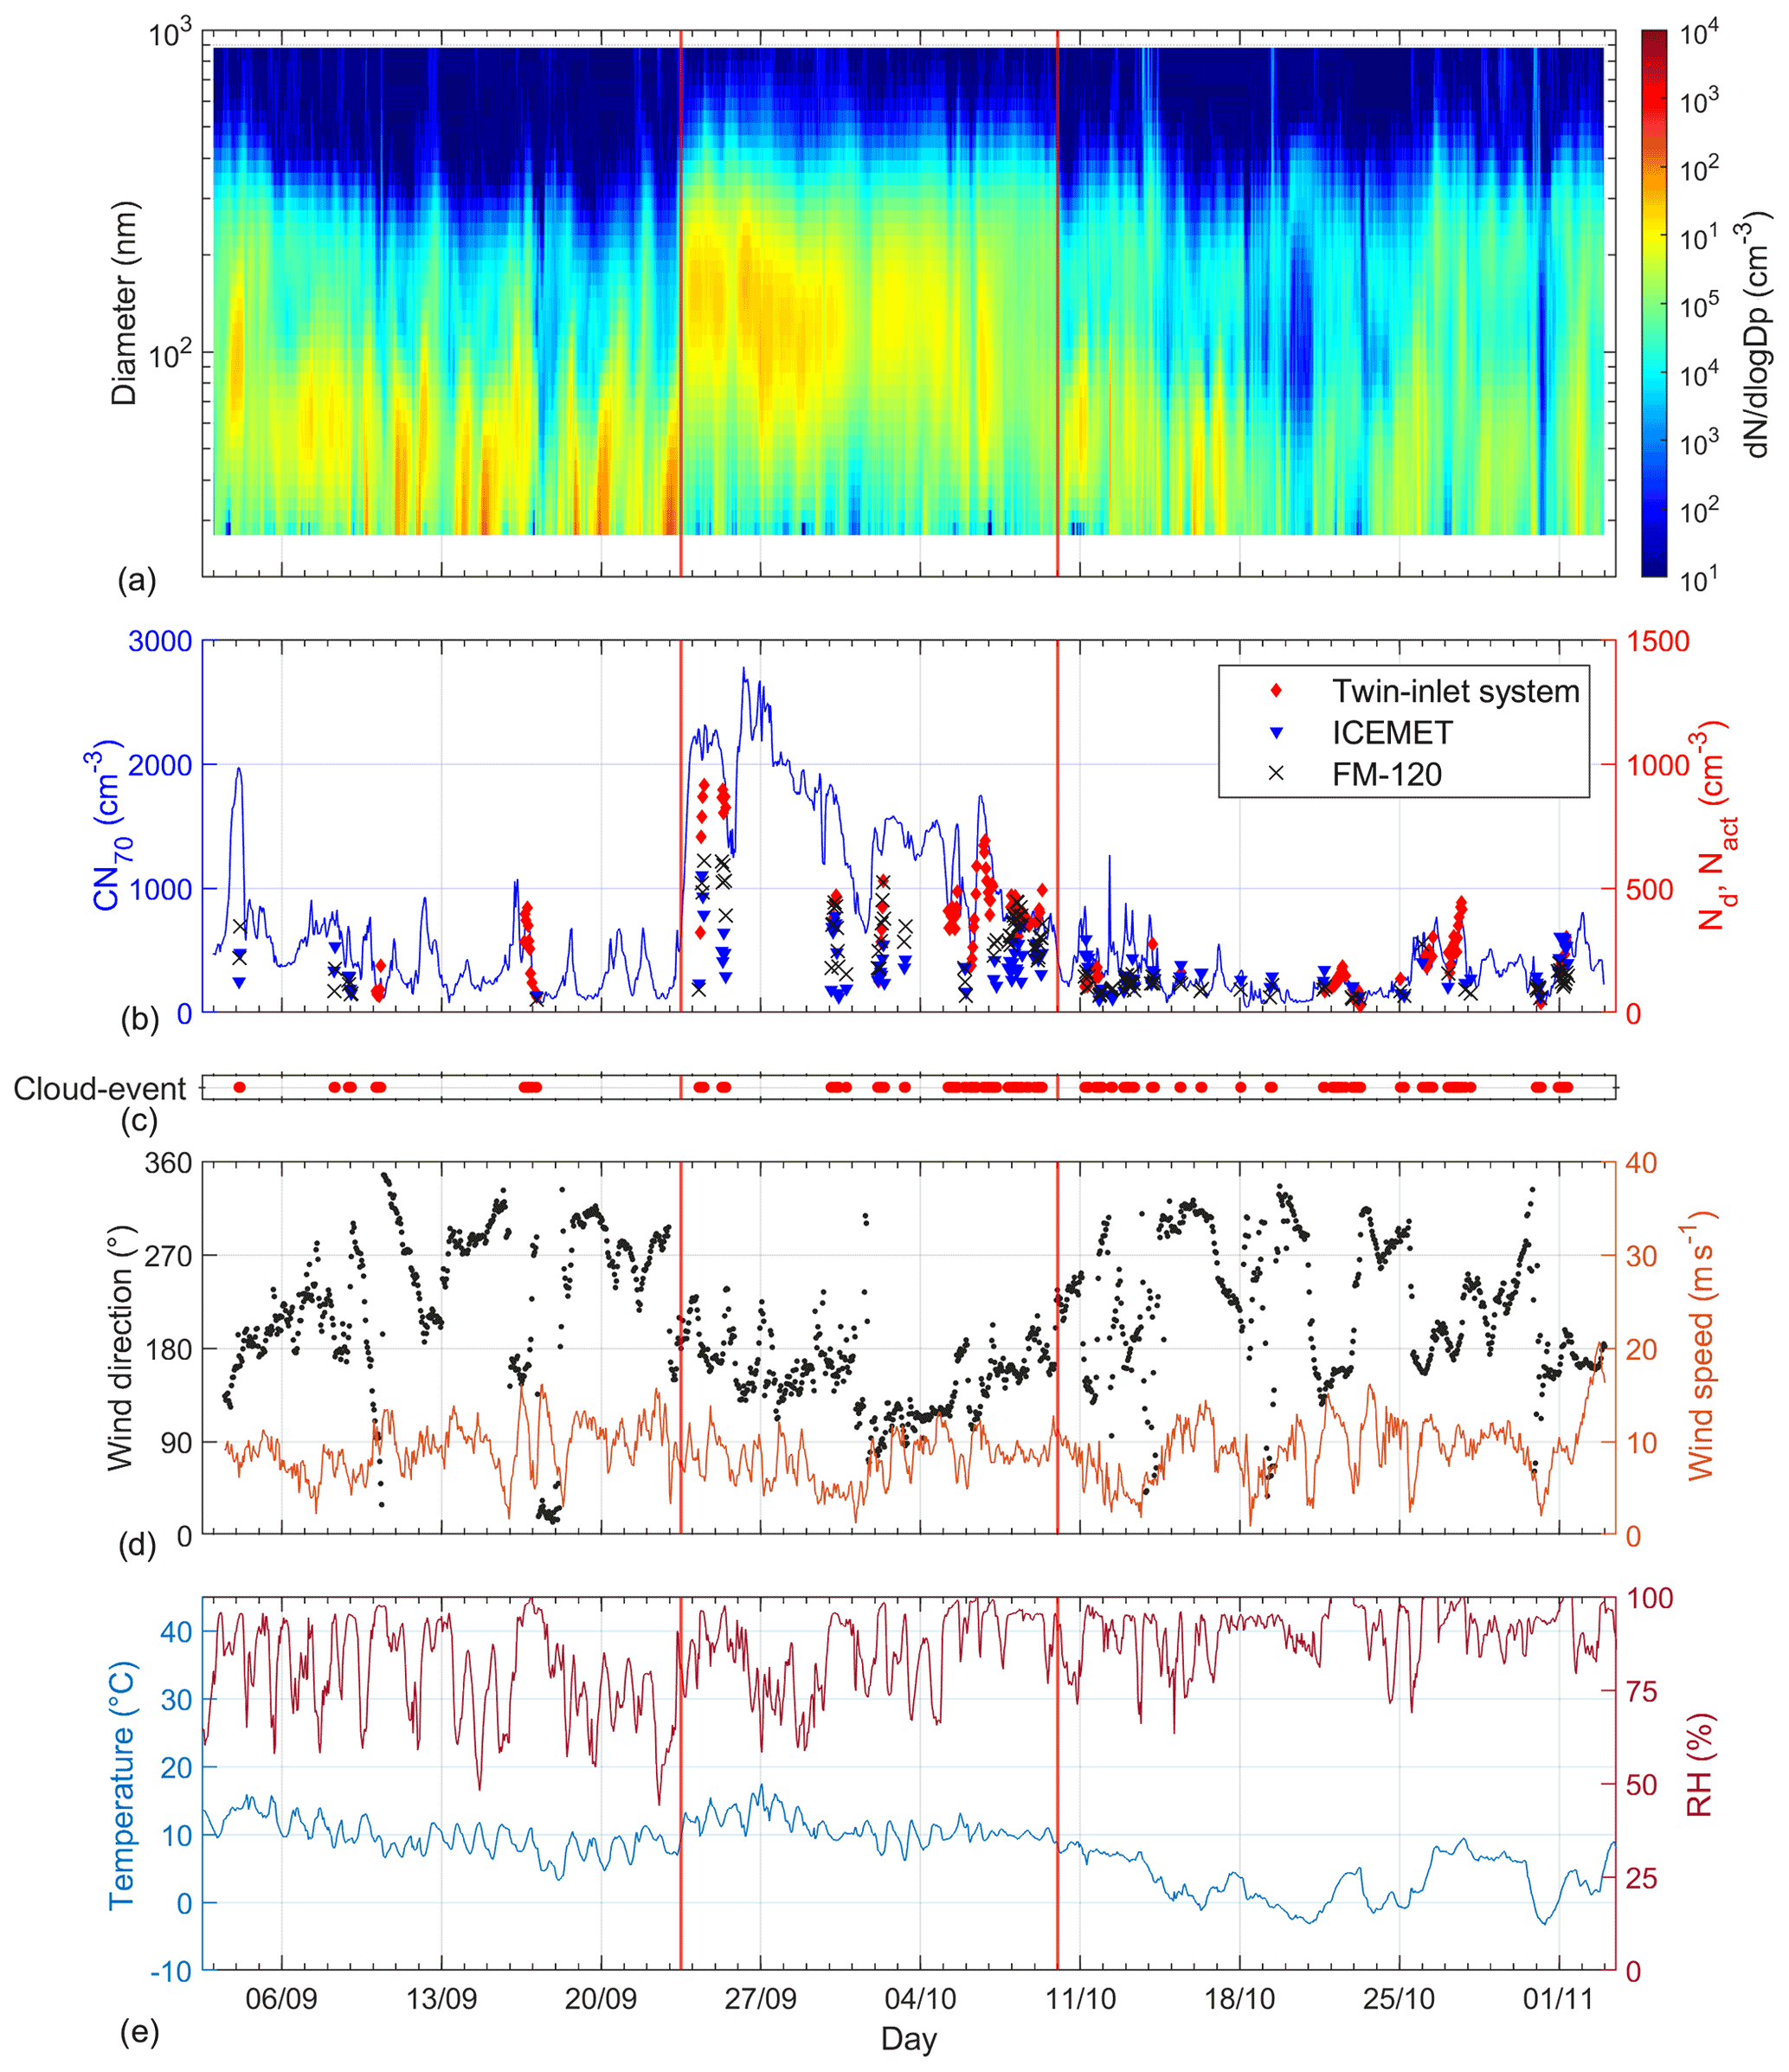
Figure 5Variation of (a) particle size and concentration, and (b) concentrations of cloud condensation nuclei (CN70), cloud droplets (Nd), and activated particles (Nact) in the period of intercomparison campaign from 3 September to 3 November 2020 at the Puijo measurement station. Observed cloud events (c), the wind speed and directions (d), and ambient temperature (T) and relative humidity (RH) (e) are also presented. The intensive smoke period is divided by red lines in panel (a).
3.2 Intercomparison between ICEMET and FM-120
3.2.1 Wind–isoaxial conditions
Cloud droplet sampling may suffer from extra losses of droplets if the inlet is not facing the direction of the prevailing wind and the angular deviation from the isoaxial sampling (θ) is getting larger (Guyot et al., 2015). Guyot et al. (2015) suggested that particle losses in FM-120 sampling because of anisoaxial sampling decrease with increasing wind speed for θ<30∘, while they increase with increasing wind speed for θ>30∘, particularly for large particles. We could verify this by comparing the cloud microphysical properties derived from the FM-120 measurements to those derived from the ICEMET measurements as a function of angular deviation from the isoaxial sampling because the ICEMET turns passively to the correct position thanks to its vane, while the FM-120 faces the same direction all the time. This sampling effect is illustrated in Fig. 6 as the ratio of FM-120 to ICEMET derived properties, and we can see that the angular deviation from the isoaxial sampling influences particularly the LWC ratio (Fig. 6c–d). This is because LWC is typically dominated by large droplets that cannot enter the FM-120 inlet in anisoaxial sampling but are observed by the ICEMET. In our measurement campaign, the FM-120 inlet was facing east (90∘), so in the intercomparisons, we emphasized the FM-120 data on prevailing wind directions of 60–120∘ (Fig. 6: blue lines), following the criteria suggested by Westbeld et al. (2009). The effect of the cut-off size (FM-120: 2 µm vs. ICEMET: 5.3 µm) was investigated by calculating Nd,FM, LWCFM, and MVDFM without the three smallest bins in the size range of 5−50 µm (Fig. 6b, d, and f). The effect of cut-off size showed only a minor impact on calculated MVDFM (+4 %) and LWCFM (−5 %), but opposite to that, Nd,FM decreased on average 35 %.

Figure 6Ratios of cloud microphysical properties (FM-120 vs. ICEMET) within different wind directions calculated using FM-120 size bins of 2–50 µm (a, c, e) and 5–50 µm (b, d, f). Ratios of 1:1 are plotted in dashed lines. The wind sector (east) deviating from the sampling direction by less than 30∘ (isoaxial sampling) is limited by blue lines.
The results revealed that the observed droplet size distributions (DSDs) showed similar behavior in time series of integrated properties and shapes, but ICEMET detected wider DSDIM values especially with increasing angular deviation which explains the higher calculated MVDIM (Fig. 7). The shoulder in DSDFM around 13.5–16 µm is probably due to irregularities in the Mie curve which is a common feature in optical counters (Gonser et al., 2011; Spiegel et al., 2012) and has only a minor influence on calculated Nd,FM, LWCFM, and MVDFM. ICEMET observed lower values than FM-120 for the smallest bins (Fig. 7). The discrepancies of the lowest bins may arise from the global threshold used in the particle segmentation phase after the hologram reconstruction. The global threshold is set to a high enough value so that no excessive amounts of false detected particles (noise artifacts) are found in the segmentation phase, which would waste computational calculation power later in the particle analysis. The use of a point source illumination also has an inherent property that the droplets closer to the laser experience a higher light field intensity, which results in a higher contrast diffraction pattern on the camera sensor, and the nearly Gaussian intensity profile in lateral direction also decreases the light intensity from the center of the hologram towards the edges of the hologram. Other influences on the segmentation of the smallest droplets include the non-ideal and elliptical laser illumination pattern, camera sensor non-idealities, and sub-pixel location of the smallest droplets close to the camera sensor where the effective pixel size is larger, as was discussed in Sect. 2.1. These effects may cause some of the smallest droplets on the camera side of the analyzed volume (Fig. 1) not to be found in the segmentation phase, which may decrease the concentration of the smallest droplets (from 5 to 7 µm).
The average activated particle concentration (Nact) of 278 cm−3 throughout eastern winds (angular deviation <30∘) was close to the measured cloud droplet number concentration (Nd,FM) of 288 cm−3 (Table 1), which results in as good as 97 % agreement based on the mean concentrations, whereas the ratios of the average cloud droplet number concentrations between the FM-120 and the ICEMET reach values up to 1.7. Also agreement in terms of variation was better for Nd,FM (Fig. 8a–b) than for Nd,IM (Fig. 8c–d). FM-120 detects smaller droplets (measured particle size range of 2–50 µm) than ICEMET (measured particle size range of 5.3–200 µm) which affect particularly the number concentration values. The different upper limits did not influence the droplet number concentrations, but when the Nd,FM was determined without the smallest size bins there were significant changes. The average Nd,FM decreased from 288 cm−3 to 282, 256, 193, and 111 cm−3 when applying 3–50, 4–50, 5–50, and 6–50 µm particle size ranges, respectively. Thus, the number concentrations measured with FM-120 and ICEMET match when the lower cut-off size of the FM-120 is a little higher than 5 µm which we can interpret as an experimentally derived estimate for the lower detection limit of ICEMET in ambient conditions, and it is very close to a theoretical effective particle detection size limit (DLeff) of 5.3 µm (Sect. 2.1).
Table 1Summary of intercomparison for the total data set (In-cloud) and for isoaxial sampling (In-cloud IAS, θ ± 30∘): mean values of LWC (mg m−3), MVD (µm), and Nd (cm−3) for ICEMET and FM-120. For the twin-inlet system, the number of Nact (cm−3) and CN70 (cm−3) are presented.

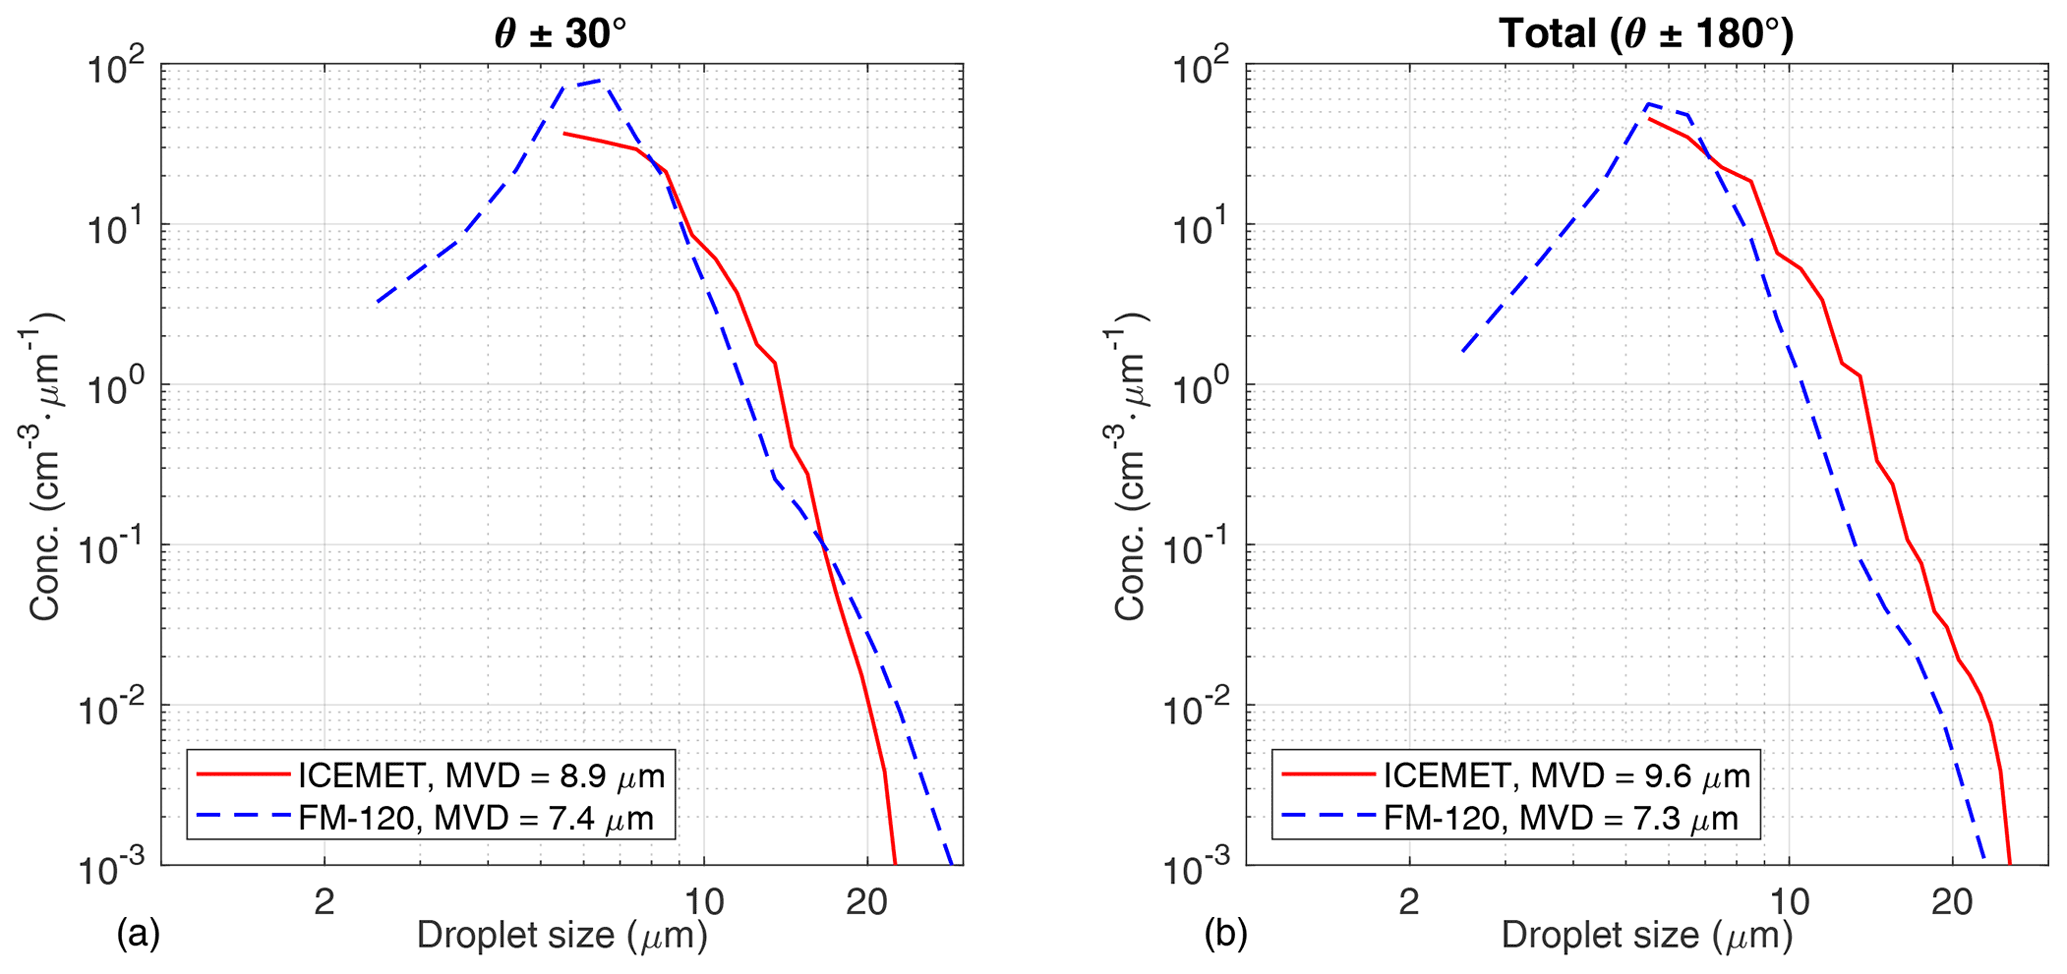
Figure 7Intercomparison between ICEMET (red line) and FM-120 (dashed blue line) median DSDs for (a) isoaxial sampling with angular deviation (θ ± 30∘) and (b) the total data set including all wind directions (θ±180∘).
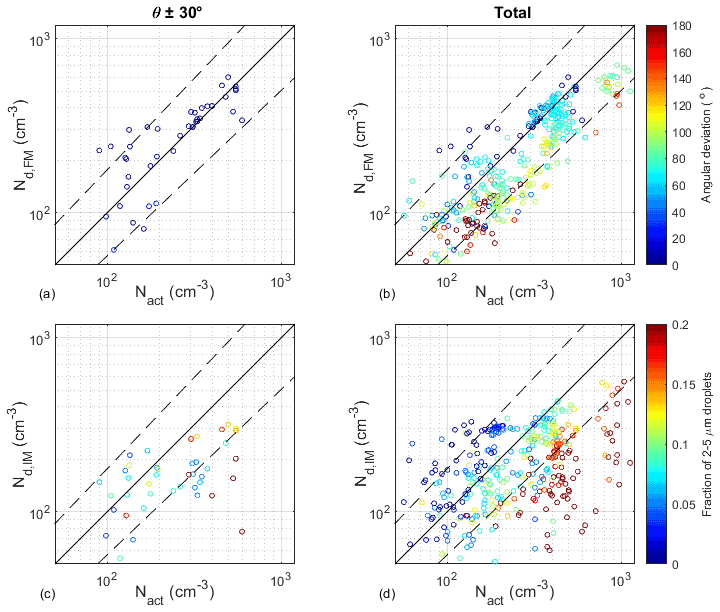
Figure 8Comparison of activated particle concentrations (Nact) with measured cloud droplet number concentrations (Nd) using FM-120 (a, b) and ICEMET (c, d) by angular deviation (θ) of 30∘ and for the total data set (θ ± 180∘). Panels (a) and (b) are colored by angular deviation from the isoaxial sampling (θ) and panels (c) and (d) using a fraction of the lowest bins 1–3 (). Black lines represent 1:1 (solid), 1:2 (dashed) and 2:1 (dashed) values. Only the data points where the fraction of the smallest bins is low () are presented.
The detection accuracy of the 5–7 µm droplet size bins with the ICEMET sensor could be increased with minor software changes, for example, by limiting the measurement volume of this droplet size range to the higher magnification part of the measurement volume, where effective pixel size is smaller than the optical resolving power. Also making the segmentation of the droplets dynamic, by varying the location, could improve the detection accuracy of the droplets near the effective pixel size limit. It would be possible also to reconstruct the holograms to higher pixel number images to compensate for the pixel size limitation in the segmentation phase. This could be done by reconstructing the shadow images, for example, to double the size of the original hologram. Then the effective pixel size could be halved, but this would increase the reconstruction and analysis time significantly, making it not a suitable solution using present computers.
An in-cloud period on 2 November 2020 was chosen to intercompare the ICEMET and the FM-120 in more detail (Fig. 9). These results revealed that instruments showed a good agreement in terms of variability during favorable meteorological conditions (isoaxial sampling, stable cloud cover without heavy rain). Figure 9d–f also point out that Nd,FM was systematically higher and MVDFM lower (red lines) than those measured with the ICEMET sensor (blue lines). Increasing the cut-off size from 2 to 5 µm for FM-120 (marked as green in Fig. 9a and d) improved the agreement in terms of amplitude (values). In summary, anisoaxial sampling and different measurement ranges can explain most of the differences between instruments' observations.
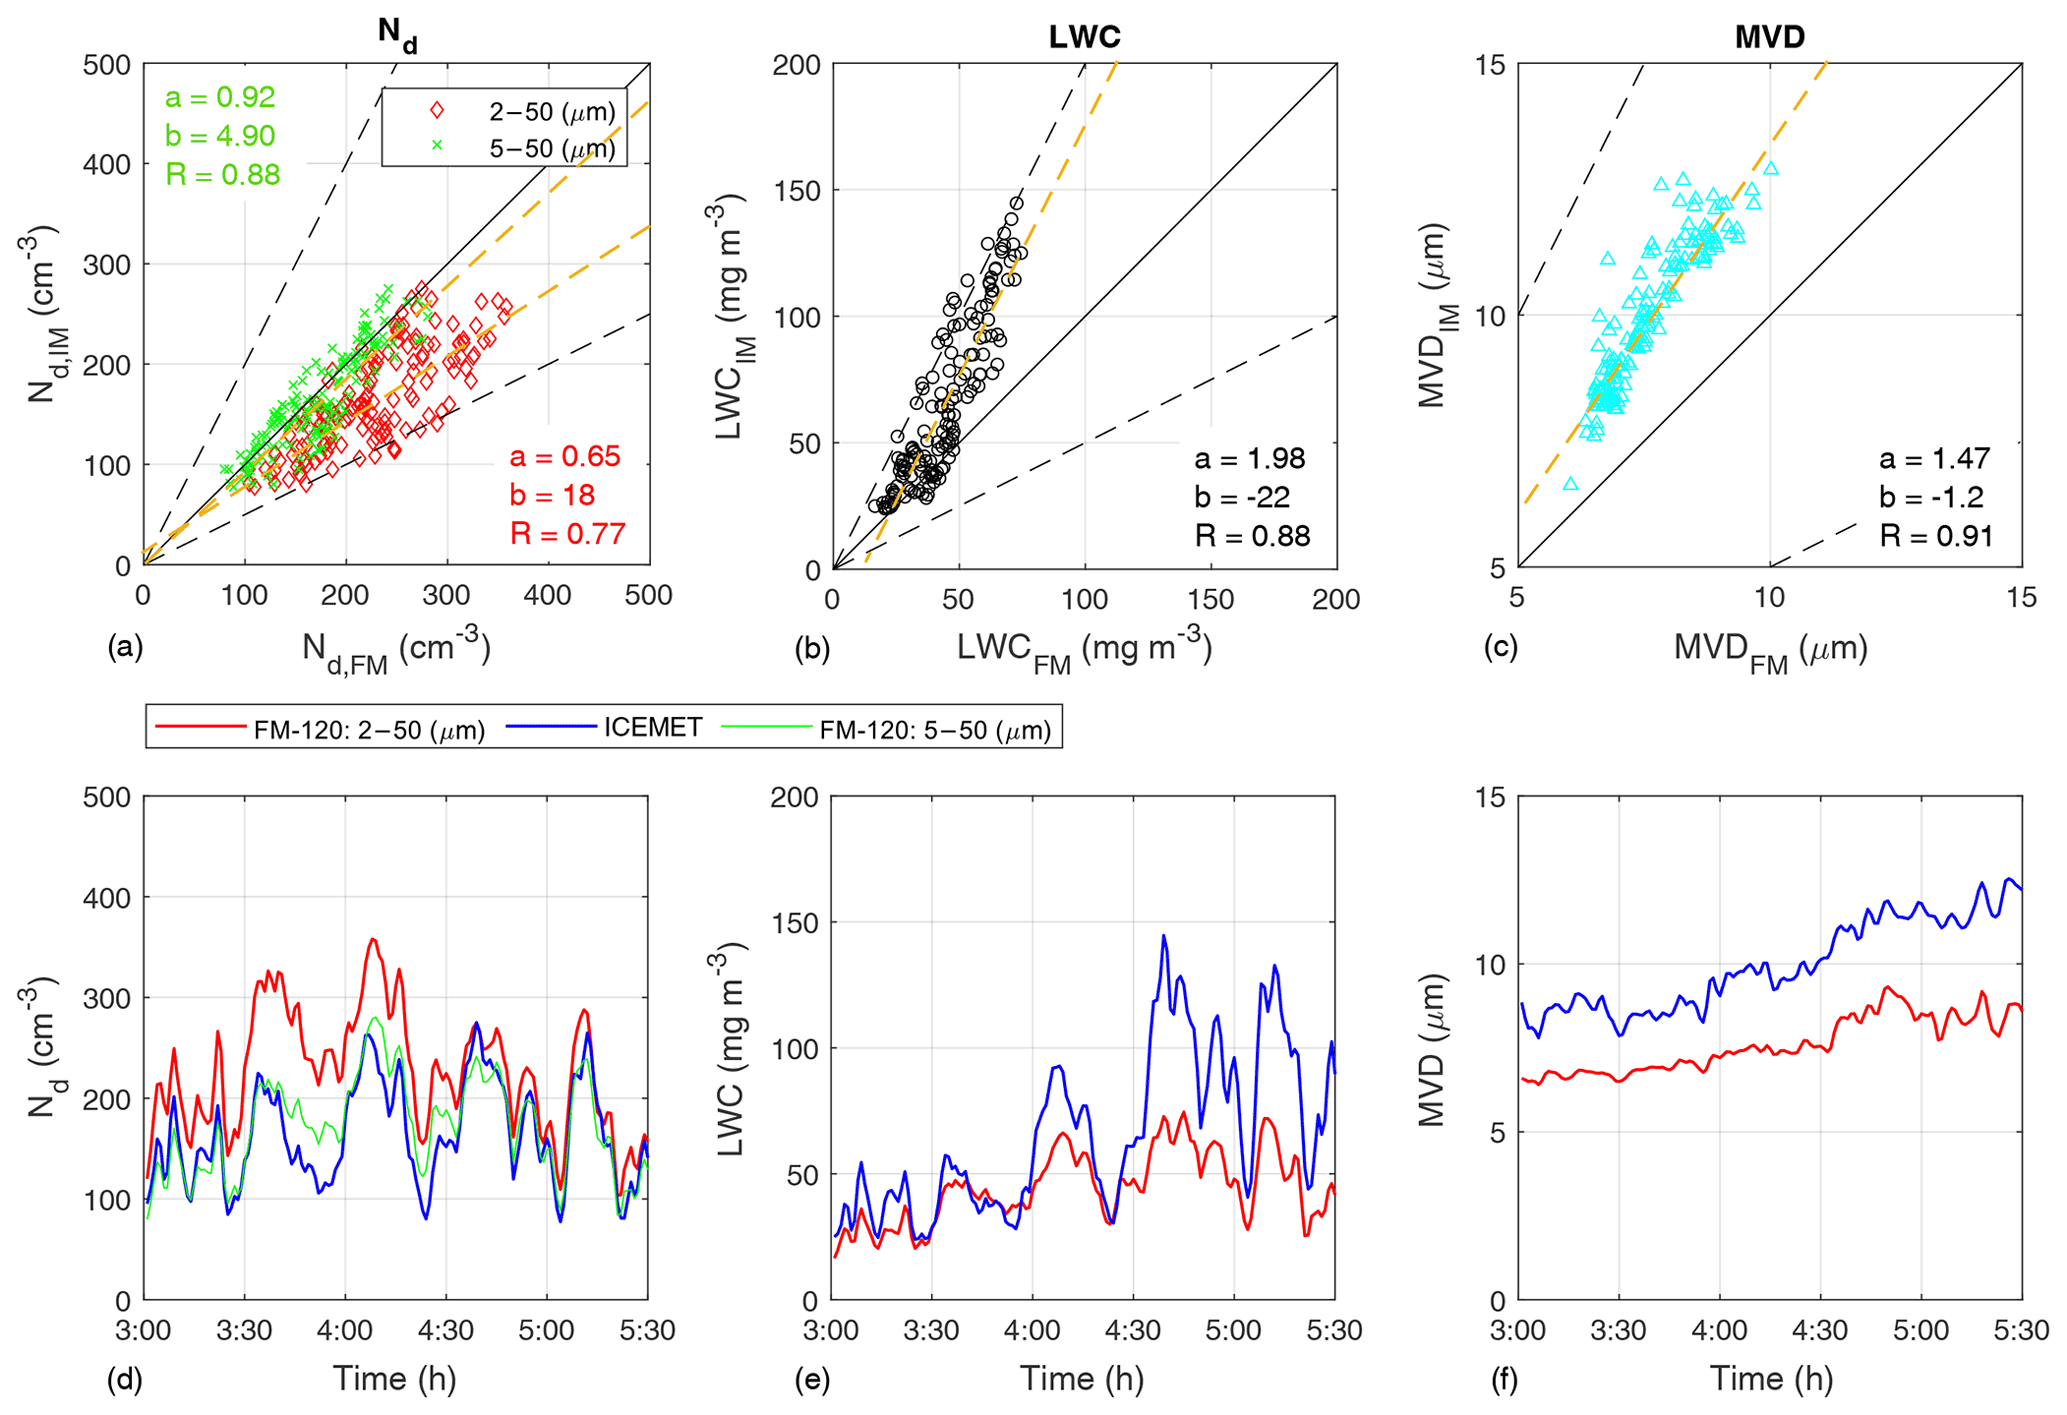
Figure 9Intercomparison of Nd (a,d), LWC (b,e), and MVD (c,f) values between ICEMET (subscript IM, blue line), and FM-120 (subscript FM, red markers/line) in the period of isoaxial sampling (cloud event on 2 October 2020). Nd,FM was also presented without the lowest bins in the size range of 5–50 µm in (a) and (d), marked as green markers/lines. The dashed orange lines represent linear regression with a= slope, b= intercept, and R= Pearson correlation coefficient. Black lines represent 1:1 (solid), 1:2 (dashed) and 2:1 (dashed) value.
3.2.2 The mutual correlation analysis
The variation in the wind direction did not affect the twin-inlet results like the FM-120 measurements, because the inlet of the twin-inlet system is insensitive to the wind direction. Short-term variability in DMPS measurements induced by wind direction is more related to variations in the aerosol properties caused by different types of air masses. For example, the local wind direction from 215 to 360∘ has no significant point aerosol sources and has therefore been defined as the clean sector at Puijo (Portin et al., 2014). The twin-inlet results represent an initial reference point in the mutual analysis. Like previous analyses, time series were filtered to separate observations corresponding to cloudy conditions (“in-cloud”; see Sect. 3.1). To assess the effect of anisoaxial sampling on the degree of mutual correlation, we also compared subsets of data containing only measurements performed with minimum angular deviation or with prevailing winds coming from the east (60–120∘). When this criterion was also applied to “in-cloud” data sets, we referred to it as “IAS”.
Results of the mutual correlation analysis for both, whole and selected data sets, are shown in Table 2 together with Pearson correlation coefficients for comparison purposes. Marginal and joint entropies were calculated using histograms of the total droplet number concentrations, LWC, and MVD. For the “in-cloud” data set, optimal bin sizes for these variables were 1 cm−3, 0.5 mg m−3, and 0.03 µm, respectively. For the “IAS” data set, optimal bin sizes were 6 cm−3, 1.8 mg m−3, and 0.09 µm, respectively. These values were chosen to give several bins close to the number of data points available in each data set (Batina et al., 2011). The evidence of measurement agreement between the ICEMET and the FM-120 can be obtained from the mutual correlation shared by each instrument with the twin-inlet system. When total droplet number concentrations from both, the ICEMET and the FM-120, are compared with those observed by the twin-inlet system, the degrees of mutual correlation are very similar and high with values between 0.70 and 0.79. This confirms that they share a significant amount of information in terms of the Nd variability.
Table 2Pearson correlation coefficients (R) and mutual correlations (MC) between measured variables for the total data set (In-cloud) and isoaxial sampling (In-cloud IAS, θ ± 30∘).
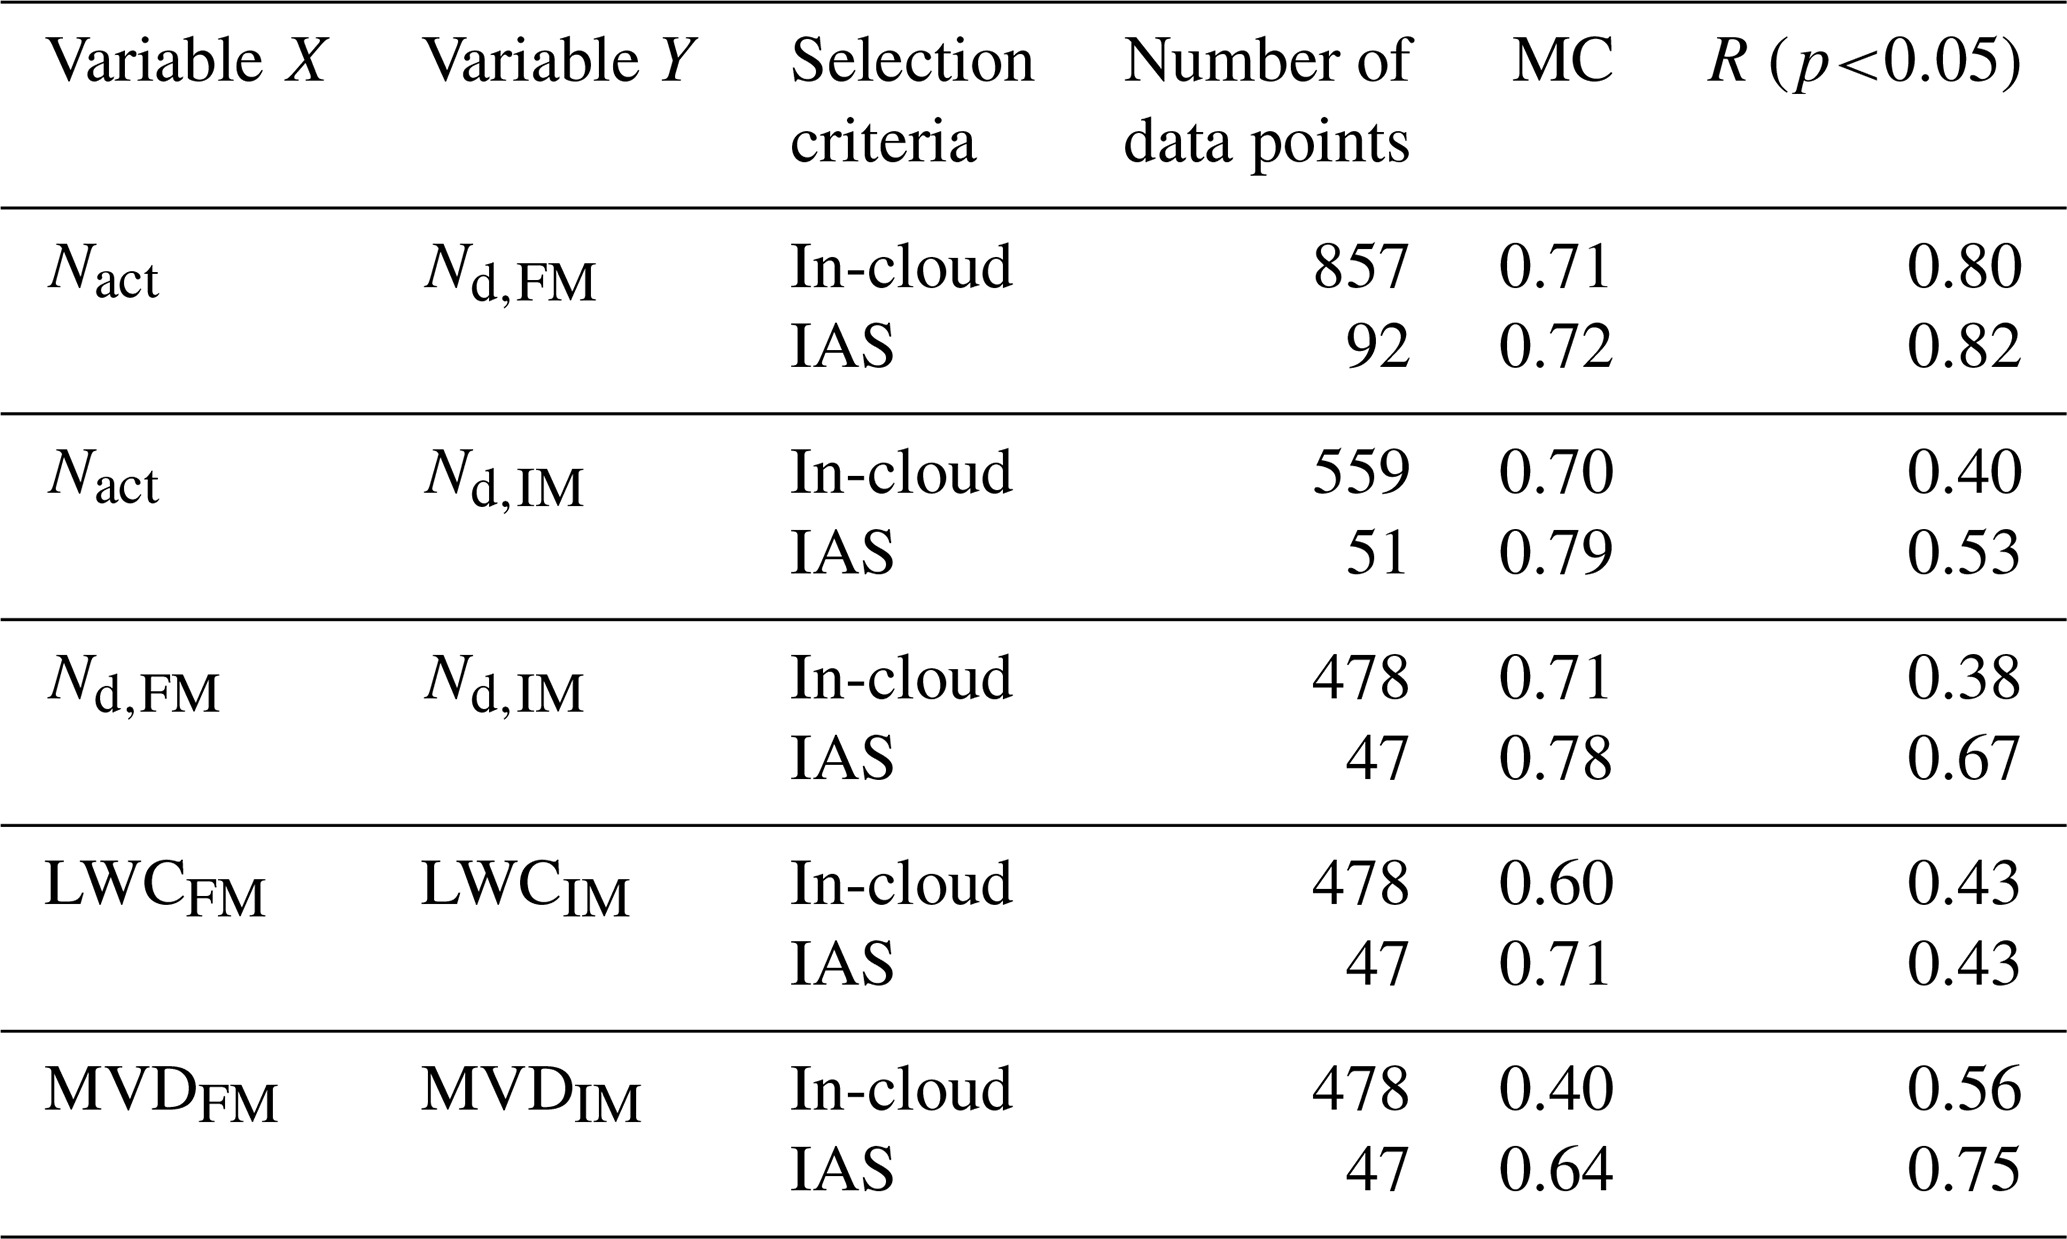
When the ICEMET and the FM-120 are compared with each other, mutual correlation values between in-cloud data sets are 0.71, 0.60, and 0.40 for Nd, LWC, and MVD, respectively, indicating a decreasing trend in the degree of correlation from strong to moderate. While the Nd is not significantly changed by losses of large droplets during anisoaxial sampling, variables such as LWC and MVD respond strongly to these losses due to their stronger functionality with droplet size. Figure 10 summarizes the relation of measured cloud microphysical properties between FM-120 and ICEMET (total data set) in terms of the joint probability distribution. Probability distributions of individual variables are included in Fig. S1 (Sect. S2 in the Supplement). When the criteria of isoaxial sampling (IAS) for the FM-120 is incorporated, mutual correlation coefficients among different data sets increases reaching values of 0.78, 0.71, and 0.64 for Nd, LWC, and MVD, respectively (Table 2). With reduced measurement uncertainty along with the droplet size range, the mutual correlation values are also closer to each other. While MC can detect any kind of dependence, Pearson correlation coefficients strictly evaluate the linear dependence between variables and, therefore, are more susceptible to the presence of extreme values or clusters. This explains why Pearson correlation coefficients for “in-cloud” data sets vary between 0.38 and 0.56 showing a lower degree of correlation than the corresponding MC values. When only the isoaxial sampling criteria are considered, both, mutual and Pearson correlation coefficients, confirm the good correlation between data sets (Table 2). Correlations were increased for all cases, not only for the isoaxial sampling but also because there were more droplets in the overlapping measurement ranges of instruments in the period of eastern winds.

Figure 10The frequency of the measured (a) Nd, (b) LWC, and (c) MVD values using FM-120 (x axis) and ICEMET (y axis) for the total data set (including all wind directions). Dashed white lines represent 1:1 value.
In summary, it is expected to have MC below 100 % due to the differences in detection limits, i.e., the smallest droplet size detected by different instruments. If cloud formation occurs with high aerosol loadings (e.g., wildfire air mass), droplet number concentrations in the size range between 1 and 5 µm can dominate the droplet spectra. Since the smallest cloud droplets cannot be detected, either by the FM-120 or by the ICEMET, but are accounted for by the twin-inlet system, negative biases are inevitable. On the contrary, if cloud formation occurs with low aerosol loadings, the droplet spectrum moves to larger droplet sizes (e.g., clean air mass), and the mutual correlation shared by the three data sets increases. In this case, larger droplets with a diameter above 50 µm are unaccounted for by the FM-120 and the twin-inlet system but detected by ICEMET because its upper detection limit is 200 µm. The large droplets increase the LWCIM and MVDIM which may cause disagreement between the ICEMET and FM-120 observations, especially during clean air mass in-cloud periods when droplets are typically larger. However, during this measurement campaign, the occurrence of larger droplets was quite small, and their effect on the average LWC and MVD were 2.1 % and 1.9 %, respectively. Given these facts, applying multiple instrumentations followed by combined data analysis is recommended to ensure the data continuity along the droplet spectrum. It is necessary to highlight that any statistical indicator of correlation cannot describe fully the physicochemical processes that are driving cloud microphysics, but they can give insight into the dominant ones.
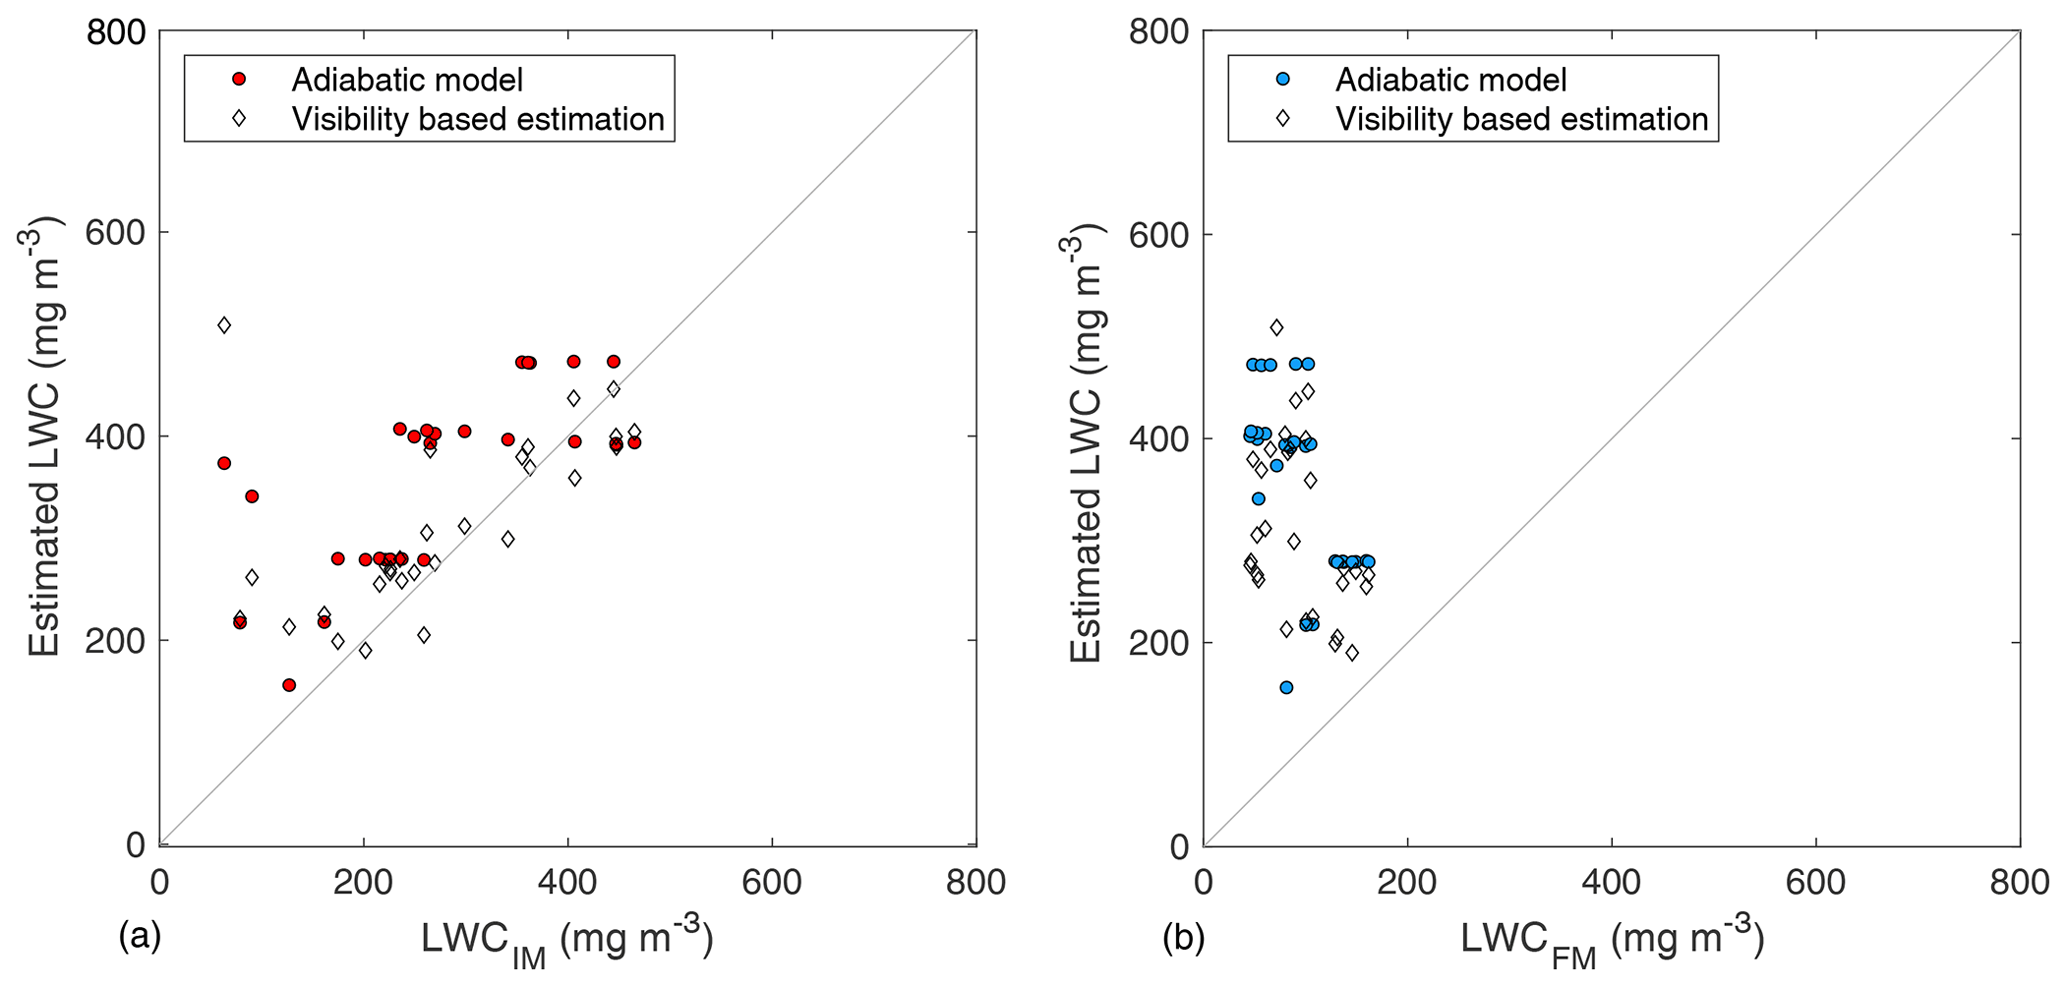
Figure 11Amount of LWC using a simple adiabatic model and visibility-based estimation compared with observed LWC measured utilizing cloud spectrometers (a) ICEMET and (b) FM-120.
3.2.3 LWC analysis
LWC estimations using adiabatic and visibility-based models (see Sect. 2.4) point out that FM-120 underestimates LWC most of the time when LWCFM is measured without a rotating inlet (Fig. 11). The average LWCFM of 92 mg m−3 was only 26 %–30 % of the estimated values of 350 and 310 mg m−3 calculated using the adiabatic and regression models, respectively. In comparison, an average LWCIM was 240 mg m−3 which was 69 % of the adiabatic value and 77 % of the regression model. LWCIM was close to the value observed in the previous study at Puijo station (150 mg m−3; Portin et al., 2014) when values were compared without cloud boundary limitations, with conditions similar to those of Portin et al. (2014), in which case LWCIM was 140 mg m−3 and LWCFM was 44 mg m−3.
We have intercompared a novel digital lens-less holographic imaging system (ICEMET), a commercially available fog monitor (FM-120), and a twin-inlet DMPS system in warm liquid clouds. We found that the intercomparison between the ICEMET and the FM-120 were sensitive to angular deviations of wind direction (e.g., Spiegel et al., 2012), particularly when the FM-120 was installed in a steady position and without a rotating inlet that would enable isoaxial sampling in changing wind directions. The ICEMET, in turn, has a vane and rotates according to the prevailing wind, which minimizes sampling losses. Despite this, our results showed good correlations between the measurements performed by the ICEMET and FM-120, especially during isoaxial sampling. When the intercomparison was carried out for only isoaxial wind condition periods, the averaged ratios between ICEMET and FM-120 were 0.6 ± 0.2, 1.0 ± 0.5, and 1.2 ± 0.2 for Nd, LWC, and MVD, respectively. This agreement was also confirmed by mutual correlation and Pearson correlation coefficients.
Based on our findings, the version of ICEMET sensor and software used in this study cannot detect all cloud droplets close to 5 µm, which affects the observed total droplet number concentration, especially when the droplet size distribution is dominated by small droplets, which was the case during a forest wildfire plume period. However, the ICEMET measures LWC more reliably than FM-120 (without a swivel-head mount), which was also verified by comparing the estimated theoretical maximum LWC to measured values. The LWC was also found to be the most sensitive to changes in wind direction. Independent LWC observations are recommended to improve the data analysis reliability when liquid clouds are investigated.
As a part of the research and development of holographic techniques, the detection accuracy of the smallest droplet sizes with ICEMET sensor could be increased with software changes, for example, by adjusting the measurement volume or making a more dynamic droplet segmentation thresholding in the analysis software. Particularly, it would be practical to reconstruct the holograms to higher pixel number images to obtain the effective pixel size limitation in segmentation of the smallest droplets located closer to the camera sensor.
The data from this paper can be obtained by contacting the authors.
The supplement related to this article is available online at: https://doi.org/10.5194/amt-15-2993-2022-supplement.
PT wrote the manuscript and analyzed the data with contributions from all co-authors. SC analyzed and reported MI data. PT, AL, and MK installed and operated all the instruments. VAK and EOM performed ICEMET calibrations.
The contact author has declared that neither they nor their co-authors have any competing interests.
Publisher’s note: Copernicus Publications remains neutral with regard to jurisdictional claims in published maps and institutional affiliations.
Financial support was provided by the Academy of Finland (grant no. 309127) and Horizon 2020 Research and Innovation Programme (grant no. 821205). This work was supported in part by the European Regional Development Fund (ERDF) under European Territorial Cooperation (ETC) program Interreg V A Nord (grant no. NYPS 20202472) and in part by the Regional Council of Lapland (grant no. 126/00.01.05.24.02/2019).
This research has been supported by the Academy of Finland (grant no. 309127), the Horizon 2020 (FORCeS (grant no. 821205)), the European Regional Development Fund (ERDF) under European Territorial Cooperation (ETC) program Interreg V A Nord (grant no. NYPS 20202472), and in part by the Regional Council of Lapland (grant no. 126/00.01.05.24.02/2019).
This paper was edited by Zamin A. Kanji and reviewed by Annika Lauber and one anonymous referee.
Batina, L., Gierlichs, B., Prouff, E., Rivain, M., Standaert, F.-X., and Veyrat-Charvillon, N.: Mutual Information Analysis: a Comprehensive Study, J. Cryptol., 24, 269–291, https://doi.org/10.1007/s00145-010-9084-8, 2011.
Baumgardner, D., Brenguier, J., Bucholtz, A., Coe, H., DeMott, P., Garrett, T., Gayet, J., Hermann, M., Heymsfield, A., Korolev, A., Krämer, M., Petzold, A., Strapp, W., Pilewskie, P., Taylor, J., Twohy, C., Wendisch, M., Bachalo,W., and Chuang, P.: Airborne instruments to measure atmospheric aerosol particles, clouds and radiation: A cook's tour of mature and emerging technology, Atmos. Res., 102, 10–29, https://doi.org/10.1016/j.atmosres.2011.06.021, 2011.
Baumgardner, D., Newton, R., Krämer, M., Meyer, J., Beyer, A., Wendisch, M., and Vochezer, P.: The Cloud Particle Spectrometer with Polarization Detection (CPSPD): A next generation open-path cloud probe for distinguishing liquid cloud droplets from ice crystals, Atmos. Res., 142, 2–14, https://doi.org/10.1016/j.atmosres.2013.12.010, 2014.
Beck, A, Henneberger, J., Schöpfer, S., Fugal, J., and Lohmann, U.: HoloGondel: in situ observations on a cable car in the Swiss Alps using a holographic imager, Atmos. Meas. Tech., 10, 459–476, https://doi.org/10.5194/amt-10-459-2017, 2017.
Bohren, C. F. and Huffman, D. R: Absorption and scattering of light by small particles, John Wiley & Sons, New York, NY, USA, https://doi.org/10.1002/9783527618156, 1983.
Boucher, O., Randall, D., Artaxo, P., Bretherton, C., Feingold, G., Forster, P., Kerminen, V.-M., Kondo, Y., Liao, H., Lohmann, U., Rasch, P., Satheesh, S. K., Sherwood, S., Stevens, B., and Zhang, X. Y.: Clouds and aerosols, in: Climate Change 2013: The Physical Science Basis, Contribution of Working Group I to the Fifth Assessment Report of the Intergovernmental Panel on Climate Change, edited by: Stocker, T. F., Qin, D., Plattner, G.-K., Tignor, M., Allen, S. K., Doschung, J., Nauels, A., Xia, Y., Bex, V., and Midgley, P. M., Cambridge University Press, 571–657, https://doi.org/10.1017/CBO9781107415324.016, 2013.
Bradski, G.: The OpenCV Library, Dr. Dobb's Journal of Software Tools, 25, 120–125, 2000.
Dawe, J. T. and Austin, P. H.: Direct entrainment and detrainment rate distributions of individual shallow cumulus clouds in an LES, Atmos. Chem. Phys., 13, 7795–7811, https://doi.org/10.5194/acp-13-7795-2013, 2013.
Doulgeris, K.-M., Komppula, M., Romakkaniemi, S., Hyvärinen, A.-P., Kerminen, V.-M., and Brus, D.: In situ cloud ground-based measurements in the Finnish sub-arctic: intercomparison of three cloud spectrometer setups, Atmos. Meas. Tech., 13, 5129–5147, https://doi.org/10.5194/amt-13-5129-2020, 2020.
Droplet Measurement Technologies: Data Analysis User's Guide Chapter I: Single Particle Light Scattering (DOC-0222, Rev A), Droplet Measurement Technologies, Inc., Boulder, USA, 2009.
Finstad, K. J., Lozowski, E. P., and Makkonen, L.: On the median volume approximation for droplet collision efficiency, J. Atmos. Sci., 45, 4008–4012, https://doi.org/10.1175/1520-0469(1988)045<4008:OTMVDA>2.0.CO;2, 1988.
Fišak, J., Řezakova, Ď., and Mattanen J.: Calculated and measured values of liquid water content in clean and polluted environment, Stud. Geophys. Geod., 50, 121–130, https://doi.org/10.1007/s11200-006-0006-z, 2006.
Fugal, J. P. and Shaw, R. A.: Cloud particle size distributions measured with an airborne digital in-line holographic instrument, Atmos. Meas. Tech., 2, 259–271, https://doi.org/10.5194/amt-2-259-2009, 2009.
Fugal, J. P., Schultz, T. J., and Shaw, R. A.: Practical methods for automated reconstruction and characterization of particles in digital in-line holograms, Meas. Sci. Technol., 20, 075501, https://doi.org/10.1088/0957-0233/20/7/075501, 2009.
Glenn, I. B., Feingold, G., Gristey, J. J., and Yamaguchi, T.: Quantification of the radiative effect of aerosol–cloud interactions in shallow continental cumulus clouds, J. Atmos. Sci., 77, 2905–2920, https://doi.org/10.1175/JAS-D-19-0269.1, 2020.
Gonser, S. G., Klemm, O., Griessbaum, F., Chang, S.-C., Chu, H.-S., and Hsia, Y.-J.: The relation between humidity and liquid water content in fog: An experimental approach, Pure Appl. Geophys., 169, 821–833 https://doi.org/10.1007/s00024-011-0270-x, 2011.
Guyot, G., Gourbeyre, C., Febvre, G., Shcherbakov, V., Burnet, F., Dupont, J.-C., Sellegri, K., and Jourdan, O.: Quantitative evaluation of seven optical sensors for cloud microphysical measurements at the Puy-de-Dôme Observatory, France, Atmos. Meas. Tech., 8, 4347–4367, https://doi.org/10.5194/amt-8-4347-2015, 2015.
Harvey, A. H., Gallagher, J. S., and Sengers, J. M. H. L.: Revised Formulation for the Refractive Index of Water and Steam as a Function of Wavelength, Temperature and Density, J. Phys. Chem. Ref. Data, 27, 761–774. https://doi.org/10.1063/1.556029, 1998.
Henneberger, J., Fugal, J. P., Stetzer, O., and Lohmann, U.: HOLIMO II: a digital holographic instrument for ground-based in situ observations of microphysical properties of mixed-phase clouds, Atmos. Meas. Tech., 6, 2975–2987, https://doi.org/10.5194/amt-6-2975-2013, 2013.
Hoyle, C. R., Webster, C. S., Rieder, H. R., Nenes, A., Hammer, E., Herrmann, E., Gysel, M., Bukowiescki, N., Weingartner, E., Steinbacker, M., and Baltensberger, U.: Chemical and physical influences on aerosol activation in liquid clouds: a study based on observation from the Jungfraujoch, Switzerland, Atmos. Chem. Phys., 16, 4043–4061, https://doi.org/10.5194/acp-16-4043-2016, 2016.
IPCC: Climate Change 2007: Impacts, Adaptation and Vulnerability, Contribution of Working Group II to the Fourth Assessment Report of the Intergovernmental Panel on Climate Change, edited by: Parry, M. L., Canziani, O. F., Palutikof, J. P., van der Linden, P. J., and Hanson, C. E., Cambridge University Press, ISBN 978 0521 88010-7 Hardback, Cambridge, UK, 976 pp., 2007.
IPCC: Climate Change 2021: The Physical Science Basis, Contribution of Working Group I to the Sixth Assessment Report of the Intergovernmental Panel on Climate Change, edited by: Masson-Delmotte, V., Zhai, P., Pirani, A., Connors, J. B. R., Péan, C., Berger, S., Caud, N., Chen, Y., Goldfarb, L., Gomis, M. I., Huang, M., Leitzell, K., Lonnoy, E., and Zhou, B., Cambridge University Press, Cambridge, United Kingdom and New York, NY, USA, in press, https://doi.org/10.1017/9781009157896, 2021.
Madonna, F., Rosoldi, M., Güldner, J., Haefele, A., Kivi, R., Cadeddu, M. P., Sisterson, D., and Pappalardo, G.: Quantifying the value of redundant measurements at GCOS Reference Upper-Air Network sites, Atmos. Meas. Tech., 7, 3813–3823, https://doi.org/10.5194/amt-7-3813-2014, 2014.
Juttula, H., Kaikkonen, V., and Mäkynen, A.: Study of the Aerodynamic Sampling Effects of a Holographic Cloud Droplet Instrument, 2020 IEEE International Instrumentation and Measurement Technology Conference (I2MTC) 25–28 May 2020 Dubrovnik Croatia, no. 19784328, 1–5, https://doi.org/10.1109/I2MTC43012.2020.9129363, 2020.
Kaikkonen, V. A., Molkoselkä, E. O., and Mäkynen, A. J.: A rotating holographic imager for stationary cloud droplet and ice crystal measurements, Opt. Rev., 27, 205–216, https://doi.org/10.1007/s10043-020-00583-y, 2020.
Knollenberg, R. G.: Techniques for Probing Cloud Microstructure, in: Clouds, Their Formation, Optical Properties and Effects, edited by: Hobbs, P. V. and Deepak, A., Academic Press, New York, NY, USA, 15–92, ISBN 9780323140973, 1981.
Kunkel, B. A.: Parametrization of droplet terminal velocity and extinction coefficient in fog models, J. Clim. Appl. Meteorol., 23, 34–41, https://doi.org/10.1175/1520-0450(1984)023<0034:PODTVA>2.0.CO;2, 1983.
Lawson, R. P., Baker, B. A., Schmitt, C. G., and Jensen, T. L.: An overview of microphysical properties of Arctic clouds observed in May and July 1998 during FIRE ACE, J. Geophys. Res., 106, 14989–15014, https://doi.org/10.1029/2000JD900789, 2001.
Lawson, R. P., O'Connor, D., Zmarzly, P., Weaver, K., Baker, B., and Mo, Q.: The 2D-S (Stereo) Probe: Design and Preliminary Tests of a New Airborne, High-Speed, High-Resolution Particle Imaging Probe, J. Atmos. Oceanic Technol., 23, 1462–1477, 2006.
Leskinen, A., Portin, H., Komppula, M., Miettinen, P., Arola, A., Lihavainen, H., Hatakka, J., Laaksonen, A., and Lehtinen, K. E. J.: Overview of the research activities and results at Puijo semi-urban measurement station, Boreal Env. Res., 14, 576–590, 2009.
Leskinen, A., Arola, A., Komppula, M., Portin, H., Tiitta, P., Miettinen, P., Romakkaniemi, S., Laaksonen, A., and Lehtinen, K. E. J.: Seasonal cycle and source analyses of aerosol optical properties in a semi-urban environment at Puijo station in Eastern Finland, Atmos. Chem. Phys., 12, 5647–5659, https://doi.org/10.5194/acp-12-5647-2012, 2012.
Li, J., Zhu, C., Chen, H., Zhao, D., Xue, L., Wang, X., Li, H., Liu, P., Liu, J, Zhang, C., Mu, Y., Zhang, W., Zhang, L., Herrmann, H., Li, K., Liu, M., and Chen, J.: The evolution of cloud and aerosol microphysics at the summit of Mt. Tai, China, Atmos. Chem. Phys., 20, 13735–13751, https://doi.org/10.5194/acp-20-13735-2020, 2020.
Lloyd, G., Choularton, T. W., Bower, K. N., Gallagher, M. W., Connolly, P. J., Flynn, M., Farrington, R., Crosier, J., Schlenczek, O., Fugal, J., and Henneberger, J.: The origins of ice crystals measured in mixed-phase clouds at the high-alpine site Jungfraujoch, Atmos. Chem. Phys., 15, 12953–12969, https://doi.org/10.5194/acp-15-12953-2015, 2015.
Lloyd, G., Choularton, T., Bower, K., Crosier, J., Gallagher, M., Flynn, M., Dorsey, J., Liu, D., Taylor, J. W., Schlenczek, O., Fugal, J., Borrmann, S., Cotton, R., Field, P., and Blyth, A.: Small ice particles at slightly supercooled temperatures in tropical maritime convection, Atmos. Chem. Phys., 20, 3895–3904, https://doi.org/10.5194/acp-20-3895-2020, 2020.
Madonna, F., Rosoldi, M., Güldner, J., Haefele, A., Kivi, R., Cadeddu, M. P., Sisterson, D., and Pappalardo, G.: Quantifying the value of redundant measurements at GCOS Reference Upper-Air Network sites, Atmos. Meas. Tech., 7, 3813–3823, https://doi.org/10.5194/amt-7-3813-2014, 2014.
Molkoselkä, E. O.: Icemet-server: Hologram processing and cloud droplet analysis software for ICEMET-project, https://github.com/molkoback/icemet-server (last access: 1 May 2022), 2020.
Molkoselkä, E. O., Kaikkonen, V. A., and Mäkynen, A. J.: Measuring atmospheric icing rate in mixedphase clouds using filtered particle data, IEEE Transactions of Instrumentation and Measurement, 70, 1–8, 7001708, https://doi.org/10.1109/TIM.2020.3035562, 2021.
Nowak, J. L., Mohammadi, M., and Malinowski, S. P.: Applicability of the VisiSize D30 shadowgraph system for cloud microphysical measurements, Atmos. Meas. Tech., 14, 2615–2633, https://doi.org/10.5194/amt-14-2615-2021, 2021.
Portin, H., Komppula, M., Leskinen, A., Romakkaniemi, S., Laaksonen, A., and Lehtinen, K. E. J.: Observations of aerosol-cloud interactions at the Puijo semi-urban measurement station, Boreal Environ. Res., 14, 641–653, 2009.
Portin, H., Leskinen, A., Hao, L., Kortelainen, A., Miettinen, P., Jaatinen, A., Laaksonen, A., Lehtinen, K. E. J., Romakkaniemi, S., and Komppula, M.: The effect of local sources on particle size and chemical composition and their role in aerosol–cloud interactions at Puijo measurement station, Atmos. Chem. Phys., 14, 6021–6034, https://doi.org/10.5194/acp-14-6021-2014, 2014.
Ragno, A. and Hobbs, P. V.: Microstructures and precipitation development in cumulus and small cumulonimbus clouds over the warm pool of the tropical Pacific Ocean, Q. J. Roy. Meteorol. Soc., 131, 639–673 https://doi.org/10.1256/qj.04.13, 2005.
Ramelli, F., Beck, A., Henneberger, J., and Lohmann, U.: Using a holographic imager on a tethered balloon system for microphysical observations of boundary layer clouds, Atmos. Meas. Tech., 13, 925-939, https://doi.org/10.5194/amt-13-925-2020, 2020.
Rolph, G., Stein, A., and Stunder, B.: Real-time Environmental Applications and Display system: READY, Environ. Model. Softw., 95, 210–228, https://doi.org/10.1016/j.envsoft.2017.06.025, 2017.
Ruuskanen, A., Romakkaniemi, S., Kokkola, H., Arola, A., Mikkonen, S., Portin, H., Virtanen, A., Lehtinen, K. E. J., Komppula, M., and Leskinen, A.: Observations on aerosol optical properties and scavenging during cloud events, Atmos. Chem. Phys., 21, 1683–1695, https://doi.org/10.5194/acp-21-1683-2021, 2021.
Sauvageat, E., Zeder, Y., Auderset, K., Calpini, B., Clot, B., Crouzy, B., Konzelmann, T., Lieberherr, G., Tummon, F., and Vasilatou, K.: Real-time pollen monitoring using digital holography, Atmos. Meas. Tech., 13, 1539–1550, https://doi.org/10.5194/amt-13-1539-2020, 2020.
Schlenczek, O., Fugal, J. P., Lloyd, G., Bower, K. N., Choularton, T. W., Flynn, M., Crosier, J., and Borrmann, S.: Microphysical Properties of Ice Crystal Precipitation and Surface-Generated Ice Crystals in a High Alpine Environment in Switzerland, J. Appl. Meteorol. Clim., 56, 433–453, 2017.
Seinfeld, J. H. and Pandis S. N.: Atmospheric Chemistry and Physics: from Air Pollution to Climate Change, 2nd Edn., J. Wiley & Sons, New York, ISBN-10 0-471-72018-6, 2006.
Spiegel, J. K., Zieger, P., Bukowiecki, N., Hammer, E., Weingartner, E., and Eugster, W.: Evaluating the capabilities and uncertainties of droplet measurements for the fog droplet spectrometer (FM-100), Atmos. Meas. Tech., 5, 2237–2260, https://doi.org/10.5194/amt-5-2237-2012, 2012.
Stein, A. F., Draxler, R. R., Rolph, G. D., Stunder, B. J. B., Cohen, M. D., and Ngan, F.: NOAA's HYSPLIT atmospheric transport and dispersion modeling system, Bull. Am. Meteorol. Soc., 96, 2059–2077, 2015.
Westbeld, A., Klemm, O., Griesbaum, F., Sträter, E., Larrain H., Osses, P., and Cereceda, P.: Fog deposition to a Tillandsia carpet in the Atacama Desert, Ann. Geophys., 27, 3571–3576, https://doi.org/10.5194/angeo-27-3571-2009, 2009.
Wood, R.: Stratocumulus Clouds, Mon. Weather Rev., 140, 2373–2423, https://doi.org/10.1175/MWR-D-11-00121.1, 2012.