the Creative Commons Attribution 4.0 License.
the Creative Commons Attribution 4.0 License.
 | 14 Jun 2022
Characterization of tandem aerosol classifiers for selecting particles: implication for eliminating the multiple charging effect
Yao Song
Xiangyu Pei
Huichao Liu
Jiajia Zhou
Zhibin Wang
Accurate particle classification plays a vital role in aerosol studies. Differential mobility analyzers (DMAs), centrifugal particle mass analyzers (CPMAs) and aerodynamic aerosol classifiers (AACs) are commonly used to select particles with a specific mobility diameter, aerodynamic diameter or mass, respectively. However, multiple charging effects cannot be entirely avoided when using either individual techniques or tandem systems such as DMA–CPMA, especially when selecting soot particles with fractal structures. In this study, we calculate the transfer functions of the DMA–CPMA and DMA–AAC in static configurations for flame-generated soot particles. We propose an equation that constrains the resolutions of the DMA and CPMA to eliminate the multiple charging effect when selecting particles with a certain mass–mobility relationship using the DMA–CPMA system. The equation for the DMA–AAC system is also derived. For DMA–CPMA in a static configuration, our results show that the ability to remove multiply charged particles mainly depends on the particle morphology and resolution settings of the DMA and CPMA. Using measurements from soot experiments and literature data, a general trend in the appearance of the multiple charging effect with decreasing size when selecting aspherical particles is observed. As for DMA–AAC in a static configuration, the ability to eliminate particles with multiple charges is mainly related to the resolutions of the classifiers. In most cases, the DMA–AAC in a static configuration can eliminate the multiple charging effect regardless of the particle morphology, but multiply charged particles will be selected when decreasing the resolution of the DMA or AAC. We propose that the potential influence of the multiple charging effect should be considered when using the DMA–CPMA or DMA–AAC systems in estimating size- and mass-resolved optical properties in field and lab experiments.
- Article
(3281 KB) - Full-text XML
-
Supplement
(1226 KB) - BibTeX
- EndNote


Atmospheric aerosol particles span a wide size range from 1 nm to >100 µm. A significant size dependence of aerosol physicochemical properties has been widely reported. Particle size can strongly alter the hygroscopic behavior (Biskos et al., 2006), phase state (Cheng et al., 2015) and cloud-nucleating ability (Dusek et al., 2006) of aerosol nanoparticles, indicating the importance of particle size when assessing the climate effect. Hence, accurate particle classification is essential when investigating the size-dependent behavior of aerosol particles.
At present, particles are generally classified by either size or mass in atmospheric aerosol studies. Differential mobility analyzers (DMAs) are the most commonly used size classifier, which selects particles based on electrical mobility (Knutson and Whitby, 1975; Park et al., 2008; Stolzenburg and McMurry, 2008; Swietlicki et al., 2008; Wiedensohler et al., 2012). Particle mass analyzers (PMAs) include aerosol particle mass analyzers (APMs) and centrifugal particle mass analyzers (CPMAs), both of which classify particles based on their mass-to-charge ratio (Ehara et al., 1996; Olfert and Collings, 2005). The charge distribution of particles must be known by passing through a neutralizer or similar when classified by a DMA or PMA. However, particles with higher-order charges and identical apparent mobility or mass-to-charge ratio can be selected simultaneously, which are referred to as the multiple charging effect. This may introduce uncertainty in the subsequent characterization. Radney et al. (2013) demonstrated that although single-charged particles account for the highest number fraction (46.3 %) of DMA-classified particles (200 nm), their contributions to the total mass concentration and extinction are insignificant (10.8 % and 7.96 %, respectively). Thus, the reported extinction of particles with a certain diameter has been greatly overestimated due to the multiple charging effect.
Previous studies (Shiraiwa et al., 2010; Rissler et al., 2013; Johnson et al., 2014, 2021) tried to utilize the combination of size and mass classifiers, such as DMA–APM or DMA–CPMA systems, to obtain singly charged particles. Theoretically, the ability of a DMA–APM to eliminate multiply charged particles is governed by the particle morphology and setups of the DMA and APM (Kuwata, 2015). This conclusion implies that multiply charged particles cannot be effectively excluded for aspherical particles, especially for soot particles. Radney and Zangmeister (2016) investigated the limitations of a DMA–APM with three types of particles (polystyrene latex (PSL) spheres, ammonium sulfate (AS) and soot particles). Their results demonstrated that a DMA–APM can resolve multiply charged particles for spherical particles (PSL and AS particles), but it failed for aspherical soot particles. Multiply charged soot particles led to over 110 % errors in retrieving the mass specific extinction cross-section.
In contrast to DMA and PMA, an aerodynamic aerosol classifier (AAC) is a novel instrument that selects the aerodynamic equivalent diameter of aerosol particles based on their relaxation time. The advantage of utilizing an AAC is that the charge state of the particles does not need to be known in particle classification compared with the aforementioned classifiers; hence, multiple charging effects can be avoided (Tavakoli and Olfert, 2013). However, the selected particles are not monodispersed in mobility diameter when an AAC is used to select aspherical particles (Kazemimanesh et al., 2022).
Morphology information, such as effective density (ρeff), mass–mobility exponent (Dfm) and dynamic shape factor (χ), can be inferred using tandem DMA–PMA (Park et al., 2003; Zhang et al., 2008; Rissler et al., 2013; Pei et al., 2018; Zangmeister et al., 2018), DMA–AAC (Tavakoli and Olfert, 2014) and AAC–CPMA systems (Kazemimanesh et al., 2022). The derived ρeff and χ depend upon the combination of instruments used, while the nonphysical values of χ and ρeff for aspherical particles can be determined by the AAC-APM (Yao et al., 2020) and AAC–CPMA (Kazemimanesh et al., 2022).
The theoretical transfer functions of individual classifiers (DMA, CPMA and AAC) and the DMA–APM system have been discussed previously (Knutson and Whitby, 1975; Ehara et al., 1996; Olfert and Collings, 2005; Stolzenburg and McMurry, 2008; Tavakoli and Olfert, 2013). In this study, we focus on a DMA–CPMA and DMA–AAC in static configurations to eliminate multiply charged particles. The DMA–CPMA and DMA–AAC systems mentioned below refer to the tandems of a DMA and CPMA or a DMA and AAC in a static configuration, respectively. We calculate the transfer functions of the DMA–AAC and DMA–CPMA systematically. Combined with soot experiments, we demonstrate that multiple charging effects may still exist after DMA–CPMA classification when selecting aspherical particles and evaluate the light absorption of selected particles with different charging states using Mie theory. Furthermore, we propose operating conditions for the DMA–CPMA and DMA–AAC to eliminate multiply charged particles in future studies. Our results suggest that the size- and mass-resolved optical properties may be overestimated for small soot particles when using the DMA–CPMA system, which will lower the prediction accuracy of the fresh soot climate effect. In Sect. 3.1, we calculate the transfer functions of the DMA–CPMA and DMA–AAC utilizing the literature data of soot particles from Pei et al. (2018). In Sect. 3.2, we measure the multiple charging effect of the DMA–CPMA using laboratory-generated soot particles, and the bias of optical measurement induced by multiply charged particles is evaluated in Sect. 3.3.
2.1 Transfer function for individual aerosol classifiers
2.1.1 DMA
The DMA, consisting of two coaxial electrodes, classifies particles based upon electrical mobility Zp (Knutson and Whitby, 1975), which can be calculated as follows:
where q is the particle charge, n is the number of elementary charges, B is the mobility of the particle, e is the elementary charge, μ is the viscosity of air and Cc (dp) is the Cunningham slip correction factor. When the aerosol inlet flow rate equals the aerosol sampling outlet flow rate, the centroid mobility, , selected by the DMA is defined as
where Qsh is the sheath flow rate, VDMA is the voltage between the two electrodes, LDMA is the length of the DMA, and r1_DMA and r2_DMA are the inner and outer radii of the DMA electrodes, respectively. Assuming that the aerosol inlet and aerosol sampling flow rates are equal, the transfer function of the DMA can be expressed as follows when particle diffusion is negligible (Knutson and Whitby, 1975; Stolzenburg and McMurry, 2008):
where , and Qa is the sample flow rate. The limiting electrical mobilities that DMA can select are (. The maximum and minimum values of dm for particles with n charges can be derived combining ( and Eq. (1) and are denoted as dmn,max and dmn,min, respectively. The transfer function is an isosceles triangle with a value of 1 at and going to 0 at (. It translates to asymmetry in dm since the relationship between dm and Zp is nonlinear.
2.1.2 CPMA
The APM consists of two coaxial electrodes which are rotating at an equal angular velocity, and a voltage is applied between these electrodes to create an electrostatic field (Ehara et al., 1996). The construction of the CPMA is similar to the APM, but its inner cylinder rotates faster than the outer cylinder to create a stable system of forces (Olfert and Collings, 2005). In the CPMA, the equation of particle motion is expressed as
and the trajectory equation is
where τ is the relaxation time, m is the mass of the particle, t is time, V is the voltage difference between the two electrodes, and r1_CPMA and r2_CPMA are the radii of the inner and outer electrodes, respectively. cr is the particle migration velocity, vz is the axial flow distribution and vθ is the velocity profile in the angular direction,
where is the ratio of the rotational speed of the outer electrode to the inner electrode, and ω1 and ω2 are the rotational speeds of the inner and outer electrodes, respectively. is the ratio of the inner and outer radii. α and β are the azimuthal flow velocity distribution parameters.
Sipkens et al. (2019) presented methods to calculate the transfer function of the CPMA. They considered the Taylor series expansion about the center of the gap (/2) instead of the equilibrium radius to avoid problems with the scenario in which the equilibrium radius does not exist. This method is much simpler and more robust. In this case, the particle migration velocity in the radial direction is
where
Assuming plug flow, the transfer function would be
where is the half width of the gap between the two electrodes, and
where G0 (r) is the operator used to map the final radial position of the particle to its position at the inlet, and is the average flow velocity. min{} and max{} are the minimum and maximum values of the quantities in the brackets, respectively.
Reavell et al. (2011) calculated the resolution of the CPMA, assuming that the gap between two electrodes is narrow enough that the variation of force in the gap can be ignored. The mass resolution (Rm) of CPMA is related to particle mobility. When selecting the particles with a mass of m1 and mobility of B1, the Rm can be calculated by
where ω is the equivalent rotational speed calculated by , m1 is the nominal mass that the CPMA can select and QCPMA is the volumetric flow rate. The limiting mass can be calculated by
where and are the maximum and minimum mass and corresponding mobility of particles bearing the number of elementary charges of n that the CPMA can select, respectively. Further details can be found in Reavell et al. (2011) and Sipkens et al. (2019).
2.1.3 AAC
The AAC classifies particles based on relaxation time, which is defined by
where μ is the viscosity of air. Cc (dae) is the slip correction factor. ρ0 is the standard density with a value of 1 g cm−3. When the aerosol inlet flow rate equals the aerosol sampling outlet flow rate, the transfer function of the AAC can be expressed as (Tavakoli and Olfert, 2013)
where τ∗ is the nominal relaxation time, which is classified by the AAC:
where , and , r1_AAC and r2_AAC are the inner and outer radii of the AAC, respectively. The limiting τ that AAC can select is (. The maximum and minimum values of dae can be derived and denoted as dae,max and dae,min, respectively.
2.2 Experimental setup
A schematic of the experimental setup is illustrated in Fig. 1. Soot particles were generated by a miniature inverted soot generator (Argonaut Scientific Ltd., Canada) with a propane flow of 74.8 SCPM (standard cubic centimeters per minute; flow in milliliters per minute (mL min−1) converted from ambient to T=298.15 K and P=101.325 kPa) and an air flow rate of 12 SLPM (standard liters per minute; flow in liters per minute (L min−1) converted from ambient to T=298.15 K and P=101.325 kPa). Although this operation setting is not in the open-tip flame regime, the flame is open-tip, consistent with Fig. 2d in Moallemi et al. (2019). Detailed aerosol generation methods can be found in Kazemimanesh et al. (2019b) and Moallemi et al. (2019). The polydispersed aerosols were dried to a relative humidity of <20 % by a silica dryer and then passed through a soft X-ray neutralizer (Model 3088, TSI, Inc., USA). Five mobility diameters (80, 100, 150, 200 and 250 nm) of soot particles were selected with the DMA (Model 3081, TSI Inc., USA, βDMA=10). For the soot characterization, the mobility-selected aerosol flow was switched between two parallel lines and fed into the CPMA (Cambustion Ltd., UK) and AAC (Cambustion, Ltd., UK, βAAC=10); meanwhile, the condensation particle counter (CPC, Model 3756, TSI, Inc., USA, 0.3 L min−1) was switched between the CPMA and AAC. The distributions of particle number concentration as a function of particle mass (m) and aerodynamic diameter (dae) were measured by the scanning mode of the CPMA and AAC, respectively, while the CPC recorded their corresponding number concentrations at each set point. For each dm, the m and dae distributions were measured three times. Between measurements of each dm, the CPC was used behind the DMA, and the number size distribution of the generated soot particles was measured by a scanning mobility particle sizer (SMPS) to ensure the number size distribution of generated soot particles did not change during the whole experiment. The m and dae distributions were fitted to log-normal distributions; thus, the modal values denoted as mc and dae,c for the mobility-selected particles were determined. The equation of log-normal distribution used in this study is expressed as
where σm and σae are the geometric standard deviations of m and dae distributions, respectively. mc and dae,c are the geometric mean of m and dae, respectively.
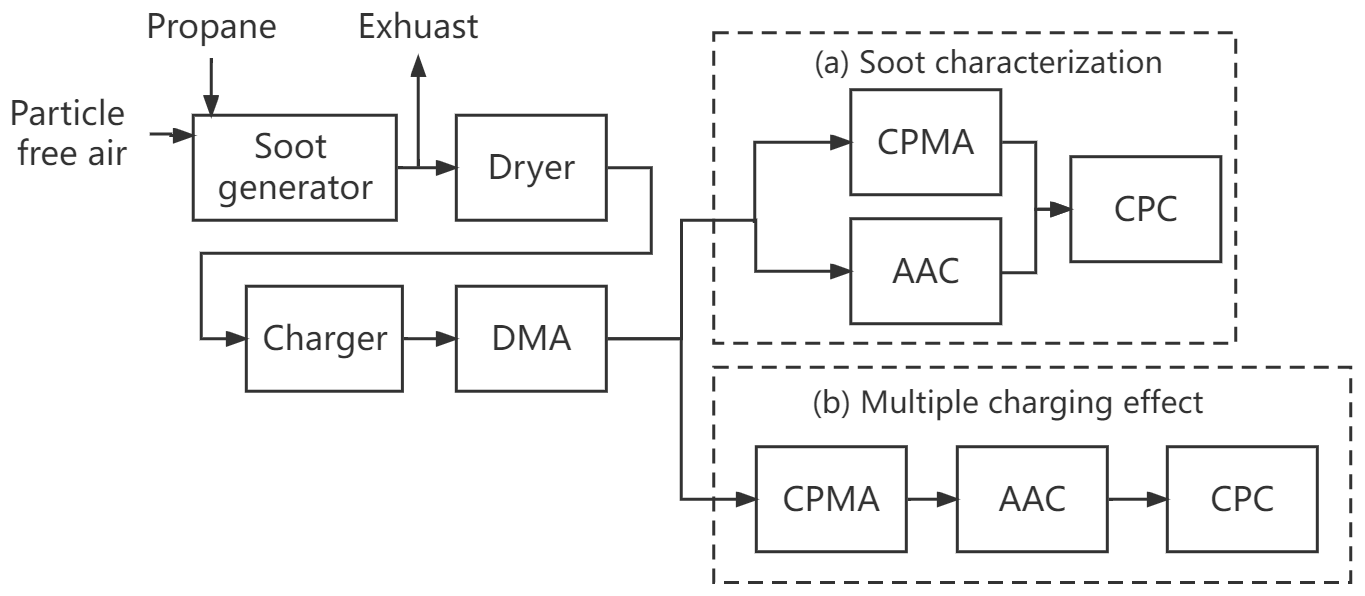
Figure 1Schematic of the experimental setup: (a) soot characterization and (b) evaluation of multiple charging effects.
The CPMA and AAC were calibrated with certified PSL spheres (Thermo, USA) with sizes of 70, 150 and 303 nm before the measurement. The measured m and dae were compared to mPSL and dae,PSL, which were calculated with the nominal diameter and density of PSL (1050 kg m−3). The deviations between measured m and mPSL or measured dae and dae,PSL were 2.75 % and 5.14 %, respectively. To quantify the multiple charging effect of particles selected by the DMA–CPMA system, the soot particles were initially selected by the DMA–CPMA at different dm values and the corresponding m. Then, the dae distribution of mobility- and mass-selected particles was obtained by stepping the AAC rotation speed of the cylinder with simultaneous measurement of the particle concentration at the AAC outlet using a CPC (Fig. 1b).
3.1 Transfer function of the tandem system
The DMA, PMA and AAC select particles based on the electrical mobility diameter, mass and aerodynamic diameter, respectively. These properties can be connected as follows (Decarlo et al., 2004):
where . The transfer function of the DMA–APM has been well documented and can be found in Kuwata (2015). The convolution of the transfer functions of the DMA–CPMA and DMA–AAC was calculated by the following equations.
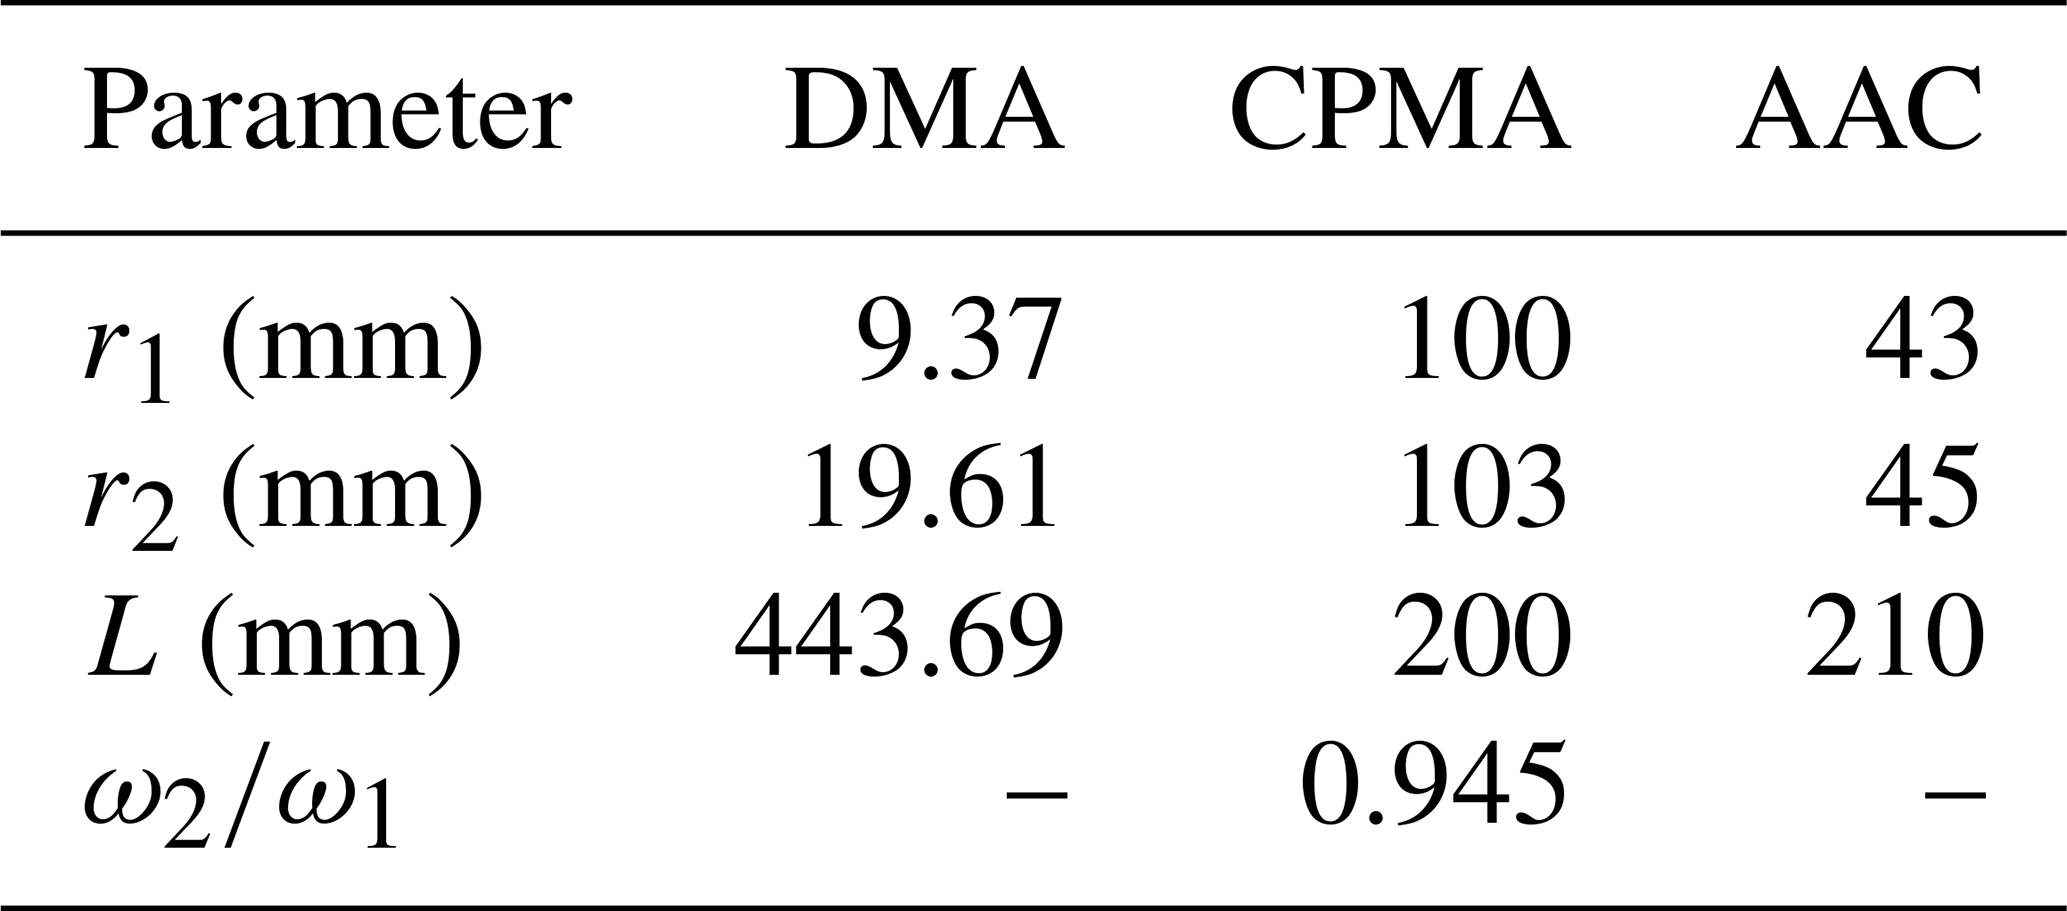
where Φ and Ω are the transfer functions of the combined and individual classification systems expressed by subscripts, respectively. In the following discussion, we explain the transfer functions of the DMA–CPMA and DMA–AAC utilizing the literature data of soot particles (Pei et al., 2018). The dm and m of the representative particles are 100 nm and 0.33 fg, respectively, and the corresponding dae is 68.3 nm according to Eq. (22). In the calculation, the following parameter set was employed: dm=100 nm, QDMA=0.3 L min−1, βDMA=0.1, m=0.33 fg, QCPMA=0.3 L min−1, Rm=8, dae=68.3 nm, QAAC=0.3 L min−1 and βAAC=0.1. The transfer functions of DMA–CPMA and DMA–AAC were solved iteratively using logarithmically spaced dm, m and dae, which included 600 points each. The ranges of dm, mand dae used in the calculations were from 0.8 times dm1,min to 1.2 times dm2,max, from 0.8 times m1,min to 1.2 times m2,max, and from 0.8 times dae,min to 1.2 times dae,max, respectively. The dimensions of the individual classifiers are summarized in Table 1.
Table 1Dimensions of the three classifiers used for transfer function calculation.
3.1.1 DMA–CPMA
The DMA–CPMA transfer function (ΦDMA−CPMA) for particles mentioned above, i.e., particles with dm of 100 nm and m of 0.33 fg, is calculated in log(dm)–log(m) space, as shown in Fig. 2. The particles are shown in Fig. 2 in actual dm and m, but when we calculate the resolutions of the DMA and CPMA, the mobility and effective mass are used. The resolution of CPMA can be calculated by Eq. (16), where m1 is the mass of singly charged particles which can be selected by the CPMA, i.e., effective mass. In log(dm)–log(m) space, the mass–mobility relationship is
In general, Dfm equals 3 for spherical particles and smaller than 3 for aspherical particles, although Dfm can be larger than 3 for particles that are nonspherical at small dm and approach spherical as dm increases. In the log(dm)–log(m) space, the relationship of m and dm is linear, with the slope expressed as the mass–mobility exponent (Dfm) and the intercept representing the pre-exponential factor (kf). Under this specific operation condition, no overlap was observed between the spherical particle population (black line) and the classification region (the colored blocks) for doubly charged particles, implying that only the singly charged particles were selected. For aspherical particles with Dfm<3, such as soot particles with aggregate structures, the particle population may overlap the doubly charged region when the slope (Dfm) is small enough; however, the combination of the DMA and CPMA is generally used to avoid the multiple charge effect in soot studies. The reported Dfm values are typically in the range of 2.2–2.4 for fresh soot particles (Rissler et al., 2013) and diesel soot particles (Park et al., 2003). In the exemplary case (Pei et al., 2018), the derived Dfm of premixed flame-generated soot particles was 2.28, resulting in the particle population always going through the transfer area of doubly charged particles. This implies that the performance of the DMA–CPMA to eliminate multiply charged particles to a certain extent depends on the particle morphology.
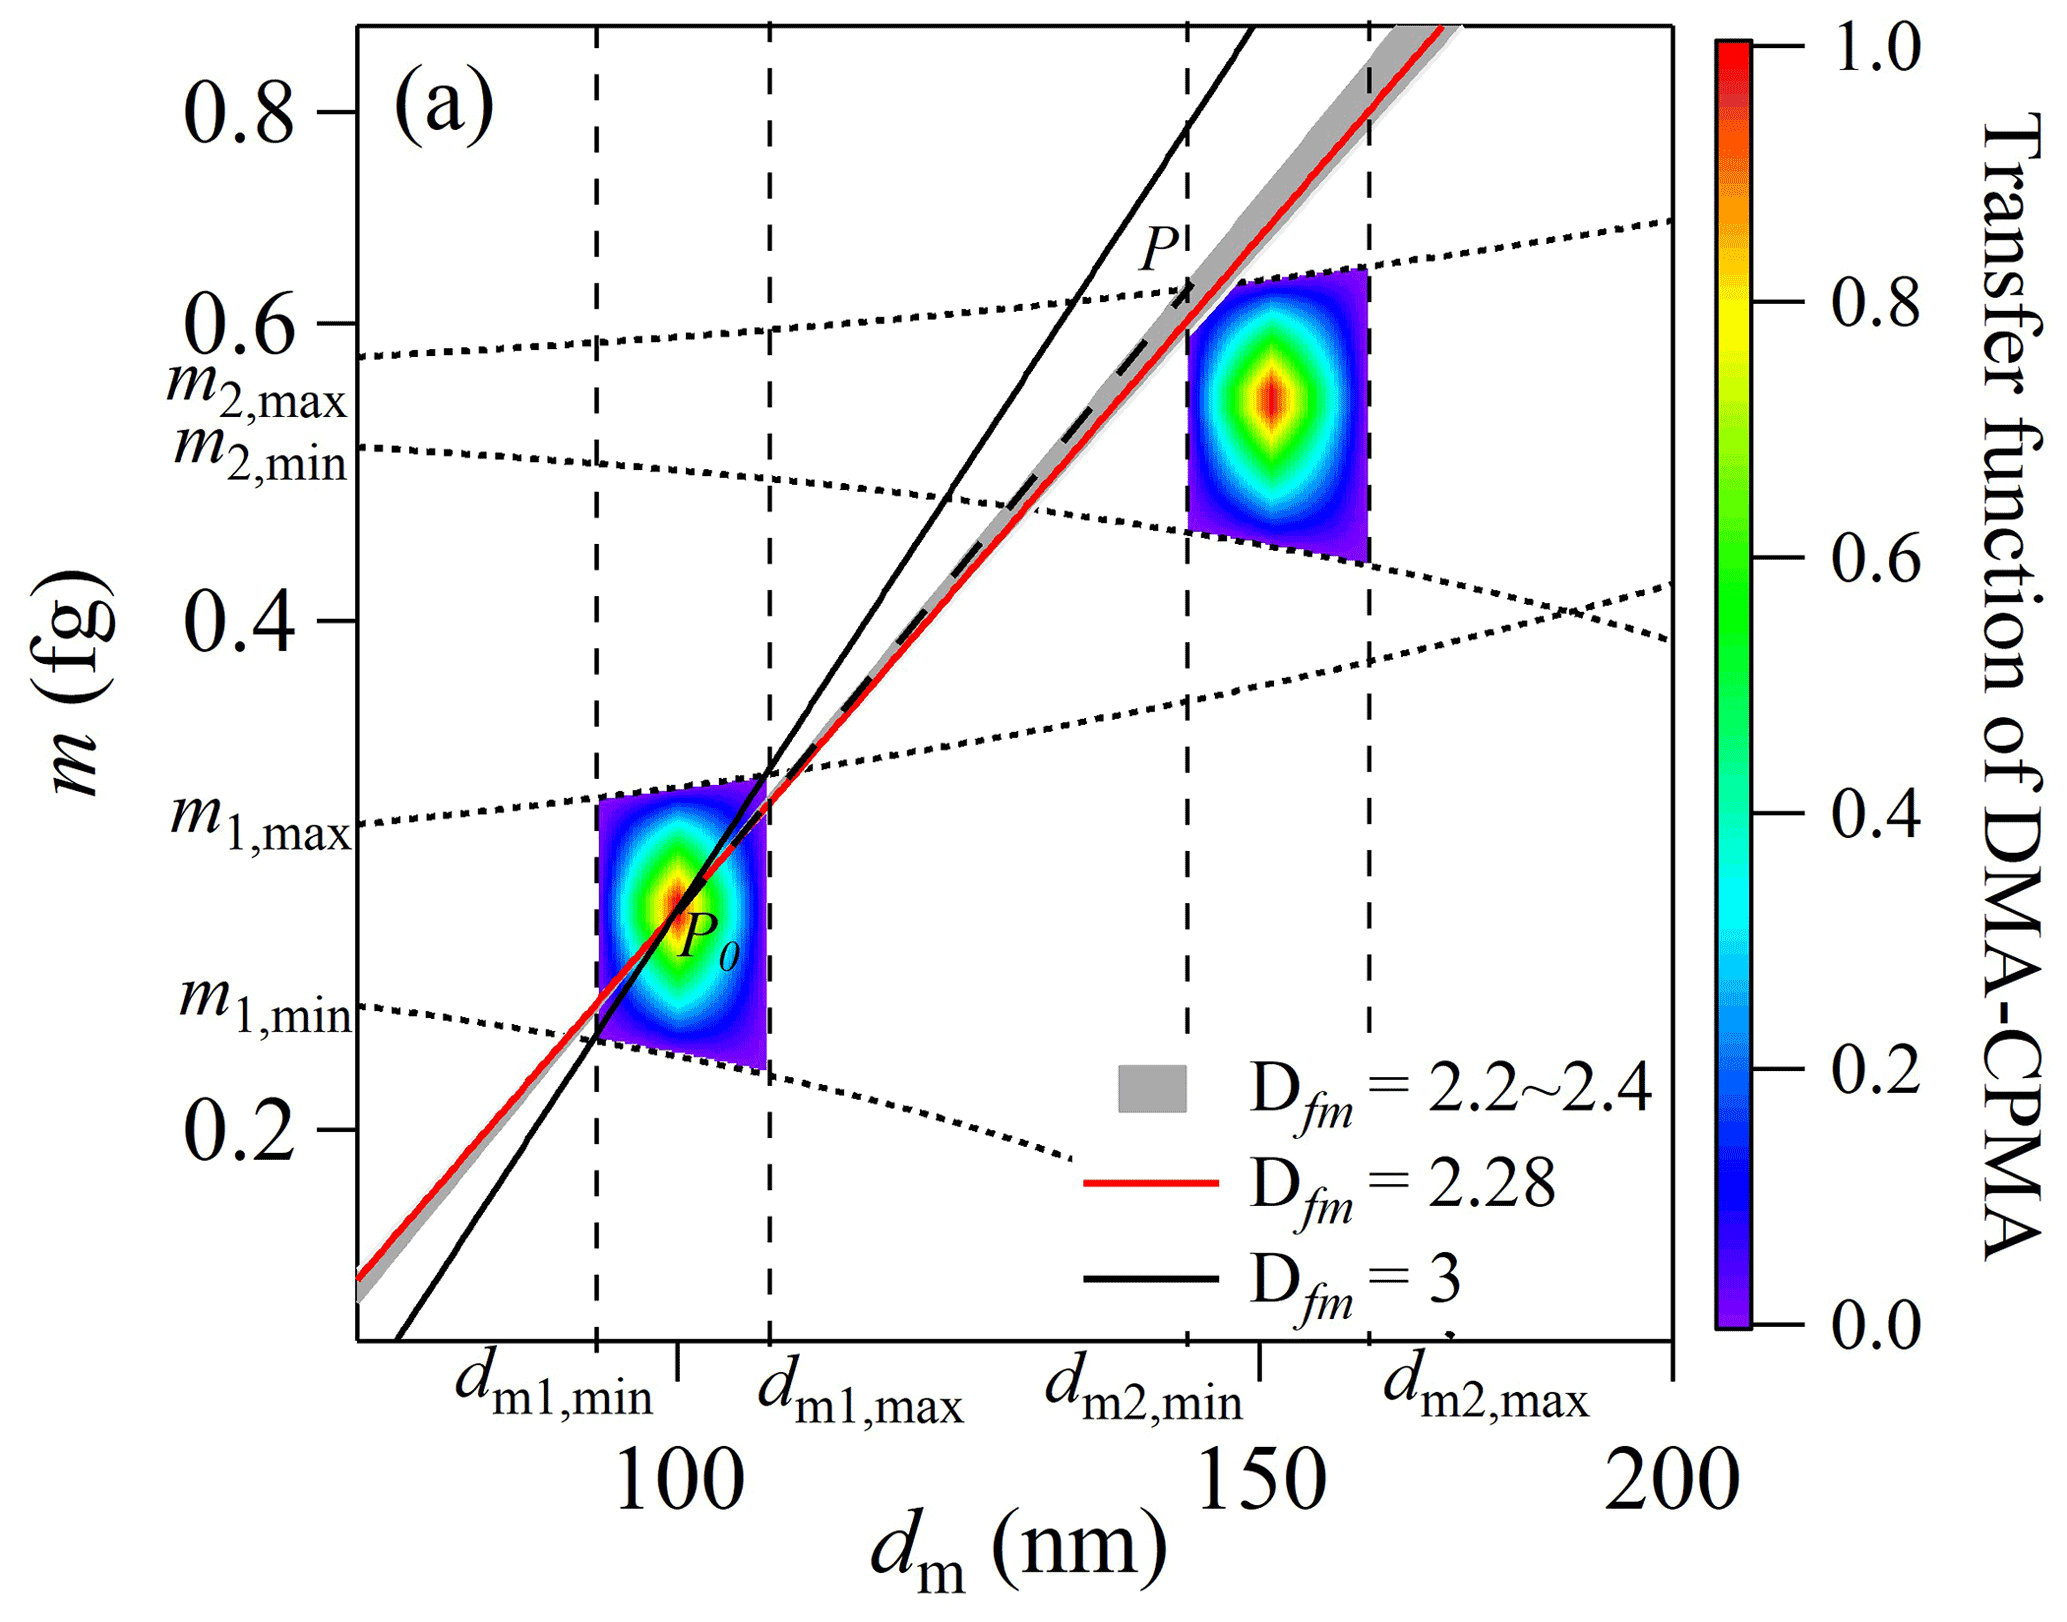
Figure 2Example of the DMA–CPMA transfer function of flame-generated soot particles (Pei et al., 2018) in log(m)–log(dm). The following parameter set was employed for the calculations: dm = 100 nm, βDMA=0.1, m=0.33 fg, QCPMA=0.3 L min−1 and Rm=8. The color blocks are the transfer function of DMA–CPMA, with the rainbow color representing the transfer function for singly charged (lower left block) and doubly charged (upper right block) particles. The solid black and red lines are particle populations with Dfm values of 3 and 2.28, respectively. The gray region is the particle population with Dfm of 2.2–2.4, which is typical for soot aerosols. The dotted lines are the limits of dm and m of the DMA and CPMA, respectively. The dashed line is the critical slope of PP0. The DMA–CPMA transfer function for +2 particles does not overlap with the line for spherical particles with a single charge (Dfm=3).
The DMA–CPMA system can only eliminate the multiply charged particles if the Dfm of the particles is larger than the slope of a line connecting (dm, m)= (dm2,min, m2,max)(dm1, m1) (as PP0 shown in Fig. 2). Since the CPMA is used downstream of the DMA, m2,max at the dm of dm2,min can be calculated using Eq. (17) with the known mobility. Accordingly, the ideal condition under static operation to completely eliminate the multiply charged particles is
The ability of the DMA–CPMA to eliminate multiply charged particles depends on the selected dm, m and resolutions of both the DMA and CPMA. Combined with Eq. (16), Eq. (27) gives instructions in actual operation to eliminate multiply charged particles. When selecting particles of certain dm and m, by decreasing QCPMA, or increasing ω and βDMA, i.e., by increasing the resolution of the measurement, the potential of multiply charged particles is reduced. Thus, the key to evaluating whether there is a multiple charging effect lies in the particle morphology (Dfm) and the slope of PP0 calculated from Eq. (27) theoretically.
In addition to the instrument setup, the particle morphology is also crucial for the DMA–CPMA. Here, we simulate the critical slope of PP0 when selecting different dm and m under the common selecting conditions (βDMA=0.1, QCPMA=0.3 L min−1, Rm=8) using Eq. (27), which is represented as contour lines in Fig. 3 (a black and white version is shown as Fig. S4). Under these selection conditions, the DMA–CPMA can select monodispersed particles when the Dfm of the particles is larger than the critical slope of PP0. When selecting small aspherical particles or particles with extremely low density, the critical slope of PP0 is relatively higher, and the DMA–CPMA classification is sensitive to the multiple charging effect. As shown in Fig. 3, dm, m and the corresponding Dfm were taken from the literature (Park et al., 2003; Rissler et al., 2013; Tavakoli et al., 2014; Ait Ali Yahia et al., 2017; Dastanpour et al., 2017; Forestieri et al., 2018; Pei et al., 2018; Kazemimanesh et al., 2019a). Generally, for soot particles with Dfm of 2.2–2.4, the multiple charging effect can be avoided for the DMA–CPMA when selecting soot particles with mobility diameters larger than 200 nm, while it fails to eliminate multiply charged particles when selecting small soot particles, as shown by the circles and squares in Fig. 3. These potential uncertainties are discussed in detail with flame-generated soot particles in Sect. 3.2.
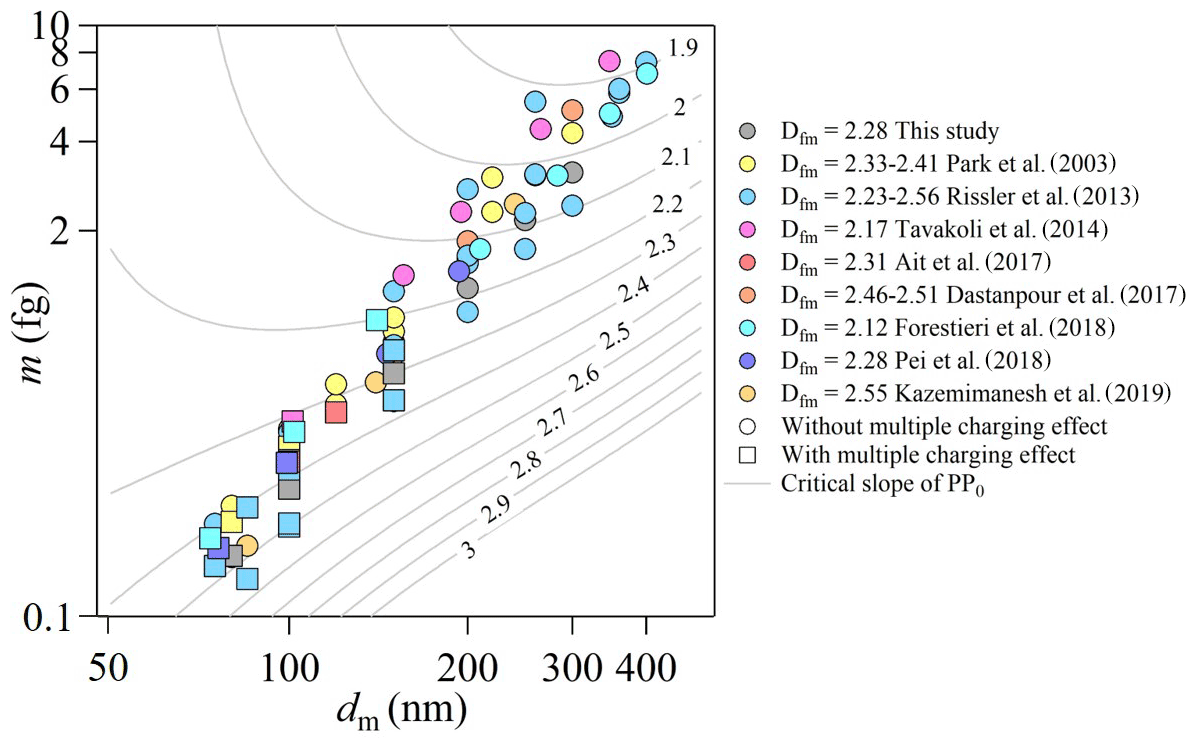
Figure 3Variations of the slope of PP0 as a function of classified dm and m. The following parameter set was employed for the calculations: βDMA=0.1, QCPMA=0.3 L min−1 and Rm=8. The contour lines denote the critical slope of PP0, with values labeled on them. The data points are soot particles measured in the literature (Park et al., 2003; Rissler et al., 2013; Tavakoli et al., 2014; Ait Ali Yahia et al., 2017; Dastanpour et al., 2017; Forestieri et al., 2018; Pei et al., 2018; Kazemimanesh et al., 2019) and generated in this study (see details in Sect. 3.2). The Dfm values of these data points are listed in the legend. The data points become square when Dfm is smaller than the critical slope of PP0 in the background; i.e., the potential multiple charging effect may exist.
3.1.2 DMA–AAC
The advantage of the AAC versus the CPMA is that there is no need for a neutralizer to charge aerosol particles to a known charge state. Measuring solely with an AAC will avoid multiple charging. However, aspherical particles with different mass can be selected by the AAC as having identical aerodynamic diameter (Kazemimanesh et al., 2022). According to Eq. (22), the population selected by the AAC has one physical size (dae), but the dm range of this population is wide since soot particles have different densities. Multiple charging becomes a problem when the tandem measurement is made with a DMA or PMA. According to Eqs. (22) and (25), the relationship of dae and dm of aspherical particles can be expressed as follows:
which indicates that the relationship between dae and dm is nonlinear since Cc (dm) and Cc (dae) vary with dm and dae, respectively. Particle morphology can be derived from the relationship between dm and dae measured by a DMA and AAC, respectively. To simulate the transfer function of the DMA–AAC, the same particles (dm=100 nm, m=0.33 fg, Dfm=2.28) as those used in the calculations of the DMA–CPMA were selected. The corresponding dae was numerically solved using the known mass–mobility relationship. The transfer function of the DMA–AAC is shown in log(dae)-log(dm) (Fig. 4a). In the transfer function of DMA–CPMA, the classification regions of singly charged particles and doubly charged particles are on the diagonal. The oblique line of particle population is more likely to go through the region of doubly charged particles in the transfer function of DMA–CPMA. The transfer functions of singly charged and doubly charged particles are in parallel for the DMA–AAC, suggesting that the particle population is less likely to overlap with the region of multiply charged particles. Using the example setups (dm=100 nm, QDMA=0.3 L min−1, βDMA=0.1, dae=68.3 nm, QAAC=0.3 L min−1 and βAAC=0.1) of the DMA–AAC, truly monodispersed particles are selected for spherical particles and typical soot particles.
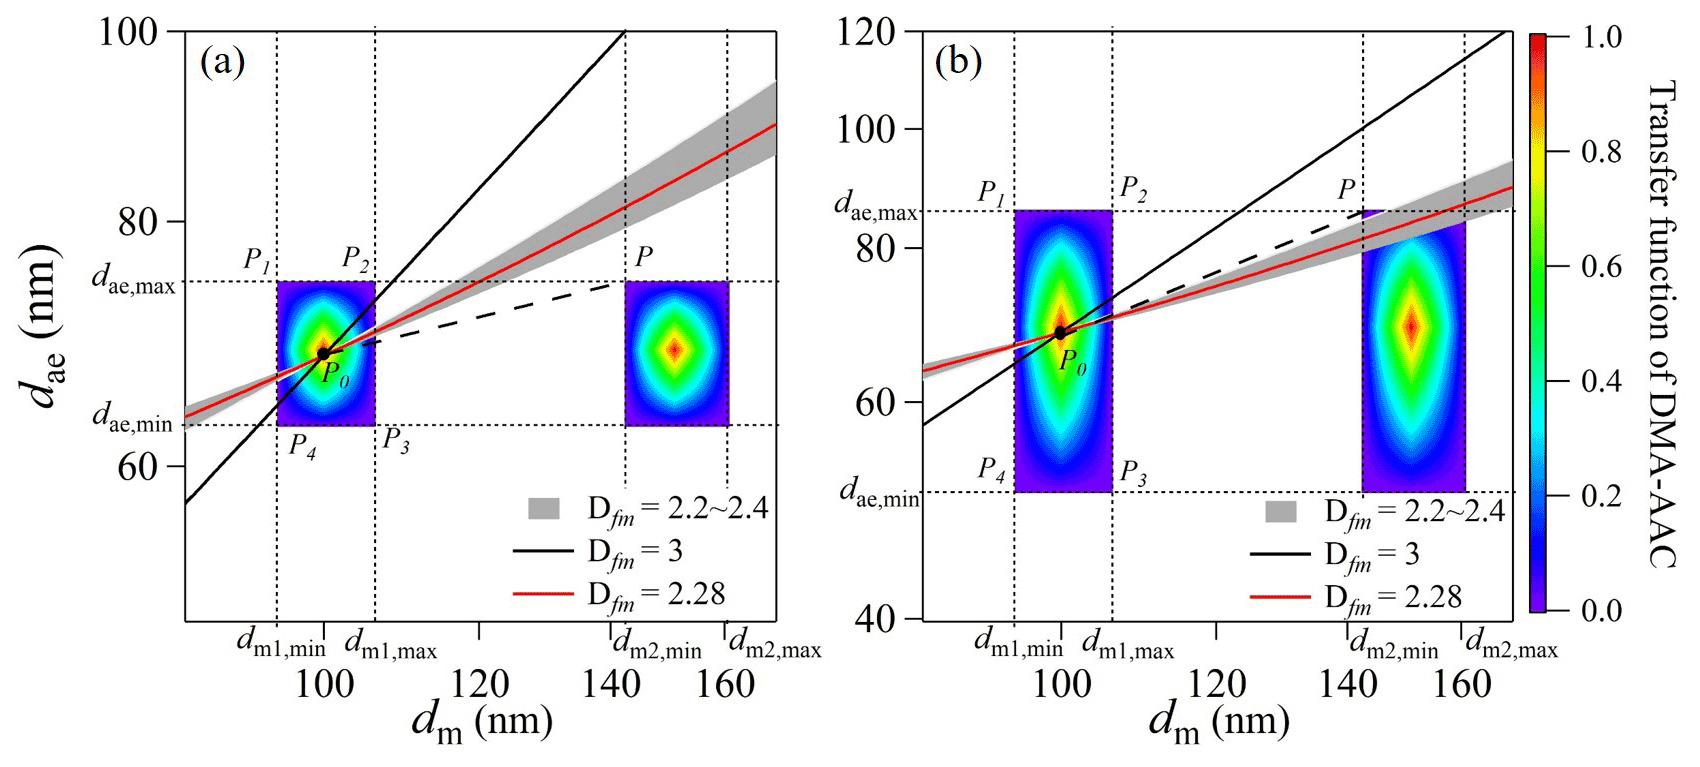
Figure 4Examples of transfer function calculation of DMA–AAC of flame-generated soot particles (Pei et al., 2018). The following parameter set was employed for the calculations: Qa=0.3 L min−1, dm1=100 nm and dae=68.3 nm, as well as (a) βDMA=0.1 and βAAC=0.1 and (b) βDMA=0.1 and βAAC=0.3. The color blocks are the transfer functions of DMA–AAC. The solid black and red lines are particle populations with Dfm values of 3 and 2.28, respectively. The gray region is the particle population with Dfm of 2.2–2.4, which is typical for soot aerosol. The dashed line is the critical slope of PP0. The dotted lines are the limiting dm and dae of DMA and AAC, respectively.
Similar to the DMA–CPMA system, eliminating multiply charged particles requires that the dae,max of the AAC at dm2,min must be smaller than the dae of particles of interest, which can be derived from dm2,min and Dfm (Eq. 28), ,
This equation describes the minimum value of Dfm to eliminate the multiple charging effect. It is clearly shown that the mobility resolution of the DMA and the relaxation time resolution of the AAC determine the limiting condition, and the resolution of the AAC is more important compared with the resolution of the DMA. The limiting condition is also related to the selected dm of the DMA but independent of the selected dae of the AAC (Fig. S1 in the Supplement). Setting the same resolutions for the DMA and AAC, particle selection is more susceptible to multiple charging effects when selecting small sizes. In Fig. 4a, the values of βDMA and βAAC are 0.1, resulting in a minimum Dfm of 1.41. This Dfm is smaller than that for most aerosols. Hence, the selected particles of the DMA–AAC are truly monodisperse, regardless of the particle morphology. However, in actual operations, a larger sample flow rate may be required to satisfy the apparatus downstream, while the maximum sheath flow rate of the classifier is restricted by the instrument design (e.g., 30 L min−1 for the DMA and 15 L min−1 for the AAC). In addition, the maximum size ranges are also restricted by the sheath flow, so in some cases, a lower sheath flow rate is required to select larger particles. When increasing βAAC to 0.3 (decreasing the resolution of the AAC) and leaving βDMA unchanged, the transfer function becomes broader (Fig. 4b). The minimum Dfm is 2.44, which indicates that the multiple charging effect exists for typical soot particles with Dfm of 2.2–2.4. The line representing soot particles overlaps with the region of doubly charged particles. Thus, reducing the resolutions of the DMA or AAC is not suggested in actual operations.
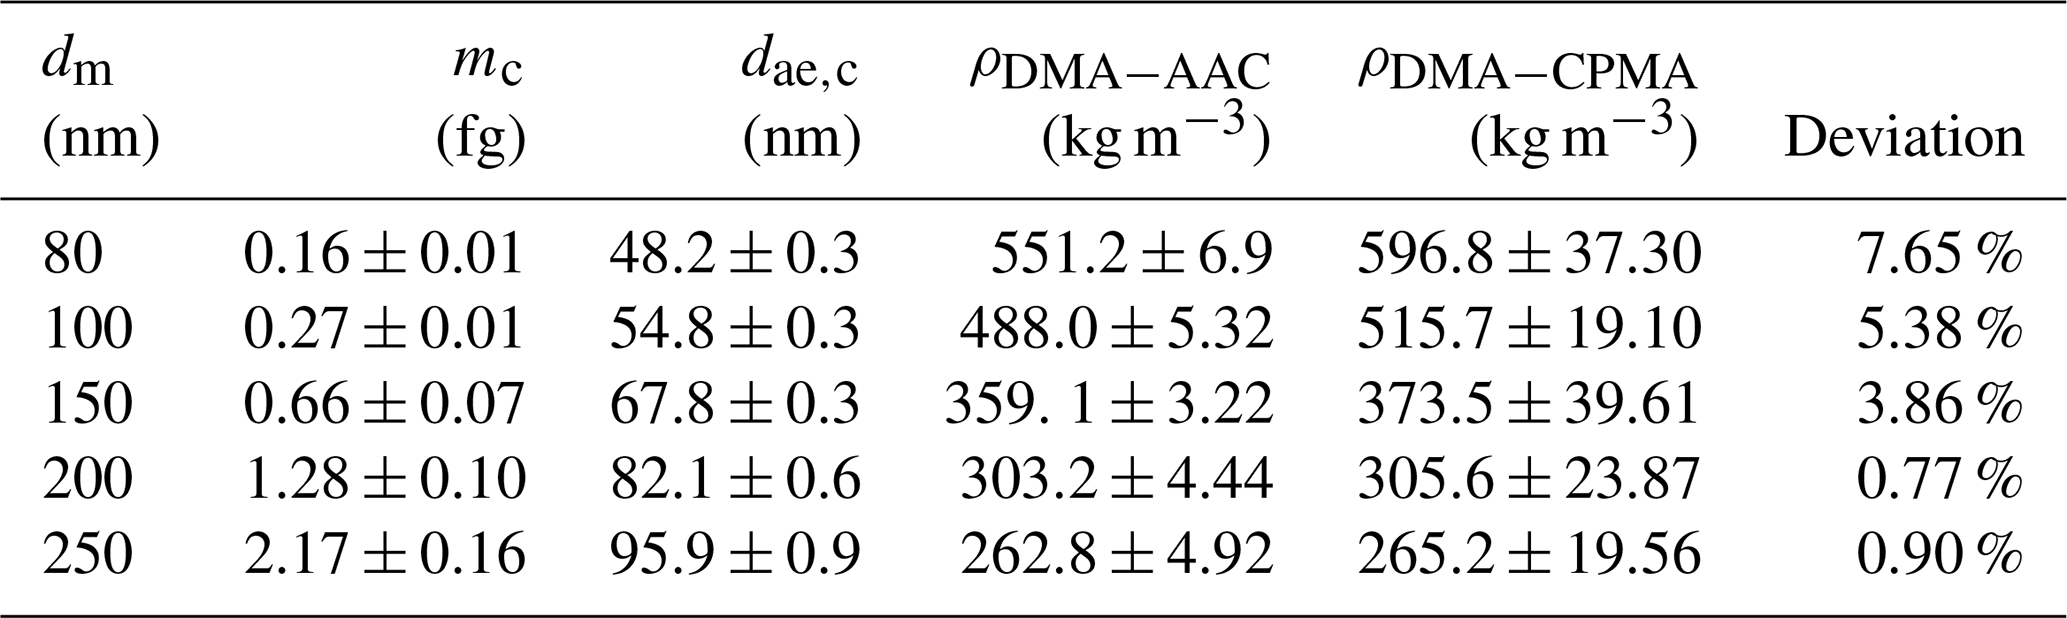
Table 2Mobility diameter, mass, aerodynamic diameter, and effective densities calculated by DMA–AAC and DMA–CPMA and the deviation between them for fresh soot particles in the size range of 80–250 nm.
We think the transfer functions of DMA–AAC or AAC-DMA are identical, regardless of the order of the DMA and AAC. For example, we use AAC-DMA to select particles with dae of 68 nm and dm of 100 nm. In Fig. 4a, the transfer function of the AAC is the region between the horizontal lines of dae,max (75 nm) and dae,min (63 nm). The soot particle population (red line) that goes through this region will be selected by the AAC. The mobility diameter distribution of these relaxation time selected particles is around 80 to 120 nm. Then the DMA is fixed to select particles with dm of 100 nm; the particles with double charges and the same mobility (dm of 150 nm) have been excluded by the AAC. As a result, AAC-DMA select monodispersed particles with dae of 68.3 nm and dm of 100 nm. In Fig. 4b, the resolution of the AAC is lower, and the transfer function of the AAC is broader than that in Fig. 4a. The soot particle population (red line) goes through the transfer function region between the horizontal lines at dae of dae,max (50 nm) and dae,min (86 nm). The mobility diameter distribution of these relaxation-time-selected particles is very wide, from less than 80 nm to about 158 nm. Then these relaxation-time-selected particles were charged and selected by the DMA at dm of 100 nm; singly charged particles with dm of 95–106 nm and doubly charged particles with dm of 142–158 nm will be selected.
If we use the DMA–AAC, the particles are selected by the DMA first. For example, in Fig. 4b, the transfer function of the DMA is shown as two vertical regions which particles with single and double charges can penetrate. The soot particles (red line) go through it, and two populations of soot particles with mode dm of 100 and 150 nm will be selected. The corresponding dae distributions of these singly and doubly charged particles are 66–70 nm and 81–87 nm. These mobility-selected particles are selected at dae of 68.3 nm by the AAC, and the transfer function of the AAC shows that particles with dae of 50–86 nm can penetrate the region. As a result, singly charged particles with dae of 66–70 nm and doubly charged particles with dae of 81–86 nm can be selected.
As a summary, the transfer functions of DMA–AAC and AAC-DMA in a static configuration are the same, no matter the ordering of the DMA and AAC.
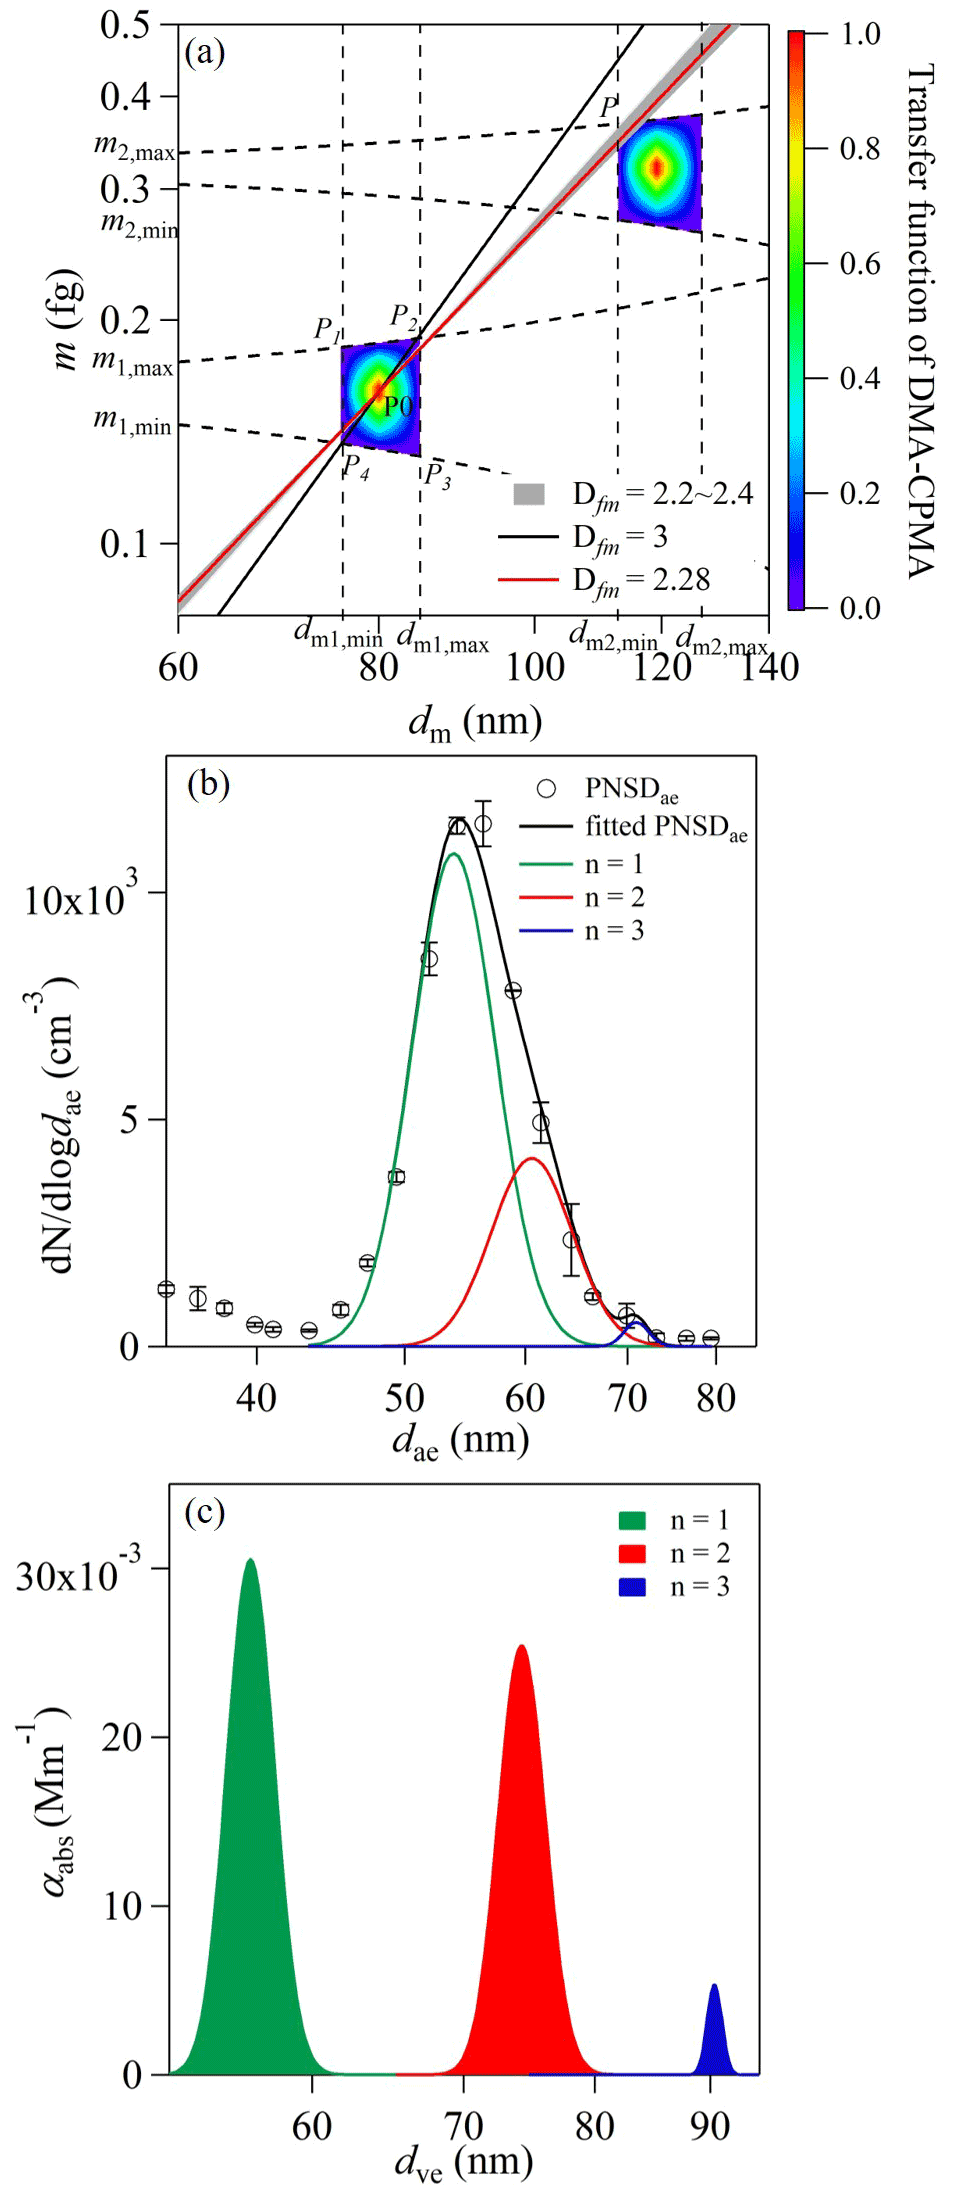
Figure 5(a) Transfer functions of DMA–CPMA when selecting 80 nm and 0.16 fg particles. The following parameter set was employed for the calculations: dm1=80 nm, βDMA=0.1, m1=0.16 fg, QCPMA=0.3 L min−1 and Rm=8. The solid red line is the generated soot particle population. (b) The aerodynamic size distribution of particles classified by DMA–CPMA. The circles are data measured by AAC-CPC, and the black, green, red and blue lines are log-normally fitted distributions of bulk, singly charged, doubly charged and triply charged particle populations. (c) The contributions to light absorption of particles with single, double and triple charges calculated with Mie theory.
3.2 Evaluation of the multiple charging effect
To quantify the possible biases of the multiple charging effect in the DMA–CPMA system, we conducted a soot experiment, as demonstrated in Fig. 1. For each mobility-selected particle, the distributions of number density as a function of dae and m were determined by the scans. These distributions were then fitted to a log-normal distribution to determine the modal values (dae,c, mc), and from these values the ρeff values were determined. The uncertainties of dae,c and mc were the standard deviation of multiple measurements. Representative plots for the measured distributions of m and dae of particles with dm of 150 and 250 nm are shown in Fig. S2. The results are summarized in Table 2. The fitted values of Dfm and kf were 2.28 and fg, respectively, indicating a fractal structure, which is the same as in previous studies (Pei et al., 2018). The effective densities of generated soot particles vary from >500 kg m−3 at dm=80 nm to <300 kg m−3 at dm of 250 nm determined by DMA–CPMA and DMA–AAC. In general, the deviation of values of ρeff measured by DMA–CPMA and DMA–AAC monotonically decreases with increasing particle size. The deviation is 7.65 % for particles of 80 nm, whereas it decreases to <1 % for particles larger than 200 nm. The results reveal a strict agreement between the two methods for retrieving the particle effective density.

Figure 6(a) The transfer functions of DMA–CPMA when selecting 200 nm and 1.28 fg particles. The following parameter set was employed for the calculations: dm1=200 nm, βDMA=0.1, m1=1.28 fg, QCPMA=0.3 L min−1 and Rm=8. The solid red line is the generated soot particle population. (b) The aerodynamic size distribution of particles classified by DMA–CPMA. The circles are data measured by AAC-CPC, and the solid line is the log-normally fitted distribution. (c) Contributions to light absorption of particles with a single charge calculated with Mie theory.
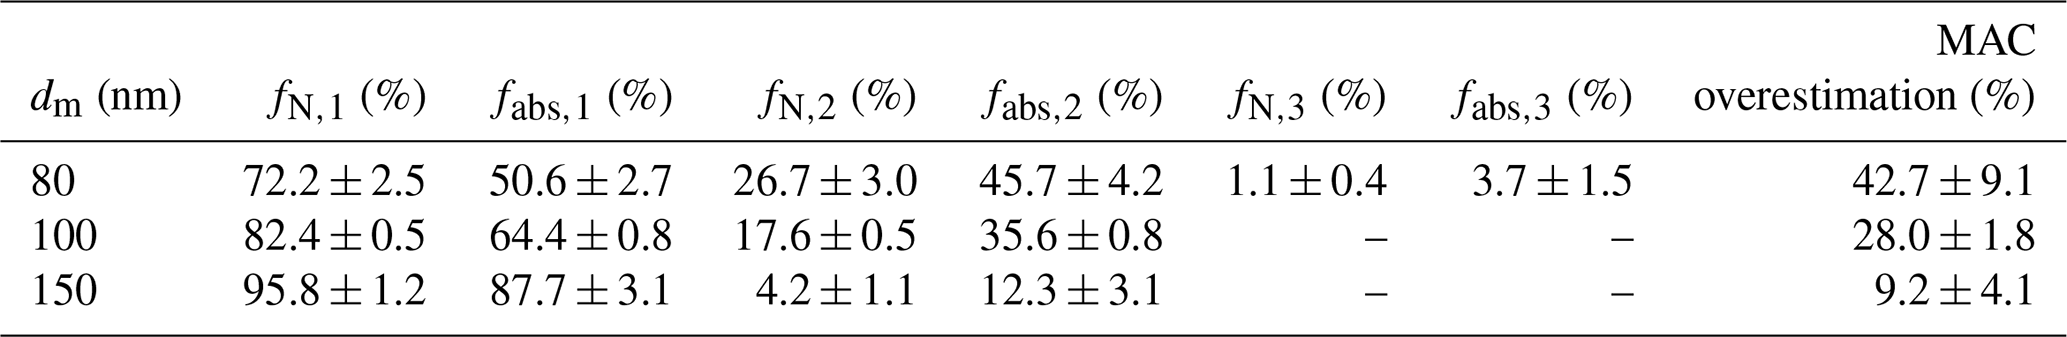
Table 3Number concentration fractions and absorption contributions for different size fresh soot particles with single, double or triple charges and the overestimation of MAC accordingly.
According to Fig. 3, the critical slopes of PP0 for soot particles with dm of 80, 100, 150, 200 and 250 nm are 2.46, 2.41, 2.29, 2.17 and 2.08, respectively. The measured Dfm of 2.28 is smaller than the calculated PP0 for particles with dm smaller than 200 nm, which suggests that the contributions from the multiply charged particles cannot be eliminated.
DMA–CPMA is set to select singly charged particles with dm of 80 nm and m of 0.16 fg, while the doubly charged particles with dm of 119.3 nm and m of 0.32 fg will also be selected, and the transfer function is presented in the upper right region. The soot particle curve (red line) goes through the upper right region, which doubly charged particles can penetrate (dm of 113–118 nm, m of 0.35–0.39 fg). As a result, we conclude that the multiple charging effect still exists when DMA–CPMA selects soot particles with dm of 80 nm and m of 0.16 fg. Since the classification of the AAC is different from the DMA and CPMA, the aerodynamic size distributions of mobility- and mass-selected particles were characterized. Figure 5b shows the particle number density aerodynamic size distribution (PNSDae) scanned by the AAC. For each measurement, PNSDae was fitted using log-normal distributions, and three peaks corresponding to singly, doubly and triply charged particles were identified. The fractional number concentration of particles with a different charging state is expressed as follows:
where fN,n and Nn are the fractional number concentration and number concentration of particles bearing n charges. dae,low and dae,high denote the minimum and maximum values of dae scanned by the AAC, respectively. The uncertainties are standard deviations of multiple measurements. Some small particles remaining in the AAC induced the peak at dae<40 nm. These residual particles were measured even if the sample flow was filtered. For particles with dm=80 nm, the modal dae values were 53.9, 60.6 and 70.9 nm, and the corresponding dae values were calculated as 51.5, 62.0 and 70.7 nm using Eqs. (1) and (18). The experimental results are consistent with the theoretical results with deviations within 5.3 %.
When selecting particles with dm of 200 nm and m of 1.28 fg, the transfer function is shown in Fig. 6a. The PP0 slope of 2.17 is smaller than Dfm of 2.28, and the generated particle population does not overlap with the block of doubly charged particles; thus, the DMA–CPMA-classified particles were truly monodispersed. PNSDae measured by the AAC is unimodal, implying that the classified particles were singly charged (Fig. 6b).
The results of other experiments are shown in Fig. S3. Although the critical slope of PP0 when selecting 150 nm particles is close to Dfm, and the transfer function of DMA–CPMA also showed that negligible multiply charged particles would be selected (Fig. S3d), doubly charged particles were measured in PNSDae (Fig. S3e). These doubly charged particles were selected, probably owing to particle diffusion. The nondiffusion models were used to calculate the transfer function, but the transfer function can be broader because of diffusion. In summary, for a type of particle with the same mass–mobility relationship, the possibility of multiple charging increases for small particles when selected by the DMA–CPMA system, which is consistent with the theoretical calculation in Sect. 3.1.
3.3 Atmospheric implication
The DMA–APM and DMA–CPMA systems are usually adopted to eliminate multiply charged particles in soot aerosol studies. Although they might fail to select monodispersed particles, downstream measurements by instruments such as a single-particle soot photometer (SP2) will not be interfered with, which characterizes the distinct information of a single particle. Nevertheless, for techniques measuring the properties of an entire aerosol population, e.g., scattering coefficient by a nephelometer or absorption coefficient by a photoacoustic spectrometer, multiply charged particles can induce significant bias. A previous study (Radney and Zangmeister, 2016) noted that the DMA–APM failed to resolve multiply charged particles for soot particles when selecting 150 nm flame-generated particles, which caused a 110 % error in extinction measurement. To investigate the multiple charging effect for DMA–CPMA classification, the optical absorption coefficient of particles with different charging states after DMA–CPMA classification was calculated from PNSDae. Mie theory was used to calculate the theoretical absorption coefficient at a wavelength of 550 nm. Mie theory is probably not the “best” method to use here since soot particles are aspherical agglomerates. Realistically, however, the Mie comparison is only being used to prove a point about the impact of multiple charging. Therefore, in this instance, any errors in the calculated optical properties are somewhat inconsequential. The refractive index used in the Mie code was 1.95 + 0.79i (Bond and Bergstrom, 2006). The PNSDae for different charging state particles was converted to volume-equivalent diameter size distribution (PNSDve), which was used in Mie theory to determine the absorption coefficient. The method to calculate PNSDve is described in Sect. S1. Subsequently, the absorption coefficient, αabs, was derived using Mie theory and the PNSDve of particles with different charging states. The fractional absorption coefficient for particles with different charging state is calculated as follows:
where fabs,n and αabs,n are the fractional absorption coefficient and absorption coefficient of particles bearing n charges, respectively. and denote the minimum and maximum value of dve of particles with n charges, which are converted from dae,low and dae,high scanned by the AAC, respectively.
The overestimation of mass absorption cross-section (MAC) is calculated by
where αabs,tot and Ntot are the total absorption coefficient and number concentration of particles selected by DMA–CPMA, respectively. mp is the actual mass of singly charged particles selected by DMA–CPMA. The uncertainties were calculated from the propagation of errors. For soot particles with diameters <200 nm, the optical absorption contributions of particles with different charging states and the MAC overestimation are summarized in Table 3. For soot particles with a diameter of 80 nm, the contributions of particles with different charging states are shown in Fig. 5c. Doubly charged particles only account for 26.7 % ± 3.0 % of the total number concentration but provide a large fractional contribution to the total absorption (45.7 % ± 4.2 %). Additionally, a small fraction (1.1 % ± 0.4 %) of triply charged particles account for 3.7 % ± 1.5 % of the absorption. As a result, the MAC was overestimated by 42.7 % ± 9.1 %, and the directive radiative force (DRF) was overestimated by 42.7 % ± 9.1 %. The DRF was calculated using previous global climate models (Bond et al., 2013). For particles selected by the DMA–CPMA at a dm of 200 nm and an m of 1.28 fg, the selected particles were truly dispersed, and the measured optical properties were valid (Fig. 6c).
A large amount of 70–90 nm soot particles was emitted from diesel engines (Wierzbicka et al., 2014), and neglecting the multiple charging effect in the measurement of mass-specific MAC on this size range will result in significant bias in the estimation of radiative forcing of automobile-emitted soot particles, which may lead to large errors in climate models.
According to Table 3, the number fraction of doubly charged particles declines with the size of the nominated particles, i.e., 26.7 % ± 3.0 % and 17.6 % ± 0.5 % for 80 and 100 nm particles, respectively, but only 4.2 % ± 1.1 % for 150 nm particles. Accordingly, the MAC was largely overestimated for 80 and 100 nm particles (42.7 % ± 9.1 % and 28.0 % ± 1.8 %, respectively) but moderately overestimated for 150 nm particles (9.2 % ± 4.1 %). To summarize, our results indicated that the combination of tandem classifiers is not sufficient to completely eliminate multiply charged particles when selecting small flame-generated soot particles, which introduced noticeable bias for absorption measurements and led to overestimation of the MAC. As a result, the DRF of soot particles was also overestimated.
In this study, we demonstrate the transfer functions of DMA–CPMA and DMA–AAC and discuss their limitations to eliminate multiply charged particles. For aspherical particles, there is no guarantee that the multiple charging effect can be avoided in DMA–CPMA or DMA–AAC systems. Usually, a DMA–AAC can select truly monodisperse particles, but the method can suffer from multiple charging when decreasing the resolutions of the DMA and AAC. The ability of the DMA–CPMA to eliminate multiple charging effect mainly depends on the particle morphology and the instrument resolutions. This tandem system is more sensitive to the multiple charging effect with decreasing Dfm and decreasing nominal size of particles. The DMA–CPMA failed to eliminate multiply charged particles when selecting soot particles with diameters <150 nm. Although doubly charged particles accounted for a small fraction of the number concentration, they contributed most significantly to light absorption, which indicated that multiply charged particles can induce an obvious contribution to light absorption and lead to an overestimation of DRF for flame-generated soot particles.
| Parameter | Definition |
| B | Mechanical mobility |
| Cc(dp) | Cunningham slip correction factor |
| cr | Particle migration velocity |
| dae | Aerodynamic equivalent diameter |
| dae,c | the geometric mean of dae distribution measured by AAC-CPC |
| dae,high | The maximum value of dae scanned by the AAC |
| dae,low | The minimum value of dae scanned by the AAC |
| dae,max | The maximum dae of particles that can be selected in AAC classification |
| dae,min | The minimum dae of particles that can be selected in AAC classification |
| dm | Mobility equivalent diameter |
| dmn,max | The maximum dm of particles with n charges that can be selected in DMA classification |
| dmn,min | The minimum dm of particles with n charges that can be selected in DMA classification |
| dve | Volume-equivalence size |
| Dfm | Mass–mobility exponent |
| e | Elementary charge |
| fN,n | The fractional number concentration of particles with n charges |
| fabs,n | The fractional absorption coefficient of particles with n charges |
| kf | Mass–mobility pre-exponential factor |
| L | Length of the DMA, CPMA or AAC |
| m | Particle mass |
| mc | the geometric mean of m distribution measured by CPMA-CPC |
| mn,max | The maximum m of particles with n charges that can be selected in CPMA classification |
| mn,min | The minimum m of particles with n charges that can be selected in CPMA classification |
| n | Number of elementary charges on the particle |
| Ntot | The total number concentration of particles selected by DMA–CPMA |
| PNSD | Particle number size distribution |
| PNSDae | Particle number aerodynamic size distribution |
| PNSDve | Particle number volume-equivalent size distribution |
| q | Electrical charge on the particle |
| Qa | Sample flow rate |
| Qsh | Sheath flow rate |
| QCPMA | The volumetric flow rate in CPMA |
| ra | Lower initial radial position that passes through the classifier |
| rb | Upper initial radial position that passes through the classifier |
| r1 | Inner radium |
| r2 | Outer radium |
| Rm | Mass resolution of CPMA |
| t | Time |
| Average flow velocity | |
| vz | Axial flow distribution |
| vθ | Velocity profile in the angular direction |
| V | Voltage between the two electrodes of the DMA or CPMA |
| Zp | Electrical mobility |
| Zp at the maximum transfer function of the DMA | |
| αβ | Azimuthal flow velocity distribution parameter |
| αabs | Absorption coefficient |
| αabs,tot | The total absorption coefficient of particles selected by DMA–CPMA |
| βAAC | The ratio of flow rates of aerosol flow and sheath flow of the AAC |
| βDMA | The ratio of flow rates of aerosol flow and sheath flow of the DMA |
| δ | Half width of the gap between the two electrodes |
| μ | Air viscosity |
| ρ0 | Standard density, which equals 1 kg m−3 |
| ρeff | Effective density |
| σm | The geometric standard deviation of m distribution |
| σae | The geometric standard deviation of dae distribution |
| τ | Relaxation time |
| τ∗ | τ at the maximum of the transfer function |
| Dimensionless particle relaxation time, | |
| χ | The dynamic shape factor |
| ω1 | Rotational speed of the inner electrode |
| ω2 | Rotational speed of the outer electrode |
| Ω | Transfer function |
Code and data are available upon request.
The supplement related to this article is available online at: https://doi.org/10.5194/amt-15-3513-2022-supplement.
ZW determined the main goal of this study. YS and XP designed the methods. YS carried them out and prepared the paper with contributions from all coauthors. YS, HL and JZ analyzed the optical data.
The contact author has declared that neither they nor their co-authors have any competing interests.
Publisher's note: Copernicus Publications remains neutral with regard to jurisdictional claims in published maps and institutional affiliations.
We especially acknowledge useful comments and suggestions on the MATLAB script of the CPMA transfer function by Timothy A. Sipkens.
This research has been supported by the National Natural Science Foundation of China (grant nos. 91844301 and 41805100).
This paper was edited by Mingjin Tang and reviewed by James Radney and one anonymous referee.
Ait Ali Yahia, L., Gehin, E., and Sagot, B.: Application of the The Rmophoretic Annular Precipitator (TRAP) for the study of soot aggregates morphological influence on their thermophoretic behaviour, J. Aerosol Sci., 113, 40–51, https://doi.org/10.1016/j.jaerosci.2017.07.018, 2017.
Biskos, G., Malinowski, A., Russell, L. M., Buseck, P. R., and Martin, S. T.: Nanosize Effect on the Deliquescence and the Efflorescence of Sodium Chloride Particles, Aerosol Sci. Technol., 40, 97–106, https://doi.org/10.1080/02786820500484396, 2006.
Bond, T. C. and Bergstrom, R. W.: Light Absorption by Carbonaceous Particles: An Investigative Review, Aerosol Sci. Technol., 40, 27–67, https://doi.org/10.1080/02786820500421521, 2006.
Bond, T. C., Doherty, S. J., Fahey, D. W., Forster, P. M., Berntsen, T., DeAngelo, B. J., Flanner, M. G., Ghan, S., Kärcher, B., Koch, D., Kinne, S., Kondo, Y., Quinn, P. K., Sarofim, M. C., Schultz, M. G., Schulz, M., Venkataraman, C., Zhang, H., Zhang, S., Bellouin, N., Guttikunda, S. K., Hopke, P. K., Jacobson, M. Z., Kaiser, J. W., Klimont, Z., Lohmann, U., Schwarz, J. P., Shindell, D., Storelvmo, T., Warren, S. G., and Zender, C. S.: Bounding the role of black carbon in the climate system: A scientific assessment, J. Geophys. Res.-Atmos., 118, 5380–5552, https://doi.org/10.1002/jgrd.50171, 2013.
Cheng, Y., Su, H., Koop, T., Mikhailov, E., and Pöschl, U.: Size dependence of phase transitions in aerosol nanoparticles, Nat. Commun., 6, 5923, https://doi.org/10.1038/ncomms6923, 2015.
Dastanpour, R., Momenimovahed, A., Thomson, K., Olfert, J., and Rogak, S.: Variation of the optical properties of soot as a function of particle mass, Carbon, 124, 201–211, https://doi.org/10.1016/j.carbon.2017.07.005, 2017.
Dusek, U., Frank, G. P., Hildebrandt, L., Curtius, J., Schneider, J., Walter, S., Chand, D., Drewnick, F., Hings, S., Jung, D., Borrmann, S., and Andreae, M. O.: Size Matters More Than Chemistry for Cloud-Nucleating Ability of Aerosol Particles, Science, 312, 1375–1378, https://doi.org/10.1126/science.1125261, 2006.
Ehara, K., Hagwood, C., and Coakley, K. J.: Novel method to classify aerosol particles according to their mass-to-charge ratio – Aerosol particle mass analyser, J. Aerosol Sci., 27, 217–234, https://doi.org/10.1016/0021-8502(95)00562-5, 1996.
Johnson, T. J., Nishida, R. T., Zhang, X., Symonds, J. P. R., Olfert, J. S., and Boies, A. M.: Generating an aerosol of homogeneous, non-spherical particles and measuring their bipolar charge distribution, J. Aerosol Sci., 153, 105705, https://doi.org/10.1016/j.jaerosci.2020.105705, 2021.
Johnson, T. J., Olfert, J. S., Cabot, R., Treacy, C., Yurteri, C. U., Dickens, C., McAughey, J., and Symonds, J. P. R.: Steady-state measurement of the effective particle density of cigarette smoke, J. Aerosol Sci., 75, 9–16, https://doi.org/10.1016/j.jaerosci.2014.04.006, 2014.
Kazemimanesh, M., Dastanpour, R., Baldelli, A., Moallemi, A., Thomson, K. A., Jefferson, M. A., Johnson, M. R., Rogak, S. N., and Olfert, J. S.: Size, effective density, morphology, and nano-structure of soot particles generated from buoyant turbulent diffusion flames, J. Aerosol Sci., 132, 22–31, https://doi.org/10.1016/j.jaerosci.2019.03.005, 2019a.
Kazemimanesh, M., Moallemi, A., Thomson, K., Smallwood, G., Lobo, P., and Olfert, J. S.: A novel miniature inverted-flame burner for the generation of soot nanoparticles, Aerosol Sci. Technol., 53, 184–195, https://doi.org/10.1080/02786826.2018.1556774, 2019b.
Kazemimanesh, M., Rahman, M.M., Duca, D., Johnson, T.J., Addad, A., Giannopoulos, G., Focsa, C., and Boies, A. M.: A comparative study on effective density, shape factor, and volatile mixing of non-spherical particles using tandem aerodynamic diameter, mobility diameter, and mass measurements, J. Aerosol Sci., 161, 105930, https://doi.org/10.1016/j.jaerosci.2021.105930, 2022.
Knutson, E. O. and Whitby, K. T.: Aerosol classification by electric mobility: apparatus, theory, and applications, J. Aerosol Sci., 6, 443–451, https://doi.org/10.1016/0021-8502(75)90060-9, 1975.
Kuwata, M.: Particle Classification by the Tandem Differential Mobility Analyzer – Particle Mass Analyzer System, Aerosol Sci. Technol., 49, 508–520, https://doi.org/10.1080/02786826.2015.1045058, 2015.
Moallemi, A., Kazemimanesh, M., Corbin, J. C., Thomson, K., Smallwood, G., Olfert, J. S., and Lobo, P.: Characterization of black carbon particles generated by a propane-fueled miniature inverted soot generator, J. Aerosol Sci., 135, 46–57, https://doi.org/10.1016/j.jaerosci.2019.05.004, 2019.
Olfert, J. S. and Collings, N.: New method for particle mass classification – the Couette centrifugal particle mass analyzer, J. Aerosol Sci., 36, 1338–1352, https://doi.org/10.1016/j.jaerosci.2005.03.006, 2005.
Park, K., Cao, F., Kittelson, D. B., and Mcmurry, P. H.: Relationship between Particle Mass and Mobility for Diesel Exhaust Particles, Environ. Sci. Technol., 37, 577–583, https://doi.org/10.1021/es025960v, 2003.
Park, K., Dutcher, D., Emery, M., Pagels, J., Sakurai, H., Scheckman, J., Qian, S., Stolzenburg, M. R., Wang, X., Yang J., and McMurry P. H.: Tandem Measurements of Aerosol Properties – A Review of Mobility Techniques with Extensions, Aerosol Sci. Technol., 42, 801–816, https://doi.org/10.1080/02786820802339561, 2008.
Pei, X., Hallquist, M., Eriksson, A. C., Pagels, J., Donahue, N. M., Mentel, T., Svenningsson, B., Brune, W., and Pathak, R. K.: Morphological transformation of soot: investigation of microphysical processes during the condensation of sulfuric acid and limonene ozonolysis product vapors, Atmos. Chem. Phys., 18, 9845–9860, https://doi.org/10.5194/acp-18-9845-2018, 2018.
Radney, J. G., Ma, X., Gillis, K. A., Zachariah, M. R., Hodges, J. T., and Zangmeister, C. D.: Direct Measurements of Mass-Specific Optical Cross Sections of Single-Component Aerosol Mixtures, Anal. Chem., 85, 8319–8325, https://doi.org/10.1021/ac401645y, 2013.
Radney, J. G. and Zangmeister, C. D.: Practical limitations of aerosol separation by a tandem differential mobility analyzer–aerosol particle mass analyzer, Aerosol Sci. Technol., 50, 160–172, https://doi.org/10.1080/02786826.2015.1136733, 2016.
Rissler, J., Messing, M. E., Malik, A. I., Nilsson, P. T., Nordin, E. Z., Bohgard, M., Sanati, M., and Pagels, J. H.: Effective Density Characterization of Soot Agglomerates from Various Sources and Comparison to Aggregation Theory, Aerosol Sci. Technol., 47, 792–805, 10.1080/02786826.2013.791381, 2013.
Shiraiwa, M., Kondo, Y., Iwamoto, T., and Kita, K.: Amplification of Light Absorption of Black Carbon by Organic Coating, Aerosol Sci. Technol., 44, 46–54, https://doi.org/10.1080/02786820903357686, 2010.
Sipkens, T. A., Olfert, J. S., and Rogak, S. N.: New approaches to calculate the transfer function of particle mass analyzers, Aerosol Sci. Technol., 54, 111–127, https://doi.org/10.1080/02786826.2019.1680794, 2019.
Stolzenburg, M. R. and McMurry, P. H.: Equations Governing Single and Tandem DMA Configurations and a New Lognormal Approximation to the Transfer Function, Aerosol Sci. Technol., 42, 421–432, https://doi.org/10.1080/02786820802157823, 2008.
Swietlicki, E., Hansson, H. C., Hämeri, K., Svenningsson, B., Massling, A., McFiggans, G., McMurry, P. H., Petäjä, T., Tunved, P., Gysel, M., Topping, D., Weingartner, E., Baltensperger, U., Rissler, J., Wiedensohler, A., and Kulmala, M.: Hygroscopic properties of submicrometer atmospheric aerosol particles measured with H-TDMA instruments in various environments – a review, Tellus B, 60, 432–469, https://doi.org/10.1111/j.1600-0889.2008.00350.x, 2008.
Tavakoli, F. and Olfert, J. S.: An Instrument for the Classification of Aerosols by Particle Relaxation Time: Theoretical Models of the Aerodynamic Aerosol Classifier, Aerosol Sci. Technol., 47, 916–926, https://doi.org/10.1080/02786826.2013.802761, 2013.
Tavakoli, F. and Olfert, J. S.: Determination of particle mass, effective density, mass–mobility exponent, and dynamic shape factor using an aerodynamic aerosol classifier and a differential mobility analyzer in tandem, J. Aerosol Sci., 75, 35–42, https://doi.org/10.1016/j.jaerosci.2014.04.010, 2014.
Wiedensohler, A., Birmili, W., Nowak, A., Sonntag, A., Weinhold, K., Merkel, M., Wehner, B., Tuch, T., Pfeifer, S., Fiebig, M., Fjäraa, A. M., Asmi, E., Sellegri, K., Depuy, R., Venzac, H., Villani, P., Laj, P., Aalto, P., Ogren, J. A., Swietlicki, E., Williams, P., Roldin, P., Quincey, P., Hüglin, C., Fierz-Schmidhauser, R., Gysel, M., Weingartner, E., Riccobono, F., Santos, S., Grüning, C., Faloon, K., Beddows, D., Harrison, R., Monahan, C., Jennings, S. G., O'Dowd, C. D., Marinoni, A., Horn, H.-G., Keck, L., Jiang, J., Scheckman, J., McMurry, P. H., Deng, Z., Zhao, C. S., Moerman, M., Henzing, B., de Leeuw, G., Löschau, G., and Bastian, S.: Mobility particle size spectrometers: harmonization of technical standards and data structure to facilitate high quality long-term observations of atmospheric particle number size distributions, Atmos. Meas. Tech., 5, 657–685, https://doi.org/10.5194/amt-5-657-2012, 2012.
Yao, Q., Asa-Awuku, A., Zangmeister, C. D., and Radney, J. G.: Comparison of three essential sub-micrometer aerosol measurements: Mass, size and shape, Aerosol Sci. Technol., 1–18, https://doi.org/10.1080/02786826.2020.1763248, 2020.
Zangmeister, C. D., You, R., Lunny, E. M., Jacobson, A. E., Okumura, M., Zachariah, M. R., and Radney, J. G.: Measured in-situ mass absorption spectra for nine forms of highly-absorbing carbonaceous aerosol, Carbon, 136, 85–93, https://doi.org/10.1016/j.carbon.2018.04.057, 2018.
Zhang, R., Khalizov, A. F., Pagels, J., Zhang, D., Xue, H., and McMurry, P. H.: Variability in morphology, hygroscopicity, and optical properties of soot aerosols during atmospheric processing, P. Natl. Acad. Sci. USA, 105, 10291, https://doi.org/10.1073/pnas.0804860105, 2008.