the Creative Commons Attribution 4.0 License.
the Creative Commons Attribution 4.0 License.
 | 23 Jun 2022
High-frequency gaseous and particulate chemical characterization using extractive electrospray ionization mass spectrometry (Dual-Phase-EESI-TOF)
Chuan Ping Lee
Mihnea Surdu
David M. Bell
Josef Dommen
Mao Xiao
Xueqin Zhou
Andrea Baccarini
Stamatios Giannoukos
Günther Wehrle
Pascal André Schneider
Andre S. H. Prevot
Jay G. Slowik
Houssni Lamkaddam
Urs Baltensperger
To elucidate the sources and chemical reaction pathways of organic vapors and particulate matter in the ambient atmosphere, real-time detection of both the gas and particle phase is needed. State-of-the-art techniques often suffer from thermal decomposition, ionization-induced fragmentation, high cut-off size of aerosols or low time resolution. In response to all these limitations, we developed a new technique that uses extractive electrospray ionization (EESI) for online gas and particle chemical speciation, namely the dual-phase extractive electrospray ionization time-of-flight mass spectrometer (Dual-Phase-EESI-TOF or Dual-EESI for short). The Dual-EESI was designed and optimized to measure gas- and particle-phase species with saturation vapor concentrations spanning more than 10 orders of magnitude with good linearity and a measurement cycle as fast as 3 min. The gas-phase selectivity of the Dual-EESI was compared with that of nitrate chemical ionization mass spectrometry. In addition, we performed organic aerosol uptake experiments to characterize the relative gas and particle response factors. In general, the Dual-EESI is more sensitive toward gas-phase analytes as compared to their particle-phase counterparts. The real-time measurement capability of the Dual-EESI for chemically speciated gas- and particle-phase measurements can provide new insights into aerosol sources or formation mechanisms, where gas-particle partitioning behavior can be determined after absolute parameterization of the gas / particle sensitivity.
- Article
(4715 KB) - Full-text XML
-
Supplement
(2013 KB) - BibTeX
- EndNote


Atmospheric aerosols are small particles suspended in the air, also denoted as particulate matter (PM). They cool the climate either directly by light scattering or indirectly by acting as cloud condensation nuclei (CCN), influencing clouds' albedo and lifetime (Seinfeld and Pandis, 2016). Poor air quality associated with high levels of PM is a major public health problem and is one of the five leading causes of premature deaths worldwide, along with high blood pressure, smoking, diabetes and obesity (Cohen et al., 2017). Human exposure to PM caused ∼8.9 million deaths or ∼10 % of the total global burden of mortality in 2015 (Burnett et al., 2018), which is more than car accidents, HIV and malaria combined. Aerosols from direct emissions are classified as primary, while those produced from various atmospheric oxidation reactions are classified as secondary. The secondary aerosol may either condense onto existing particles or nucleate to induce new particle formation (NPF). NPF and particle growth happen on timescales of minutes to hours and involve millions of different oxidation products (Seinfeld and Pandis, 2016). To elucidate the sources and chemical reaction pathways of these products as well as their gas-particle partitioning behavior, rapid online detection of both gas and particle phase with high chemical resolution is needed (Nozière et al., 2015).
Online chemical characterization in the gas and particle phase is traditionally realized by using different mass spectrometers in parallel (Hoffmann et al., 2011). Chemical ionization mass spectrometry and proton-transfer-reaction mass spectrometry (PTR-MS) with relatively low ionization energy (<10 eV) are applied for gas-phase measurements (Hansel et al., 1999; Munson and Field, 1966), whereas electron impact ionization and laser ablation mass spectrometry with high energy (>70 eV) are applied for particle-phase measurements (Jayne et al., 2000; Noble and Prather, 1996). Because chemical speciation, ionization selectivity and efficiency between the different analytical techniques do not overlap, our understanding of the dynamics between the two phases (gas and particle) is limited with such an approach (Riva et al., 2019). Efforts to detect both phases using a single mass spectrometer led to the development of the Micro-Orifice Volatilization Impactor (MOVI), the Filter Inlet for Gases and Aerosols (FIGAERO) and the Thermal Desorption Differential Mobility Analyzer (TD-DMA), which can be coupled to chemical ionization mass spectrometry (Brüggemann et al., 2015; Lopez-Hilfiker et al., 2014; Voisin et al., 2003; Wagner et al., 2018; Yatavelli et al., 2012, 2014; Yatavelli and Thornton, 2010), PTR-MS (Holzinger et al., 2010) or a standalone PTR-MS combined with a particle inlet system such as CHARON-PTR (Eichler et al., 2015). Most of these semi-continuous techniques have an atmospherically relevant detection limit (a few ng m−3), but their performance in molecular speciation is complicated by ongoing reactions on the collection substrate (Pratt and Prather, 2012; Timkovsky et al., 2015) as well as thermal decomposition due to thermal treatment of the collected particulate matter or/and ionization-induced fragmentation (Stark et al., 2017; Müller et al., 2017).
In response to the limitations of state-of-the-art techniques, an extractive electrospray ionization time-of-flight instrument (EESI-TOF) was developed to chemically characterize particles with sizes as small as 10 nm at time resolutions >5 Hz and a detection limit of a few nanograms per cubic meter, by exploiting the soft ionization nature of the electrospray (Lopez-Hilfiker et al., 2019; Surdu et al., 2021). This technique was further developed for online metal detection (Giannoukos et al., 2020), aerosol source apportionment (Qi et al., 2019; Stefenelli et al., 2019) and with the recent development of coupling to an ultra-high resolution mass spectrometry (Lee et al., 2020). Despite these efforts, gaseous chemical characterization has not been attempted using this technique even though it is technically possible (Zhao et al., 2017). To improve our understanding of physicochemical processes between the gas and particle phase, we developed an inlet for the EESI-TOF that allows for automated and alternating measurements of the gas and particle phase, namely a Dual-Phase-EESI-TOF (Dual-EESI). First, we show the proof-of-principle measurement and demonstrate measurement linearity of the Dual-EESI with chemical standards spanning almost 10 orders of magnitude in estimated saturation vapor concentration. Then we present results from flow tube measurements of oxidation products of biogenic and anthropogenic volatile organic compounds (VOCs) to validate the capability of the Dual-EESI which distinguishes gaseous and particulate analytes. The gas-phase measurements of the Dual-EESI were compared to well-established chemical ionization mass spectrometry techniques for the evaluation of linearity, selectivity and sensitivity. Finally, the gas-phase sensitivity response of the EESI was empirically parameterized for the first time.
2.1 Dual-Phase-EESI-TOF inlet description
The Dual-EESI source couples the EESI ion source design of Lopez-Hilfiker et al. (2019) with a newly developed inlet which automatically cycles through three different sampling channels, denoted as total-phase channel (TP), particle-phase channel (PP) and particle filter channel (FP). As shown in Fig. 1, an open channel (length L: 0.5 m; diameter ∅: 10×8 mm; surface to volume m−1) samples both gas-phase and particle-phase analytes (referred to as the total-phase channel, TP). An open tube (L: 0.7 m; ∅: 10×8 mm, two 90∘ bends) with two multichannel charcoal denuders which remove gas-phase analytes is used for particle-phase analyte sampling (referred to as the particle-phase channel, PP). The charcoal denuders ( m, ∅=36 mm with approximately 200 channels with an area dimension of 1.5×1.5 mm, m−1, Ionicon GmbH, Austria) have a high gas removal efficiency as shown in Fig. S1 of the Supplement (∼99 % at 3 L min−1 and ∼97 % at 11 L min−1). Lastly, a HEPA filter is added to the particle-phase channel prior to the two multichannel charcoal denuders to remove particles for particle-phase background measurement, referred to as the particle filter channel (FP). The gas-phase and particle-phase signals are calculated as TP–PP and PP–FP, respectively. The sampling flow of the EESI-TOF capillary is 0.8 L min−1, whereas the sampling flow of the Dual-Phase-EESI-inlet (prior to the EESI-TOF capillary) was varied from 2–11 L min−1 with a residence time ranging from 0.2–1 s to maximize gas and particle sampling efficiency (Figs. S2, S3 and S4) depending on the experimental setups. The residence time in the PP is 1.4 times longer than in the TP. These residence times among sampling channels are optimized to be as short as possible while maintaining symmetric sampling between channels, minimization of gaseous diffusion losses and particulate re-volatilization which typically has a timescale of 102 min (Vaden et al., 2011).

Figure 1Schematic diagram of the developed ionization inlet for the Dual-EESI. The inlet consists of the following channels: total phase (TP, shaded blue), particle phase (PP, shaded green) and particle filter (FP, shaded green and red). The gas-phase measurement is obtained as TP–PP, whereas the particle-phase measurement is obtained as PP–FP2.
We tested four different tubing materials – conductive perfluoroalkoxy alkane (PFA), conductive polytetrafluoroethylene (PTFE), stainless steel 306 and coated stainless steel 306 – to determine desorption responses of semi-volatile organic compounds (SVOCs) in the Dual-EESI inlet as shown in Fig. S5. Unless specified otherwise, stainless steel 306 tubing coated with functionalized hydrogenated amorphous silicon (SilcoNert 2000, Silcotek GmbH, Germany) was chosen for its rigidness, which allows for stable particle transmission and a lower adsorption rate in comparison to uncoated stainless steel 306 (Pagonis et al., 2017). A pressure sensor is added upstream of the electrospray region because pressure fluctuations >5 mbar destabilize the electrospray (ES) signal. For high sampling flow applications (>5 L min−1, ∅=40 mm, L=0.5 m), it is recommended to use multiple particle filters in parallel to minimize flow impedance (i.e., pressure drop) as characterized in Fig. S6. In this study, a single HEPA filter was used and the excess sampling flow rate was maintained at 5 L min−1 unless specified.
Throughout the whole experiment, acetonitrile H2O ( ) doped with 100 ppm NaI was used as the ES working solution. A potential difference of around 2.6–2.9 kV relative to the MS interface was applied to the ES solution, and an air pressure difference of 300 to 600 mbar was applied to the ES solution bottle reservoir, delivering 2.7–5.4 µL min−1 of ES solution via a polyimide fused silica capillary (o.d.: 369 µm and i.d.: 75 µm, BGB Analytik, Switzerland). The ES droplets intersected with the sample analytes before entering the heated TOF capillary kept at 275 ∘C (<1 ms residence time), undergoing a Coulomb explosion as the ES droplets evaporated. The ions generated from organic molecules were detected predominantly (>95 % relative abundance) as sodiated adducts () in the positive ionization mode by the TOF. The raw mass spectra (1 Hz) were post-averaged every 10 s using Tofware (version 2.5.13). All measured analyte signals were normalized by the most abundant electrospray ion (i.e., ) to account for the variation in the electrospray signal (±5 %).
2.2 Ambient aerosol and gaseous surrogates
A permeation source containing a 5 mL glass vial filled with 0.1 g of solid camphor was used to generate camphor vapors. A flow rate of 1.5 L min−1 permeation source vapor was mixed with 1.5 L min−1 nebulized levoglucosan particles and introduced into the Dual-EESI for proof-of-principle measurements as shown in Fig. S7. Calibrations of particles were carried out individually for organic (sebacic acid, levoglucosan and sucrose) and inorganic (iodic acid and ammonium nitrate) compounds. The flow from a nebulizer (1.5 L min−1) was mixed with a dilution flow of zero air at 3, 5, 7 and 9 L min−1 in a laminar mixing dilution unit. The mixture inside the laminar mixing dilution unit was core-sampled by the Dual-EESI. The laminar mixing dilution unit was operated with a slight overpressure to prevent re-entrainment of ambient analytes as shown in Fig. S8. The particle mass concentration was measured by a scanning mobility particle sizer (SMPS, TSI Inc., USA), which comprises an electrostatic classifier 3082 with a differential mobility analyzer 3081 (TSI Inc., USA) and a condensation particle counter 3775 (TSI Inc., USA).
Gas standards (ethyl acetate, ethyl propionate, 3-pentanone, camphor, hydroxyacetone) for the Dual-EESI calibration were generated by a Vaporjet (Microfab Technologies Inc., USA, Fig. S9) and measured by a proton-transfer-reaction time-of-flight mass spectrometer (PTR-TOF, Ionicon GmbH, Austria). In the Vaporjet, a single droplet of a dissolved chemical was periodically (20–200 Hz) dispensed by a piezoelectric microjet with an inner diameter of 50 µm. The droplets are continuously and fully flash-evaporated by a thermally regulated resistive heater at a temperature of around 250–275 ∘C. The number of droplets per second is monitored by a stroboscopic camera with a magnifying lens (Verkouteren et al., 2006). All chemical solutions for the Vaporjet dispenser were prepared at a concentration of 0.1 M using Milli-Q water (18 MΩ cm).
Finally, we investigated the measurement linearity of gas-phase species in the presence of particle-phase species by mixing an increasing camphor gas concentration with a constant flow of particles (Fig. S10). Solutions of 0.5 ppm of levoglucosan and iodic acid were prepared in Milli-Q water and mixed. This mixture solution was nebulized at 1.5 L min−1 and mixed with 1.2 L min−1 of camphor in a laminar mixing dilution unit before entering the Dual-EESI inlet. The concentration of camphor in the laminar mixing dilution unit was decreased by increasing the carrier flow (3–10 L min−1) through the camphor permeation source.
2.3 Biogenic and anthropogenic secondary organic aerosol (SOA)
Measurements of atmospherically relevant gas and particulate oxidation products were performed in two types of experiments. In the first experiment (Fig. S11), a 104 cm long Pyrex glass tube of 3.7 cm i.d. with a normalized residence time of 4.47 min2 L−1 was used as an oxidation flow reactor for monoterpene ozonolysis as described in Molteni et al. (2018). α-Pinene vapor was generated via evaporation of the liquid compounds from a 1 L bubbler immersed in a 25 ∘C water bath and carried by a stream of 2–10 mL min−1 synthetic air (80:20 N2:O2) to provide a constant source of α-pinene (2–18 ppmv) inside the flow tube, as monitored by a quadrupole proton-transfer-reaction mass spectrometer (Q-PTR, Ionicon GmbH, Austria). To generate ozone, dry synthetic air (1 L min−1) was irradiated by an amalgam lamp (185 and 254 nm; WISAG GmbH, Switzerland) and diluted by a factor of 10 to produce ∼280 ppbv of ozone, as measured by a Serinus 10 ozone analyzer (Ecotech Group, Australia). The ozone flow (1 L min−1) was combined at an angle of 90∘ with the α-pinene vapor (1 L min−1) before entering the flow reactor. 9 L min−1 zero air at 40 % relative humidity (RH) and 20 ∘C was introduced into the flow tube giving a total residence time of approximately 28 s for SOA formation. The Dual-EESI was used to measure the gaseous and particulate chemical composition. An SMPS was used to quantify the SOA mass concentration.
In the second experiment (Fig. S12), a flow of 1 L min−1 1,3,5-trimethylbenzene vapor from a VOC permeation source was mixed with 4 L min−1 dry and 4 L min−1 wet air. This gas mixture was combined with 1 L min−1 of ozone at a mixing ratio of approximately 10 ppmv. After the introduction of this mixture into the first flow tube with a residence time of approximately 22 s, OH radicals were generated from ozone by irradiation with the UV-B lamps surrounding the flow tube, producing gaseous oxidation products of 1,3,5-trimethylbenzene. These gaseous oxidation products were continuously injected into the second flow tube concentrically for about 2 h until the measured oxidation products were at steady state; i.e., conditioning of the flow tube wall was complete. After that, increasing concentrations of ammonium sulfate particles were injected into the center of the second flow tube by an Apex E desolvating nebulizer (Elemental Scientific, US) connected to an SC-2X autosampler (Elemental Scientific, US), which drew from five ammonium sulfate solutions with increasing concentrations as sources for seed particles (see Table S1 in the Supplement) to provide the condensation sink for low-volatility oxidation products at an RH of 50 %–60 % and temperature of 23±0.1 ∘C.
The gaseous chemical species were characterized by a nitrate chemical ionization mass spectrometer (CIMS) and a PTR-TOF. The nitrate CIMS is composed of two main parts: a chemical ionization (CI) Eisele-type inlet for chemical ionization at ambient pressure (Eisele and Tanner, 1993) and an atmospheric pressure interface (API) time-of-flight mass spectrometer (Bertram et al., 2011; Ehn et al., 2010; Jokinen et al., 2012). Here, the CI inlet was used with nitric acid where the nitric acid vapor was photoionized by a soft X-ray source (Hamamatsu L9490). As a result, the gaseous chemical species were detected after deprotonation or cluster formation with the reagent ions such as NO. The sampling flow of the nitrate CIMS was diluted by a factor of 50 to minimize primary ion (e.g., NO) depletion. The PTR-TOF-MS used in this work is described in detail elsewhere (Graus et al., 2010). The PTR-TOF-MS was run with H3O+ as the reagent ion and used with the following parameters: 0.2 L min−1 sample flow rate through a heated (333 K) capillary polyether ether ketone (PEEK) tubing (i.d. =1.5 mm); 10 s time resolution; drift tube pressure =2.2 mbar; drift tube temperature =333 K; drift tube voltage =550 V, resulting in an electric field () value of 120 Td (1 Td cm2 V−1). H3O+ reagent ions donate a proton to the gaseous chemical species within the air sample stream (via exothermic proton transfer reactions) producing mostly quasi-molecular compound ions before separation in the TOF (Breitenlechner et al., 2017).
Figure 1 shows the sampling setup for the Dual-EESI inlet with three different sampling channels: (1) TP (blue channel), (2) PP (green channel) and (3) FP (green and red channels). All sampling pathways lead to the same electrospray ionization (ESI) chamber, where the gaseous and/or particulate analytes intersect with charged droplets discharged by an ESI capillary for subsequent ionizations. In the EESI scheme, when particles intersect with the charged ES droplets, they can be extracted into the aqueous phase and subsequently ionized via Coulomb fission of these ES charged droplets. The gas molecules can be ionized by gas-phase ions formed during charged ES droplet evaporation, which is termed secondary electrospray ionization (SESI) (Wu et al., 2000). This approach was used in the design of Zhao et al. (2017), where charged ions were generated first before mixing with neutral analyte gases inside a cross-flow ion–molecule reaction tube. According to the settings of our Dual-EESI inlet, which does not use a heated sheath flow to aid ES droplet evaporation, analytes intersect with the ES droplets at ambient pressure. Therefore, EESI (i.e., analyte–droplet interaction) is expected to dominate in the TP and PP channels, though SESI (i.e., ion–vapor interaction) may still occur in all channels including FP where gas desorption from the tubing wall coexists.
3.1 Proof-of-principle measurement
Figure 2 shows a typical measurement cycle of the Dual-EESI for two different sampling cycles of 1 and 0.1 background-to-sampling measurement period ratios. Each complete sampling cycle proceeds as follows: FP0–TP–FP1–PP–FP2, where FP0 is the FP2 measurement from the previous measurement cycle. Both camphor and levoglucosan with concentrations of approximately 500 pptv and 10 µg m−3, respectively, were measured during TP measurements (blue shade). During the combined FP1–PP–FP2 period in Fig. 2a, the camphor signal decreased by a factor of 50. Lastly, during the FP measurement (red shade), the levoglucosan intensity decreased by at least a factor of 5. As shown in Fig. 2a, the background level (FP0) of the camphor signal increased from 1 % of TP (before any camphor injection) to 1.5 % after injection. Figure 2b shows that when the duration of the PP measurement phase (during which camphor gas was denuded) was increased to 10 min, the final background camphor signal intensity (∼1.5 %) was similar to that observed with only 1 min of PP measurement (Fig. 2a). To check the performance and memory effect of the background measurement, we applied different background-to-sampling measurement period ratios for the sampling cycles as shown in Fig. S13 and Table S2. The background levels (FP) of camphor (TP) and levoglucosan (PP) varied within the range of 1.2 %–1.5 % and 11 %–22 %, respectively, for all these sampling sequences. The increase in the background level of levoglucosan can be attributed to the potential gas desorption of levoglucosan from the tubing walls downstream of the denuders (Lee et al., 2020; Lopez-Hilfiker et al., 2019). The background signals of the Dual-EESI vary by less than a factor of 2 for all the tested sampling sequences and are reproducible during FP1 and FP2 measurements. Similarly, for semi-volatile compounds generated from precursor oxidation (Figs. 4 and S18), the average signal measured during FP1 and FP2 periods is lower than 15 % and 10 % of the TP signals, respectively. Averaged FP2 measurements remain consistent for different sampling durations (Fig. S13), indicating that background buildup is negligible. The rise time from FP0 (i.e., FP2 of the previous cycle) to TP as shown in Fig. 2 is very short (<1 min) compared to that observed using ion–molecule reaction (IMR) chemical ionization mass spectrometry (Palm et al., 2019), where it was required to carry out fast zero measurements to account for vapor–wall interactions. For the Dual-EESI inlet, such effects are likely minor given the fast rise time and consistency of FP2. Therefore, we use FP2 as our background measurement. This is similar to the background treatment of single-phase EESI (Lopez-Hilfiker et al., 2019), which follows a FP0–PP–FP1 sampling scheme and uses the average of FP0 and FP1 as the background, where FP0 is the FP1 measurement of the previous cycle. As a result, the Dual-EESI is able to provide quasi-simultaneous gas- and particle-phase measurements for standard compounds with measurement cycle periods as low as 5 min, including background correction. This capability was further tested below using environmentally relevant complex mixtures of gases and particles.
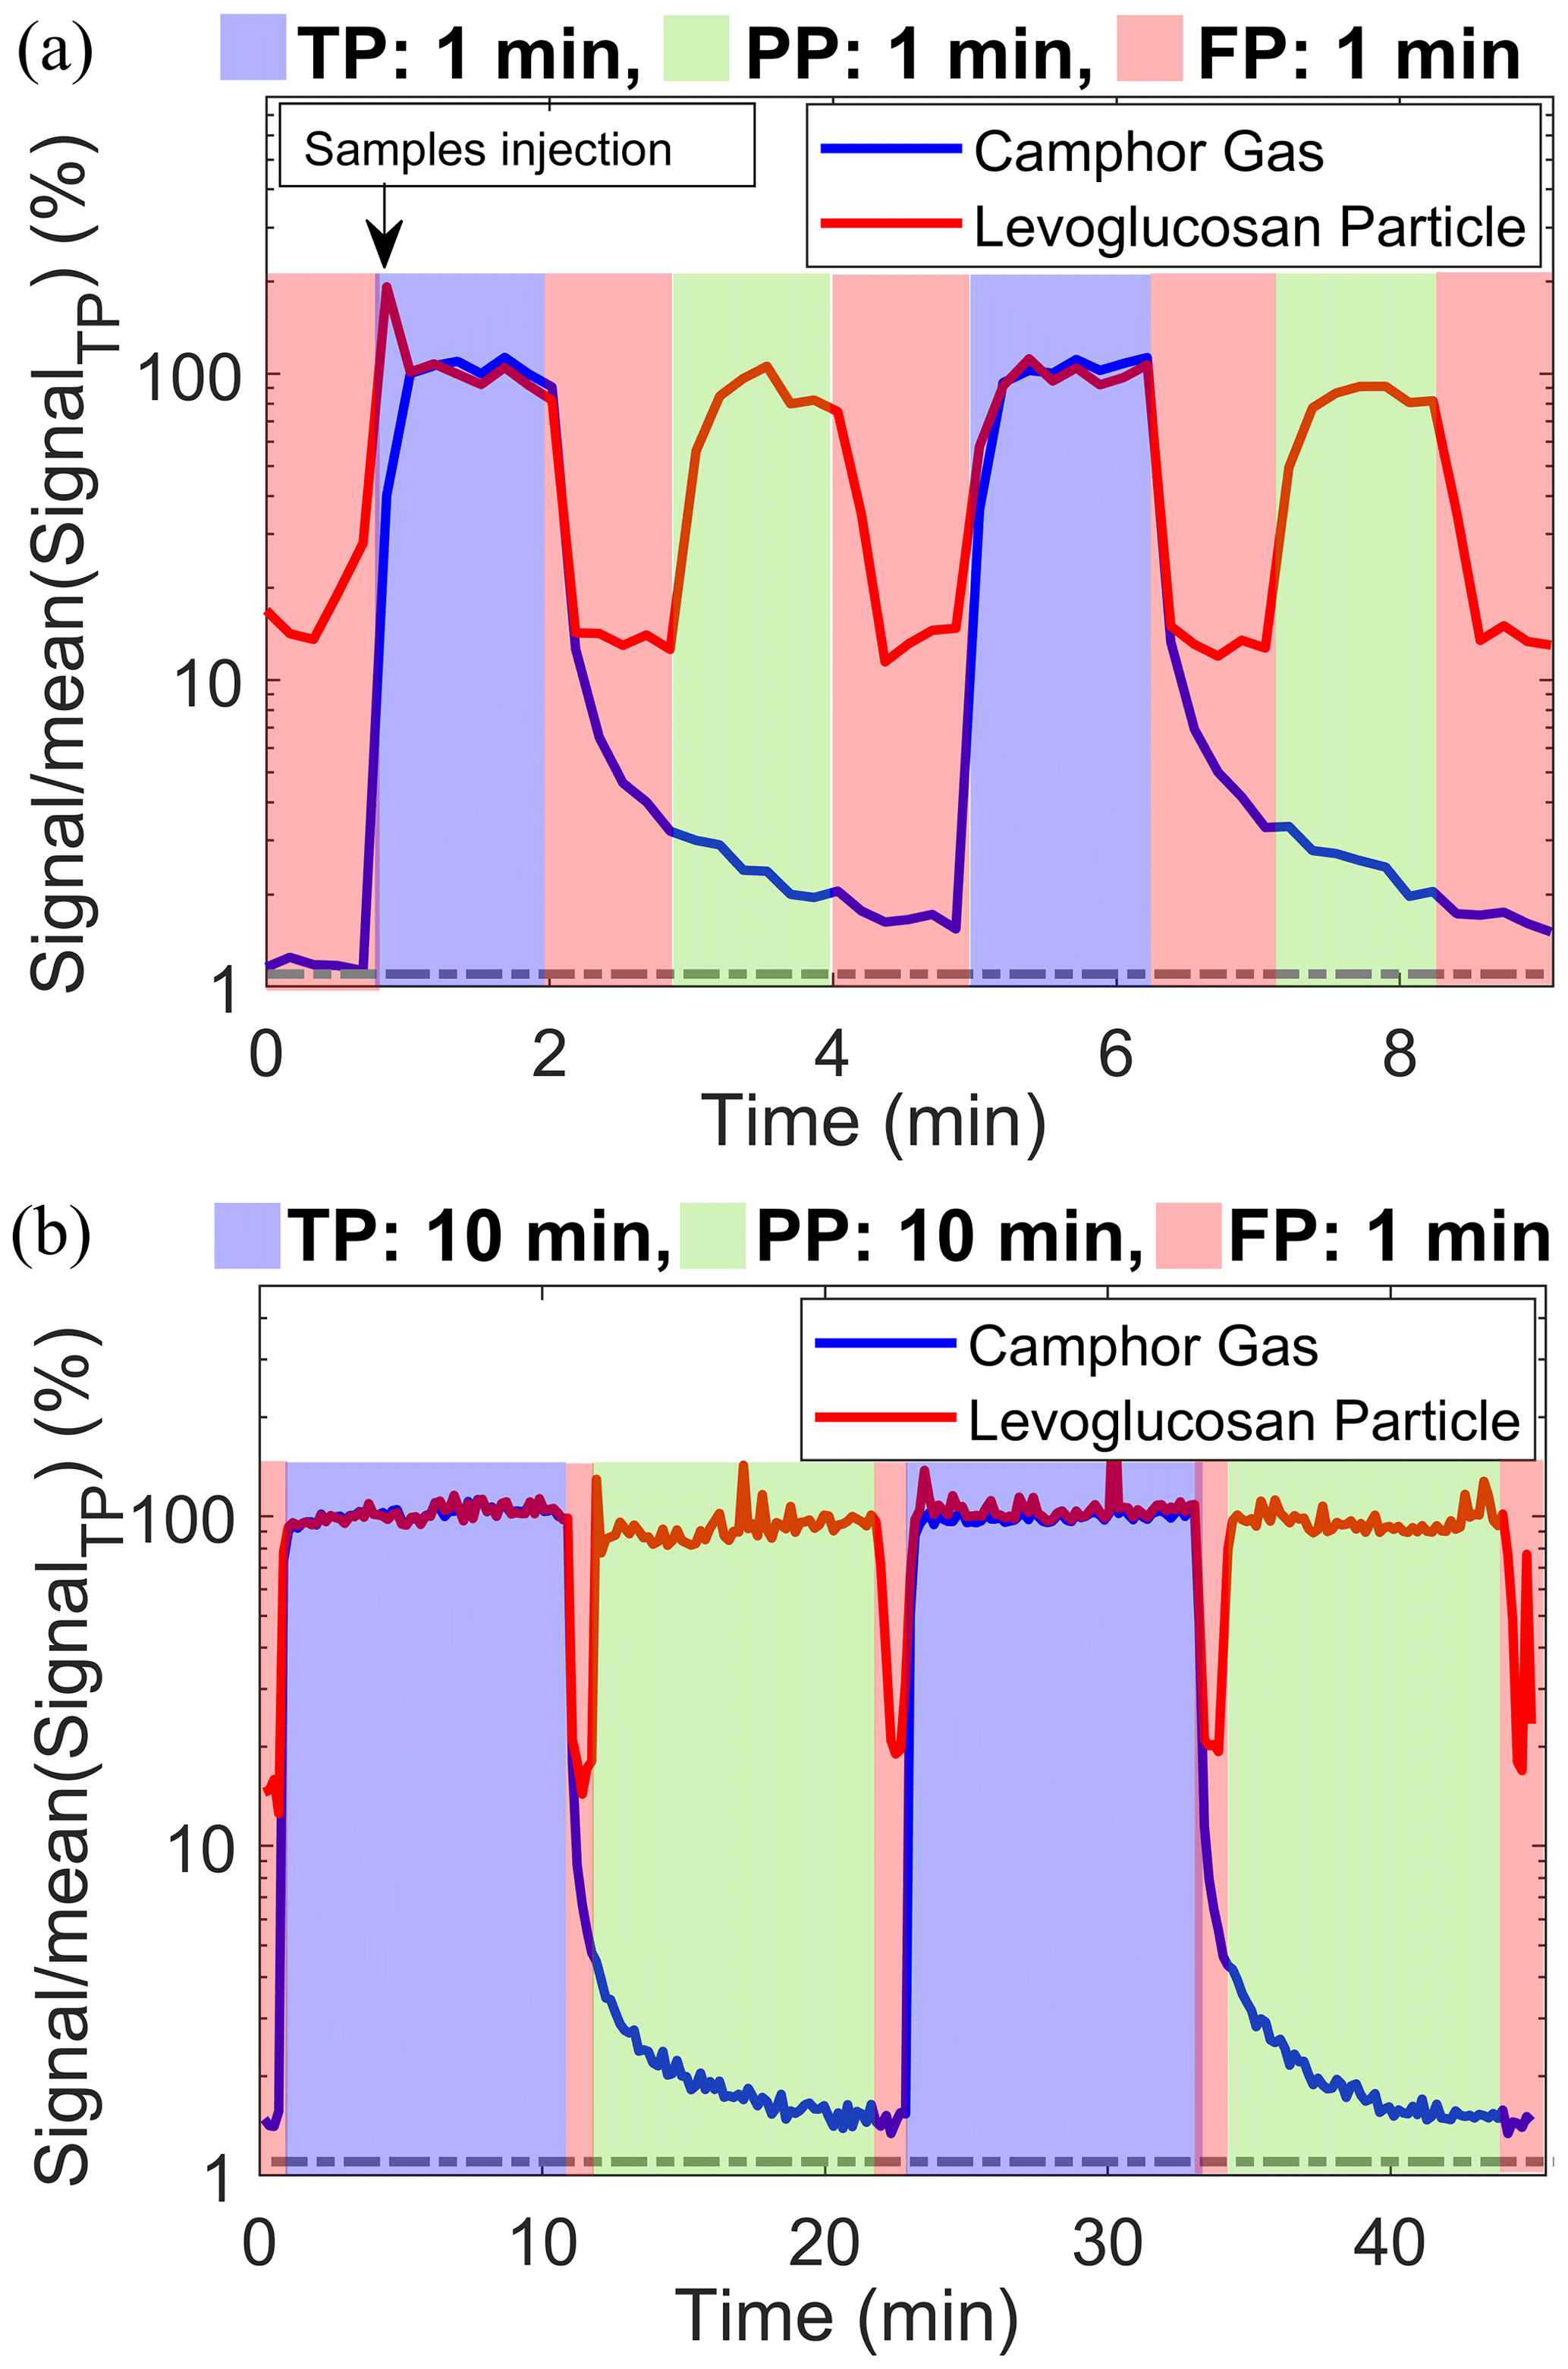
Figure 2Dual-EESI measurements of gaseous camphor and particulate levoglucosan for two different ratios of the background-to-sampling measurement period (a) 1 and (b) 0.1. Please note that the camphor in (b) was injected at the first minute as in (a); thus both sampling conditions have the same level of background (1 %). The relative changes in the signals in percentage were obtained after normalizing the signals by the averaged TP signal. Dashed gray lines denote the initial background level before the injection of camphor and levoglucosan. Different sampling time ratios (background to measurement time) are shown in Fig. S13 and Table S2. Data were collected at a time resolution of 1 s and then averaged to 10 s for display.
3.2 Influence of transmission for the quantification
Sampling flow conditions have been shown to affect the measurements of TP and PP via vapor–wall interactions and size-dependent particle transmission (Brown et al., 2021; Deming et al., 2019; Lee et al., 2021a; Pagonis et al., 2017). In this section, we characterize the effect of the response of gaseous and particulate compounds in the TP and PP channels.
First, we investigate the influence of the vapor–wall interaction in the TP channel on the Dual-EESI gas sampling efficiency (∼40 % at 1 L min−1, see Figs. S2 and S3a). Different sampling flows of camphor were applied to the TP channel. Figure S3b shows that the background (FP measurement) relative to the TP measurement remains similar when the sampling flow of camphor decreases from 9 L min−1 (higher sampled gas concentration) to 3 L min−1 (lower sampled gas concentration). The similar camphor background level relative to TP at different gas sampling efficiencies could be attributed to the positioning of the valves downstream of the Dual-EESI TP and PP channels, where the remaining tubing surface area is approximately a factor of 7 less than the whole inlet, enabling minimal vapor–wall interactions inside the inlet.
Gas–wall interactions are especially important for semi-volatile and intermediate-volatility organic compounds (Pagonis et al., 2017; Deming et al., 2019; Liu et al., 2019). We tested four different tubing materials: conductive PFA, conductive PTFE, stainless steel 306 and coated stainless steel 306 for desorption responses of semi-volatile compounds in the Dual-EESI inlet. Compounds were generated from the OH oxidation of 1,2,4-trimethylbenzene at 30 % RH and 20 ∘C. The oxidation product signals were measured by an Eisele-type atmospheric pressure chemical ionization inlet (nitrate CIMS) connected after the Dual-EESI inlet at 10 L min−1 sampling flow. Figure S5 shows that, under our sampling configurations, semi-volatile vapors (C9H12O4−5) quickly equilibrate regardless of the tubing materials. This is most likely because the wall losses are dominated by the presence of other surfaces. The rapid equilibration times of ∼3 min are likely due to the high flow used, which ensures a combination of shorter residence time and higher dilution compared to previous studies (Pagonis et al., 2017; Deming et al., 2019; Liu et al., 2019), where gas–wall interactions were more severe and dependent on wall material. A similar behavior is observed for semi-volatile oxidation products of α-pinene + ozone (C10H16O3 and C10H16O5, Fig. 4), measured by the Dual-EESI at 5 L min−1 sampling flow.
To compare the particle signal between TP and PP, we investigated the change in detected particulate levoglucosan signal for the TP and PP channels at 7 and 9 L min−1 after characterizing the particle transmission efficiencies of different channels (Fig. S4). We found that the measured levoglucosan signal in PP is approximately 13 %–17 % lower than in TP, corresponding to a decrease in the transmitted particle mass concentration between TP and PP of 4 %–20 % as measured by an SMPS. This difference of the detected EESI signal between PP and TP has to be taken into account for quantifying the particle- and gas-phase concentrations. For instance, during sampling of smaller particles which exhibit higher sensitivity (Lee et al., 2021a), we expect larger differences between PP and TP and thus larger uncertainties in the quantification of gas-phase concentrations.
3.3 Measurement linearity
Several studies have reported that the ionization efficiency of chemical compounds in the gas and particle phase can differ due to different ionization mechanisms (Kumbhani et al., 2018; Law et al., 2010; Lee et al., 2021a; Wang et al., 2012; Wingen and Finlayson-Pitts, 2019). One study suggested that the EESI sensitivity depends on volatility (Meier et al., 2011). To evaluate this, we used two groups of chemical compounds classified by volatility to investigate the effect observed by Meier et al. (2011). Group 1 consists of compounds with estimated saturation vapor concentrations >102 µg m−3, i.e., ethyl acetate, ethyl propionate, 3-pentanone, camphor and hydroxyacetone. Group 2 consists of compounds with estimated saturation vapor concentrations <101 µg m−3, i.e., sebacic acid, levoglucosan, iodic acid, ammonium nitrate and sucrose. These compounds have been observed in ambient air and span almost 10 orders of magnitude in estimated saturation vapor concentration. Figure 3a and b show that the Dual-EESI provides a linear response for gases and particles with a sensitivity range of approximately 2–3 orders of magnitude, consistent with other reports (Lopez-Hilfiker et al., 2019; Kruve et al., 2013). The detected ions in the gas or particle phase are measured as the same adduct ions, enabling the subtraction of the TP–PP signal for gas-phase measurement. Organic compounds are mostly (>95 %) detected by the EESI as Na+ adducts. Unlike for inorganic salts and organic molecules with highly polar anions (e.g., sebacic acid) in either the gas or particle phase, the corresponding cation or carboxyl is partially or fully substituted by Na+ before being associated with another Na+ such as or . For the investigated chemical standards, we do not observe an effect of such additional cation substitution on the response linearity. However, the possible effect of the adduct formation after the cation substitution process on the measurement sensitivity and linearity should be investigated further in the future.
Figure 3 shows that the Dual-EESI exhibits a linear response to the individual gaseous and particulate analytes. However, this linearity could potentially be affected if the gaseous and particulate analyte mixtures interact with each other rather than just with the ES ions, leading to matrix effects such as ion enhancement or suppression via different mechanisms (Rovelli et al., 2020). Therefore, we characterized the linearity of a mixture of gaseous (camphor) and particulate (levoglucosan and iodic acid) compounds. Figure S15 shows that the relative signals of levoglucosan and iodic acid particles were negligibly affected (±10 %) when the concentration of camphor gas was decreased by a factor of 10. The negligible matrix effect of gas and particle mixture measurement using the Dual-EESI is a promising feature for separating gaseous and particulate chemical species. We further assess the linearity of the gas-phase signals in Sect. 3.6 (Fig. 6) for more complex mixtures, by comparing the EESI signals to those measured with a nitrate CIMS.
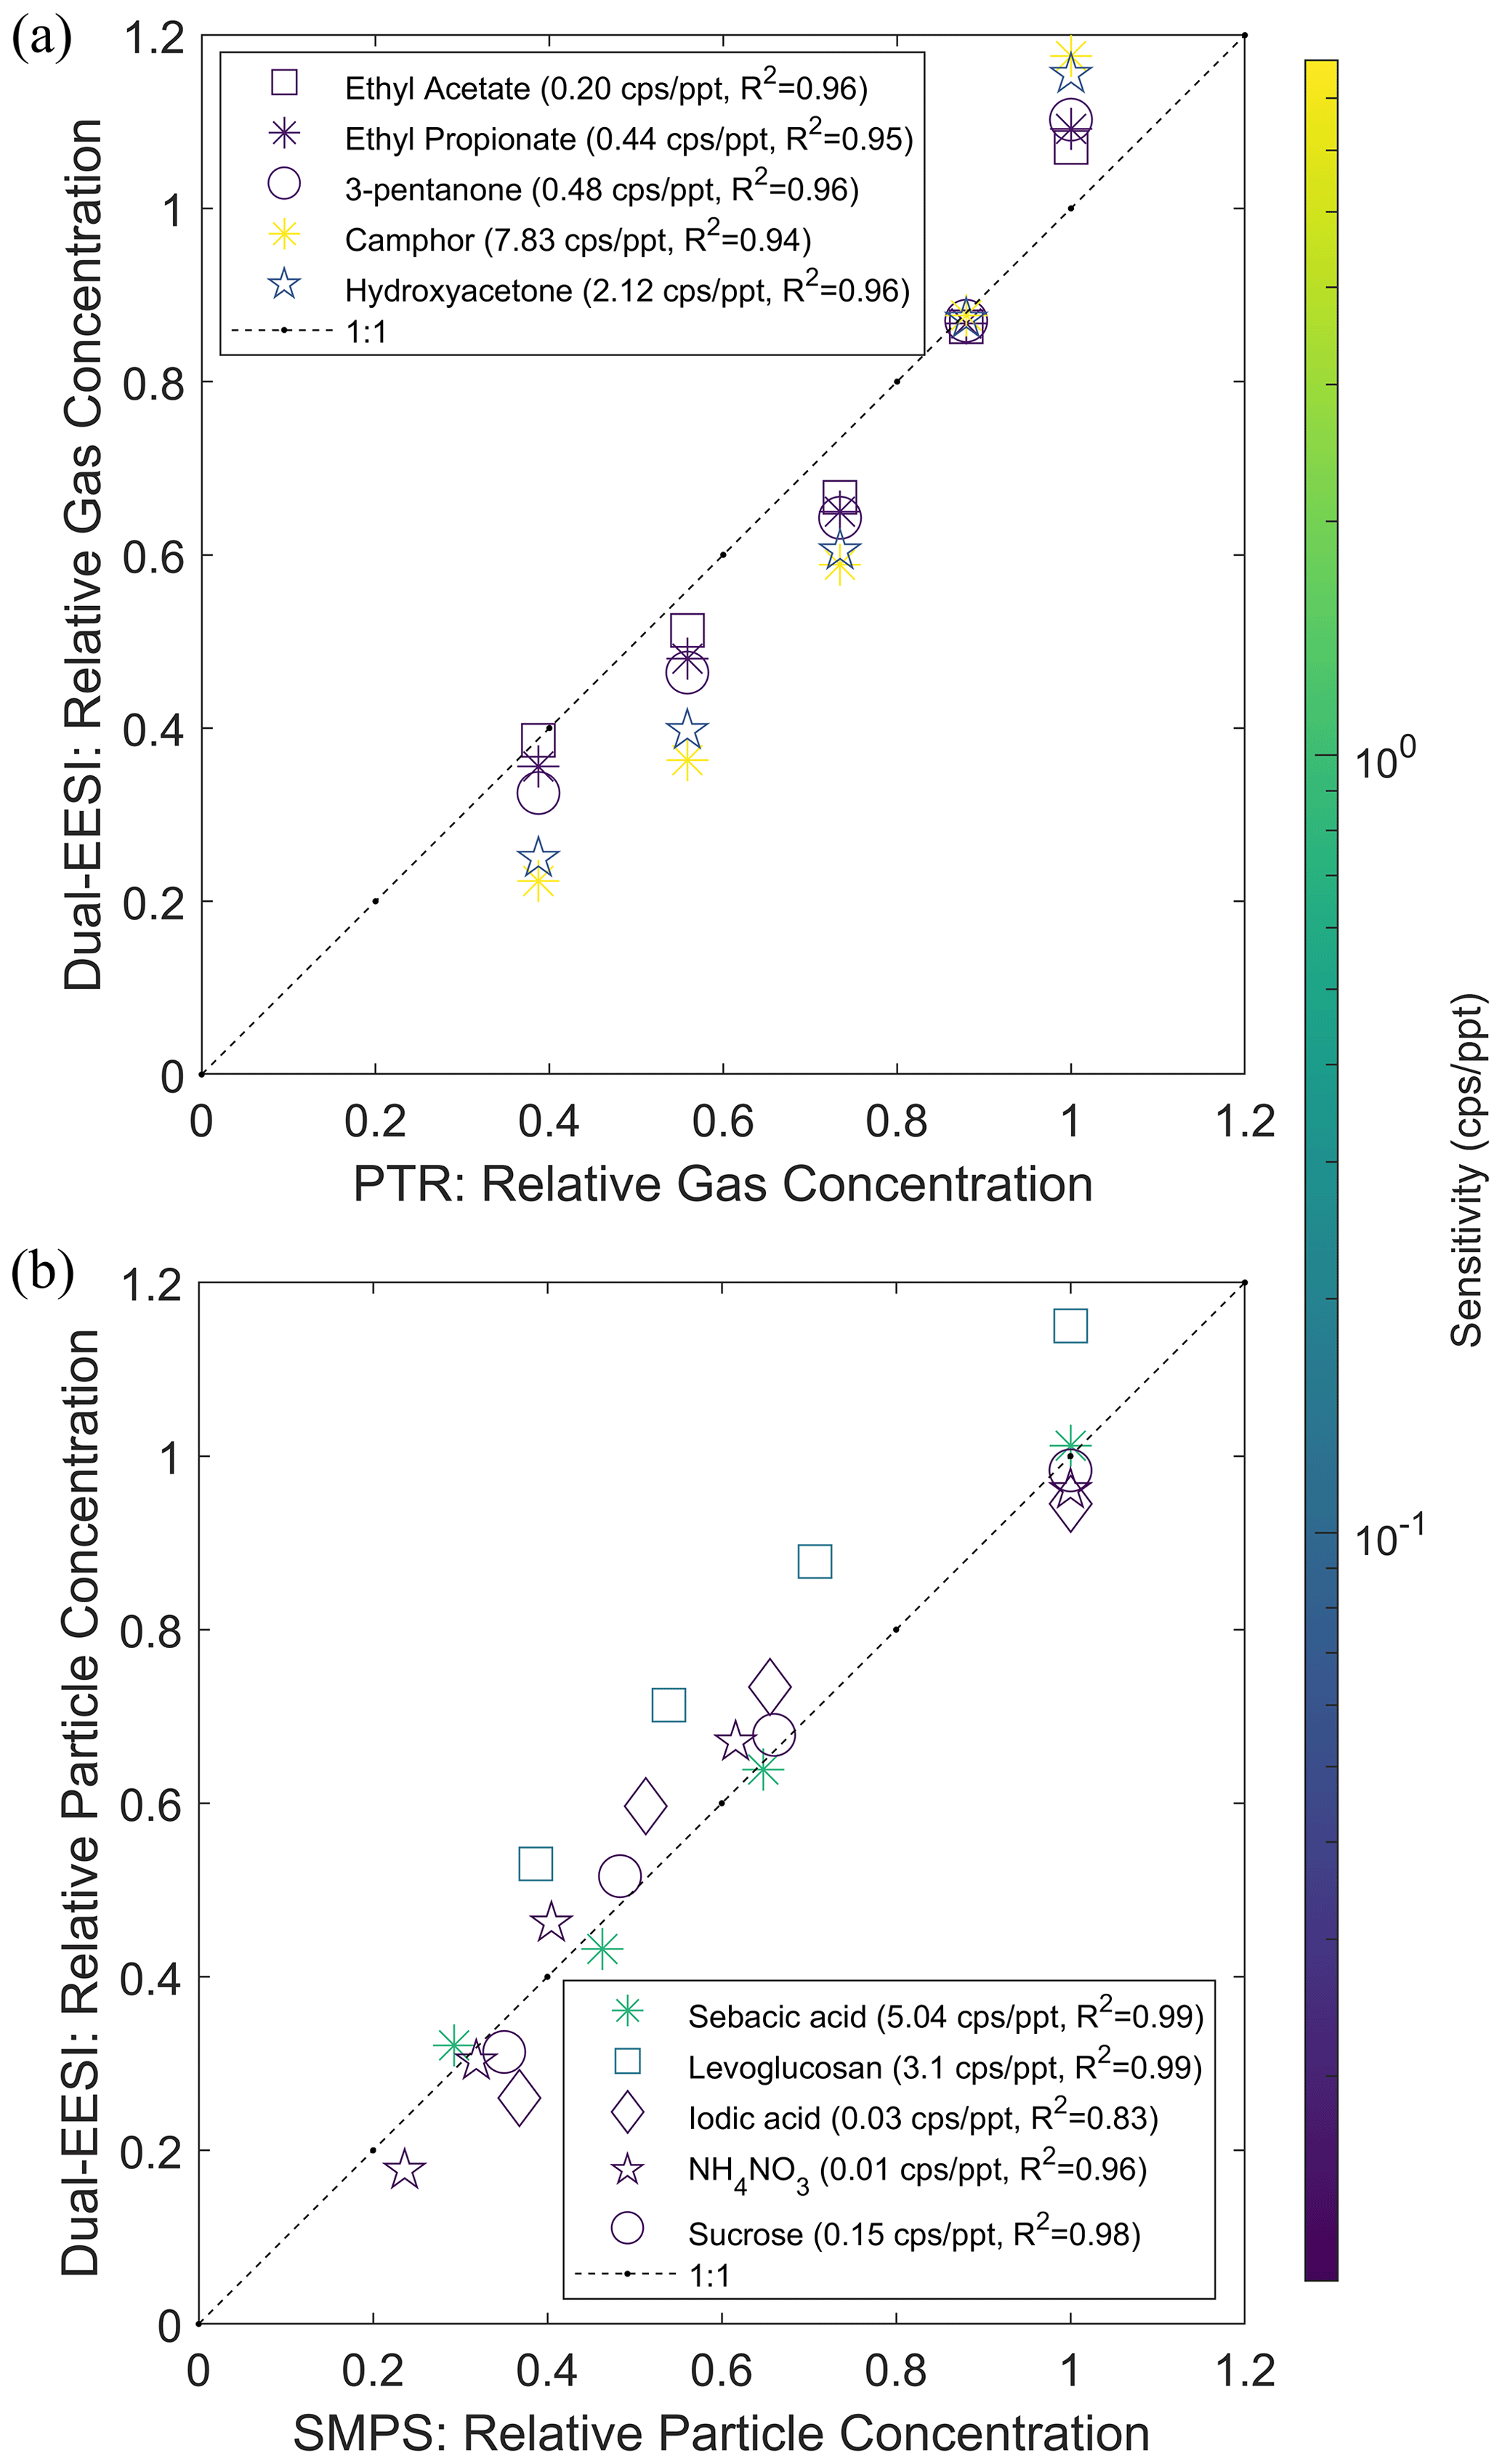
Figure 3Dual-EESI linearity for chemical standards that span almost 10 orders of magnitudes in the estimated saturation vapor concentration. (a) Measured intensity of different gaseous species (TP–PP) and (b) particulate species (PP–FP2) with estimated saturation vapor concentrations >102 µg m−3. The gaseous species were generated by a Vaporjet and quantified by a PTR (see Figs. S9 and S14). The particulate species were generated by a nebulizer and quantified by an SMPS using the effective density of the chemical standard. Color scales indicate the sensitivity (cps ppt−1) in the gas and particle phase as indicated in the respective legend. Each set of calibration data points is fitted by a linear regression p1⋅x. For display, the y-axis data points are then normalized by the maximum of the regressed data points using the x-axis data points.
3.4 Separation of gas and particle measurements using SOA
While the experiments discussed above, using chemical standards, show that the Dual-EESI can measure gas and particle phases separately, they do not reflect the complexity of compounds present in the real atmosphere in the particle and gas phases. For this reason, we measured biogenic and anthropogenic oxidation products generated in the flow tube using two different sets of experiments. In the first set of experiments, SOA was produced from α-pinene (AP) ozonolysis with an increasing production rate of the oxidation products, leading to an increasing SOA formation rate and condensation sink. As shown in Fig. 4a, four stages of SOA mass concentration were generated by reacting ozone (<280 ppbv) with increasing AP concentrations (2–18 ppmv) in excess. The condensation sink (CS) increased from 0.002 to 0.11 s−1 (Fig. S16) due to the increase in the AP SOA formation rate with SOA mass concentrations of 6–247 µg m−3 (Fig. S17). Figure 4b shows that the Dual-EESI gas-phase measurements of C10H14O and C10H16O behave commensurately with the measurements of the Q-PTR. To check for condensation of semi-volatile species, the time series of C10H16O3 and C10H16O5 are shown in Fig. 4c–d. While the particle-phase signal of C10H16O5 (green shade) increases with the SOA mass concentration, the particle-phase signal of C10H16O3 is indiscernible from the background within our uncertainties and in the studied range of CS.
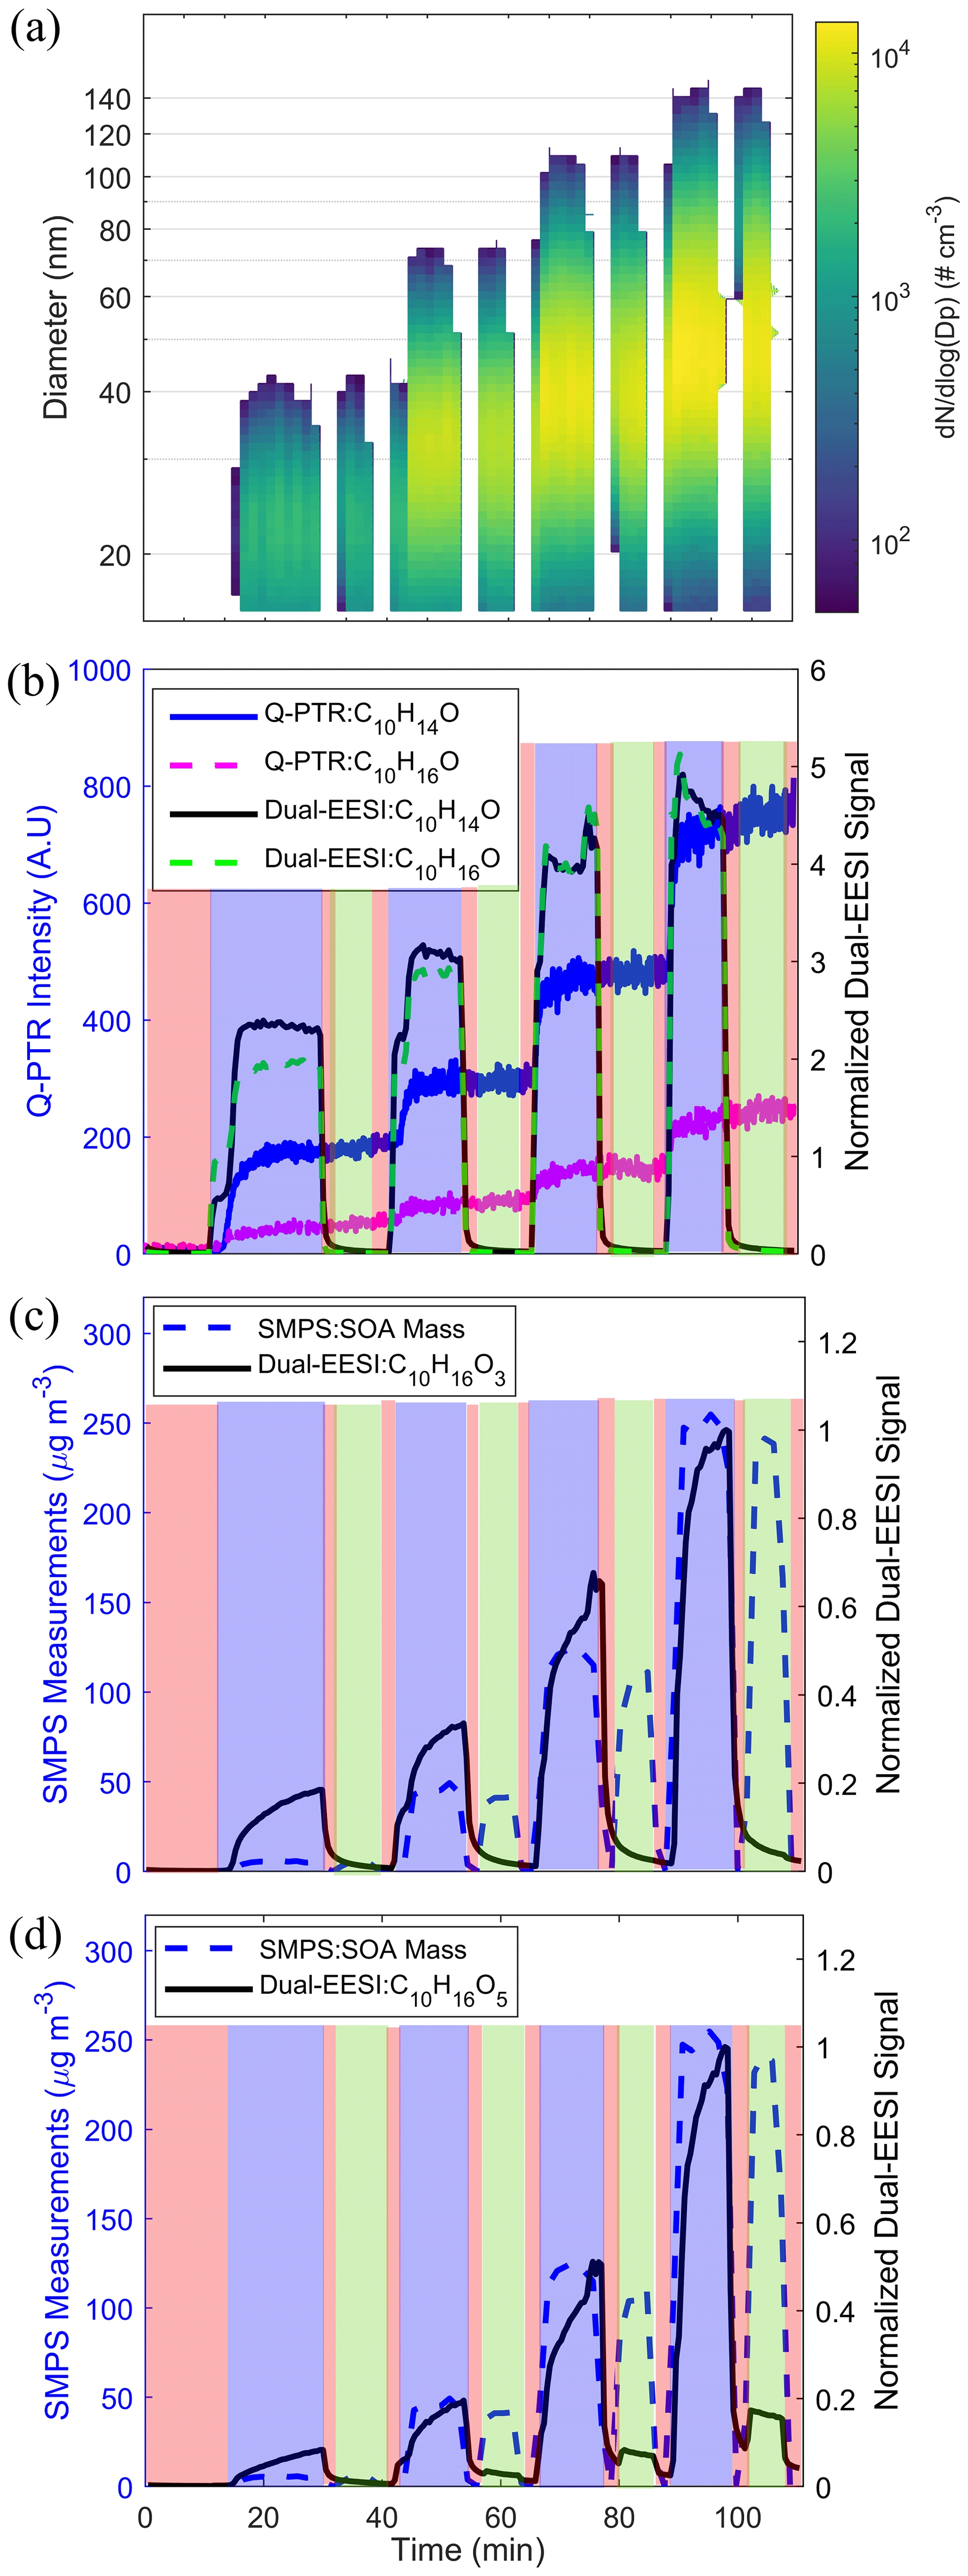
Figure 4(a) SMPS size distribution for four experimental stages, each with different SOA mass concentrations (regions where ) <50 cm−3 are replaced by blank space). (b) Comparison of the Dual-EESI and Q-PTR measurements for C10H14,16O. Normalized Dual-EESI signal of (c) C10H16O3 and (d) C10H16O5 for increasing SOA mass concentration. Each sampling cycle consists of 10–15 min of TP (blue), 5 min of FP1 (red), 10 min of PP (green) and 5 min of FP2 (red) measurements. Note that the switching of the sampling channel for FP and PP only started when the signals of C10H16O3−5 reached a steady state in the TP. Thus, the sampling time of the first TP phase of each cycle varied for these four stages.
In the second set of experiments, we measured the oxidation products of 1,2,4-trimethylbenzene (TMB) through OH oxidation, where the gas-phase production rate was kept constant, while the condensation sink was increased by varying the mass concentration of ammonium sulfate (Table S1). As shown in Fig. S18, the TP signal of C9H12O5 decreases with increasing CS, while producing an increase in the PP signal at higher CS. Among the TMB oxidation products, C9H10−12O4 are the most abundant species in both phases. Figure S19 shows that the relative abundance of more oxygenated compounds (O = 5–6) in the gas phase is lower than in the particle phase, similar to the case of α-pinene (Fig. S17). Our comparison of 73 chemical species (Table S3) from AP and TMB SOA in Fig. S20 demonstrates the ability of the Dual-EESI to separate gas- and particle-phase components almost simultaneously; i.e., it can resolve a particle-phase species increase with increasing gas-species production and CS in the first set of experiments and a particle-phase species increase due to increasing gas-species condensation with an increasing condensation sink in the second set of experiments.
3.5 Biogenic and anthropogenic SOA constituents
Figures 3 and 4 show that the Dual-EESI can separate gas-phase and particle-phase components from chemical standards as well as from SOA mixtures. To demonstrate the different behavior of species in the gas and particle phase, Fig. 5 shows their relative abundance in the gas phase (TP–PP) and particle phase (PP–FP) as a function of oxygen and carbon number. The C8−10H12−16O1−8 and C7−9H8−16O2−8 species were chosen for the AP and TMB system, respectively, because these species had already been reported for these systems (Tsiligiannis et al., 2019; Wang et al., 2021; Zhang et al., 2015). The total intensity of the gas-phase measurement is at least 20 times higher than the total intensity of the particle-phase measurement for both the AP and TMB systems. However, a 20 times higher gas-phase intensity for a detected species does not necessarily mean that its gas-phase concentration is 20 times higher than the particle-phase concentration. A large fraction of this difference may be attributed to differences in the Brownian coagulation coefficient of gas molecules and particles with ES droplets, which for particles yields a significant increase in sensitivity with decreasing particle size for particles with diameter Dp<100 nm (Lee et al., 2021a). To directly compare gas-phase to particle-phase measurements in terms of absolute concentration, molecular calibration and correction for gas / particle sensitivity response are still required (see Sect. 3.7) (Kruve et al., 2013; Mayhew et al., 2020; Wang et al., 2021). Since the intensities in Fig. 5 are not corrected, we only compare the measured relative abundances (i.e., not absolute concentrations) of those oxygenated species between the gas-phase and particle-phase measurements.
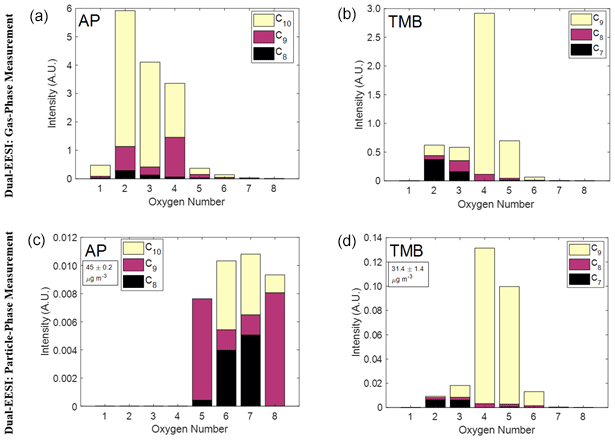
Figure 5Measurement of gas- and particle-phase oxidation product mixtures generated inside a flow tube reactor using the Dual-EESI. (a, c) Gas-phase oxidation products (a) and SOA (c) from AP ozonolysis for C8−10H12−16O1−8 with a total number of 73 species. (b, d) Gas-phase oxidation products (b) and (d) SOA from TMB oxidation with OH for C7−9H8−16O2−8 with a total number of 32 species (see Table S3). Corrections for particle transmission efficiencies were not applied here, which might cause an uncertainty of up to 15 %, as discussed in Sect. 3.2. The arbitrary unit (A.U.) denotes the quantity of the ion intensity after normalization to the most abundant ES ion which was applied to the gas- and particle-phase measurements.
Figure 5a and c compare C8−10 species of AP SOA. The gas-phase species mostly contain 2–4 O atoms, whereas the particle-phase species mostly contain 5–8 O atoms with an SOA mass concentration of 45 µg m−3. Such relative abundance distribution is also consistent for different AP SOA mass concentrations (6, 45, 123, 246 µg m−3) as shown in Fig. S17 where the relative abundances of different species in the gas and particle phase vary commensurately with the SOA mass concentration. For the C7−9 species of TMB SOA at 31.4 µg m−3 (Fig. 5b and d), the relative abundances of C7−9H10−12O5−6 species in the particle phase are higher than in the gas phase. C9H12−16O4 is the most abundant species in both phases, indicating its semi-volatile nature. Consistently, when decreasing the CS from 0.16 to 0.08 s−1, the total intensity of the gas-phase measurement increases and the total intensity of the particle-phase measurement decreases as depicted in Fig. S19. The particle-phase measurement in AP is much more oxygenated than its gas phase when compared to the TMB gas- and particle-phase measurement. This difference could be primarily attributed to the dynamic where AP SOA CS is generated due to the increase in the oxidation product concentration, whereas it is constant for TMB SOA. Overall, the Dual-EESI measures species over a wide volatility range in both the gas and particle phase, giving insights into the different partitioning behaviors of compounds spanning a wide range of volatilities with increasing molecular weight or/and functionalization (Donahue et al., 2011; Pankow and Asher, 2008).
3.6 Linearity and sensitivity comparison to the CIMS
As demonstrated in Fig. 3, the Dual-EESI shows good measurement linearity for chemical standards measured in both the gas and particle phases. To potentially elucidate the gas-to-particle partitioning processes, measurement linearity and the sensitivity of semi-volatile species with a saturation vapor concentration within 0.1–100 µg m−3 are crucial (Donahue et al., 2012). Thus, a series of semi-volatile organic compounds generated via TMB OH oxidation (C9HO3−8) were compared between the Dual-EESI and a nitrate CIMS, as shown in Fig. 6. Generally, the Dual-EESI detects oxygenated products ranging from O1 to O8 but is insensitive to non-oxygenated VOCs. Figure 6a shows that Na+ adduct formation in the Dual-EESI in the gas phase is linear with respect to the two different ionization pathways of the nitrate CIMS, where some analytes undergo two different ionization pathways (Riva et al., 2019). The Dual-EESI measures a wider range than either the deprotonated ions (O3–O5) or the nitrate adduct ions (O3–O7) measured by the nitrate CIMS. Furthermore, Fig. 6b shows that the relative response factor of the Dual-EESI vs. the CIMS spans over roughly 2 orders of magnitude, with the nitrate CIMS being more sensitive towards more oxygenated compounds, which has been reported in previous studies (Lamkaddam et al., 2021; Riva et al., 2019). Wang et al. (2021) reported that the ionization efficiency of the EESI increases by 2 orders of magnitude as the volatility decreases by 8 orders of magnitude indicating that the Dual-EESI exhibits a shallower sensitivity dependence on the oxygen number than the nitrate CIMS. A systematic discussion of gas- and particle-phase sensitivity for the Dual-EESI is given in Sect. 3.7.
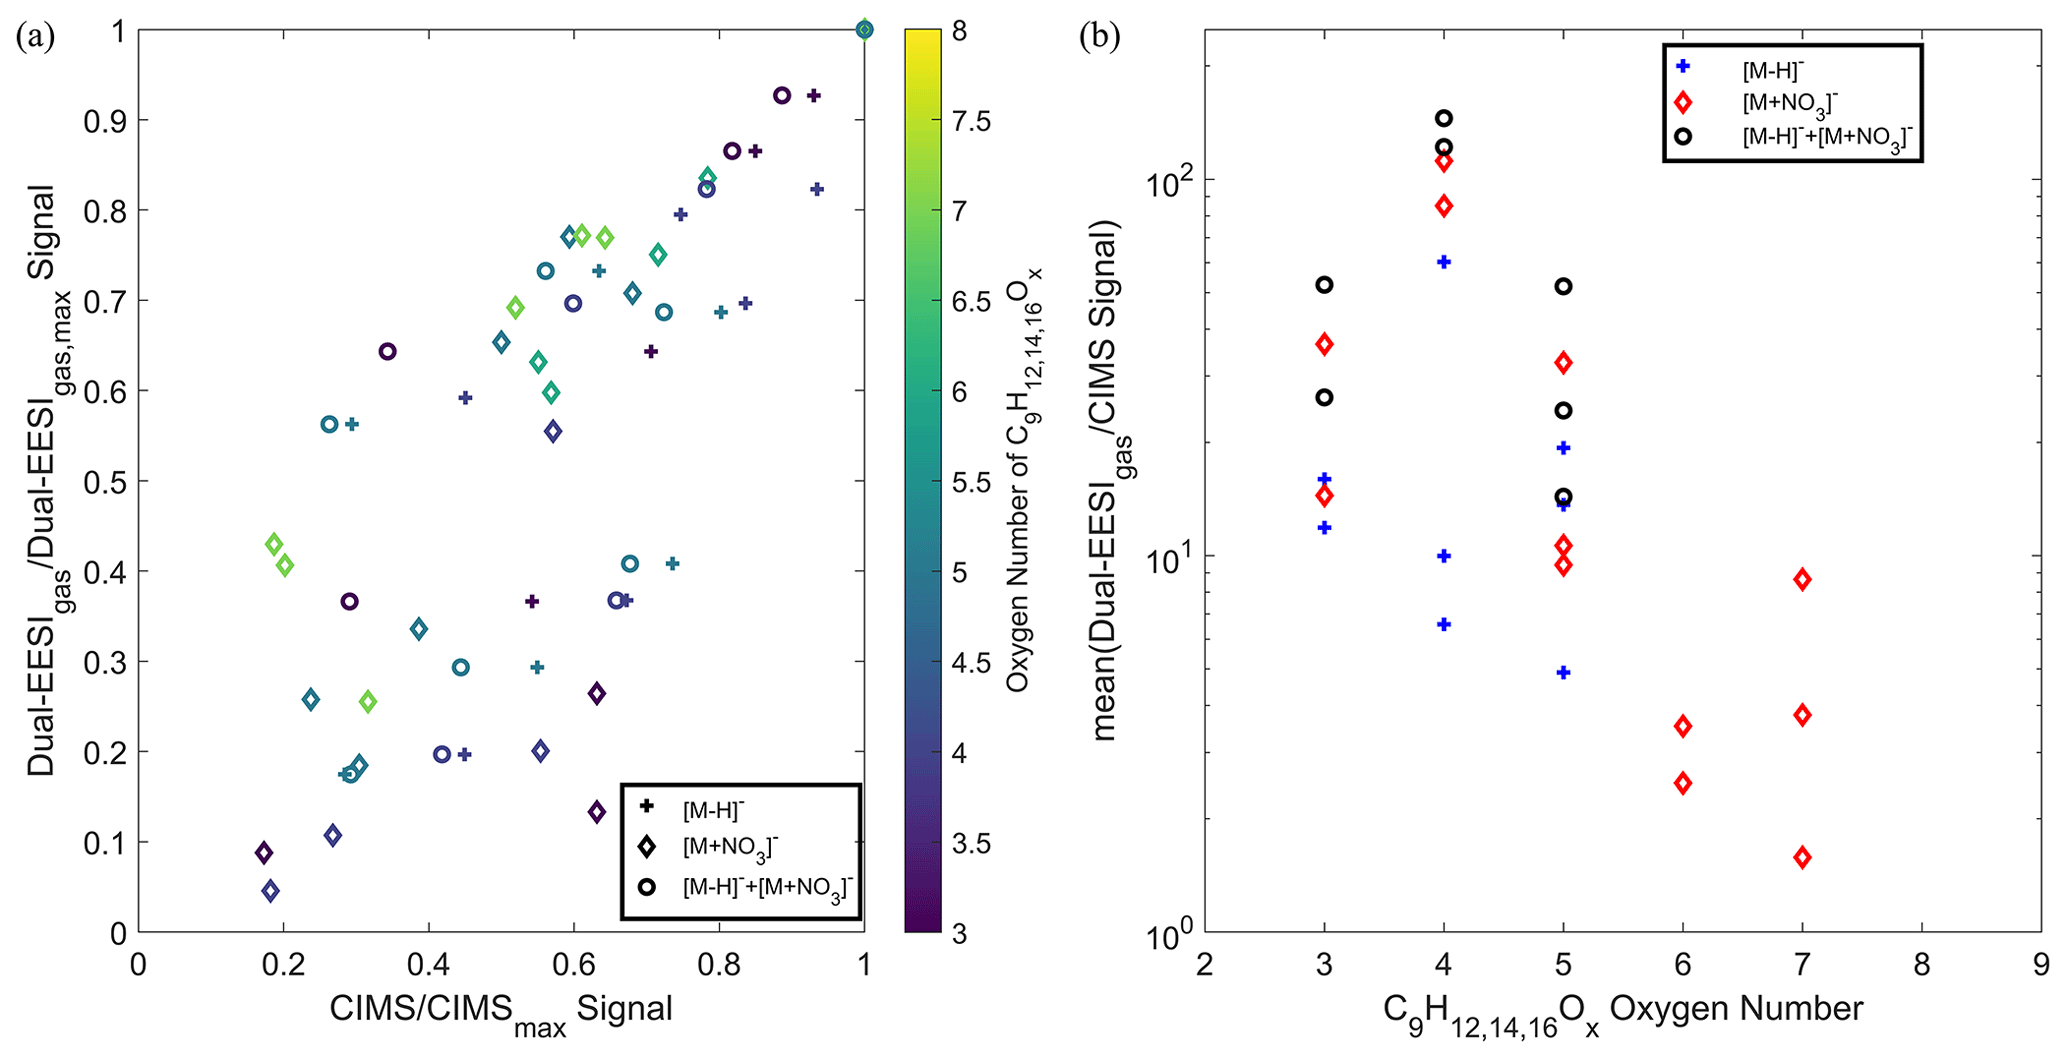
Figure 6Comparison between the Dual-EESI and nitrate CIMS for a series of TMB oxidation products in the gas phase. Since some analytes detected in the nitrate CIMS might have two ionization pathways via deprotonation or nitration, for each analyte M, we compared , and from the nitrate CIMS to the of the Dual-EESI. Please note that summation of detected ions in the CIMS was only implemented for ions that can be detected in both and of the same compound, where their respective sensitivities in the nitrate CIMS may differ. (a) The normalized signal of the Dual-EESI and the nitrate CIMS to their respective maxima where the color scale indicates the oxygen number. (b) Averaged intensity ratio between the Dual-EESI in the gas phase and the nitrate CIMS for TMB products with different oxygen numbers (C9HO3−8).
3.7 Dual-EESI gas- and particle-phase sensitivity response
Given a steady gas-phase production rate (i.e., constant precursor injection rates), the decrease in total-phase signal in response to an increasing condensation sink (Fig. S21), which facilitates condensation of organic vapors, suggests that the Dual-EESI has a higher sensitivity towards gas-phase species than towards particle-phase species. Taking the sampling efficiencies (>60 %, Fig. S4) and size-dependent sensitivity (∼20 % decrease for a Dp increase from 90 to 130 nm, Fig. S22, Eqs. S2–S3, Table S1) into account, Fig. 7 shows that the increase in the particle-phase signals after seed particle injection for the same molecule is on average 11 times lower than the decrease in the gas-phase signals; i.e., the relative gas- and particle-phase sensitivity response factor differ by up to a factor of 11, with the gas phase being more sensitive. This is reproducible for five different condensation sink conditions (0.075–0.16 s−1) where 75 % of the mean of (change in gas)/(change in particle) signals are 3 times higher than the standard deviation as shown in Fig. S23. The calculation of the particle- and gas-phase signals shown in Fig. 7 is detailed in Sect. S6 of the Supplement. The spread in Fig. 7 indicates that the saturation vapor concentration alone is insufficient to describe the differences in gas vs. particle relative response factors for the Dual-EESI. Other factors such as diffusivity may also contribute; the unclear correlation (R2=0.115) between the gas / particle sensitivity ratio and binary diffusivity values estimated using only molecular formulae (Fuller et al., 1996) could be caused by the lacking knowledge on analyte structures. This higher sensitivity in the gas phase compared to the particle phase is consistent with the strong size dependence of the EESI response (Fig. S22 and Lee et al., 2021a) and most likely results from the increase in the coagulation rate coefficients between the ES droplets and the analyte particles or gas molecules as their size decreases. The higher coagulation rate from the gaseous molecule in EESI results in a higher detection (extraction) limit of gas-phase measurement in comparison to the particle-phase measurement.

Figure 7Relative gas-to-particle sensitivity response of the Dual-EESI. The change (decrease) in gas-phase signal and change (increase) in particle-phase signal from different molecules (Table S4) are shown on a logarithmic scale due to the 2–3 orders of magnitudes relative ionization efficiency (RIE) variability range among the molecules for each phase. The 1:1, 10:1, 50:1 and 100:1 dotted lines are added for visualization of the gas-to-particle-phase sensitivity response. The particle-phase measurements were corrected for size-dependent sensitivity as shown in Fig. S22. The data points are color scaled by their estimated saturation vapor concentration (Donahue et al., 2011).
We developed and characterized a novel instrument, the Dual-Phase-EESI-TOF (Dual-EESI), which can measure gaseous and particulate chemical species quasi-simultaneously with the same ionization and detection system. The inlet design, materials and sampling sequence are optimized to achieve accurate background correction and high sampling efficiency. Negligible measurement interferences between gas and particle were demonstrated for both constant and varying gas and particle concentrations using chemical standards and SOA mixtures. In addition, the Dual-EESI can measure a wide range of oxygenated species for in the gas phase, allowing for a more comprehensive characterization of ambient gas and aerosols. Using the Na+ adduct formation for gas- and particle-phase species measurements, the Dual-EESI simplifies the gas- and particle-phase composition analysis, which could provide a self-consistent method to deduce SVOC volatility. The measurement cycle can be as fast as 5 min, with 1 Hz time resolution, which is useful for atmospheric chemistry and aerosol dynamics investigations. We also present the relative sensitivity of gaseous versus particulate species where the quantity of the gas phase can be estimated using the particle-phase calibration within a factor of 11 uncertainty. This factor of 11 likewise dominates the uncertainty in estimating the partitioning coefficient for SVOC under typical ambient conditions . Future work should focus on absolute response factor parameterization between the gaseous and particulate species, and a systematic elucidation of their sensitivities can help to determine partitioning coefficients in real time, shedding light on source apportionment of total organics and partitioning investigation for specific sources and/or pollution.
Data presented in this study can be obtained at the Zenodo online repository hosted by CERN (https://doi.org/10.5281/zenodo.6634695, Lee et al., 2021b). Raw data can be obtained by contacting the corresponding authors.
The supplement related to this article is available online at: https://doi.org/10.5194/amt-15-3747-2022-supplement.
CPL, JGS, JD, GW and PAS designed the inlet. CPL, GW, PAS, MS, XZ and DW fabricated the inlet. CPL, IEH, JD, HL, MS, DW and DMB designed the experiment. MS, CPL, DW, HL, JD, XZ, AB and SG performed the experiments. CPL, MS, HL and DW analyzed the data. CPL, IEH, MS, DW, HL, JD, JGS, DMB, UB, ASHP and XM interpreted the compiled results. CPL prepared the paper. All authors contributed to the discussion and revision of the paper.
The contact author has declared that neither they nor their co-authors have any competing interests.
Publisher’s note: Copernicus Publications remains neutral with regard to jurisdictional claims in published maps and institutional affiliations.
We would like to thank Rene Richter for his dedicated commitment during the development of this work and the PSI workshop in providing the infrastructure for part fabrication. We would also like to thank Liwei Wang and Yandong Tong for their advice on PTR and AMS data analysis, respectively. We also appreciate the supervision of Julia Schmale, which helped in the implementation of this development. Lastly, thanks to Felipe Lopez-Hilfiker and Veronika Pospíšilová for the discussions during the initial stage of this development.
This research has been supported by the Horizon 2020 (PSI-FELLOW-II-3i (grant no. 701647) and EUROCHAMP-2020 (grant no. 730997)) and the Schweizerischer Nationalfonds zur Förderung der Wissenschaftlichen Forschung (grant nos. 200020_172602 and BSSGI0_155846).
This paper was edited by Bin Yuan and reviewed by two anonymous referees.
Bertram, T. H., Kimmel, J. R., Crisp, T. A., Ryder, O. S., Yatavelli, R. L. N., Thornton, J. A., Cubison, M. J., Gonin, M., and Worsnop, D. R.: A field-deployable, chemical ionization time-of-flight mass spectrometer, Atmos. Meas. Tech., 4, 1471–1479, https://doi.org/10.5194/amt-4-1471-2011, 2011.
Breitenlechner, M., Fischer, L., Hainer, M., Heinritzi, M., Curtius, J., and Hansel, A.: PTR3: An Instrument for Studying the Lifecycle of Reactive Organic Carbon in the Atmosphere, Anal. Chem., 89, 5824–5831, https://doi.org/10.1021/acs.analchem.6b05110, 2017.
Brown, W. L., Day, D. A., Stark, H., Pagonis, D., Krechmer, J. E., Liu, X., Price, D. J., Katz, E. F., DeCarlo, P. F., Masoud, C. G., Wang, D. S., Hildebrandt Ruiz, L., Arata, C., Lunderberg, D. M., Goldstein, A. H., Farmer, D. K., Vance, M. E., and Jimenez, J. L.: Real-time organic aerosol chemical speciation in the indoor environment using extractive electrospray ionization mass spectrometry, Indoor Air, 31, 141–155, https://doi.org/10.1111/ina.12721, 2021.
Brüggemann, M., Karu, E., Stelzer, T., and Hoffmann, T.: Real-time analysis of ambient organic aerosols using aerosol flowing atmospheric-pressure afterglow mass spectrometry (AeroFAPA-MS), Environ. Sci. Technol., 49, 5571–5578, https://doi.org/10.1021/es506186c, 2015.
Burnett, R., Chen, H., Szyszkowicz, M., Fann, N., Hubbell, B., Pope, C. A., Apte, J. S., Brauer, M., Cohen, A., Weichenthal, S., Coggins, J., Di, Q., Brunekreef, B., Frostad, J., Lim, S. S., Kan, H., Walker, K. D., Thurston, G. D., Hayes, R. B., Lim, C. C., Turner, M. C., Jerrett, M., Krewski, D., Gapstur, S. M., Diver, W. R., Ostro, B., Goldberg, D., Crouse, D. L., Martin, R. V., Peters, P., Pinault, L., Tjepkema, M., Van Donkelaar, A., Villeneuve, P. J., Miller, A. B., Yin, P., Zhou, M., Wang, L., Janssen, N. A. H., Marra, M., Atkinson, R. W., Tsang, H., Thach, T. Q., Cannon, J. B., Allen, R. T., Hart, J. E., Laden, F., Cesaroni, G., Forastiere, F., Weinmayr, G., Jaensch, A., Nagel, G., Concin, H., and Spadaro, J. V.: Global estimates of mortality associated with longterm exposure to outdoor fine particulate matter, P. Natl. Acad. Sci. USA, 115, 9592–9597, https://doi.org/10.1073/pnas.1803222115, 2018.
Cohen, A. J., Brauer, M., Burnett, R., Anderson, H. R., Frostad, J., Estep, K., Balakrishnan, K., Brunekreef, B., Dandona, L., Dandona, R., Feigin, V., Freedman, G., Hubbell, B., Jobling, A., Kan, H., Knibbs, L., Liu, Y., Martin, R., Morawska, L., Pope, C. A., Shin, H., Straif, K., Shaddick, G., Thomas, M., van Dingenen, R., van Donkelaar, A., Vos, T., Murray, C. J. L., and Forouzanfar, M. H.: Estimates and 25-year trends of the global burden of disease attributable to ambient air pollution: an analysis of data from the Global Burden of Diseases Study 2015, Lancet, 389, 1907–1918, https://doi.org/10.1016/S0140-6736(17)30505-6, 2017.
Deming, B. L., Pagonis, D., Liu, X., Day, D. A., Talukdar, R., Krechmer, J. E., de Gouw, J. A., Jimenez, J. L., and Ziemann, P. J.: Measurements of delays of gas-phase compounds in a wide variety of tubing materials due to gas–wall interactions, Atmos. Meas. Tech., 12, 3453–3461, https://doi.org/10.5194/amt-12-3453-2019, 2019.
Donahue, N. M., Epstein, S. A., Pandis, S. N., and Robinson, A. L.: A two-dimensional volatility basis set: 1. organic-aerosol mixing thermodynamics, Atmos. Chem. Phys., 11, 3303–3318, https://doi.org/10.5194/acp-11-3303-2011, 2011.
Donahue, N. M., Kroll, J. H., Pandis, S. N., and Robinson, A. L.: A two-dimensional volatility basis set – Part 2: Diagnostics of organic-aerosol evolution, Atmos. Chem. Phys., 12, 615–634, https://doi.org/10.5194/acp-12-615-2012, 2012.
Ehn, M., Junninen, H., Petäjä, T., Kurtén, T., Kerminen, V.-M., Schobesberger, S., Manninen, H. E., Ortega, I. K., Vehkamäki, H., Kulmala, M., and Worsnop, D. R.: Composition and temporal behavior of ambient ions in the boreal forest, Atmos. Chem. Phys., 10, 8513–8530, https://doi.org/10.5194/acp-10-8513-2010, 2010.
Eichler, P., Müller, M., D'Anna, B., and Wisthaler, A.: A novel inlet system for online chemical analysis of semi-volatile submicron particulate matter, Atmos. Meas. Tech., 8, 1353–1360, https://doi.org/10.5194/amt-8-1353-2015, 2015.
Eisele, F. L. and Tanner, D. J.: Measurement of the gas phase concentration of H2SO4 and methane sulfonic acid and estimates of H2SO4 production and loss in the atmosphere, J. Geophys. Res., 98, 9001–9010, https://doi.org/10.1029/93JD00031, 1993.
Fuller, E. N., Schettler, P. D., and Giddings, J. C.: A new method for prediction of binary gas-phase diffusion coefficients, Ind. Eng. Chem., 58, 18–27, https://doi.org/10.1021/ie50677a007, 1966.
Giannoukos, S., Lee, C. P., Tarik, M., Ludwig, C., Biollaz, S., Lamkaddam, H., Baltensperger, U., Henry Prevot, A. S., and Slowik, J.: Real-Time Detection of Aerosol Metals Using Online Extractive Electrospray Ionization Mass Spectrometry, Anal. Chem., 92, 1316–1325, https://doi.org/10.1021/acs.analchem.9b04480, 2020.
Graus, M., Müller, M., and Hansel, A.: High Resolution PTR-TOF: Quantification and Formula Confirmation of VOC in Real Time, J. Am. Soc. Mass Spectrom., 21, 1037–1044, https://doi.org/10.1016/J.JASMS.2010.02.006, 2010.
Hansel, A., Jordan, A., Warneke, C., Holzinger, R., Wisthaler, A., and Lindinger, W.: Proton-transfer-reaction mass spectrometry (PTR-MS): On-line monitoring of volatile organic compounds at volume mixing ratios of a few pptv, Plasma Sources Sci. T., 8, 332–336, https://doi.org/10.1088/0963-0252/8/2/314, 1999.
Hoffmann, T., Huang, R. J., and Kalberer, M.: Atmospheric analytical chemistry, Anal. Chem., 83, 4649–4664, https://doi.org/10.1021/ac2010718, 2011.
Holzinger, R., Williams, J., Herrmann, F., Lelieveld, J., Donahue, N. M., and Röckmann, T.: Aerosol analysis using a Thermal-Desorption Proton-Transfer-Reaction Mass Spectrometer (TD-PTR-MS): a new approach to study processing of organic aerosols, Atmos. Chem. Phys., 10, 2257–2267, https://doi.org/10.5194/acp-10-2257-2010, 2010.
Jayne, J. T., Leard, D. C., Zhang, X., Davidovits, P., Smith, K. A., Kolb, C. E., and Worsnop, D. R.: Development of an aerosol mass spectrometer for size and composition analysis of submicron particles, Aerosol Sci. Tech., 33, 49–70, https://doi.org/10.1080/027868200410840, 2000.
Jokinen, T., Sipilä, M., Junninen, H., Ehn, M., Lönn, G., Hakala, J., Petäjä, T., Mauldin III, R. L., Kulmala, M., and Worsnop, D. R.: Atmospheric sulphuric acid and neutral cluster measurements using CI-APi-TOF, Atmos. Chem. Phys., 12, 4117–4125, https://doi.org/10.5194/acp-12-4117-2012, 2012.
Kruve, A., Kaupmees, K., Liigand, J., Oss, M., and Leito, I.: Sodium adduct formation efficiency in ESI source, J. Mass Spectrom., 48, 695–702, https://doi.org/10.1002/jms.3218, 2013.
Kumbhani, S., Longin, T., Wingen, L. M., Kidd, C., Perraud, V., and Finlayson-Pitts, B. J.: New Mechanism of Extractive Electrospray Ionization Mass Spectrometry for Heterogeneous Solid Particles, Anal. Chem., 90, 2055–2062, https://doi.org/10.1021/acs.analchem.7b04164, 2018.
Lamkaddam, H., Dommen, J., Ranjithkumar, A., Gordon, H., Wehrle, G., Krechmer, J., Majluf, F., Salionov, D., Schmale, J., Bjelić, S., Carslaw, K. S., El Haddad, I., and Baltensperger, U.: Large contribution to secondary organic aerosol from isoprene cloud chemistry, Sci. Adv., 7, eabe2952, https://doi.org/10.1126/sciadv.abe2952, 2021.
Law, W. S., Wang, R., Hu, B., Berchtold, C., Meier, L., Chen, H., and Zenobi, R.: On the mechanism of extractive electrospray ionization, Anal. Chem., 82, 4494–4500, https://doi.org/10.1021/ac100390t, 2010.
Lee, C. P., Riva, M., Wang, D., Tomaz, S., Li, D., Perrier, S., Slowik, J. G., Bourgain, F., Schmale, J., Prevot, A. S. H., Baltensperger, U., George, C., and El Haddad, I.: Online Aerosol Chemical Characterization by Extractive Electrospray Ionization-Ultrahigh-Resolution Mass Spectrometry (EESI-Orbitrap), Environ. Sci. Technol., 54, 3871–3880, https://doi.org/10.1021/acs.est.9b07090, 2020.
Lee, C. P., Surdu, M., Bell, D. M., Lamkaddam, H., Wang, M., Ataei, F., Hofbauer, V., Lopez, B., Donahue, N. M., Dommen, J., Prevot, A. S. H., Slowik, J. G., Wang, D., Baltensperger, U., and El Haddad, I.: Effects of aerosol size and coating thickness on the molecular detection using extractive electrospray ionization, Atmos. Meas. Tech., 14, 5913–5923, https://doi.org/10.5194/amt-14-5913-2021, 2021a.
Lee, C. P., Surdu, M., Bell, D. M., Dommen, J., Xiao, M., Zhou, X., Baccarini, A., Giannoukos, S., Wehrle, G., Schneider, P. A., Prevot, A. S. H., Slowik, J. G., Lamkaddam, H., Wang, D., Baltensperger, U., and El Haddad, I.: High-Frequency Gaseous and Particulate Chemical Characterization using Extractive Electrospray Ionization Mass Spectrometry (Dual-Phase-EESI-TOF), Version 2, Zenodo [data set], https://doi.org/10.5281/zenodo.6634695, 2021b.
Liu, X., Deming, B., Pagonis, D., Day, D. A., Palm, B. B., Talukdar, R., Roberts, J. M., Veres, P. R., Krechmer, J. E., Thornton, J. A., de Gouw, J. A., Ziemann, P. J., and Jimenez, J. L.: Effects of gas–wall interactions on measurements of semivolatile compounds and small polar molecules, Atmos. Meas. Tech., 12, 3137–3149, https://doi.org/10.5194/amt-12-3137-2019, 2019.
Lopez-Hilfiker, F. D., Mohr, C., Ehn, M., Rubach, F., Kleist, E., Wildt, J., Mentel, Th. F., Lutz, A., Hallquist, M., Worsnop, D., and Thornton, J. A.: A novel method for online analysis of gas and particle composition: description and evaluation of a Filter Inlet for Gases and AEROsols (FIGAERO), Atmos. Meas. Tech., 7, 983–1001, https://doi.org/10.5194/amt-7-983-2014, 2014.
Lopez-Hilfiker, F. D., Pospisilova, V., Huang, W., Kalberer, M., Mohr, C., Stefenelli, G., Thornton, J. A., Baltensperger, U., Prevot, A. S. H., and Slowik, J. G.: An extractive electrospray ionization time-of-flight mass spectrometer (EESI-TOF) for online measurement of atmospheric aerosol particles, Atmos. Meas. Tech., 12, 4867–4886, https://doi.org/10.5194/amt-12-4867-2019, 2019.
Mayhew, A. W., Topping, D. O., and Hamilton, J. F.: New Approach Combining Molecular Fingerprints and Machine Learning to Estimate Relative Ionization E ffi ciency in Electrospray Ionization, ACS Omega, 5, 9510–9516, https://doi.org/10.1021/acsomega.0c00732, 2020.
Meier, L., Schmid, S., Berchtold, C., and Zenobi, R.: Contribution of liquid-phase and gas-phase ionization in extractive electrospray ionization mass spectrometry of primary amines, Eur. J. Mass Spectrom., 17, 345–351, https://doi.org/10.1255/ejms.1146, 2011.
Molteni, U., Bianchi, F., Klein, F., El Haddad, I., Frege, C., Rossi, M. J., Dommen, J., and Baltensperger, U.: Formation of highly oxygenated organic molecules from aromatic compounds, Atmos. Chem. Phys., 18, 1909–1921, https://doi.org/10.5194/acp-18-1909-2018, 2018.
Müller, M., Eichler, P., D'Anna, B., Tan, W., and Wisthaler, A.: Direct Sampling and Analysis of Atmospheric Particulate Organic Matter by Proton-Transfer-Reaction Mass Spectrometry, Anal. Chem., 89, 10889–10897, https://doi.org/10.1021/acs.analchem.7b02582, 2017.
Munson, M. S. B. and Field, F. H.: Chemical Ionization Mass Spectrometry. I. General Introduction, J. Am. Chem. Soc., 88, 2621–2630, https://doi.org/10.1021/ja00964a001, 1966.
Noble, C. A. and Prather, K. A.: Real-time measurement of correlated size and composition profiles of individual atmospheric aerosol particles, Environ. Sci. Technol., 30, 2667–2680, https://doi.org/10.1021/es950669j, 1996.
Nozière, B., Kalberer, M., Claeys, M., Allan, J., D'Anna, B., Decesari, S., Finessi, E., Glasius, M., Grgić, I., Hamilton, J. F., Hoffmann, T., Iinuma, Y., Jaoui, M., Kahnt, A., Kampf, C. J., Kourtchev, I., Maenhaut, W., Marsden, N., Saarikoski, S., Schnelle-Kreis, J., Surratt, J. D., Szidat, S., Szmigielski, R., and Wisthaler, A.: The Molecular Identification of Organic Compounds in the Atmosphere: State of the Art and Challenges, Chem. Rev., 115, 3919–3983, https://doi.org/10.1021/cr5003485, 2015.
Pagonis, D., Krechmer, J. E., de Gouw, J., Jimenez, J. L., and Ziemann, P. J.: Effects of gas–wall partitioning in Teflon tubing and instrumentation on time-resolved measurements of gas-phase organic compounds, Atmos. Meas. Tech., 10, 4687–4696, https://doi.org/10.5194/amt-10-4687-2017, 2017.
Pankow, J. F. and Asher, W. E.: SIMPOL.1: a simple group contribution method for predicting vapor pressures and enthalpies of vaporization of multifunctional organic compounds, Atmos. Chem. Phys., 8, 2773–2796, https://doi.org/10.5194/acp-8-2773-2008, 2008.
Pratt, K. A. and Prather, K. A.: Mass spectrometry of atmospheric aerosols – Recent developments and applications. Part I: Off-line mass spectrometry techniques, Mass Spectrom. Rev., 31, 1–16, https://doi.org/10.1002/mas.20322, 2012.
Qi, L., Chen, M., Stefenelli, G., Pospisilova, V., Tong, Y., Bertrand, A., Hueglin, C., Ge, X., Baltensperger, U., Prévôt, A. S. H., and Slowik, J. G.: Organic aerosol source apportionment in Zurich using an extractive electrospray ionization time-of-flight mass spectrometer (EESI-TOF-MS) – Part 2: Biomass burning influences in winter, Atmos. Chem. Phys., 19, 8037–8062, https://doi.org/10.5194/acp-19-8037-2019, 2019.
Riva, M., Rantala, P., Krechmer, J. E., Peräkylä, O., Zhang, Y., Heikkinen, L., Garmash, O., Yan, C., Kulmala, M., Worsnop, D., and Ehn, M.: Evaluating the performance of five different chemical ionization techniques for detecting gaseous oxygenated organic species, Atmos. Meas. Tech., 12, 2403–2421, https://doi.org/10.5194/amt-12-2403-2019, 2019.
Rovelli, G., Jacobs, M. I., Willis, M. D., Rapf, R. J., Prophet, A. M., and Wilson, K. R.: A critical analysis of electrospray techniques for the determination of accelerated rates and mechanisms of chemical reactions in droplets, Chem. Sci., 11, 13026–13043, https://doi.org/10.1039/d0sc04611f, 2020.
Seinfeld, J. H. and Pandis, S. N. (Eds.): Atmospheric Chemistry and Physics: From Air Pollution to Climate Change, 3rd edn., Wiley-Interscience, Hoboken, ISBN: 978-1-119-22117-3, 2016.
Stark, H., Yatavelli, R. L. N., Thompson, S. L., Kang, H., Krechmer, J. E., Kimmel, J. R., Palm, B. B., Hu, W., Hayes, P. L., Day, D. A., Campuzano-Jost, P., Canagaratna, M. R., Jayne, J. T., Worsnop, D. R., and Jimenez, J. L.: Impact of Thermal Decomposition on Thermal Desorption Instruments: Advantage of Thermogram Analysis for Quantifying Volatility Distributions of Organic Species, Environ. Sci. Tech., 51, 8491–8500, https://doi.org/10.1021/acs.est.7b00160, 2017.
Stefenelli, G., Pospisilova, V., Lopez-Hilfiker, F. D., Daellenbach, K. R., Hüglin, C., Tong, Y., Baltensperger, U., Prévôt, A. S. H., and Slowik, J. G.: Organic aerosol source apportionment in Zurich using an extractive electrospray ionization time-of-flight mass spectrometer (EESI-TOF-MS) – Part 1: Biogenic influences and day–night chemistry in summer , Atmos. Chem. Phys., 19, 14825–14848, https://doi.org/10.5194/acp-19-14825-2019, 2019.
Surdu, M., Pospisilova, V., Xiao, M., Wang, M., Mentler, B., Simon, M., Stolzenburg, D., Hoyle, C. R., Bell, D. M., Lee, C. P., Lamkaddam, H., Lopez-Hilfiker, F., Ahonen, L. R., Amorim, A., Baccarini, A., Chen, D., Dada, L., Duplissy, J., Finkenzeller, H., He, X.-C., Hofbauer, V., Kim, C., Kürten, A., Kvashnin, A., Lehtipalo, K., Makhmutov, V., Molteni, U., Nie, W., Onnela, A., Petäjä, T., Quéléver, L. L. J., Tauber, C., Tomé, A., Wagner, R., Yan, C., Prevot, A. S. H., Dommen, J., Donahue, N. M., Hansel, A., Curtius, J., Winkler, P. M., Kulmala, M., Volkamer, R., Flagan, R. C., Kirkby, J., Worsnop, D. R., Slowik, J. G., Wang, D. S., Baltensperger, U., and el Haddad, I.: Molecular characterization of ultrafine particles using extractive electrospray time-of-flight mass spectrometry, Environ. Sci. Atmos., 1, 434–448, https://doi.org/10.1039/d1ea00050k, 2021.
Timkovsky, J., Chan, A. W. H., Dorst, T., Goldstein, A. H., Oyama, B., and Holzinger, R.: Comparison of advanced offline and in situ techniques of organic aerosol composition measurement during the CalNex campaign, Atmos. Meas. Tech., 8, 5177–5187, https://doi.org/10.5194/amt-8-5177-2015, 2015.
Tsiligiannis, E., Hammes, J., Salvador, C. M., Mentel, T. F., and Hallquist, M.: Effect of NOx on 1,3,5-trimethylbenzene (TMB) oxidation product distribution and particle formation, Atmos. Chem. Phys., 19, 15073–15086, https://doi.org/10.5194/acp-19-15073-2019, 2019.
Vaden, T. D., Imre, D., Beránek, J., Shrivastava, M., and Zelenyuk, A.: Evaporation kinetics and phase of laboratory and ambient secondary organic aerosol, P. Natl. Acad. Sci. USA, 108, 2190–2195, https://doi.org/10.1073/pnas.1013391108, 2011.
Verkouteren, R. M., Gillen, G., and Taylor, D. W.: Piezoelectric trace vapor calibrator, Rev. Sci. Instrum., 77, 085104, https://doi.org/10.1063/1.2236109, 2006.
Voisin, D., Smith, J. N., Sakurai, H., McMurry, P. H., and Eisele, F. L.: Thermal desorption chemical ionization mass spectrometer for ultrafine particle chemical composition, Aerosol Sci. Tech., 37, 471–475, https://doi.org/10.1080/02786820300959, 2003.
Wagner, A. C., Bergen, A., Brilke, S., Fuchs, C., Ernst, M., Hoker, J., Heinritzi, M., Simon, M., Bühner, B., Curtius, J., and Kürten, A.: Size-resolved online chemical analysis of nanoaerosol particles: a thermal desorption differential mobility analyzer coupled to a chemical ionization time-of-flight mass spectrometer, Atmos. Meas. Tech., 11, 5489–5506, https://doi.org/10.5194/amt-11-5489-2018, 2018.
Wang, D. S., Lee, C. P., Krechmer, J. E., Majluf, F., Tong, Y., Canagaratna, M. R., Schmale, J., Prévôt, A. S. H., Baltensperger, U., Dommen, J., El Haddad, I., Slowik, J. G., and Bell, D. M.: Constraining the response factors of an extractive electrospray ionization mass spectrometer for near-molecular aerosol speciation, Atmos. Meas. Tech., 14, 6955–6972, https://doi.org/10.5194/amt-14-6955-2021, 2021.
Wang, R., Gröhn, A. J., Zhu, L., Dietiker, R., Wegner, K., Günther, D., and Zenobi, R.: On the mechanism of extractive electrospray ionization (EESI) in the dual-spray configuration, Anal. Bioanal. Chem., 402, 2633–2643, https://doi.org/10.1007/s00216-011-5471-8, 2012.
Wingen, L. M. and Finlayson-Pitts, B. J.: Probing surfaces of atmospherically relevant organic particles by easy ambient sonic-spray ionization mass spectrometry (EASI-MS), Chem. Sci., 10, 884–897, https://doi.org/10.1039/c8sc03851a, 2019.
Wu, C., Siems, W. F., and Hill, H. H.: Secondary electrospray ionization ion mobility spectrometry/mass spectrometry of illicit drugs, Anal. Chem., 72, 396–403, https://doi.org/10.1021/ac9907235, 2000.
Yatavelli, R. L. N. and Thornton, J. A.: Particulate organic matter detection using a micro-orifice volatilization impactor coupled to a chemical ionization mass spectrometer (MOVI-CIMS), Aerosol Sci. Tech., 44, 61–74, https://doi.org/10.1080/02786820903380233, 2010.
Yatavelli, R. L. N., Lopez-Hilfiker, F., Wargo, J. D., Kimmel, J. R., Cubison, M. J., Bertram, T. H., Jimenez, J. L., Gonin, M., Worsnop, D. R., and Thornton, J. A.: A chemical ionization high-resolution time-of-flight mass spectrometer coupled to a micro orifice volatilization impactor (MOVI-HRToF-CIMS) for analysis of gas and particle-phase organic species, Aerosol Sci. Tech., 46, 1313–1327, https://doi.org/10.1080/02786826.2012.712236, 2012.
Yatavelli, R. L. N., Stark, H., Thompson, S. L., Kimmel, J. R., Cubison, M. J., Day, D. A., Campuzano-Jost, P., Palm, B. B., Hodzic, A., Thornton, J. A., Jayne, J. T., Worsnop, D. R., and Jimenez, J. L.: Semicontinuous measurements of gas–particle partitioning of organic acids in a ponderosa pine forest using a MOVI-HRToF-CIMS, Atmos. Chem. Phys., 14, 1527–1546, https://doi.org/10.5194/acp-14-1527-2014, 2014.
Zhang, X., McVay, R. C., Huang, D. D., Dalleska, N. F., Aumont, B., Flagan, R. C., and Seinfeld, J. H.: Formation and evolution of molecular products in α-pinene secondary organic aerosol, Proc. Natl. Acad. Sci. USA, 112, 14168–14173, https://doi.org/10.1073/pnas.1517742112, 2015.
Zhao, Y., Chan, J. K., Lopez-Hilfiker, F. D., McKeown, M. A., D'Ambro, E. L., Slowik, J. G., Riffell, J. A., and Thornton, J. A.: An electrospray chemical ionization source for real-time measurement of atmospheric organic and inorganic vapors, Atmos. Meas. Tech., 10, 3609–3625, https://doi.org/10.5194/amt-10-3609-2017, 2017.