the Creative Commons Attribution 4.0 License.
the Creative Commons Attribution 4.0 License.
 | 01 Sep 2022
Characterization of a modified printed optical particle spectrometer for high-frequency and high-precision laboratory and field measurements
Sabin Kasparoglu
Mohammad Maksimul Islam
Nicholas Meskhidze
The printed optical particle spectrometer (POPS) is a lightweight, low-cost instrument for measurements of aerosol number concentrations and size distributions. This work reports on modifications of the Handix Scientific commercial version of the POPS to facilitate its use in multi-instrument aerosol sampling systems. The flow system is modified by replacing the internal pump with a needle valve and a vacuum pump. The instrument is integrated into closed-flow systems by routing the sheath flow from filtered inlet air. A high-precision multichannel analyzer (MCA) card is added to sample the analog pulse signal. The MCA card is polled at 10 Hz frequency using an external data acquisition system and improves upon the count-rate limitation associated with the POPS internal data acquisition system. The times required to change the concentration between 90 % and 10 % and vice versa for a step change in concentration were measured to be 0.17 and 0.41 s at a flow rate of 5 cm3 s−1. This yields a sampling frequency of ∼ 1–2 Hz, below which the amplitude of measured fluctuations is captured with > 70 % efficiency. The modified POPS was integrated into the dual tandem differential mobility analyzer system to explore the coalescence of dimer particles. Results show that the pulse-height response increases upon dimer coalescence. The magnitude of the increase is broadly consistent with the change in light-scattering amplitude predicted by the T-matrix method. It is anticipated that this modified version of the POPS will extend the utilization of the technique for a range of field and laboratory applications.
- Article
(3749 KB) - Full-text XML
- BibTeX
- EndNote


Aerosol particles in the atmosphere are important as they impact climate and human health (Pöschl, 2005). Measurements of the aerosol number concentration and size distribution are critical to understand their effects on human health and the environment (Flagan, 2014) and to help devise strategies that control atmospheric particle population (Väkevä et al., 2000).
Optical particle counters (OPCs) have a long history in aerosol measurement. In OPCs, aerosol flow is passed through a laser beam. The scattered light is collected by a detector and recorded as a voltage pulse (Hinds, 1999). The amplitude of the scattered light signal depends on the size, refractive index, and shape of the particle (Quinten et al., 2001). Modern OPCs are widely used in a variety of applications including measuring the size distribution of ambient aerosols (Burkart et al., 2010; Snider and Petters, 2008), size distributions of ambient aerosols coupled with differential mobility analyzers (DMA) (Stolzenburg et al., 1998), the size of hygroscopically grown particles in humidified aerosols (Sorooshian et al., 2008; Wex et al., 2006), and the number concentration of droplets and ice nucleation particles exiting ice nucleation instrumentation (Kulkarni et al., 2020; Möhler et al., 2021; Wolf et al., 2020). In conjunction with other instruments, the amplitude of the light-scattering signal can also be used to measure aerosol refractive index (Hand and Kreidenweis, 2002; Kiselev et al., 2005; Wex et al., 2009).
Some commercially available OPCs can measure particles down to 60 nm in diameter (Cai et al., 2008; Moore et al., 2021). However, the lower size threshold varies between different instrument designs, with ∼ 100 and ∼ 300 nm being more typical lower size cuts. Accessing lower sizes requires more powerful lasers, and thus units with lower size cuts are generally more expensive. Gao et al. (2016) introduced a printed optical particle spectrometer (POPS) to measure aerosol sizes between ∼ 140 and ∼ 3000 nm. A commercial version of this instrument is now available from Handix Scientific (1613 Prospect Park Way, Suite 100, Fort Collins, Colorado 80525 USA). The POPS is attractive for its relatively low cost, light weight, low power consumption, and ability to access sizes smaller than 200 nm. It has been used in previous studies to obtain vertical profile size distributions on unmanned systems (de Boer et al., 2016, 2018; Creamean et al., 2021; Kezoudi et al., 2021; Mascaut et al., 2022; Telg et al., 2017; Yu et al., 2017), indoor particle size distributions (Boedicker et al., 2021), and other real-time aerosol number size distributions measured during field campaigns (Brock et al., 2019; Liu et al., 2021; Ranjithkumar et al., 2021; Zhang et al., 2019).
The relatively low cost of POPS introduces some limitations. Data acquisition is performed via a single-board computer, which processes a conditioned analog signal from the photomultiplier tube via a digitizer. This hardware is limited by a maximum count rate that makes the instrument unsuitable for measurements with number concentrations exceeding ∼ 2000 cm−3. The commercial version of the instrument saves the data on a MicroSD card. The stored data are in a binary format and can be configured to save single-particle information, including precise time stamps for each beam transit. This, however, makes integration of the POPS into a system with multiple sensors challenging, as time stamps must be kept synchronized across multiple computers. Having a precise time stamp is especially critical in systems that rely on the precise timing of the signals, e.g., for eddy covariance particle flux measurements (Emerson et al., 2018; Farmer et al., 2011). The POPS data acquisition software also provides binned data in a user-selectable number of channels. The default is 16 bins. These data can be streamed to an external computer at 1 Hz time resolution via a standard serial connection. While this allows for integration with other systems, the serial data stream yields data with degraded time and bin resolution. Finally, the instrument is designed as a low-power and lightweight system with a miniature rotary vane pump (Gardner Denver Thomas GmbH, Germany, model G 6/01-K-LCL) regulating the sample flow. This also makes physical integration of the instrument into a closed flow path challenging, especially when there is an appreciable pressure drop in the system, e.g., for tandem DMA–OPC experiments (Park et al., 2008; Sorooshian et al., 2008).
To alleviate these limitations, we modified the commercial version of the POPS by adding a high-resolution external multichannel analyzer (MCA) card and modified the flow path. We present characterization experiments of the modified POPS instrument, including concentration, size, and time responses. In this study, we also demonstrate a new application of the instrument that uses the light-scattering amplitude to detect particle-phase transitions when integrating it into a multi-DMA setup.
2.1 Modified POPS
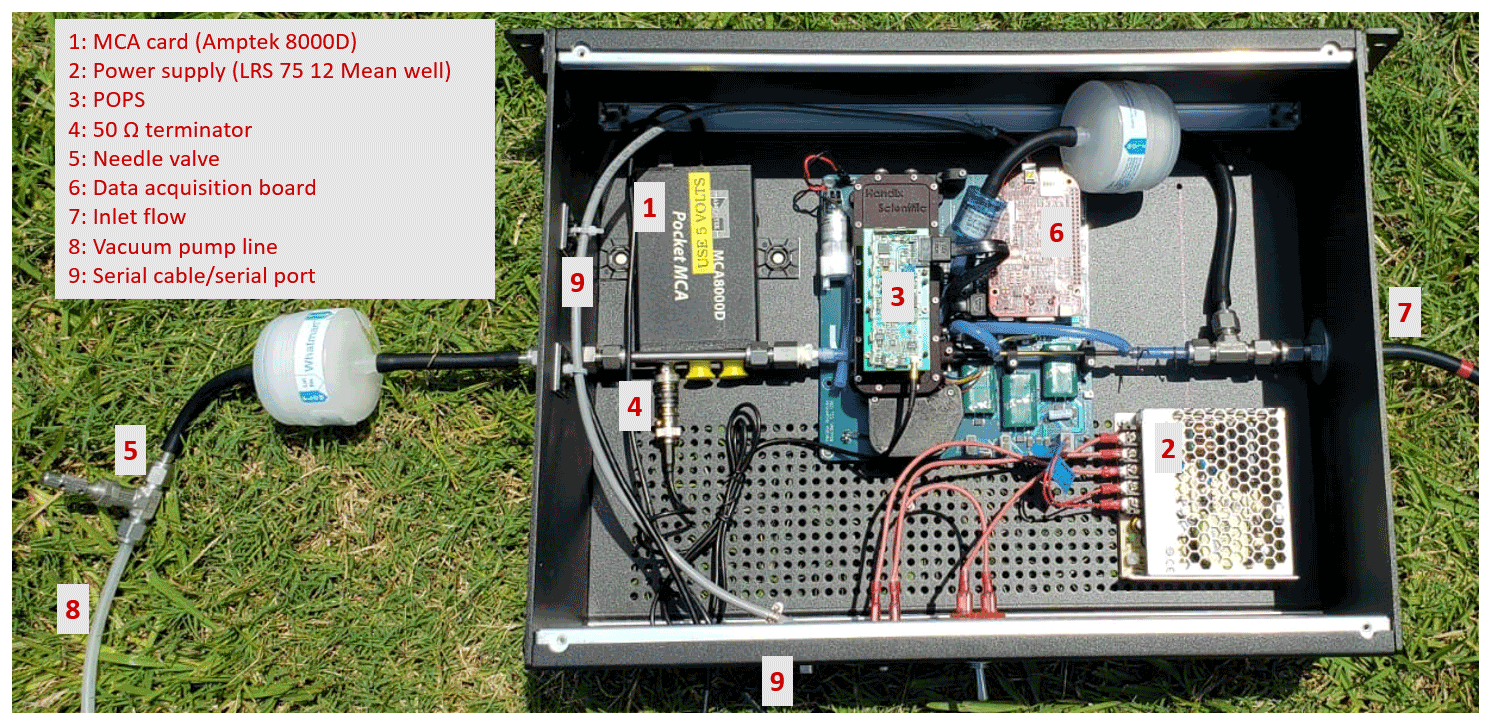
The schematic of the modified POPS is shown in Fig. 1. A photograph of the modified unit is provided in Fig. 2. An MCA card (AMPTEK Inc., 14 DeAngelo Drive, Bedford, MA, USA, model MCA 8000D PA) is interfaced with the analog output of the photomultiplier electronics board. A 50Ω terminator was integrated to reduce electronic noise that was present in the lower MCA channels. The MCA card consists of a preamplifier and a shaping amplifier. The role of the shaping amplifier is to filter noise, to stabilize the baseline, and to provide enough gain for accurate measurement. The card allows configuration for a high gain (0–1 V) and low gain (0–10 V) setting. In this work, the 0–1 V setting was used. The card's electronics generate a calibrated 8191 channel pulse-height count distribution, which is polled at 10 Hz frequency into a custom external data acquisition system. We refer to these data as MCA-PH distributions. Integration over the MCA-PH count distribution and accounting for flow rate yields the MCA-derived number concentration, hereafter denoted “MCA concentration”. This system simultaneously records data from the serial stream provided by the POPS internal data acquisition system at 1 Hz resolution. These data provide a time series of measured sample flow rate and manufacturer binned count histograms of the size distribution at 16 bin resolution. Integration over the count size distribution histogram yields the serial-signal-derived number concentration, hereafter referred to as “serial concentration”. In addition, the POPS computer digitizes the photomultiplier tube (PMT) signal and extracts peak information on a particle-by-particle basis. The instrument was configured to save single-particle data onto an external disk in binary format. After completion of an experiment, the data are extracted to create pulse-height histograms, size distributions, and concentration time series. The pulse-height histograms are binned into 65 535 channels, corresponding to the maximum resolution of the 16-bit digitizer card used in the instrument (Gao et al., 2016). We refer to these data as digitizer-PH distributions. Integration over the digitizer-PH count distribution and accounting for flow rate yields digitizer-derived number concentration, hereafter denoted as “digitizer concentration”. The three data streams are merged based on the continually monitored time offset between the two computers' clocks.
In the original instrument design, the sheath flow is taken from the ambient air. Here it is split from a total inlet to facilitate integration into complex flow systems. The original miniature pump is replaced with a needle valve and vacuum pump operated at critical flow conditions. Critical flow refers to conditions in which the flow across the orifice reaches sonic velocity, and further decreases in downstream pressure have no further effect on the volumetric flow rate. This provides flow stability when operating downstream of other instruments. The needle valve is adjusted to achieve the desired sample flow, which is measured using a laminar flow element. The sheath flow rate is not actively controlled. At a sample flow rate of 0.3 L min−1 (5 cm3 s−1), the total flow is ∼ 0.9 L min−1. All tests were performed at a sample flow rate of 0.3 L min−1.
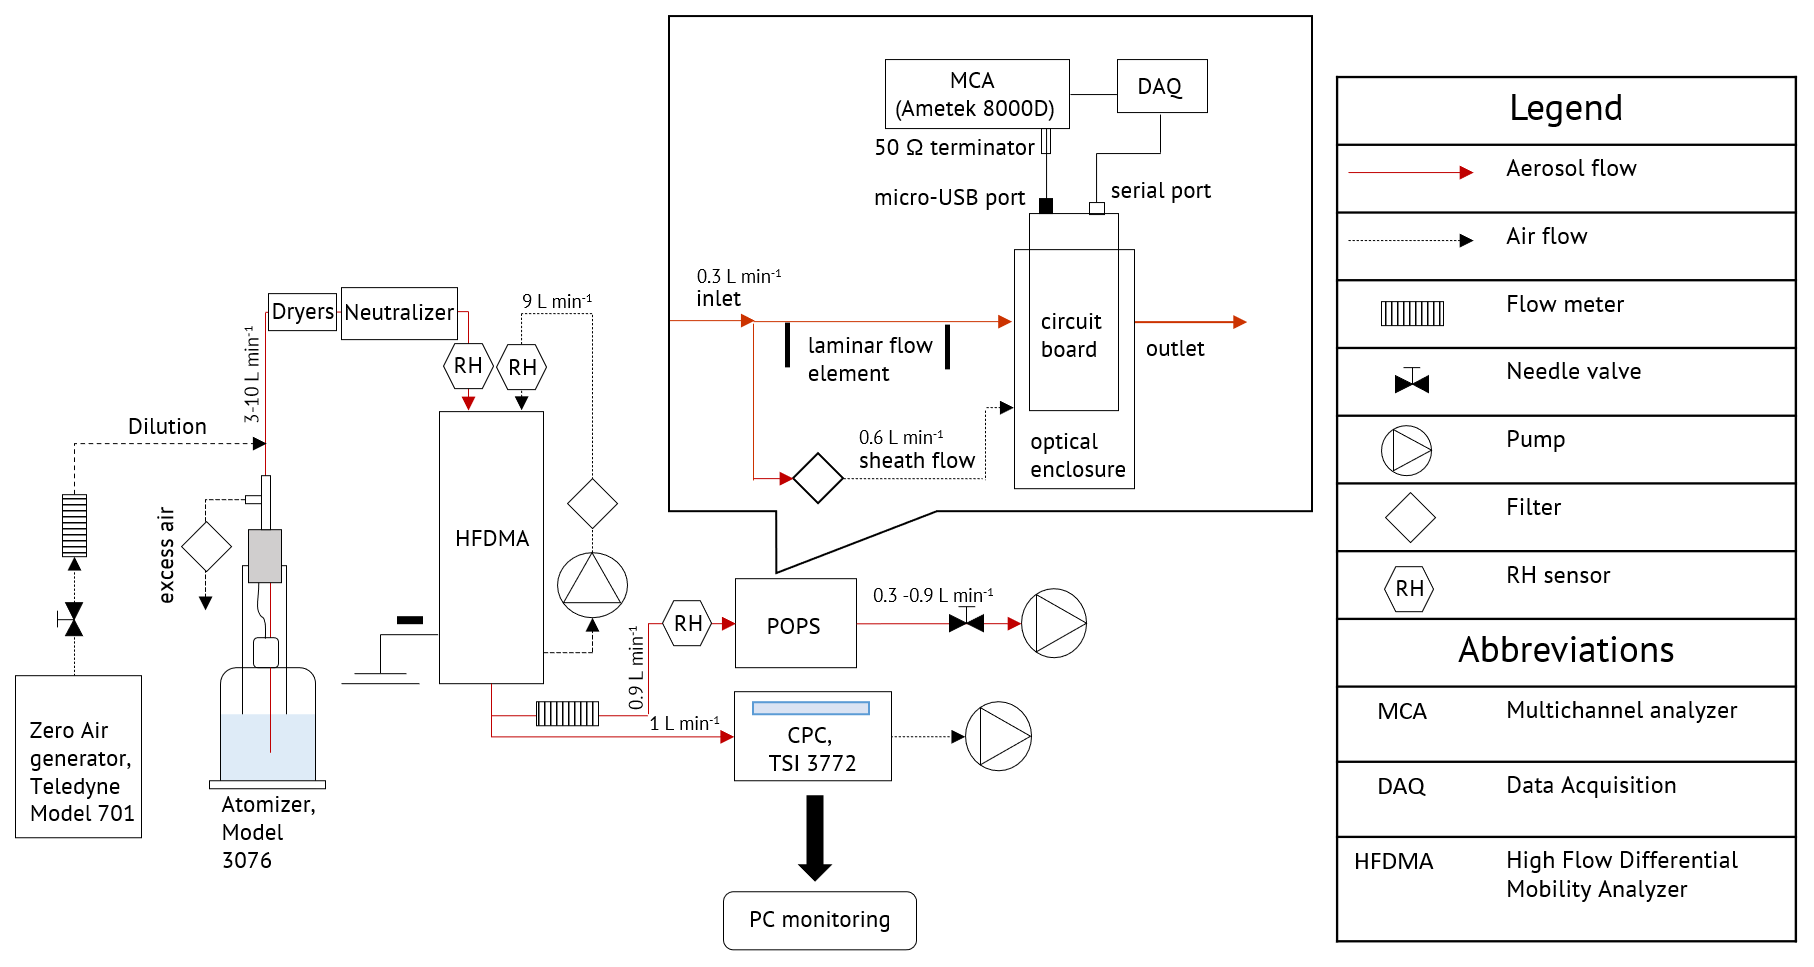
Figure 1Schematic of the modified POPS instrument and size-resolved characterization experiments.
2.2 Concentration and size response
The responses of the digitizer-PH and MCA-PH data were characterized downstream of a DMA. A schematic of the setup is shown in Fig. 3. The DMA consisted of a high-flow column (Stolzenburg et al., 1998) operated at 9 L min−1 sheath flow. Particles were taken either from laboratory air or from atomized solutions (TSI Inc. model 3076, Shoreview, MN, USA). Atomized particles were dried to <25 % relative humidity (RH) using four or five silica-gel driers in series. At RH <25 % the water content for organic particles such as sucrose is negligible (Power et al., 2013). Ammonium sulfate is effloresced at RH <40 % and thus contains no water. Particles were neutralized using either 210Po or an X-ray neutralizer (TSI Inc. model 3088). A condensation particle counter (TSI Inc. model 3772) was placed in parallel to the POPS to measure the particle concentration (see Fig. 1). The concentration from the condensation particle counter (CPC) was taken from the serial data stream, which includes a coincidence correction by the manufacturer. The MCA concentration was corrected for coincidence using the method by Collins et al. (2013) and assuming a beam transit time of 5 µs. No coincidence correction was performed for the digitizer concentration since this data stream produces a concentration error that is primarily due to electronic limitations.
For size response characterization, the number concentration of particles visible to the POPS was controlled to be <1000 cm−3 to avoid saturation of the digitizer response signal (Gao et al., 2016; Mei et al., 2020). The bin resolution of the digitizer-PH and MCA-PH was reduced to ∼ 500 bins to improve counting statistics and to present the data at the same bin resolution. For each size, counts were accumulated over 2 min, and the resulting pulse-height count histogram was normalized by the maximum value of the histogram.
2.3 Time response characterization
The response of the modified instrument to the instantaneous change in particle number concentration describes the time response (Enroth et al., 2018). Here, the time response was measured by placing a three-way solenoid valve switching between filtered and laboratory air upstream of the POPS inlet. The 90/10 rise and fall time describes the time required for the concentration to change between 10 % and 90 % and between 90 % and 10 % of the value corresponding to a toggle between the ambient air and the filter. Using a resistor–capacitor (RC) circuit as an analog, the 3 dB cut-off frequency can be obtained as 0.35 tr, where tr is the 90/10 rise or fall time in the output signal for the RC low-pass filter system (Andrews, 1999). The 90/10 rise and fall times were determined for the 10 Hz MCA concentration and 1 Hz serial concentration data streams.
2.4 Phase state response
Utilization of the digitizer-PH data for measuring aerosol-phase transitions was tested by integrating the POPS into a dual tandem DMA setup (Kasparoglu et al., 2021; Rothfuss et al., 2019; Rothfuss and Petters, 2016). Briefly, the method uses two DMAs to select particles with the same mobility but using different polarities. The streams are merged into a coagulation chamber. Coagulation events of +1/−1 and +2/−2 charged particles result in charge-neutral dimer particles. Initially these dimer particles consist of touching spheres, and we also refer to those as bispheres. Particles exiting the coagulation chamber are passed through an electrostatic precipitator (Kasparoglu et al., 2022b) to remove all charged particles. Next, particles are passed through a coalescence chamber, which exposes the particles for a fixed time to elevated temperature conditions; this is measured at the outside of the metal chamber. Upon exiting the chamber, the sample is cooled to ambient conditions. This arrests the sintering process, allowing for the observation of partially coalesced particles. If the temperature is sufficiently high, the particles coalesce and transform from a touching bisphere dimer particle into a spherical particle. The sphere-equivalent diameter of a dimer particle after coalescence is , where Dmono is the monomer diameter from which the dimer particle has been formed. The transformation from uncoalesced dimer particles to spherical particles is a change in the particle morphology. The change in morphology is monitored by measuring the mobility diameter using a scanning mobility particle sizer (SMPS) downstream of the coalescence chamber. Here, the objective is to test if the transition from the bisphere to the sphere can be sensed using the modified POPS.
Figure 3 provides an overview of the setup. The detailed setup of the system is described in previous publications (Kasparoglu et al., 2021; Rothfuss and Petters, 2016; S. Petters et al., 2019). Dry and charge-neutralized particles were generated via atomization as described earlier. The upstream DMAs consisted of a high-flow DMA (HFDMA) column (Stolzenburg et al., 1998) that was operated at 9 L min−1 flow with a negative high-voltage power supply and a TSI 3071 column (TSI DMA) that was operated at 5 L min−1 sheath flow with a positive high-voltage power supply. The coagulation chamber consisted of a 50 ft. (15.24 m) long 5/8′′ (1.59 cm) outer diameter copper coil. The coalescence chamber consisted of a ∼ 22 cm3 heat exchanger mounted to a thermoelectric heat exchanger. The flow rates through the coagulation and coalescence chamber were 0.5 L min−1. The SMPS downstream of the coalescence chamber consisted of a TSI 3071 column operated at a 3 L min−1 flow rate. In the original version of the instrument, the particle concentration downstream of the SMPS is monitored using a CPC. Here, that CPC was replaced with the modified POPS.
The standard processing of phase transition data from the dual tandem DMA technique is described in detail in previous studies (Rothfuss and Petters, 2016; Kasparoglu et al., 2021, 2022). The mobility distribution is determined by aligning the voltage applied to the SMPS and the number concentration measured by the CPC. The same analysis can be performed by treating the POPS as just a particle counter. The change in the mode mobility diameter is tracked as a function of temperature in the coalescence chamber. The mode diameter decreases when the particle transitions from an uncoalesced dimer particle to a sphere. This is because the drag force acting on the sphere-equivalent particle is less than the drag on the uncoalesced dimer particle. The resulting data on mode mobility diameter versus temperature form a sigmoid curve, with smaller mode diameters occurring at larger temperatures. The midpoint of the transition defines the transition temperature and is determined from a fit to the data. The mapping between transition temperature and viscosity depends on particle size, surface tension, and residence time in the coalescence chamber (Rothfuss and Petters, 2016). The effect of surface tension on the mapping is small (Marsh et al., 2018). Here, the transition temperature corresponds to the condition when viscosity is ∼ 107 Pa s.
In addition to the number concentration data, the POPS also measures the PH data. To track the PH data across the transition from an uncoalesced dimer particle to coalesced sphere, the digitizer-PH was determined at ∼ ±4 % of the mode diameter of the dimer peak. Note that the mobility distribution of the dual tandem DMA is complex and contains multiple modes. Details are given in Petters (2018) and Rothfuss et al. (2019). The primary peak of dimer particles that form from +1/−1 charged particles is identified by its mobility diameter of ∼ 1.26 Dmono. Near the peak of the distribution, interference from particles other than +1/−1 dimers is minimal (see Fig. 7 in Petters, 2018). The range was selected to obtain a sufficient number of counts to construct the PH histogram and to determine the mean PH as a function of temperature. This allows for tracking the light-scattering amplitude as the particle undergoes the transition from an uncoalesced dimer to coalesced sphere. As we will show next, the light-scattering amplitude is predicted to increase for this transition for dimer particles formed from <300 nm diameter monomers.

Figure 3Schematic of the modified POPS instrument integrated into a dual tandem DMA setup. Symbols are as in Fig. 1.
2.5 Light-scattering calculations
Light-scattering amplitudes of spheres and randomly oriented dimer particles were computed using the method and Fortran code developed by Mackowski and Mishenko (Mackowski, 1994; Mishchenko, 1991; Mishchenko and Mackowski, 1994). The computational method is based on the superposition T-matrix approach. The code predicts the scattering-phase function for bispherical particles with diameters D1 and D2. The distance between sphere centers was set such that the spheres are touching. We confirmed that in the limit D2=0 the algorithm converges to the phase function calculated from Mie theory. The phase function for the scattered light intensity, I, was integrated from 38 to 142 degrees for a wavelength of 405 nm. The scattering angles and wavelength correspond to the configuration of the POPS (Gao et al., 2016).

Figure 4The intensity ratio of the uncoalesced bisphere particle and equivalent spherical particle as a function of monomer diameter and refractive index. Each line corresponds to a refractive index i, where n is the real and k is the imaginary part. Colors correspond to variations in n. Solid lines correspond to k=0, and dashed lines correspond to k=0.01.
Figure 4 shows the calculated light intensity ratio of the uncoalesced bisphere particle and equivalent spherical particle as a function of monomer diameter and refractive index. Typically, organics have a refractive index of 1.4–1.7 (Flores et al., 2014; He et al., 2018; Nakayama et al., 2012; Moise et al., 2015), and sea salt has a refractive index of 1.51 (Bi et al., 2018), which span the range of most atmospheric aerosol types (Mico et al., 2019; Shepherd et al., 2018). Some secondary organic aerosol particles from monoterpenes such as limonene, α-humulene, and α-pinene have an imaginary part of the refractive index, k<0.05 (Flores et al., 2014). On the other hand, strongly absorptive material, such as black carbon, has a imaginary part of the refractive index (Pluchino et al., 1980; Bond and Bergstrom, 2006; Janzen, 1979). For monomer particles 300 nm, the intensity is predicted to increase upon coalescence. The magnitude of the increase weakly depends on the real and imaginary part of the refractive index, but the behavior is broadly consistent over the range of the assumed optical properties shown in Fig. 4. For monomer sizes 300 nm, the intensity ratio generally decreases with the monomer diameter. However, the magnitude depends more strongly on the refractive index. As we will show later, the change in scattering intensity can be used to measure the change in particle morphology during particle coalescence.
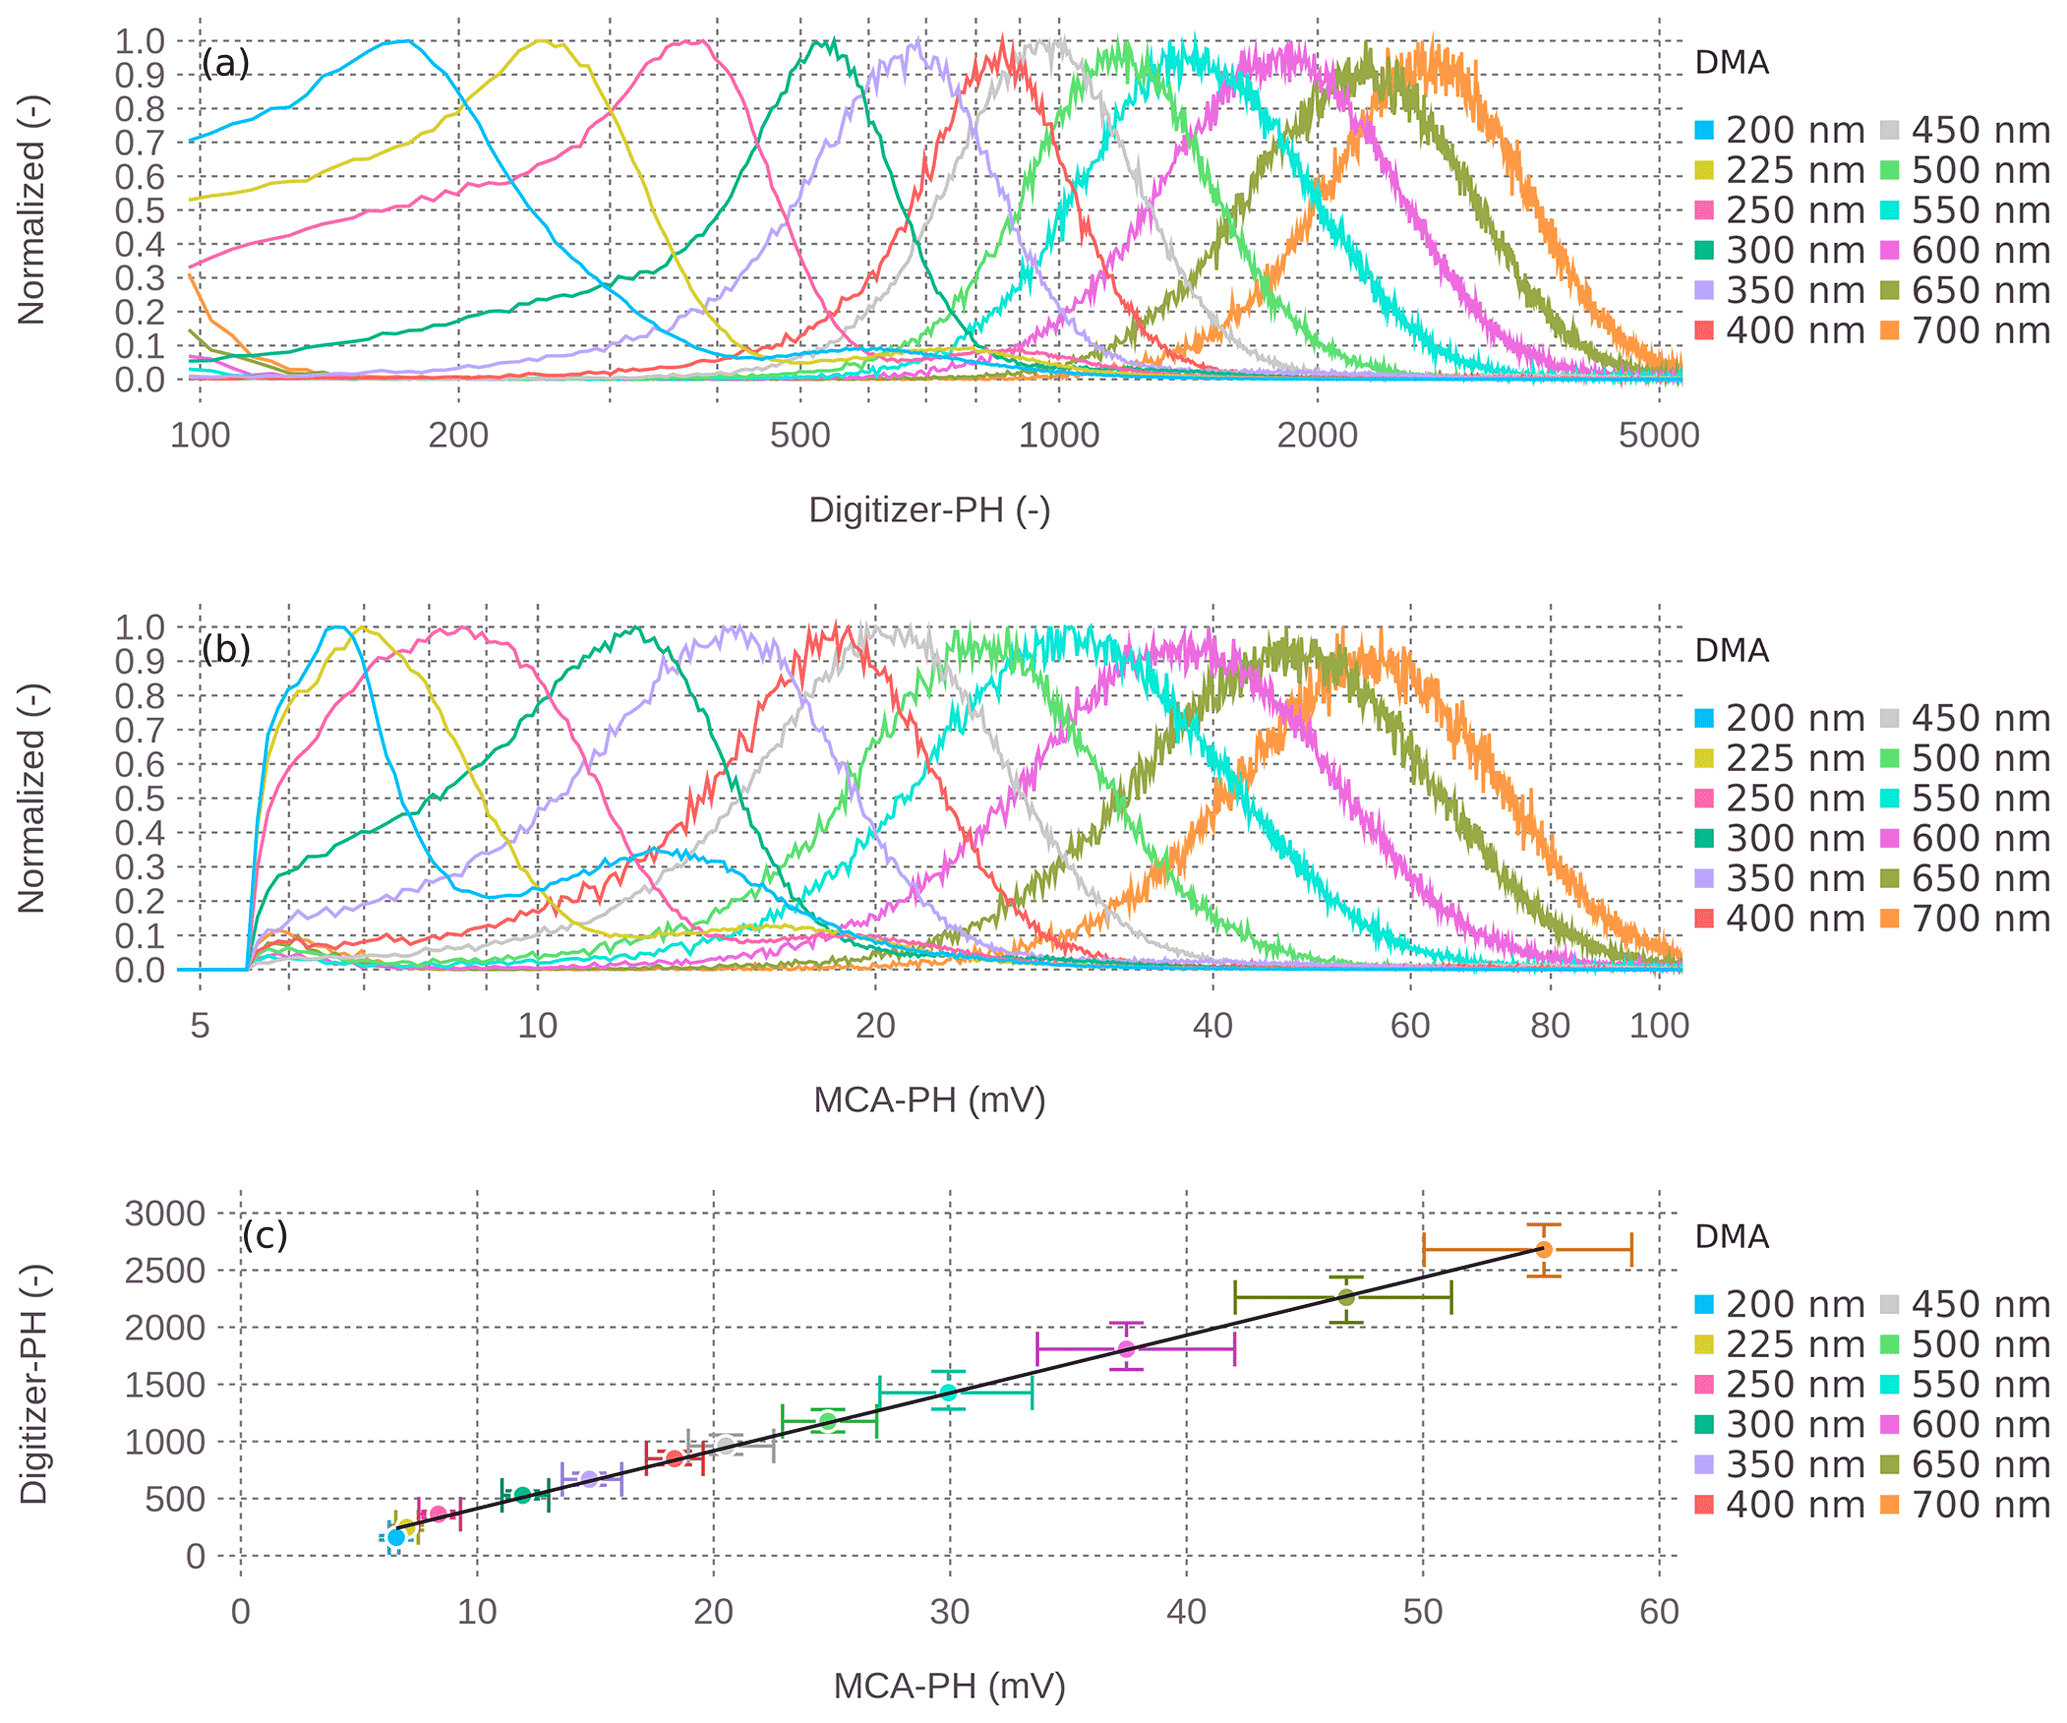
Figure 5(a) Digitizer-PH and (b) MCA-PH histograms for dry size-selected ammonium sulfate particles between 200 and 700 nm. The histograms were normalized such that the largest value equals unity. (c) Comparison of digitizer-PH and MCA-PH at the peak of the histogram. Error bars correspond to the 95 % confidence interval of the mode determined via a curve fit of the data to a lognormal distribution. The line corresponds to linear regression with the equation digitizer-PH = MCA-PH∗50.59–92.57.
3.1 Size response
Figure 5 shows the response of the digitizer-PH and MCA-PH distributions for the mobility of selected dried ammonium sulfate particles. The PH histograms resolve the output distribution of size-classified particles by a DMA. As expected, the mode of both the digitizer-PH and MCA-PH histograms scales with the selected mobility diameter. The dependence of the PH response on refractive index and its scaling with Mie theory have been discussed elsewhere (Gao et al., 2016; Mei et al., 2020), and thus it is not further analyzed here. The 200 to 250 nm particle PH histograms show a shoulder to the right, corresponding to doubly charged particles transmitted by the DMA. Compared to the digitizer-PH, the MCA-PH distribution does not fully resolve the main mode of the 200 nm particle distribution generated by the DMA. Furthermore, the multiply charged particle shoulder appears to be enhanced. However, the main mode is resolved for 225 nm particles. This suggests that the smallest detectable particle size is slightly larger than 200 nm for the MCA-PH mode of data acquisition. The data show that the MCA-PH and digitizer-PH are strongly correlated for diameters greater than 250 nm. Deviations for the smaller sizes are due to the drop in detection efficiency of the MCA-PH distribution. We attribute these to the treatment of noise and resolution limitations of the MCA card at low signal voltages.
3.2 Concentration response
Figure 6 shows the comparison between digitizer concentration, MCA concentration, and CPC reference concentration. In these experiments, the concentration was varied using a dilution valve and size-selected particles > 250 nm, corresponding to sizes at which the MCA concentration and digitizer concentration agreed. As reported previously (Gao et al., 2016; Mei et al., 2020), the digitizer concentration strongly deviates for concentrations exceeding 2000 cm−3 and the signal saturates below 5000 cm−3. In contrast, the coincidence-corrected MCA concentration correlates well with the CPC concentration up to 15 000 cm−3. Note that this particular CPC model reports values at concentrations > 10 000 cm−3. However, per manufacturer specification, the optimal performance range is expected to be achieved at <10 000 cm−3. Thus, extending the comparison to even higher concentrations was not possible. However, we expect that higher concentrations can be measured with the MCA-PH POPS without difficulty. The dead time of the MCA card is only 10 ns. At a concentration of 100 000 cm−3 and a flow rate of 5 cm3 s−1, the mean interarrival time is 50 µs, which is orders of magnitude larger than the dead time. Thus, a dead-time correction is not needed and electronic counting limitations are unlikely.
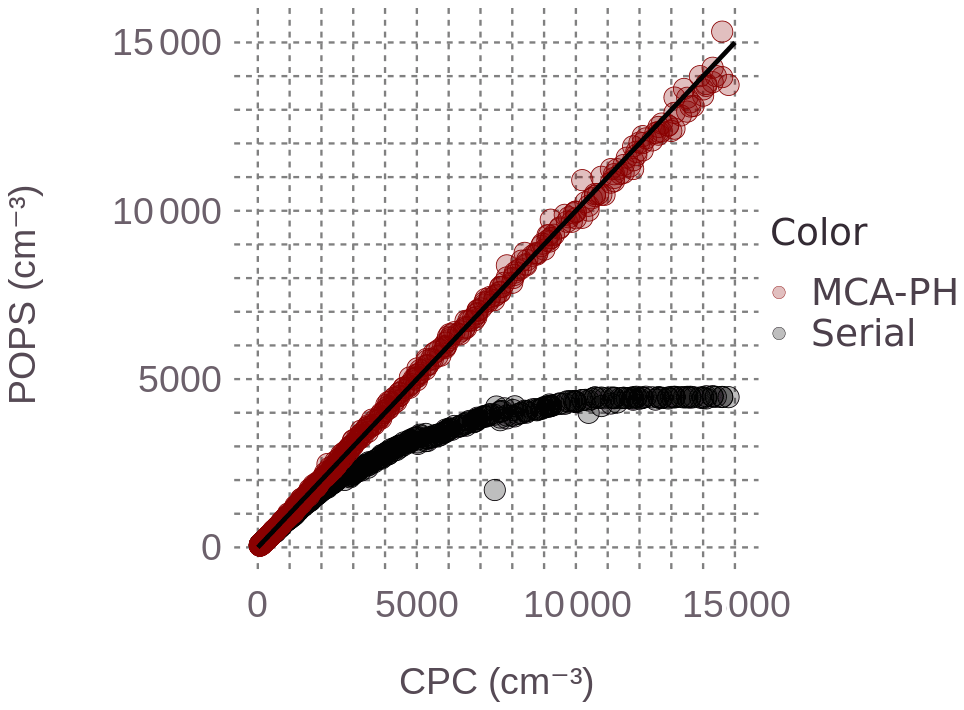
Figure 6Relationship between CPC number concentration and POPS number concentration derived from the serial and MCA-PH distributions. The solid black line corresponds to the 1:1 relationship.
3.3 Time response
Figure 7 shows the measured time response derived from the serial concentration and MCA concentration. Note that the concentration of the MCA-PH stream is lower than that of the serial stream due to the difference in the minimum detected size between the digitizer and the MCA card (Fig. 5). The left panel in Fig. 7 shows multiple toggles between the instrument sampling filter and room air. The right panels in Fig. 7 show zoomed-in versions of a single scan. The rise and fall times averaged by four cycles are 0.17 and 0.41 s for the 10 Hz MCA concentration and 0.81 and 1.44 s for the 1 Hz serial concentration. Multiple data points trace out the time response, especially during the decay. Thus, the actual time response of the instrument is slower than the 10 Hz sample interval. This suggests that the measured response corresponds to the limit imposed by the flow geometry. We did not record the single-particle output for these experiments. However, as we will show next, 10 Hz binned digitizer-PH-derived concentrations have a similar time response as the 10 Hz MCA-derived concentrations.
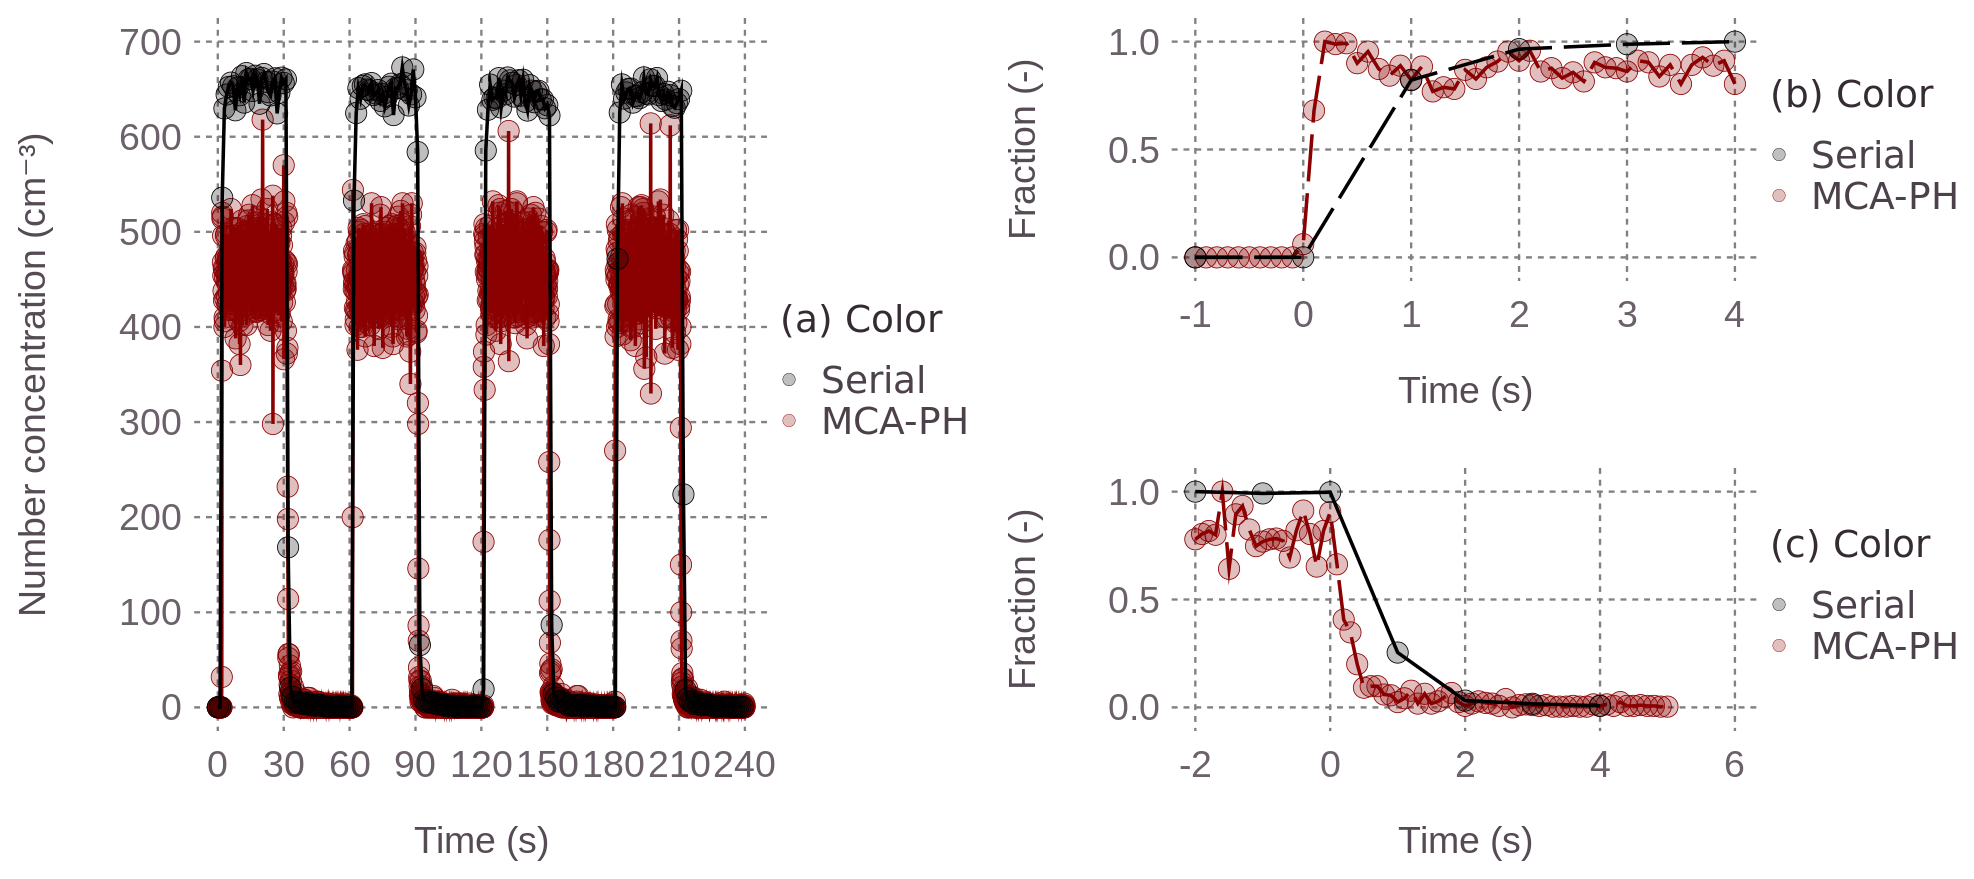
Figure 7(a) Time response curves were measured by the POPS data acquisition system and MCA data acquisition system. Right: zoomed-in view for one example up (b) and down (c) cycle. Time t=0 s corresponds to the valve switch.
3.4 Ambient measurements
Figure 8 summarizes ambient measurements using air sampled from outside the laboratory and air inside the laboratory. The data show that the concentration time series and size distribution reported by the modified POPS serial data stream can be reconstructed from digitizer-PH data. While this closure should be expected, it shows that the digitizer-PH data can be binned at a frequency higher than the manufacturer-selected frequency. At ∼ 9:42:17, the sampling line from the outside was disconnected at the inlet of the POPS, thus simulating a step change similar to the filter toggle test shown in Fig. 7. As shown in the inset of panel (a), the rebinned 10 Hz digitizer-PH concentration time response is equivalent to the 10 Hz MCA-PH response shown in Fig. 7. Reconstructed size distributions for the whole time period are identical between the onboard serial processing and digitizer-PH post-processed distribution as long as the same binning algorithm is used. (The onboard binning algorithm divides the digitizer-PH distribution into 16 logarithmically spaced PH bins between a prescribed minimum and maximum PH.)
The MCA-PH distribution compares reasonably well with the digitizer-PH-derived distribution. Here the MCA-PH distribution is obtained using the linear relationship between MCA-PH and digitizer-PH shown in Fig. 5, followed by applying the digitizer-PH binning algorithm to the calibrated MCA-PH signal. The MCA-PH-derived distribution is in excellent agreement for bins 8–15. There is a discrepancy in channel 16, which is due to the upper limit of the detectable MCA-PH at the high gain setting (0–1 V). Applying the relationship between the pulse height from Fig. 5 implies that the highest equivalent digitizer-PH that can be measured by the MCA card at this setting is 50 399. This contrasts with a maximum digitizer PH by the POPS hardware, which is 65 535. Therefore, the MCA card is missing counts in bin 16 due to signal saturation. The detection efficiency is reduced by 10 %–30 % in bins 4–7, reduced by more than a factor of 10 in bin 3, and zero in bins 1 and 2. This drop-off in counting efficiency is consistent with the observed size response by the MCA-PH compared to the digitizer-PH signal reported in Fig. 5. Importantly, the addition of the MCA still preserves the digitizer-PH output. Thus, the combination of the two may be used to reconstruct the size distribution from the digitizer-PH using post-processing while scaling the concentration using the measured MCA-PH data.
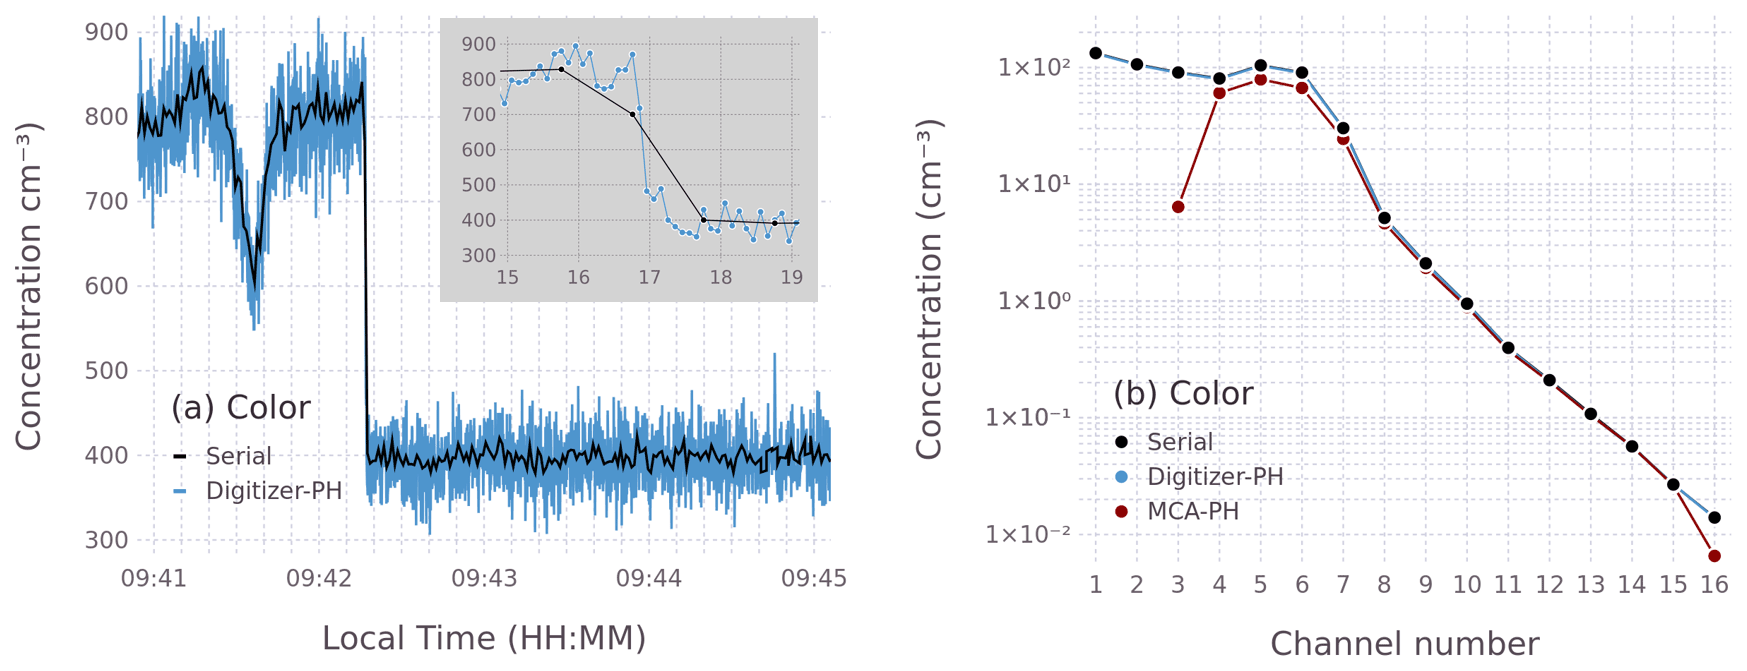
Figure 8(a) Comparison of 1 Hz serial concentration and 10 Hz digitizer concentration. The inset is a magnified view corresponding to the transition between 9:42:15 and 9:42:19. (b) Comparison of the serial distribution, digitizer-PH distribution, and MCA-PH distributions. Serial and digitizer-PH distributions are indistinguishable.
3.5 Phase state detection
Figure 9a shows the change in the mode diameter as a function of increasing the temperature in the coalescence chamber. At ∼ 60 ∘C, the mode diameter starts decreasing with increasing temperature due to the onset of coalescence, which causes particles to become more spherical. At ∼ 72 ∘C, all particles have fully coalesced and no further changes in electrical mobility diameter are observed. Figure 9b shows the measured digitizer-PH at the peak of the mobility distribution. At ∼ 60 ∘C, the scattered light intensity starts to increase. The increase stops at ∼ 72 ∘C when all coalescence is complete. The observed increase is 13 % in scattering intensity, derived from an increase from 305 to 345 in digitizer units. Note that the real parts of the refractive index of glucose and sucrose at 405 nm are ∼ 1.35 (Bodurov et al., 2017) compared to 1.54 for ammonium sulfate used in Fig. 5 (Washenfelder et al., 2013). The observed increase is less than the predicted value of ∼ 20 % by the T-matrix code, possibly due to a combination of measurement uncertainties and slightly irregular shape of the monomers from which the dimer particles are generated. Nevertheless, the data clearly show that the coalescence leads to an increase in scattered light intensity. Thus, this experiment demonstrates how the high-resolution pulse-height data from the modified POPS can be used in laboratory-based research.
We modified the commercial version of the POPS to add an MCA card for data acquisition and to modify the flow path to facilitate integration into complex flow systems. As shown in Fig. 2, the unit was placed inside a 19′′ rackmount enclosure. No effort was made to minimize the height and weight of the enclosure or the power consumption of the unit. The additional power requirement beyond the factory design depends on the vacuum pump. We used an ∼ 400 W model, but smaller pumps will be sufficient. The rackmount form factor is suitable for laboratory and field applications, including measurements from mobile platforms such as vehicles or airplanes where size and weight are less critical than in balloon-borne deployments. The cost to modify the factory-supplied unit was ∼ USD 6500, including the MCA card, enclosure, vacuum pump, needle valve, power supply, Swagelok fittings, electrical connections, and particle filters.
The data presented here show that both the pulse-height data created by the MCA card and single-particle data stored by the onboard computer of the POPS can be used to acquire count histograms at 10 Hz time resolution, while also preserving the native 13-bit and 16-bit bin resolution of the MCA and digitizer hardware. A 10 Hz (100 ms) sampling frequency exceeds the physical time response of the system. The effective measured 10/90 and 90/10 time response is 170 and 410 ms. Using an RC circuit model (Andrews, 1999) and applying the estimate 0.35/tr to determine the 3 dB cut-off frequency, we deduce that fluctuation can be captured with > 70 % efficiency at 1 Hz. However, this cannot be achieved with the POPS standard data output and requires sampling at frequencies > 1 Hz using either the MCA-PH data or post-processing of the single-particle digitizer-PH data at 10 Hz resolution.
For many applications, the digitizer-PH data acquisition is superior to that of the MCA-PH data acquisition. The digitizer data have a better size resolution, resolve to smaller sizes, and have a larger dynamic size range when compared to the MCA data acquisition of the same signal. The digitizer-PH data can be post-processed at 10 Hz frequency while preserving the full resolution of the digitizer-PH response. When combined with time-stamped serial data acquisition, the digitizer-PH data can also be used in an integrated system whose precise timing relies on an external clock. One example is an eddy covariance system, for which time stamps of the sonic anemometer and other sensors must remain tightly synchronized.
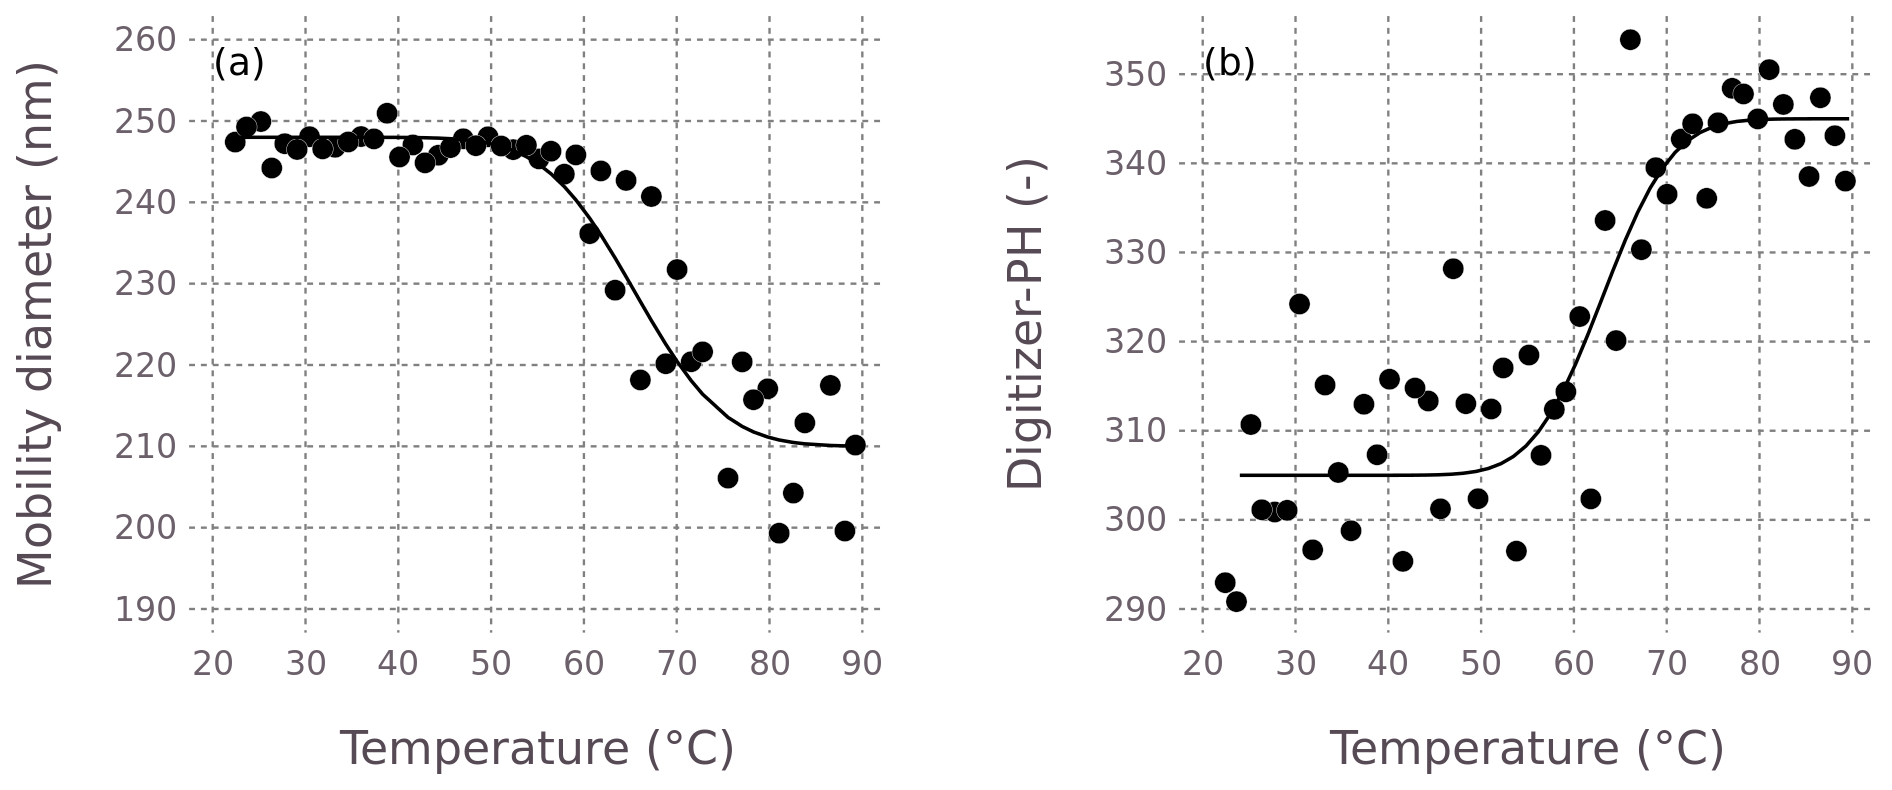
Figure 9The phase transition of bisphere organic particles between 20 and 90 ∘C. Black lines correspond to those of a fitted logistic curve. (a) Phase transition of dimers for the nominal 166 nm glucose–sucrose particles versus temperature. The midpoint of the transition is Tr ± ∘C. (b) Temperature scans of digitizer-PH for the nominal 166 nm glucose–sucrose particles versus temperature. The midpoint of the relaxation is Tr ∘C.
Even though the digitizer-PH has a better size resolution, the MCA mode of data acquisition can be useful for a range of applications. Full-resolution 10 Hz data can be obtained on an external data acquisition system in real time. Unlike the digitizer, the MCA card allows reliable measurement of number concentrations for values exceeding 2000 cm−3 using standard methods of coincidence correction (Collins et al., 2013). This is particularly useful when using the instrument as a detector behind a DMA when working with atomized particles, in which case concentrations may vary by orders of magnitude between 150 nm and 3 µm. Importantly, the addition of the MCA still preserves the digitizer-PH output. Thus, the combination of the two may be used to reconstruct the full size distribution from the digitizer-PH using post-processing while scaling the concentration using the measured MCA-PH data. The combination of real-time processing and the ability to measure high concentrations at high time resolution could also enable the use of the modified POPS system for the spatiotemporal characterization of high-concentration aerosols. This includes, for example, mobile measurements of open combustion near sources or the characterization of volatile electronic cigarette vapors that are not amenable to dilution without causing evaporation (Wright et al., 2016).
As shown in Fig. 5, the full-resolution pulse-height histograms provide detailed information about the size-selected aerosol size distribution. While the utility of the high-resolution PH data is limited in ambient measurements due to an unknown refractive index, these data can be useful in laboratory research. One example shown here is the use of the POPS to detect phase transitions of bispheric particles to changes in optical properties. As particles transition from a bisphere to a sphere, the scattering signal increases within a certain size range. This increase is readily measured by the modified POPS. Based on our data we estimate that relative changes in scattering intensity of ±2 %–3 % can be resolved with the digitizer-PH signal.
Scripts and data used to generate the figures presented herein are available via Zenodo (Kasparoglu et al., 2022a).
MDP conceptualized the study. NM and MDP were responsible for funding acquisition. SK and MMI performed the experiments and analyzed the data. MDP performed the T-matrix simulations. SK and MDP wrote the initial draft. All authors commented on the paper.
The contact author has declared that none of the authors has any competing interests.
Publisher's note: Copernicus Publications remains neutral with regard to jurisdictional claims in published maps and institutional affiliations.
We thank Gavin McMeeking and Bryan Rainwater at Handix Scientific for their help with interpreting the raw POPS data.
This research has been supported by the U.S. Department of Energy (grant nos. DE-SC0018265 and DE-SC0021074).
This paper was edited by Mingjin Tang and reviewed by three anonymous referees.
Andrews, J. R.: Low-Pass Risetime Filters for Time Domain Applications, Piscosecond Pulse Labs, Boulder, CO, 1–6, 1999.
Bi, L., Lin, W., Wang, Z., Tang, X., Zhang, X., and Yi, B.: Optical Modeling of Sea Salt Aerosols: The Effects of Nonsphericity and Inhomogeneity, J. Geophys. Res.-Atmos., 123, 543–558, https://doi.org/10.1002/2017JD027869, 2018.
Bodurov, I., Vlaeva, I., Viraneva, A., and Yovcheva, T.: Discrimination of sweeteners based on the refractometric analysis, J. Phys. Conf. Ser., 794, 012033, https://doi.org/10.1088/1742-6596/794/1/012033, 2017.
Boedicker, E. K., Emerson, E. W., McMeeking, G. R., Patel, S., Vance, M. E., and Farmer, D. K.: Fates and spatial variations of accumulation mode particles in a multi-zone indoor environment during the HOMEChem campaign, Environ. Sci. Process. Impacts, 23, 1029–1039, https://doi.org/10.1039/D1EM00087J, 2021.
Bond, T. C. and Bergstrom, R. W.: Light Absorption by Carbonaceous Particles: An Investigative Review, Aerosol Sci. Technol., 40, 27–67, https://doi.org/10.1080/02786820500421521, 2006.
Brock, C. A., Williamson, C., Kupc, A., Froyd, K. D., Erdesz, F., Wagner, N., Richardson, M., Schwarz, J. P., Gao, R.-S., Katich, J. M., Campuzano-Jost, P., Nault, B. A., Schroder, J. C., Jimenez, J. L., Weinzierl, B., Dollner, M., Bui, T., and Murphy, D. M.: Aerosol size distributions during the Atmospheric Tomography Mission (ATom): methods, uncertainties, and data products, Atmos. Meas. Tech., 12, 3081–3099, https://doi.org/10.5194/amt-12-3081-2019, 2019.
Burkart, J., Steiner, G., Reischl, G., Moshammer, H., Neuberger, M., and Hitzenberger, R.: Characterizing the performance of two optical particle counters (Grimm OPC1.108 and OPC1.109) under urban aerosol conditions, J. Aerosol Sci., 41, 953–962, https://doi.org/10.1016/j.jaerosci.2010.07.007, 2010.
Cai, Y., Montague, D. C., Mooiweer-Bryan, W., and Deshler, T.: Performance characteristics of the ultra high sensitivity aerosol spectrometer for particles between 55 and 800 nm: Laboratory and field studies, J. Aerosol Sci., 39, 759–769, https://doi.org/10.1016/j.jaerosci.2008.04.007, 2008.
Collins, A. M., Dick, W. D., and Romay, F. J.: A New Coincidence Correction Method for Condensation Particle Counters, Aerosol Sci. Technol., 47, 177–182, https://doi.org/10.1080/02786826.2012.737049, 2013.
Creamean, J. M., de Boer, G., Telg, H., Mei, F., Dexheimer, D., Shupe, M. D., Solomon, A., and McComiskey, A.: Assessing the vertical structure of Arctic aerosols using balloon-borne measurements, Atmos. Chem. Phys., 21, 1737–1757, https://doi.org/10.5194/acp-21-1737-2021, 2021.
de Boer, G., Palo, S., Argrow, B., LoDolce, G., Mack, J., Gao, R.-S., Telg, H., Trussel, C., Fromm, J., Long, C. N., Bland, G., Maslanik, J., Schmid, B., and Hock, T.: The Pilatus unmanned aircraft system for lower atmospheric research, Atmos. Meas. Tech., 9, 1845–1857, https://doi.org/10.5194/amt-9-1845-2016, 2016.
de Boer, G., Ivey, M., Schmid, B., Lawrence, D., Dexheimer, D., Mei, F., Hubbe, J., Bendure, A., Hardesty, J., Shupe, M. D., McComiskey, A., Telg, H., Schmitt, C., Matrosov, S. Y., Brooks, I., Creamean, J., Solomon, A., Turner, D. D., Williams, C., Maahn, M., Argrow, B., Palo, S., Long, C. N., Gao, R.-S., and Mather, J.: A Bird's-Eye View: Development of an Operational ARM Unmanned Aerial Capability for Atmospheric Research in Arctic Alaska, B. Am. Meteorol. Soc., 99, 1197–1212, https://doi.org/10.1175/BAMS-D-17-0156.1, 2018.
Emerson, E. W., Katich, J. M., Schwarz, J. P., McMeeking, G. R., and Farmer, D. K.: Direct Measurements of Dry and Wet Deposition of Black Carbon Over a Grassland, J. Geophys. Res.-Atmos., 123, 12277–12290, https://doi.org/10.1029/2018JD028954, 2018.
Enroth, J., Kangasluoma, J., Korhonen, F., Hering, S., Picard, D., Lewis, G., Attoui, M., and Petäjä, T.: On the time response determination of condensation particle counters, Aerosol Sci. Technol., 52, 778–787, https://doi.org/10.1080/02786826.2018.1460458, 2018.
Farmer, D. K., Kimmel, J. R., Phillips, G., Docherty, K. S., Worsnop, D. R., Sueper, D., Nemitz, E., and Jimenez, J. L.: Eddy covariance measurements with high-resolution time-of-flight aerosol mass spectrometry: a new approach to chemically resolved aerosol fluxes, Atmos. Meas. Tech., 4, 1275–1289, https://doi.org/10.5194/amt-4-1275-2011, 2011.
Flagan, R. C.: Continuous-Flow Differential Mobility Analysis of Nanoparticles and Biomolecules, Annu. Rev. Chem. Biomol. Eng., 5, 255–279, https://doi.org/10.1146/annurev-chembioeng-061312-103316, 2014.
Flores, J. M., Washenfelder, R. A., Adler, G., Lee, H. J., Segev, L., Laskin, J., Laskin, A., Nizkorodov, S. A., Brown, S. S., and Rudich, Y.: Complex refractive indices in the near-ultraviolet spectral region of biogenic secondary organic aerosol aged with ammonia, Phys. Chem. Chem. Phys., 16, 10629–10642, https://doi.org/10.1039/C4CP01009D, 2014.
Gao, R. S., Telg, H., McLaughlin, R. J., Ciciora, S. J., Watts, L. A., Richardson, M. S., Schwarz, J. P., Perring, A. E., Thornberry, T. D., Rollins, A. W., Markovic, M. Z., Bates, T. S., Johnson, J. E., and Fahey, D. W.: A light-weight, high-sensitivity particle spectrometer for PM2.5 aerosol measurements, Aerosol Sci. Technol., 50, 88–99, https://doi.org/10.1080/02786826.2015.1131809, 2016.
Hand, J. L. and Kreidenweis, S. M.: A New Method for Retrieving Particle Refractive Index and Effective Density from Aerosol Size Distribution Data, Aerosol Sci. Technol., 36, 1012–1026, https://doi.org/10.1080/02786820290092276, 2002.
He, Q., Bluvshtein, N., Segev, L., Meidan, D., Flores, J. M., Brown, S. S., Brune, W., and Rudich, Y.: Evolution of the Complex Refractive Index of Secondary Organic Aerosols during Atmospheric Aging, Environ. Sci. Technol., 52, 3456–3465, https://doi.org/10.1021/acs.est.7b05742, 2018.
Hinds, W. C.: Aerosol Technology: Properties, Behavior, and Measurement of Airborne Particles, 2nd ed., John Wiley & Sons, 1999.
Janzen, J.: The refractive index of colloidal carbon, J. Coll. Interf. Sci., 69, 436–447, https://doi.org/10.1016/0021-9797(79)90133-4, 1979.
Kasparoglu, S., Li, Y., Shiraiwa, M., and Petters, M. D.: Toward closure between predicted and observed particle viscosity over a wide range of temperatures and relative humidity, Atmos. Chem. Phys., 21, 1127–1141, https://doi.org/10.5194/acp-21-1127-2021, 2021.
Kasparoglu, S., Islam, M. M., Meskhidze, N., and Petters, M. D.: Dataset for “Characterization of a modified printed optical particle spectrometer for high-frequency and high-precision laboratory and field measurements,” Zenodo [data set], https://doi.org/10.5281/ZENODO.7011077, 2022a.
Kasparoglu, S., Wright, T. P., and Petters, M. D.: Open-hardware design and characterization of an electrostatic aerosol precipitator, HardwareX, 11, e00266, https://doi.org/10.1016/j.ohx.2022.e00266, 2022b.
Kezoudi, M., Keleshis, C., Antoniou, P., Biskos, G., Bronz, M., Constantinides, C., Desservettaz, M., Gao, R.-S., Girdwood, J., Harnetiaux, J., Kandler, K., Leonidou, A., Liu, Y., Lelieveld, J., Marenco, F., Mihalopoulos, N., Močnik, G., Neitola, K., Paris, J.-D., Pikridas, M., Sarda-Esteve, R., Stopford, C., Unga, F., Vrekoussis, M., and Sciare, J.: The Unmanned Systems Research Laboratory (USRL): A New Facility for UAV-Based Atmospheric Observations, Atmos., 12, 1042, https://doi.org/10.3390/atmos12081042, 2021.
Kiselev, A., Wex, H., Stratmann, F., Nadeev, A., and Karpushenko, D.: White-light optical particle spectrometer for in situ measurements of condensational growth of aerosol particles, Appl. Opt., 44, 4693–4701, https://doi.org/10.1364/AO.44.004693, 2005.
Kulkarni, G., Hiranuma, N., Möhler, O., Höhler, K., China, S., Cziczo, D. J., and DeMott, P. J.: A new method for operating a continuous-flow diffusion chamber to investigate immersion freezing: assessment and performance study, Atmos. Meas. Tech., 13, 6631–6643, https://doi.org/10.5194/amt-13-6631-2020, 2020.
Liu, S., Liu, C.-C., Froyd, K. D., Schill, G. P., Murphy, D. M., Bui, T. P., Dean-Day, J. M., Weinzierl, B., Dollner, M., Diskin, G. S., Chen, G., and Gao, R.-S.: Sea spray aerosol concentration modulated by sea surface temperature, P. Natl. Acad. Sci. USA, 118, e2020583118, https://doi.org/10.1073/pnas.2020583118, 2021.
Mackowski, D. W.: Calculation of total cross sections of multiple-sphere clusters, J. Opt. Soc. Am. A, 11, 2851–2861, https://doi.org/10.1364/JOSAA.11.002851, 1994.
Marsh, A., Petters, S. S., Rothfuss, N. E., Rovelli, G., Song, Y. C., Reid, J. P., and Petters, M. D.: Amorphous phase state diagrams and viscosity of ternary aqueous organic/organic and inorganic/organic mixtures, Phys. Chem. Chem. Phys., 20, 15086–15097, https://doi.org/10.1039/C8CP00760H, 2018.
Mascaut, F., Pujol, O., Verreyken, B., Peroni, R., Metzger, J. M., Blarel, L., Podvin, T., Goloub, P., Sellegri, K., Thornberry, T., Duflot, V., Tulet, P., and Brioude, J.: Aerosol characterization in an oceanic context around Reunion Island (AEROMARINE field campaign), Atmos. Environ., 268, 118770, https://doi.org/10.1016/j.atmosenv.2021.118770, 2022.
Mei, F., McMeeking, G., Pekour, M., Gao, R.-S., Kulkarni, G., China, S., Telg, H., Dexheimer, D., Tomlinson, J., and Schmid, B.: Performance Assessment of Portable Optical Particle Spectrometer (POPS), Sensors, 20, 6294, https://doi.org/10.3390/s20216294, 2020.
Mico, S., Deda, A., Tsaousi, E., Alushllari, M., and Pomonis, P.: Complex refractive index of aerosol samples, WOMEN IN PHYSICS: 6th IUPAP International Conference on Women in Physics, Birmingham, UK, 060002, https://doi.org/10.1063/1.5110120, 2019.
Mishchenko, M. I.: Light scattering by randomly oriented axially symmetric particles, J. Opt. Soc. Am. A, 8, 871–882, https://doi.org/10.1364/JOSAA.8.000871, 1991.
Mishchenko, M. I. and Mackowski, D. W.: Light scattering by randomly oriented bispheres, Opt. Lett., 19, 1604–1606, https://doi.org/10.1364/OL.19.001604, 1994.
Möhler, O., Adams, M., Lacher, L., Vogel, F., Nadolny, J., Ullrich, R., Boffo, C., Pfeuffer, T., Hobl, A., Weiß, M., Vepuri, H. S. K., Hiranuma, N., and Murray, B. J.: The Portable Ice Nucleation Experiment (PINE): a new online instrument for laboratory studies and automated long-term field observations of ice-nucleating particles, Atmos. Meas. Tech., 14, 1143–1166, https://doi.org/10.5194/amt-14-1143-2021, 2021.
Moise, T., Flores, J. M., and Rudich, Y.: Optical Properties of Secondary Organic Aerosols and Their Changes by Chemical Processes, Chem. Rev., 115, 4400–4439, https://doi.org/10.1021/cr5005259, 2015.
Moore, R. H., Wiggins, E. B., Ahern, A. T., Zimmerman, S., Montgomery, L., Campuzano Jost, P., Robinson, C. E., Ziemba, L. D., Winstead, E. L., Anderson, B. E., Brock, C. A., Brown, M. D., Chen, G., Crosbie, E. C., Guo, H., Jimenez, J. L., Jordan, C. E., Lyu, M., Nault, B. A., Rothfuss, N. E., Sanchez, K. J., Schueneman, M., Shingler, T. J., Shook, M. A., Thornhill, K. L., Wagner, N. L., and Wang, J.: Sizing response of the Ultra-High Sensitivity Aerosol Spectrometer (UHSAS) and Laser Aerosol Spectrometer (LAS) to changes in submicron aerosol composition and refractive index, Atmos. Meas. Tech., 14, 4517–4542, https://doi.org/10.5194/amt-14-4517-2021, 2021.
Nakayama, T., Sato, K., Matsumi, Y., Imamura, T., Yamazaki, A., and Uchiyama, A.: Wavelength Dependence of Refractive Index of Secondary Organic Aerosols Generated during the Ozonolysis and Photooxidation of α-Pinene, SOLA, 8, 119–123, https://doi.org/10.2151/sola.2012-030, 2012.
Park, K., Dutcher, D., Emery, M., Pagels, J., Sakurai, H., Scheckman, J., Qian, S., Stolzenburg, M. R., Wang, X., Yang, J., and McMurry, P. H.: Tandem Measurements of Aerosol Properties – A Review of Mobility Techniques with Extensions, Aerosol Sci. Technol., 42, 801–816, https://doi.org/10.1080/02786820802339561, 2008.
Petters, M. D.: A language to simplify computation of differential mobility analyzer response functions, Aerosol Sci. Technol., 52, 1437–1451, https://doi.org/10.1080/02786826.2018.1530724, 2018.
Pluchino, A. B., Goldberg, S. S., Dowling, J. M., and Randall, C. M.: Refractive-index measurements of single micron-sized carbon particles, Appl. Opt., 19, 3370, https://doi.org/10.1364/AO.19.003370, 1980.
Pöschl, U.: Atmospheric Aerosols: Composition, Transformation, Climate and Health Effects, Angew. Chem. Int. Ed., 44, 7520–7540, https://doi.org/10.1002/anie.200501122, 2005.
Power, R. M., Simpson, S. H., Reid, J. P., and Hudson, A. J.: The transition from liquid to solid-like behaviour in ultrahigh viscosity aerosol particles, Chem. Sci., 4, 2597–2604, https://doi.org/10.1039/C3SC50682G, 2013.
Quinten, M., Friehmelt, R., and Ebert, K.-F.: SIZING OF AGGREGATES OF SPHERES BY A WHITE-LIGHT OPTICAL PARTICLE COUNTER WITH 90∘ SCATTERING ANGLE, J. Aerosol Sci., 32, 63–72, https://doi.org/10.1016/S0021-8502(00)00043-4, 2001.
Ranjithkumar, A., Gordon, H., Williamson, C., Rollins, A., Pringle, K., Kupc, A., Abraham, N. L., Brock, C., and Carslaw, K.: Constraints on global aerosol number concentration, SO2 and condensation sink in UKESM1 using ATom measurements, Atmos. Chem. Phys., 21, 4979–5014, https://doi.org/10.5194/acp-21-4979-2021, 2021.
Rothfuss, N. E. and Petters, M. D.: Coalescence-based assessment of aerosol phase state using dimers prepared through a dual-differential mobility analyzer technique, Aerosol Sci. Technol., 50, 1294–1305, https://doi.org/10.1080/02786826.2016.1221050, 2016.
Rothfuss, N. E., Petters, S. S., Champion, W. M., Grieshop, A. P., and Petters, M. D.: Characterization of a Dimer Preparation Method for Nanoscale Organic Aerosol, Aerosol Sci. Technol., 39, 998–1011, https://doi.org/10.1080/02786826.2019.1623379, 2019.
Shepherd, R. H., King, M. D., Marks, A. A., Brough, N., and Ward, A. D.: Determination of the refractive index of insoluble organic extracts from atmospheric aerosol over the visible wavelength range using optical tweezers, Atmos. Chem. Phys., 18, 5235–5252, https://doi.org/10.5194/acp-18-5235-2018, 2018.
Snider, J. R. and Petters, M. D.: Optical particle counter measurement of marine aerosol hygroscopic growth, Atmos. Chem. Phys., 8, 1949–1962, https://doi.org/10.5194/acp-8-1949-2008, 2008.
Sorooshian, A., Hersey, S., Brechtel, F. J., Corless, A., Flagan, R. C., and Seinfeld, J. H.: Rapid, Size-Resolved Aerosol Hygroscopic Growth Measurements: Differential Aerosol Sizing and Hygroscopicity Spectrometer Probe (DASH-SP), Aerosol Sci. Technol., 42, 445–464, https://doi.org/10.1080/02786820802178506, 2008.
S.Petters, S. S., Kreidenweis, S. M., Grieshop, A. P., Ziemann, P. J., and Petters, M. D.: Temperature- and Humidity-Dependent Phase States of Secondary Organic Aerosols, Geophys. Res. Lett., 46, 1005–1013, https://doi.org/10.1029/2018GL080563, 2019.
Stolzenburg, M., Kreisberg, N., and Hering, S.: Atmospheric Size Distributions Measured by Differential Mobility Optical Particle Size Spectrometry, Aerosol Sci. Technol., 29, 402–418, https://doi.org/10.1080/02786829808965579, 1998.
Telg, H., Murphy, D. M., Bates, T. S., Johnson, J. E., Quinn, P. K., Giardi, F., and Gao, R.-S.: A practical set of miniaturized instruments for vertical profiling of aerosol physical properties, Aerosol Sci. Technol., 51, 715–723, https://doi.org/10.1080/02786826.2017.1296103, 2017.
Väkevä, M., Hämeri, K., Puhakka, T., Nilsson, E. D., Hohti, H., and Mäkelä, J. M.: Effects of meteorological processes on aerosol particle size distribution in an urban background area, J. Geophys. Res.-Atmos, 105, 9807–9821, https://doi.org/10.1029/1999JD901143, 2000.
Washenfelder, R. A., Flores, J. M., Brock, C. A., Brown, S. S., and Rudich, Y.: Broadband measurements of aerosol extinction in the ultraviolet spectral region, Atmos. Meas. Tech., 6, 861–877, https://doi.org/10.5194/amt-6-861-2013, 2013.
Wex, H., Kiselev, A., Ziese, M., and Stratmann, F.: Calibration of LACIS as a CCN detector and its use in measuring activation and hygroscopic growth of atmospheric aerosol particles, Atmos. Chem. Phys., 6, 4519–4527, https://doi.org/10.5194/acp-6-4519-2006, 2006.
Wex, H., Petters, M. D., Carrico, C. M., Hallbauer, E., Massling, A., McMeeking, G. R., Poulain, L., Wu, Z., Kreidenweis, S. M., and Stratmann, F.: Towards closing the gap between hygroscopic growth and activation for secondary organic aerosol: Part 1 – Evidence from measurements, Atmos. Chem. Phys., 9, 3987–3997, https://doi.org/10.5194/acp-9-3987-2009, 2009.
Wolf, M. J., Zhang, Y., Zawadowicz, M. A., Goodell, M., Froyd, K., Freney, E., Sellegri, K., Rösch, M., Cui, T., Winter, M., Lacher, L., Axisa, D., DeMott, P. J., Levin, E. J. T., Gute, E., Abbatt, J., Koss, A., Kroll, J. H., Surratt, J. D., and Cziczo, D. J.: A biogenic secondary organic aerosol source of cirrus ice nucleating particles, Nat. Commun., 11, 4834, https://doi.org/10.1038/s41467-020-18424-6, 2020.
Wright, T. P., Song, C., Sears, S., and Petters, M. D.: Thermodynamic and kinetic behavior of glycerol aerosol, Aerosol Sci. Technol., 50, 1385–1396, https://doi.org/10.1080/02786826.2016.1245405, 2016.
Yu, P., Rosenlof, K. H., Liu, S., Telg, H., Thornberry, T. D., Rollins, A. W., Portmann, R. W., Bai, Z., Ray, E. A., Duan, Y., Pan, L. L., Toon, O. B., Bian, J., and Gao, R.-S.: Efficient transport of tropospheric aerosol into the stratosphere via the Asian summer monsoon anticyclone, P. Natl. Acad. Sci. USA, 114, 6972–6977, https://doi.org/10.1073/pnas.1701170114, 2017.
Zhang, J., Wu, X., Liu, S., Bai, Z., Xia, X., Chen, B., Zong, X., and Bian, J.: In situ measurements and backward-trajectory analysis of high-concentration, fine-mode aerosols in the UTLS over the Tibetan Plateau, Environ. Res. Lett., 14, 124068, https://doi.org/10.1088/1748-9326/ab5a9f, 2019.