the Creative Commons Attribution 4.0 License.
the Creative Commons Attribution 4.0 License.
 | 04 Feb 2022
Differential absorption lidar measurements of water vapor by the High Altitude Lidar Observatory (HALO): retrieval framework and first results
Brian J. Carroll
Susan A. Kooi
James E. Collins
Rory A. Barton-Grimley
Anthony Notari
David B. Harper
Joseph Lee
Airborne differential absorption lidar (DIAL) offers a uniquely capable solution to the problem of measuring water vapor (WV) with high precision, accuracy, and resolution throughout the troposphere and lower stratosphere. The High Altitude Lidar Observatory (HALO) airborne WV DIAL was recently developed at NASA Langley Research Center and was first deployed in 2019. It uses four wavelengths near 935 nm to achieve sensitivity over a wide dynamic range and simultaneously employs 1064 nm backscatter and 532 nm high-spectral-resolution lidar (HSRL) measurements for aerosol and cloud profiling. A key component of the WV retrieval framework is flexibly trading resolution for precision to achieve optimal datasets for scientific objectives across scales. An approach to retrieving WV in the lowest few hundred meters of the atmosphere using the strong surface return signal is also presented.
The five maiden flights of the HALO WV DIAL spanned the tropics through midlatitudes with a wide range of atmospheric conditions, but opportunities for validation were sparse. Comparisons to dropsonde WV profiles were qualitatively in good agreement, though statistical analysis was impossible due to systematic error in the dropsonde measurements. Comparison of HALO to in situ WV measurements aboard the aircraft showed no substantial bias across 3 orders of magnitude, despite variance (R2=0.66) that may be largely attributed to spatiotemporal variability. Precipitable water vapor measurements from the spaceborne sounders AIRS and IASI compared very well to HALO with R2>0.96 over ocean.
- Article
(5996 KB) - Full-text XML
- BibTeX
- EndNote


Water vapor (WV) is a key component of the Earth's atmosphere and water cycle, playing major roles in cloud, weather, and climate processes, including radiative balance as the most dominant greenhouse gas (Trenberth et al., 2007). The need for accurate WV measurement across scales is widely recognized, as is the value of remote sensing for providing such measurements with desirable spatiotemporal coverage (Bony et al., 2006, 2015; Sherwood et al., 2010; Teixeira et al., 2021; Wulfmeyer et al., 2015).
Radiosonde networks have long provided the most consistent and extensive in situ WV profile measurements globally, though the operational network is limited by resources and personnel to a finite number of sites, only over land, and two launches per day (Ferreira et al., 2019). Spaceborne passive sounders have the great advantage of daily global coverage, and their column and cloud products are important contributors to operational forecasting and climate research (Wulfmeyer et al., 2015). However, their WV retrieval vertical resolution is roughly 1–2 km at best in the troposphere, and accuracy is closely tied to the observed scene as well as the prior inputs to the retrievals. This makes spaceborne passive sounders incapable of capturing many lower tropospheric, cloud, and planetary boundary layer (PBL) processes relevant on the weather and climate timescales. Measurement techniques with higher spatiotemporal resolution, such as lidars, have become vital to studying WV processes as our understanding improves and more demanding measurement criteria have become prevalent (Wulfmeyer et al., 2015). Due to the challenging nature of developing and deploying airborne lidars, there are not many within the research community. These sparse but capable airborne lidars are complemented with emerging technologies that show promise for enabling dense, low-cost surface-based networks (Nehrir et al., 2012; Spuler et al., 2015, 2021). The mobility of airborne lidar cements it as an important asset for Earth science, able to observe large regions with high precision and resolution, including over oceans where permanent observing networks are impractical.
Two types of lidar are commonly used for atmospheric WV measurements: Raman lidar (e.g., Cooney, 1970; Eichinger et al., 1999; Goldsmith et al., 1998; Leblanc et al., 2012; Philbrick, 1994; Whiteman et al., 1992) and differential absorption lidar (DIAL; e.g., Browell et al., 1998; Ehret et al., 1993; Ferrare et al., 2004; Nehrir et al., 2011, 2017; Späth et al., 2016; Spuler et al., 2021; Wirth et al., 2009). Raman lidar systems provide the advantageous capability of monitoring multiple gas species simultaneously, but this comes at the cost of requiring large, high-peak-power ultraviolet lasers to overcome small Raman scattering cross sections, as well as a need for frequent calibration. DIAL avoids the need for high-peak-power ultraviolet lasers but only measures one species and requires the use of single frequency and frequency-agile pulsed lasers which have been the focus of decades of laser research within the DIAL community. A significant benefit of the DIAL technique that results from the stringent laser transmitter requirements is the lack of a need for external calibration, as this technique relies on the ratio of elastic backscatter signals from a closely spaced wavelength pair, one online and one offline, of a WV absorption line. For nadir-pointing airborne DIAL, WV typically increases with range, and thus the challenges of signal attenuation and limited dynamic range with a single wavelength pair can be overcome by utilizing multiple wavelength pairs distributed along the side of the WV absorption line. The direct, calibration-free measurement of WV profiles with reduction in overall complexity resulting from emerging laser technologies make WV DIAL a unique and important tool for atmospheric studies and well suited for airborne and space-based implementations.
Airborne WV DIAL systems were first employed in the 1980s (Browell, 1983), with subsequent decades of literature documenting advances in the theoretical framework and instrument designs (e.g., Behrendt et al., 2007; Browell et al., 1998; Ehret et al., 1993; Higdon et al., 1994; Ismail and Browell, 1989; Wulfmeyer, 1998) as well as measurements and applications (e.g., Carroll et al., 2021; Ismail et al., 2010; Kiemle et al., 2017; Schäfler et al., 2021; Wakimoto et al., 2006; Wulfmeyer et al., 2006). Two airborne WV DIALs of particular note for this paper are the NASA Langley Research Center (LaRC) Lidar Atmospheric Sensing Experiment (LASE, Moore et al., 1997) and the Deutsches Zentrum für Luft- und Raumfahrt (DLR) airborne WAter vapour Lidar Experiment in Space (WALES) instrument (Wirth et al., 2009). LASE is the predecessor to the focus of this work, the High Altitude Lidar Observatory (HALO) WV DIAL. HALO has similar capabilities to WALES, with simultaneous WV DIAL and high-spectral-resolution lidar (HSRL, Hair et al., 2008) capability for aerosols and clouds; however, HALO's modular design and exploitation of emerging laser and receiver technologies allow for a more compact form factor that permits operation on a wide range of aircraft.
This paper reports on the HALO WV DIAL retrieval framework and measurement capabilities based on its maiden flights in 2019, including comparisons against the other instrumentation that was available. Section 2 describes the field campaign and instruments utilized in this work. Section 3 provides a brief review of WV DIAL principles followed by relevant specifics of HALO's design. Section 4 details the HALO WV retrieval methodology. Section 5 presents comparisons of HALO WV measurements with available in situ instrumentation and spaceborne sounders. Conclusions and future directions are discussed in Sect. 6.
2.1 The NASA Aeolus calibration and validation test flight campaign
The HALO measurements described in this paper were collected during the NASA Aeolus calibration and validation (cal/val) test flight campaign from 17–30 April 2019. The campaign was designed to provide calibration/validation comparisons with the European Space Agency (ESA) spaceborne Doppler wind lidar mission ADM-Aeolus (Stoffelen et al., 2005). The NASA Doppler Aerosol WiNd lidar (DAWN, Kavaya et al., 2014) provided wind profiles for this purpose, and HALO was deployed to validate aerosol measurements via HSRL as well as opportunistically test the WV DIAL capability. Further details of this campaign, including overviews of each flight, are given in Bedka et al. (2021). Data are archived and publicly available online (NASA/LARC/SD/ASDC, 2020).
This campaign consisted of five flights of the NASA DC-8 aircraft: four from the NASA Armstrong Flight Research Center in Palmdale, California, and one from Kona, Hawaii, totaling ∼43 flight hours. These flights were mainly over the northeastern Pacific spanning midlatitudes to the tropics and observing a wide range of atmospheric conditions. There were only a few hours of observations over land. Installed along with HALO and DAWN on the DC-8 was the Diode Laser Hygrometer (DLH, Diskin et al., 2002) to provide in situ WV measurements for comparison with HALO. Dropsondes were also deployed to validate wind and WV measurements. This campaign provided the maiden flights for the HALO WV DIAL configuration, which also employed simultaneous HSRL measurements of aerosols and clouds.
2.2 HALO
The HALO airborne lidar was developed at NASA LaRC to address observational needs in the Earth sciences, specifically focusing on atmospheric dynamics, composition, radiation, and the carbon cycle, in addition to serving as a technology test bed for a future spaceborne DIAL. HALO has a modular design with the capability to measure WV or methane mixing ratios via the DIAL technique along with aerosol, cloud, and ocean optical properties via the HSRL technique. This multi-functional design allows any two measurement capabilities simultaneously (i.e., WV DIAL/HSRL, WV DIAL/methane DIAL, or methane DIAL/HSRL) with rapid reconfiguration by using three modular laser transmitters and a single multi-channel, multi-wavelength receiver. Because of its compact design, the instrument can be flown on most research aircraft, including autonomous operation aboard the high-altitude NASA ER-2. The methane DIAL/HSRL configuration has successfully flown in multiple field campaigns (e.g., Davis et al., 2021; Wu et al., 2021). This paper focuses on the WV DIAL retrieval framework and results from its maiden flights during the Aeolus cal/val campaign. Details of the HALO instrument design and performance will follow in an instrument paper.
2.3 Dropsondes
The dropsondes deployed from the DC-8 were expendable digital dropsondes (XDDs) with the Yankee Environmental Systems Inc. High-Definition Sounding System (HDSS). The HDSS and XDDs are presented in full in Black et al. (2017) and will be referred to as sondes in this paper. The pressure, temperature, and humidity measurements were taken at 2 Hz, which is roughly 8 m in vertical resolution. These sondes have been used in previous field campaigns (e.g., Doyle et al., 2017), but the Aeolus cal/val campaign was the first deployment with a new relative humidity sensor. This new sensor was found during the campaign to have a time-lagged response that varied with altitude, leading to large errors in the WV profiles (Bedka et al., 2021). This prevents a typical approach of using sonde measurements to quantitatively validate HALO WV profiles. Only a cursory qualitative comparison is made in Sect. 5. More rigorous comparison to dropsondes will be an objective of future HALO flights.
2.4 DLH
The NASA Langley/Ames DLH (hereafter just DLH) is designed to measure in situ WV in the troposphere and lower stratosphere while flying aboard research aircraft, in this case the NASA DC-8 (Diskin et al., 2002). It reports WV mixing ratio at 1 Hz and is considered to be a community standard for accurate measurements of WV from the upper troposphere and lower stratosphere (UT/LS) down to the surface. The measurement relies on WV absorption of diode laser light in the 1.4 µm spectral region, tuning to either a weak or strong absorption line to accommodate the wide range of WV concentrations in the atmosphere. It uses an open-path double-pass configuration between the laser transceiver inside the DC-8 pointing out a modified window panel and a retroreflecting panel mounted on an outboard engine nacelle. The calibration, algorithm, and validation study by Podolske et al. (2003) found a 1σ error estimate of 3.7 %. This qualifies the DLH as a viable validation instrument for the HALO WV measurements, although conclusions are limited by the instruments' different sampling volumes. Comparisons between HALO and DLH were made in two ways for this study: examining a single spiral descent profile, which was preceded by HALO overpasses, and a more statistically robust near-field comparison throughout the campaign.
2.5 Satellites
The Atmospheric Infrared Sounder (AIRS) and Infrared Atmospheric Sounding Interferometer (IASI) are community standards for spaceborne WV measurement and are used here for comparison to HALO WV products. The AIRS and IASI precipitable water vapor (PWV) products were validated against ground-based measurements by Roman et al. (2016), finding that both satellites generally fell within a 5 % error range, except for very dry (<5 mm) or very moist (>50 mm) regions which tended to have larger wet or dry biases, respectively.
2.5.1 Atmospheric Infrared Sounder (AIRS)
The AIRS instrument aboard the polar-orbiting NASA Aqua satellite retrieves temperature, humidity, and trace gas information with daily global coverage to support weather prediction, study the water and energy cycles, and provide a record of several critical greenhouse gases (Chahine et al., 2006; Le Marshall et al., 2006). The hyperspectral sounder measures infrared radiation from 3.7 to 15 µm in a cross-track scanning pattern with a 13.5 km diameter nadir field of view (FOV), stretching to 22.4 km along track by 41.0 km across track at scan edge.
The AIRS level 2 version 7 data products used in this work (PWV and WV mixing ratio profiles) are derived from three-by-three arrays of AIRS FOVs, and uncertainty estimates are provided with each retrieval (Thrastarson et al., 2020). The AIRS profiles used here are from the support data files which have 100 vertical levels, but it is important to note that the 100 levels represent a much finer resolution than the actual independent information within the profile. AIRS WV vertical resolution is actually limited to 1–2 km at best within the troposphere (Gettelman et al., 2004; Thrastarson et al., 2020; Wong et al., 2015; Wulfmeyer et al., 2015).
2.5.2 Infrared Atmospheric Sounding Interferometer (IASI)
The IASI instrument aboard the polar-orbiting ESA MetOp satellite series is designed to support numerical weather prediction by providing information on temperature, humidity, and some trace gases with global coverage twice per day (e.g., Clerbaux et al., 2009; Hilton et al., 2009, 2012; Klaes et al., 2007). IASI is composed of an imaging system and a Fourier transform spectrometer to analyze infrared spectra between 3.6 and 15.5 µm. IASI scans across track with 30 elementary fields of view (EFOVs), each of which contains a two-by-two grid of four instantaneous fields of view (IFOVs). The IFOV footprint is a circle of 12 km diameter at nadir and an ellipse of 20 km along track by 39 km across track at swath edge. While IASI humidity is reported at up to 101 vertical levels, there are only a maximum of 10 independent pieces of information within the profile, and sensitivity is lowest in the lowest few kilometers of the troposphere.
The IASI data used in this work are the operational level 2 version 6 data for the instrument aboard MetOp-B. The data files report PWV and WV mixing ratio profiles for each IFOV but do not provide associated uncertainties beyond the instrument accuracy requirement of 10 %. To provide some estimate of uncertainty related to spatiotemporal variability in comparison to HALO, the mean and standard deviation of the four IFOV products within a given EFOV were calculated and used here.
3.1 DIAL theory
Derived from the lidar equation, the single-scattering DIAL equation can be written as
where N is the number density of WV (molecules cm−3), r is range from the lidar (cm), Δr is the range cell length over which N is calculated, Δσ is the difference between online and offline absorption cross sections (cm2), λ is the online or offline wavelength as indicated by subscripts, and P is the measured backscatter signal (Schotland, 1974). This dependence on the ratio of online to offline signals yields a direct, calibration-free measurement of WV assuming the following conditions are true: the spectral separation between the on and off wavelengths is small enough to neglect differences in atmospheric transmission properties such that differential attenuation is only due to WV, the spatiotemporal variations in the atmosphere are negligible between the two laser pulses, the pulsed laser exhibits high spectral purity (Ismail and Browell, 1989), Doppler broadening is constant across Δr, and instrument differential transmission is constant within a retrieval (Schotland, 1974). It is also assumed that the WV concentration in the retrieval bin is constant.
In practice, accurate measurements require careful consideration of Δσ calculation, close monitoring of instrument and laser characteristics, and corrections to the measured signals. These sources of error have been presented at length in the literature (e.g., Schotland, 1974; Remsberg and Gordley, 1978; Ismail and Browell, 1989; Wulfmeyer and Bösenberg, 1998), and reproduction is unwarranted here. Some details of implementation with HALO will be discussed further in Sect. 4. We will highlight here the sensitivity of statistical uncertainty to the temporal (or along track) and range resolutions of the DIAL measurement:
where δN is statistical uncertainty in the DIAL measurement of N and Δt is temporal resolution (Ismail and Browell, 1989). This proportionality indicates that the statistical uncertainty of a DIAL measurement can be reduced by decreasing resolution, with greater sensitivity to changes in Δr than Δt. This is caused by Poisson statistics in both dimensions giving the 0.5 exponent and the differential absorption along the path length contributing 1.0 Δr (Eq. 2 in Nehrir et al., 2009; Ismail and Browell, 1989). Equation (2) assumes validity of Poisson sampling statistics for the DIAL system in question, which is typically applicable to photon counting systems but can also be applied to analog detection systems such as HALO via a noise scale factor (NSF, Liu et al., 2006).
Optical depth (OD) is fundamental to the DIAL principle, affecting signal-to-noise ratio and factoring into the δN calculation (Wulfmeyer and Bösenberg, 1998). The OD between range r and r+Δr can be calculated in a very straightforward manner from the DIAL signals:
assuming as in Eq. (1) that online and offline wavelengths are spectrally close enough to have identical transmission except for the absorption due to WV. The one-way OD at the online wavelength increases along the beam path until the signal becomes too attenuated for accurate measurement. The maximum cumulative WV OD up to which an accurate retrieval can be made is dependent on many system parameters such as the detection noise floor and pulse energy, and in practice it is typically in the range 1–2 and for a single range cell 0.01–0.05 (Bösenberg, 1998; Wulfmeyer and Bösenberg, 1998; Remsberg and Gordley, 1978). To meet these criteria, flexibility in selection of online wavelengths and Δr is incorporated into the HALO WV retrieval.
3.2 HALO water vapor DIAL
HALO transmits four wavelengths around 935 nm to cover the large WV dynamic range from the moist surface to the dry UT/LS. These four wavelengths are spread between varying strength absorption features and wings of lines in the 935.5 nm line complex as shown in Fig. 1a, thus providing sensitivity across the wide dynamic range of WV within the troposphere and UT/LS. We refer to the most strongly absorbed HALO wavelength as λ1, progressing sequentially to λ4 as the least-absorbed wavelength. The strong absorption of λ1 makes it an ideal online wavelength in very dry UT/LS, suitable for ∼ 8–20 km altitude range and therefore compatible with high-altitude aircraft such as the ER-2. λ2 follows as the typical online wavelength for the mid-troposphere, and λ3 is chosen for the lower troposphere and PBL. Due to the high variability of lower tropospheric moisture (e.g., tropics versus arctic), λ3 is tunable within a 22 GHz range (0.064 nm) when referenced to λ2. λ4 is offset locked to λ3 and thus tunes in tandem. The details of this tunability and transmitter design will be explored in a subsequent instrument paper.
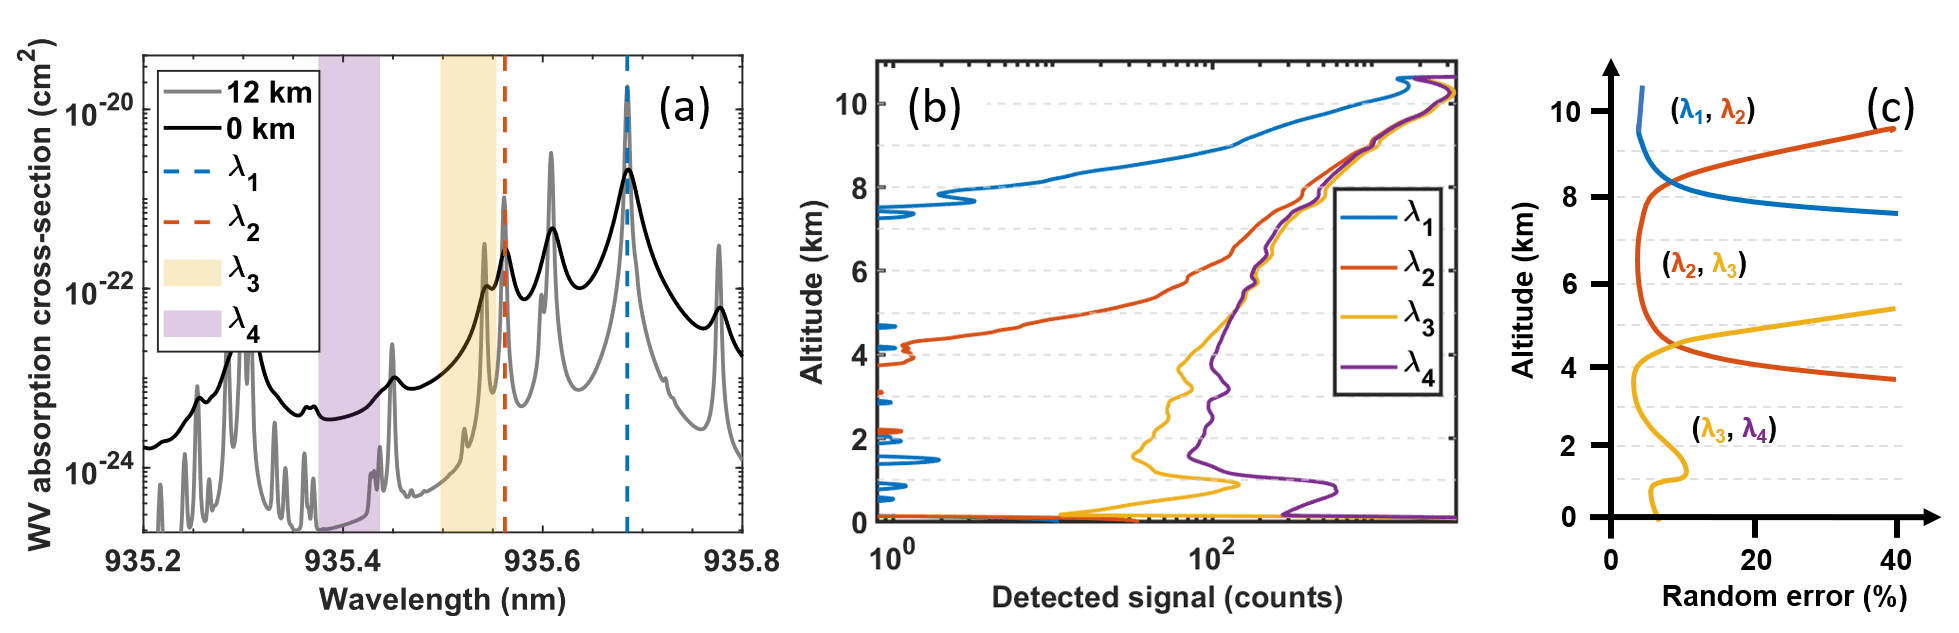
Figure 1(a) Voigt spectrum of WV absorption cross section at 12 km (210 hPa, 22 K) and at sea level (1013 hPa, 300 K), with vertical lines and shading indicating the fixed and tunable HALO wavelengths. (b) Example profile of HALO measured signals for the four transmitted wavelengths, averaged temporally and vertically to match a typical final WV product resolution (60 s temporal, 315 m vertical). (c) Sensitivity of line pairs to different parts of the atmosphere, expressed as an estimation of random error versus altitude. Line pairs are in parentheses as (online, offline). Error magnitudes can change with retrieval resolution, as discussed in Sect. 4.1, though the general line shape versus altitude will remain.
In selecting online and offline pairs for a given DIAL calculation, consecutive wavelengths are used, e.g., λ2 online with λ3 offline. This optimizes accuracy concerning the DIAL equation assumptions by minimizing spectral differences in transmission and minimizes the angular dependence of near-field returns through the narrowband optical filter (Nehrir et al., 2009). Figure 1b shows an example of nadir lidar signals at the four wavelengths, attenuating with increasing range from the aircraft. The increase in signal below 1 km in Fig. 1b is due to enhanced aerosol backscatter within the PBL. Figure 1b also shows the low end of the dynamic range of these channels, with λ1 and λ2 reaching the noise floor around 100 counts. Each wavelength pair is sensitive to the altitude range that has sufficiently high differential absorption optical depth (DAOD) and sufficient online signal strength, which is demonstrated in Fig. 1c. Figure 1c is a manually drawn estimate of the DAOD and Poisson statistics (shot noise) contributions to the WV uncertainty, meant to illustrate the typical sensitivity of each wavelength pair. It should be noted that the plots of Fig. 1b and c will differ from profile to profile based on the vertical distribution and magnitude of the WV profile as well as the aerosol loading and scattering properties within the sampled volume. The precision of the WV DIAL retrieval is also highly dependent on instrument parameters and spatial averaging.
The HALO WV DIAL uses an injection-seeded and frequency-doubled Nd:YAG laser to pump an injection-seeded optical parametric oscillator (OPO) to generate output at 935 nm with 1 KHz pulse repetition frequency (PRF). The 935 nm seed laser and OPO cavity are tuned to switch between the four wavelengths on a shot-by-shot basis. The residual 532 and 1064 nm pulsed energy left over from the OPO conversion process is transmitted collinearly with the 935 nm output to enable simultaneous aerosol/cloud profiling utilizing HSRL (532 nm) and backscatter (1064 nm) techniques, including depolarization measurement at 532 and 1064 nm. The simultaneous WV and HSRL sampling approach employed with HALO is similar to previous work (e.g., Wirth et al., 2009), but the design to utilize a single transmitter for all wavelengths makes HALO a uniquely capable and compact instrument with the ability to support airborne campaigns from a wide range of aircraft optimized for different sampling strategies.
Real-time onboard processing of the 1 KHz PRF signal sums shots at each wavelength to improve the signal-to-noise ratio (SNR) and reduce the data rate to 2 Hz. The data system sampling rate is 120 MHz or 1.25 m in range, but the 935 and 1064 nm channels are limited by the detection chain electrical bandwidth to 15 m vertical resolution. The high vertical resolution allows for oversampling of surface or cloud signals to allow for high-spatial-resolution total and partial WV columns and future cloud retrievals, respectively. To keep the file sizes manageable, the atmospheric signals for all channels are filtered and downsampled to 15 m vertical resolution. Subsequent temporal and vertical averaging of the WV DIAL data is employed to improve the precision of the DIAL retrieval, and this is discussed in further detail in Sect. 4. The 532 nm HSRL detector chain has sufficient bandwidth to maintain 1.25 m vertical resolution; however, the vertical resolution is limited by the 532 nm laser pulse width to ∼3 m. The high vertical resolution will be used for future cloud and ocean profiling measurements, but the atmospheric data shown in this paper are digitally filtered and binned to 15 m vertical resolution in post-processing to increase SNR and match the WV DIAL and 1064 nm data resolution. Working with 15 m resolution for calculating the NSF and all subsequent data products also ensures that data from each vertical bin are uncorrelated (any range correlations are small enough to be negligible.)
The receiver dynamic range is extended by implementing a high and low optical split. Dynamic range is further increased as both optical channels have an adjustable dual-gain (high and low) electronic output. The high-optical, high-electrical gain channel is used for all atmospheric measurements in this paper and will be referred to simply as the “high-gain” channel. The low-optical, high-electrical gain channel is used in surface return calculations and will be referred to as the “low-gain” channel. The other channels are used for diagnostics and will be optimized for measurements in future campaigns.
Some key parameters of the HALO instrument and processing are listed in Table 1 and will be discussed in greater detail below. Another relatively brief summary of HALO WV DIAL was presented in the Aeolus cal/val campaign overview by Bedka et al. (2021), and further technical details will be presented in an instrument paper.
Table 1HALO parameters.
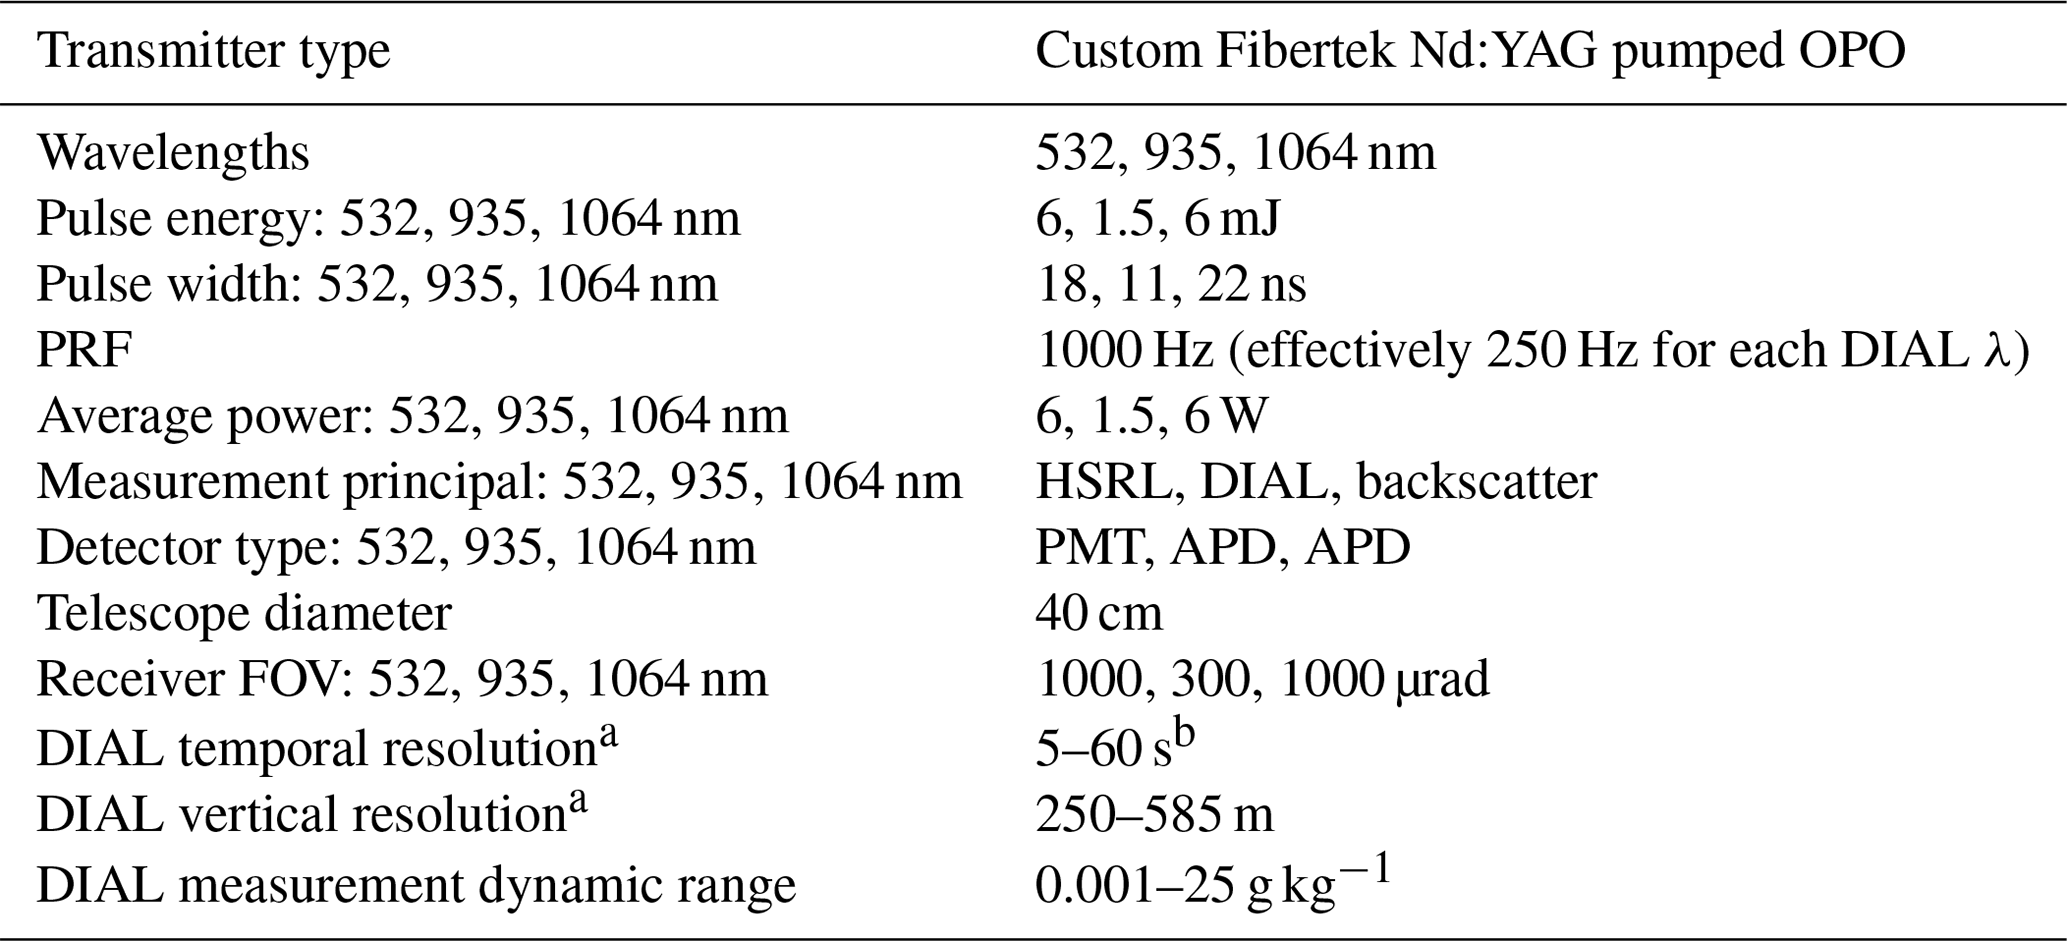
a Resolution is variable, with increasing statistical uncertainty accompanying finer resolutions, as discussed in Sect. 4.1. b For typical NASA DC-8 flight speed, including the data in this paper, this is roughly 1–12 km.
The HALO DIAL data processing and WV calculation are based on the preceding decades of DIAL research within the community and implement heritage techniques developed for HALO's predecessor LASE (e.g., Ismail and Browell, 1989; Moore et al., 1997). This section gives an overview of the HALO WV retrieval, with additional details in subsections where warranted.
Two components of the DIAL equation (Eq. 1) require extensive consideration: the lidar signals and the absorption cross sections. Their treatment is outlined in Fig. 2. First, electronic and atmospheric background signals are removed from the raw lidar signals before digitally filtering and downsampling to 15 m range resolution. Data below cloud top or terrain are then removed based on cloud-top heights (CTHs) identified from HSRL and terrain elevation from the Global Land One-Kilometer Base Elevation (GLOBE, Hastings et al., 1999) digital elevation model, respectively. An additional 45 m back-off is added to both cloud and terrain to account for any spatial heterogeneity within the observation time. High-altitude cirrus clouds are not automatically masked because they are often thin enough to be penetrated. Manual inspection of final datasets is employed for any additional masking that may be necessary.
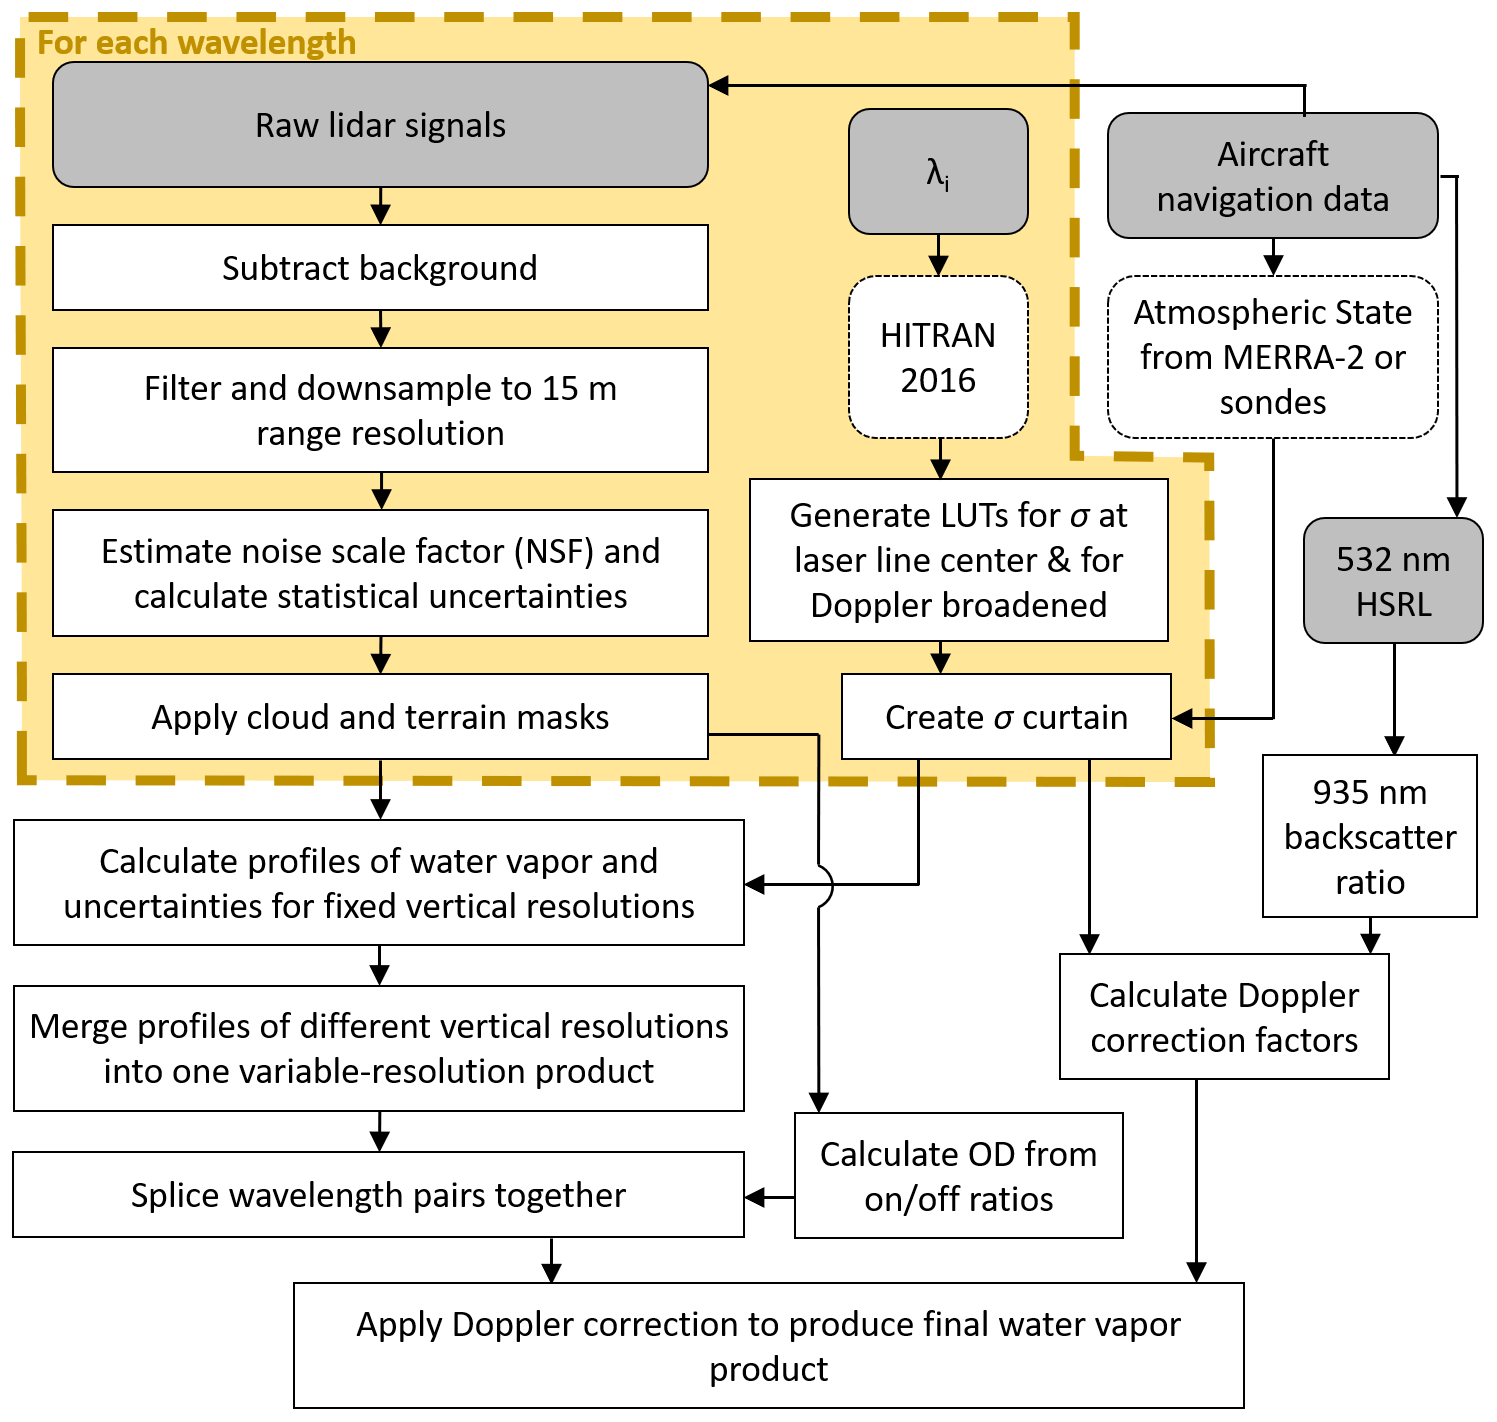
Calculation of absorption cross-section profiles with proper consideration of collisional (pressure) and Doppler broadening is critical for accurate DIAL measurements. This begins with the creation of lookup tables (LUTs) of WV absorption cross section for each transmitted HALO wavelength over the reasonable expected range of pressures and temperatures. These LUTs utilize the 2016 High Resolution Transmission database (HITRAN, Gordon et al., 2017). The atmospheric state for each profile is taken from the MERRA-2 reanalysis model (Gelaro et al., 2017), or radiosondes/dropsondes when MERRA-2 is not yet available during field campaign operation. The atmospheric state at each point gives the pressure and temperature for the LUT, and thus the absorption cross-section curtains are generated for the DIAL calculation. One consideration not shown in Fig. 2 is an additional step to address the contribution of WV to collisional broadening instead of assuming dry air (Ismail and Browell, 1989). The contribution of this collisional self-broadening is first calculated with WV mixing ratios from MERRA-2, and then the resultant HALO WV mixing ratio product is fed back into the absorption cross-section curtain creation to fine-tune the contribution of self-broadening. The subsequent code is then rerun to produce the final HALO WV product.
Once the lidar signals and Δσ have been implemented in Eq. (1) to calculate WV number density, the collocated MERRA-2 molecular number density is used to convert the HALO backscattered power measurements to WV mass mixing ratio. This is done for each of the three wavelength pairs and at multiple range resolutions, and those resolutions are then combined into a single curtain of WV measurements for each wavelength pair (Sect. 4.1A). Wavelength pairs are then spliced together for each profile based on optical depths (Sect. 4.2), and surface return measurements are appended below the minimum altitude of atmospheric calculations (Sect. 4.3). Lastly, Doppler correction factors are applied to produce the final WV curtain (Sect. 4.4).
Parallel to the WV processing is the calculation of statistical uncertainty in the WV product. The uncertainties calculated for each wavelength pair and range resolution are merged into one final curtain in the same manner as the WV mixing ratios. This uncertainty is the statistical error based on Poisson statistics (e.g., Eq. 9 of Ismail and Browell, 1989) adapted to the analog detection used by HALO via NSFs (Liu et al., 2006). A mean NSF is used for each channel in each campaign, calculated from the NSFs determined from each flight. Because relevant instrument parameters are kept constant to the greatest extent possible, the NSFs are fairly constant over the campaign, with standard deviations from the campaign mean <15 %. Additional sources of systematic uncertainty such as errors in HITRAN (Birk et al., 2017; Hodges et al., 2008), knowledge of atmospheric state (namely temperature), or propagating errors from HSRL products used in Doppler correction are estimated to have <1 % impact on the WV product and thus are not accounted for here. Additionally, the magnitude of systematic errors resulting from uncertainties in the performance of the instrument such as knowledge of the transmitted wavelength, spectral purity, or linearity of the receiver detector chain is estimated to be <2 %, which is far below the magnitude of the random error resulting from detector electronic noise and shot noise. These sources of systematic error account for a larger fraction of the error budget in drier environments such as in the UT/LS; however, the comparison with DLH demonstrates that systematic sources of error are to a large extent well understood and do not drive the overall error budget of the retrieval.
4.1 Variable resolution
As discussed in Sect. 3.1, statistical uncertainty in a DIAL measurement can be reduced by using a coarser temporal (horizontal) or range (vertical) resolution, though this may introduce error in representativeness of gradients smaller than the resolution. This allows for flexibility in processing to optimize for a given scientific objective. HALO WV processing is typically done at a fixed temporal resolution with vertical resolution that varies between two values, because the statistical uncertainty of the DIAL measurement is more sensitive to the vertical resolution. For most of the HALO data shown in this paper, the initial DIAL calculation vertical resolution is 315 m. If the statistical uncertainty for a given mixing ratio value at 315 m resolution exceeds 6 %, the value is replaced with the corresponding 585 m vertical resolution value. These vertical resolutions are user-defined and can be made finer or coarser when reprocessing the data, as can the conservative choice of 6 % uncertainty threshold. Six percent was chosen for this dataset by empirical investigation to provide precise measurements even in the most challenging environments. A linear weighting function is applied to a 165 m vertical window centered on each bin where the range resolution changes to ensure a smooth transition in the WV profile.
To illustrate how the chosen resolutions for the DIAL calculation enable applicability to science targets across scales, Fig. 3 explores the WV product and its statistical uncertainty for temporal resolutions ranging from 1 to 70 s with fixed vertical resolution, either 315 or 585 m. This temporal range corresponds to 200 m to 14 km along track for the typical DC-8 flight speed in the data shown here but would differ when HALO is deployed on other aircraft. Figure 3c and d exemplify Eq. (2) – that statistical uncertainty for a given measurement decreases proportional to Δt0.5 and that the statistical uncertainty is more sensitive to Δr than Δt because a larger Δr results in a larger DAOD and the precision of the WV retrieval is directly proportional to the DAOD. It should be noted that Eq. (2) holds for any given profile, but the appearance of plots such as those in Fig. 3 will vary depending on the scene. For example, this profile shows a jump in uncertainty below ∼4.5 km, where the pair is used, because λ3 for this flight was optimized for wetter environments than were observed at that time. Since this paper is not investigating specific targets, a conservative choice of 60 s temporal resolution has been implemented in the retrieval, except where stated otherwise.
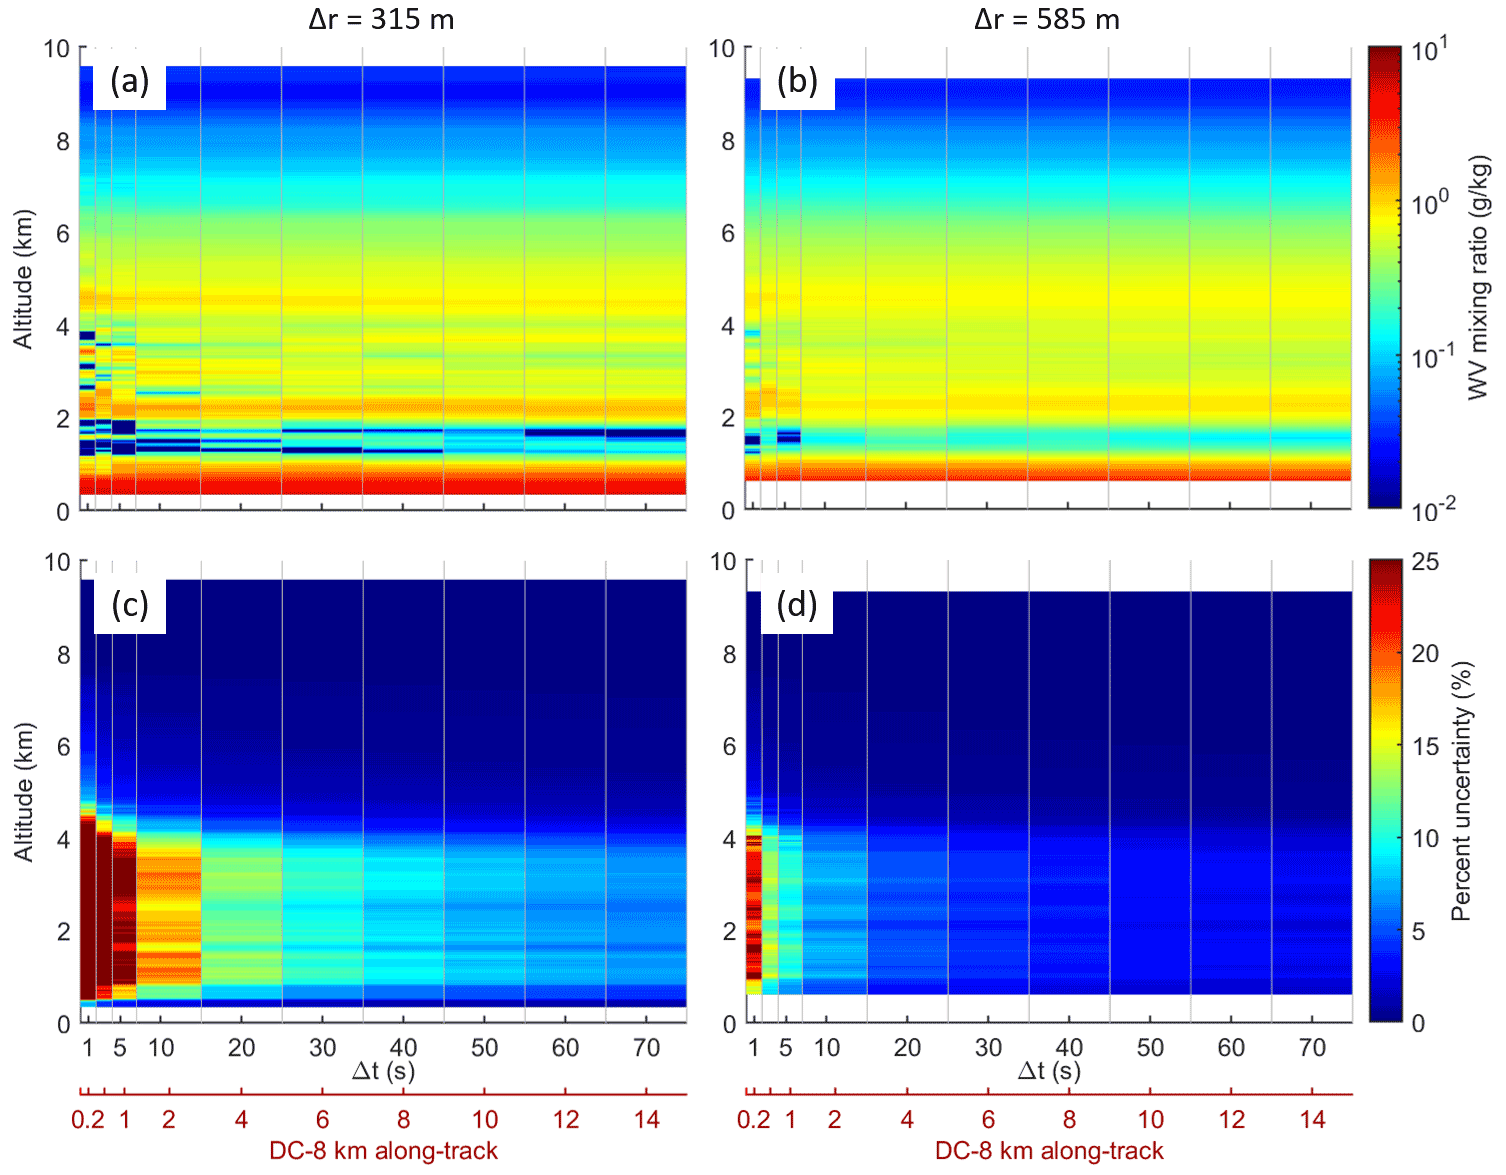
Figure 3Plots showing (a, b) WV mixing ratio and (c, d) the associated statistical uncertainty for different temporal and range resolutions for a single profile centered at 01:02 UTC from the 29 April 2019 flight (this profile is also shown in Fig. 4). Panels (a) and (c) have Δr=315 m throughout the profile, while panels (b) and (d) have Δr=585 m. The x axis indicates different temporal resolutions (Δt), which translate to along-track horizontal resolution calculated for the typical DC-8 flight speed.
Figure 4 shows HALO data for a section of a midlatitude flight. Figure 4a is the final WV mixing ratio product, with corresponding statistical uncertainty and range resolution shown in Fig. 4b and c. Various environmental conditions and features were sampled, including broken and unbroken marine stratocumulus, a very dry layer above the PBL, and moist layers throughout the troposphere that in one location extended towards the tropopause (visible and infrared satellite imagery for this flight was shown in Bedka et al., 2021). In Fig. 4b, many of the sharper gradients in uncertainty are a result of a change in vertical resolution (compare to Fig. 4c). The largest uncertainties for this scene were driven by insufficient DAOD in the dry layer above cloud top. Because the layer was very dry, the small DAOD was difficult to measure with the weakly absorbed λ3. Aerosol scattering in the PBL provided good SNR and thus low uncertainties. Aircraft altitude also indirectly affected uncertainty by effectively shifting the SNR profile; this can be seen around 00:24–00:54 UTC. Figure 4d exhibits the utility of the simultaneous HSRL measurements to identify clouds and the PBL while providing valuable information for WV–aerosol–cloud interaction studies.
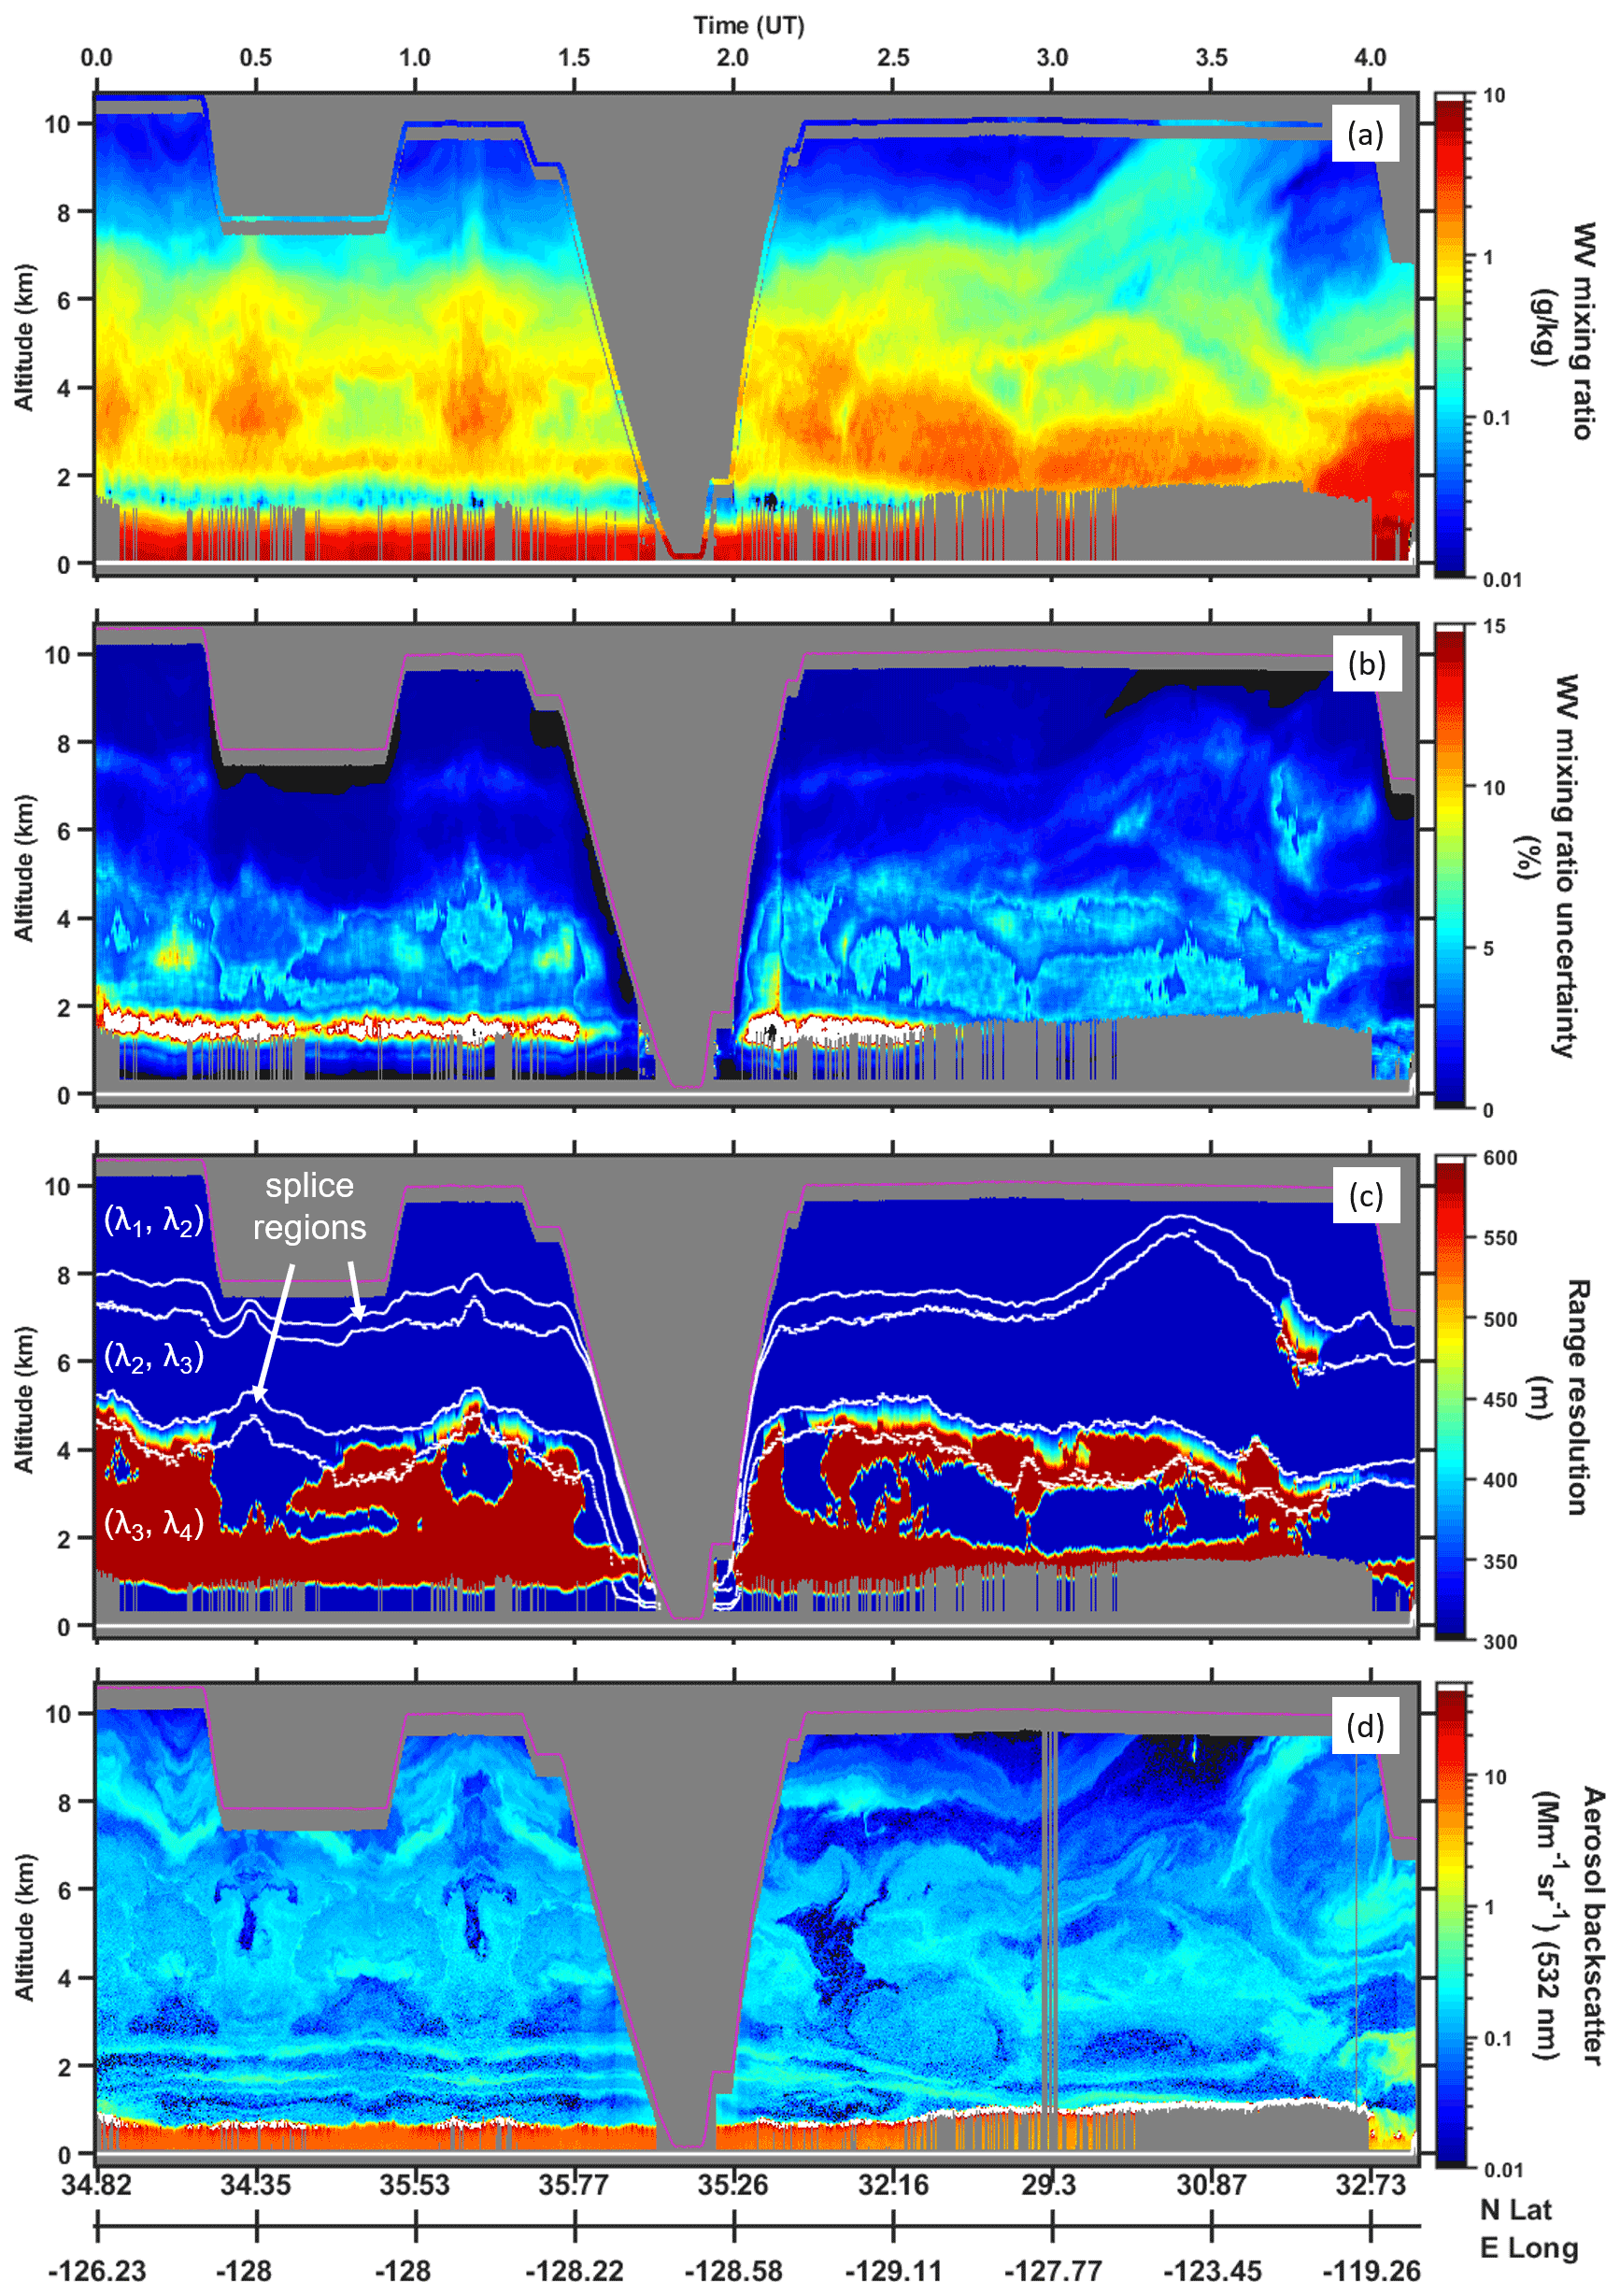
Figure 4Time–altitude curtains of HALO (a) WV mixing ratio, (b) percent uncertainty, (c) vertical resolution, and (d) HSRL 532 nm aerosol backscatter on 30 April. DLH measurements are also shown in panel (a) at the aircraft altitude, whereas aircraft altitude is a magenta line in the other panels. The white lines in panel (c) mark wavelength pair and splicing regions, as indicated.
4.2 Splicing profiles from multiple wavelength pairs
After the variable range resolution has been determined for each wavelength pair, the WV profiles of the three wavelength pairs are spliced together based on WV DAOD thresholds. The extent of each splicing region is plotted in Fig. 4c as an example. Starting from the highest altitude, WV calculated from the first wavelength pair (λ1 and λ2) is used until a DAOD of 1.0 is reached, at which point a linearly weighted average incorporates an increasing contribution from the second wavelength pair until an OD of 1.6. The second wavelength pair is then used alone until the OD range 1.0 to 1.5, wherein again a linearly weighted average controls the transition to the third wavelength pair. The third wavelength pair is used alone for the rest of the profile. The OD thresholds can change from these default values based on manual inspection of instrument performance and atmospheric scene. Results are typically not affected by OD threshold changes within ±0.1 of chosen values because the overlap region where both wavelength pairs perform well is sufficiently broad.
Figure 4 illustrates a fundamental challenge of the DIAL technique with the very dry layer below 2 km. Because the more absorbing wavelengths are attenuated close to the instrument, only the less sensitive λ3 has useable signal at this altitude. The very low DAOD gives accurate identification of the dry layer but low precision. During operation the HALO λ3 signal is monitored and the wavelength is tuned as needed to ensure maximum DAOD in conjunction with the signal staying above the instrument noise floor at all altitudes. This effectively maintains maximum possible sensitivity to any dry layer that may be present while still capturing the full profile to the surface.
4.3 Near-surface water vapor measurement via surface return signals
The center of a nadir-pointing atmospheric DIAL measurement window (i.e., the altitude at which the value is reported) is by its nature limited to a distance of Δr, the range resolution, above a hard target scattering surface (e.g., land, ocean, or cloud top). As discussed above, Δr is driven by the measurement SNR and desired precision. However, the unresolved lowest bin (from the surface up to an altitude of Δr) can be retrieved by carrying out a DIAL retrieval using the strong surface return and the last atmospheric bin above the surface. This is accomplished by employing Eq. (1) with λ3 and λ4, where is replaced with P(λ,rsurface).
These signals are depicted in Fig. 5, utilizing high-gain and low-gain signals for P(λ,r) and P(λ,rsurface), respectively. The high-gain atmospheric signals are temporally and vertically averaged matching the atmospheric DIAL resolutions from Fig. 4 of 60 s and 315 m. Due to the increase in SNR from aerosol scattering in the PBL, future work may reduce this averaging to a finer resolution. Only atmospheric signals more than about 100 m above the surface are considered to ensure no contamination from surface heterogeneity or other effects such as sea spray. The low-gain channels have an optimal receiver dynamic range for the surface return signals, ensuring that the strong signal is captured within the linear regime of the channel's digitizer (i.e., neither saturating nor reaching the noise floor.) The low-gain channel consistently best captured the surface return signal over ocean during this campaign, but this channel choice may differ for other datasets, e.g., over ice or flying at lower altitudes. To ensure accurate representation of the energy capture within the impulse response from the surface return, the data from five bins centered about the peak of the surface return are integrated (highlighted with color in Fig. 5). The online and offline surface return signals were ratioed then temporally smoothed to 60 s to match the atmospheric data. This order of operations was empirically determined as the best approach for reducing non-physical outliers. WV retrieved in this manner is included in the HALO profiles throughout this paper (except Fig. 4) as well as the entire campaign curtains in Bedka et al. (2021).
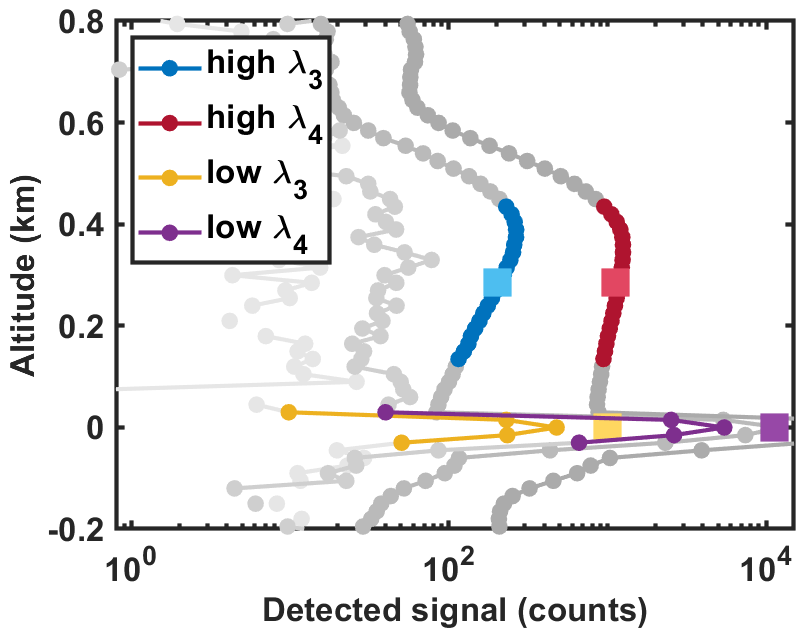
Figure 5Illustration of surface return DIAL concepts. The legend “high” and “low” refer to high-gain and low-gain channels, plotted at 15 m vertical resolution. The high-gain data are temporally averaged to 60 s, while low gain is a single half second averaged record. The colored circles are averaged (atmospheric) or summed (surface return) to use in the DIAL calculation. These are the P(λ,r) inputs to Eq. (1) and are shown as colored squares on the plot. Grayscale points are not used in the surface return but are still shown here for context.
While this method was previously employed with LASE and is similar to other techniques (e.g., integrated path differential absorption lidar; Abshire et al., 2013; Amediek et al., 2017; Dobler et al., 2013), to the authors' knowledge it has not been previously published with application to range-resolved WV DIAL profiling. This method has only been applied to HALO for clear-sky data over oceans thus far because it is a relatively uniform surface compared to cloud or land. Moving forward, efforts will be made to adapt the surface return methodology to extend HALO measurements down to those more complex surfaces. Topographic and albedo variability of cloud and land will require a more detailed treatment to ensure surface-related changes in signal are separated from atmospheric OD variation and may ultimately prohibit usefulness of the retrieval over sufficiently complex scenes. The HALO low-gain channels will be optimized to keep the signals over clouds and land on scale, something that was not the focus of the maiden HALO flights. Furthermore, the surface return will be examined with the native HALO 1.25 m resolution, which despite being oversampled still allows for much more accurate peak finding and representation of the energy captured within the surface impulse response. This latter topic is an area of ongoing research and will be the subject of a follow-on study.
4.4 Doppler broadening correction
Another consideration in optimizing the HALO WV retrieval is accounting for the Doppler broadening of the backscattered signal. The backscattered light from aerosols experiences negligibly small Doppler shifts (MHz), whereas the backscattered light from molecules is significantly Doppler-broadened (GHz) because of the temperature-dependent molecular velocity distribution. The Doppler-broadened return signal must be considered carefully due to the wavelength-dependent OD of the return path. In particular, the signal from the start of a range cell and the end of that range cell can experience different aerosol ODs based on the aerosol gradient within that Δr. Thus, the aerosol backscatter ratio profile is necessary for correct consideration of Doppler broadening effects, and in this regard the HALO HSRL measurements are a unique advantage of the HALO architecture. A full description and mathematical framework of the Doppler broadening correction for WV DIAL measurements is presented in Ansmann (1985) and Ansmann and Bosenberg (1987) (with more recent studies including Fan et al., 2015; Spath et al., 2020). The correction's application to HALO was streamlined by experience with HALO's predecessor LASE (Ismail and Browell, 1989).
Doppler broadening correction is implemented in the HALO retrievals beginning with creation of two LUTs for absorption cross sections with the transmitted wavelength, pressure, and temperature as user inputs to the Voigt function, which utilizes the 2016 HITRAN database for fundamental line parameters. The first LUT is the same as the single-wavelength lookup tables described above and is used for the aerosol portion of the backscatter (Mie scattering). A second LUT is comprised of the Doppler (Gaussian) weighted sum of the Voigt absorption cross sections across a range of ±0.05 wavenumbers from each transmitted laser wavelength (Rayleigh scattering). The backscatter Doppler broadening for the profile is then determined from the atmospheric state (MERRA-2 or sondes), and the aerosol backscatter profile at 935 nm is estimated from the backscatter Ångström exponent at 532/1064 nm (Burton et al., 2012). This Ångström exponent comes from the HSRL 532 nm aerosol backscatter and the 1064 nm aerosol backscatter retrieved using Eq. (10) of Hair et al. (2008). The aerosol backscatter ratio is averaged to match the resolution of the DIAL calculation. If there are brief periods when DIAL data are available but HSRL is not (e.g., 03:00 UTC in Fig. 4), the last available HSRL profile is used. The propagation of the broadened signal is then calculated (e.g., Ansmann and Bosenberg, 1987), and thus the Doppler-corrected WV profile is determined. This processing is done parallel to the non-corrected WV and ultimately applied to the WV product as a correction factor. This allows optional application of the correction in the field where processing is abbreviated, as well as examination of the magnitudes of the Doppler correction. Throughout the Aeolus cal/val campaign, the Doppler correction to the WV product only had an impact of 3.5 % at most.
Sondes were deployed during the Aeolus cal/val campaign to validate the wind measurements by Aeolus and DAWN. The sondes also opportunistically provided WV measurements for comparison to HALO WV DIAL. However, due to the poor performance of the sonde WV measurements, only a very limited qualitative comparison is possible (Bedka et al., 2021). This section therefore places emphasis on HALO WV comparisons to the other observations that were available, namely the DLH and satellites, which proved useful despite lacking the profiling spatiotemporal resolution to constitute a thorough validation dataset.

Figure 6HALO WV mixing ratio profiles with statistical uncertainty bars, and collocated dropsonde profiles for comparison. The bars have been decimated for legibility. The sonde WV sensors had erroneous nonlinear damped responses and thus cannot be used for a rigorous quantitative comparison.
5.1 Dropsondes
A representative set of WV profiles from sondes and HALO is shown in Fig. 6, taken throughout the campaign including four out of the five flights, spanning the tropics to relatively dry midlatitudes. HALO profiles with 30 and 60 s temporal resolution are shown to further exemplify the resolution flexibility discussed above. Vertical resolution is the same for both, using the default algorithm for variable vertical resolution applied to the 60 s dataset. Both resolutions have very good agreement with the sondes and with each other, as expected from Fig. 3. However, as mentioned in Sect. 2.3 only a qualitative comparison to dropsondes is possible from this campaign because the dropsonde moisture sensors had a nonlinear damped response and erroneously low values in the first few kilometers of descent. This damped response is seen as a vertical shift; i.e., for a given feature in the HALO data, the same feature is in the sonde data but its location is shifted downwards by a variable amount (this is especially clear in Fig. 6b, c). This shift starts large and then diminishes in an inconsistent way, making a correction infeasible and limiting to qualitative comparison.
In the middle and lower troposphere, the dropsondes and HALO resolved the same moisture structures with similar results across 2 orders of magnitude, approximately 0.1 to 20 g kg−1. Dry layers within the lower troposphere were captured by both instruments. The lowest few hundred meters where the HALO measurements utilized the surface return signal over ocean also showed good agreement, with differences typically less than 15 %. Across the wide range of aircraft altitudes and environmental conditions that were sampled, there were no apparent systematic biases or other deficiencies in HALO WV for the atmospheric signal profiles or the surface return retrieval.
5.2 DLH
The DLH aboard the DC-8 was the best available option for validation of a HALO WV profile. Only one spiral descent was carried out during the campaign, from 01:20–01:50 UTC on 30 April (shown in Fig. 4), and was preceded by multiple overpasses. The DLH profile from 10 km down to 160 m above the surface, with an average descent rate of ∼400 m min−1, is shown alongside HALO profiles in Fig. 7. DLH data are shown at native resolution and with 315 m vertical smoothing to match the HALO measurements. The DC-8 descent occupied 50 km2, and the preceding overpasses were tangential to this area due to vectoring by air traffic control, so spatiotemporal differences in the measured profiles are inevitable, and there is no single best HALO profile to compare to the DLH. Furthermore, the DC-8 in situ spiral diameter was approximately a quarter of the length of the remote sensing overpass leg, and substantial variability was observed by HALO within this volume, which could explain the high frequency variability in the DLH data around 4 km. The gray shaded area in Fig. 7 shows the range of values measured by HALO in the overpass preceding the spiral, from 00:56–01:04 UTC, which included eight independent profiles. An example HALO profile taken near the start of the descent is also shown (01:31 UTC), with data above 7 km appended from a slightly earlier profile with a higher aircraft altitude (01:23 UTC). The vast majority of the DLH profile was within the range of values observed by HALO, with two very small discrepancies in the upper troposphere and another at PBL top, which were potentially caused by spatiotemporal variability between the measurements. The single HALO profile also shows good agreement, exemplifying the measurement precision across the wide dynamic range of the profile and even capturing the very dry layer above the PBL, which is particularly challenging from a range of several kilometers.
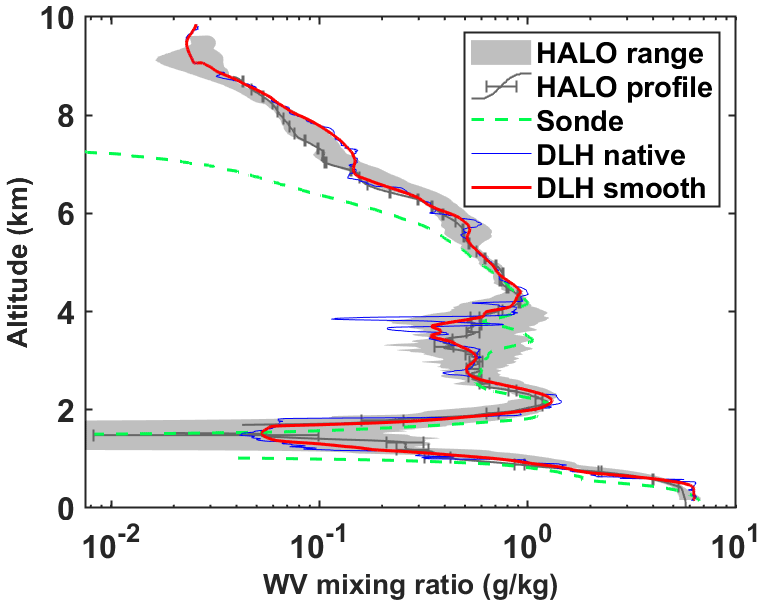
Figure 7HALO comparisons to DLH and sonde from the descent on 30 April. The blue line is the DLH data at native resolution. The red line is DLH smoothed with a 315 m rolling average to match the constant 315 m vertical resolution of the HALO profile. The gray area shows the range of HALO measurements in the area of the spiral descent from the preceding overpass, indicating the expected spatiotemporal variability of the region. An example HALO profile from right before the descent is also shown, with bars denoting measurement statistical uncertainty. The dashed green line shows the malfunctioning sonde profile.
A sonde profile is also shown in Fig. 7. The sonde was launched at 01:26 UTC, near the start of the spiral descent. The sonde is not in agreement with the DLH or the range of HALO values until the lower half of the profile, and even then it appears to have temporal lag as it exceeds the range of HALO values around the sharp gradients below 3 km. This reinforces the previous statements that the sondes were not reliable enough for quantitative validation of HALO WV.
We do not present error statistics for this one DLH profile because the dataset is too small, and differences are likely dominated by specific atmospheric features and sampling differences between the instruments. Many profiles would be needed (e.g., from DLH or functional sondes) to objectively assess precision or any systematic bias in the HALO profiles.
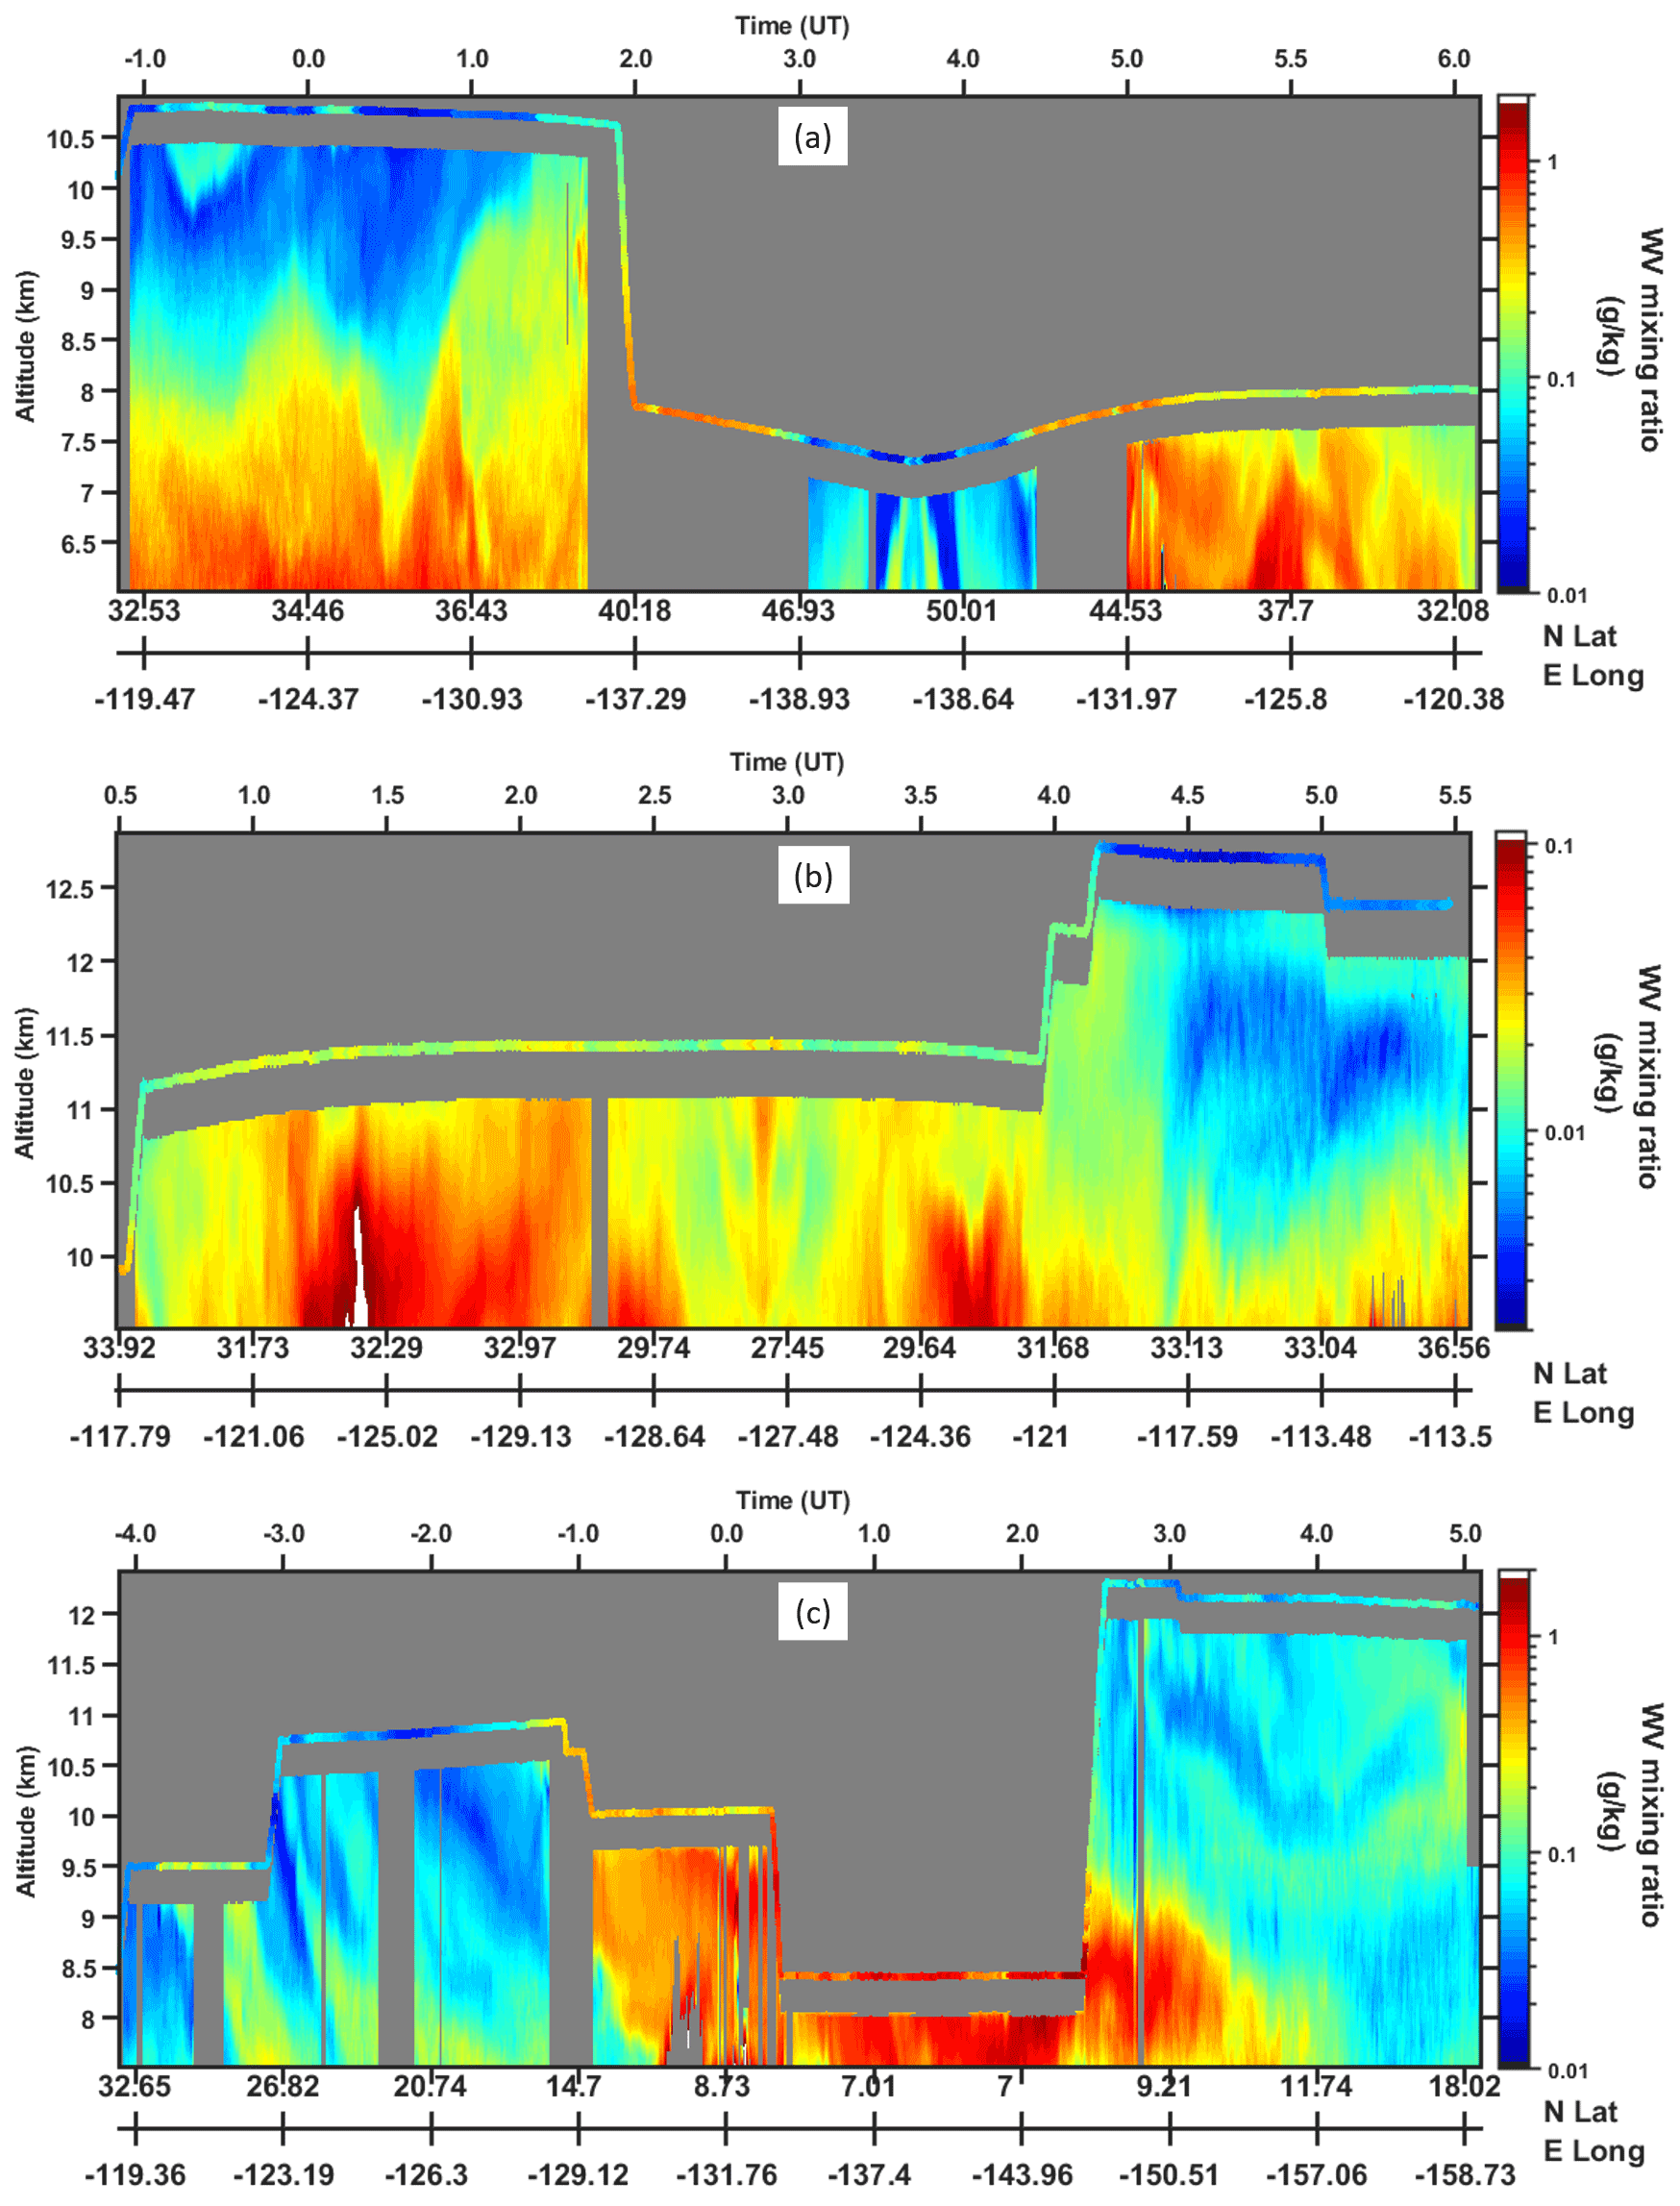
Figure 8HALO WV curtains with DLH plotted at the aircraft altitude, as in Fig. 4a. Segments of three different flights are shown in (a, 18 April; b, 23 April) midlatitudes and (c, 26 April) the tropics. Only upper altitudes are shown to focus on comparison with DLH.
A much more statistically robust approach to comparing the DLH and HALO measurements is to utilize the near-field HALO measurements over the course of the campaign to DLH taken at flight altitude. The closest comparable HALO measurement was typically ∼400 m below the aircraft due to geometric overlap of the transmitter and receiver. Figures 8 and 4a show DLH WV data from the four flights where it was operational, plotted at aircraft altitude with the HALO WV profiles below. The continuity of features between the DLH and HALO data in these plots confirms HALO's ability to capture UT/LS WV, plus the relatively moist environments of the Intertropical Convergence Zone (ITCZ) troposphere in Fig. 8c and the spiral descent in Fig. 4a. This agreement is quantified with the scatterplot in Fig. 9 and associated statistics in Table 2. Comparing the 86 300 available DLH measurements with the nearest measurements in the coincident HALO profiles, ranging 0.004 to 2 g kg−1, yielded an R2=0.66 and a very small wet bias of 0.003 g kg−1. A small wet bias could be expected due to the typical increase in WV with decreasing altitude, plus the range and distribution of the values in Fig. 9 suggest that this calculation may be dominated by the spatial variability over the ∼400 m vertical separation between the measurements rather than indicative of a systematic bias in HALO. The low end of the comparison, g kg−1, most clearly shows a moist bias for HALO in Fig. 9, but these data are sourced entirely from 04:00–05:00 UTC on 23 April (Fig. 8b) when the aircraft was clipping the tropopause and large moisture gradients appear to be influencing the comparison. Removing this flight from the comparison drops the HALO wet bias by about 1 order of magnitude, to g kg−1.
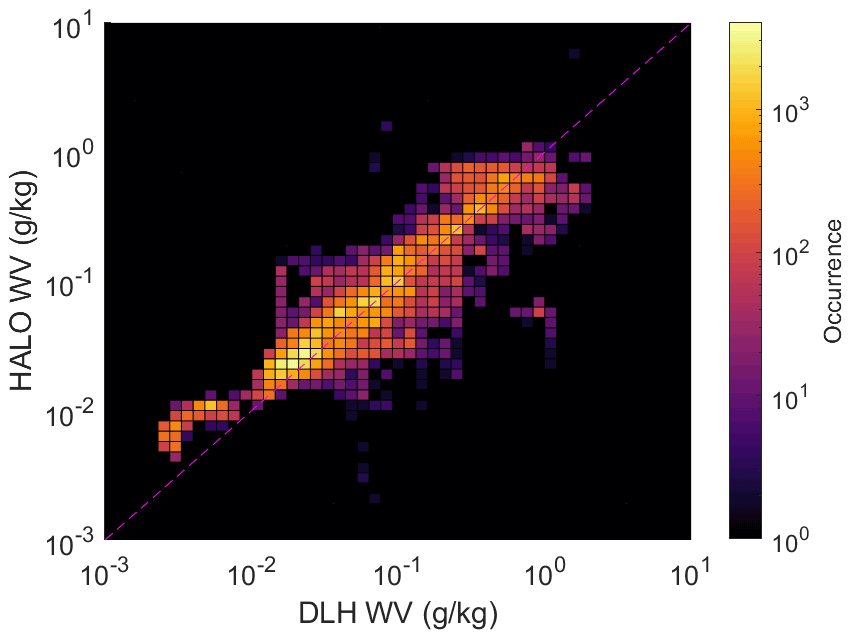
Figure 9Plot of DLH versus HALO WV on log scales and aggregated over all available data, with color indicating the number of points in each bin. The dashed line is a one-to-one line. HALO data are the average of the five highest-altitude measurements, ∼400 m below the DLH.
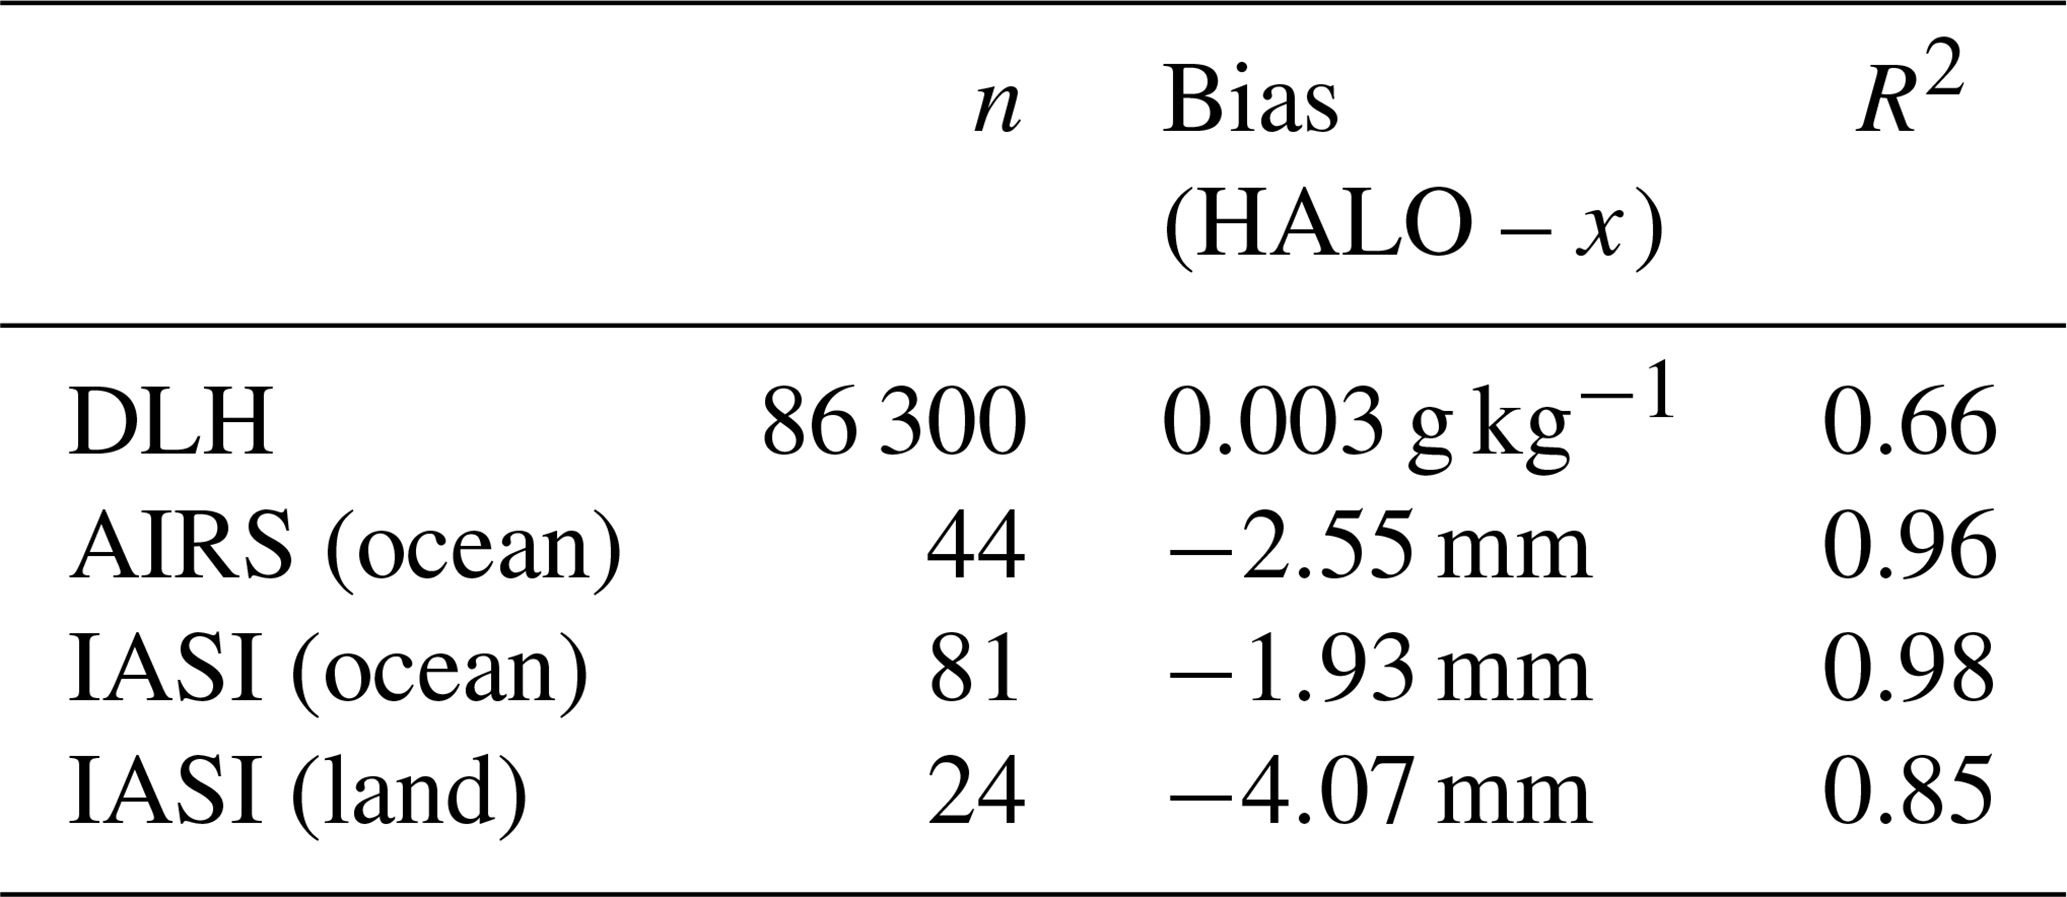
Table 2Statistics of HALO comparisons with other instrumentation. DLH comparison is against the average of the closest five HALO measurements. AIRS and IASI comparisons are of PWV, as shown in Fig. 11. n is the number of data points in the comparison.
It should also be noted that due to the high-altitude nature of this comparison, 86 % of the observations are with HALO wavelength pair , and another 7 % are in the splicing region of and . When considering only the remaining 7 % which are all pair and constitute most points >0.04 g kg−1, bias is still very low at −0.005 g kg−1. Overall, this good agreement of DLH and HALO WV with a large dataset spanning 3 orders of magnitude and a range of atmospheric conditions is a validation of HALO WV in the near field, as well as the general measurement principle and implementation. This is also a notable comparison as the UT/LS is a region rarely profiled with the accuracy, precision, and resolution of a lidar.
5.3 Satellites
5.3.1 PWV
Geophysical observables such as WV profiles and PWV from satellites provide another opportunity to assess HALO products against community standards (e.g., Chazette et al., 2014; Martins et al., 2010; Roman et al., 2016). During this campaign there were several under-flights of opportunity with AIRS and IASI that allowed comparisons to HALO. HALO PWV is calculated by vertical integration of a given WV profile. It should be noted for the HALO and spaceborne sounder comparisons that HALO only gives a partial column PWV, limited to altitudes between the aircraft and surface. HALO records were omitted from PWV comparison if a cloud was detected or the aircraft was below 8 km. AIRS overpasses were suitable for comparison to HALO on 25 and 27 April, both passing through the northern edge of the ITCZ. IASI overpasses were suitable for comparison to HALO on 17, 22, 25, and 27 April, which included tropical and midlatitude flights. The temporal average and standard deviation of HALO measurements within 25 km (20 km) of the AIRS (IASI) footprint centers were used to mitigate the instrumental and spatiotemporal sampling differences between the instruments, similar to previous studies (e.g., Bedka et al., 2010; Chazette et al., 2014; Diao et al., 2013; Roman et al., 2016).
PWV from HALO, AIRS, and IASI is shown on maps in Fig. 10 for comparison. Overall agreement is good, capturing the large moisture gradient near the ITCZ as well as features in relatively dry midlatitudes. An important note for these comparisons is that some differences may arise from the brevity of the satellite overpass (minutes or less) versus the hours of DC-8 flight that fall within the satellite swath. The DC-8 location at overpass time is marked with a green circle in Fig. 10. This spatiotemporal offset may be responsible for some differences, including the northwest corner of the oceanic portion of Fig. 10c, but cannot be corrected for in a straightforward manner.
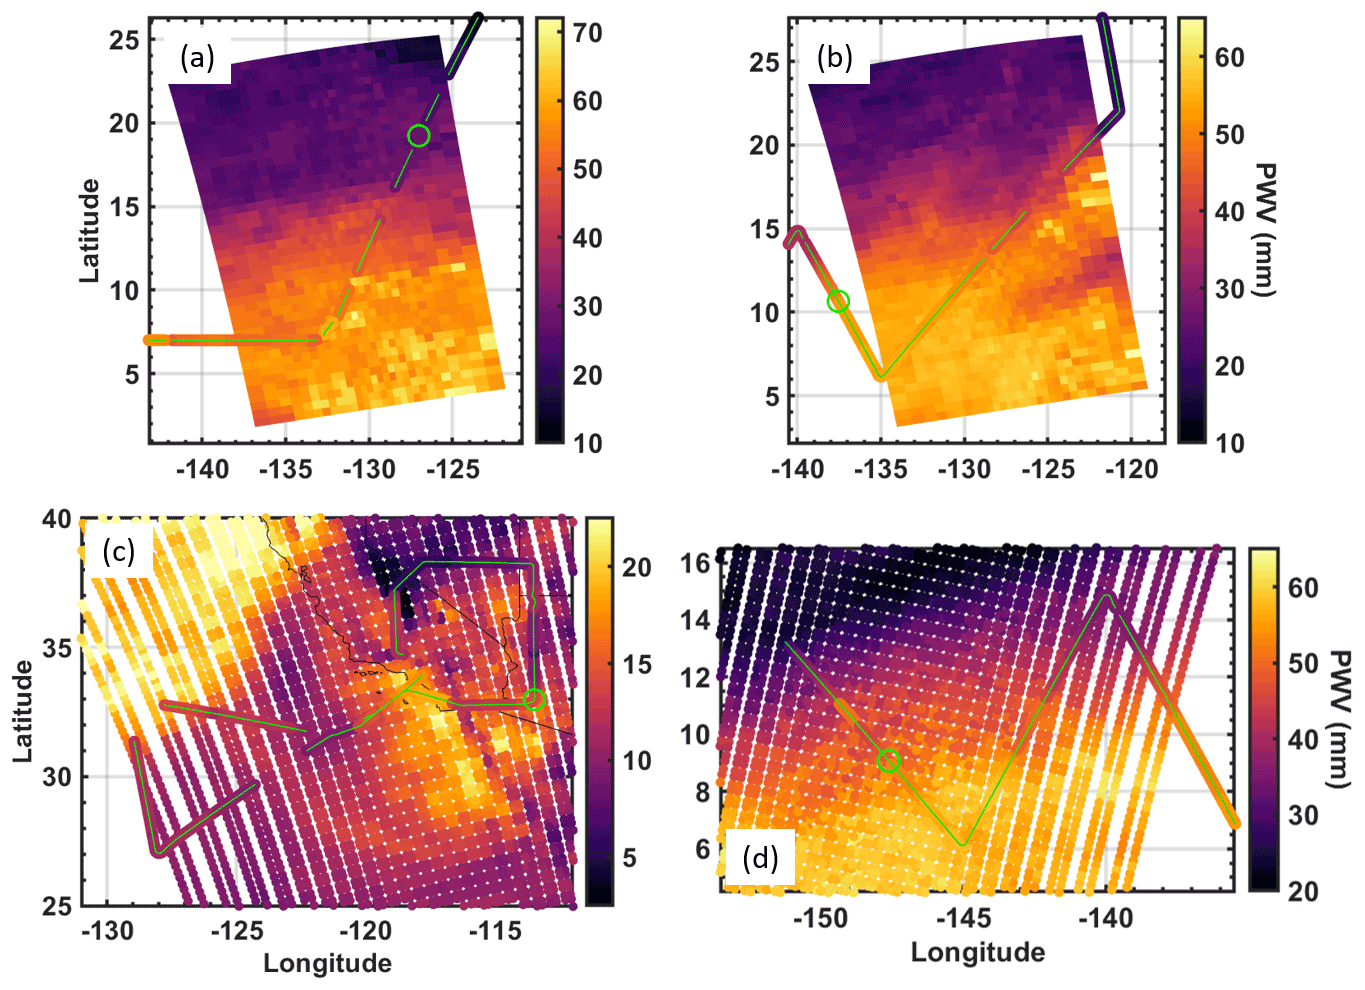
Figure 10(a, b) AIRS and (c, d) IASI PWV with HALO PWV overlaid. The HALO PWV has a green line at the center of the flight track for visibility. Green circles mark the time that the satellite overpassed. Gaps in the HALO data are due to clouds or missing data preventing full-column PWV retrieval. Dates are (a) 25 April, (b, d) 27 April, and (c) 23 April.
Figure 11 and Table 2 show that there was excellent agreement of HALO PWV with AIRS and IASI, with HALO measurements over ocean having a dry bias of 2.55 and 1.93 mm and R2 of 0.96 and 0.98 against AIRS and IASI, respectively. A dry bias is expected for these comparisons because HALO is only capturing the partial atmospheric column, i.e., below the DC-8 flight altitude. The bias is most prevalent at high PWV values, which correspond to tropical flight legs where the DC-8 was often flying within the upper reaches of deep ITCZ moisture plumes, e.g., Fig. 8c. On midlatitude flights with low or moderate PWV and a relatively dry upper troposphere, such a bias was not clearly evident. The overall good agreement may also be interpreted as an indirect indicator of accuracy in the near-surface retrieval presented in Sect. 4.3, since PWV is generally dominated by the high moisture content of the PBL (e.g., Richardson et al., 2021; Thompson et al., 2021), but this is not a direct relationship appropriate for robust validation.
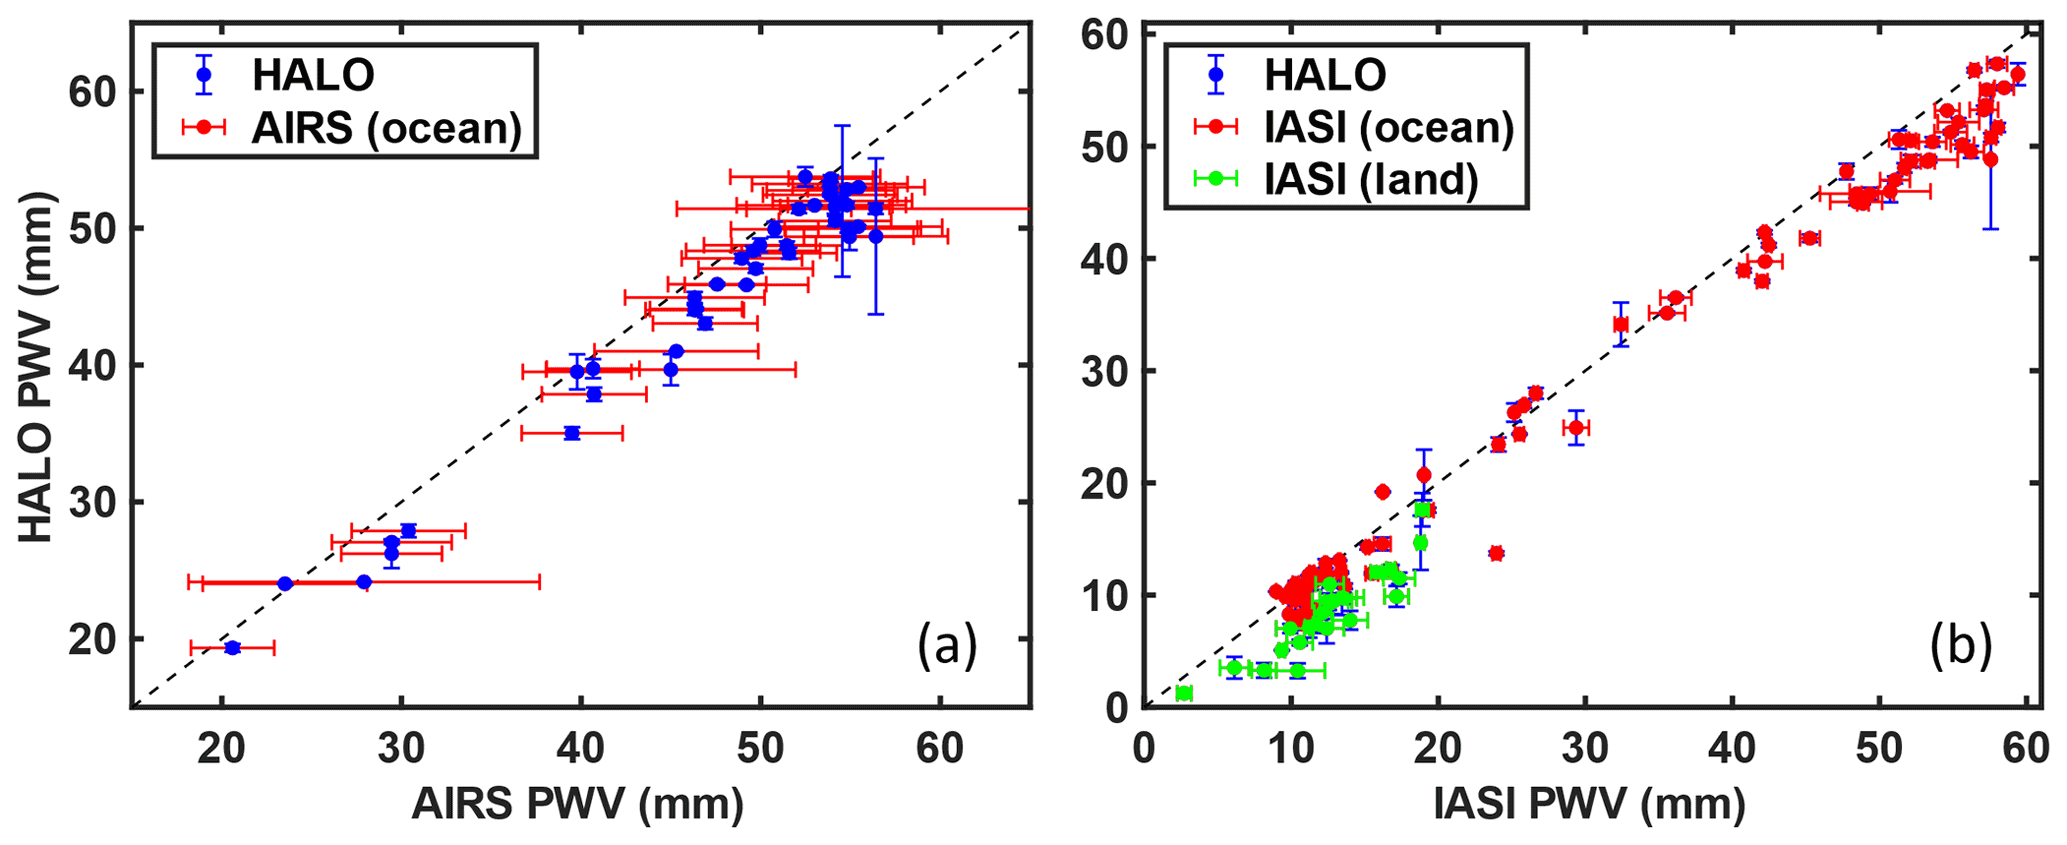
Figure 11Comparison of (a) AIRS or (b) IASI PWV with the average HALO PWV calculated within each satellite retrieval footprint. Bars for AIRS are the reported retrieval uncertainties. Bars for HALO and IASI are standard deviations. Dashed line is 1:1, for reference.
Some of the IASI overpass time included data over land (e.g., Fig. 10c), wherein the surface return DIAL technique was not employed to measure the lowest few hundred meters of the atmosphere, and thus measured PWV is expected to have a larger dry bias. The bias from this limitation is shown in Fig. 11 and Table 2 to be 2.14 mm larger than the PWV comparison over ocean which included the surface return DIAL technique. This discrepancy may be eliminated in the future as the surface return retrieval is applied to HALO data collected over land.
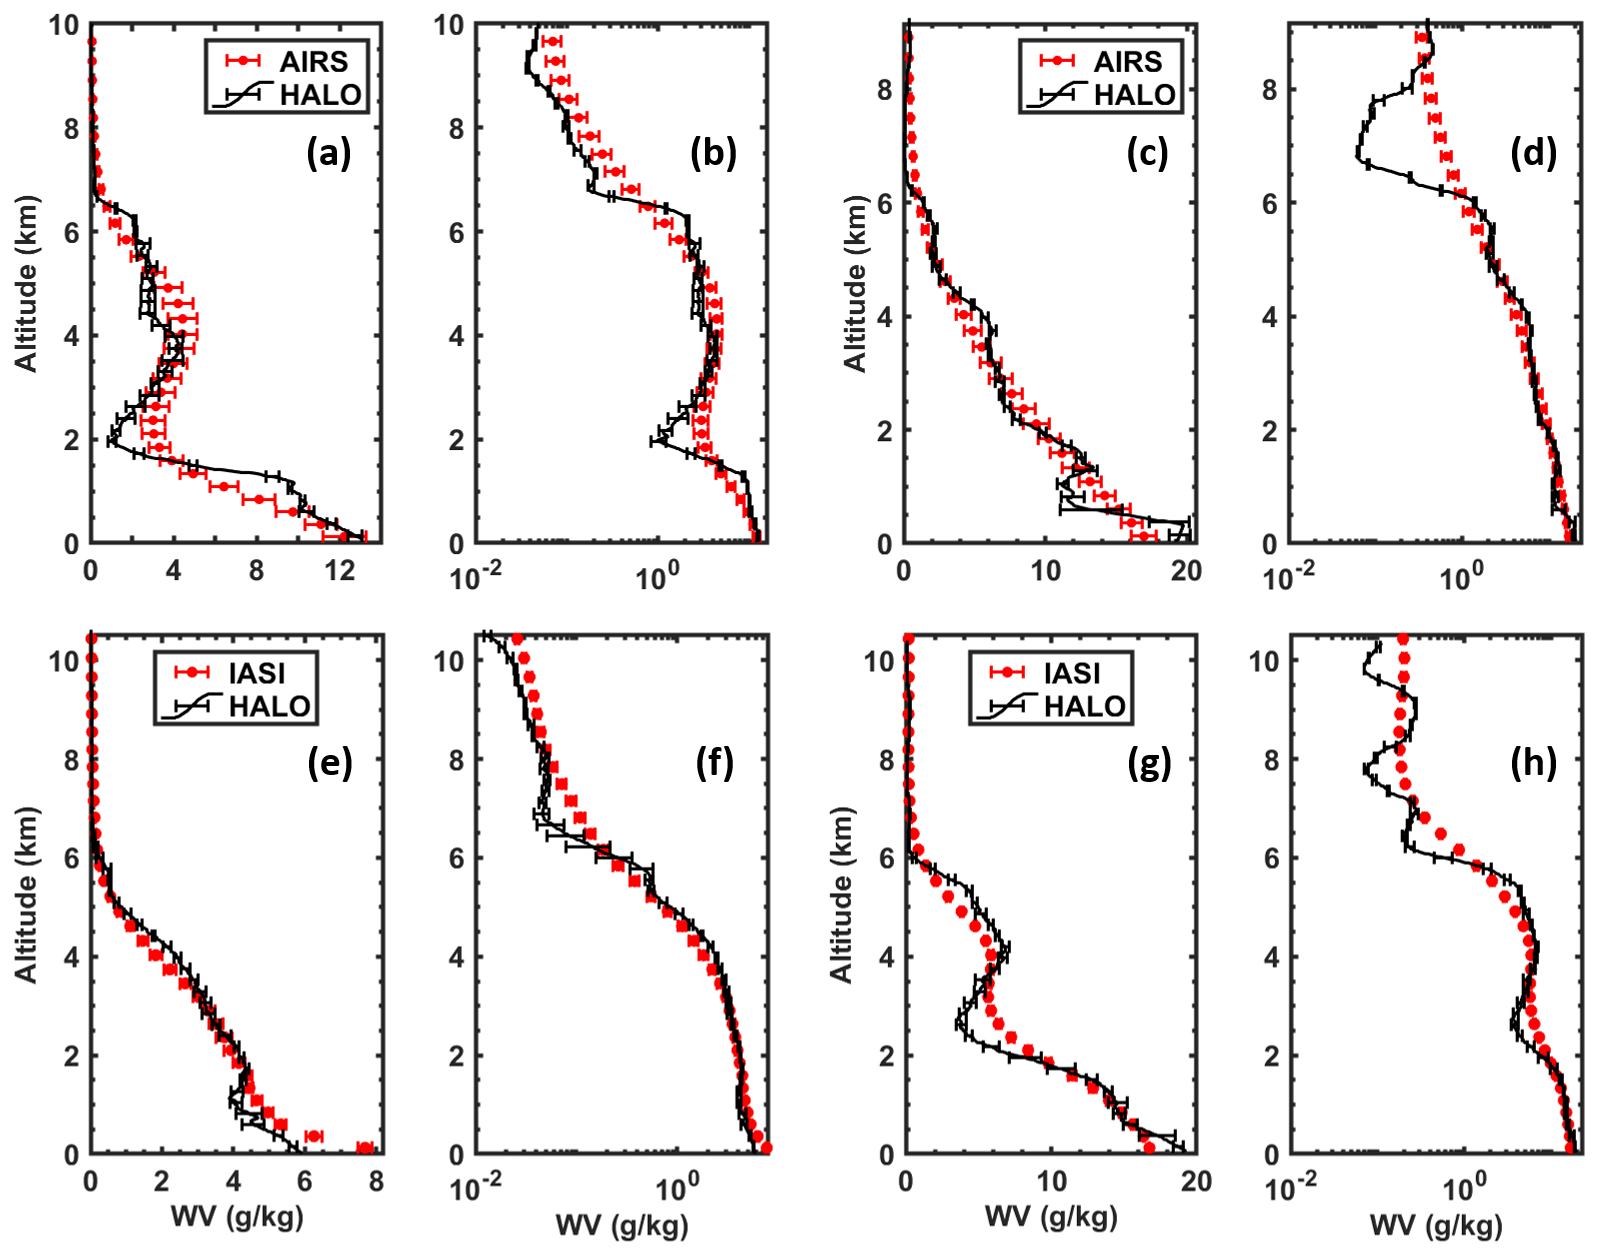
Figure 12WV mixing ratio profiles from HALO versus (a–d) AIRS and (e–h) IASI with two locations each and both (a, c, e, g) linear and (b, d, f, h) log scales to emphasize capabilities across scales. The AIRS profiles are from 25 April 22:15 UTC overpass, with the HALO profiles from (a, b) 22:36 and (c, d) 23:16 UTC. IASI profiles are from (e, f) 23 April 04:00 UTC overpass and 04:30 UTC HALO profile and (g, h) 27 April 19:26 UTC overpass and 19:12 UTC HALO profile.
5.3.2 Water vapor profiles
Figure 12 shows four HALO WV profiles alongside AIRS and IASI WV profile products. As noted in Sect. 2E, the spaceborne sounders report at finely spaced vertical levels but are actually limited to 1–2 km vertical resolution of independent information in the troposphere under ideal conditions. While the sounders generally agree with the trends of HALO, and some differences may be attributed to spatiotemporal changes, the spaceborne sounders are ultimately limited relative to HALO in their ability to resolve sharp gradients and small-scale variability in moisture that are important for transport and convection. This is especially apparent in these profiles around PBL top and lower tropospheric dry layers, where discrepancies of 1–2 g kg−1 or greater are present. The logarithmic plots also highlight large differences in the UT/LS.
AIRS and IASI provide important research and operational data to the community and have the strength of frequent global coverage, but HALO or similar active remote sensing is clearly advantageous for supporting process studies and other applications requiring higher spatial resolution and accuracy. The synergistic strengths of combining active and passive sounders will be an important resource moving forward, such as the work by Turner and Löhnert (2021) combining passive and active remote sensing observations to increase information content and improve vertical resolution and accuracy of passive retrievals.
This paper provides an overview of implementation and retrieval methodology for the new HALO airborne WV DIAL system and comparison to other instrumentation from its five maiden flights, serving to inform the community of a new capability within the suborbital portfolio. The HALO instrument and WV retrieval were designed based on decades of legacy of related DIAL efforts at NASA LaRC and in the global community. The HALO WV DIAL measurements are carried out in the 935 nm spectral range, transmitting four wavelengths to achieve sensitivity to moisture from the UT/LS down to the PBL within a single profile. HALO is the first WV DIAL system to employ shot-by-shot switching between the four wavelengths using a single laser transmitter and in doing so reduces instrument size, complexity, and potential for certain systematic errors. The retrieval methodology incorporates the flexibility of the DIAL technique to trade resolution for precision, with streamlined reprocessing to optimize for scientific applications across scales. Another unique advantage of HALO is the combination of the WV DIAL with HSRL (or methane DIAL). The HSRL measurements provide cloud and aerosol optical properties, which are assets to both the WV retrieval calculations and scientific analysis.
The maiden flights of the HALO WV DIAL were flights of opportunity that enabled a first assessment of the WV measurements in various forms over a wide range of atmospheric conditions spanning the tropical and midlatitude eastern Pacific, though opportunities for rigorous validation were limited at best. The DLH was operational aboard the DC-8 for most of the campaign, providing a large dataset of in situ WV observations for comparison to the HALO measurements nearest the aircraft (∼400 m below). Values spanned 0.004 to 2 g kg−1, and a very small bias of only 0.003 g kg−1 was found, which was likely dominated by spatial variability rather than systematic bias. There was also considerable spread with R2=0.66, again due in part to spatial variability. A single DLH in situ profile was available for comparison to HALO profiles, and the DLH data were found to be within the range of values measured by HALO during the preceding overpass (with the exception of three very small deviations), indicating good agreement within the expected spatiotemporal variation for the area. Unfortunately, a typical assessment of profiles via statistical comparison to sondes was not possible due to deficiencies in the sonde moisture sensors throughout the campaign. Despite this limitation, the HALO and sonde profiles were found to capture WV features and magnitudes with good agreement.
HALO PWV comparisons to community standard spaceborne sounders AIRS and IASI showed excellent agreement. PWV observations over ocean ranged from 10 to 60 mm with R2= 0.96 and 0.98 for AIRS and IASI, respectively. HALO measurements were often slightly drier than the sounders in accordance with expectations, considering HALO only measures a partial column based on DC-8 flight altitude. HALO profile comparisons to the sounders' WV profiles highlighted the different capabilities of the instruments, with HALO resolving much more detail and sharper gradients throughout the troposphere. Synergies between active and passive sounders such as these will be critical for improving measurements and information content on global scales in the future (Teixeira et al., 2021).
Although substantial conclusions were drawn, the opportunities for validation of HALO WV during the Aeolus cal/val campaign were not ideal due to the focus and brevity of the campaign. Further validation of HALO will be performed during future campaigns to quantify any potential systematic or other sources of error beyond the statistical uncertainty that is currently reported, though no such errors are evident to date. Improvements to the HALO architecture and processing are also ongoing, including efforts to expand the tunability of the transmitted wavelength targeting the lower troposphere, which will improve performance and expand measurement capability in very moist environments such as the ITCZ. Another major advancement will be the refining of the surface return DIAL algorithm over oceans and attempting to extend this capability to land as well as cloud top, which will further increase utility for PBL and cloud process studies in addition to column products such as PWV.
Data from the Aeolus cal/val campaign are available through the NASA Atmospheric Science Data Center (ASDC) at https://doi.org/10.5067/SUBORBITAL/AEOLUSCALVAL2019/DATA001 (NASA/LARC/SD/ASDC, 2020).
The authors worked collaboratively on each aspect as part of the HALO team. ARN led conceptualization and development of the HALO instrument with contributions from AN and DBH. SK and JC led data curation and the development of the HALO WV retrieval code with contributions from ARN and BJC. JC, JL, and RABG contributed to the integration and operation of HALO during the campaign. BJC and ARN led the analyses presented here. BJC prepared the paper with contributions from co-authors.
The contact author has declared that neither they nor their co-authors have any competing interests.
Publisher’s note: Copernicus Publications remains neutral with regard to jurisdictional claims in published maps and institutional affiliations.
We acknowledge funding support from the NASA Headquarters Earth Science Division, the NASA Earth Science Technology Office, and the NASA Langley Research Center. We thank the DC-8 team at the NASA Armstrong Flight Research Center and the National Suborbital Education and Research Center for their support of the Aeolus cal/val campaign. We thank Joshua Digangi and Glenn Diskin for providing the DLH data used in the preparation of this paper. We thank Yankee Environmental Systems for providing the dropsondes and providing technical guidance on the use of the data presented in this paper. We also thank Kris Bedka for his leadership during the Aeolus cal/val campaign and fruitful discussions regarding synergistic DIAL retrievals.
Brian J. Carroll has been supported by the NASA Postdoctoral Program (NPP) at NASA Langley Research Center. The NPP was administered by the Universities Space Research Association (contract no. NNH15CO48B).
This paper was edited by John Sullivan and reviewed by two anonymous referees.
Abshire, J. B., Riris, H., Weaver, C. J., Mao, J., Allan, G. R., Hasselbrack, W. E., and Browell, E. V.: Airborne measurements of CO2 column absorption and range using a pulsed direct-detection integrated path differential absorption lidar, Appl. Optics, 52, 4446–4461, 2013.
Amediek, A., Ehret, G., Fix, A., Wirth, M., Büdenbender, C., Quatrevalet, M., Kiemle, C., and Gerbig, C.: CHARM-F–a new airborne integrated-path differential-absorption lidar for carbon dioxide and methane observations: measurement performance and quantification of strong point source emissions, Appl. Optics, 56, 5182–5197, 2017.
Ansmann, A.: Errors in ground-based water-vapor DIAL measurements due to Doppler-broadened Rayleigh backscattering, Appl. Optics, 24, 3476–3480, 1985.
Ansmann, A. and Bosenberg, J.: Correction scheme for spectral broadening by Rayleigh scattering in differential absorption lidar measurements of water vapor in the troposphere, Appl. Optics, 26, 3026–3032, 1987.
Bedka, K. M., Nehrir, A. R., Kavaya, M., Barton-Grimley, R., Beaubien, M., Carroll, B., Collins, J., Cooney, J., Emmitt, G. D., Greco, S., Kooi, S., Lee, T., Liu, Z., Rodier, S., and Skofronick-Jackson, G.: Airborne lidar observations of wind, water vapor, and aerosol profiles during the NASA Aeolus calibration and validation (Cal/Val) test flight campaign, Atmos. Meas. Tech., 14, 4305–4334, https://doi.org/10.5194/amt-14-4305-2021, 2021.
Bedka, S., Knuteson, R., Revercomb, H., Tobin, D., and Turner, D.: An assessment of the absolute accuracy of the Atmospheric Infrared Sounder v5 precipitable water vapor product at tropical, midlatitude, and arctic ground-truth sites: September 2002 through August 2008, J. Geophys. Res., 115, D17310, https://doi.org/10.1029/2009JD013139, 2010.
Behrendt, A., Wulfmeyer, V., Schaberl, T., Bauer, H. S., Kiemle, C., Ehret, G., Flamant, C., Kooi, S., Ismail, S., Ferrare, R., and Browell, E. V.: Intercomparison of water vapor data measured with lidar during IHOP_2002. Part II: Airborne-to-airborne systems, J. Atmos. Ocean. Tech., 24, 22–39, 2007.
Birk, M., Wagner, G., Loos, J., Lodi, L., Polyansky, O. L., Kyuberis, A. A., Zobov, N. F., and Tennyson, J.: Accurate line intensities for water transitions in the infrared: comparison of theory and experiment, J. Quant. Spectrosc. Ra., 203, 88–102, 2017.
Black, P., Harrison, L., Beaubien, M., Bluth, R., Woods, R., Penny, A., Smith, R. W., and Doyle, J. D.: High-definition Sounding System (HDSS) for atmospheric profiling, J. Atmos. Ocean. Tech., 34, 777–796, 2017.
Bony, S., Colman, R., Kattsov, V. M., Allan, R. P., Bretherton, C. S., Dufresne, J. L., Hall, A., Hallegatte, S., Holland, M. M., Ingram, W., and Randall, D. A.: How well do we understand and evaluate climate change feedback processes?, J. Climate, 19, 3445–3482, 2006.
Bony, S., Stevens, B., Frierson, D. M., Jakob, C., Kageyama, M., Pincus, R., Shepherd, T. G., Sherwood, S. C., Siebesma, A. P., Sobel, A. H. and Watanabe, M.: Clouds, circulation and climate sensitivity, Nat. Geosci., 8, 261–268, 2015.
Bösenberg, J.: Ground-based differential absorption lidar for water-vapor and temperature profiling: methodology, Appl. Optics, 37, 3845–3860, 1998.
Browell, E. V.: Remote sensing of tropospheric gases and aerosols with an airborne DIAL system, in: Optical and Laser Remote Sensing, edited by: Killinger, D. K. and Mooradian A., Springer, Berlin, Heidelberg, Germany, 138–147, https://doi.org/10.1007/978-3-540-39552-2_18, 1983.
Browell, E. V., Ismail, S., and Grant, W. B.: Differential absorption lidar (DIAL) measurements from air and space, Appl. Phys. B, 67, 399–410, 1998.
Burton, S. P., Ferrare, R. A., Hostetler, C. A., Hair, J. W., Rogers, R. R., Obland, M. D., Butler, C. F., Cook, A. L., Harper, D. B., and Froyd, K. D.: Aerosol classification using airborne High Spectral Resolution Lidar measurements – methodology and examples, Atmos. Meas. Tech., 5, 73–98, https://doi.org/10.5194/amt-5-73-2012, 2012.
Carroll, B. J., Demoz, B. B., Turner, D. D., and Delgado, R.: Lidar observations of a mesoscale moisture transport event impacting convection and comparison to Rapid Refresh model analysis, Mon. Weather Rev., 149, 463–477, 2021.
Chahine, M. T., Pagano, T. S., Aumann, H. H., Atlas, R., Barnet, C., Blaisdell, J., Chen, L., Fetzer, E. J., Goldberg, M., Gautier, C., and Granger, S.: AIRS: Improving weather forecasting and providing new data on greenhouse gases, B. Am. Meteorol. Soc., 87, 911–926, 2006.
Chazette, P., Marnas, F., Totems, J., and Shang, X.: Comparison of IASI water vapor retrieval with H2O-Raman lidar in the framework of the Mediterranean HyMeX and ChArMEx programs, Atmos. Chem. Phys., 14, 9583–9596, https://doi.org/10.5194/acp-14-9583-2014, 2014.
Clerbaux, C., Boynard, A., Clarisse, L., George, M., Hadji-Lazaro, J., Herbin, H., Hurtmans, D., Pommier, M., Razavi, A., Turquety, S., Wespes, C., and Coheur, P.-F.: Monitoring of atmospheric composition using the thermal infrared IASI/MetOp sounder, Atmos. Chem. Phys., 9, 6041–6054, https://doi.org/10.5194/acp-9-6041-2009, 2009.
Cooney, J.: Remote measurements of atmospheric water vapor profiles using the Raman component of laser backscatter, J. Appl. Meteorol., 9, 182–184, 1970.
Davis, K. J., Browell, E. V., Feng, S., Lauvaux, T., Obland, M. D., Pal, S., Baier, B. C., Baker, D. F., Baker, I. T., Barkley, Z. R., and Bowman, K. W.: The Atmospheric Carbon and Transport (ACT)-America Mission, B. Am. Meteorol. Soc., 102, E1714–E1734, 2021.
Diao, M., Jumbam, L., Sheffield, J., Wood, E. F., and Zondlo, M. A.: Validation of AIRS/AMSU-A water vapor and temperature data with in situ aircraft observations from the surface to UT/LS from 87∘N–67∘S, J. Geophys. Res.-Atmos., 118, 6816–6836, 2013.
Diskin, G. S., Podolske, J. R., Sachse, G. W., and Slate, T. A.: Open-path airborne tunable diode laser hygrometer, Diode Lasers and Applications in Atmospheric Sensing, Proc. SPIE, 4817, 9 pp., https://doi.org/10.1117/12.453736, 2002.
Dobler, J. T., Harrison, F. W., Browell, E. V., Lin, B., McGregor, D., Kooi, S., Choi, Y., and Ismail, S.: Atmospheric CO2 column measurements with an airborne intensity-modulated continuous wave 1.57 µm fiber laser lidar, Appl. Optics, 52, 2874–2892, 2013.
Doyle, J. D., Moskaitis, J. R., Feldmeier, J. W., Ferek, R. J., Beaubien, M., Bell, M. M., Cecil, D. L., Creasey, R. L., Duran, P., Elsberry, R. L., Komaromi, W. A., Molinari, J., Ryglicki, D. R., Stern, D. P., Velden, C. S., Wang, X., Allen, T., Barrett, B. S., Black, P. G., Dunion, J. P., Emanuel, K. A., Harr, P. A., Harrison, L., Hendricks, E. A., Herndon, D., Jeffries, W. Q., Majumdar, S. J., Moore, J. A., Pu, Z., Rogers, R. F., Sanabia, E. R., Tripoli, G. J., and Zhang, D.: A View of Tropical Cyclones from Above: The Tropical Cyclone Intensity Experiment, B. Am. Meteorol. Soc., 98, 2113–2134, https://doi.org/10.1175/BAMSD-16-0055.1, 2017.
Ehret, G., Kiemle, C., Renger, W., and Simmet, G.: Airborne remote sensing of tropospheric water vapor with a near–infrared differential absorption lidar system, Appl. Optics, 32, 4534–4551, 1993.
Eichinger, W. E., Cooper, D. I., Forman, P. R., Griegos, J., Osborn, M. A., Richter, D., Tellier, L. L., and Thornton, R.: The development of a scanning Raman water vapor lidar for boundary layer and tropospheric observations, J. Atmos. Ocean. Tech., 16, 1753–1766, 1999.
Fan, L., Zhang, Y., Chen, S., Guo, P., and Chen, H.: Rayleigh-backscattering doppler broadening correction for differential absorption lidar, in: Selected Papers of the Photoelectronic Technology Committee Conferences, June–July 2015, International Society for Optics and Photonics, Proc. SPIE, 9795, p. 979517, 2015.
Ferrare, R. A., Browell, E. V., Ismail, S., Kooi, S. A., Brasseur, L. H., Brackett, V. G., Clayton, M. B., Barrick, J. D. W., Diskin, G. S., Goldsmith, J. E. M., and Lesht, B. M.: Characterization of upper-troposphere water vapor measurements during AFWEX using LASE, J. Atmos. Ocean. Tech., 21, 1790–1808, 2004.
Ferreira, A. P., Nieto, R., and Gimeno, L.: Completeness of radiosonde humidity observations based on the Integrated Global Radiosonde Archive, Earth Syst. Sci. Data, 11, 603–627, https://doi.org/10.5194/essd-11-603-2019, 2019.
Gelaro, R., McCarty, W., Suárez, M. J., Todling, R., Molod, A., Takacs, L., Randles, C. A., Darmenov, A., Bosilovich, M. G., Reichle, R., and Wargan, K.: The modern-era retrospective analysis for research and applications, version 2 (MERRA-2), J. Climate, 30, 5419–5454, 2017.
Gettelman, A., Weinstock, E. M., Fetzer, E. J., Irion, F. W., Eldering, A., Richard, E. C., Rosenlof, K. H., Thompson, T. L., Pittman, J. V., Webster, C. R., and Herman, R. L.: Validation of Aqua satellite data in the upper troposphere and lower stratosphere with in situ aircraft instruments, Geophys. Res. Lett., 31, L22107, https://doi.org/10.1029/2004GL020730, 2004.
Goldsmith, J. E. M., Blair, F. H., Bisson, S. E., and Turner, D. D.: Turn-key Raman lidar for profiling atmospheric water vapor, clouds, and aerosols, Appl. Optics, 37, 4979–4990, 1998.
Gordon, I. E., Rothman, L. S., Hill, C., Kochanov, R. V., Tan, Y., Bernath, P. F., Birk, M., Boudon, V., Campargue, A., Chance, K. V., and Drouin, B. J.: The HITRAN2016 molecular spectroscopic database, J. Quant. Spectrosc. Ra., 203, 3–69, 2017.
Hair, J. W., Hostetler, C. A., Cook, A. L., Harper, D. B., Ferrare, R. A., Mack, T. L., Welch, W., Izquierdo, L. R., and Hovis, F. E.: Airborne high spectral resolution lidar for profiling aerosol optical properties, Appl. Optics, 47, 6734–6752, 2008.
Hastings, D. A., Dunbar, P. K., Elphingstone, G. M., Bootz, M., Murakami, H., Maruyama, H., Masaharu, H., Holland, P., Payne, J., Bryant, N. A., and Logan, T. L.: The global land one-kilometer base elevation (GLOBE) digital elevation model, version 1.0, National Oceanic and Atmospheric Administration, National Geophysical Data Center, https://www.ngdc.noaa.gov/mgg/topo/globe.html (last access: 1 August 2007), 1999.
Higdon, N. S., Browell, E. V., Ponsardin, P., Grossmann, B. E., Butler, C. F., Chyba, T. H., Mayo, M. N., Allen, R. J., Heuser, A. W., Grant, W. B., and Ismail, S.: Airborne differential absorption lidar system for measurements of atmospheric water vapor and aerosols, Appl. Optics, 33, 6422–6438, 1994.
Hilton, F., Atkinson, N. C., English, S. J., and Eyre, J. R.: Assimilation of IASI at the Met Office and assessment of its impact through observing system experiments, Q. J. Roy. Meteor. Soc., 135, 495–505, 2009.
Hilton, F., Armante, R., August, T., Barnet, C., Bouchard, A., Camy-Peyret, C., Capelle, V., Clarisse, L., Clerbaux, C., Coheur, P. F., and Collard, A.: Hyperspectral Earth observation from IASI: Five years of accomplishments, B. Am. Meteorol. Soc., 93, 347–370, 2012.
Hodges, J. T., Lisak, D., Lavrentieva, N., Bykov, A., Sinitsa, L., Tennyson, J., Barber, R. J., and Tolchenov, R. N.: Comparison between theoretical calculations and high-resolution measurements of pressure broadening for near-infrared water spectra, J. Mol. Spectrosc., 249, 86–94, 2008.
Ismail, S. and Browell, E. V.: Airborne and spaceborne lidar measurements of water vapor profiles: a sensitivity analysis, Appl. Optics, 28, 3603–3615, 1989.
Ismail, S., Ferrare, R. A., Browell, E. V., Chen, G., Anderson, B., Kooi, S. A., Notari, A., Butler, C. F., Burton, S., Fenn, M., and Dunion, J. P.: LASE measurements of water vapor, aerosol, and cloud distributions in Saharan air layers and tropical disturbances, J. Atmos. Sci., 67, 1026–1047, 2010.
Kavaya, M. J., Beyon, J. Y., Koch, G. J., Petros, M., Petzar, P. J., Singh, U. N., Trieu, B. C., and Yu, J.: The Doppler Aerosol Wind (DAWN) Airborne, Wind-Profiling Coherent-Detection Lidar System: Overview and Preliminary Flight Results, J. Atmos. Ocean. Tech., 31, 826–842, https://doi.org/10.1175/JTECH-D-12-00274.1, 2014.
Kiemle, C., Groß, S., Wirth, M., and Bugliaro, L.: Airborne lidar observations of water vapor variability in tropical shallow convective environment, in: Shallow Clouds, Water Vapor, Circulation, and Climate Sensitivity, Springer International Publishing, 253–271, 2017.
Klaes, K. D., Cohen, M., Buhler, Y., Schlüssel, P., Munro, R., Luntama, J. P., von Engeln, A., Clérigh, E. Ó., Bonekamp, H., Ackermann, J., and Schmetz, J.: An introduction to the EUMETSAT polar system, B. Am. Meteorol. Soc., 88, 1085–1096, https://doi.org/10.1175/BAMS-88-7-1085, 2007.
Leblanc, T., McDermid, I. S., and Walsh, T. D.: Ground-based water vapor raman lidar measurements up to the upper troposphere and lower stratosphere for long-term monitoring, Atmos. Meas. Tech., 5, 17–36, https://doi.org/10.5194/amt-5-17-2012, 2012.
Le Marshall, J., Jung, J., Derber, J., Chahine, M., Treadon, R., Lord, S. J., Goldberg, M., Wolf, W., Liu, H. C., Joiner, J., and Woollen, J.: Improving global analysis and forecasting with AIRS, B. Am. Meteorol. Soc., 87, 891–894, 2006.
Liu, Z., Hunt, W., Vaughan, M., Hostetler, C., McGill, M., Powell, K., Winker, D., and Hu, Y.: Estimating random errors due to shot noise in backscatter lidar observations, Appl. Optics, 45, 4437–4447, 2006.
Martins, J. P., Teixeira, J., Soares, P. M., Miranda, P. M., Kahn, B. H., Dang, V. T., Irion, F. W., Fetzer, E. J., and Fishbein, E.: Infrared sounding of the trade-wind boundary layer: AIRS and the RICO experiment, Geophys. Res. Lett., 37, L24806, https://doi.org/10.1029/2010GL045902, 2010.
Moore, A. S., Brown, K. E., Hall, W. M., Barnes, J. C., Edwards, W. C., Petway, L. B., Little, A. D., Luck, W. S., Jones, I. W., Antill, C.W., and Browell, E. V.: Development of the Lidar Atmospheric Sensing Experiment (LASE) – an advanced airborne DIAL instrument, in: Advances in Atmospheric Remote Sensing with Lidar, Springer, Berlin, Germany, 281–288, 1997.
NASA/LARC/SD/ASDC: Aeolus CalVal HALO Aerosol and Water Vapor Profiles and Images, NASA Langley Atmospheric Science Data Center DAAC [data set], https://doi.org//10.5067/SUBORBITAL/AEOLUSCALVAL2019/DATA001, 2020.
Nehrir, A. R., Repasky, K. S., Carlsten, J. L., Obland, M. D., and Shaw, J. A.: Water Vapor Profiling Using a Widely Tunable, Amplified Diode-Laser-Based Differential Absorption Lidar (DIAL), J. Atmos. Ocean. Tech., 26, 733–745, 2009.
Nehrir, A. R., Repasky, K. S., and Carlsten, J. L.: Eye-safe diode-laser-based micropulse differential absorption lidar (DIAL) for water vapor profiling in the lower troposphere, J. Atmos. Ocean. Tech., 28, 131–147, 2011.
Nehrir, A. R., Repasky, K. S., and Carlsten, J. L.: Micropulse water vapor differential absorption lidar: transmitter design and performance, Opt. Express, 20, 25137–25151, 2012.
Nehrir, A. R., Kiemle, C., Lebsock, M. D., Kirchengast, G., Buehler, S. A., Löhnert, U., Liu, C. L., Hargrave, P. C., Barrera-Verdejo, M., and Winker, D. M.: Emerging technologies and synergies for airborne and space-based measurements of water vapor profiles, Surv. Geophys., 38, 1445–1482, 2017.
Philbrick, C. R.: Raman lidar measurements of atmospheric properties, in: Atmospheric Propagation and Remote Sensing III, edited by: Flood, W. A. and Miller, W. B., SPIE, 2222, 922–931, 1994.
Podolske, J. R., Sachse, G. W., and Diskin, G. S.: Calibration and data retrieval algorithms for the NASA Langley/Ames Diode Laser Hygrometer for the NASA transport and chemical evolution over the pacific (TRACE-P) mission, J. Geophys. Res., 108, 8792, https://doi.org/10.1029/2002JD003156, 2003.
Remsberg, E. E. and Gordley, L. L.: Analysis of differential absorption lidar from the Space Shuttle, Appl. Optics, 17, 624–630, 1978.
Richardson, M. T., Thompson, D. R., Kurowski, M. J., and Lebsock, M. D.: Boundary layer water vapour statistics from high-spatial-resolution spaceborne imaging spectroscopy, Atmos. Meas. Tech., 14, 5555–5576, https://doi.org/10.5194/amt-14-5555-2021, 2021.
Roman, J., Knuteson, R., August, T., Hultberg, T., Ackerman, S., and Revercomb, H.: A global assessment of NASA AIRS v6 and EUMETSAT IASI v6 precipitable water vapor using ground-based GPS SuomiNet stations, J. Geophys. Res.-Atmos., 121, 8925–8948, 2016.
Schäfler, A., Fix, A., and Wirth, M.: Mixing at the extratropical tropopause as characterized by collocated airborne H2O and O3 lidar observations, Atmos. Chem. Phys., 21, 5217–5234, https://doi.org/10.5194/acp-21-5217-2021, 2021.
Schotland, R. M.: Errors in the lidar measurement of atmospheric gases by differential absorption, J. Appl. Meteorol., 13, 71–77, 1974.
Sherwood, S. C., Roca, R., Weckwerth, T. M., and Andronova, N. G.: Tropospheric water vapor, convection, and climate, Rev. Geophys., 48, RG2001, https://doi.org/10.1029/2009RG000301, 2010.
Späth, F., Behrendt, A., Muppa, S. K., Metzendorf, S., Riede, A., and Wulfmeyer, V.: 3-D water vapor field in the atmospheric boundary layer observed with scanning differential absorption lidar, Atmos. Meas. Tech., 9, 1701–1720, https://doi.org/10.5194/amt-9-1701-2016, 2016.
Späth, F., Behrendt, A., and Wulfmeyer, V.: Minimization of the Rayleigh-Doppler error of differential absorption lidar by frequency tuning: a simulation study, Opt. Express, 28, 30324–30339, 2020.
Spuler, S. M., Repasky, K. S., Morley, B., Moen, D., Hayman, M., and Nehrir, A. R.: Field-deployable diode-laser-based differential absorption lidar (DIAL) for profiling water vapor, Atmos. Meas. Tech., 8, 1073–1087, https://doi.org/10.5194/amt-8-1073-2015, 2015.
Spuler, S. M., Hayman, M., Stillwell, R. A., Carnes, J., Bernatsky, T., and Repasky, K. S.: MicroPulse DIAL (MPD) – a diode-laser-based lidar architecture for quantitative atmospheric profiling, Atmos. Meas. Tech., 14, 4593–4616, https://doi.org/10.5194/amt-14-4593-2021, 2021.
Stoffelen, A., Pailleux, J., Källén, E., Vaughan, J. M., Isaksen, L., Flamant, P., Wergen, W., Andersson, E., Schyberg, H., Culoma, A., and Meynart, R.: The atmospheric dynamics mission for global wind field measurement, B. Am. Meteorol. Soc., 86, 73–88, 2005.
Teixeira, J., Piepmeier, J. R., Nehrir, A. R., Ao, C. O., Chen, S. S., Clayson, C. A., Fridlind, A. M., Lebsock, M., McCarty, W., Salmun, H., Santanello, J. A., Turner, D. D., Wang, Z., and Zeng, X.: Toward a Global Planetary Boundary Layer Observing System, The NASA PBL Incubation Study Team Report, 134 pp., 2021.
Thrastarson, H. T., Manning, E., Kahn, B., Fetzer, E., Yue, Q., Wong, S., Kalmus, P., Payne, V., Wang, T., Olsen, E. T., Wilson, R. C., Blaisdell, J., Iredell, L., Susskind, J., Warner, J., and Cady-Pereira, K.: AIRS/AMSU/HSB Version 7 Level 2 Product User Guide, Jet Propulsion Laboratory, California Institute of Technology, Pasadena, CA, USA, 2020.
Thompson, D. R., Kahn, B. H., Brodrick, P. G., Lebsock, M. D., Richardson, M., and Green, R. O.: Spectroscopic imaging of sub-kilometer spatial structure in lower-tropospheric water vapor, Atmos. Meas. Tech., 14, 2827–2840, https://doi.org/10.5194/amt-14-2827-2021, 2021.
Trenberth, K. E., Jones, P. D., Ambenje, P., Bojariu, R., Easterling, D., Klein Tank, A., Parker, D., Rahimzadeh, F., Renwick, J. A., Rusticucci, M., Soden, B., and Zhai, P.: Observations: Surface and atmospheric climate change, chap. 3, in: Climate Change 2007: The Physical Science Basis. Contribution of Working Group I to the Fourth Assessment Report of the Intergovernmental Panel on Climate Change, edited by: Solomon, S., Qin, D., Manning, M., Chen, Z., Marquis, M., Averyt, K. B., Tignor, M., and Miller, H. L., Cambridge University Press, Cambridge, United Kingdom and New York, NY, USA, 236–336, 2007.
Turner, D. D. and Löhnert, U.: Ground-based temperature and humidity profiling: combining active and passive remote sensors, Atmos. Meas. Tech., 14, 3033–3048, https://doi.org/10.5194/amt-14-3033-2021, 2021.
Wakimoto, R. M., Murphey, H. V., Browell, E. V., and Ismail, S.: The “triple point” on 24 May 2002 during IHOP. Part I: Airborne Doppler and LASE analyses of the frontal boundaries and convection initiation, Mon. Weather Rev., 134, 231–250, 2006.
Whiteman, D. N., Melfi, S. H., and Ferrare, R. A.: Raman lidar system for the measurement of water vapor and aerosols in the Earth's atmosphere, Appl. Optics, 31, 3068–3082, 1992.
Wirth, M., Fix, A., Mahnke, P., Schwarzer, H., Schrandt, F., and Ehret, G.: The airborne multi-wavelength water vapor differential absorption lidar WALES: system design and performance, Appl. Phys. B, 96, 201–213, 2009.
Wong, S., Fetzer, E. J., Schreier, M., Manipon, G., Fishbein, E. F., Kahn, B. H., Yue, Q., and Irion, F. W.: Cloud-induced uncertainties in AIRS and ECMWF temperature and specific humidity, J. Geophys. Res.-Atmos., 120, 1880–1901, 2015.
Wu, Y., Nehrir, A. R., Ren, X., Dickerson, R. R., Huang, J., Stratton, P. R., Gronoff, G., Kooi, S. A., Collins, J. E., Berkoff, T. A., and Lei, L.: Synergistic aircraft and ground observations of transported wildfire smoke and its impact on air quality in New York City during the summer 2018 LISTOS campaign, Sci. Total Environ., 773, 145030, https://doi.org/10.1016/j.scitotenv.2021.145030, 2021.
Wulfmeyer, V.: Ground-based differential absorption lidar for water-vapor and temperature profiling: development and specifications of a high-performance laser transmitter, Appl. Optics, 37, 3804–3824, 1998.
Wulfmeyer, V. and Bösenberg, J.: Ground-based differential absorption lidar for water-vapor profiling: assessment of accuracy, resolution, and meteorological applications, Appl. Optics, 37, 3825–3844, 1998.
Wulfmeyer, V., Bauer, H. S., Grzeschik, M., Behrendt, A., Vandenberghe, F., Browell, E. V., Ismail, S., and Ferrare, R. A.: Four-dimensional variational assimilation of water vapor differential absorption lidar data: The first case study within IHOP_2002, Mon. Weather Rev., 134, 209–230, 2006.
Wulfmeyer, V., Hardesty, R. M., Turner, D. D., Behrendt, A., Cadeddu, M. P., Di Girolamo, P., Schlüssel, P., Van Baelen, J., and Zus, F.: A review of the remote sensing of lower tropospheric thermodynamic profiles and its indispensable role for the understanding and the simulation of water and energy cycles, Rev. Geophys., 53, 819–895, 2015.
- Abstract
- Introduction
- Instruments and comparison methodology
- DIAL principle and HALO measurements
- HALO water vapor retrieval methodology
- Data product comparisons and discussion
- Conclusions
- Data availability
- Author contributions
- Competing interests
- Disclaimer
- Acknowledgements
- Financial support
- Review statement
- References