the Creative Commons Attribution 4.0 License.
the Creative Commons Attribution 4.0 License.
 | 13 Mar 2023
An evaluation of the U.S. EPA's correction equation for PurpleAir sensor data in smoke, dust, and wintertime urban pollution events
Colleen Miller
Katie Thompson
Brandon Finley
Manna Nelson
James Ouimette
Elisabeth Andrews
PurpleAir sensors (PASs) are low-cost tools to measure fine particulate matter (PM) concentrations and are now widely used, especially in regions with few regulatory monitors. However, the raw PAS data have significant biases, so the sensors must be calibrated to generate accurate data. The U.S. EPA recently developed a national correction equation and has integrated corrected PAS data onto its AirNow website. This integration results in much better spatial coverage for PM2.5 (particulate matter with diameters less than 2.5 µm) across the US. The goal of our study is to evaluate the EPA correction equation for three different types of aerosols: typical urban wintertime aerosol, smoke from biomass burning, and mineral dust.
We identified 50 individual pollution events, each having a peak hourly PM2.5 concentration of at least 47 µg m−3 and a minimum of 3 h over 40 µg m−3 and characterized the primary aerosol type as either typical urban, smoke, or long-range transported dust. For each event, we paired a PAS sampling outside air with a nearby regulatory PM2.5 monitor to evaluate the agreement. All 50 events show statistically significant correlations (R values between 0.71–1.00) between the hourly PAS and regulatory data but with varying slopes. We then corrected the PAS data using either the correction equation from Barkjohn et al. (2021) or a new equation that is now being used by the U.S. EPA for the AirNow Fire and Smoke Map (U.S. EPA, 2022b). Both equations do a good job at correcting the data for smoke and typical pollution events but with some differences. Using the Barkjohn et al. (2021) equation, we find mean slopes of 1.00 and 0.99 for urban and smoke aerosol events, respectively, for the corrected data versus the regulatory data. For heavy smoke events, we find a small change in the slope at very high PM2.5 concentrations (> 600 µg m−3), suggesting a ∼ 20 % underestimate in the corrected PAS data at these extremely high concentrations. Using the new EPA equation, we find slopes of 0.95 and 0.88 for urban and smoke events, respectively, indicating a slight underestimate in PM2.5 using this equation, especially for smoke events. For dust events, while the PAS and regulatory data still show significant correlations, the PAS data using either correction equation underestimate the true PM2.5 by a factor of 5–6.
We also examined several years of co-located regulatory and PAS data from a site near Owens Lake, California (CA), which experiences high concentrations of PM2.5 due to both smoke and locally emitted dust. For this site, we find similar results as above; the corrected PAS data are accurate in smoke but are too low by a factor of 5–6 in dust. Using these data, we also find that the ratios of PAS-measured PM10 PM1 mass and 0.3 µm 5 µm particle counts are significantly different for dust compared to smoke. Using this difference, we propose a modified correction equation that improves the PAS data for some dust events, but further work is needed to improve this algorithm.
- Article
(1372 KB) - Full-text XML
-
Supplement
(936 KB) - BibTeX
- EndNote


Low-cost air sensors are becoming a ubiquitous way for the general public to measure local air quality. There are now thousands of these sensors publicly reporting data in real time to the PurpleAir map (http://map.purpleair.com, last access: 4 March 2023). As one example, there are more than 700 active PurpleAir sensors (PASs) in the Puget Sound region of Washington State (from Tacoma to Everett), compared to ∼ 15 regulatory monitors in the same area. This provides an enormous increase in spatial information on PM2.5 (particulate matter with diameters less than 2.5 µm). However, there are no clear performance standards for accuracy or precision of low-cost sensors. Several studies have examined the performance of low-cost sensors, including the PAS (Singer and Delp, 2018; Li et al., 2020; Ardon-Dryer et al., 2020; Manibusan and Mainelis, 2020; Tryner et al., 2020). The PAS uses the Plantower PMS5003 laser sensor to count particles that scatter light in the optical range (particles greater than about 0.2 µm in diameter). Most outdoor PASs include two identical PMS5003 sensors that can be compared to enhance quality control. The PAS data can be downloaded with two “conversion factors”, CF = 1 or CF = Atm (atmosphere). The two PM2.5 values are nearly identical until 25 µg m−3, but above this value CF = 1 will be greater. The exact algorithm used by the PAS to convert the Plantower data to mass concentration using either the CF = 1 or the CF = Atm factors has not been published (Ouimette et al., 2022).
Tryner et al. (2020) evaluated three low-cost PM sensors, including the PMS5003, by exposing them to five different types of aerosols in the laboratory. They found that the ratios of PMS5003-reported to filter-derived PM2.5 mass concentrations were inversely proportional to mass median diameter (MMD). Wood smoke had the smallest MMD, 0.42 µm; its PMS5003 PM2.5 mass had a mean that was 2.5 times the filter-derived mass. Conversely, oil mist had the largest MMD at 2.9 µm; its PMS5003 PM2.5 averaged only 0.23 times the filter-derived PM2.5. These lab results are consistent with the physical-optical model developed for the PMS5003 by Ouimette et al. (2022). The model predicted that the PMS5003 response decreases relative to an ideal nephelometer by about 70 %–90 % for particle diameters ≥ 1.0 µm. This is a result of using a laser that is polarized, the angular truncation of the scattered light, and particle losses (e.g., due to aspiration) before reaching the laser. Their model predicted that the PMS5003 would underestimate PM2.5 for dust particles by approximately 70 %–90 %, depending on the coarse particle size distribution.
The Plantower sensor reports PM mass concentrations in three bins (PM1, PM2.5, and PM10) and particle counts in six size bins (> 0.3, > 0.5, > 1, > 2.5, > 5, and > 10 µm), presumably based on the pulse height of the scattered radiation, although the exact procedure is not documented by Plantower or PurpleAir. The PAS also reports temperature, relative humidity (RH), and pressure. A number of field and laboratory studies have found that the particle number size distributions reported by the PMS5003 are not correct. Several studies have reported that the PMS5003 tends to create an invariant normalized size distribution, independent of the actual size distribution and concentration (Tryner et al., 2020; He et al., 2020; Kuula et al., 2020; Ouimette et al., 2022). However, the PMS5003 normalized size fractions above 1 µm increased by a factor of 2–5 in one high-PM2.5 windblown dust episode observed at Keeler, California (CA; Ouimette et al., 2022). So, at present, there remains some ambiguity over how the PAS-reported PM2.5 mass concentrations and particle counts respond to different aerosol types.
Aerosol size distributions can vary considerably depending on the source type. Previous studies have shown that the aerosol size distributions for smoke events are similar to the distributions in typical urban pollution events, with a geometric mean diameter of around 0.2–0.3 µm (Kleeman et al., 1999; Laing et al., 2016). The mass ratio of PM2.5 PM10 for smoke, 0.55–0.75, is also similar to that for urban pollution (Xu et al., 2017). Dust events are known to have size distributions that are shifted towards larger particles, compared to typical urban and smoke aerosols. Jiang et al. (2018) report an average PM2.5 PM10 ratio of 0.1 for dust events in China. Sugimoto et al. (2016) suggest a value of 0.35 for the PM2.5 PM10 ratio in dust, similar to the values reported by Tong et al. (2012). In addition, aerosol particles from some cooking methods, such as barbecue, may also have a size distribution that is shifted to larger sizes (Kleeman et al., 1999; Song et al., 2018). If this is correct, then this may have implications for using PAS data to examine indoor air quality.
The South Coast Air Quality Management District (South Coast AQMD) has completed a rigorous evaluation of a variety of sensors, including the PAS (South Coast AQMD, 2015). This evaluation has shown that the PAS gave precise results, showed little response to temperature or humidity, and had relatively small variations between units. The U.S. Environmental Protection Agency (EPA) also provides information about these sensors via its Air Sensor Toolbox portal for citizen scientists, researchers, and developers (U.S. EPA, 2022a). All of these evaluations have demonstrated that the raw PAS measurements are precise but often biased high compared to regulatory PM2.5 measurements in the United States. Several groups have developed correction equations for the PAS measurements. The Lane Regional Air Protection Agency (LRAPA), the University of Utah, and the EPA have empirical corrections for PM2.5, and these can be implemented directly on the PurpleAir website (PurpleAir, 2022). Barkjohn et al. (2021) (hereafter referred to as Barkjohn 2021) conducted a comprehensive evaluation of PAS PM2.5 data against regulatory PM2.5 data and developed a US-wide correction equation starting from PAS raw data (CF = 1) and using the RH as measured by the PAS:
The LRAPA and the Barkjohn corrections are in close agreement, whereas the University of Utah correction gives somewhat higher values. While the Barkjohn 2021 algorithm (Eq. 1) was initially used by the EPA, they have recently developed a new correction algorithm that is now being used for the national Fire and Smoke Map (Johnson Barkjohn et al., 2022). This algorithm differs significantly from the earlier Barkjohn 2021 relationship in that it starts from the PAS data with CF = Atm and involves a more complex, five-part piecewise regression, with weighting to smooth the transitions between segments. For our analysis, we will refer to the new algorithm as “new EPA”. Note that the PAS data can be downloaded with either CF = 1 or CF = Atm. In the present analysis, we start from raw data with CF = 1 (for Barkjohn 2021) or CF = Atm (for the new EPA correction). Figure S1 in the Supplement compares the raw CF = Atm data with the new EPA correction algorithm, and Fig. S2 compares the Barkjohn 2021 and the new EPA correction for the data used in Part I of this analysis.
Because many PAS devices are now installed around the world, both outside and inside, they can experience a wide range of aerosol types. Thus, it is essential to understand the accuracy and precision of the PAS for various aerosol events, which could differ based on the particle size distribution or other aerosol characteristics. In this study, we evaluated the Barkjohn 2021 correction and the new EPA correction for 50 different aerosol pollution events, encompassing typical urban aerosols, as well as smoke and dust aerosols. Our goals are the following:
-
to evaluate the accuracy of both correction equations for each aerosol type;
-
to examine whether the correction changes at very high PM2.5 levels (e.g., > 250 µg m−3);
-
to identify whether the PAS data can provide an indication of the aerosol type and, if so, whether this information can be used to improve the correction algorithm.
Below we first describe data treatment and events and aerosol type identification. Then we report on results comparing regulatory and PAS observations for different aerosol types for 50 short-term pollution events. We also use a longer time series from a single site (Keeler, CA) that experiences frequent episodes of high dust and smoke pollution. Our results demonstrate that the PAS sensors can give accurate PM2.5 data in urban pollution and smoke, but more work is needed to develop an improved correction for dust aerosols.
2.1 Part I: 50 paired sites
For this analysis we identified 50 short-term pollution events where the aerosols could be clearly characterized as either typical urban, smoke, or dust. For these events, PAS data were downloaded for each sensor from the PurpleAir website (http://map.purpleair.com). The raw data (CF = 1 and CF = Atm) were downloaded as hourly averages. Regulatory PM data for the nearest monitoring site were downloaded from the EPA Air Data website (https://www.epa.gov/outdoor-air-quality-data, last access: 4 March 2023) or the AirNow-Tech website (https://www.airnowtech.org/, last access: 4 March 2023), except for data from the monitoring site at Portland Cully Helensview School in Portland, Oregon (OR; Air Quality System – AQS – ID 410512011), which were downloaded from the Oregon Department of Environmental Quality website (https://www.oregon.gov/deq/aq, last access: 4 March 2023).
Table 1Methodology for identification of pollution events for 50 cases in Part I.
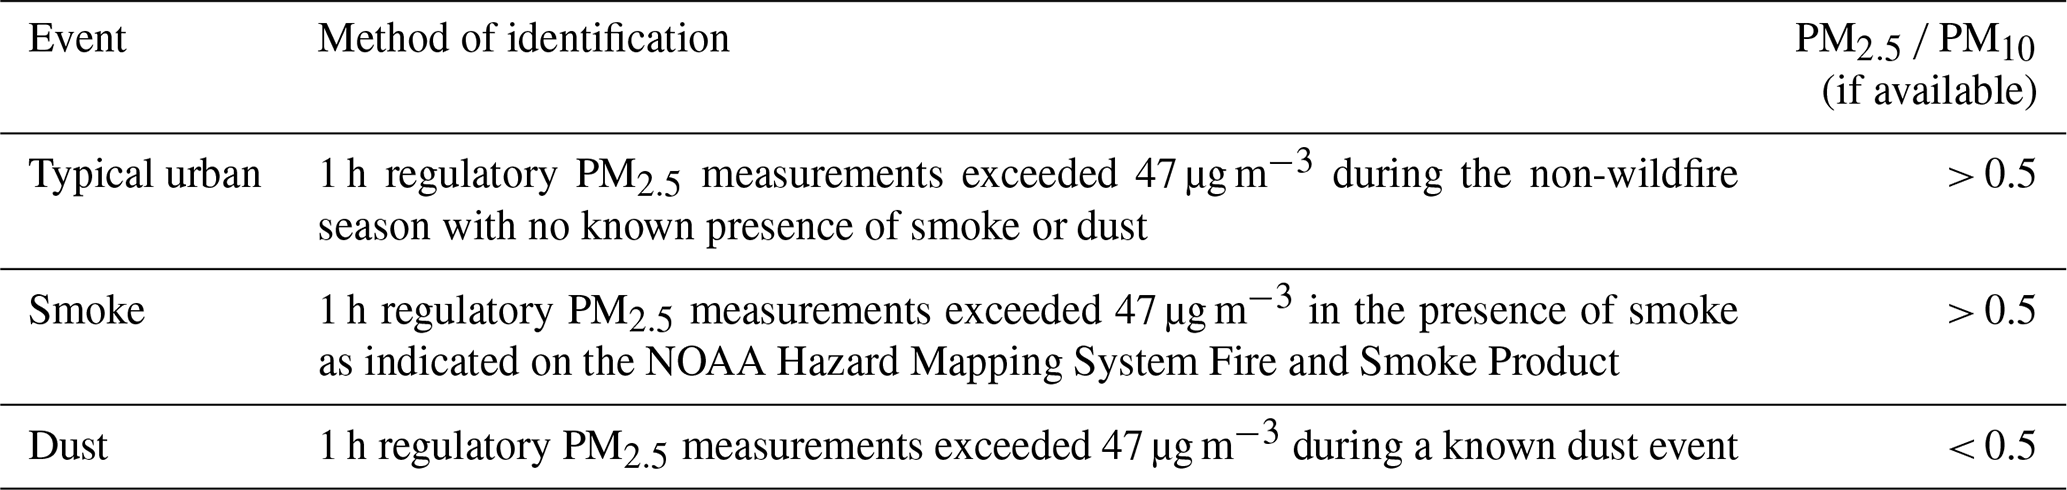
For each paired PAS–regulatory site, we identified an intense pollution event that had an hourly peak PM2.5 value at the regulatory site of > 40 µg m−3 for at least 3 h. We also required that there be a good correlation between the regulatory and PAS data. For the 50 events we analyzed, the correlation coefficients between the regulatory and corrected PAS data ranged from 0.77 to 0.996. For each pollution event, we identified the most likely source of elevated aerosols: typical urban wintertime pollution, biomass burning smoke, or dust. Table 1 summarizes the method used to characterize each pollution event. Table S1 provides details on each of the 50 individual events, including the PAS site, regulatory site ID, event dates, and distance between the two sites. The average distance between the PAS and regulatory sites was 5.4 km, with a range of 0–15 km. As shown in Fig. S3, there is no significant relationship between the correlation coefficient and distance between sites.
Typical urban pollution events were identified for the non-wildfire season (winter months) and with no evidence of smoke or dust. The PM sources for those events reflect typical urban wintertime pollution (vehicles, power plants, industry, and residential wood combustion), and the PM2.5 mass is dominated by particles with diameters in the range of 0.30–0.60 µm (Zhang et al., 2010; Herner et al., 2005). The typical urban pollution events had peak hourly PM2.5 values at the regulatory sites of 47–259 µg m−3.
Smoke events were identified by elevated PM2.5 during the summer fire season and confirmed using the Hazard Mapping System (HMS) Fire and Smoke Product (Rolph et al., 2009; Kaulfus et al., 2017). The HMS product is derived from multiple satellite images and updated multiple times each day. Details on the HMS product are given in the references above. The HMS imagery was obtained via the AirNow-Tech website. The smoke events had the highest peak PM2.5 values at the regulatory sites with peak hourly values of 60–713 µg m−3.
Dust events were identified by examining large-scale spatial patterns of PM2.5, media reports, and the measured PM10 PM2.5 ratios from regulatory sites, if available. In Part I of our analysis, all six dust events occurred during the well-known June 2020 Saharan dust cloud that was transported to the US and impacted surface concentrations across the southern US (Francis et al., 2020; Euphrasie-Clotilde et al., 2021; Pu and Jin, 2021). This event brought huge amounts of dust to the southern US and resulted in daily average PM2.5 concentrations of 60–103 µg m−3 at many locations. The six dust events included in our analysis had peak hourly PM2.5 values at the regulatory sites of 52–72 µg m−3. Figure S4 shows the impact of this dust on PM2.5 across the southeastern US.
In total, we identified 50 events as either typical urban, smoke, or dust, lasting from 24 to 528 h. We verified that each had an operating PAS and a nearby regulatory monitoring site. For typical urban pollution, 16 cases were identified, with the majority (13) located in California and the remainder in Utah. We identified 28 smoke cases, with locations in Alaska, California, Idaho, Oregon, and Washington. Six dust cases were identified, with locations throughout the southeastern US. Of the 50 events identified, 17 have co-located regulatory PM10 data (3 urban, 8 smoke, and 6 dust). The event times were chosen to incorporate a few hours of low concentrations before and after the highest PM2.5 concentrations to improve correlations. The corrections on these low PAS values can sometimes yield negative values at high RH. If corrected PAS values were less than 2 µg m−3, these values were excluded from the calculation of correlation with the regulatory measurements.
2.2 Data quality control
The data were quality-controlled and screened using four criteria:
-
Since most PASs contain two sensors, A and B, we compared mass concentrations from the two sensors and the data were used only if the values were within 30 %. Most values are much closer than this, with an average difference of 10 % across all events considered (4.6 % for the Keeler, CA, PAS data).
-
The PAS raw A and B values were averaged and excluded if less than 1 µg m−3.
-
The PAS values were corrected using the Barkjohn 2021 correction and included only if greater than 2 µg m−3.
-
Regulatory PM2.5 data must be greater than 1 µg m−3 (there were a number values that were 0 or negative in the EPA's PM2.5 data records).
In total, these steps removed approximately 10 % of the available data. After screening, the PAS data were corrected using the Barkjohn et al. (2021) and the new EPA correction algorithms. We evaluated both sets of corrected PAS data using the same linear relationship using standard linear regression:
We also compared the slopes with reduced major-axis regression (RMA) and found essentially no difference in the results. Generally, the intercepts were small (a few micrograms per cubic meter), so we can interpret the slopes as giving the overall indication of agreement between the two datasets. A slope near 1 with a zero intercept would indicate no bias. A slope of < 1 indicates that the corrected PAS data are biased high compared to the regulatory data; a slope of > 1 indicates the corrected PAS data are biased low compared to the regulatory data.
2.3 Part II: Keeler, CA, site
To further understand the nature of the PAS response to dust aerosol, we also used data from Keeler, CA, near Owens Lake. Owens Lake is a dry lake bed due to diversion of its primary water source, the Owens River, to Los Angeles. As a result, the dry lake bed is one of the largest sources of dust in North America (Cahill et al., 1996; Gillette et al., 1997), and the region experiences many significant dust events each year. With increasing drought, it appears that the dust flux from Owens Lake is increasing (Borlina and Rennó, 2017). We use regulatory PM2.5 and PM10 data from February 2019–May 2022 from a site in Keeler, CA, and a nearby PAS site. Both the regulatory and PAS instruments are operated and maintained by the Great Basin Unified Air Pollution Control District (GBUAPCD; Chris Howard, personal communication, December 2022), and the regulatory data were obtained from their data archive (https://www.gbuapcd.org/, last access: 4 March 2023). The regulatory PM2.5 was measured using a Thermo Fisher model 1400a TEOM with a model 8500C conditioning system. For PM10, a Thermo Fisher model 1400a TEOM was used from February 2019 through September 2021 and a model 1405 TEOM was used from October 2021 through May 2022. Other information about the site is given in Table S2. The Keeler PAS and regulatory sensor inlets are within 4 m of each other. For the Keeler PAS data, as in Part I, we use the mean of channels A and B, which have a mean difference of 4.6 %. For the Keeler analysis, we did not specifically identify events. Instead, we consider only hours where the Keeler regulatory PM2.5 was > 25 µg m−3, which provides 1366 h of data spanning a 3.3-year period. We also restrict the analysis of the Keeler data to hours where regulatory PM10 exceeds PM2.5 by at least 0.5 µg m−3 and where simultaneous regulatory and PAS data are available. This yields 1257 h of data with mean PM2.5 and PM10 concentrations from the regulatory monitors of 59 and 118 µg m−3, respectively.
3.1 Part I: event analysis
Figure 1 shows time series plots of two example events (no. 44 and no. 45). The top plot in Fig. 1 shows PAS and regulatory data during a major smoke event in Washington State during July–August 2021. The regulatory PM2.5 exceeded 200 µg m−3 at this site. This figure demonstrates that the Barkjohn 2021 correction yields excellent bias correction of the data. The new EPA correction also improves the fit, compared to the raw data, but appears to yield a positive bias at the highest concentrations (200–250 µg m−3). The bottom plot in Fig. 1 shows data from a dust period in June 2020 (event no. 45). In contrast to the smoke event, the raw PA data are much lower than the regulatory data, and both correction algorithms significantly underpredict the regulatory values; there is essentially no difference between the two correction schemes. While there is still a good correlation between the regulatory and PAS data (R value of 0.82), the slope is 6.76, indicating that both correction equations are significantly underestimating the true concentrations by a factor of 6 or more. Table S3 shows the results for each of the 50 individual events. Table 2 summarizes the relationship and correlation slopes between the corrected PAS data and the regulatory measurements for the 50 events and for the 3 different aerosol types. The results are consistent with Fig. 1 in that urban pollution and smoke events are reasonably corrected by either the Barkjohn 2021 or the new EPA algorithms, whereas dust events are not. There are some differences between the two correction equations, which we discuss below.
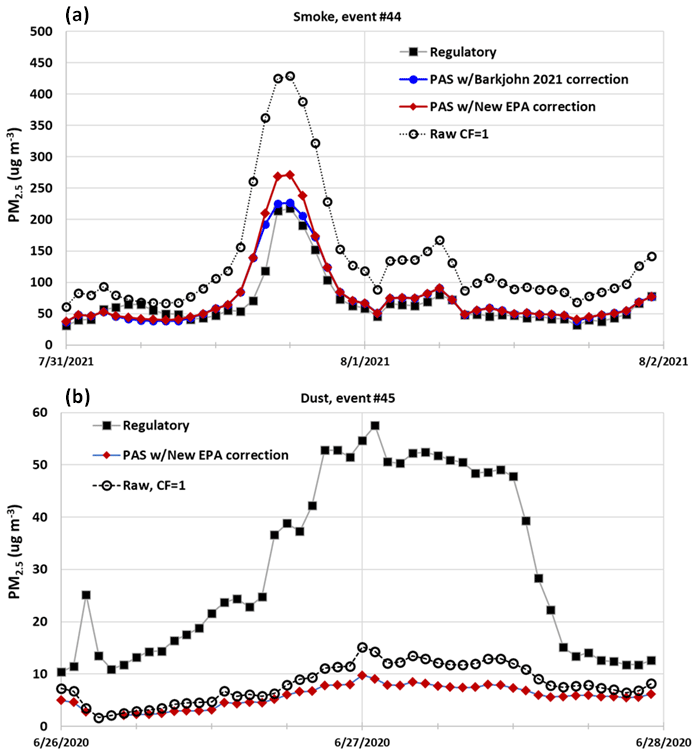
Figure 1Time series of hourly regulatory and PAS PM2.5 (raw and corrected) data for two events, no. 44 (smoke, a) and no. 45 (dust, b). Time is in UTC. Note that for the dust event (no. 45), the two correction schemes give identical results. Details on the sites used for these figures are given in Tables S1 and S3. For event no. 44, the slopes (using Eq. 2) comparing the Barkjohn 2021 and new EPA correction schemes are 0.81 and 0.70, respectively. For event no. 45, the slope using the Barkjohn 2021 correction scheme is 6.76. Please note that the date format used in this figure is month/day/year.
Table 2Peak regulatory PM2.5, mean slope, and R2 results from analysis of regulatory and PAS data, with the Barkjohn 2021 correction and new EPA correction, for 50 individual pollution events (Part I dataset). N gives the number of events of each type; SD is standard deviation. R2 is the mean value for all events of that type. Also shown are the average slopes by aerosol type for the PM1 PM10 and 0.3 µm 5 µm count regressions, both of which are unitless.

Table 3Relationship between hourly regulatory PM2.5 and corrected PAS PM2.5 with the Barkjohn 2021 algorithm. Data are included for all simultaneous measurements for the 50 identified events in Part I. (N gives the number of hours of data of each type.)
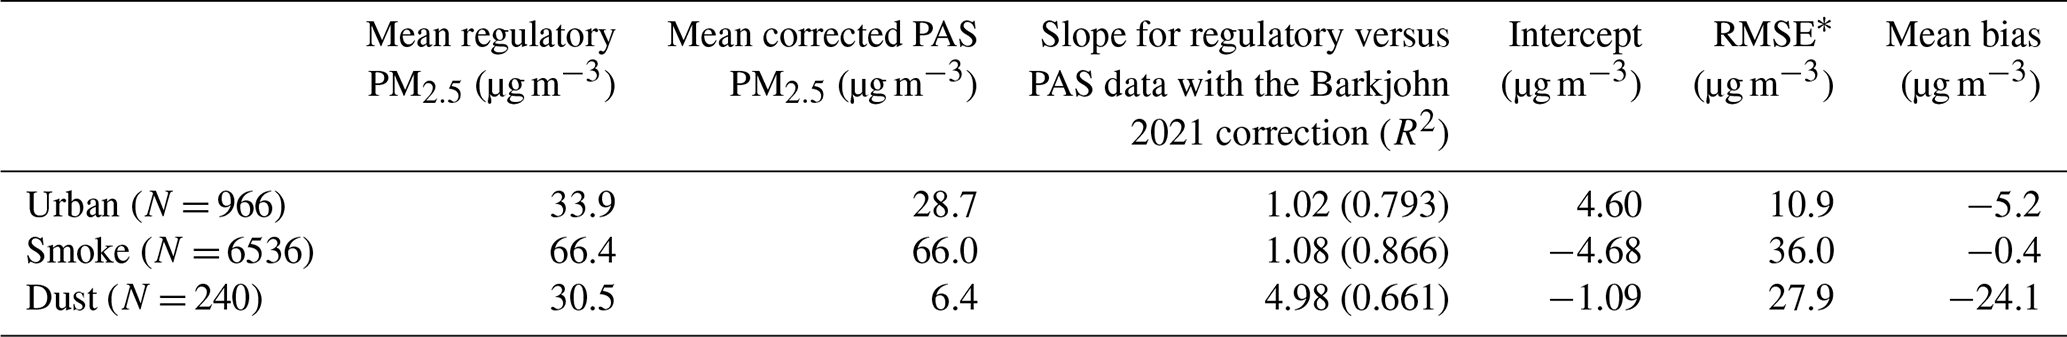
∗ Root mean square error.
Table 4Relationship between hourly regulatory PM2.5 and corrected PAS PM2.5 with the new EPA algorithm. Data are included for all simultaneous measurements for the 50 identified events in Part I. (N gives number of hours of data of each type.)
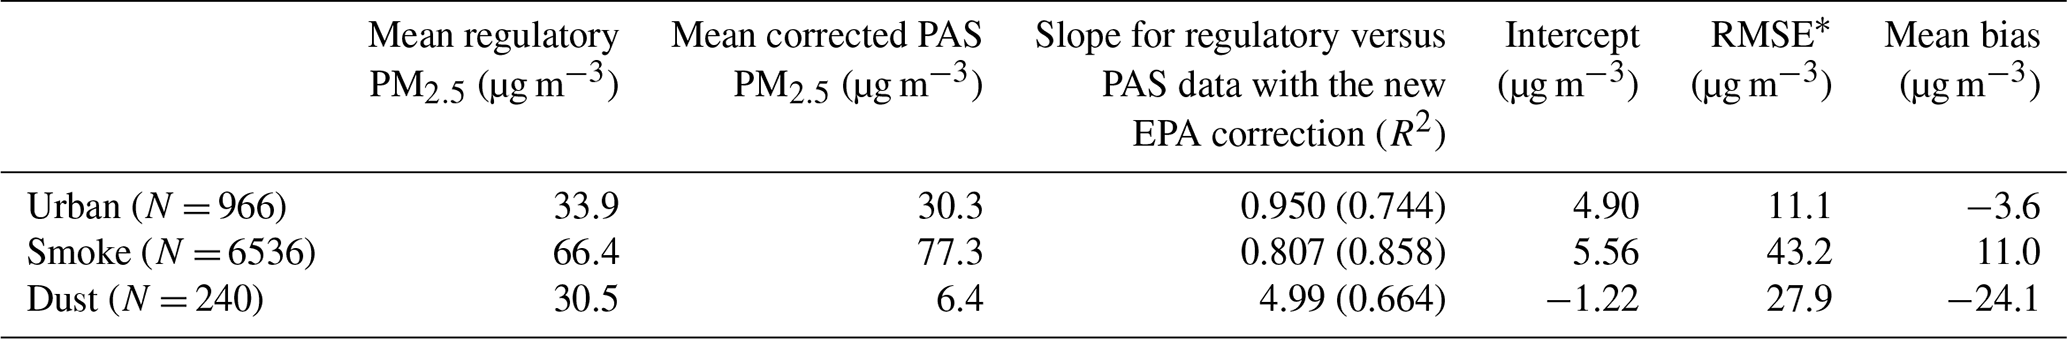
∗ Root mean square error.
Tables 3 and 4 summarize the results by aerosol type and include all hourly data for each identified aerosol type. Table 3 uses the Barkjohn 2021 correction, whereas Table 4 shows results using the new EPA correction. For urban, smoke, and dust aerosols, the slope of regulatory PM2.5 versus the corrected PAS data with the Barkjohn 2021 algorithm were 1.02, 1.08, and 4.98, respectively, using all hourly data of each type (Table 3). Using the new EPA correction, the slopes were 0.95, 0.81, and 4.99, respectively (Table 4). These slopes indicate that both correction algorithms yield excellent bias correction for typical urban and smoke events, but they exacerbate the large negative (low) bias for dust events. Using either correction on the PAS data during dust events gives values that are low by a factor of 5–6.
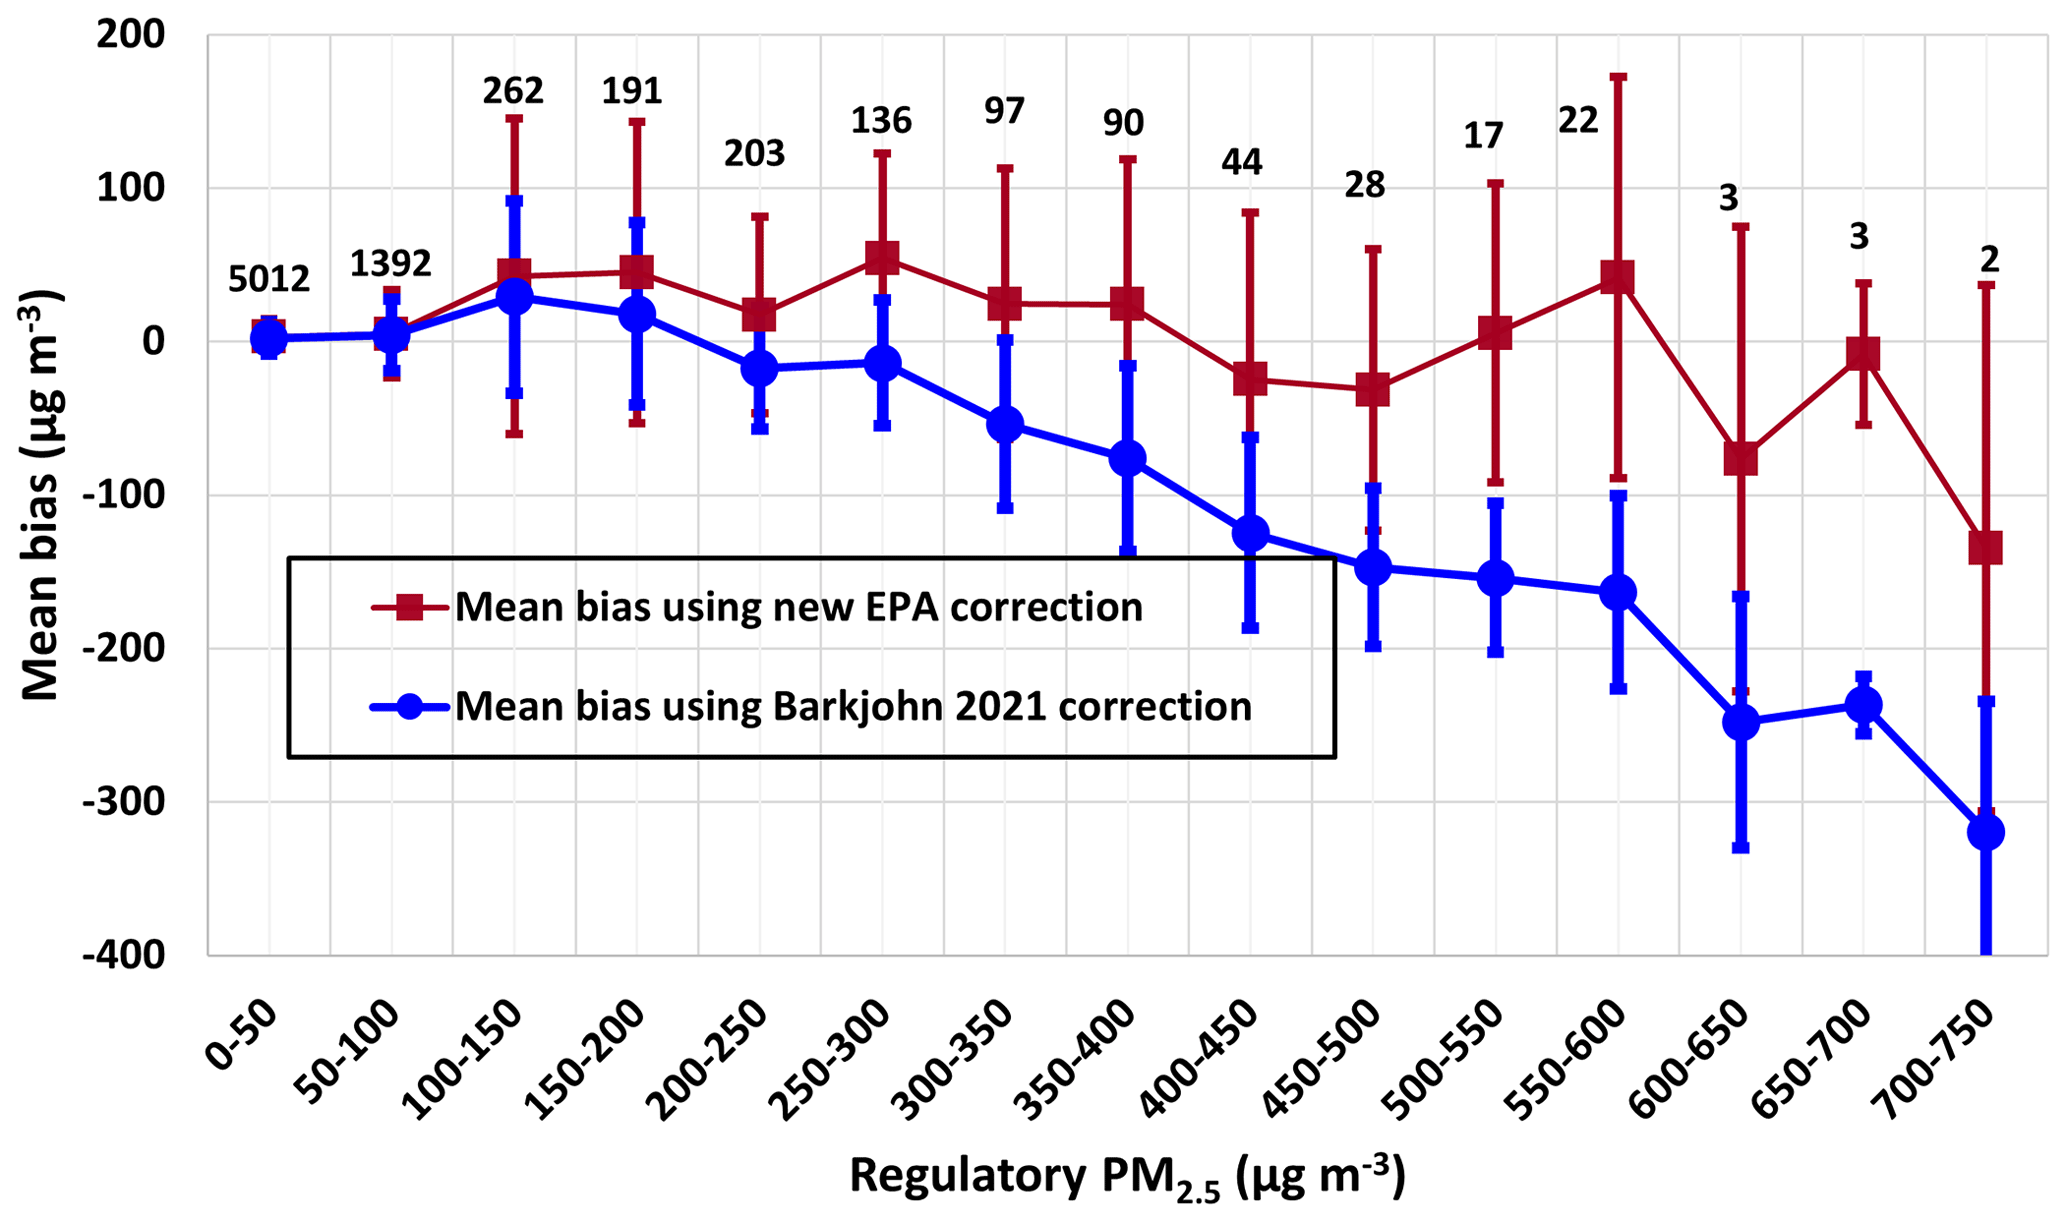
Figure 2Comparison of mean bias (corrected PAS–regulatory data) using the hourly data for smoke and urban pollution events in Part I using the Barkjohn 2021 and new EPA correction schemes. Data are binned by regulatory PM2.5 in 50 µg m−3 bins, as shown on the x axis. The values above the red points are the number of hourly data points in each bin, which is the same for both the Barkjohn 2021 and the new EPA-corrected values. The error bars show 1 standard deviation within that bin.
Tables 2, 3, and 4 suggest that the new EPA algorithm has slightly lower slopes, especially for the smoke events. For example, the mean slope for smoke events (shown in Table 2) is 0.99 for the Barkjohn 2021 correction versus 0.88 for the new EPA correction. Similarly, using hourly data for smoke-influenced periods, the slopes are 1.08 using the Barkjohn 2021 correction (Table 3) versus 0.81 using the new EPA correction (Table 4). We also want to examine whether there is evidence that the PAS data respond differently at very high PM concentrations. Figure 2 shows the mean bias using the hourly data with both correction algorithms versus the regulatory PM2.5. This plot includes only data during the urban and smoke events. The bias is strongly negative using the Barkjohn 2021 correction at very high PM2.5, greater than about 300 µg m−3. At medium-high PM2.5 concentrations, such as 150–300 µg m−3, the new EPA correction shows a positive bias, which is consistent with the results shown in Fig. 1a and Tables 2–4. Thus we conclude that the new EPA correction improves the bias at very high concentrations (> 300 µg m−3) but introduces a modest bias at moderately high pollution levels (150–300 µg m−3), compared to the Barkjohn 2021 algorithm.
We show above that the raw PAS data, along with both corrections, are substantially underreporting PM2.5 concentrations during dust events. The next question is whether the PAS data can give some information about dust events (i.e., the presence/absence of dust), despite significant issues with the reported size distribution (Ouimette et al., 2022). To address this question, we calculated the slopes of the PM1 PM10 mass ratios and the 0.3 µm 5 µm particle count ratio, using the PAS data for each event. The results are reported by event type in Table 2. The results show that the PAS reports a greater fraction of coarse mass and proportionally more larger particles, compared to the 0.3 µm particles, in the dust aerosols, compared to urban or smoke aerosols. Both the PM1 PM10 mass ratio and the 0.3 µm 5 µm particle count ratio increase in the order of dust < smoke < urban. These differences are statistically significant (p < 0.05) for urban versus dust using a two sample, two-tailed t test and assuming unequal variance. These relationships will be explored further below in Part II of this analysis.
We also looked at the coarse aerosol fraction (CAF) for these events using both the regulatory and PAS data. We define the CAF as
Out of the 50 events considered, 17 have both regulatory PM2.5 and PM10. Figure 3 shows the CAF, calculated using both the regulatory data and the PAS raw data for all hours for the 17 events with both PM2.5 and PM10 data. For the PAS data, we use the raw values (CF = 1) for PM2.5 and PM10, since there are no known correction algorithms for the PM10 data. Several things are apparent in Fig. 3. First, the CAF values using the regulatory data are much higher than CAF values obtained from the PAS data. Nonetheless, both the regulatory and PAS data show the expected pattern of a higher CAF in dust compared to the other aerosol types. In addition, the number of data points is much higher for the PAS, due to the relative sparsity of regulatory PM10 data. We note that these relationships change very little if the PAS data are restricted to the same times as the regulatory data.
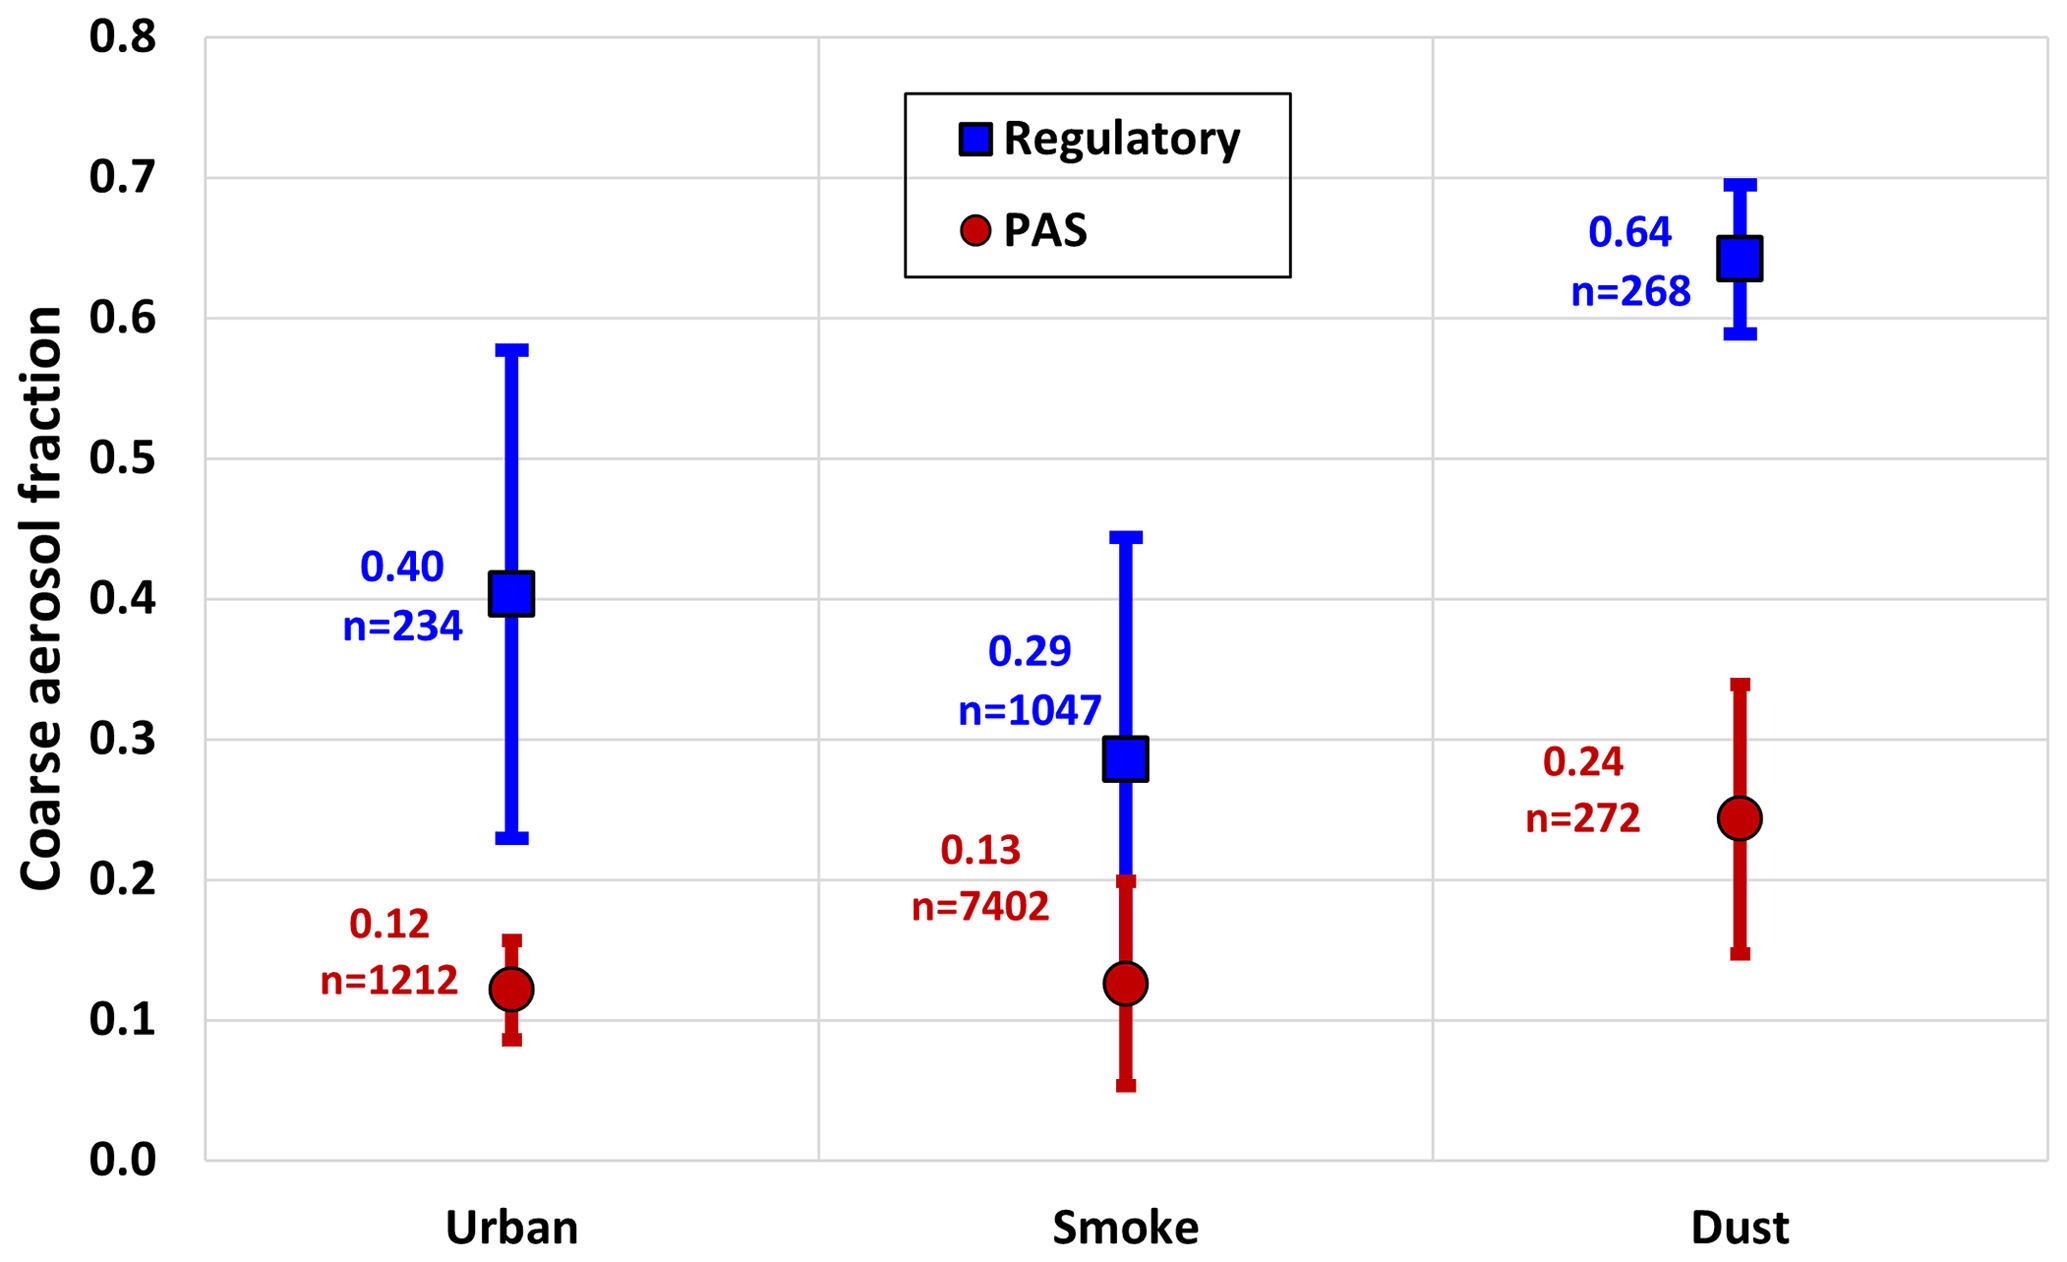
Figure 3Mean coarse aerosol fraction (CAF) (Eq. 3) calculated using the regulatory data and the PAS raw (CF = 1) data for 17 events from the Part I dataset that had both PM2.5 and PM10. The values near each point give the mean and number of data points (hours) in each bin.
3.2 Part II: Keeler, CA, analysis
In Part II we use the multi-year dataset from the Owens Lake and Keeler, CA, site. The hourly data cover a period of a little more than 3 years (February 2019–May 2022). We focus exclusively on hours with regulatory PM2.5 > 2.5 µg m−3, which yields 1257 h, after our quality control described above. Table S2 has more details on both the regulatory and PAS sites in Keeler, CA.
Figure 4 shows a histogram of the CAF based on the regulatory data. There is a clear bimodal distribution, indicating two very different aerosol types during these pollution events. Given that Keeler is ca. 150 km from the urban areas of Bakersfield and Fresno, CA, this aerosol is likely either dust generated from Owens Lake or smoke from the many California wildfires during 2019–2022. For the points with a CAF of < 0.5 (n = 1013 h), the vast majority (99 %) occurred in August–October 2020 or August–September 2021, both times when large fires were burning in central California and influencing air quality across the region. Thus, it is reasonable to conclude that those hours with a CAF of < 0.5 are predominantly wildfire smoke (1013 h) and those with a CAF of > 0.7 (200 h) are predominantly dust. In contrast to the smoke data, the dust data tend to occur in the winter and spring periods. There are relatively fewer points (44 h) with 0.5 < CAF < 0.7, and these appear to have a mixed character, as shown below.

Figure 4Histogram of coarse aerosol fraction (CAF) at Keeler, CA, using regulatory PM2.5 and PM10 data for hours with PM2.5 of > 25 µg m−3. We assume that the aerosol is primarily smoke when the CAF is < 0.5, mixed when the CAF is between 0.5 and 0.7, and dust for times when the CAF is > 0.7.
Table 5Mean regulatory (reg) PM2.5, PAS PM2.5 (with the Barkjohn 2021 correction and with the proposed dust correction), ratio of PAS PM1 PM10 raw concentrations (CF = 1), and ratio of PAS 0.3 µm 5 µm counts by coarse aerosol fraction (CAF) bins. The CAF bins are centered on the indicated value.

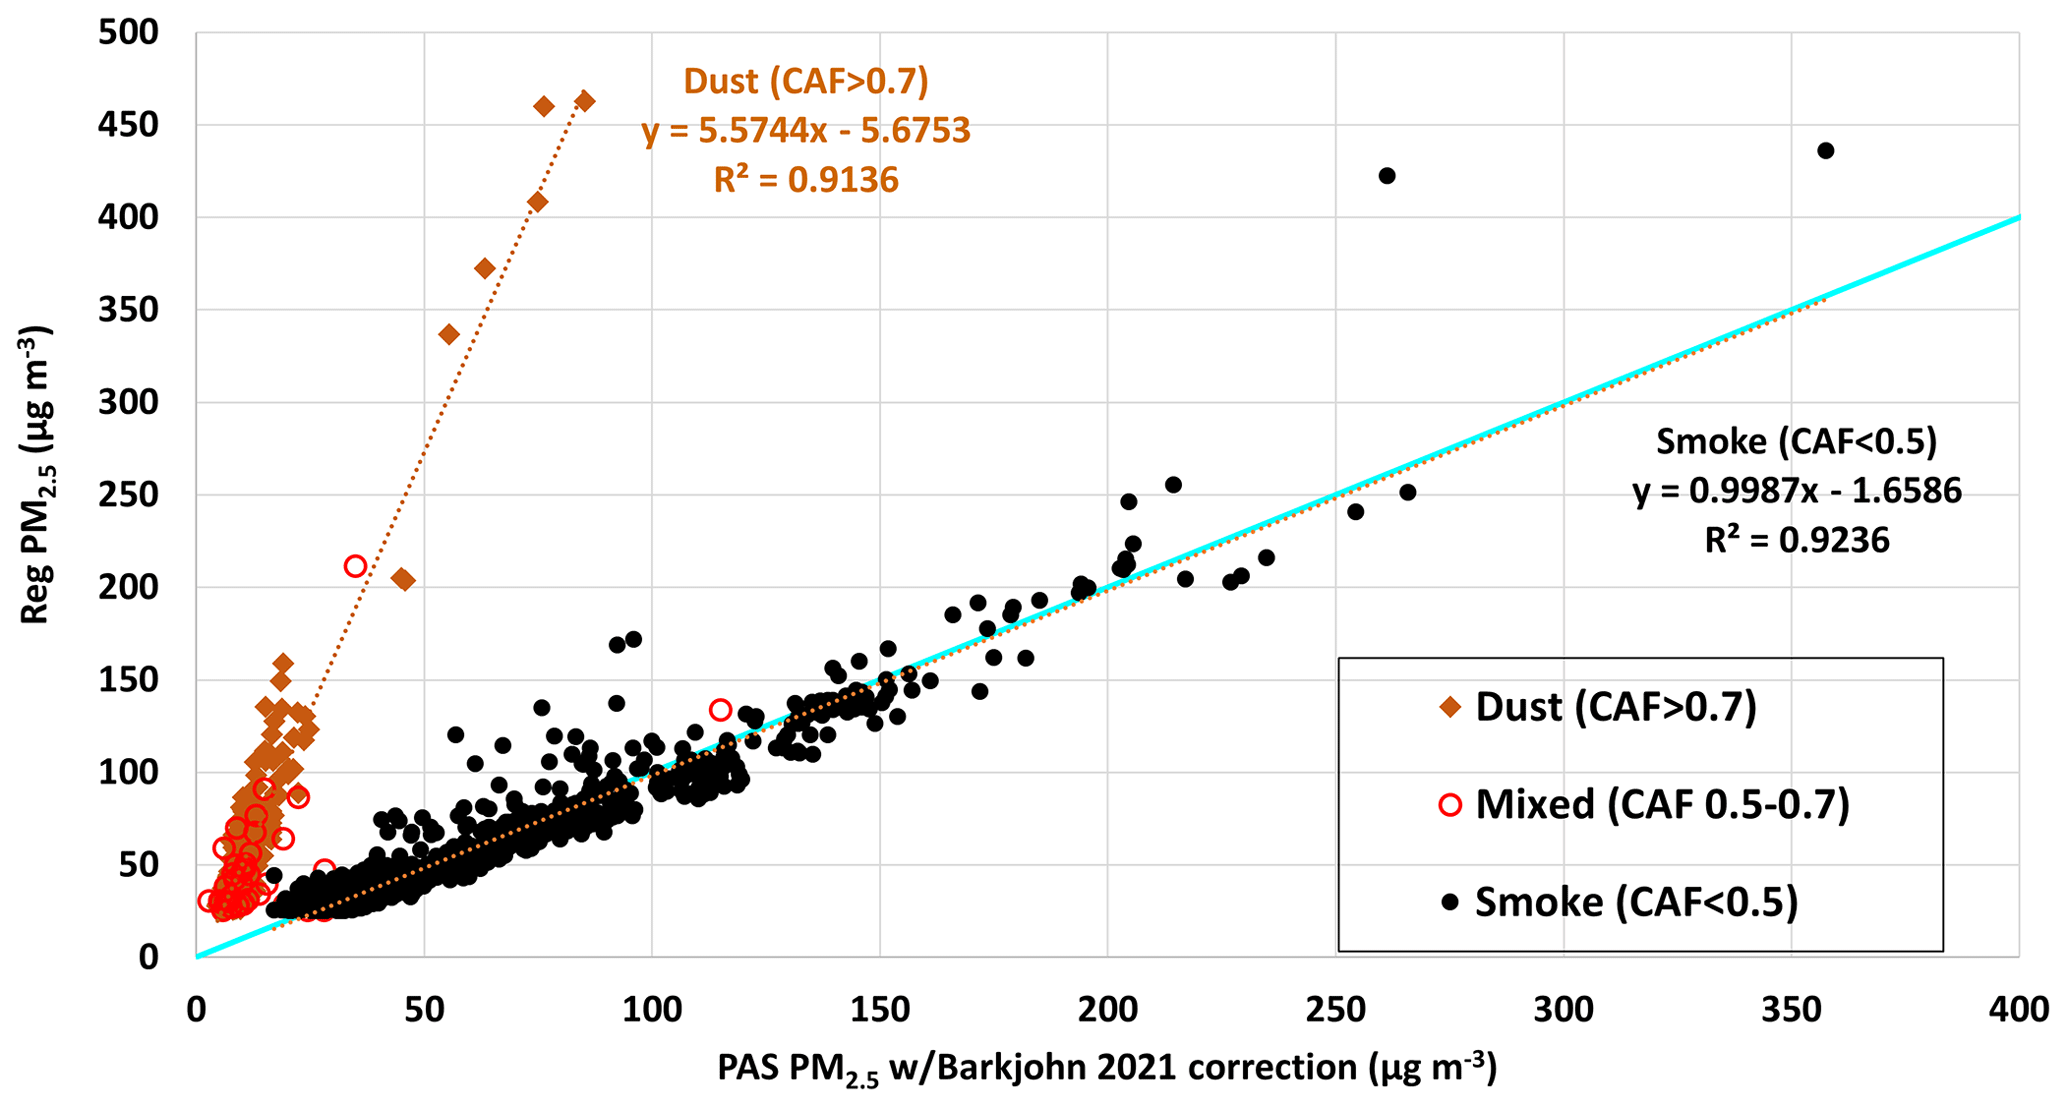
Figure 5Regulatory PM2.5 versus PAS PM2.5 with the Barkjohn 2021 correction at Keeler, CA, for hours with regulatory PM2.5 of > 25 µg m−3. The data are separated by the coarse aerosol fraction (CAF), as measured by the regulatory data. Linear regression relationships are shown with dotted lines, and the light blue line shows a 1 : 1 relationship.
Table 5 and Fig. 5 show results grouped by the CAF calculated using the regulatory data. Tables shows that for all values of the CAF below 0.5, there are similar ratios of PM1 PM10 and 0.3 µm 0.5 µm counts. For this group, the PAS PM2.5 with the Barkjohn 2021 correction shows a good fit to the regulatory PM2.5. For the values with a CAF of > 0.7, there is similar consistency in the PAS-measured ratios (PM1 PM10 and 0.3 µm 5 µm counts), but for this group the PAS Barkjohn 2021 correction significantly underestimates the regulatory concentrations. For the group with the CAF is between 0.5 and 0.7, the aerosol has a mixed character, likely including both smoke and dust.
Figure 5 shows a plot of the regulatory PM2.5 versus PAS PM2.5 with the Barkjohn 2021 correction, sorted by these three groups (CAF < 0.5, 0.5 < CAF < 0.7, and CAF > 0.7). For the smoke aerosols, the PAS with the Barkjohn 2021 correction shows a slope of 0.99 and an R2 of 0.92, whereas for the dust aerosols, the slope is 5.6, similar to the slopes shown in Table 2 (5.5) and Table 3 (5.0). Thus, we conclude that for dust aerosols the PAS values with the Barkjohn 2021 correction show a underestimate of 5–6 times the PM2.5 regulatory values. The mixed aerosols show behavior that is more difficult to characterize, with some showing more similarity to dust and others to smoke.
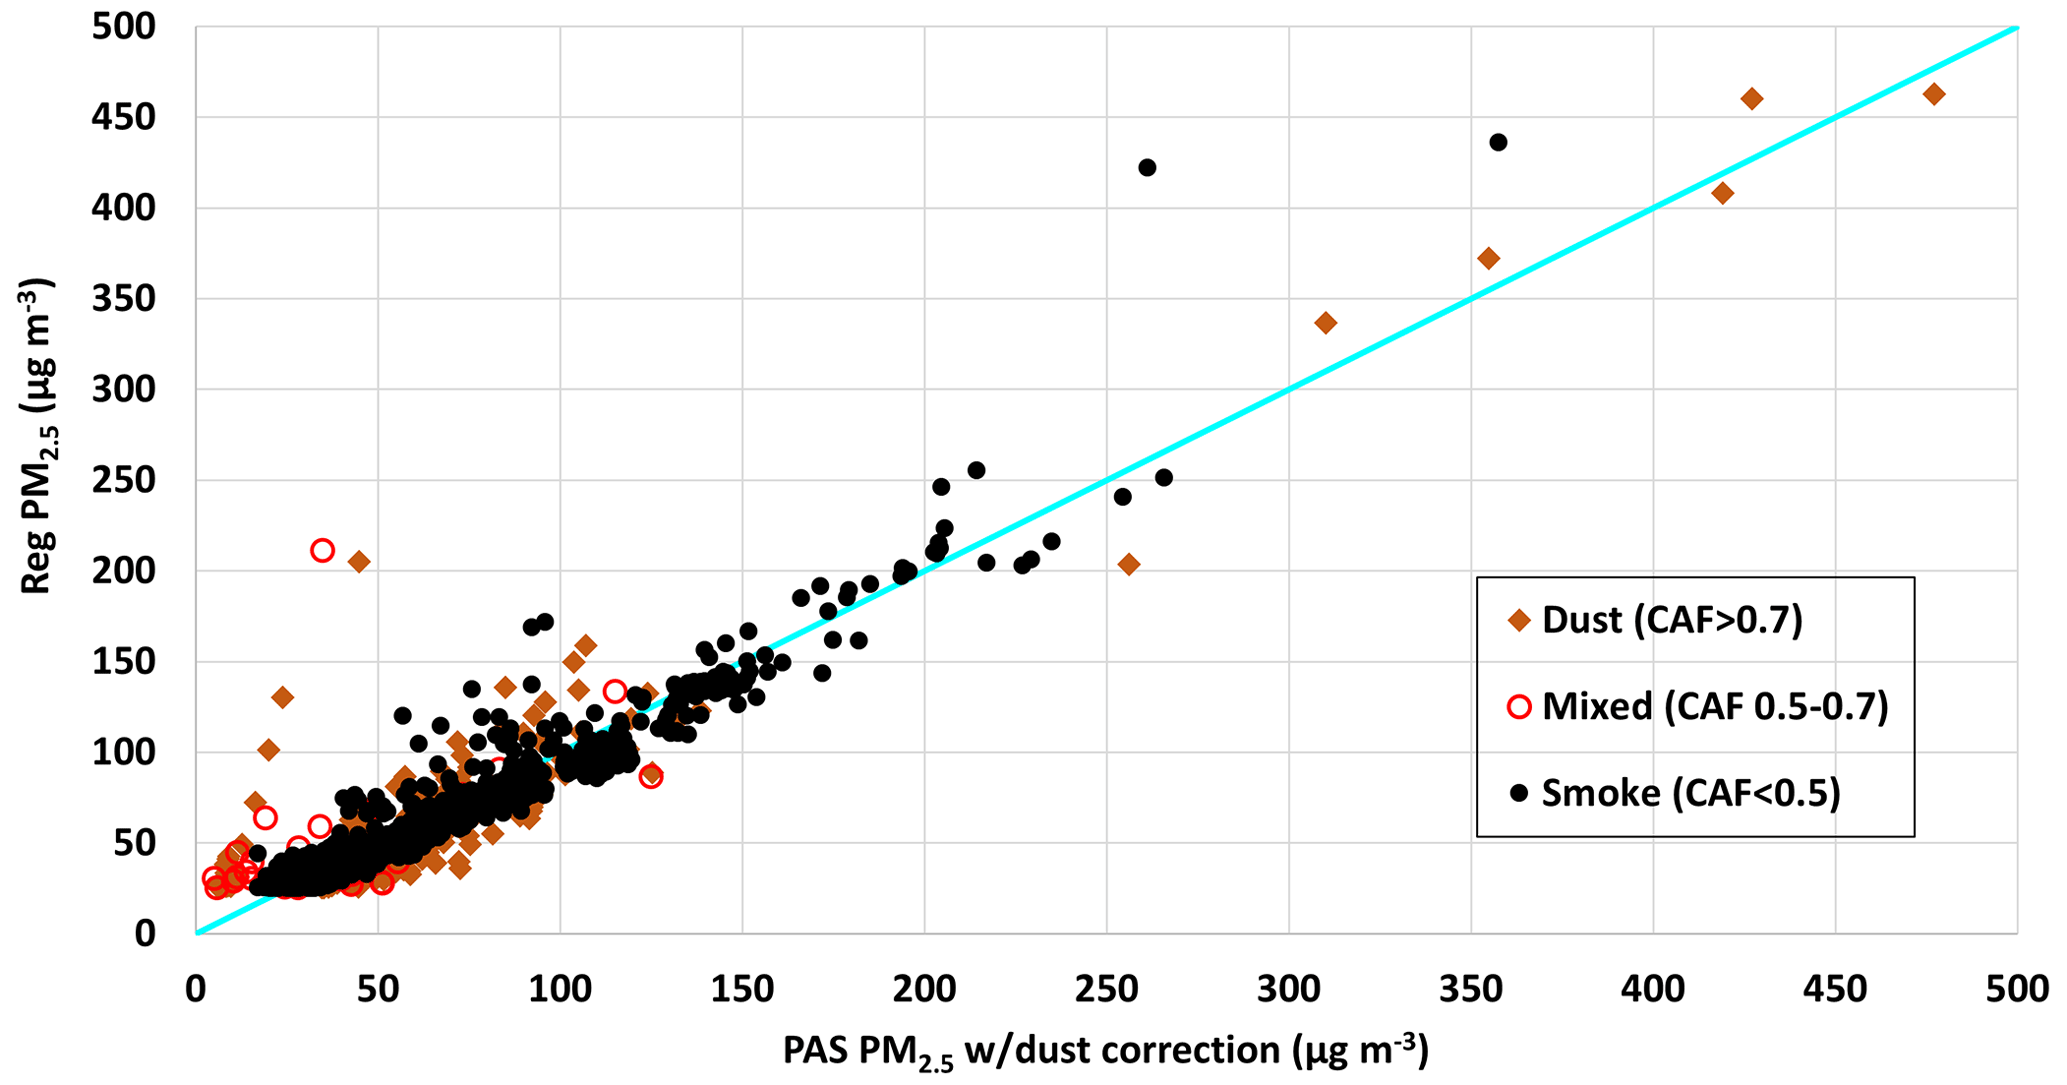
Figure 6Regulatory PM2.5 versus PAS PM2.5 with the dust correction (Eq. 4) at Keeler, CA, for hours with regulatory PM2.5 of > 25 µg m−3. The data are separated by the coarse aerosol fraction (CAF), as measured by the regulatory data. The light blue line shows a 1 : 1 relationship.
Figures S5 and S6 show the 0.3 µm 5 µm counts and the ratios of PM1 PM10, as measured by the PAS versus the CAF, and Table 5 shows a summary of the data segregated by the CAF. Both ratios of PM1 PM10 and the 0.3 µm 5 µm counts show clear differentiation for the low-CAF aerosols compared to the high-CAF aerosols. So these unitless ratios provide a tool that can identify dust aerosols so that a separate correction can be applied. We explored both the PM1 PM10 mass concentrations and the ratio of 0.3 µm 5 µm counts as tools to identify PM2.5 aerosol that is dominated by dust. Figure S5 and Table 5 show that using a ratio of the 0.3 µm 5 µm counts of somewhere between 150–250 will provide the best separation of dust and mixed aerosols. By examination of various plots of regulatory PM2.5 versus corrected PAS PM2.5 for the Keeler, CA, data, we found an optimum value of 190. The value of 5.6 comes from the slope of the dust aerosols in Fig. 5. So, this leads to a new correction equation that depends on PAS-measured values:
In Eq. (4), we use the Barkjohn 2021 correction, but in practice there is little difference in the results regardless of whether this or the new EPA correction is used. Figure 6 shows a plot of the Keeler, CA, regulatory PM2.5 versus PAS PM2.5 with Eq. (4) applied. There is very little change to the smoke data as most of these points have PAS-measured 0.3 µm 5 µm counts of > 190. For the dust aerosols, the majority of the data points are now much closer to the regulatory values. The mean bias for the points with a CAF of > 0.7 is now 1.3 µg m−3 compared with 51.4 µg m−3 for the dust data using the Barkjohn 2021 correction. Figures S7 and S8 show how the choice of the 0.3 µm 5 µm ratio impacts the analysis. Using a higher threshold in Eq. (4) results in identifying some points (smoke) with corrected PM2.5 values that are substantially too high. Using a lower threshold in Eq. (4) results in missing some dust points and, for those points, generating corrected PAS PM2.5 values that are too low. While using a value of 190 in Eq. (4) does miss a small number of dust points, it appears to be the best balance in finding and correcting the dust data points for this location. Finally, Fig. S9 shows regulatory PM2.5 versus PAS PM2.5 with the new EPA correction separated by the CAF. The results are nearly identical to Fig. 5, showing that both the Barkjohn 2021 and new EPA correction algorithms have similar behavior with dust aerosols.
Equation (4) was developed based on data from one site (Keeler) that has strong dust and smoke occurrence and with the sensors in close proximity (30 m). We apply Eq. (4) to the 50 events from different sites identified in Part I and find a wider range of results. Table S3 summarizes the results for each event. Out of the six dust events, four show moderate improvements with slopes of 0.46–0.72. However, for some smoke events (e.g., 38, 39, and 40), the slopes are dramatically lower, in the range of 0.17–0.26, which indicates that the data corrected by PAS with the dust algorithm (Eq. 4) are overestimating the regulatory data by a large amount. This occurs due to the fact that during these smoke events some hours have a ratio of the 0.3 µm 5 µm counts of > 190 and thus get multiplied by 5.6. So, while the new dust algorithm does appear to improve corrected PAS data in dust events at a single controlled site that is operated by an air quality agency, it does not provide a useful correction for the bulk of publicly operated sensors. Nonetheless, the fact that the PAS data indicate changes in the observed ratios of PM1 PM10 and the 0.3 µm 5 µm counts during mineral dust events indicates that the PAS data do provide some useful information on dust and that more work to identify a suitable correction algorithm for dust is warranted.
PASs are now ubiquitous around the world and far outnumber the more accurate, regulatory-grade instruments for PM2.5. These low-cost sensor data are proving to be highly valuable for a variety of analyses but especially for improving our understanding of the spatial distribution of PM2.5. However, to use these data, it is essential to understand the measurements. Using the Barkjohn 2021 and new EPA correction algorithm for PAS data, we find that the sensors give reasonably accurate results for PM2.5 for typical urban wintertime pollution and smoke events but give concentrations that are a factor of 5–6 too low for dust events. The Barkjohn 2021 algorithm yields a negative bias at very high PM2.5 concentrations (> 300 µg m−3), whereas the new EPA algorithm yields a positive bias at moderate PM2.5 concentrations (150–300 µg m−3). Both algorithms underestimate PM2.5 during dust events by a factor of 5–6. Using the PAS ratios of PM10 PM1 mass concentrations and 0.3 µm 5 µm counts, we find that there are significant differences in these ratios for smoke and dust at a site with frequent incursions of both aerosol types. Using this result, we propose a new PAS correction algorithm that significantly improves the correction for dust aerosols and does not change the results for smoke aerosols but only at this one site. Applying this equation to a broader array of sites, we find significant problems with the proposed dust algorithm – it improves PAS PM2.5 estimates in some dust cases but worsens PAS PM2.5 estimates for some smoke events. Nonetheless, our analysis demonstrates that it may be possible to develop an improved PAS correction algorithm that could identify dust and provide a better estimate of the PM2.5 concentrations when dust is present.
All data used in this analysis are publicly available. Most regulatory data were obtained from the EPA Air Data site (https://www.epa.gov/outdoor-air-quality-data, U.S. EPA, 2023a) and the AirNow-Tech site (https://www.airnowtech.org/, U.S. EPA, 2023b). Data for the Keeler, CA, site were from the Great Basin Unified Air Pollution Control District (https://www.gbuapcd.org/cgi-bin/downloadData, GBUCD, 2023). Data for the Portland Cully Helensview School in Portland, OR, were downloaded from the Oregon Department of Environmental Quality website (https://www.oregon.gov/deq/aq, Oregon Department of Environmental Quality, 2023). PurpleAir data were from the PurpleAir site (http://map.purpleair.com, PurpleAir, 2022).
The supplement related to this article is available online at: https://doi.org/10.5194/amt-16-1311-2023-supplement.
DAJ designed the study, developed the analysis protocols, and wrote the manuscript. CM, KT, and MN conducted data analysis. BF, JO, and EA reviewed the manuscript and provided comments on the analysis.
The contact author has declared that none of the authors has any competing interests.
Publisher’s note: Copernicus Publications remains neutral with regard to jurisdictional claims in published maps and institutional affiliations.
We wish to acknowledge and thank the many individuals that have made their PAS data freely available for scientific analysis.
Support for this work came from the National Oceanic and Atmospheric Administration (grant no. NA22OAR4310203) and the University of Washington Bothell's Scholarship, Research, and Creative Practice (SRCP) Seed Grant Program. Manna Nelson was supported by an internship from the Confederated Tribes of the Colville Reservation, which was funded by an EPA environmental justice grant. Elisabeth Andrews was supported by the NOAA cooperative agreement with the Cooperative Institute for Research in Environmental Sciences (CIRES; grant no. NA17OAR4320101).
This paper was edited by Albert Presto and reviewed by two anonymous referees.
Ardon-Dryer, K., Dryer, Y., Williams, J. N., and Moghimi, N.: Measurements of PM2.5 with PurpleAir under atmospheric conditions, Atmos. Meas. Tech., 13, 5441–5458, https://doi.org/10.5194/amt-13-5441-2020, 2020.
Barkjohn, K. K., Gantt, B., and Clements, A. L.: Development and application of a United States-wide correction for PM2.5 data collected with the PurpleAir sensor, Atmos. Meas. Tech., 14, 4617–4637, https://doi.org/10.5194/amt-14-4617-2021, 2021.
Borlina, C. S. and Rennó, N. O.: The impact of a severe drought on dust lifting in California's Owens Lake area, Sci. Rep., 7, 1784, https://doi.org/10.1038/s41598-017-01829-7, 2017.
Cahill, T. A., Gill, T. E., Reid, J. S., Gearhart, E. A., and Gillette, D. A.: Saltating particles, playa crusts and dust aerosols at Owens (Dry) Lake, California, Earth Surf. Proc. Land., 21, 7, 621–639, https://doi.org/10.1002/(SICI)1096-9837(199607)21:7<621::AID-ESP661>3.0.CO;2-E, 1996.
Euphrasie-Clotilde, L., Plocoste, T., and Brute, F.-N.: Particle size analysis of African dust haze over the last 20 years: a focus on the extreme event of June 2020, Atmosphere, 12, 502, https://doi.org/10.3390/atmos12040502, 2021.
Francis, D., Fonseca, R., Nelli, N., Cuesta, J., Weston, M., Evan, A., and Temimi, M.: The atmospheric drivers of the major Saharan dust storm in June 2020, Geophys. Res. Lett., 47, e2020GL090102, https://doi.org/10.1029/2020GL090102, 2020.
Gillette, D. A., Fryrear, D. W., Xiao, J. B., Stockton, P., Ono, D., Helm, P. J., Gill, T. E., and Ley, T.: Large-scale variability of wind erosion mass flux rates at Owens Lake: 1. Vertical profiles of horizontal mass fluxes of wind-eroded particles with diameter greater than 50 µm, J. Geophys. Res., 102, 25977–25987, https://doi.org/10.1029/97JD00961, 1997.
Great Basin Unified Control District (GBUCD): Data for the Keeler, CA, site, Great Basin Unified Control District [data set], https://www.gbuapcd.org/cgi-bin/downloadData, last access: 4 March 2023.
He, M. L., Kuerbanjiang, N., and Dhaniyala, S.: Performance characteristics of the low-cost Plantower PMS optical sensor, Aerosol Sci. Tech., 54, 232–241, https://doi.org/10.1080/02786826.2019.1696015, 2020.
Herner, J., Aw, J., Gao, O., Chang, D. P., and Kleeman, M.: Size and composition distribution of airborne particulate matter in Northern California: 1-particulate mass, carbon, and water-soluble ions, Air Waste, 55, 30–51, https://doi.org/10.1080/10473289.2005.10464600, 2005.
Jiang, N., Dong, Z., Xu, Y., Yu, F., Yin, S., Zhang, R., and Tang, X.: Characterization of PM10 and PM2.5 source profiles of fugitive dust in Zhengzhou, China, Aerosol Air Qual. Res., 18, 314–329, https://doi.org/10.4209/aaqr.2017.04.0132, 2018.
Johnson Barkjohn, K., Holder, A., Clements, C., Frederick, S., and Evans, R.: Sensor data cleaning and correction: Application on the AirNow Fire and Smoke Map, U.S. EPA, https://cfpub.epa.gov/si/si_public_record_report.cfm?dirEntryId=353088&Lab=CEMM, last access: 13 December 2022.
Kaulfus, A. S., Nair, U., Jaffe, D. A., Christopher, S. A., and Goodrick, S.: Biomass burning smoke climatology of the United States: Implications for particulate matter air quality, Environ. Sci. Technol., 50, 11731–11741, https://doi.org/10.1021/acs.est.7b03292, 2017.
Kleeman, M. J., Schauer, J. J., and Cass, G. R.: Size and composition distribution of fine particulate matter emitted from wood burning, meat charbroiling, and cigarettes, Environ. Sci. Technol., 33, 3516–3523, https://doi.org/10.1021/es981277q, 1999.
Kuula, J., Mäkelä, T., Aurela, M., Teinilä, K., Varjonen, S., González, Ó., and Timonen, H.: Laboratory evaluation of particle-size selectivity of optical low-cost particulate matter sensors, Atmos. Meas. Tech., 13, 2413–2423, https://doi.org/10.5194/amt-13-2413-2020, 2020.
Laing, J. R., Jaffe, D. A., and Hee, J. R.: Physical and optical properties of aged biomass burning aerosol from wildfires in Siberia and the Western USA at the Mt. Bachelor Observatory, Atmos. Chem. Phys., 16, 15185–15197, https://doi.org/10.5194/acp-16-15185-2016, 2016.
Li, J., Mattewal, S. K., Patel, S., and Biswas, P.: Evaluation of nine low-cost-sensor-based particulate matter monitors, Aerosol Air Qual. Res., 20, 254–270, https://doi.org/10.4209/aaqr.2018.12.0485, 2020.
Manibusan, S. and Mainelis, G.: Performance of four consumer-grade air pollution measurement devices in different residences, Aerosol Air Qual. Res., 20, 217–230, https://doi.org/10.4209/aaqr.2019.01.0045, 2020.
Oregon Department of Environmental Quality: Air quality, Oregon Department of Environmental Quality [data set], https://www.oregon.gov/deq/aq, last access: 4 March 2023.
Ouimette, J. R., Malm, W. C., Schichtel, B. A., Sheridan, P. J., Andrews, E., Ogren, J. A., and Arnott, W. P.: Evaluating the PurpleAir monitor as an aerosol light scattering instrument, Atmos. Meas. Tech., 15, 655–676, https://doi.org/10.5194/amt-15-655-2022, 2022.
Pu, B. and Jin, Q.: A record-breaking trans-Atlantic African dust plume associated with atmospheric circulation extremes in June 2020, B. Am. Meteorol. Soc., 102, 7, E1340–E1356, https://doi.org/10.1175/BAMS-D-21-0014.1, 2021.
PurpleAir: Real-Time Air Quality Map, PurpleAir Map [data set], http://map.purpleair.com, last access: 18 December 2022.
Rolph, G. D., Draxler, R. R., Stein, A. F., Taylor, A., Ruminski, M. G., Kondragunta, S., Zeng, J., Huang, H. C., Manikin, G., McQueen, J. T., and Davidson, P. M.: Description and verification of the NOAA Smoke Forecasting System: the 2007 fire season, Weather Forecast., 24, 361–378, https://doi.org/10.1175/2008waf2222165.1, 2009.
Singer, B. C. and Delp, W. W.: Response of consumer and research grade indoor air quality monitors to residential sources of fine particles, Indoor Air, 28, 4, 629–639, https://doi.org/10.1111/ina.12463, 2018.
Song, Y., Sun, L., Wang, X., Zhang, Y., Wang, H., Li, R., Xue, L., Chen, J., and Wang, W.: Pollution characteristics of particulate matters emitted from outdoor barbecue cooking in urban Jinan in eastern China, Front. Environ. Sci. Eng., 12, 14, https://doi.org/10.1007/s11783-018-1024-0, 2018.
South Coast Air Quality Management District (South Coast AQMD): AQ-SPEC Air Quality Sensor Performance Evaluation Center, https://www.aqmd.gov/docs/default-source/aq-spec/summary/purpleair-pa-ii---summary-report.pdf (last access: 12 December 2022), 2015.
Sugimoto, N., Shimizu, A., Matsui, I., and Nishikawa, M.: A method for estimating the fraction of mineral dust in particulate matter using PM2.5-to-PM10 ratios, Particuology, 28, 114–120, https://doi.org/10.1016/j.partic.2015.09.005, 2016.
Tong, D. Q., Dan, M., Wang, T., and Lee, P.: Long-term dust climatology in the western United States reconstructed from routine aerosol ground monitoring, Atmos. Chem. Phys., 12, 5189–5205, https://doi.org/10.5194/acp-12-5189-2012, 2012.
Tryner, J., Mehaffy, J., Miller-Lionberg, D., and Volckens, J.: Effects of aerosol type and simulated aging on performance of low-cost PM sensors, J. Aerosol Sci., 150, 105654, https://doi.org/10.1016/j.jaerosci.2020.105654, 2020.
U.S. Environmental Protection Agency (EPA): Air Sensor Toolbox, U.S. Environmental Protection Agency, https://www.epa.gov/air-sensor-toolbox/, last access: 14 September 2022a.
U.S. Environmental Protection Agency (EPA): AirNow Fire and Smoke Map, U.S. Environmental Protection Agency, https://fire.airnow.gov/, last access: 18 December 2022b.
U.S. Environmental Protection Agency (EPA): Air Data: Air Quality Data Collected at Outdoor Monitors Across the US, U.S. Environmental Protection Agency [data set], https://www.epa.gov/outdoor-air-quality-data, last access: 4 March 2023a.
U.S. Environmental Protection Agency (EPA): AirNow, U.S. Environmental Protection Agency [data set], https://www.airnowtech.org, last access: 4 March 2023b.
Xu, G., Jiao, L., Zhang, B., Zhao, S., Yuan, M., Gu, Y., Liu, J., and Tang, X.: Spatial and temporal variability of the PM2.5 PM10 ratio in Wuhan, central China, Aerosol Air Qual. Res., 17, 741–751, https://doi.org/10.4209/aaqr.2016.09.0406, 2017.
Zhang, Y., Liu, P., Liu, X., Pun, B., Seigneur, C., Jacobson, M., and Wang, W.: Fine scale modeling of wintertime aerosol mass, number, and size distributions in central California, J. Geophys. Res.-Atmos., 115, D15207, https://doi.org/10.1029/2009JD012950, 2010.