the Creative Commons Attribution 4.0 License.
the Creative Commons Attribution 4.0 License.
 | 20 Apr 2023
Evaluation of polarimetric ice microphysical retrievals with OLYMPEX campaign data
Armin Blanke
Andrew J. Heymsfield
Manuel Moser
Silke Trömel
Polarimetric microphysical retrievals reveal a great potential for the evaluation of numerical models and data assimilation. However, the accuracy of ice microphysical retrievals is still poorly explored. To evaluate these retrievals and assess their accuracy, polarimetric radar measurements are spatially and temporally collocated with in situ aircraft measurements obtained during the OLYMPEX campaign (Olympic Mountain Experiment). Retrievals for ice water content (IWC), total number concentration Nt, and mean volume diameter Dm of ice particles are assessed by comparing an in situ dataset obtained by the University of North Dakota (UND) Citation II aircraft with X-band Doppler on Wheels (DOW) measurements. Sector-averaged range height indicator (RHI) scans are used to derive vertical profiles of microphysical retrievals. The comparison of these estimates with in situ data provides insights into strengths, weaknesses, and the accuracy of the different retrievals and quantifies the improvements in polarimetry-informed retrievals compared to conventional, non-polarimetric ones. In particular, the recently introduced hybrid ice water content retrieval exploiting reflectivity ZH, differential reflectivity ZDR, and specific differential phase KDP outperforms other retrievals based on either (ZH, ZDR) or (ZH, KDP) or non-polarimetric retrievals in terms of correlations with in situ measurements and the root mean square error.
- Article
(4003 KB) - Full-text XML
- BibTeX
- EndNote


Polarimetric microphysical retrievals bear great potential for data assimilation and the evaluation of numerical models, however, their exploitation is still in its infancy. For instance, Trömel et al. (2021) demonstrated the potential of using polarimetric observations and retrievals to evaluate and improve microphysical parameterizations. Pioneering work by Carlin et al. (2016) revealed the benefits of assimilating polarimetric microphysical retrievals. Similar work is currently underway in Germany. Reimann et al. (2021) took a first step towards assimilating polarimetric variables into the ICOsahedral Nonhydrostatic (ICON) model (Zängl et al., 2015) via adapting microphysical retrievals for their application to observations of the polarimetric C-band radar network of the German national meteorological service.
Ryzhkov et al. (1998) pointed to the limited database to identify the main reasons for the differences between individual in situ measurements and polarimetric retrievals. In fact, the in-depth evaluation of retrievals requires extensive airborne in situ cloud particle measurements over polarimetric radar sites using, e.g., so-called optical array probes (OAPs) collected during field campaigns. However, these are substantial high budget and provide data only along flight trajectories. Hogan et al. (2006) introduced an ice water content (IWC) based on radar reflectivity Z and atmospheric temperature T. Tian et al. (2016) evaluated its performance along with that of a mean volume diameter Dm retrieval with aircraft in situ data from the Bow Echo and Mesoscale Convective Vortex Experiment (BAMEX; Davis et al., 2004). They observed an overestimation of the mean Hogan IWC retrieval compared to in situ measurements (1.52 g m−3 vs. 1.25 g m−3) and a correlation of 0.55. Similarly the mean retrieved Dm showed an overestimation (2.08 mm vs. 1.77 mm) and a low correlation of 0.27.
One reason for the bad performance of non-polarimetric retrievals is that the horizontal reflectivity ZH in snow is approximately proportional to the fourth moment of the particle size distribution (PSD) (Hu and Ryzhkov, 2022); hence ZH is insensitive to small particles, whereas other moments, such as the IWC, are sensitive to the small particle contributions. In contrast, specific differential phase KDP is proportional to the first moment of the PSD and thus the whole spectrum is considered. However, KDP strongly depends on the aspect ratio and orientation of the particles, necessitating prior knowledge of these parameters. Aydin and Tang (1997) proposed for IWC estimation the combination of KDP and differential reflectivity ZDR because their ratio is not affected by the variability in orientation and particle aspect ratio (Ryzhkov et al., 2018). Another set of polarimetric relations to quantify snow properties was derived by Bukovčić et al. (2018) exploiting ZH and KDP. More recently, Carlin et al. (2021) suggested a hybrid application for estimating IWC by combining the complementary strengths and optimal ranges of the IWC retrievals following Bukovčić et al. (2018) and Ryzhkov and Zrnić (2019). Apart from IWC retrievals, polarimetric retrieval relations have been suggested for Dm and total number concentration of ice particles per unit volume Nt based on approaches utilizing combinations of three or two polarimetric variables, always including KDP (Ryzhkov et al., 2018; Bukovčić et al., 2020). To evaluate the quality of polarimetric retrievals, approaches based on in situ and/or ground-based measurements were pursued.
Nguyen et al. (2019) proposed a methodology to retrieve IWC using ZDR and KDP from X-band dual-polarization airborne radar data. This algorithm was found to be superior to power-law fits using Z compared to others because ZDR minimizes the dependence of IWC on variations in ice particle shape and orientation. An evaluation with in situ data from the High Altitude Ice Crystal – High Ice Water Content (HAIC-HIWC) field campaign revealed that the additional use of ZDR reduced the root mean square difference by 6 % and the bias by 15 % on average compared to retrievals using KDP only.
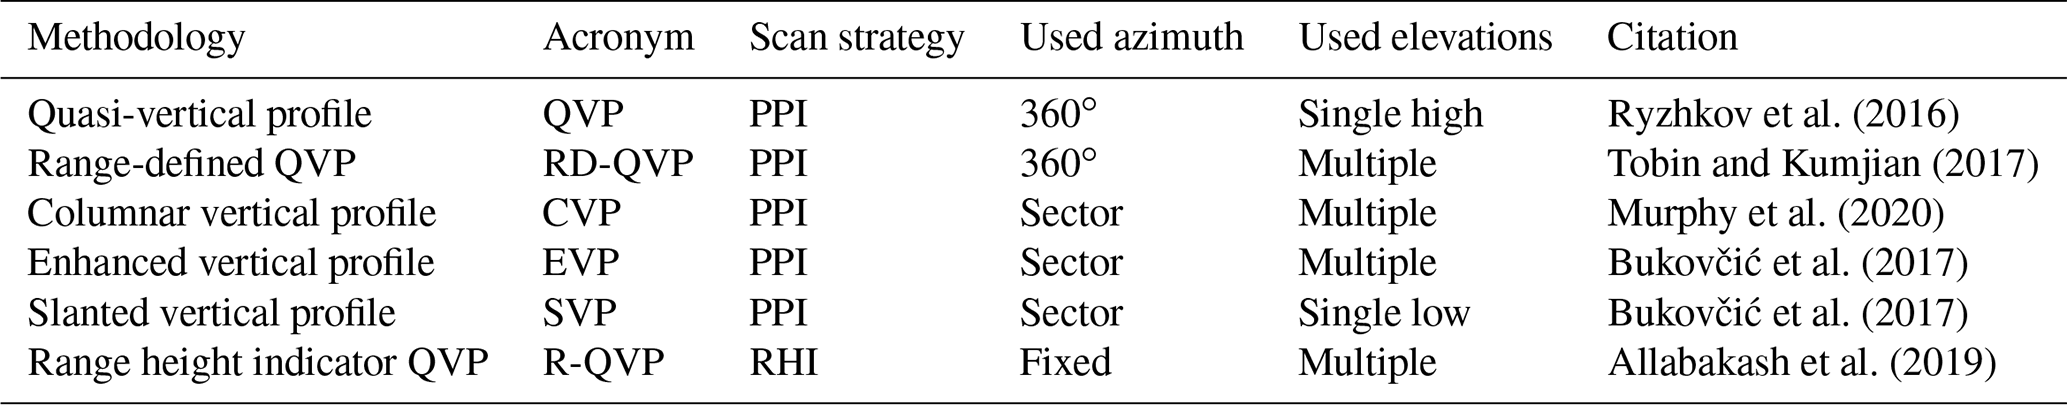
Several noise-reducing techniques for reconstructing average vertical profiles from radar data have been proposed and used in the literature (Table 1). They are based on plan position indicator (PPI) or range height indicator (RHI) scans using single or multiple elevations. However, polarimetric and especially the phase-based radar measurements may be noisy in ice and snow and even more near the cloud top. As a consequence, it is beneficial to reduce their statistical noise before the calculation of microphysical retrievals. For instance columnar vertical profiles (CVPs; Murphy et al., 2020) represent local average vertical profiles that can be calculated at any distance from the radar using all elevation scans. Murphy et al. (2020) applied the microphysical retrievals by Ryzhkov et al. (2018) to CVPs and tracked airborne in situ measurements to exploit them for evaluation. Overall, newly developed polarimetric retrievals show good promise in quantitatively estimating IWC, Nt, and Dm. However, Murphy et al. (2020) especially revealed deficiencies near the melting layer (ML), resulting in, e.g., a pronounced underestimation of Dm in these regions. Also using in situ measurements from aircraft, alternative retrieval methods were recently tested. Kedzuf et al. (2021) validated the accuracy of statistical polarimetric retrieval methods designed for pristine ice and aggregates, and Dunnavan et al. (2022) evaluated aspect ratio retrievals (Matrosov et al., 2020).
Ryzhkov et al. (2016)Tobin and Kumjian (2017)Murphy et al. (2020)Bukovčić et al. (2017)Bukovčić et al. (2017)Allabakash et al. (2019)Table 1Overview of areal averaging techniques to derive quasi-vertical profiles of polarimetric radar variables.
This study exploits measurements obtained during the Olympic Mountain Experiment (OLYMPEX) field campaign conducted from November 2015 to February 2016 on the Olympic Peninsula of Washington State, USA (Houze et al., 2017). During OLYMPEX, the University of North Dakota's (UND) Cessna Citation II science aircraft equipped with an advanced in situ cloud payload performed overpasses over the National Science Foundation (NSF)-funded Doppler on Wheels (DOW) radar. We focus on the evaluation of radar-derived IWC, Dm, and Nt. Our accuracy assessments are based on two key aspects: (1) the matching of ground-based polarimetric radar data with airborne in situ cloud particle measurements in time and space and (2) a noise-reducing averaging of the polarimetric radar measurements in the ice phase. Throughout OLYMPEX, the DOW X-band radar performed sequences of RHI scans in azimuthal sectors of 22∘, which motivated us to introduce the RHI sector vertical profile (RSVP) technique to determine vertical profiles of polarimetric variables within specified sectors in azimuth and range.
The major objective of this study is to exploit the OLYMPEX campaign data for the accuracy assessment of the most recent microphysical retrievals and emphasize at the same time the benefits of X-band radars for microphysical studies.
The paper is organized as follows. Section 2 introduces the polarimetric remote sensing observations and airborne in situ measurements used. Section 3 summarizes the microphysical retrievals considered, while the RSVP methodology and the matching with aircraft measurements are detailed in Sect. 4. Evaluation results are presented in Sect. 5 followed by a discrepancy analysis in Sect. 6. A summary of key findings and a comprehensive discussion of all results are provided in Sect. 7.
The OLYMPEX ground validation field campaign (Houze et al., 2017), conducted in the Pacific Northwest, aimed at validating rain and snow measurements in midlatitude frontal systems and to further develop the Global Precipitation Measurement (GPM) mission satellite algorithms for precipitation estimation. Of the broad variety of ground instruments, including several radars and airborne instruments, the DOW in conjunction with the in situ aircraft measurements of the Citation II is appropriate for our evaluation purposes.
2.1 Polarimetric data from X-band radar DOW
The DOW radar (Wurman et al., 1997), placed within Chehalis Valley at Lake Quinault (47.48∘ N, 123.86∘ W; at 64 m altitude), Washington, and operated by the Center of Severe Weather Research (CSWR), is installed on a mobile truck. The polarimetric dual-frequency X-band radar operated with a range of 59.96 km and a radial resolution of 75 m and used two independent transmitters at frequencies of ∼9.55 GHz and ∼9.40 GHz (Houze et al., 2018). In this study, we exclusively utilize the latter frequency as only measurements of the lower frequency were available after 12 November 2015. More detailed information on the DOW radar can be found in Houze et al. (2018).
The DOW's 10 min scanning schedule includes plan position indicator (PPI) scans for the azimuthal sector between 39.2 and 83.6∘ at six elevations between 2.8 and 11∘ and a series of 22 range–height indicators (RHIs) for the azimuthal sector between 50.4 and 71.4∘ in equidistant intervals of 1∘ and elevations ranging from 0 to 71∘. For the evaluation of polarimetric ice microphysical retrievals, we focus in this study on the sector RHIs. All datasets utilized (Petersen et al., 2018), including a new version of the DOW data with improved calibration (Houze et al., 2018; doi: https://doi.org/10.5067/GPMGV/OLYMPEX/DOW/DATA201), were downloaded from the Global Hydrology Resource Center (GHRC) Distributed Active Archive Center (DAAC). As a cross-check, we followed Ryzhkov and Zrnić (2019) and verified whether the expected ZH–ZDR relationship for X-band in rain is fulfilled and made adjustments of ZDR if necessary. Accordingly, a ZDR correction was applied to all data used, with a larger correction required for measurements in November than in December (on average 0.38 dB vs. 0.19 dB).
Specific differential phase KDP, defined as half the range derivative of differential propagation phase shift ΦDP, is estimated following Vulpiani et al. (2012). For processing efficiency, the derivative of ΦDP is approximated using low-noise Lanczos differentiators (Holoborodko, 2008). Since KDP is inversely proportional to the radar wavelength, more reliable estimates can be expected at X-band compared to C- or S-band with according benefits also for microphysical retrievals. Only data with a cross-correlation coefficient ρhv above 0.7 are used for the KDP estimation in order to reduce the impact of noisy and non-meteorological contamination.
2.2 In situ sensors and observations
The in situ microphysical cloud measurements during the OLYMPEX campaign have been acquired with the University of North Dakota (UND) Cessna Citation II airplane, which was equipped with an enhanced instrumental payload, including the 2D stereo imaging probe (2D-S; SPEC Inc, USA) and the high-volume precipitation spectrometer (HVPS; SPEC Inc, USA). Both instruments provide shadowgraphs of cloud particles. The 2D shadow images of hydrometeors are generated as the particles penetrate through the sampling area of the particle imagers. A detailed description of the 2D-S and HVPS operating principles, uncertainties, and limitations can be found in Lawson et al. (2006), Baumgardner et al. (2017), and Moser et al. (2023). Note that the data recorded by the 2D-S and HVPS differ in sampling volume size and pixel resolution. The 2D-S is equipped with 128 pixels of 10 µm resolution each, which allows imaging particles from 10 µm to 1.28 mm in size. With the larger pixel resolution provided by the HVPS of 150 µm, imaging of hydrometeors from 150 µm to 3.25 cm is enabled. Here, the datasets of the horizontally oriented HVPS and the horizontally oriented part of the 2D-S processed by Heymsfield et al. (2018) were combined with a switch-over size at 1000 µm; i.e., particles smaller than 1000 µm are sized by the 2D-S and larger particles by the HVPS. Standard processing and correction options with SODA (software for OAP data analysis, provided by Aaron Bansemer, National Center for Atmospheric Research/University Corporation for Atmospheric Research; Bansemer, 2023) were applied including shattering and dead-time corrections. For a better comparability of the in situ measurements with the according radar-based retrievals of IWC, Dm, and Nt, only particles larger than 100 µm are considered because of the sensitivity of weather surveillance radars (Ryzhkov et al., 2020) and uncertainties in probe data (Poellot and Bansemer, 2017; Baumgardner et al., 2017). With the particle size distribution (PSD) given by Heymsfield et al. (2018), Dm, IWC, and Nt for particles between 100 µm and 3 cm are calculated. In order to derive Nt, the number concentration for each particle size bin is added up.
The different relations between measures of particle sizes used in the radar community and those derived from in situ measurements must be considered in their comparison. Radar-based retrievals mostly provide the mean volume diameter Dm as a parameter for the size of the particles, which is defined as the ratio of the fourth to the third moment of the PSD:
where D is the equivolume diameter. It should be noted that Dm is very close to the median volume diameter D0. Assuming that the PSD follows a gamma distribution with shape parameter μ (Ulbrich, 1983), we obtain
Instead of Dm, the aircraft microphysical probes usually measure either the median mass diameter Dmm or the median volume diameter Dmv of the distribution of maximal particle dimension (Hu and Ryzhkov, 2022), which is given by
where φ is the particle aspect ratio. For a gamma size distribution and taking Eq. (3) into account, we yield
with Eq. (4a) assuming particle density being inversely proportional to its size. Assuming φ=0.6 and an exponential distribution (μ=0), the following two Dm relationships (Hu and Ryzhkov, 2022) are obtained:
and
These relations enable the direct comparison between the in situ measurements with the radar-based Dm retrievals, with the median mass size Dmm derived in situ utilized in our study to obtain Dm. The IWC is estimated by using a mass–dimension relation between mass m and size given by
with a=0.0121 kg per mb b=1.9, and Dmax the diameter of the minimum enclosing circle of the projected 2D image. We followed Chase et al. (2018) by adopting Eq. (6) and parameters a and b from Brown and Francis (1995) and modifying them considering the particle size definition by Hogan et al. (2012). Even though parameters a and b of the mass–dimension relationship vary with the environmental conditions and particle shapes (Baker and Lawson, 2006), constant standard parameters are used in this study which reasonably represent the mean ice water content, especially for ice crystal aggregates. Tridon et al. (2019) confirmed that the aggregates observed during OLYMPEX can mostly be described by a quite narrow range of mass–size relations. In single situations with large aggregates or intense riming processes, however, the fixed parametrization may underestimate the ice water content (see also Heymsfield et al., 2023).
In addition to the quantitative information provided by the 2D-S and HVPS, high-resolution in situ particle imagery data from the cloud particle imager (CPI; SPEC Inc, USA) can be used to accurately identify particle types and characteristics. Only with the CPI is it possible to directly monitor supercooled liquid water (SLW) droplets of micron size attached to ice particles and thus diagnose riming unambiguously and estimate the degree of riming.
The Rosemount icing detector (RICE; Baumgardner and Rodi, 1989) mounted on the Citation II is used as a supporting probe to detect the presence of SLW mandatory for riming (Vogel and Fabry, 2018). The RICE oscillates at a constant frequency, but when supercooled droplets freeze on its surface, the frequency of vibration decreases. Once accumulated ice exceeds a certain threshold, the probe tip is briefly heated to remove accreted ice. Data are available again as soon as the probe temperature has stabilized (Heymsfield and Miloshevich, 1989).
This section summarizes the most recent polarimetric and a suite of conventional non-polarimetric ice microphysical retrievals for IWC, Nt, and Dm considered and assessed in this study. Two conventional Dm retrievals derived from statistical relations between particle sizes and reflectivity expressed in linear scale (; in units of mm6 m−3) are used in our analysis. The first relation introduced by Skofronick-Jackson et al. (2019) is based on a power law between Dm (mm) and Ku-band Zh fitted to data from the GPM Cold Season Precipitation Experiment (GCPEx) campaign (Skofronick-Jackson et al., 2015) conducted in Canada:
Matrosov et al. (2019) introduced another power-law relation derived from Zh data of ground-based S-band radar and aircraft in situ calculated Dmv obtained during the Indirect and Semi-Direct Aerosol Campaign (ISDAC) in Alaska (Maahn et al., 2015). Assuming φ=0.6 and using Eq. (5b), it follows that
This equation differs from Eq. (5) in Murphy et al. (2020) showing, due to a typo, the reciprocal multiplier when converting Dmm to Dm.
Since ZH-based Dm retrievals are disproportionally weighted by a few large particles, polarimetric KDP-based retrievals have a great potential to provide more accurate estimates. Additionally, such estimators use the key advantage that KDP is not affected by attenuation and not biased by noise and radar miscalibration. To retrieve a polarimetric Dm from KDP and Zdp, where is the reflectivity difference at horizontal and vertical polarization in linear scale, as proposed in Ryzhkov et al. (2018) and Ryzhkov and Zrnić (2019), we use
where KDP is in degrees per kilometer, Zdp is in millimeters to the power of six per cubic meter (mm6 m−3), and the radar wavelength λ is in millimeters. This estimator is largely immune to variations in ice particle orientation and shape but has the inherent deficiency of being impacted by the degree of riming; therefore it is supposed to be more appropriate for lower-temperature regions where riming is less likely. As an alternative, Bukovčić et al. (2018, 2020) use Zh and KDP to retrieve
Unlike Dm(Zdp,KDP), however, this retrieval is not immune to the variability in particle orientation and shape, and a strength of this Dm(Zh,KDP) estimate is that it does not depend on density and is therefore not affected by the degree of riming.
Similarly to the aforementioned Dm retrievals, IWC retrievals can also be derived in a purely empirical fashion through the utilization of power laws. Hogan et al. (2006) introduced an expression which related in situ measured IWC (in g m−3) to reflectivity (in dBZ) at various frequencies (e.g., 3 GHz) and temperature T (in ∘C) in the European Cloud Radiation Experiment (EUCREX) derived in the Rayleigh approximation:
They also exploited the IWCI(ZH,T) to evaluate the mesoscale version of the Met Office Unified Model. However, the IWC relationship implicit in the models' parameterization (see Hogan et al., 2006, for details) is
Nguyen et al. (2019) proposed two more empirical but polarimetric IWC retrievals via optimal fitting parameters, exploiting aircraft measurements from a polarimetric side-pointing X-band radar and measured IWC by in situ probes obtained during HAIC-HIWC. The two retrievals either utilize KDP only or include additionally the differential reflectivity Zdr expressed in linear scale ():
Zdr is set to 1.15 (Ryzhkov et al., 1998) when Zdr falls below this threshold. Ryzhkov et al. (1998) also demonstrated that KDP is sensitive to the aspect ratio φ and orientation of the particles, whereas IWC is not, requiring additional knowledge about the particles. Accordingly, the estimator IWC(KDP) is highly affected by variations in φ and/or orientation, whereas the inclusion of Zdr in IWCI(Zdr,KDP) reduces these dependences. The observational study by Nguyen et al. (2019) demonstrated that their empirical relation IWCI(Zdr,KDP) is very close to the theoretical IWC relation by Ryzhkov et al. (2018):
The latter exploits the inherent information of Zdr about the shape and the orientation of particles. Similar to Eq. (9), IWCII(Zdr,KDP) is practically insensitive to the shape and orientations of the ice particles because the numerator and denominator are proportionally impacted and thus the ratio is not affected.
In the absence of a birdbath scan in the scan schedule (as is, e.g., the case for the operational radar networks in the USA), ensuring high Zdr accuracy is often difficult. Bukovčić et al. (2018, 2020) introduced a generalized relation for IWC,
which is immune to Zdr miscalibrations and where F0 is the orientation factor as a function of the width of the canting angle distribution σ and FS the shape factor determined by φ. The relation in Eq. (16) produces
for σ=0∘, φ=0.65, and λ=32 mm. In contrast to Eq. (10), however, the IWC(Zh,KDP) retrieval is sensitive to the density of the particles and thus the degree of riming.
The combined application of Eq. (15) in regions where ZDR>0.4 dB and Eq. (17) elsewhere, as suggested by Carlin et al. (2021), leverages the strengths of both formulas and is denoted as IWCCarlin estimator in the following.
Estimating snow concentration Nt is a challenging task, and it is almost impossible to derive it with acceptable accuracy from single-polarization radar measurements because of the wide variety of ice and snow habits and their microphysical properties. A polarimetric retrieval for the logarithm of the total number concentration of ice particles Nt (in L−1) following Ryzhkov et al. (2018) and Ryzhkov and Zrnić (2019) is estimated by
with
Again, using the ratio of in this retrieval cancels out the effects of orientation and shape. Another relation for Nt included in our accuracy assessment is given by Carlin et al. (2021):
Combined with IWCCarlin, Eq. (19) is hereafter referred to as Nt(ZH,IWCCarlin). Note that polarimetric retrieval equations (Eqs. 9, 10, and 15–18a) were derived in the Rayleigh approximation assuming that the density ρs of Rayleigh scatterers (ice particles, snowflakes) is inversely proportional to D, according to the formula following Brandes et al. (2007):
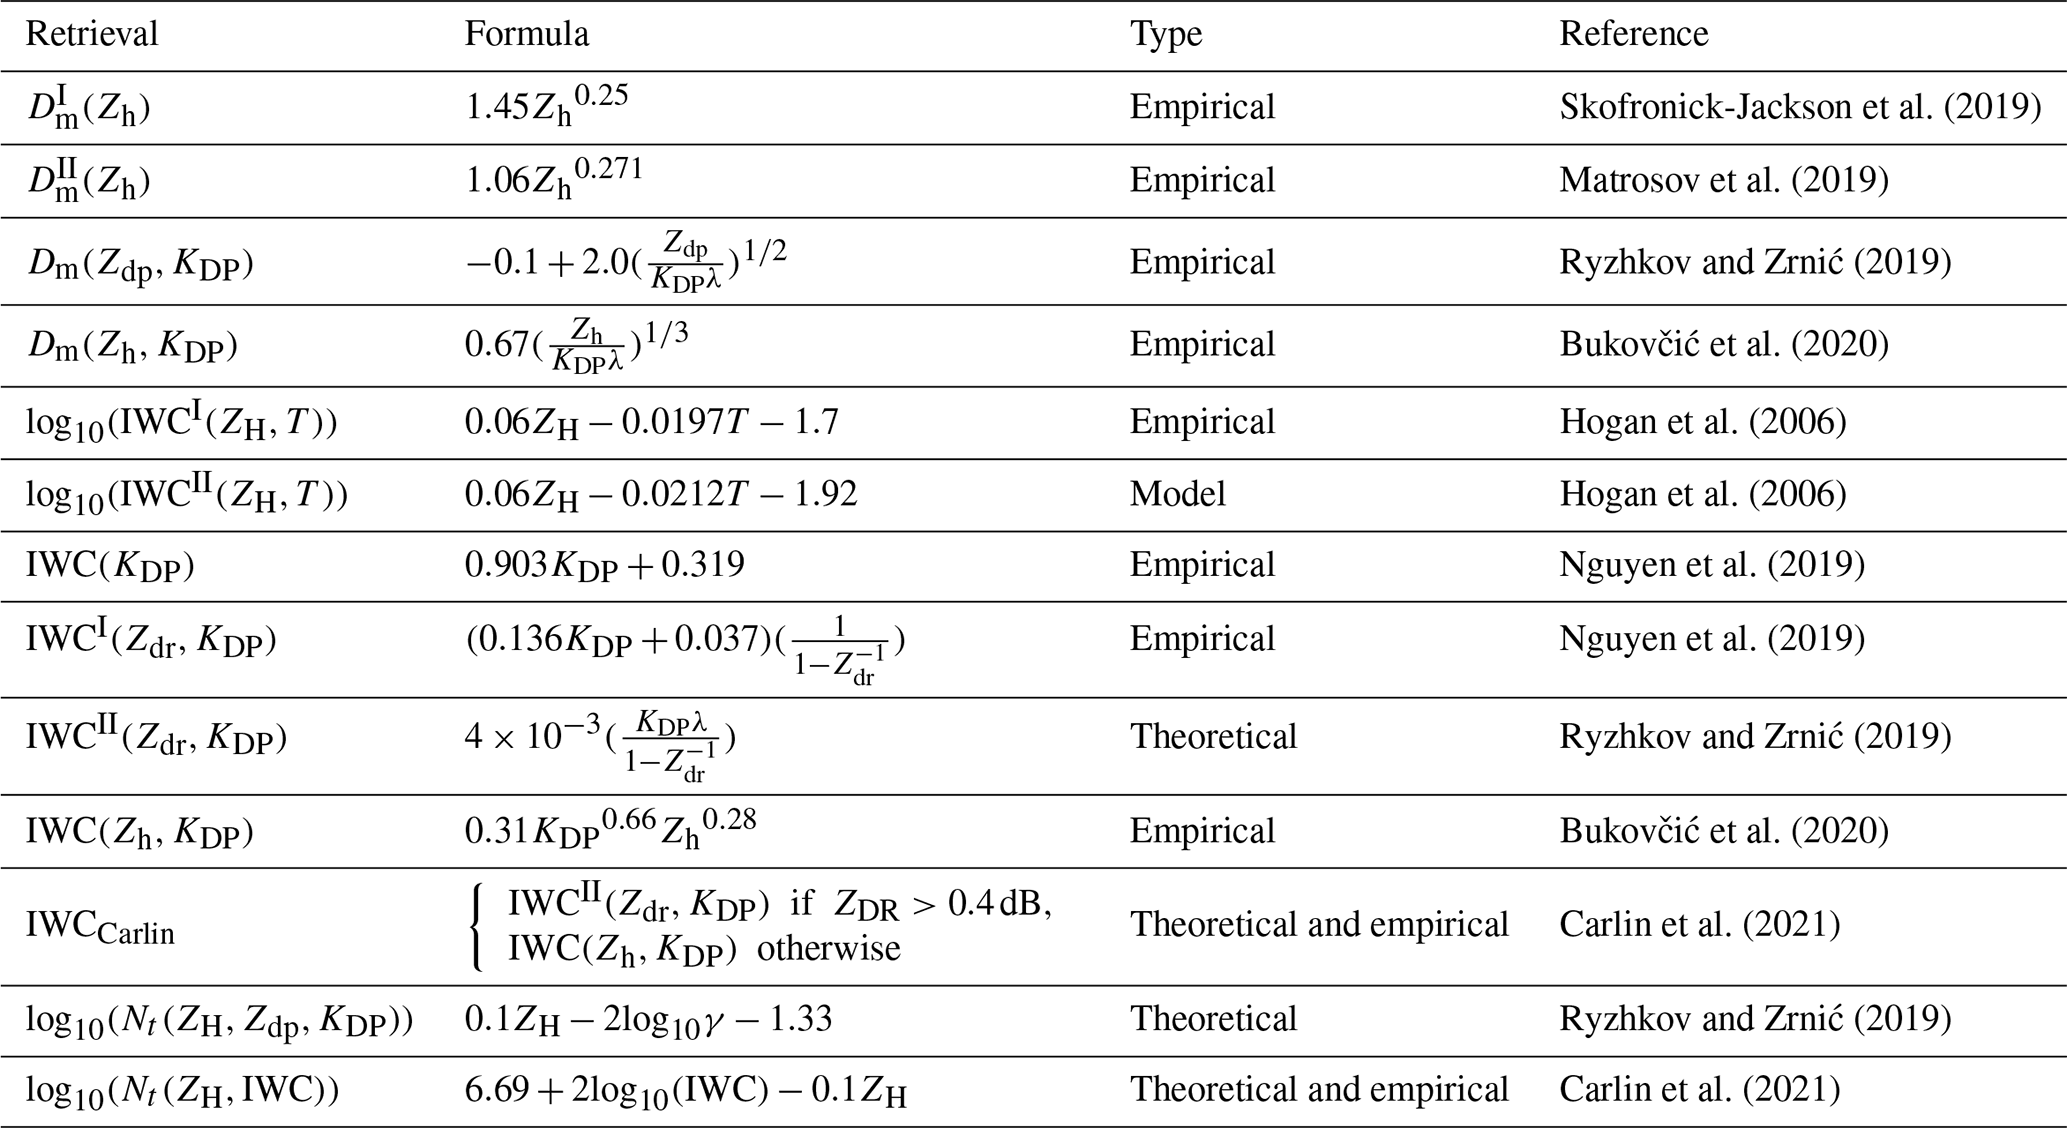
where ρs is expressed in grams per cubic centimeter, α0 is a constant, and the prefactor αp varies with the degree of riming frim, which ranges from 1 for unrimed ice to 5 for heavily rimed ice. For larger non-Rayleigh scatterers like graupel or hail, these polarimetric retrieval equations are not valid (Ryzhkov et al., 2020). Reliable retrievals are only obtainable in areas where ZDR and KDP are not very close to zero, which represents a weakness of polarimetric retrievals. In addition, a recent study showed that polarimetric ice microphysical retrievals following Ryzhkov and Zrnić (2019) provide the best results at cold temperatures, i.e., lower than −10 to −15 ∘C (Murphy et al., 2020). Around this temperature interval the dendritic growth layer (DGL) is located and ZDR and KDP exhibit pronounced signals. For this reason, our analysis is restricted to temperatures below −10 ∘C. Table 2 summarizes the retrieval equations used in this study.
Skofronick-Jackson et al. (2019)Matrosov et al. (2019)Ryzhkov and Zrnić (2019)Bukovčić et al. (2020)Hogan et al. (2006)Hogan et al. (2006)Nguyen et al. (2019)Nguyen et al. (2019)Ryzhkov and Zrnić (2019)Bukovčić et al. (2020)Carlin et al. (2021)Ryzhkov and Zrnić (2019)Carlin et al. (2021)Table 2Table of retrieval equations used in this work (Dm is in units of mm, IWC is in units of g m−3, and Nt is in units of L−1; T is in units of ∘C.)
RHI scans obtain vertically high-resolved measurements and thus are well suited for microphysical studies and our accuracy assessment. Furthermore, the sequences of successive RHIs performed during the OLYMPEX campaign in azimuthal sectors of 22∘ provide high-resolution 3D measurements in this predefined region. Our newly introduced RHI sector vertical profile (RSVP) technique provides noise-reduced quasi-vertical profiles of polarimetric variables obtained by azimuthal averaging of RHI sector scans in a convenient height vs. time format. This method was inspired by both the quasi-vertical profile (QVP; Ryzhkov et al., 2016) methodology and the ability of CVPs to follow flight segments of research aircraft, and on top it takes advantage of the RHI scan mode. Figure 1 illustrates the RSVP technique introduced here for the matching with airborne in situ measurements.
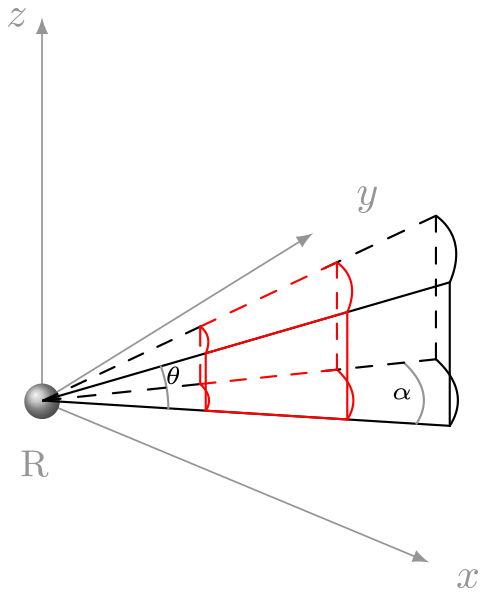
To create a RSVP, a series of RHIs is first averaged within the azimuthal range α. The range of elevation angles θ considered can be adapted, e.g., to minimize ground clutter effects.
In the second step, windows of the desired size and position are selected along the range axis of the already azimuthally averaged RHI (marked in red in Fig. 1) and averaged along the chosen range interval as well. Based on the selected and averaged volume, a mean profile is computed representing the vertical columns that are combined and displayed in the RSVP. In this way, RSVPs enable both the joint analysis with fixed ground-based measurements provided by vertically pointing devices like, e.g., micro rain radars (MRRs) and the tracking of research aircraft within the sector covered by the RHIs for the matching with airborne measurements. In the latter case, the selected volume taken into account in the averaging process changes with time. Additionally, vertical averaging is applied, with 75 m bins to match the aircraft track and account for aircraft altitude fluctuations. Four columns with a length on the range axis of 4.5 km each starting at 2 km distance from the radar are used for tracking the aircraft. The first 2 km were omitted because of known inconsistencies in the transmitters and reduced polarimetric information content. Also, the maximum range considered in this analysis was 20 km from the radar in order to reduce partial beam blockage by surrounding mountains. The temporal resolution of the RSVP technique depends for sure on the scan schedule. During the OLYMPEX campaign, the 22 RHIs measured in the azimuthal sector were available every 4 min interspersed with a 2 min PPI scan after each two RHI sector scans.
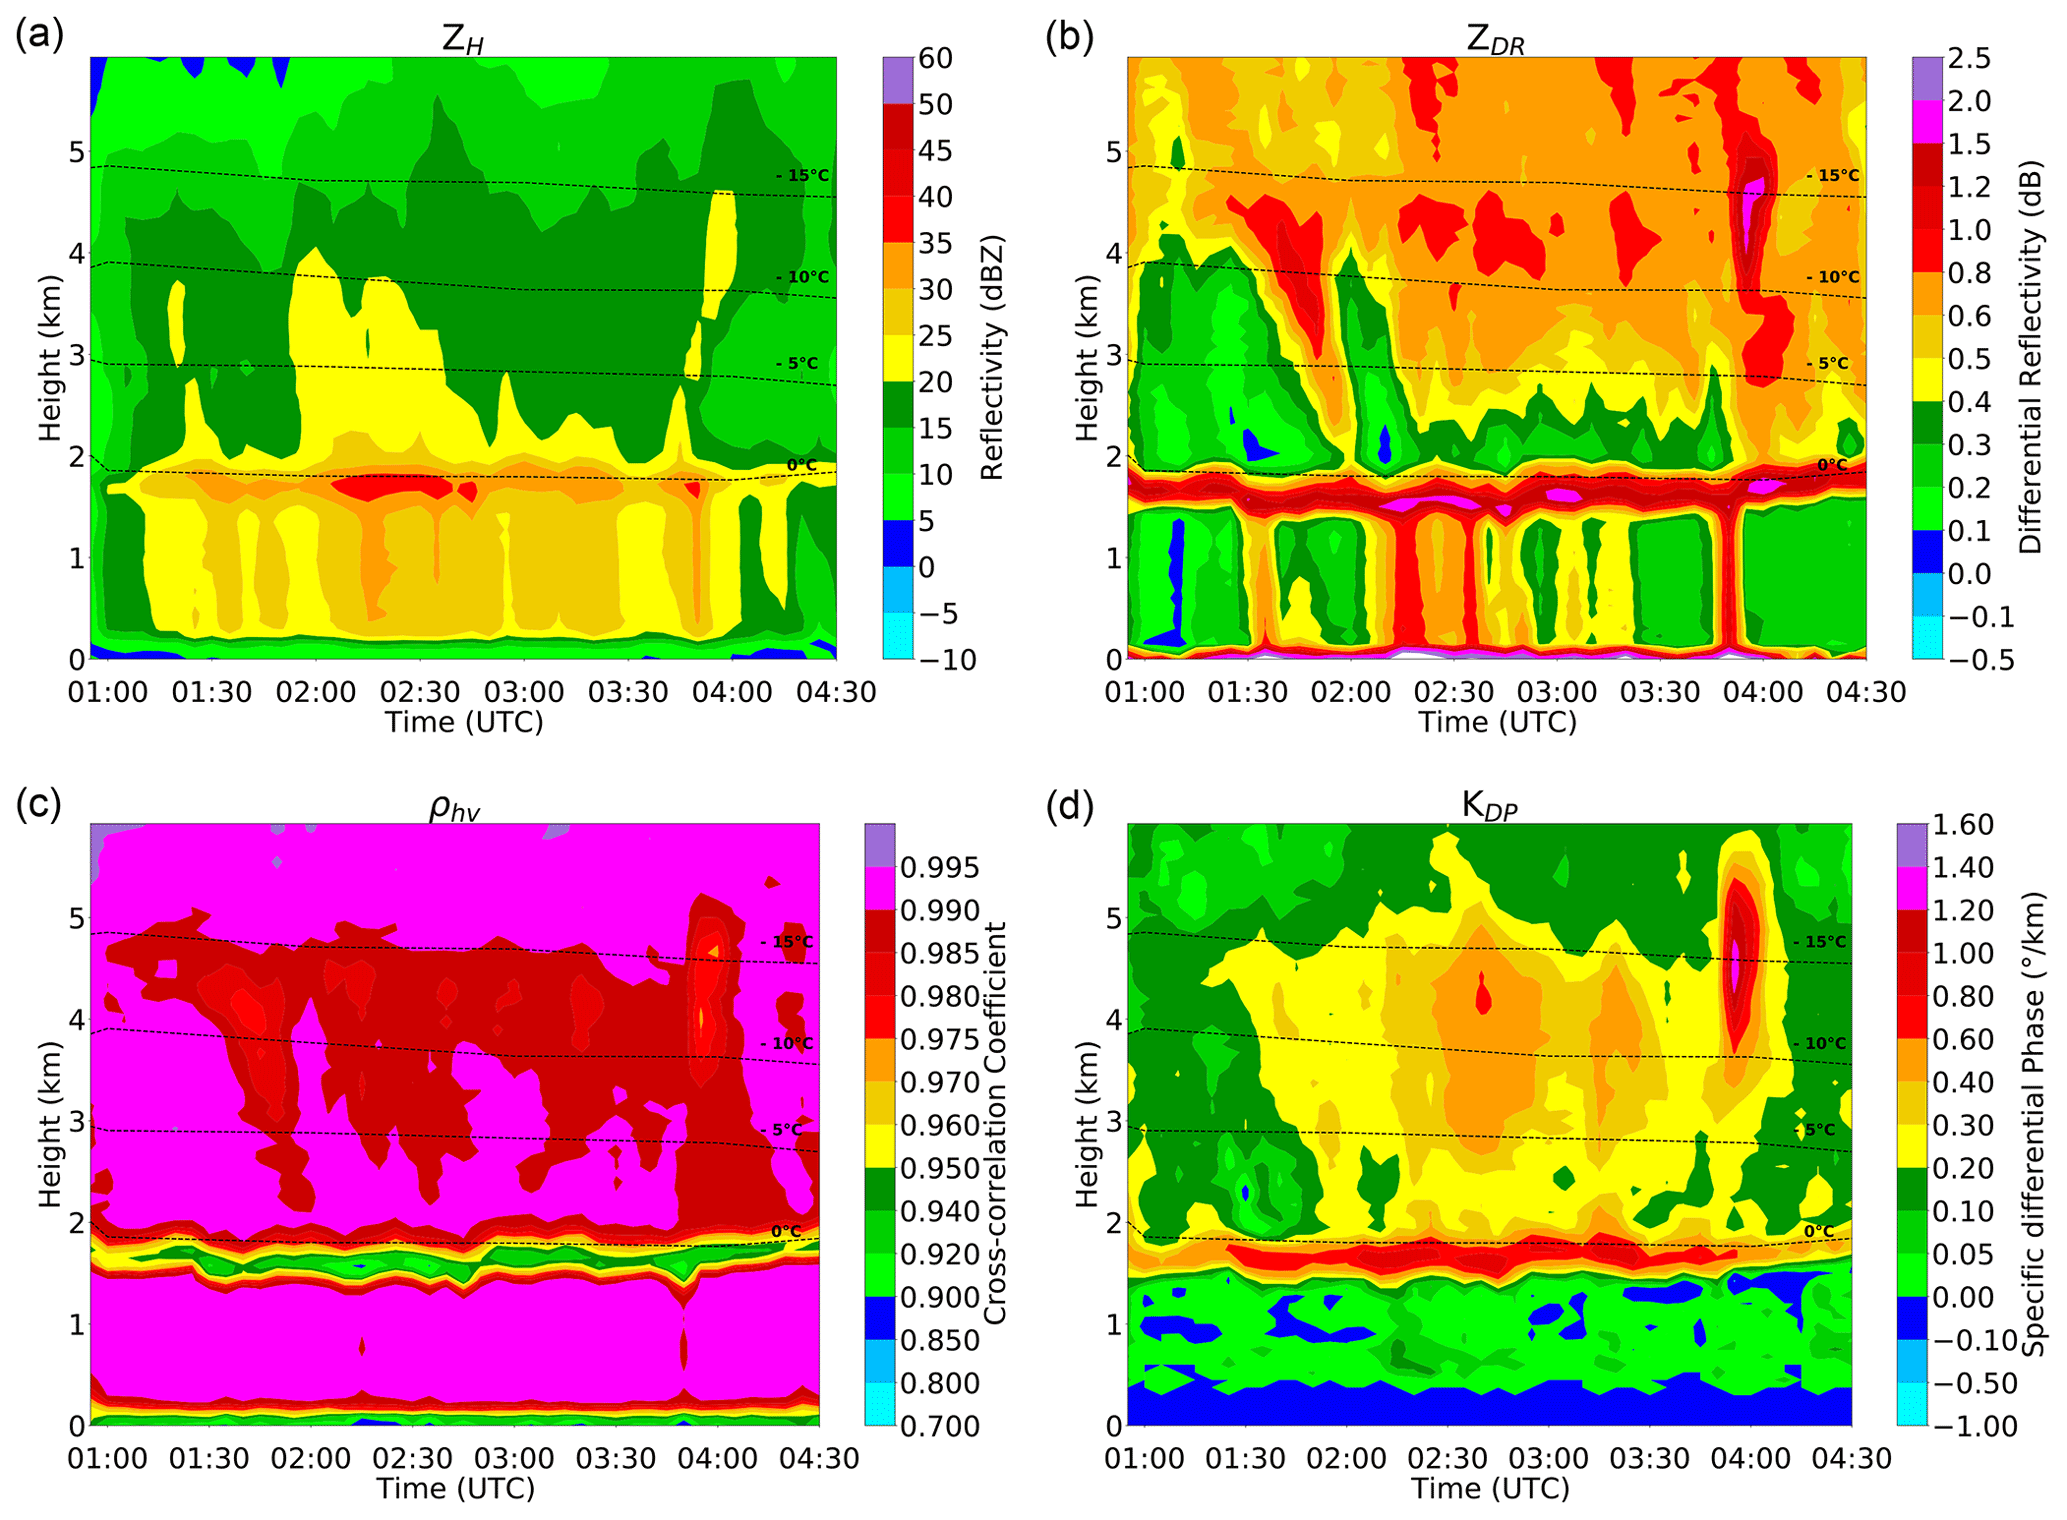
Figure 2RSVPs of ZH (a), ZDR (b), ρhv (c), and KDP (d) using measurements from the DOW on 18 December 2015 between 00:40 and 04:30 UTC. The time interval shown is equal to the flight mission length to the nearest 15 min. Data in the RSVPs are at ranges from 6.5 to 11 km away from the radar and 22∘ in azimuth. The overlaid dashed lines (in all panels) display the 0, −5, −10, and −15 ∘C isotherms from European Centre for Medium-Range Weather Forecasts Reanalysis v5 (ERA5; Hersbach et al., 2020) at the DOW location.
Figure 2 shows as an example RSVPs of ZH, ZDR, ρhv, and KDP for a complex occluded front observed on 18 December 2015. Similar RSVPs have been generated for all 20 flights during OLYMPEX totalling approximately 60 flight hours (not shown here). The event displayed in Fig. 2 exhibits throughout clearly visible ML signatures in ZH, ZDR, and ρHV, roughly following the temporal evolution of the 0 ∘C isotherm. Within the DGL, located at temperatures between −10 and −15 ∘C, also bands of enhanced ZDR and KDP are visible.
For the accuracy assessment, the microphysical retrievals introduced in Sect. 3 are calculated based on the RSVPs and displayed in a similar manner, considering only data above the ML. For this purpose, only radar data with ZDR>0.1 dB, ZH>0 dBZ, KDP>0.01∘ km−1, and ρhv>0.7 are used.
A direct comparison of airborne in situ measurements with ground-based retrievals requires a careful matching in both space and time. Research aircraft measure along flight trajectories, while the RSVP technique uses stationary ground-based radars monitoring a volume at flight altitude. The aircraft measurements of IWC, Dm, and Nt are averaged along the respective flight path sections and compared to the radar retrievals in the according columns and at the corresponding aircraft altitude. Similarly, the flight altitude and measured environmental parameters (e.g., temperature) are averaged for the time intervals within each column. The temperature information enables us to exclude bright band effects. Herein, the averaged in situ observations are assumed to be characteristic of the entire collocated radar volume. Figure 3 illustrates the matching of microphysical retrievals based on RSVP data with airborne in situ measurements. During OLYMPEX, the UND Citation II research aircraft performed 148 transects over DOW at different altitudes. In our study, only the aircraft measurements between 3 and 7 km height are used. The use of RSVP columns allows for the analysis of multiple collocated data points within a single overpass. Here, the selected length of 4.5 km along the range for the RSVP columns ensures that the duration of an aircraft flying at approximately 100 m s−1 is sufficiently long within the column (t≥30 s). Flight intercepts of less than 30 s in duration were discarded from the analysis as they may not adequately represent the respective RSVP columns and to ensure statistical reliability. Too short flight intercepts occurred, e.g., when the aircraft shortly flew along the edge of a column and then left the sector again (e.g., yellow column in right panel of Fig. 3) or did not pass the RHI sector at all. Note that the limited temporal resolution of RSVPs (here 4 min) and the comparatively short flight segments can lead to a temporal mismatch between the two datasets of up to 3 min in this study.
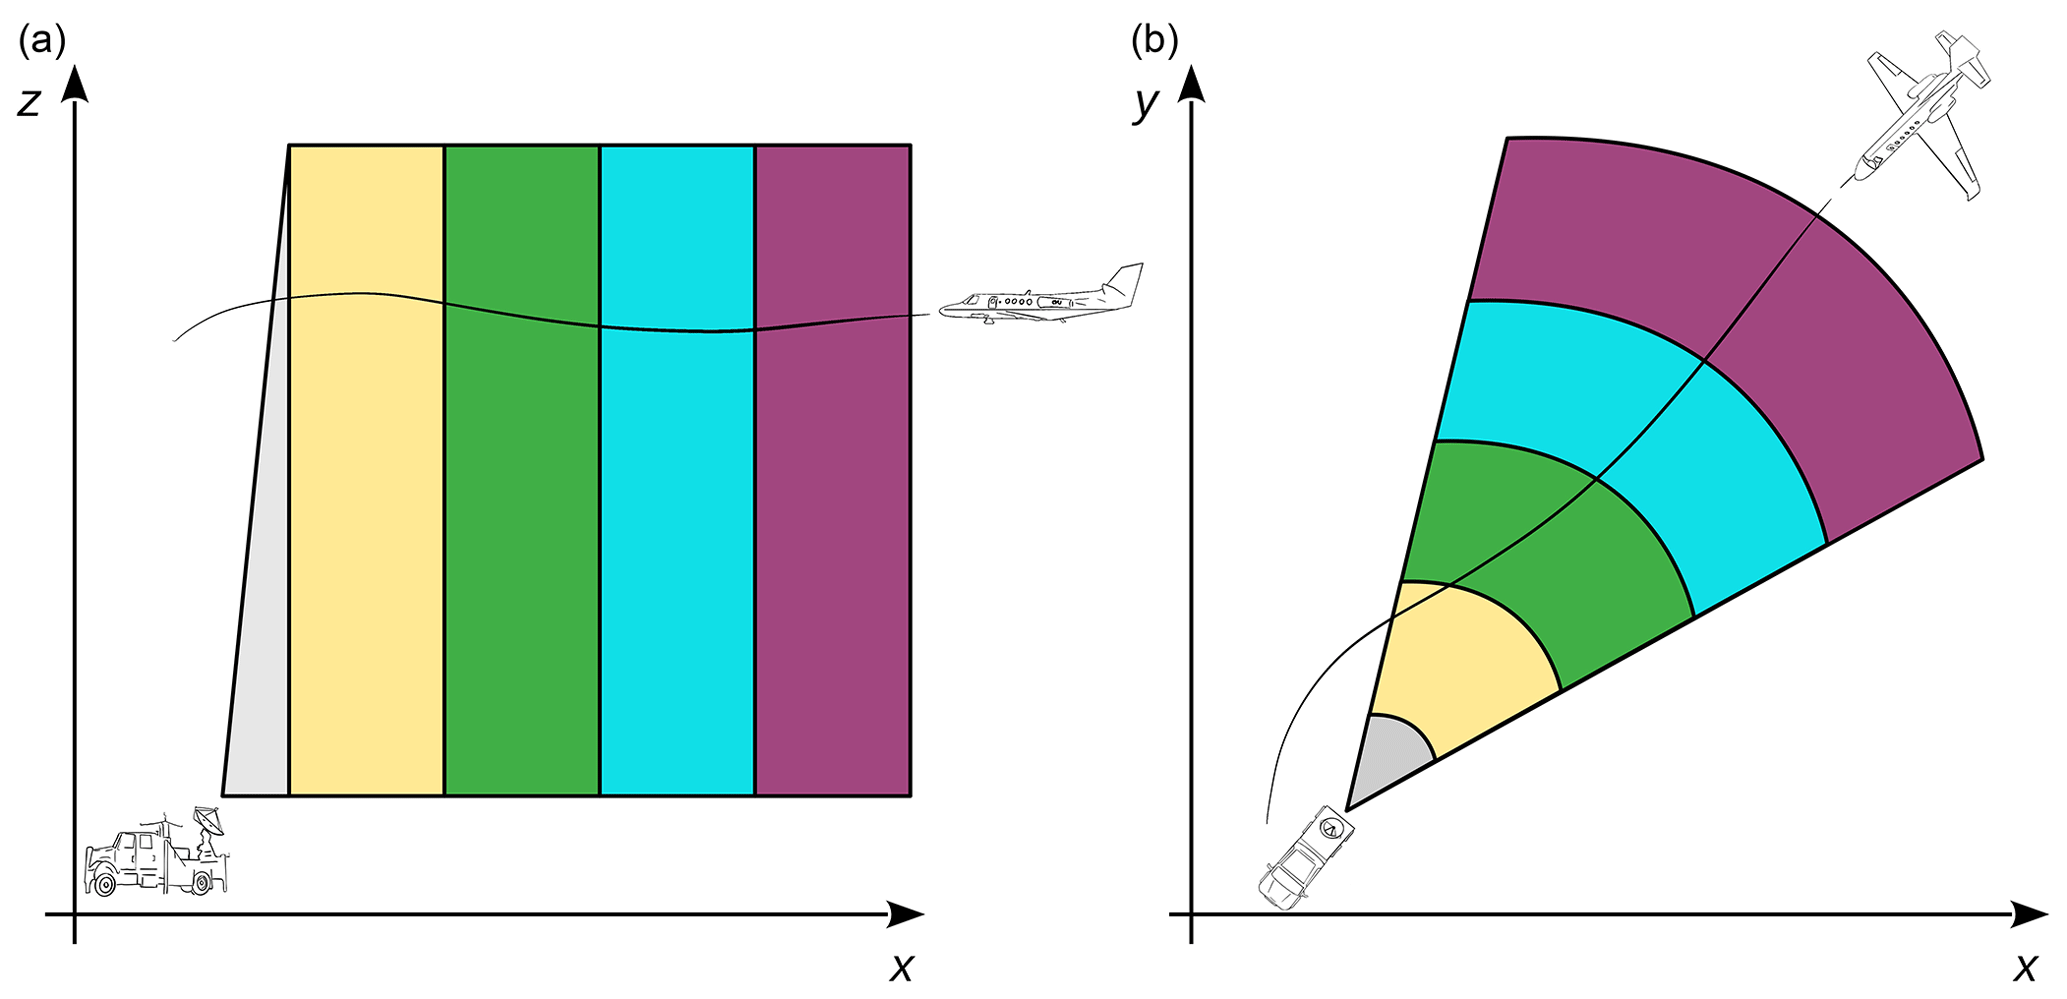
Figure 3A schematic illustration from the collocation of RSVP columns with in situ measurements. Each colored column can be created according to the RSVP procedure depicted in Fig. 1. Gray shaded areas represent omitted data very close to the radar. Panel (a) shows the side view and panel (b) the top view of the aircraft flying through the columns.
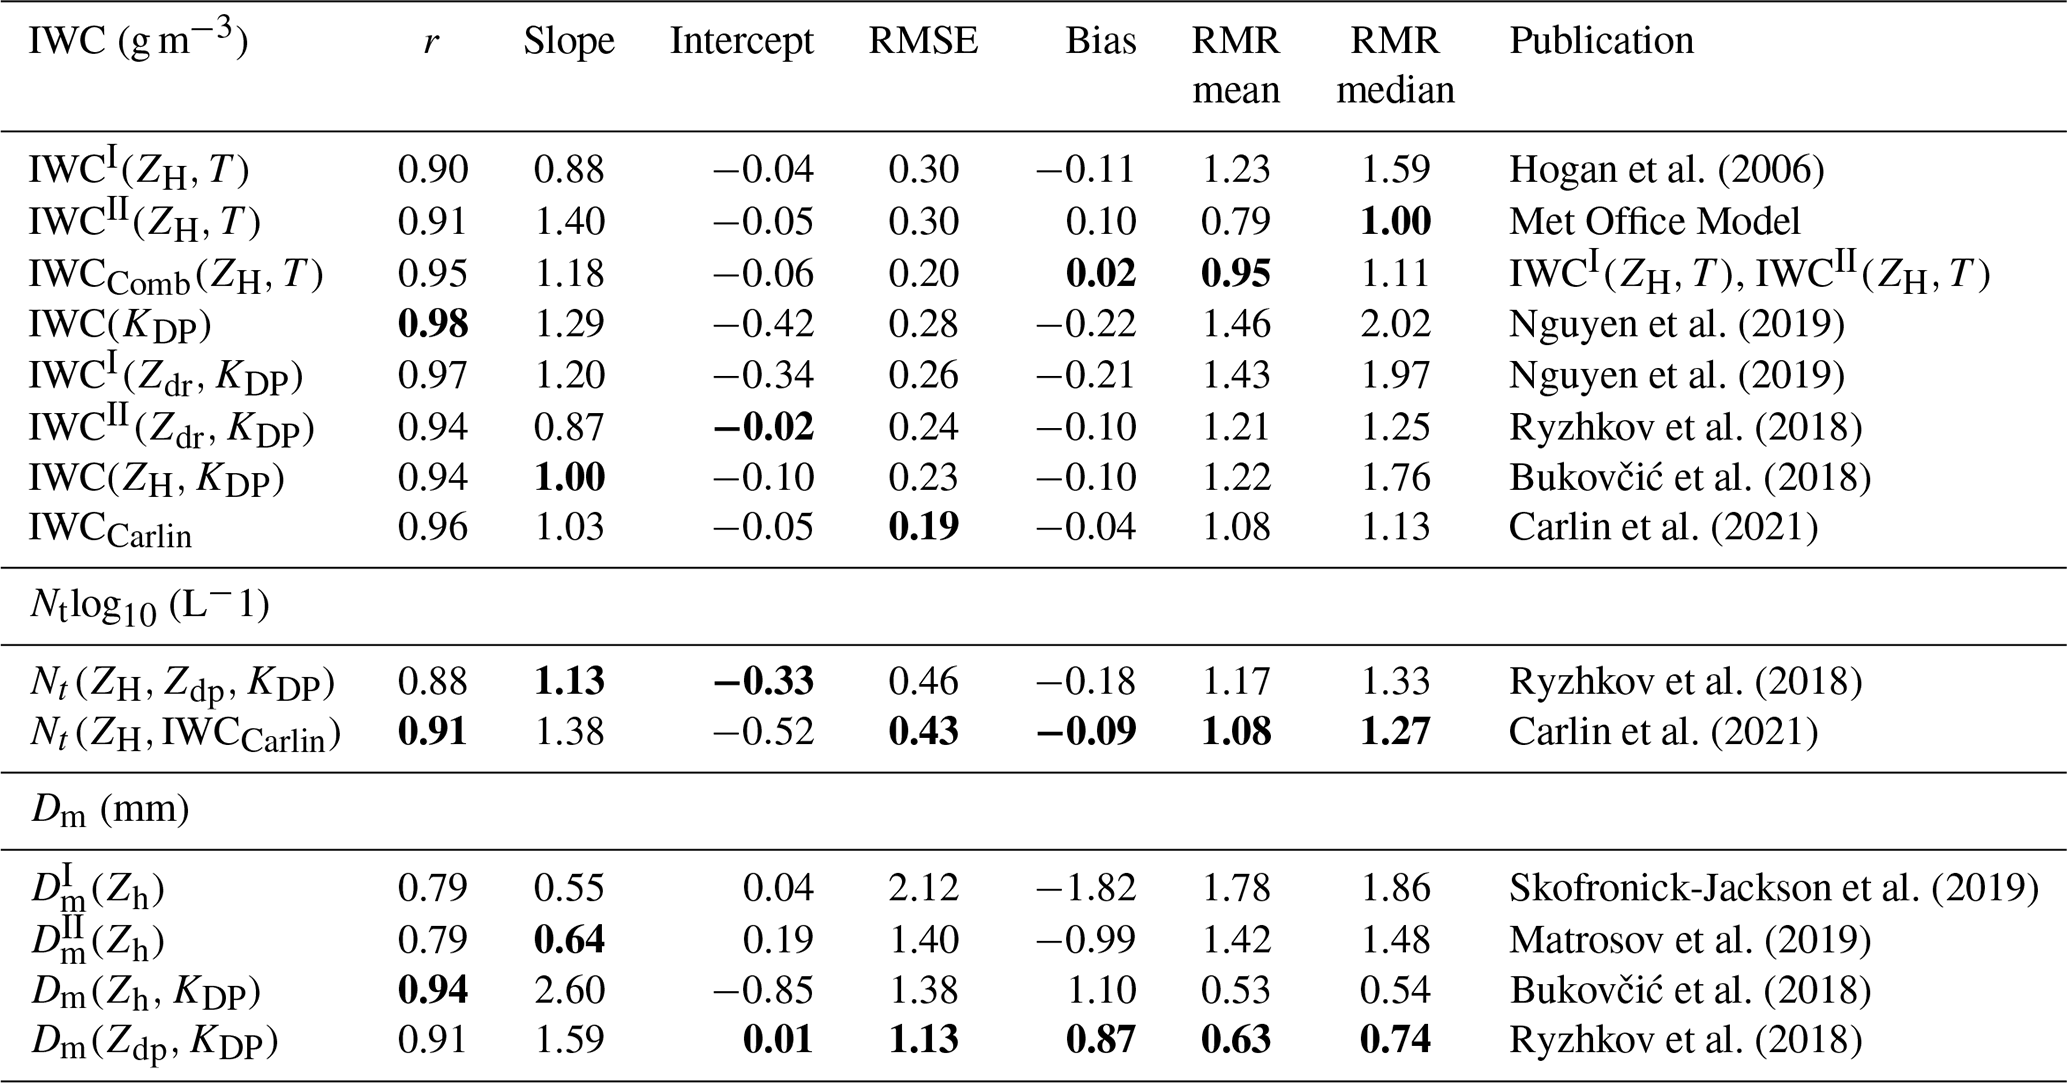
This section presents the resulting accuracies for all polarimetric and non-polarimetric retrievals outlined in Sect. 3 exploiting the collocated in situ measurements available during the OLYMPEX campaign. The in situ measurements are assumed to be the truth in this study despite similar existing uncertainties, e.g., with the assumed mass–dimension relationship. As statistical measures for the agreement between the in situ measurements and the different radar-derived retrievals, the mean and median retrieved-to-measured ratio (RMR), the mean difference (bias), the root mean square error (RMSE), and Pearson's correlation coefficient r are considered. Results for all ice microphysical retrievals introduced in Sect. 3 are shown in Table 3. The retrieval analysis identifies in terms of RMSE IWCCarlin, Nt(ZH,IWCCarlin), and Dm(Zdp,KDP) as the best-performing set for the three quantities considered. It can be seen that the use of polarimetry clearly improves the estimates of IWC and Dm compared to the conventional, non-polarimetric retrievals. In particular, IWCCarlin can improve r by 7 % over IWCI(ZH,T) and reduce RMSE by 37 %. An even greater improvement occurs for the estimation of Dm, where the use of Dm(Zdp,KDP) over both non-polarimetric Dm retrievals increases r by 15 % compared to both non-polarimetric Dm retrievals. Dm(Zdp,KDP) also brings a reduction in RMSE of 47 % compared to . An analysis of IWCI(Zdr,KDP) in the ice regions of tropical clouds during seven flights of the HAIC-HIWC field campaign in Cayenne, French Guiana, showed an overall correlation between in situ and estimated IWCs of 0.72 and a mean RMSE of 0.52 g m−3 (Nguyen et al., 2019). In our case, a lower RMSE of 0.26 g m−3 can be observed for their IWCI(Zdr,KDP) and a systematically higher correlation of 0.97. Again, the advantages of using polarimetry over non-polarimetry are evident in this retrieval. It is interesting that IWC(KDP) shows the highest correlation with 0.98, although Zdr is not included. Nevertheless, both polarimetric estimators based on optimal fitting parameters exhibit a higher RMSE compared to all other polarimetric IWC retrievals, manifested in a systematic overestimation. A possible explanation for the overestimation may be that they were optimized for the tropical climate region characterized by an average higher IWC.
Hogan et al. (2006)Nguyen et al. (2019)Nguyen et al. (2019)Ryzhkov et al. (2018)Bukovčić et al. (2018)Carlin et al. (2021)Ryzhkov et al. (2018)Carlin et al. (2021)Skofronick-Jackson et al. (2019)Matrosov et al. (2019)Bukovčić et al. (2018)Ryzhkov et al. (2018)Table 3Correlations (r), slopes, and intercepts from least-squares fits, root mean square error (RMSE), biases, and mean and median retrieved-to-measured ratio (RMR) for each microphysical property and for all retrievals. Best values of each statistical measure across every microphysical retrieval type are highlighted in boldface font.
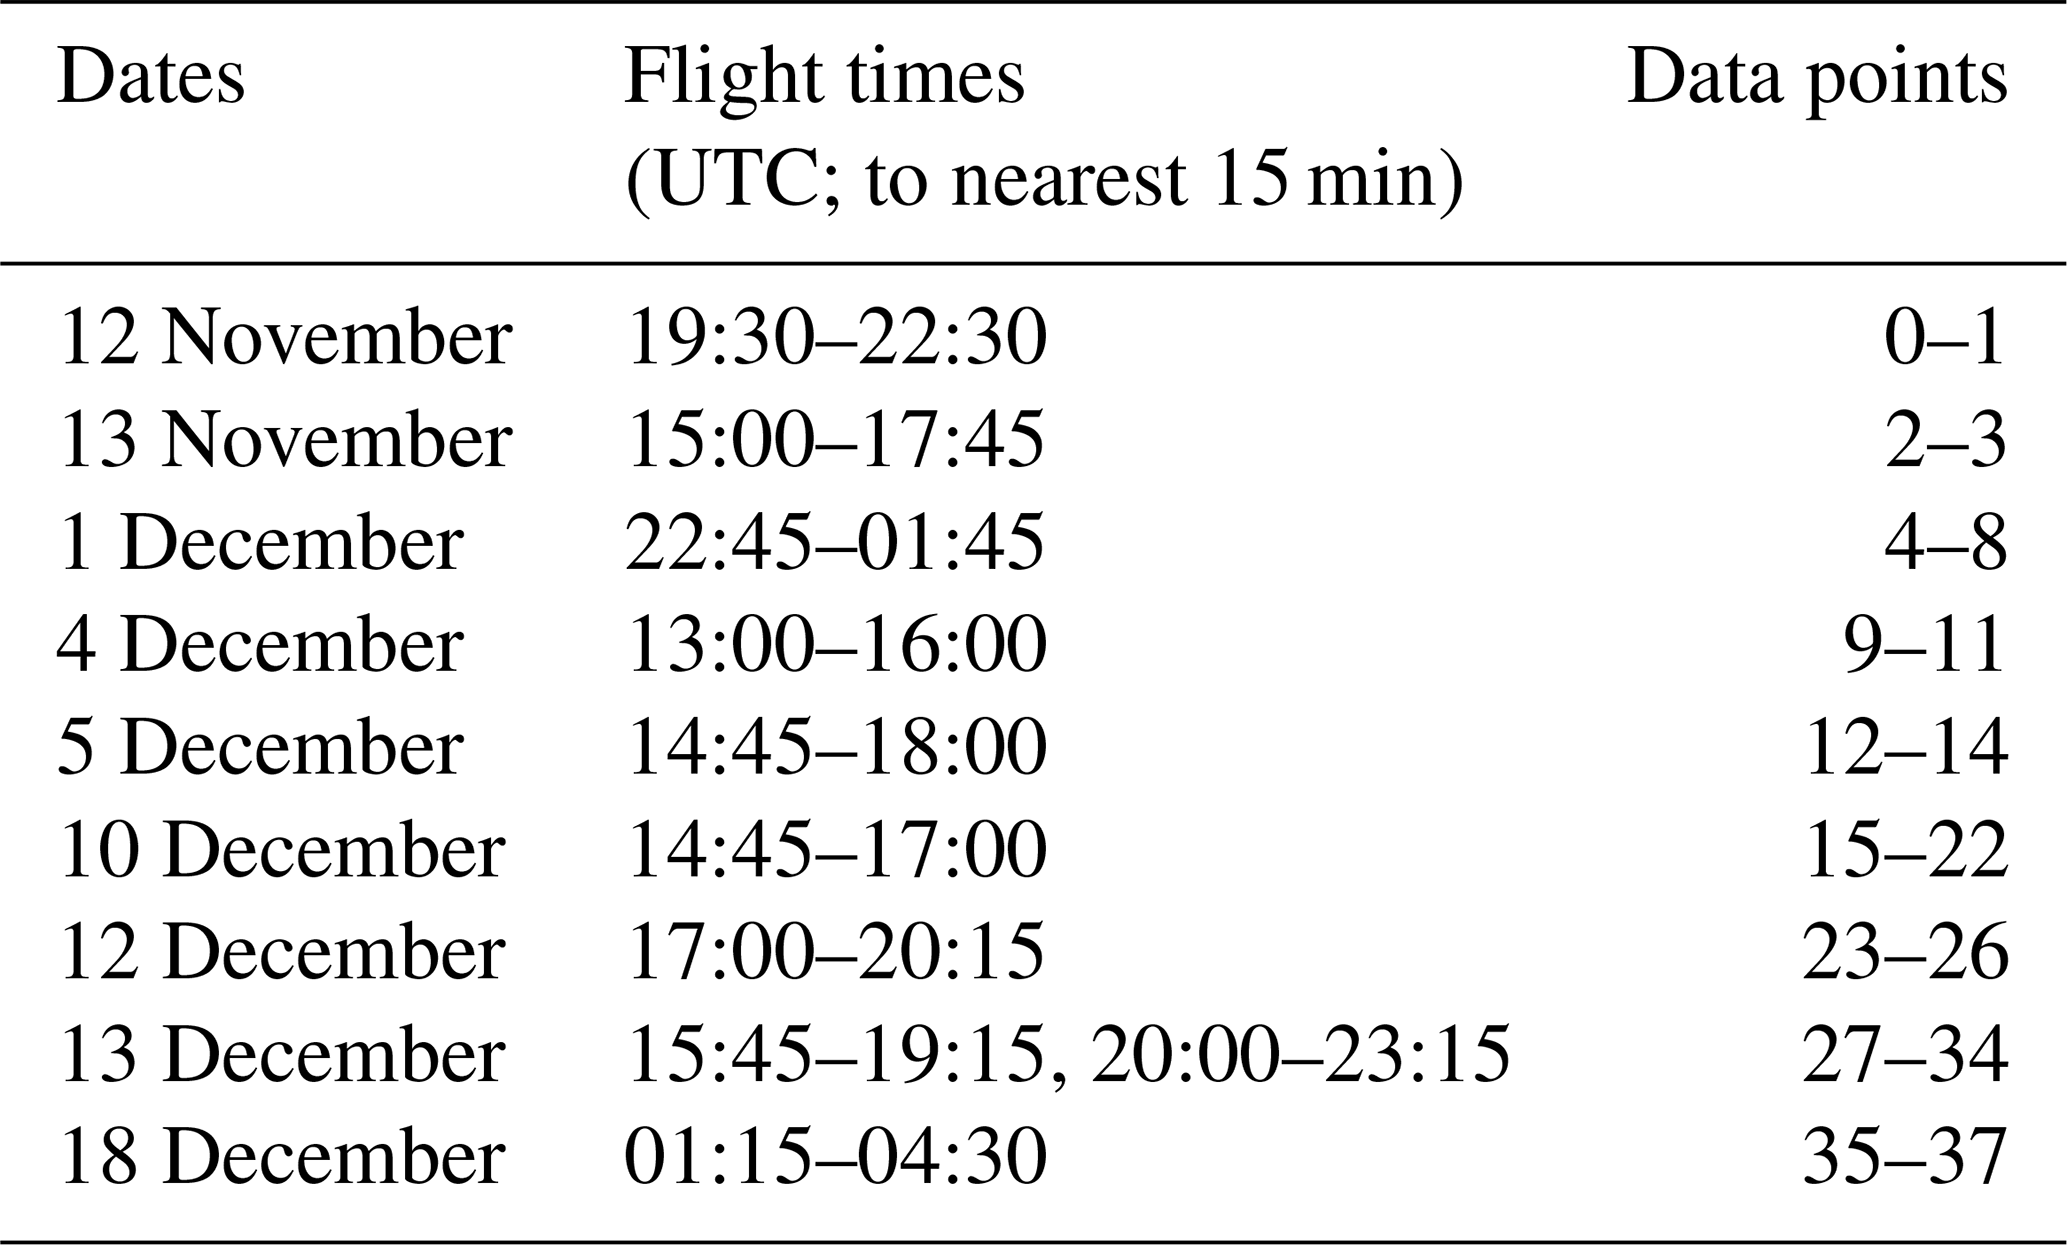
For a more detailed look at the evaluation procedure to obtain information about quantitative statistics and accuracies, we consider an example (Fig. 4) for the best-performing IWC retrieval. Out of 20 campaign flights, 10 flight missions were selected and are listed in Table 4 that have good data quality (in situ and radar) and meet all filter criteria. With the thresholds applied, the correlation of IWCCarlin improves from r=0.91 to r=0.96. The slope of the filtered regression is 1.03, which is closer to the 1 to 1 line than the unfiltered green regression line. The important information here is that the filtering via thresholds provides us with a more reliable database for the analysis.
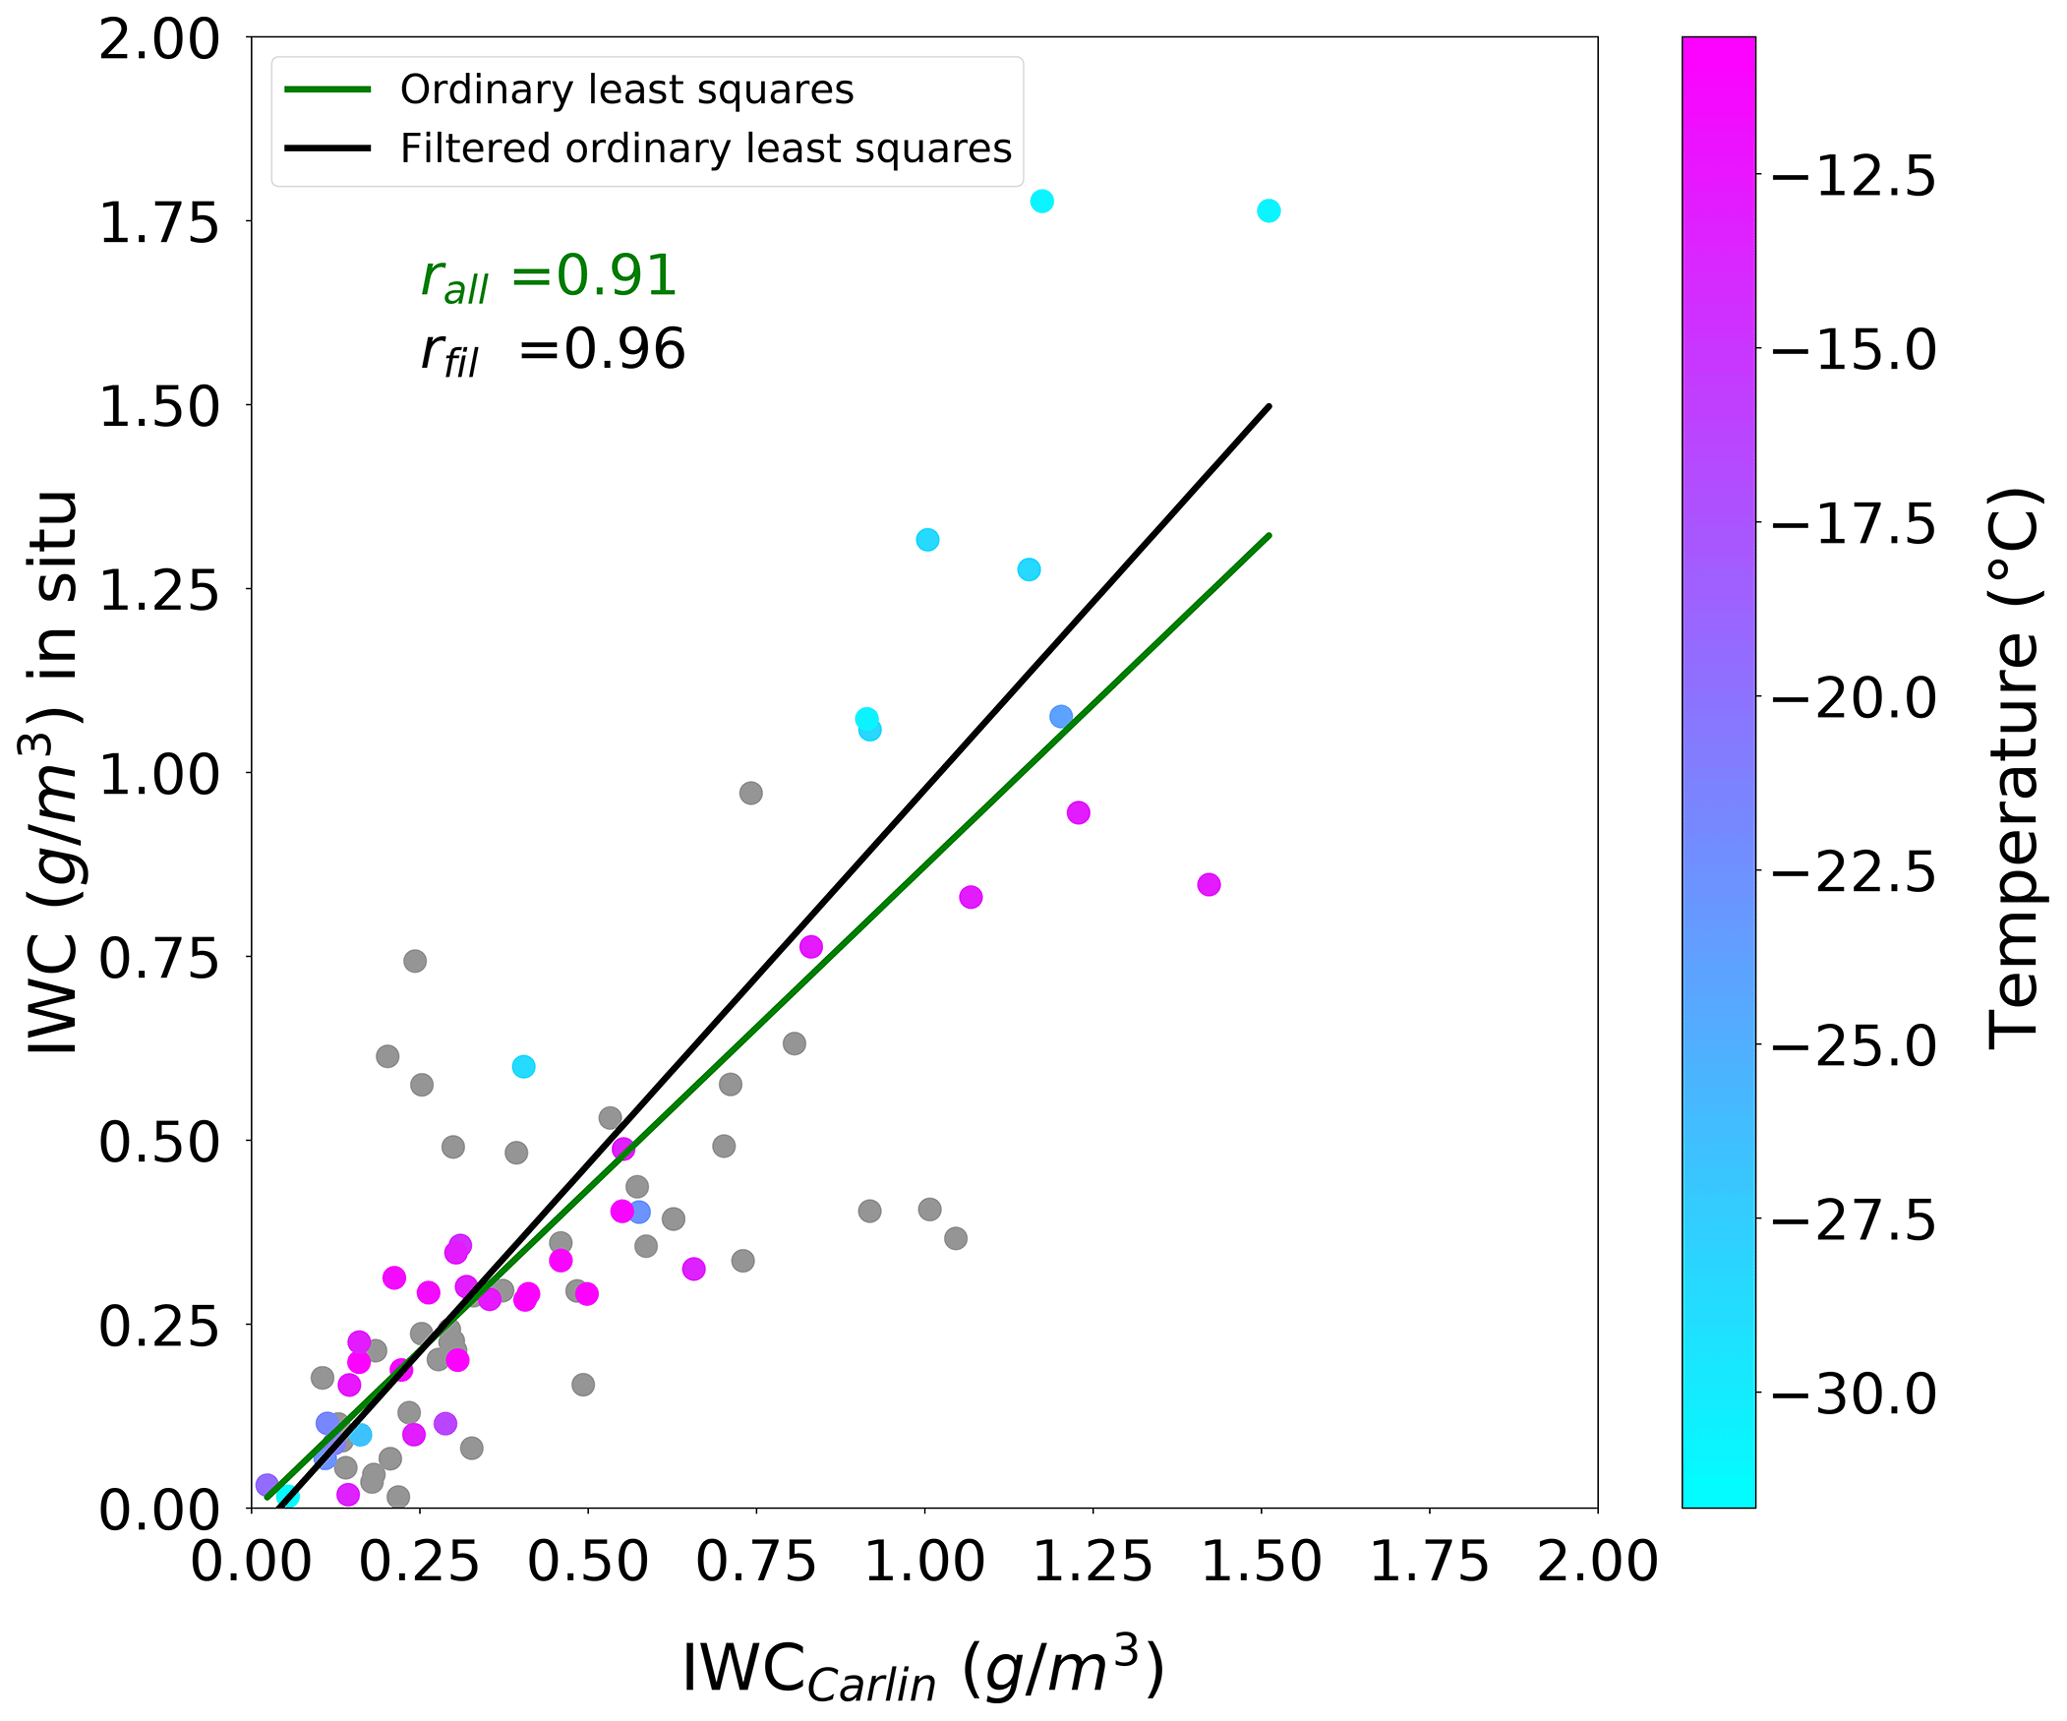
Figure 4Scatter plots and linear regressions of IWC from OLYMPEX in situ data vs. IWCCarlin. Temperature-dependent coloring of each data point indicates temperatures colder than or equal to −10 ∘C, while the gray dots represent data masked via filter criteria for temperature ( ∘C) and intersection time (t≤30 s). The r statistics are reported in green for all data points and in black for filtered ones.
Table 4List of selected Citation II flight missions after applying filter criteria with resulting collocated data points.
The repeated analysis without a temperature threshold applied showed a significant decrease in the correlations for all retrievals (not shown). Figure 5 shows this best-performing set of ice microphysical retrievals, together with the in situ data. Overall, we see a tendency towards a slight overestimation of IWC at warmer ( ∘C) and an underestimation at colder temperatures ( ∘C), with the largest in situ standard deviation at colder temperatures. IWCCarlin yields a high correlation of r=0.96, the lowest RMSE of 0.19 g m−3, and a near-zero bias of −0.04 g m−3. Carlin et al. (2021) found some evidence that using IWCCarlin for the initialization of a 1D spectral bin model results in a more constrained forecast with respect to the snowfall start time compared to using the IWC(ZH,KDP) retrieval only. The outstanding performance of IWCCarlin within this accuracy assessment is in line with these findings.
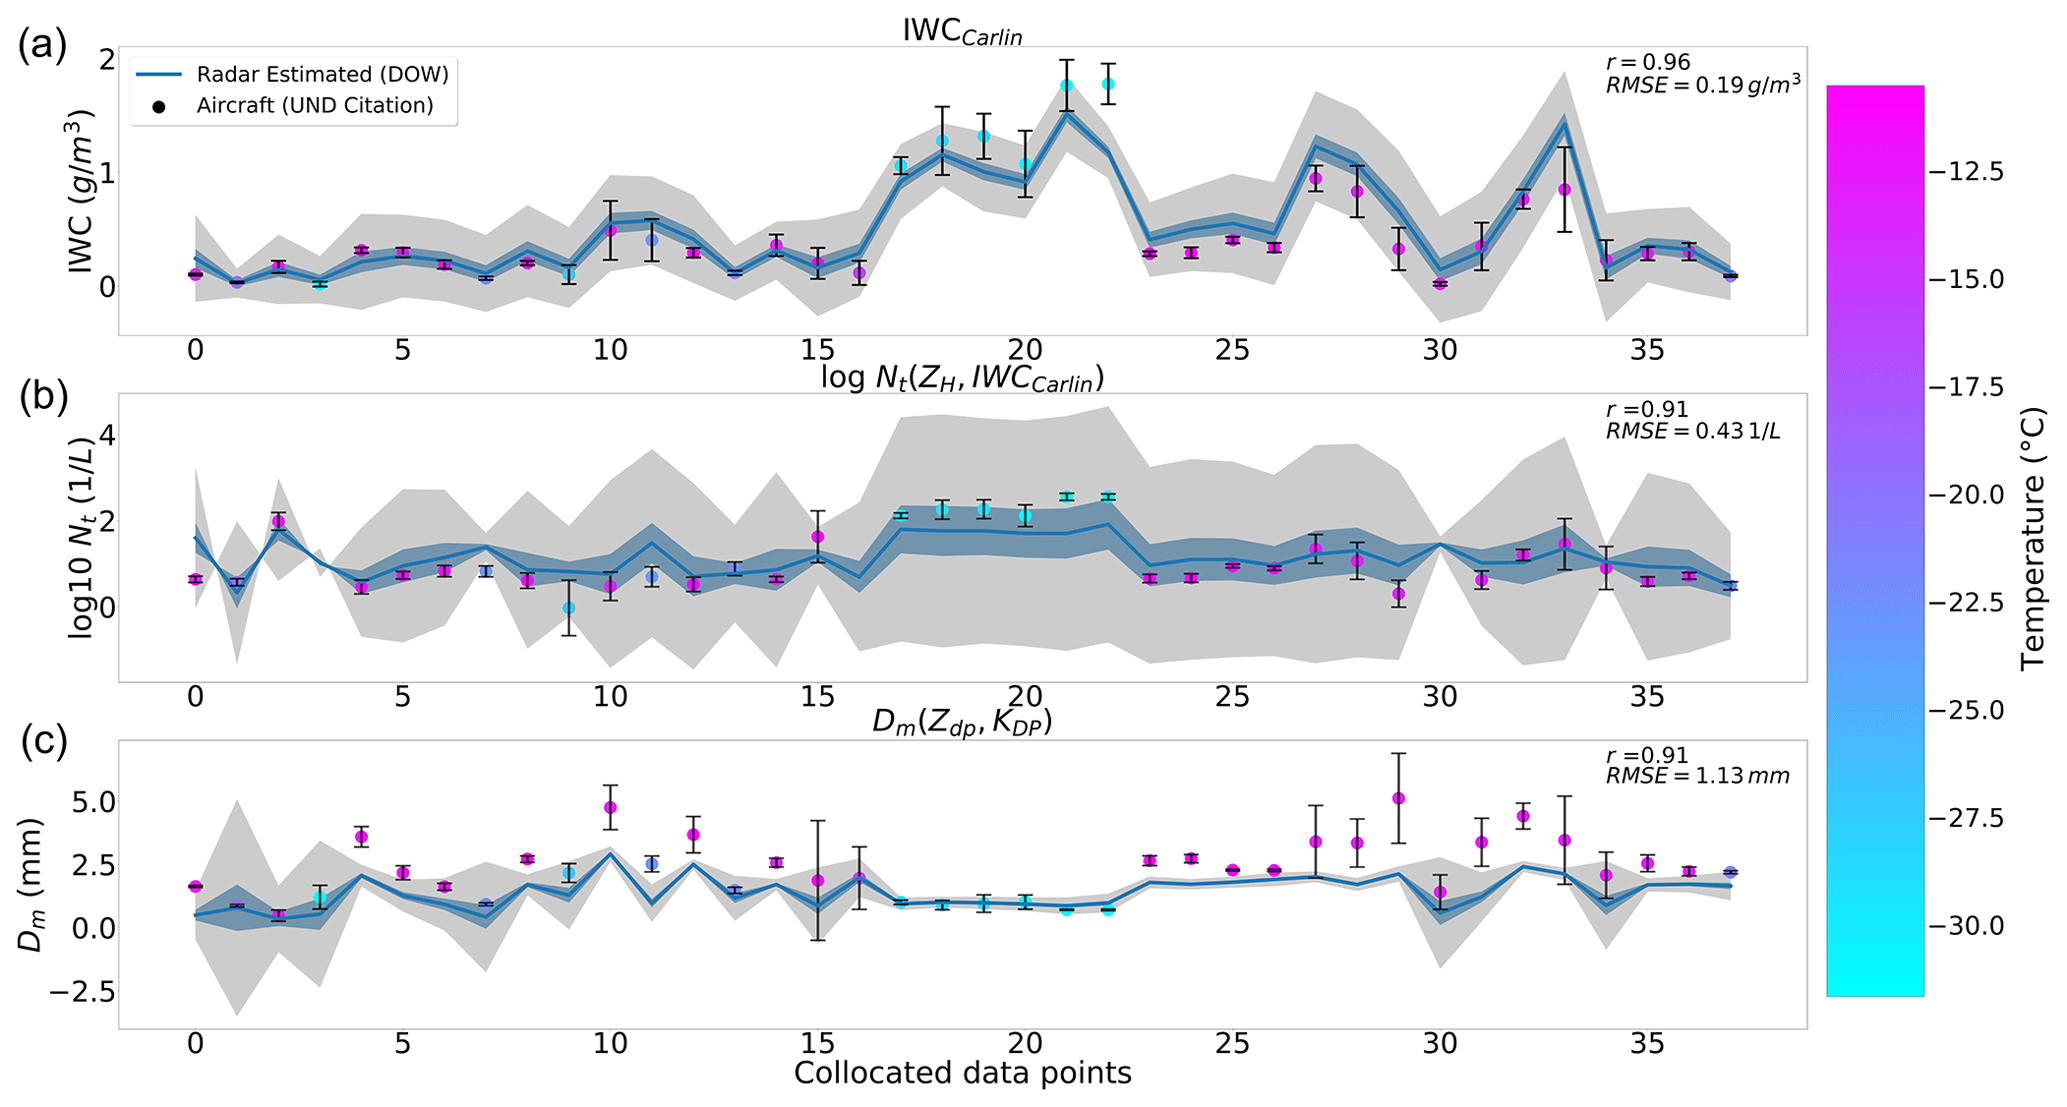
Figure 5Collocated aircraft in situ data in chronological order (colored dots) and the best-performing set of ice microphysical retrievals based on RSVP data (solid blue lines) for 10 flight missions. Plots represent from top to bottom IWCCarlin, Nt(ZH,IWCCarlin), and Dm(Zdp,KDP). Shadings show ±1σ (gray) and standard error of the mean (blue) calculated via Gaussian error propagation. Colors following the color bar indicate the respective temperatures (in ∘C). Vertical bars represent in situ standard deviations.
The polarimetric retrieval for Nt(ZH,IWCCarlin) poses a greater challenge (Fig. 5, middle panel). It shows a high variability and more pronounced deviations from the in situ measurements but still reaches a convincing correlation of r=0.91. Similar to IWCCarlin, Nt(ZH,IWCCarlin) shows an overestimation at warmer ( ∘C) and underestimation at colder temperatures ( ∘C). Pronounced Nt deviations at warmer temperatures are visible for the collocated data points 29 and 31, with the former also revealing large standard deviations on the in situ side. The outlier at data point 9 exhibits KDP values below 0.1 ∘ km−1, which may indicate deficiencies of this retrieval for very low KDP values, but the in situ values show relatively high variability as well. The Dm(Zdp,KDP) retrieval (Fig. 5, bottom panel) estimates particle size especially well at colder temperatures. Mixtures of aggregates with different sizes coexisting near the ML (solid region) may explain the high in situ standard deviations at warmer temperatures (e.g., data point 29 where Dm is in excess of 5 mm). Furthermore, the occurrence of an increased number of aggregates reducing the information content of KDP can result in an underestimation of Dm(Zdp,KDP), which makes Dm estimation via polarimetric retrievals close to the freezing level challenging. In line with our analyses, Murphy et al. (2020) indicated larger errors with polarimetric Nt and Dm retrievals in the immediate vicinity of the ML. Despite this underestimation, a convincing correlation of r=0.91 is obtained.
Direct comparisons of both IWC(Z,T) retrievals with the IWCCarlin retrieval reveals that both non-polarimetric retrievals show a worse performance in terms of lower correlation and higher RMSE (see Table 3). Note that the use of temperature information from soundings or models would further reduce the performance of IWC(Z,T) retrievals due to increased uncertainties compared to in situ temperature data recorded during the flights. Figure 6 indicates that each IWC(Z,T) shows a better performance in a certain temperature range. Accordingly, we combined them using Eq. (11) for T≤15 ∘C and Eq. (12) elsewhere; i.e., the DGL located between approximately −10 to −15 ∘C providing the optimal conditions for the depositional growth of ice serves here as the boundary for the two retrievals. This combination, hereafter referred to as IWCComb(ZH,T), shows promise in estimating IWC with non-polarimetric data more precisely, as it reduces the RMSE to 0.20 and increases the correlation to 0.95 (Table 3). The bias of the combined method with a value of 0.02 g m−3 is slightly closer to 0 compared to IWCCarlin. However, a more extensive dataset is needed to corroborate this finding.
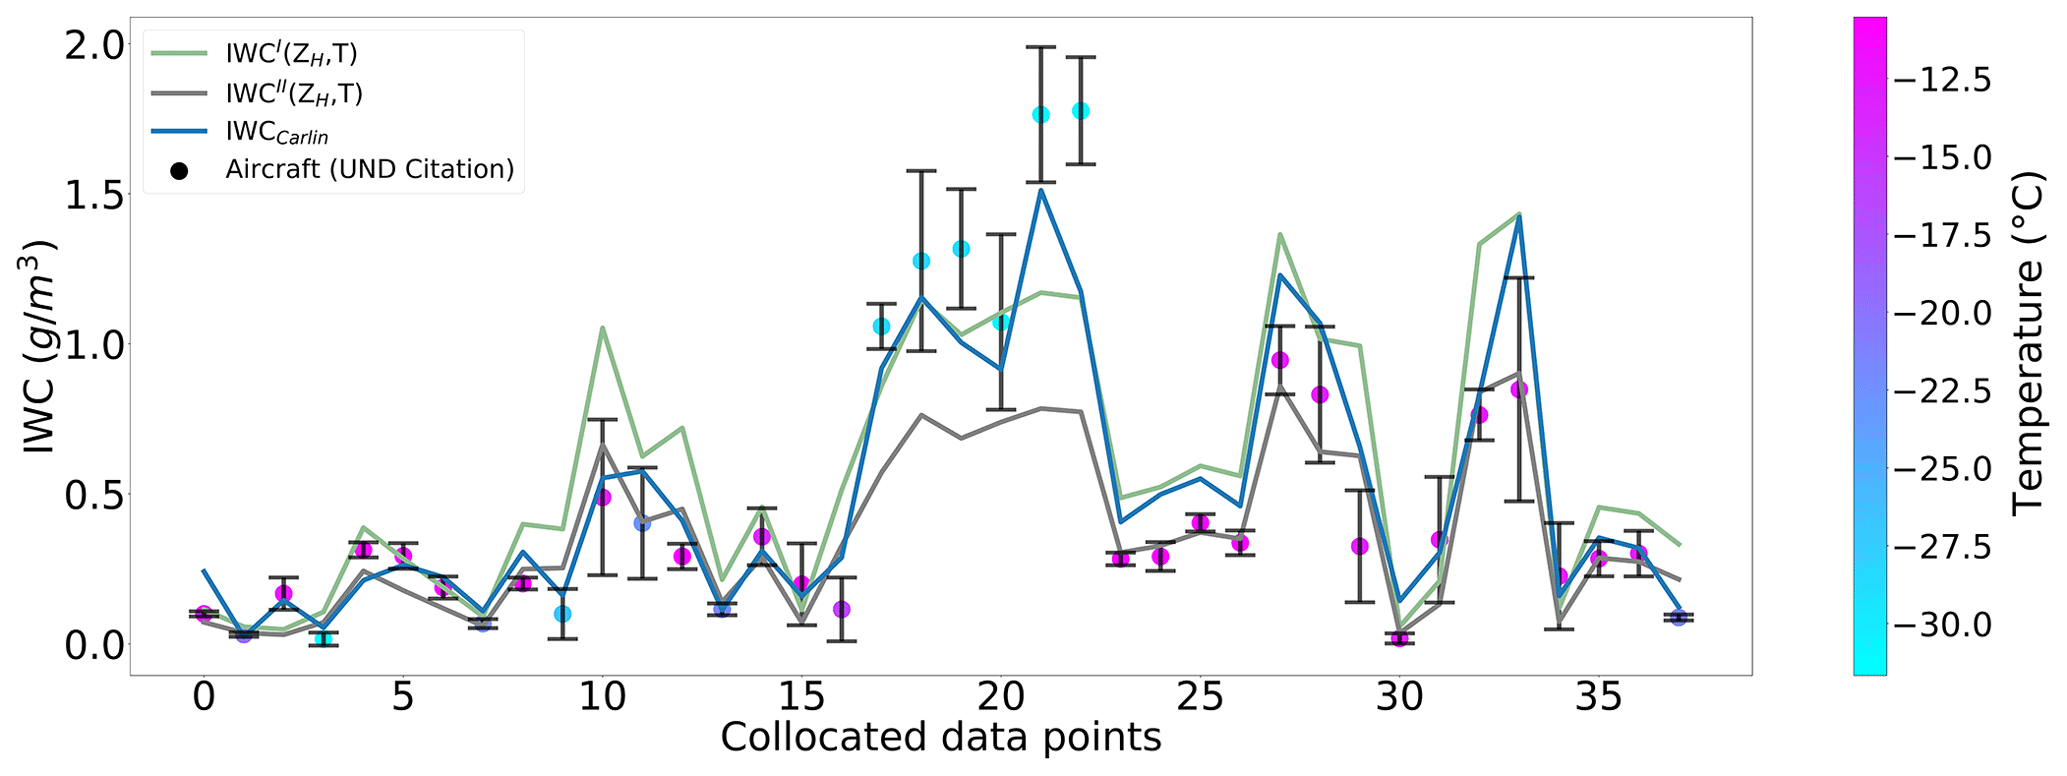
Figure 6Collocated aircraft in situ data in chronological order (colored dots), the IWCI(ZH,T) (green), the IWCII(ZH,T) (gray), and the IWCCarlin (blue) of RSVP data (solid lines) for 10 flight missions. Vertical bars have the same meaning as in Fig. 5.
Heymsfield et al. (2008) also evaluated non-polarimetric IWC retrieval methods, including the IWCI(ZH,T) variant for 95 GHz, using test datasets derived from in situ microphysical measurements. The retrieved-to-measured ratio (RMR) was calculated via dividing the mean or median of the retrieved quantity by the measured quantity, with a selected range of indicating “good” agreement between retrievals and measurements. Their IWCI(ZH,T) showed a tendency to underestimate IWC at low temperatures and overestimate it at warm temperatures, consistent with our results. Overall, their non-polarimetric radar-only approach and radar temperature retrievals yielded a mean (median) RMR of 1.29 (1.20). Our analysis shows a similar mean RMR of 1.23 for IWCI(ZH,T) but a slightly higher median RMR value of 1.59. It is noteworthy that the polarimetric IWCCarlin outperforms IWCI(ZH,T) and their radar-only and radar temperature retrievals, with a mean RMR close to unity (see Table 3).
Figure 7 also demonstrates the pronounced biases associated with the and retrievals, with especially large deviations (strong overestimation) at colder temperatures. This result underlines again the importance of the key variable KDP in ice and reveals the notorious inaccuracies of conventional Dm retrievals. However, these power laws could potentially be used in combination with polarimetric Dm retrieval in areas near the ML in a hybrid fashion to obtain a more accurate estimate of Dm.
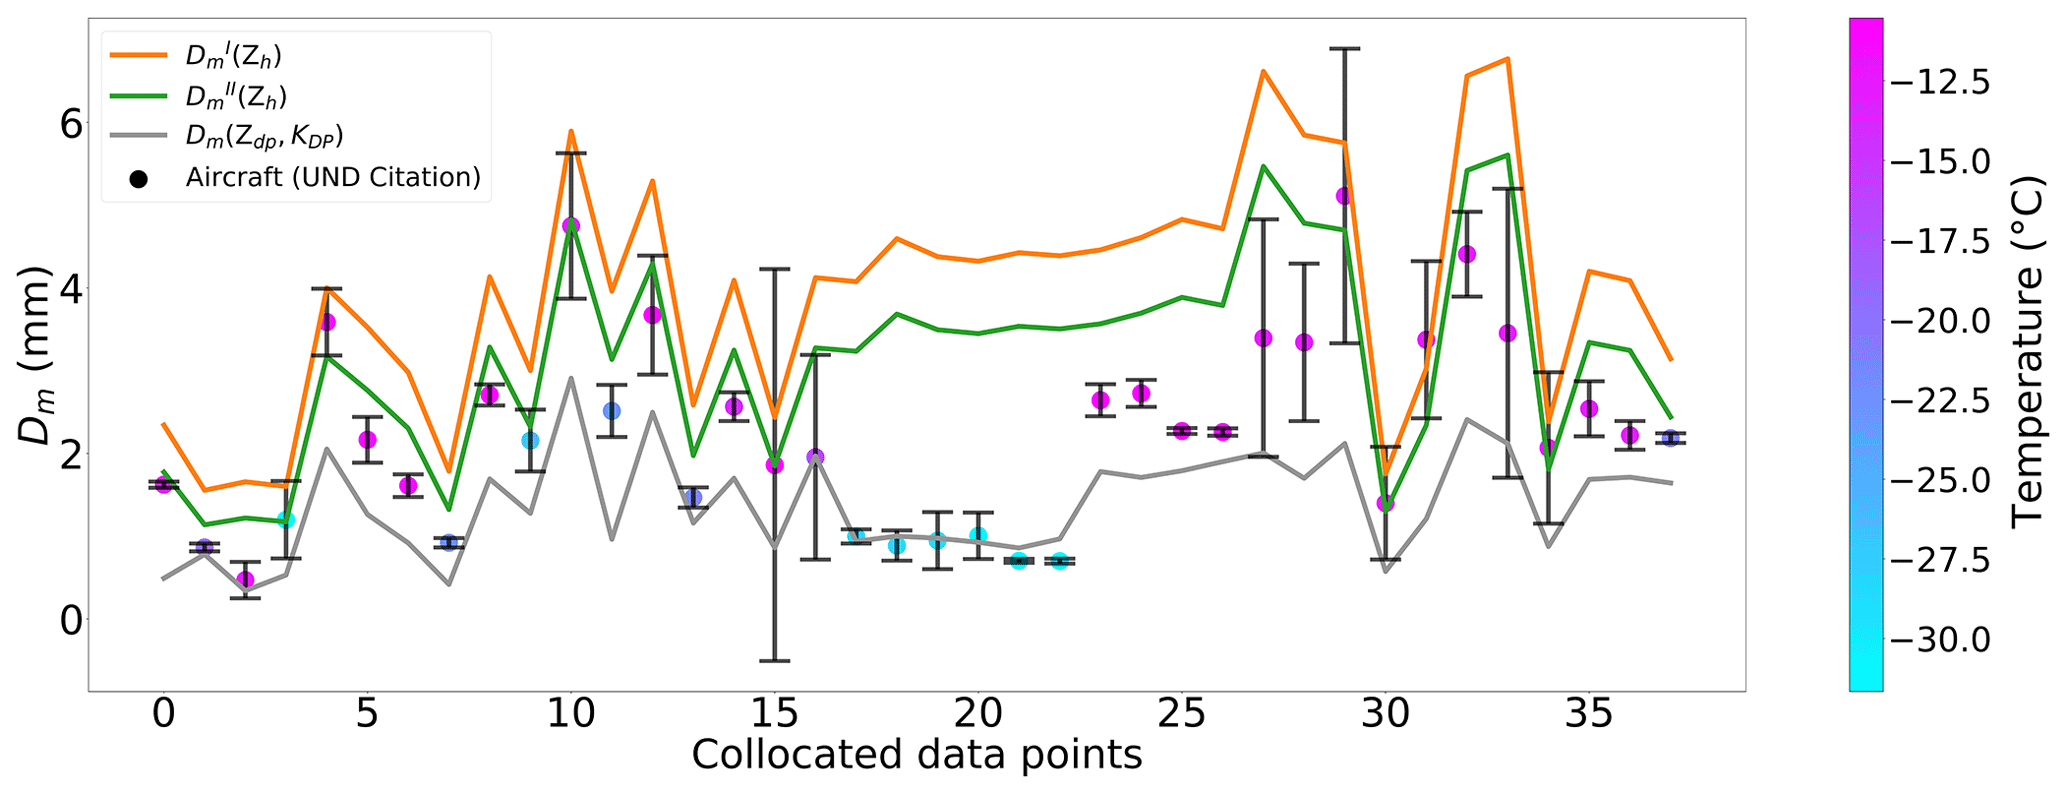
Figure 7Collocated aircraft in situ data in chronological order (colored dots), the Dm power laws (yellow and green), and the Dm(Zdp,KDP) retrieval (gray) of RSVP data (solid lines) for 10 flight missions. Vertical bars have the same meaning as in Fig. 5.
Our analysis of Nt(ZH,IWCCarlin) shows good agreement in terms of mean RMR (1.08), whereas none of the Dm retrievals in this evaluation fall within the chosen RMR range, with the best-performing Dm(Zdp,KDP) exhibiting a RMR median value close to the lower limit with a value of 0.74. Overall, our analysis is consistent with findings by Murphy et al. (2020), who found a strong underestimation of the Dm(Zdp,KDP) retrieval near the ML. Similarly, our analysis shows the best results in regions with high ZDR and KDP, such as in the DGL, and the worst just above the freezing level, where ZDR and KDP signatures nearly vanish as a result of aggregation processes (Ryzhkov et al., 1998).
For a more detailed analysis and improved understanding, examples of the most pronounced discrepancies encountered between in situ and retrieved quantities are spotlighted and presented, together with CPI imagery, HVPS samples, and/or RSVPs.
On 10 December 2015 at 15:58 UTC (data point 22, see top panel in Fig. 5), the aircraft entered the RSVP column at a distance of 15.5 to 20 km from the DOW. In this flight segment, a mean temperature of −31 ∘C was measured by the Citation II at a mean altitude of 5.7 km. The discrepancy between in situ observed IWC and retrieved IWCCarlin is striking here, with an underestimation of 0.61 g m−3 by the radar-based retrieval. This is the only data point where the IWC discrepancy is so pronounced that even the uncertainty estimates via the standard deviations from both in situ and retrieval side do not show any overlap. One possible reason for the underestimation by IWCCarlin is the temporal mismatch displayed in Fig. 8. Since the aircraft entered at 15:58 UTC and left at 15:59 UTC, the collocation was assigned to the RHI sector scan that began at 15:54 UTC. Thus, it is temporally at the very end of this sector scan. However, the subsequent one might contain signatures that had already been started to be measured at the end of the previous sector scan. For instance, a higher IWC due to advection at the end of the scan could be present. Note that two RHI sector scans are always followed by a PPI scan of 2 min. The following RHI sector scan starting at 16:00 UTC is also close in time to the in situ measurements and shows a higher IWC of 1.39 g m−3, reducing the discrepancy to 0.39 g m−3. Moreover, choosing this scan leads to overlapping standard deviations, with a retrieval σ of 0.45 g m−3. However, this data point also shows the slight underestimation of IWCCarlin at colder temperatures.
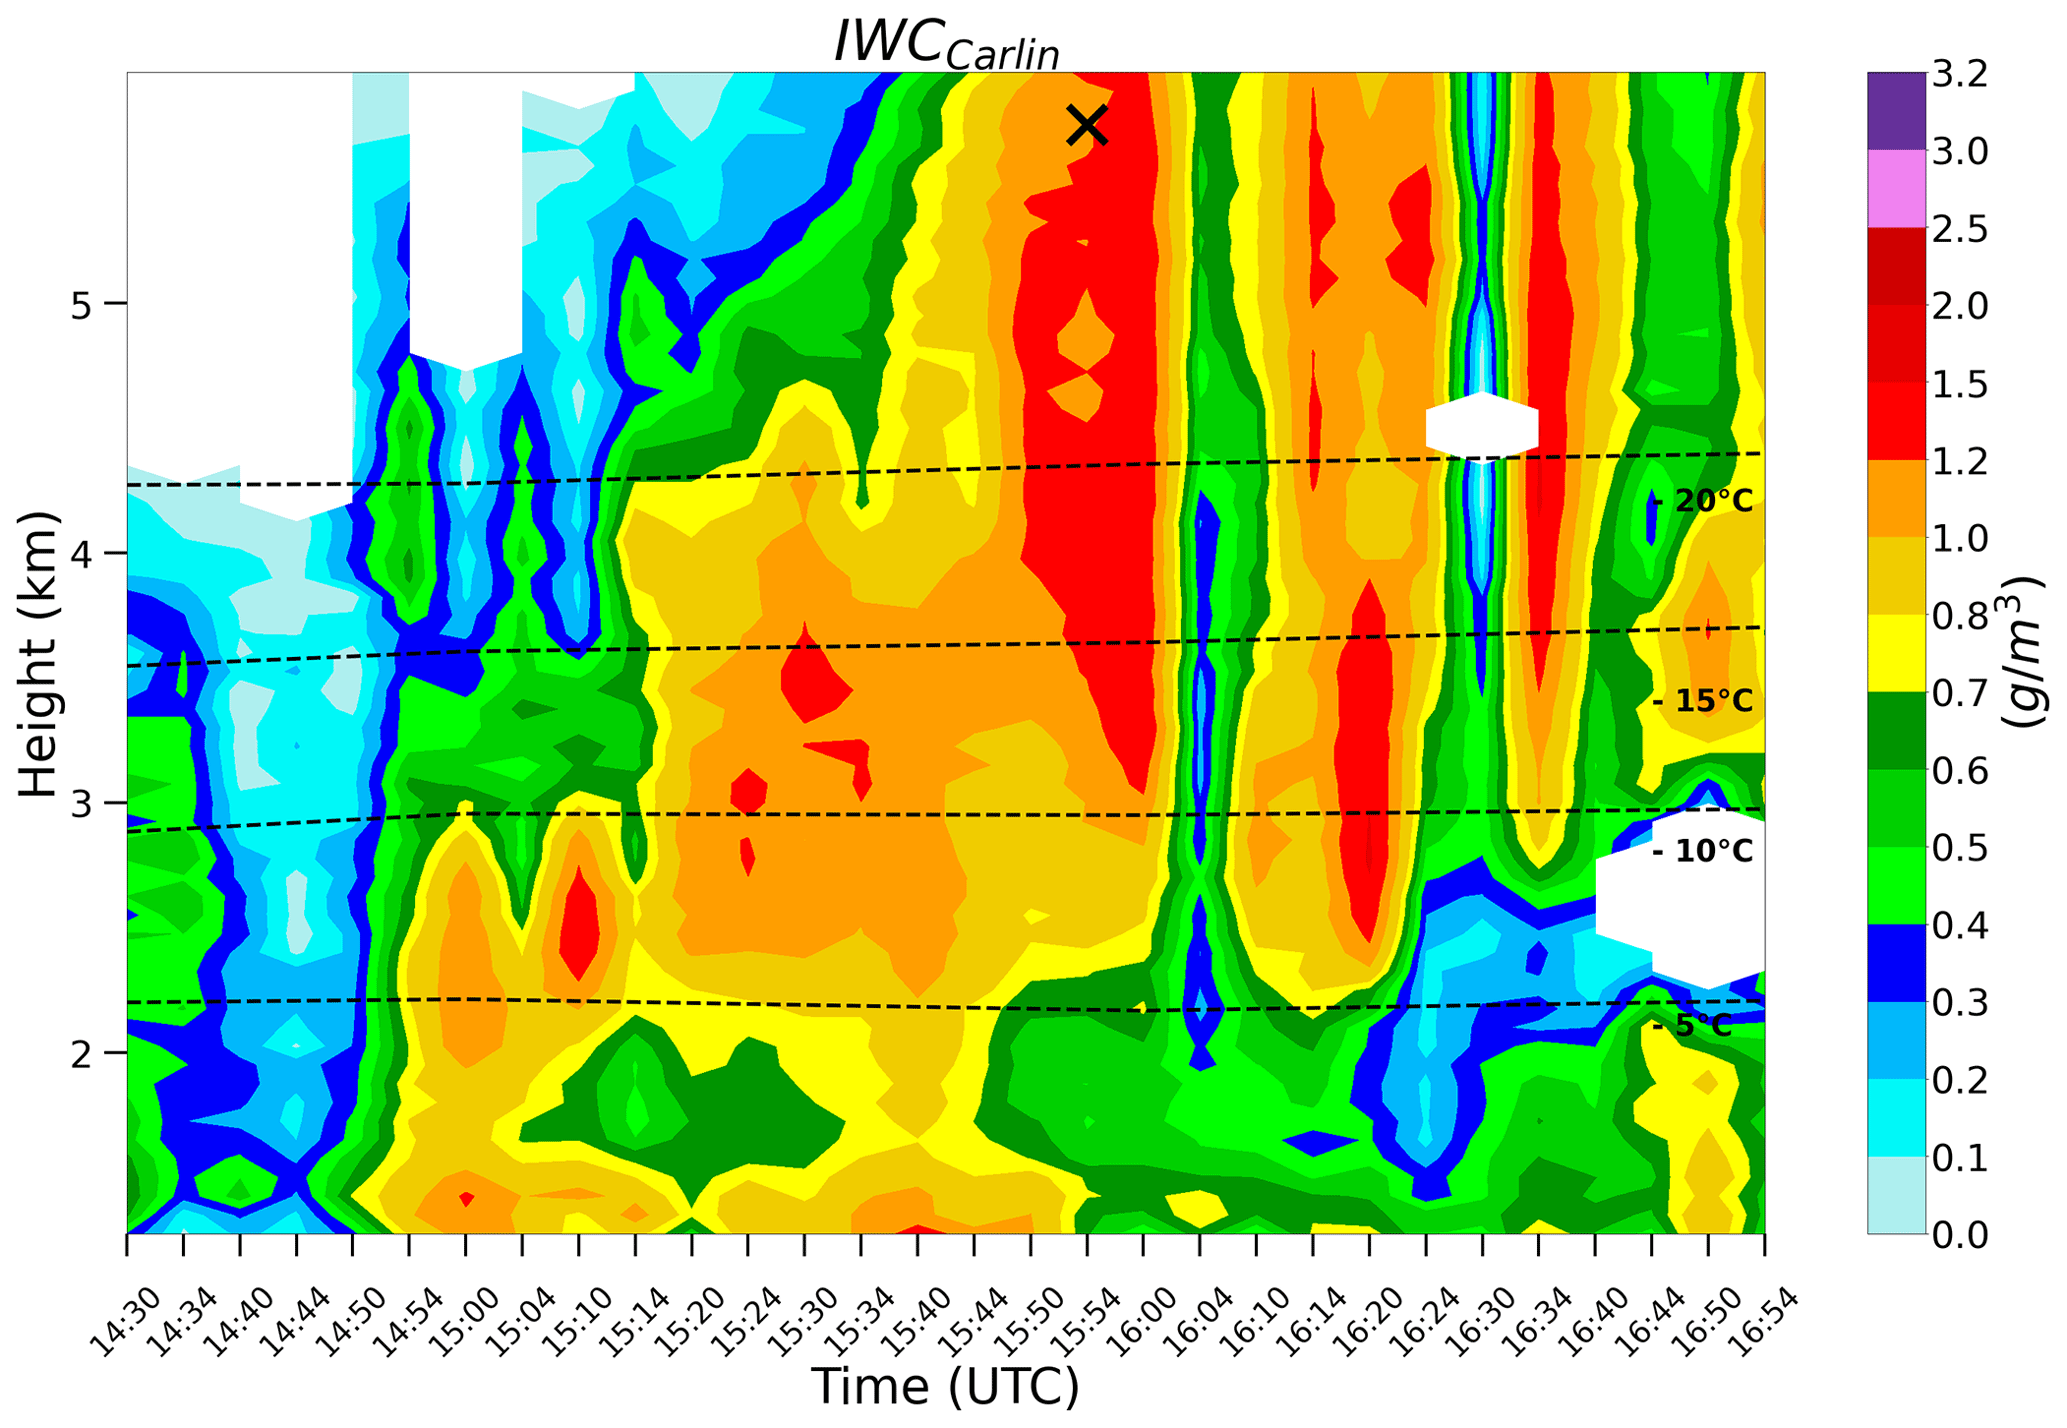
Figure 8RSVPs of IWCCarlin at ranges between 15.5 and 20 km from the DOW on 10 December 2015 between 14:30 and 16:54 UTC. Overlaid dashed lines display the −5, −10, −15, and −20 ∘C isotherms from ERA5 at the DOW location. The collocated data point is indicated by the black cross.
The most pronounced discrepancy in terms of Dm emerges on 13 December 2015 at 16:17 UTC (data point 29, see lower panel in Fig. 5) when the aircraft entered the RSVP column at a distance of 6.5 to 11 km from the DOW. Here, the Citation II measured a mean temperature of −13 ∘C at a mean altitude of 2.95 km. Retrieved Dm(Zdp,KDP) strongly underestimates the in situ observed Dm peak exceeding 5 mm, with an underestimation of almost 3 mm. Note that in this case there is no temporal mismatch. Figure 9 illustrates sampled particles captured along the relatively narrow flight path of the aircraft. It seems the smaller in situ sample is dominated by larger particles, while the larger RSVP volume also accounts for the immediate vicinity where more smaller particles may be present. These possibly affect Dm(Zdp,KDP) significantly due to averaging and may not properly resolve the regions with enhanced in situ Dm peaks. In addition, the DOW sector scan started at 16:14 UTC, and thus the RSVP volume also contains particles not monitored by the aircraft entering the sector later. The particles may be smaller and could explain the discrepancy between in situ observed Dm and retrieved Dm(Zdp,KDP). It is also worth mentioning that an in situ σ of 1.78 mm is observed along the trajectory, indicating high variability in this region.
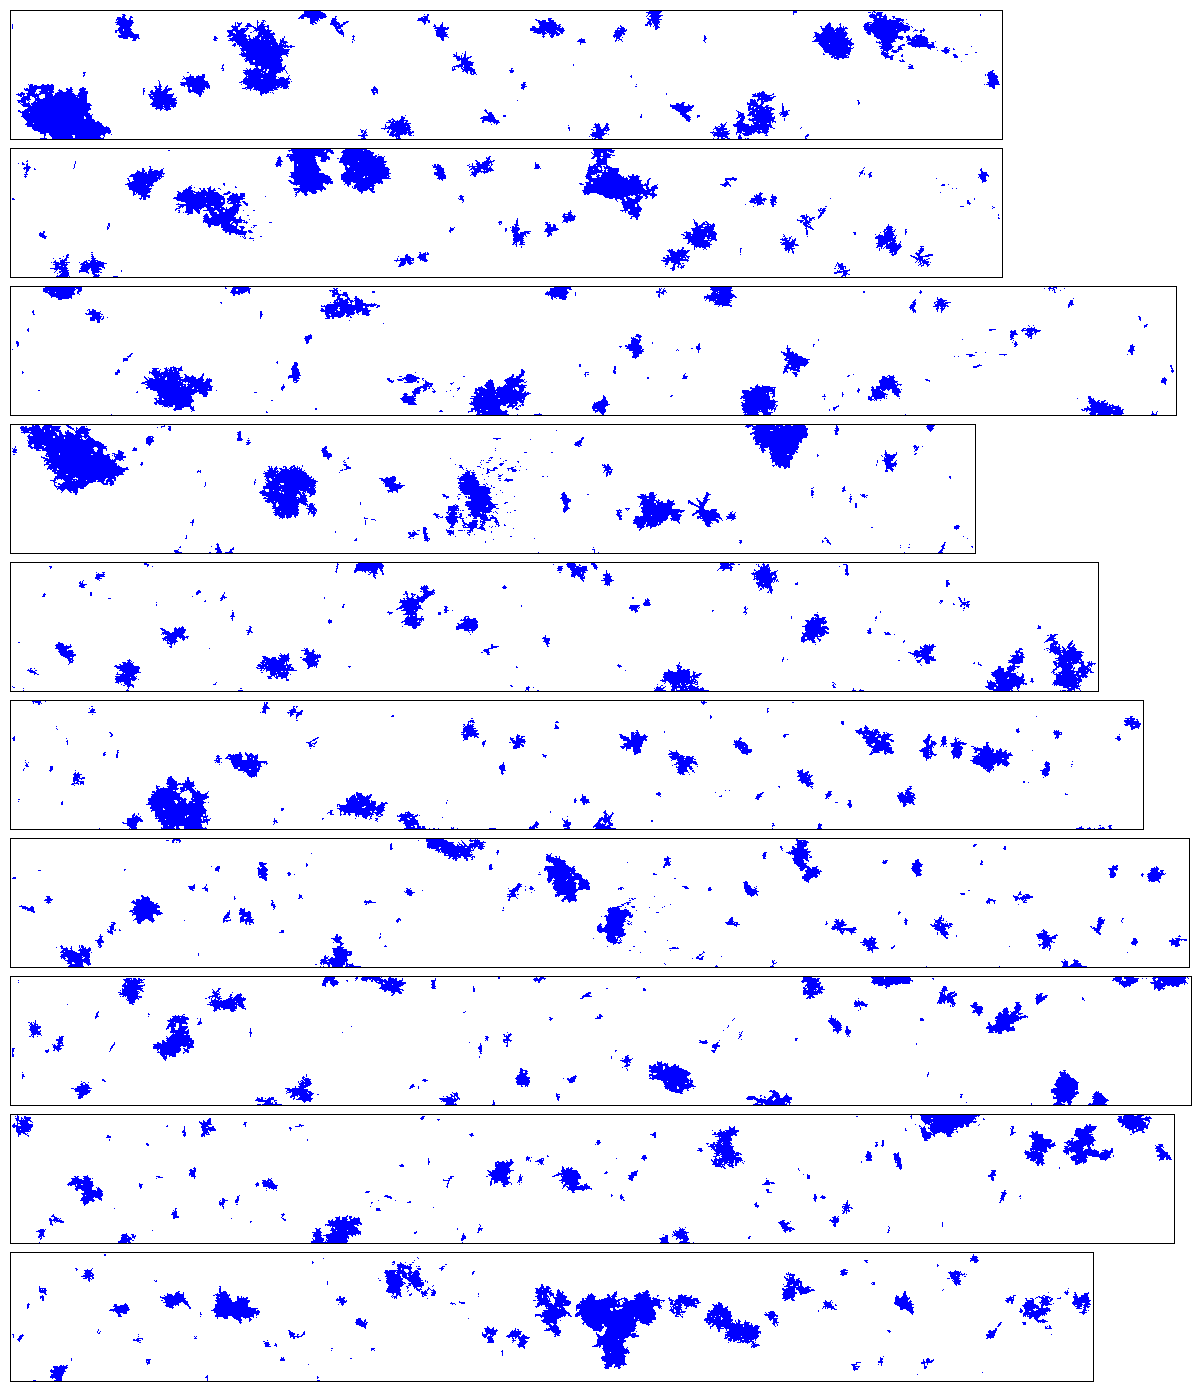
Figure 9HVPS sample images of hydrometeor shadows on 13 December 2015 at 16:18 UTC. The images correspond to the trajectory within the DOW sector scan starting at 16:17 UTC. The height of each panel represents 19.2 mm.
In agreement with the RICE measurements, indicating the presence of SLW with a sudden decrease in frequency (Fig. 10), the CPI example particle images in Fig. 11 also indicate ongoing riming in the flight segment under discussion. Moreover, a clear sagging of the ML in terms of ZDR and ρhv (not shown) in the RSVPs supports the riming hypothesis, since rimed ice particles fall with increased velocities and therefore melt at lower altitudes. Such a sagging signature in radar images can be associated with riming processes (Kumjian et al., 2016), and since riming, most likely present in this case, results in both higher φ and frim values than assumed in the derivation of the Dm(Zdp,KDP) retrieval, the observed underestimation is in line with the known shortcomings of the retrieval for such conditions. Additionally, for riming conditions present, the mass–dimension relation assumed for in situ measured IWC is also not valid anymore. In general, the precise effect of riming on mass–dimension relations is poorly understood (Tridon et al., 2019), but these processes considerably modify inherent parameters. With an increasing degree of riming, higher values of the prefactor a and the exponent b in Eq. (6) are expected. The latter can reach a maximum b close to 3 (sphere-like geometry) when graupel-like particles filled with rime are present. Thus, the observed overestimation of IWCCarlin could at least partly be explained by assumed inappropriate parameters in the mass–dimension relationship following Brown and Francis (1995). Using a relation that accounts for more knowledge of ice particle masses (e.g., Heymsfield et al., 2010) that is valid for higher degrees of riming (e.g., Leinonen and Szyrmer, 2015) or that uses multiple mass–dimension relations for different Dmm ranges, as proposed in Ding et al. (2020), may reduce deviations between in situ and retrieved IWC in this case. Only directly measured in situ IWC can provide IWC without the need for any assumptions. However, such measurements were not available during the OLYMPEX campaign (Tridon et al., 2019).
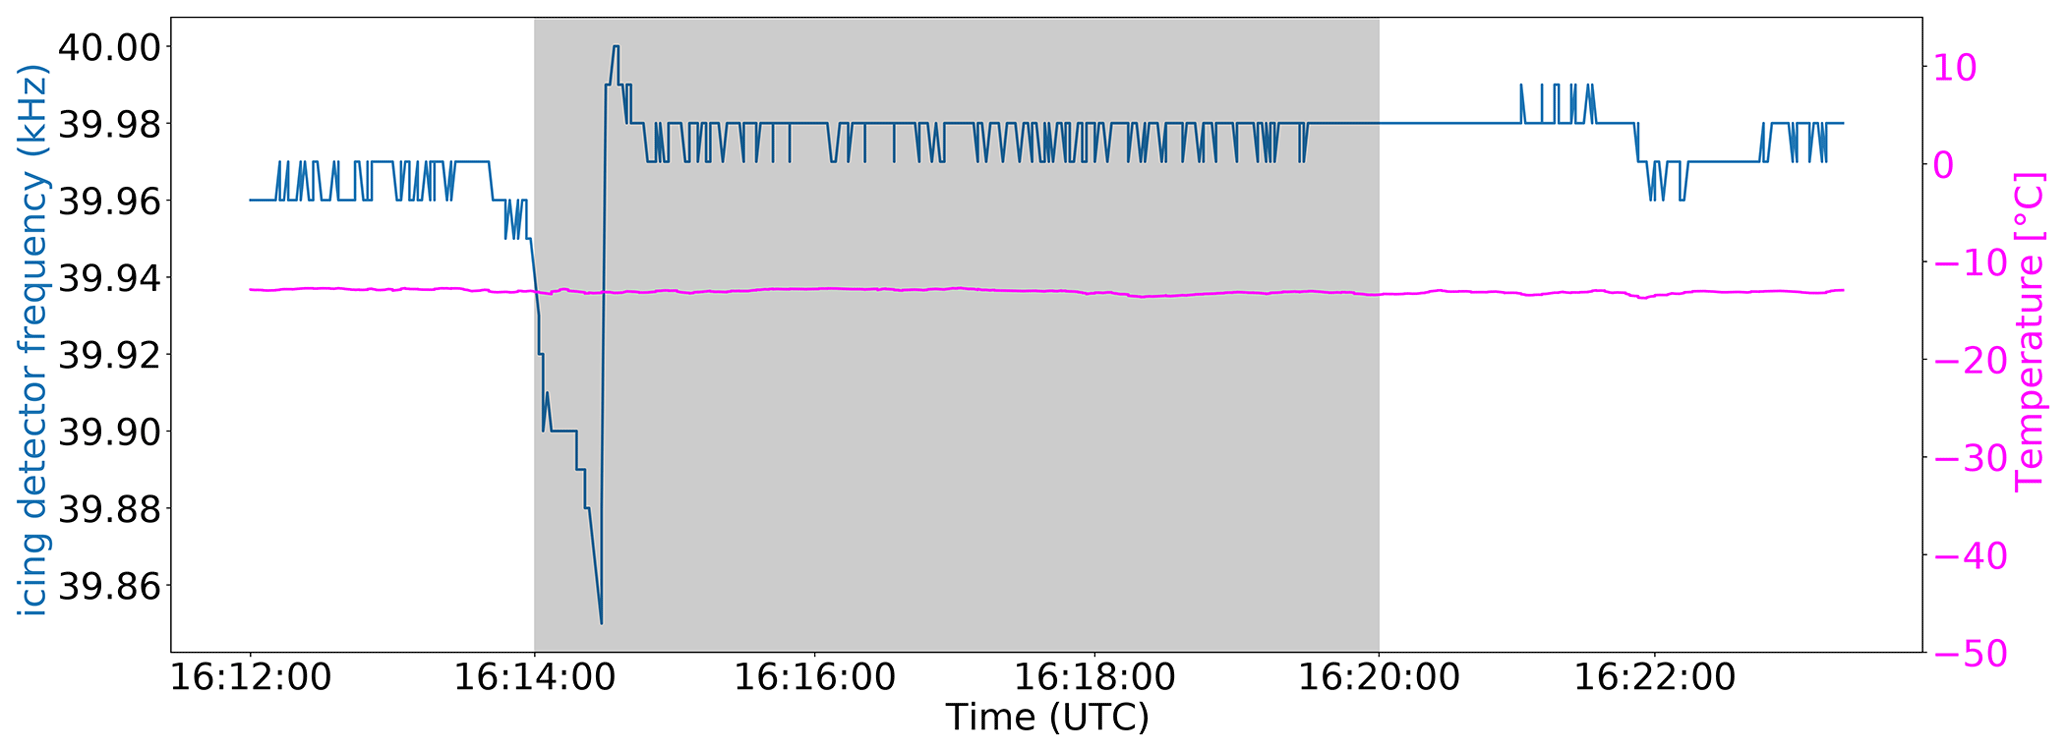
Figure 10RICE oscillation frequency (blue) and temperature at Citation II level (magenta). Icing periods are indicated by a sharp drop in RICE frequency due to ice accumulation at the sensor tip. The shaded area represents the associated flight interval on 13 December 2015.
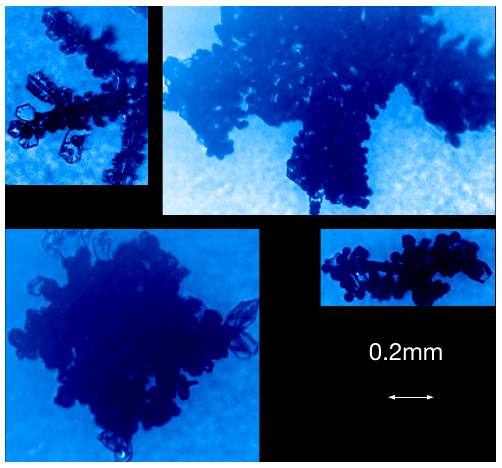
Figure 11Examples of CPI images where rimed crystals were observed. The images were taken on 13 December 2015 between 16:14 and 16:18 UTC.
Data collected during the OLYMPEX campaign (Houze et al., 2017) conducted in late 2015 provided a comprehensive database including ground-based polarimetric X-band radar measurements and airborne in situ cloud measurements to evaluate radar-based ice microphysical retrievals. In this study, the accuracy of conventional non-polarimetric retrievals is assessed, together with a series of state-of-the-art polarimetric retrievals to quantify the benefits of additional polarimetric information and identify the strengths and weaknesses of all of them. RHIs within an azimuthal sector of 22∘ provide vertically high-resolved polarimetric measurements, and the RSVP matching methodology introduced adds a moderate degree of averaging in order to reduce the noisiness of especially phase-based radar measurements like KDP. The matching of the achieved robust radar-based retrievals with the airborne cloud measurements enables the accuracy assessment of retrievals for ice water content (IWC), ice particle number concentration Nt, and mean volume diameter Dm, which are of great value for model evaluation and data assimilation. The key results of the study are as follows.
-
State-of-the-art microphysical retrievals exploiting polarimetric radar measurements to estimate IWC (RMSE =0.19 g m−3), Nt (RMSE =0.43 L−1), and Dm (RMSE =1.13 mm) achieve quite high agreement with airborne in situ measurements, especially at cold temperatures.
-
Overall, polarimetric retrievals are superior to conventional Z-based retrievals, but combinations with non-polarimetric retrievals have potential to improve deficiencies directly above the ML.
-
The hybrid polarimetric IWCCarlin retrieval outperforms all other IWC estimates in terms of RMSE and shows a high r of 0.96.
-
Compared to IWC retrievals, the Nt and Dm retrievals show larger uncertainties and should be further improved in the future.
This study clearly demonstrates the added value of multiparameter retrievals as proposed by Carlin et al. (2021) for the IWC. Combining the strengths of retrievals can be applied to other ice microphysical properties and ultimately also hints at the potential for developing combinations of polarimetric and non-polarimetric retrievals. Further independent evaluation studies particularly focusing on such hybrid retrievals are required.
Future work using an additional particle classifier (e.g., Praz et al., 2018; Przybylo et al., 2022) capable of identifying and classifying each particle along flight transects with high-resolution image data sampled by particle imagers will provide an even more in-depth evaluation. Specifically, extended classifiers that possibly allow riming degree estimation, as proposed in Przybylo et al. (2022), may provide an avenue for studying riming cases and relating these observations to retrieval assumptions. These classifiers hold the potential to be utilized for the refinement and development of future ice microphysical retrieval methods.
The exploitation of the OLYMPEX data represents another piece of the mosaic towards a comprehensive evaluation of (polarimetric) microphysical retrievals. While previous evaluation studies focused on C- and S-band radar data, this study also emphasizes the added value of X-band radars for the exploitation of microphysical retrievals and related process studies. However, in light of potential applications in model evaluation and data assimilation, C- and S-band radars are of great interest because of their national operational availability. Recently, even more field campaigns have been exploited or their analysis is currently underway. Examples are the Federal-Aviation-Administration-led In-Cloud ICing and Large-drop Experiment (ICICLE; Bernstein et al., 2021) and the NASA-led Investigation of Microphysics and Precipitation for Atlantic Coast-Threatening Snowstorms (IMPACTS; McMurdie et al., 2019). Two flight legs of a winter storm case from the latter campaign have already been used by Dunnavan et al. (2022) for a radar retrieval evaluation. With respect to previous experimental evaluation studies, the more convincing accuracy of the best-performing polarimetric retrievals identified in this study gives us further confidence in their application. The benefit of using a shorter wavelength than that of S-band radars, as suggested in Ryzhkov et al. (1998) for the verification of their proposed IWCI(Zdr,KDP), indeed exhibited a noticeably lower RMSE in our study (0.24 g m−3 vs. 0.4 g m−3). Using the same IWCI(Zdr,KDP) retrieval as Nguyen et al. (2019), we were further able to achieve half the RMSE and a systematically higher correlation with our method based on RHI sector scans, even though both studies used an X-band radar. More recent retrievals were able to achieve even smaller RMSEs. The almost consistent underestimation of Dm(Zdp,KDP) shown in Murphy et al. (2020) is in line with our results. However, in contrast to their study, we could not only attribute the deficits to warmer temperature regimes but also demonstrate the accurate estimation at cold temperatures. As a result, an important open question for future research concerns the deficient performance of retrievals directly above the ML and requires new approaches to obtain accurate estimators in this region.
OLYMPEX data used in this study were obtained from the NASA EOSDIS GHRC OLYMPEX data archive (https://doi.org/10.5067/GPMGV/OLYMPEX/DATA101, Petersen et al., 2018, and https://doi.org/10.5067/GPMGV/OLYMPEX/DOW/DATA201, Houze et al., 2018). The ERA5 data are stored at the Climate Data Store from the ECMWF and are accessible via https://doi.org/10.24381/cds.bd0915c6 (Hersbach et al., 2023).
AB and ST jointly developed the concept and methodology for this work. Data handling and analysis were performed by AB with contributions from MM. Visualization was carried out by AB, who also led the writing with input from ST. AJH processed the Citation II data collected during OLYMPEX and provided scientific expertise on in situ data. All authors contributed to the proofreading and added valuable suggestions to the final draft.
The contact author has declared that none of the authors has any competing interests.
Publisher’s note: Copernicus Publications remains neutral with regard to jurisdictional claims in published maps and institutional affiliations.
This article is part of the special issue “Fusion of radar polarimetry and numerical atmospheric modelling towards an improved understanding of cloud and precipitation processes (ACP/AMT/GMD inter-journal SI)”. It is not associated with a conference.
The research was carried out in the framework of the Priority Programme SPP-2115 “Polarimetric Radar Observations meet Atmospheric Modelling (PROM)” funded by the German Research Foundation (DFG). We also thank all the participants of OLYMPEX for collecting the data used in this study. Similarly, we acknowledge the support of Kai Mühlbauer and the open-source radar library wradlib (https://docs.wradlib.org/en/stable/index.html, last access: 11 November 2022) regarding the processing of radar data.
This research has been supported by the Deutsche Forschungsgemeinschaft (grant nos. TR 1023/13-1 and VO 1504/5-1) and the National Aeronautics and Space Administration (grant no. 80NSSC20K0897 to Andrew J. Heymsfield). This open-access publication was funded by the University of Bonn.
This paper was edited by Patric Seifert and reviewed by two anonymous referees.
Allabakash, S., Lim, S., Chandrasekar, V., Min, K., Choi, J., and Jang, B.: X-band dual-polarization radar observations of snow growth processes of a severe winter storm: Case of 12 December 2013 in South Korea, J. Atmos. Ocean. Tech., 36, 1217–1235, https://doi.org/10.1175/JTECH-D-18-0076.1, 2019. a
Aydin, K. and Tang, C.: Relationships between IWC and polarimetric radar measurands at 94 and 220 GHz for hexagonal columns and plates, J. Atmos. Ocean. Tech., 14, 1055–1063, https://doi.org/10.1175/1520-0426(1997)014<1055:RBIAPR>2.0.CO;2, 1997. a
Baker, B. and Lawson, R. P.: Improvement in determination of ice water content from two-dimensional particle imagery. Part I: Image-to-mass relationships, J. Appl. Meteorol. Clim., 45, 1282–1290, https://doi.org/10.1175/JAM2398.1, 2006. a
Bansemer, A.: System for OAP Data Analysis, v2.23.0, Zenodo [code], https://doi.org/10.5281/zenodo.7803116, 2023. a
Baumgardner, D. and Rodi, A.: Laboratory and wind tunnel evaluations of the Rosemount icing detector, J. Atmos. Ocean. Tech., 6, 971–979, https://doi.org/10.1175/1520-0426(1989)006<0971:LAWTEO>2.0.CO;2, 1989. a
Baumgardner, D., Abel, S. J., Axisa, D., Cotton, R., Crosier, J., Field, P., Gurganus, C., Heymsfield, A., Korolev, A., Krämer, M., Lawson, P., McFarquhar, G., Ulanowski, Z., and Um, J.: Cloud Ice Properties: In Situ Measurement Challenges, Meteor. Mon., 58, 9.1–9.23, https://doi.org/10.1175/AMSMONOGRAPHS-D-16-0011.1, 2017. a, b
Bernstein, B., DiVito, S., Riley, J. T., Landolt, S., Haggerty, J., Thompson, G., Adriaansen, D., Serke, D., Kessinger, C., Tessendorf, S., Wolde, M., Korolev, A., Brown, A., Nichman, L., Sims, D., Dumont, C.: The In-Cloud Icing and Large-Drop Experiment Science and Operations Plan, Tech. rep. no. DOT/FAA/TC-21/29, Department of Transportation, Federal Aviation Administration, United States, https://doi.org/10.21949/1524472, 2021. a
Brandes, E. A., Ikeda, K., Zhang, G., Schönhuber, M., and Rasmussen, R. M.: A statistical and physical description of hydrometeor distributions in Colorado snowstorms using a video disdrometer, J. Appl. Meteorol. Clim., 46, 634–650, https://doi.org/10.1175/JAM2489.1, 2007. a
Brown, P. R. A. and Francis, P. N.: Improved Measurements of the Ice Water Content in Cirrus Using a Total-Water Probe, J. Atmos. Ocean. Tech., 12, 410–414, https://doi.org/10.1175/1520-0426(1995)012<0410:imotiw>2.0.co;2, 1995. a, b
Bukovčić, P., Zrnić, D., and Zhang, G.: Winter precipitation liquid–ice phase transitions revealed with polarimetric radar and 2DVD observations in central Oklahoma, J. Appl. Meteorol. Clim., 56, 1345–1363, https://doi.org/10.1175/JAMC-D-16-0239.1, 2017. a, b
Bukovčić, P., Ryzhkov, A., Zrnić, D., and Zhang, G.: Polarimetric radar relations for quantification of snow based on disdrometer data, J. Appl. Meteorol. Clim., 57, 103–120, https://doi.org/10.1175/JAMC-D-17-0090.1, 2018. a, b, c, d, e, f
Bukovčić, P., Ryzhkov, A., and Zrnić, D.: Polarimetric relations for snow estimation—Radar verification, J. Appl. Meteorol. Clim., 59, 991–1009, https://doi.org/10.1175/JAMC-D-19-0140.1, 2020. a, b, c, d, e
Carlin, J. T., Ryzhkov, A. V., Snyder, J. C., and Khain, A.: Hydrometeor mixing ratio retrievals for storm-scale radar data assimilation: Utility of current relations and potential benefits of polarimetry, Mon. Weather Rev., 144, 2981–3001, https://doi.org/10.1175/MWR-D-15-0423.1, 2016. a
Carlin, J. T., Reeves, H. D., and Ryzhkov, A. V.: Polarimetric Observations and Simulations of Sublimating Snow: Implications for Nowcasting, J. Appl. Meteorol. Clim., 60, 1035–1054, https://doi.org/10.1175/JAMC-D-21-0038.1, 2021. a, b, c, d, e, f, g, h, i
Chase, R. J., Finlon, J. A., Borque, P., McFarquhar, G. M., Nesbitt, S. W., Tanelli, S., Sy, O. O., Durden, S. L., and Poellot, M. R.: Evaluation of Triple-Frequency Radar Retrieval of Snowfall Properties Using Coincident Airborne In Situ Observations During OLYMPEX, Geophys. Res. Lett., 45, 5752–5760, https://doi.org/10.1029/2018gl077997, 2018. a
Davis, C., Atkins, N., Bartels, D., Bosart, L., Coniglio, M., Bryan, G., Cotton, W., Dowell, D., Jewett, B., Johns, R., Jorgensen, D., Knievel, J., Knupp, K., Lee, W.-C., McFarquhar, G., Moore, J., Przybylinski, R., Rauber, R., Smull, B., Trapp, R., Trier, S., Wakimoto, R., Weisman, M., and Ziegler, C.: The Bow Echo and MCV experiment: observations and opportunities: observations and opportunities, B. Am. Meteorol. Soc., 85, 1075–1094, https://doi.org/10.1175/BAMS-85-8-1075, 2004. a
Ding, S., McFarquhar, G. M., Nesbitt, S. W., Chase, R. J., Poellot, M. R., and Wang, H.: Dependence of mass–dimensional relationships on median mass diameter, Atmosphere, 11, 756, https://doi.org/10.3390/atmos11070756, 2020. a
Dunnavan, E. L., Carlin, J. T., Hu, J., Bukovčić, P., Ryzhkov, A. V., McFarquhar, G. M., Finlon, J. A., Matrosov, S. Y., and Delene, D. J.: Radar Retrieval Evaluation and Investigation of Dendritic Growth Layer Polarimetric Signatures in a Winter Storm, J. Appl. Meteorol. Clim., 61, 1685–1711, https://doi.org/10.1175/JAMC-D-21-0220.1, 2022. a, b
Hersbach, H., Bell, B., Berrisford, P., Hirahara, S., Horányi, A., Muñoz-Sabater, J., Nicolas, J., Peubey, C., Radu, R., Schepers, D., Simmons, A., Soci, C., Abdalla, S., Abellan, X., Balsamo, G., Bechtold, P., Biavati, G., Bidlot, J., Bonavita, M., De Chiara, G., Dahlgren, P., Dee, D., Diamantakis, M., Dragani, R., Flemming, J., Forbes, R., Fuentes, M., Geer, A., Haimberger, L., Healy, S., Hogan, R. J., Hólm, E., Janisková, M., Keeley, S., Laloyaux, P., Lopez, P., Lupu, C., Radnoti, G., de Rosnay, P., Rozum, I., Vamborg, F., Villaume, S., Thépaut, J.-N.: The ERA5 global reanalysis, Q. J. Roy. Meteor. Soc., 146, 1999–2049, https://doi.org/10.1002/qj.3803, 2020. a
Hersbach, H., Bell, B., Berrisford, P., Biavati, G., Horányi, A., Muñoz Sabater, J., Nicolas, J., Peubey, C., Radu, R., Rozum, I., Schepers, D., Simmons, A., Soci, C., Dee, D., and Thépaut, J.-N.: ERA5 hourly data on pressure levels from 1940 to present, Copernicus Climate Change Service (C3S) Climate Data Store (CDS) [data set], https://doi.org/10.24381/cds.bd0915c6, 2023. a
Heymsfield, A., Bansemer, A., Heymsfield, G., Noone, D., Grecu, M., and Toohey, D.: Relationship of Multiwavelength Radar Measurements to Ice Microphysics from the IMPACTS Field Program, J. Appl. Meteorol. Clim., 62, 289–315, https://doi.org/10.1175/JAMC-D-22-0057.1, 2023. a
Heymsfield, A. J. and Miloshevich, L. M.: Evaluation of liquid water measuring instruments in cold clouds sampled during FIRE, J. Atmos. Ocean. Tech., 6, 378–388, https://doi.org/10.1175/1520-0426(1989)006<0378:EOLWMI>2.0.CO;2, 1989. a
Heymsfield, A. J., Protat, A., Bouniol, D., Austin, R. T., Hogan, R. J., Delanoë, J., Okamoto, H., Sato, K., van Zadelhoff, G.-J., Donovan, D. P., and Wang, Z.: Testing IWC retrieval methods using radar and ancillary measurements with in situ data, J. Appl. Meteorol. Clim., 47, 135–163, https://doi.org/10.1175/2007JAMC1606.1, 2008. a
Heymsfield, A. J., Schmitt, C., Bansemer, A., and Twohy, C. H.: Improved representation of ice particle masses based on observations in natural clouds, J. Atmos. Sci., 67, 3303–3318, https://doi.org/10.1175/2010JAS3507.1, 2010. a
Heymsfield, A. J., Bansemer, A., and Poellot, M. R.: GPM Ground Validation NCAR Particle Probes OLYMPEX, NASA EOSDIS Global Hydrology Resource Center Distributed Active Archive Center [data set], Huntsville, Alabama, U.S.A., https://doi.org/10.5067/GPMGV/OLYMPEX/PROBES/DATA201, 2018. a, b
Hogan, R. J., Mittermaier, M. P., and Illingworth, A. J.: The retrieval of ice water content from radar reflectivity factor and temperature and its use in evaluating a mesoscale model, J. Appl. Meteorol. Clim., 45, 301–317, https://doi.org/10.1175/JAM2340.1, 2006. a, b, c, d, e, f
Hogan, R. J., Tian, L., Brown, P. R. A., Westbrook, C. D., Heymsfield, A. J., and Eastment, J. D.: Radar Scattering from Ice Aggregates Using the Horizontally Aligned Oblate Spheroid Approximation, J. Appl. Meteorol. Clima., 51, 655–671, https://doi.org/10.1175/jamc-d-11-074.1, 2012. a
Holoborodko, P.: Smooth Noise Robust Differentiators, http://www.holoborodko.com/pavel/numerical-methods/numerical-derivative/smooth-low-noise-differentiators/ (last access: 5 April 2023), 2008. a
Houze, R. A., Wurman, J., Brodzik, S., and Framback, A.: GPM Ground Validation Doppler on Wheels (DOW) OLYMPEX V2, NASA EOSDIS Global Hydrology Resource Center Distributed Active Archive Center (DAAC) [data set], Huntsville, Alabama, U.S.A., https://doi.org/10.5067/GPMGV/OLYMPEX/DOW/DATA201, 2018. a, b, c, d
Houze Jr., R. A., McMurdie, L. A., Petersen, W. A., Schwaller, M. R., Baccus, W., Lundquist, J. D., Mass, C. F., Nijssen, B., Rutledge, S. A., Hudak, D. R., Tanelli, S., Mace, G. G., Poellot, M. R., Lettenmaier, D. P., Zagrodnik, J. P., Rowe, A. K., DeHart, J. C., Madaus, L. E., Barnes, H. C., and Chandrasekar, V.: The olympic mountains experiment (OLYMPEX), B. Am. Meteorol. Soc., 98, 2167–2188, https://doi.org/10.1175/BAMS-D-16-0182.1, 2017. a, b, c
Hu, J. and Ryzhkov, A.: Climatology of the vertical profiles of polarimetric radar variables and retrieved microphysical parameters in continental/tropical MCSs and landfalling hurricanes, J. Geophys. Res.-Atmos., 127, e2021JD035498, https://doi.org/10.1029/2021JD035498, 2022. a, b, c
Kedzuf, N. J., Chiu, J. C., Chandrasekar, V., Biswas, S., Joshil, S. S., Lu, Y., van Leeuwen, P. J., Westbrook, C., Blanchard, Y., and O'Shea, S.: Retrieving microphysical properties of concurrent pristine ice and snow using polarimetric radar observations, Atmos. Meas. Tech., 14, 6885–6904, https://doi.org/10.5194/amt-14-6885-2021, 2021. a
Kumjian, M. R., Mishra, S., Giangrande, S. E., Toto, T., Ryzhkov, A. V., and Bansemer, A.: Polarimetric radar and aircraft observations of saggy bright bands during MC3E, J. Geophys. Res.-Atmos., 121, 3584–3607, https://doi.org/10.1002/2015JD024446, 2016. a
Lawson, R. P., O'Connor, D., Zmarzly, P., Weaver, K., Baker, B., Mo, Q., and Jonsson, H.: The 2D-S (Stereo) Probe: Design and Preliminary Tests of a New Airborne, High-Speed, High-Resolution Particle Imaging Probe, J. Atmos. Ocean. Tech., 23, 1462–1477, https://doi.org/10.1175/JTECH1927.1, 2006. a
Leinonen, J. and Szyrmer, W.: Radar signatures of snowflake riming: A modeling study, Earth and Space Science, 2, 346–358, https://doi.org/10.1002/2015EA000102, 2015. a
Maahn, M., Löhnert, U., Kollias, P., Jackson, R. C., and McFarquhar, G. M.: Developing and evaluating ice cloud parameterizations for forward modeling of radar moments using in situ aircraft observations, J. Atmos. Ocean. Tech., 32, 880–903, https://doi.org/10.1175/JTECH-D-14-00112.1, 2015. a
Matrosov, S., Ryzhkov, A., Hardin, J., Shupe, M., Maahn, M., de Boer, G., and Uttal, T.: Intercomparisons of CloudSat and ground-based radar measurements during satellite overpasses, in: 39th Int. Conf. on Radar Meteorology, 16–20 September 2019, Nara, Japan, Amer. Meteor. Soc., 11A-02, https://cscenter.co.jp/icrm2019/program/data/abstracts/Session11A-02_2.pdf (last access: 5 April 2023), 2019. a, b, c
Matrosov, S. Y., Ryzhkov, A. V., Maahn, M., and De Boer, G.: Hydrometeor shape variability in snowfall as retrieved from polarimetric radar measurements, J. Appl. Meteorol. Clim., 59, 1503–1517, https://doi.org/10.1175/JAMC-D-20-0052.1, 2020. a
McMurdie, L., Heymsfield, G., Yorks, J., and Braun, S.: Investigation of Microphysics and Precipitation for Atlantic Coast-Threatening Snowstorms (IMPACTS) Collection, NASA EOSDIS Global Hydrology Resource Center Distributed Active Archive Center [data set], Huntsville, Alabama, U.S.A., https://doi.org/10.5067/IMPACTS/DATA101, 2019. a
Moser, M., Voigt, C., Jurkat-Witschas, T., Hahn, V., Mioche, G., Jourdan, O., Dupuy, R., Gourbeyre, C., Schwarzenboeck, A., Lucke, J., Boose, Y., Mech, M., Borrmann, S., Ehrlich, A., Herber, A., Lüpkes, C., and Wendisch, M.: Microphysical and thermodynamic phase analyses of Arctic low-level clouds measured above the sea ice and the open ocean in spring and summer, Atmos. Chem. Phys. Discuss. [preprint], https://doi.org/10.5194/acp-2023-44, in review, 2023. a
Murphy, A. M., Ryzhkov, A., and Zhang, P.: Columnar vertical profile (CVP) methodology for validating polarimetric radar retrievals in ice using in situ aircraft measurements, J. Atmos. Ocean. Tech., 37, 1623–1642, https://doi.org/10.1175/JTECH-D-20-0011.1, 2020. a, b, c, d, e, f, g, h, i
Nguyen, C. M., Wolde, M., and Korolev, A.: Determination of ice water content (IWC) in tropical convective clouds from X-band dual-polarization airborne radar, Atmos. Meas. Tech., 12, 5897–5911, https://doi.org/10.5194/amt-12-5897-2019, 2019. a, b, c, d, e, f, g, h, i
Petersen, W., Houze, R., and McMurdie, L.: GPM Ground Validation OLYMPEX Field Campaign Data Collection, NASA EOSDIS Global Hydrology Resource Center Distributed Active Archive Center (DAAC) [data set], Huntsville, Alabama, U.S.A., https://doi.org/10.5067/GPMGV/OLYMPEX/DATA101, 2018. a, b
Poellot, M. R., Heymsfield, A. J., and Bansemer, A.: GPM Ground Validation UND Citation Cloud Microphysics OLYMPEX, NASA EOSDIS Global Hydrology Resource Center Distributed Active Archive Center (DAAC) [data set], Huntsville, Alabama, U.S.A., https://doi.org/10.5067/GPMGV/OLYMPEX/MULTIPLE/DATA201, 2017. a
Praz, C., Ding, S., McFarquhar, G. M., and Berne, A.: A versatile method for ice particle habit classification using airborne imaging probe data, J. Geophys. Res.-Atmos., 123, 13–472, https://doi.org/10.1029/2018JD029163, 2018. a
Przybylo, V. M., Sulia, K. J., Schmitt, C. G., and Lebo, Z. J.: Classification of cloud particle imagery from aircraft platforms using convolutional neural networks, J. Atmos. Ocean. Tech., 39, 405–424, https://doi.org/10.1175/JTECH-D-21-0094.1, 2022. a, b
Reimann, L., Simmer, C., and Trömel, S.: Dual-polarimetric radar estimators of liquid water content over Germany, Meteorol. Z., 30, 237–249, https://doi.org/10.1127/metz/2021/1072, 2021. a
Ryzhkov, A., Zhang, P., Reeves, H., Kumjian, M., Tschallener, T., Trömel, S., and Simmer, C.: Quasi-vertical profiles—A new way to look at polarimetric radar data, J. Atmos. Ocean. Tech., 33, 551–562, https://doi.org/10.1175/JTECH-D-15-0020.1, 2016. a, b
Ryzhkov, A., Bukovcic, P., Murphy, A., Zhang, P., and McFarquhar, G.: Ice microphysical retrievals using polarimetric radar data, in: 10th European Conference on Radar in Meteorology and Hydrology, 1–6 July 2018, the Netherlands, 494–504, https://doi.org/10.18174/454537, 2018. a, b, c, d, e, f, g, h, i
Ryzhkov, A. V. and Zrnić, D. S.: Radar Polarimetry for Weather Observations, vol. 486, Springer, ISBN 978-3-030-05092-4, https://doi.org/10.1007/978-3-030-05093-1, 2019. a, b, c, d, e, f, g, h
Ryzhkov, A. V., Zrnic, D. S., and Gordon, B.: Polarimetric method for ice water content determination, J. Appl. Meteorol., 37, 125–134, https://doi.org/10.1175/1520-0450(1998)037<0125:PMFIWC>2.0.CO;2, 1998. a, b, c, d, e
Ryzhkov, A. V., Snyder, J., Carlin, J. T., Khain, A., and Pinsky, M.: What polarimetric weather radars offer to cloud modelers: forward radar operators and microphysical/thermodynamic retrievals, Atmosphere, 11, 362, https://doi.org/10.3390/atmos11040362, 2020. a, b
Skofronick-Jackson, G., Hudak, D., Petersen, W., Nesbitt, S. W., Chandrasekar, V., Durden, S., Gleicher, K. J., Huang, G.-J., Joe, P., Kollias, P., Reed, K. A., Schwaller, M. R., Stewart, R., Tanelli, S., Tokay, A., Wang, J. R., and Wolde, M.: Global Precipitation Measurement Cold Season Precipitation Experiment (GCPEX): for measurement's sake, let it snow, B. Am. Meteorol. Soc., 96, 1719–1741, https://doi.org/10.1175/BAMS-D-13-00262.1, 2015. a
Skofronick-Jackson, G., Kulie, M., Milani, L., Munchak, S. J., Wood, N. B., and Levizzani, V.: Satellite estimation of falling snow: A global precipitation measurement (GPM) core observatory perspective, J. Appl. Meteorol. Clim., 58, 1429–1448, https://doi.org/10.1175/JAMC-D-18-0124.1, 2019. a, b, c
Tian, J., Dong, X., Xi, B., Wang, J., Homeyer, C. R., McFarquhar, G. M., and Fan, J.: Retrievals of ice cloud microphysical properties of deep convective systems using radar measurements, J. Geophys. Res.-Atmos., 121, 10820–10839, https://doi.org/10.1002/2015JD024686, 2016. a
Tobin, D. M. and Kumjian, M. R.: Polarimetric radar and surface-based precipitation-type observations of ice pellet to freezing rain transitions, Weather Forecast., 32, 2065–2082, https://doi.org/10.1175/WAF-D-17-0054.1, 2017. a
Tridon, F., Battaglia, A., Chase, R. J., Turk, F. J., Leinonen, J., Kneifel, S., Mroz, K., Finlon, J., Bansemer, A., Tanelli, S., Heymsfield, A. J., and Nesbitt, S. W.: The microphysics of stratiform precipitation during OLYMPEX: Compatibility between triple-frequency radar and airborne in situ observations, J. Geophys. Res.-Atmos., 124, 8764–8792, https://doi.org/10.1029/2018JD029858, 2019. a, b, c
Trömel, S., Simmer, C., Blahak, U., Blanke, A., Doktorowski, S., Ewald, F., Frech, M., Gergely, M., Hagen, M., Janjic, T., Kalesse-Los, H., Kneifel, S., Knote, C., Mendrok, J., Moser, M., Köcher, G., Mühlbauer, K., Myagkov, A., Pejcic, V., Seifert, P., Shrestha, P., Teisseire, A., von Terzi, L., Tetoni, E., Vogl, T., Voigt, C., Zeng, Y., Zinner, T., and Quaas, J.: Overview: Fusion of radar polarimetry and numerical atmospheric modelling towards an improved understanding of cloud and precipitation processes, Atmos. Chem. Phys., 21, 17291–17314, https://doi.org/10.5194/acp-21-17291-2021, 2021. a
Ulbrich, C. W.: Natural variations in the analytical form of the raindrop size distribution, J. Appl. Meteorol. Clim., 22, 1764–1775, 1983. a
Vogel, J. M. and Fabry, F.: Contrasting polarimetric observations of stratiform riming and nonriming events, J. Appl. Meteorol. Clim., 57, 457–476, https://doi.org/10.1175/JAMC-D-16-0370.1, 2018. a
Vulpiani, G., Montopoli, M., Passeri, L. D., Gioia, A. G., Giordano, P., and Marzano, F. S.: On the use of dual-polarized C-band radar for operational rainfall retrieval in mountainous areas, J. Appl. Meteorol. Clim., 51, 405–425, https://doi.org/10.1175/JAMC-D-10-05024.1, 2012. a
Wurman, J., Straka, J., Rasmussen, E., Randall, M., and Zahrai, A.: Design and deployment of a portable, pencil-beam, pulsed, 3-cm Doppler radar, J. Atmos. Ocean. Tech., 14, 1502–1512, https://doi.org/10.1175/1520-0426(1997)014<1502:DADOAP>2.0.CO;2, 1997. a
Zängl, G., Reinert, D., Rípodas, P., and Baldauf, M.: The ICON (ICOsahedral Non-hydrostatic) modelling framework of DWD and MPI-M: Description of the non-hydrostatic dynamical core, Q. J. Roy. Meteor. Soc., 141, 563–579, https://doi.org/10.1002/qj.2378, 2015. a
- Abstract
- Introduction
- The OLYMPEX campaign database
- Radar-based microphysical retrievals
- Methodology
- Accuracy assessment of the ice microphysical retrievals
- Discrepancy analyses
- Conclusions
- Data availability
- Author contributions
- Competing interests
- Disclaimer
- Special issue statement
- Acknowledgements
- Financial support
- Review statement
- References