the Creative Commons Attribution 4.0 License.
the Creative Commons Attribution 4.0 License.
 | 24 May 2023
Performance evaluation of the Alphasense OPC-N3 and Plantower PMS5003 sensor in measuring dust events in the Salt Lake Valley, Utah
Kamaljeet Kaur
As the changing climate expands the extent of arid and semi-arid lands, the number of, severity of, and health effects associated with dust events are likely to increase. However, regulatory measurements capable of capturing dust (PM10, particulate matter smaller than 10 µm in diameter) are sparse, sparser than measurements of PM2.5 (PM smaller than 2.5 µm in diameter). Although low-cost sensors could supplement regulatory monitors, as numerous studies have shown for PM2.5 concentrations, most of these sensors are not effective at measuring PM10 despite claims by sensor manufacturers. This study focuses on the Salt Lake Valley, adjacent to the Great Salt Lake, which recently reached historic lows exposing 1865 km2 of dry lake bed. It evaluated the field performance of the Plantower PMS5003, a common low-cost PM sensor, and the Alphasense OPC-N3, a promising candidate for low-cost measurement of PM10, against a federal equivalent method (FEM, beta attenuation) and research measurements (GRIMM aerosol spectrometer model 1.109) at three different locations. During a month-long field study that included five dust events in the Salt Lake Valley with PM10 concentrations reaching 311 µg m−3, the OPC-N3 exhibited strong correlation with FEM PM10 measurements (R2 = 0.865, RMSE = 12.4 µg m−3) and GRIMM (R2 = 0.937, RMSE = 17.7 µg m−3). The PMS exhibited poor to moderate correlations (R2 < 0.49, RMSE = 33–45 µg m−3) with reference or research monitors and severely underestimated the PM10 concentrations (slope < 0.099) for PM10. We also evaluated a PM-ratio-based correction method to improve the estimated PM10 concentration from PMSs. After applying this method, PMS PM10 concentrations correlated reasonably well with FEM measurements (R2 > 0.63) and GRIMM measurements (R2 > 0.76), and the RMSE decreased to 15–25 µg m−3. Our results suggest that it may be possible to obtain better resolved spatial estimates of PM10 concentration using a combination of PMSs (often publicly available in communities) and measurements of PM2.5 and PM10, such as those provided by FEMs, research-grade instrumentation, or the OPC-N3.
- Article
(8853 KB) - Full-text XML
-
Supplement
(4275 KB) - BibTeX
- EndNote


Our changing climate is expanding the extent of arid and semi-arid lands globally; these lands currently cover approximately one-third of the Earth's land surface (Williams et al., 2022; Huang et al., 2016). Recent studies suggest that this expansion of arid lands is linked to increases in the number and severity of dust events (Clifford et al., 2019; Tong et al., 2017; Ardon-Dryer and Kelley, 2022). Dust events can transport particulate matter (PM), particle-bound air toxics, and allergens over thousands of kilometers (Goudie, 2014). The suspended PM affects regional climate by impacting cloud formation, precipitation processes, and convection activity (Cai et al., 2021; Kumar et al., 2021; Mallet et al., 2009). Dust events significantly affect the regional air quality (Chakravarty et al., 2021; Akinwumiju et al., 2021; Liu et al., 2020), decrease atmospheric visibility (Jayaratne et al., 2011), and have adverse effects on human health, including being linked to increased incidence of asthma, pneumonia, bronchitis, stroke, adverse birth outcomes, influenza, meningitis, and valley fever (Dastoorpoor et al., 2018; Jones, 2020; Bogan et al., 2021; Soy, 2016; Trianti et al., 2017; Diokhane et al., 2016; Schweitzer et al., 2018).
During dust events, the majority of PM is greater than 2.5 µm in diameter (Tam et al., 2012). Government organizations, such as the World Health Organization (WHO), measure and/or provide guidelines for ambient PM10 concentrations (PM10, particles with aerodynamic diameter < 10 µm). PM smaller than 10 µm in diameter is of particular interest because it is inhalable. The WHO has set guidelines for 24 h and annual average PM10 concentrations at 45 and 15 µg m−3, respectively (WHO, 2022). The US EPA's national ambient air quality standards for PM10 concentrations are 150 and 50 µg m−3 for the 24 h and annual average, respectively. One challenge with 24 h standards and guidelines is that dust events often last a few hours, and these events are obscured when reporting only the PM10 24 h average or comparing these averages to the 24 h guidelines (Ardon-Dryer and Kelley, 2022).
PM10 concentrations tend to be more spatially heterogenous than PM2.5 concentrations because PM10 settles more quickly (Keet et al., 2018). In addition, regulatory measurements of PM10 are spatially and temporally sparser than PM2.5 measurements. For example, the US EPA reports measurements from 1370 active PM2.5 sites versus 800 active PM10 sites (EPA, 2022). Approximately half of these PM10 sites only report 24 h averages (US EPA, 2022). Furthermore, many dust-prone areas of the US lack any PM monitoring (US EPA, 2022). More highly resolved measurements of PM10 concentration would aid communities and researchers in understanding and addressing the effects of windblown dust and dust events.
More recent studies of PM have leveraged low-cost PM measurements and mobile measurements to obtain higher-spatial- and temporal-resolution PM2.5 estimates (Bi et al., 2020; Caplin et al., 2019; Lim et al., 2019; Caubel et al., 2019; Kelly et al., 2021). With appropriate calibration, low-cost sensors have been demonstrated to be generally effective at measuring PM2.5; however, the most common low-cost PM sensors that employ a laser and a photodiode to estimate particle concentration (Plantower PMS, Nova SDSS011, Sensirion SPS30, Shineyi PPD42NS, and Samyoung DSM501A) are ineffective at measuring PM10 and dust (Kosmopoulos et al., 2020; Mei et al., 2020; Sayahi et al., 2019; Kuula et al., 2020), primarily due to truncation of the forward-scattering coefficient for larger particles and potentially due to the sensors' inability to aspirate the larger particles into the device (Ouimette et al., 2022). Kuula et al. (2020) tested several low-cost PM sensors using monodisperse dioctyl sebacate particles (0.5–10 µm) and observed a constant particle size distribution for particle sizes > 0.5 µm and indicated that these sensors are incapable of measuring coarse-mode particles (2.5–10 µm).
The Alphasense optical particle counter (OPC)-N series is a promising low-cost sensor for measuring PM10. It is larger and more expensive (∼ USD 500) than many of the low-cost PM sensors (< USD 50) with a greater flow rate (total flow of 5.5 L min−1 and sample flow rate of 0.28 L min−1) and a mirror that allows collection of light scattering from a broader array of angles than typical low-cost PM sensors, which have flow rates on the order of 0.1 L min−1 (Sayahi et al., 2019; Ouimette et al., 2022; Alphasense Ltd, 2022). The OPC-N3 allows particle counting in 24 size bins for sizes ranging from 0.35–40 µm. The working principle of Alphasense OPC-N3 and its previous version (OPC-N2) is similar to an aerosol spectrometer; it measures scattering from single particles (Vogt et al., 2021). Studies have used the Alphasense OPCs for indoor and ambient PM monitoring (Kaliszewski et al., 2020; Chu et al., 2021; Dubey et al., 2022b; Feenstra et al., 2019; Pope et al., 2018; Nor et al., 2021; Alhasa et al., 2018; Mohd Nadzir et al., 2020), to monitor PM2.5 personal exposure (Harr et al., 2022a), to identify PM sources (Harr et al., 2022b; Bousiotis et al., 2021), and to monitor occupational PM2.5 and PM10 exposure (Runström Eden et al., 2022; Bächler et al., 2020). The Alphasense OPCs correlate well (R2 = 0.93–0.99) with PM10 in laboratory studies (Sousan et al., 2021, 2016; Samad et al., 2021; Dubey et al., 2022a). The field-based studies have reported somewhat lower correlations (R2: 0.53–0.8) (Bílek et al., 2021; Dubey et al., 2022b, a; Crilley et al., 2018) due to the variable ambient meteorological conditions and changing PM compositions. The ambient PM ratios (PM2.5 PM10) in these previous studies were greater than 0.6, indicating that the main contributions to PM levels were from fine PM rather than coarser PM. The ratio of PM2.5 PM10 can provide crucial information about particle origin and formation processes (Xu et al., 2017; Speranza et al., 2014). Duvall et al. (2021a) have suggested evaluating the performance of PM10 sensors for varying PM2.5 PM10 ratios, and dust events provide a great opportunity to evaluate PM10 sensor performance at ambient PM ratios < 0.3.
Few studies have evaluated the performance of Alphasense OPCs for measuring PM10 concentration during dust events. Gomes et al. (2022) measured hourly PM10 concentration exceeding 300 µg m−3 using the OPC-N3 during Saharan dust events in western Portugal. In Sarajevo, Bosnia–Herzegovina, Masic et al. (2020) reported that for the Aralkum Desert dust event, the OPC-N2 tracked GRIMM-11D PM10 measurements but at a lower magnitude. Fewer studies have compared the Alphasense OPCs with the regulatory monitors during dust events. Vogt et al. (2021) reported that the OPC-N3 captures the long-range-transported dust well but slightly overestimates PM10 concentration (< 120 µg m−3) compared to a FIDAS (EN 16450 approved regulatory instrument). They also reported a moderate correlation with PM10 compared to FIDAS (R2 = 0.58–064 and RMSE 12–13 µg m−3) and compared to a gravimetric method (R2 = 0.71–0.74 and RMSE 9–11 µg m−3). Mukherjee et al. (2017) evaluated the OPC-N2 performance against a Met One beta attenuation monitor (BAM) over 12 weeks in the Cuyama Valley of California, where PM concentrations are impacted by windblown dust events and regional transport; they reported a moderate to good degree of correlation (R2 = 0.53–0.81, depending on sampling orientation) for PM10 (< 750 µg m−3). In general, the studies report that the OPC-N2/N3 tracks the temporal variation of research and reference measurements but with varying correlation factors.
A high PM2.5 PM10 ratio represents fine-dominated aerosols, likely corresponding to anthropogenic or other combustion sources. Low ratios represent coarser particles (aerodynamic size between 2.5–10 µm) that tend to correspond to windblown dust (Sugimoto et al., 2016). Sugimoto et al. (2016) classified aerosols as local dust when the PM2.5 PM10 ratio was less than 0.1 and as transported dust when PM2.5 PM10 ratios were between 0.1 and 0.3. During dust events, low-cost sensors like the Plantower PMSs can detect only a small portion of a particle size distribution, and its response greatly depends on the particle size distribution and particle optical properties (Vogt et al., 2021). This study explores the possibility of using a size-segregated correction factor (PM2.5 PM10 ratio) to infer PM10 concentration from low-cost sensors that typically respond poorly to particles larger than 2.5 µm in diameter. If successful, this technique could leverage the large number of existing low-cost sensor measurements that use the Plantower PMS (and similar sensors) and improve spatial estimates of PM10 concentration.
This study aims to evaluate the Alphasense OPC-N3 to complement common low-cost PM measurements to understand PM10 concentrations during dust events in the Salt Lake Valley. The Salt Lake Valley is particularly well suited to studying dust events because it is affected by both regional dust events from the playas located to the west of the valley and from the drying Great Salt Lake bed, which has reached historic lows with more than 1865 km2 of exposed lake bed (Perry et al., 2019). Under appropriate meteorological conditions, portions of this exposed lake bed produce substantial dust plumes, and the winds can transport this dust directly into the populated areas of the Salt Lake Valley (Perry et al., 2019).
This study focused on April 2022 in the Salt Lake Valley, when it experienced five dust events (summarized in Table 1). It relies on low-cost sensors as well as reference and research measurements at three different locations (Fig. 1): the Utah Division of Air Quality (UDAQ) Hawthorne monitoring station (HW), the UDAQ's Environmental Quality (EQ) station and surroundings, and a residential site (RS) in the northeastern quadrant of the Salt Lake Valley. This period included an hourly average FEM (federal equivalent method) PM10 concentration that reached 311 µg m−3.
Table 1PM measurements at the three different study locations.
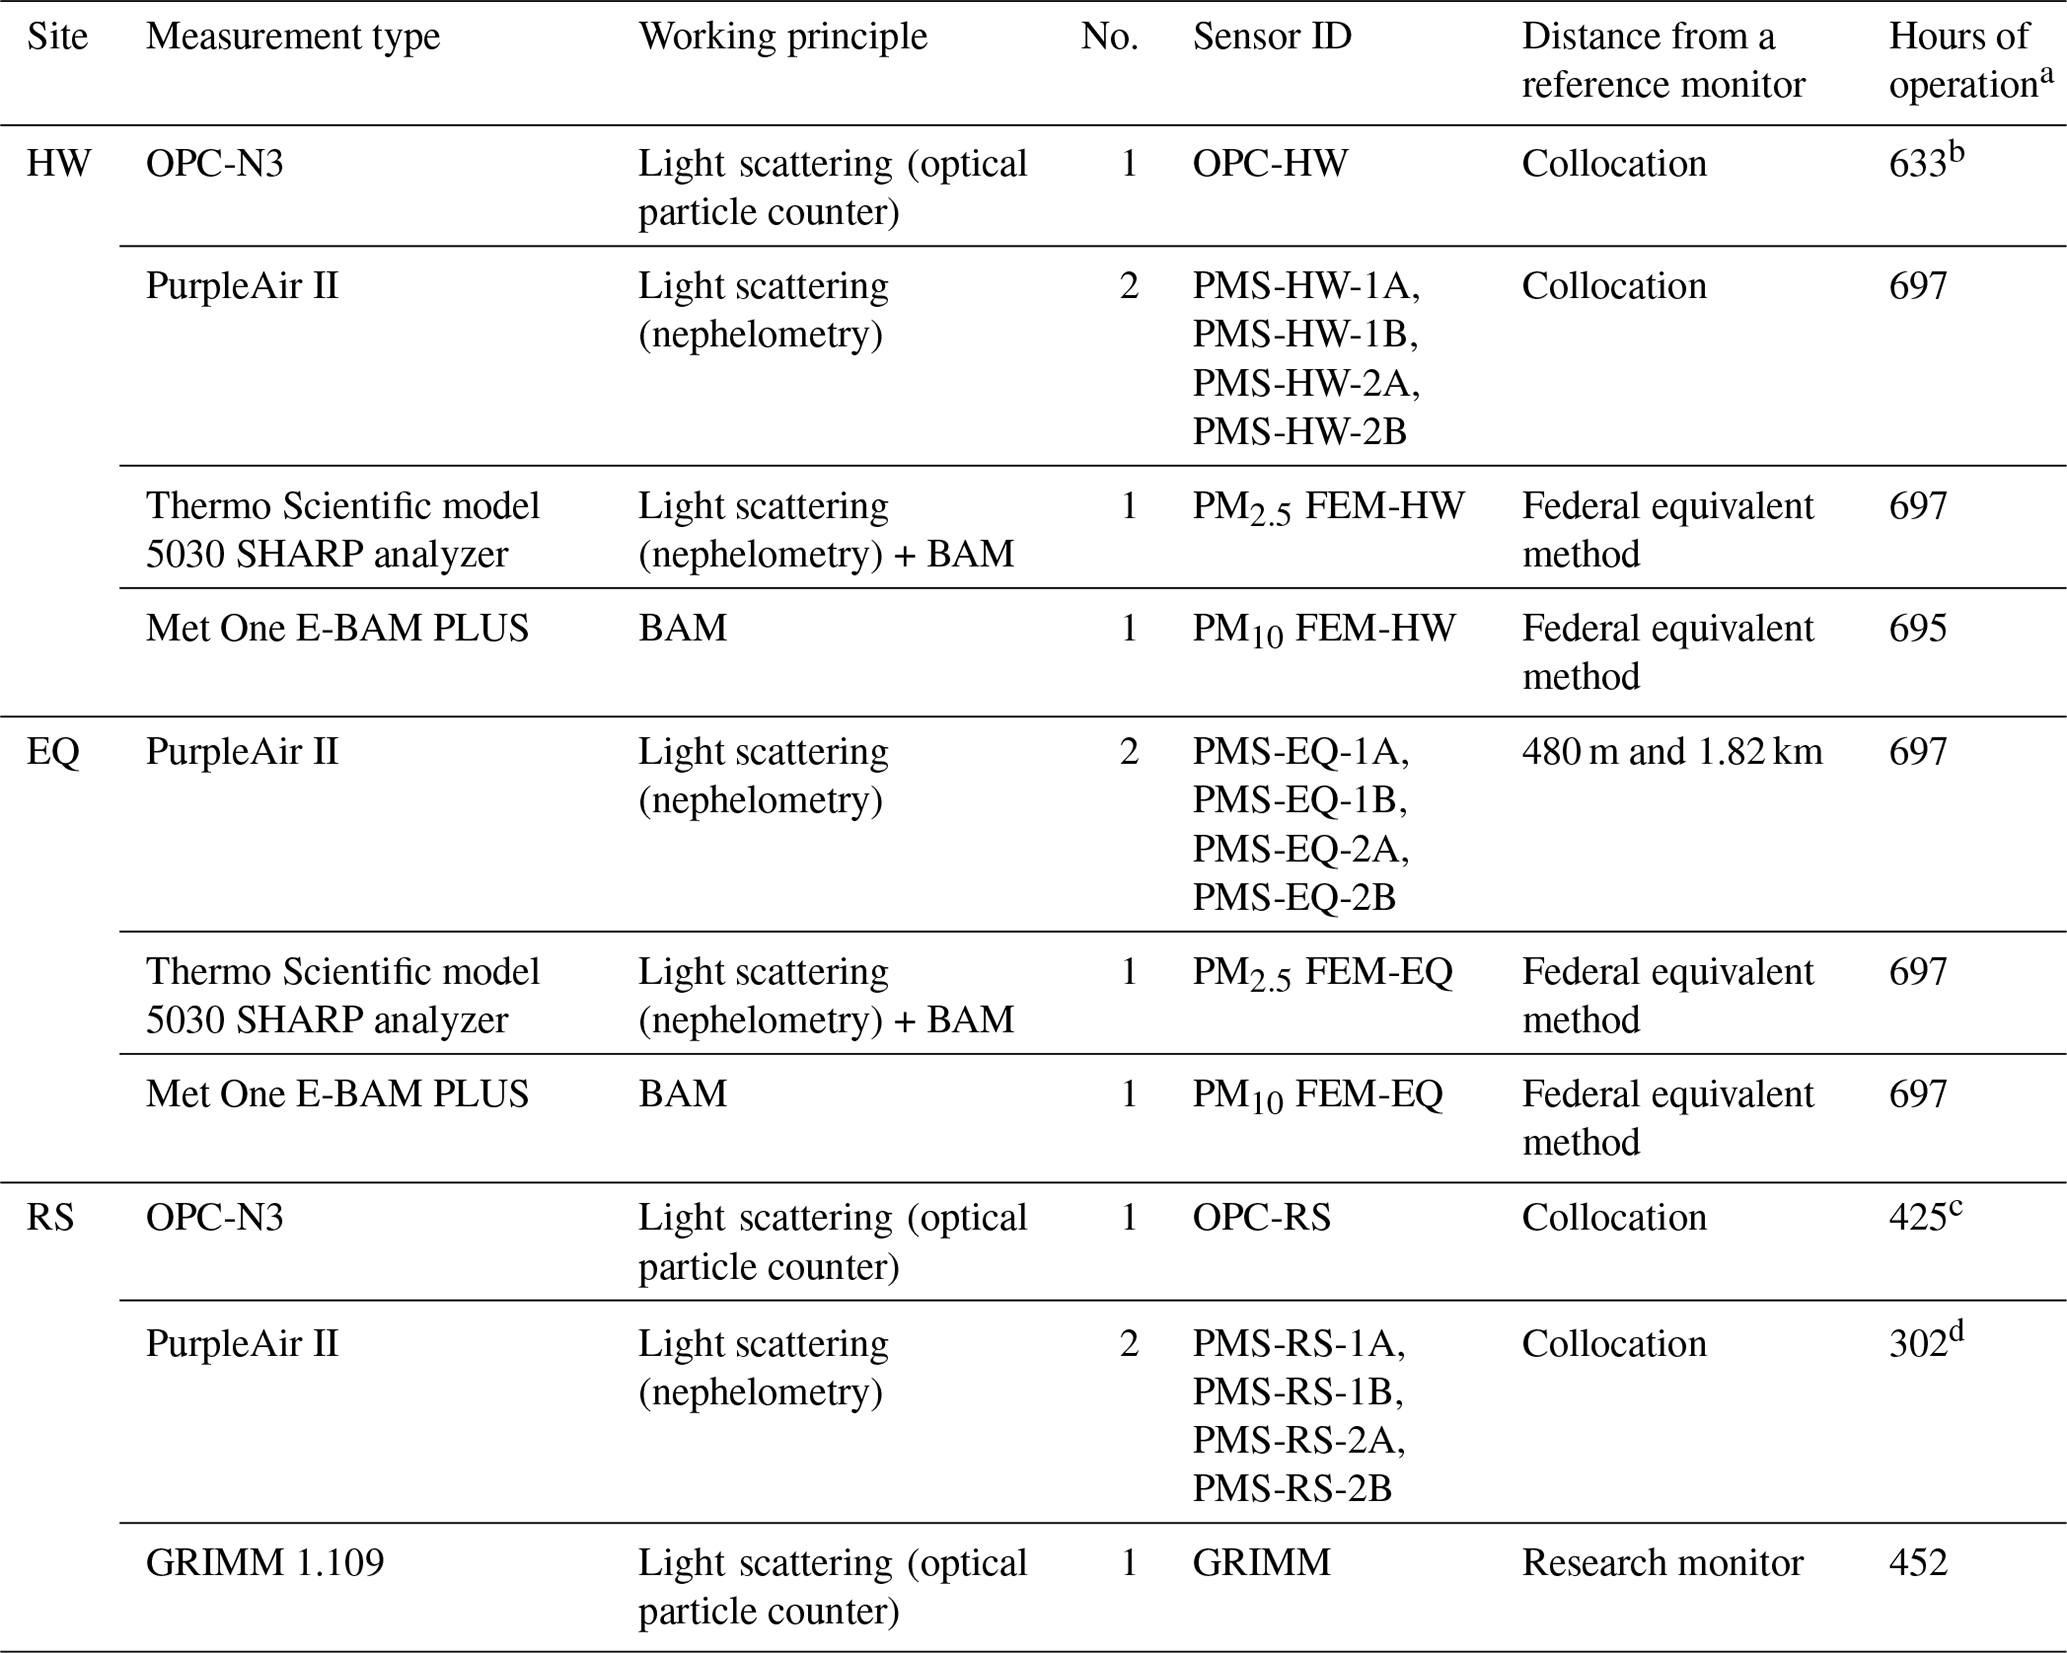
a The total number of available hours is 711. Measurements between 11 April 2022 at 20:00 and 12 April 2022 at 05:00 MDT were not available for HW and were subsequently removed for all sensors. Measurements corresponding to relative humidity > 85 %, i.e., 14 h, were excluded. b OPC-HW measurements were not available between 12 April 2022 at 18:00 and 14 April 2022 at 19:00 MDT due to connectivity issues. c The measurements for OPC-RS were available starting on 9 April 2022. OPC-RS measurements between 14 April 2022 at 10:00 and 17 April 2022 at 20:00 MDT were not available due to connectivity issues. d The measurements from all the PurpleAir II sensors at RS were available starting on 18 April 2022.
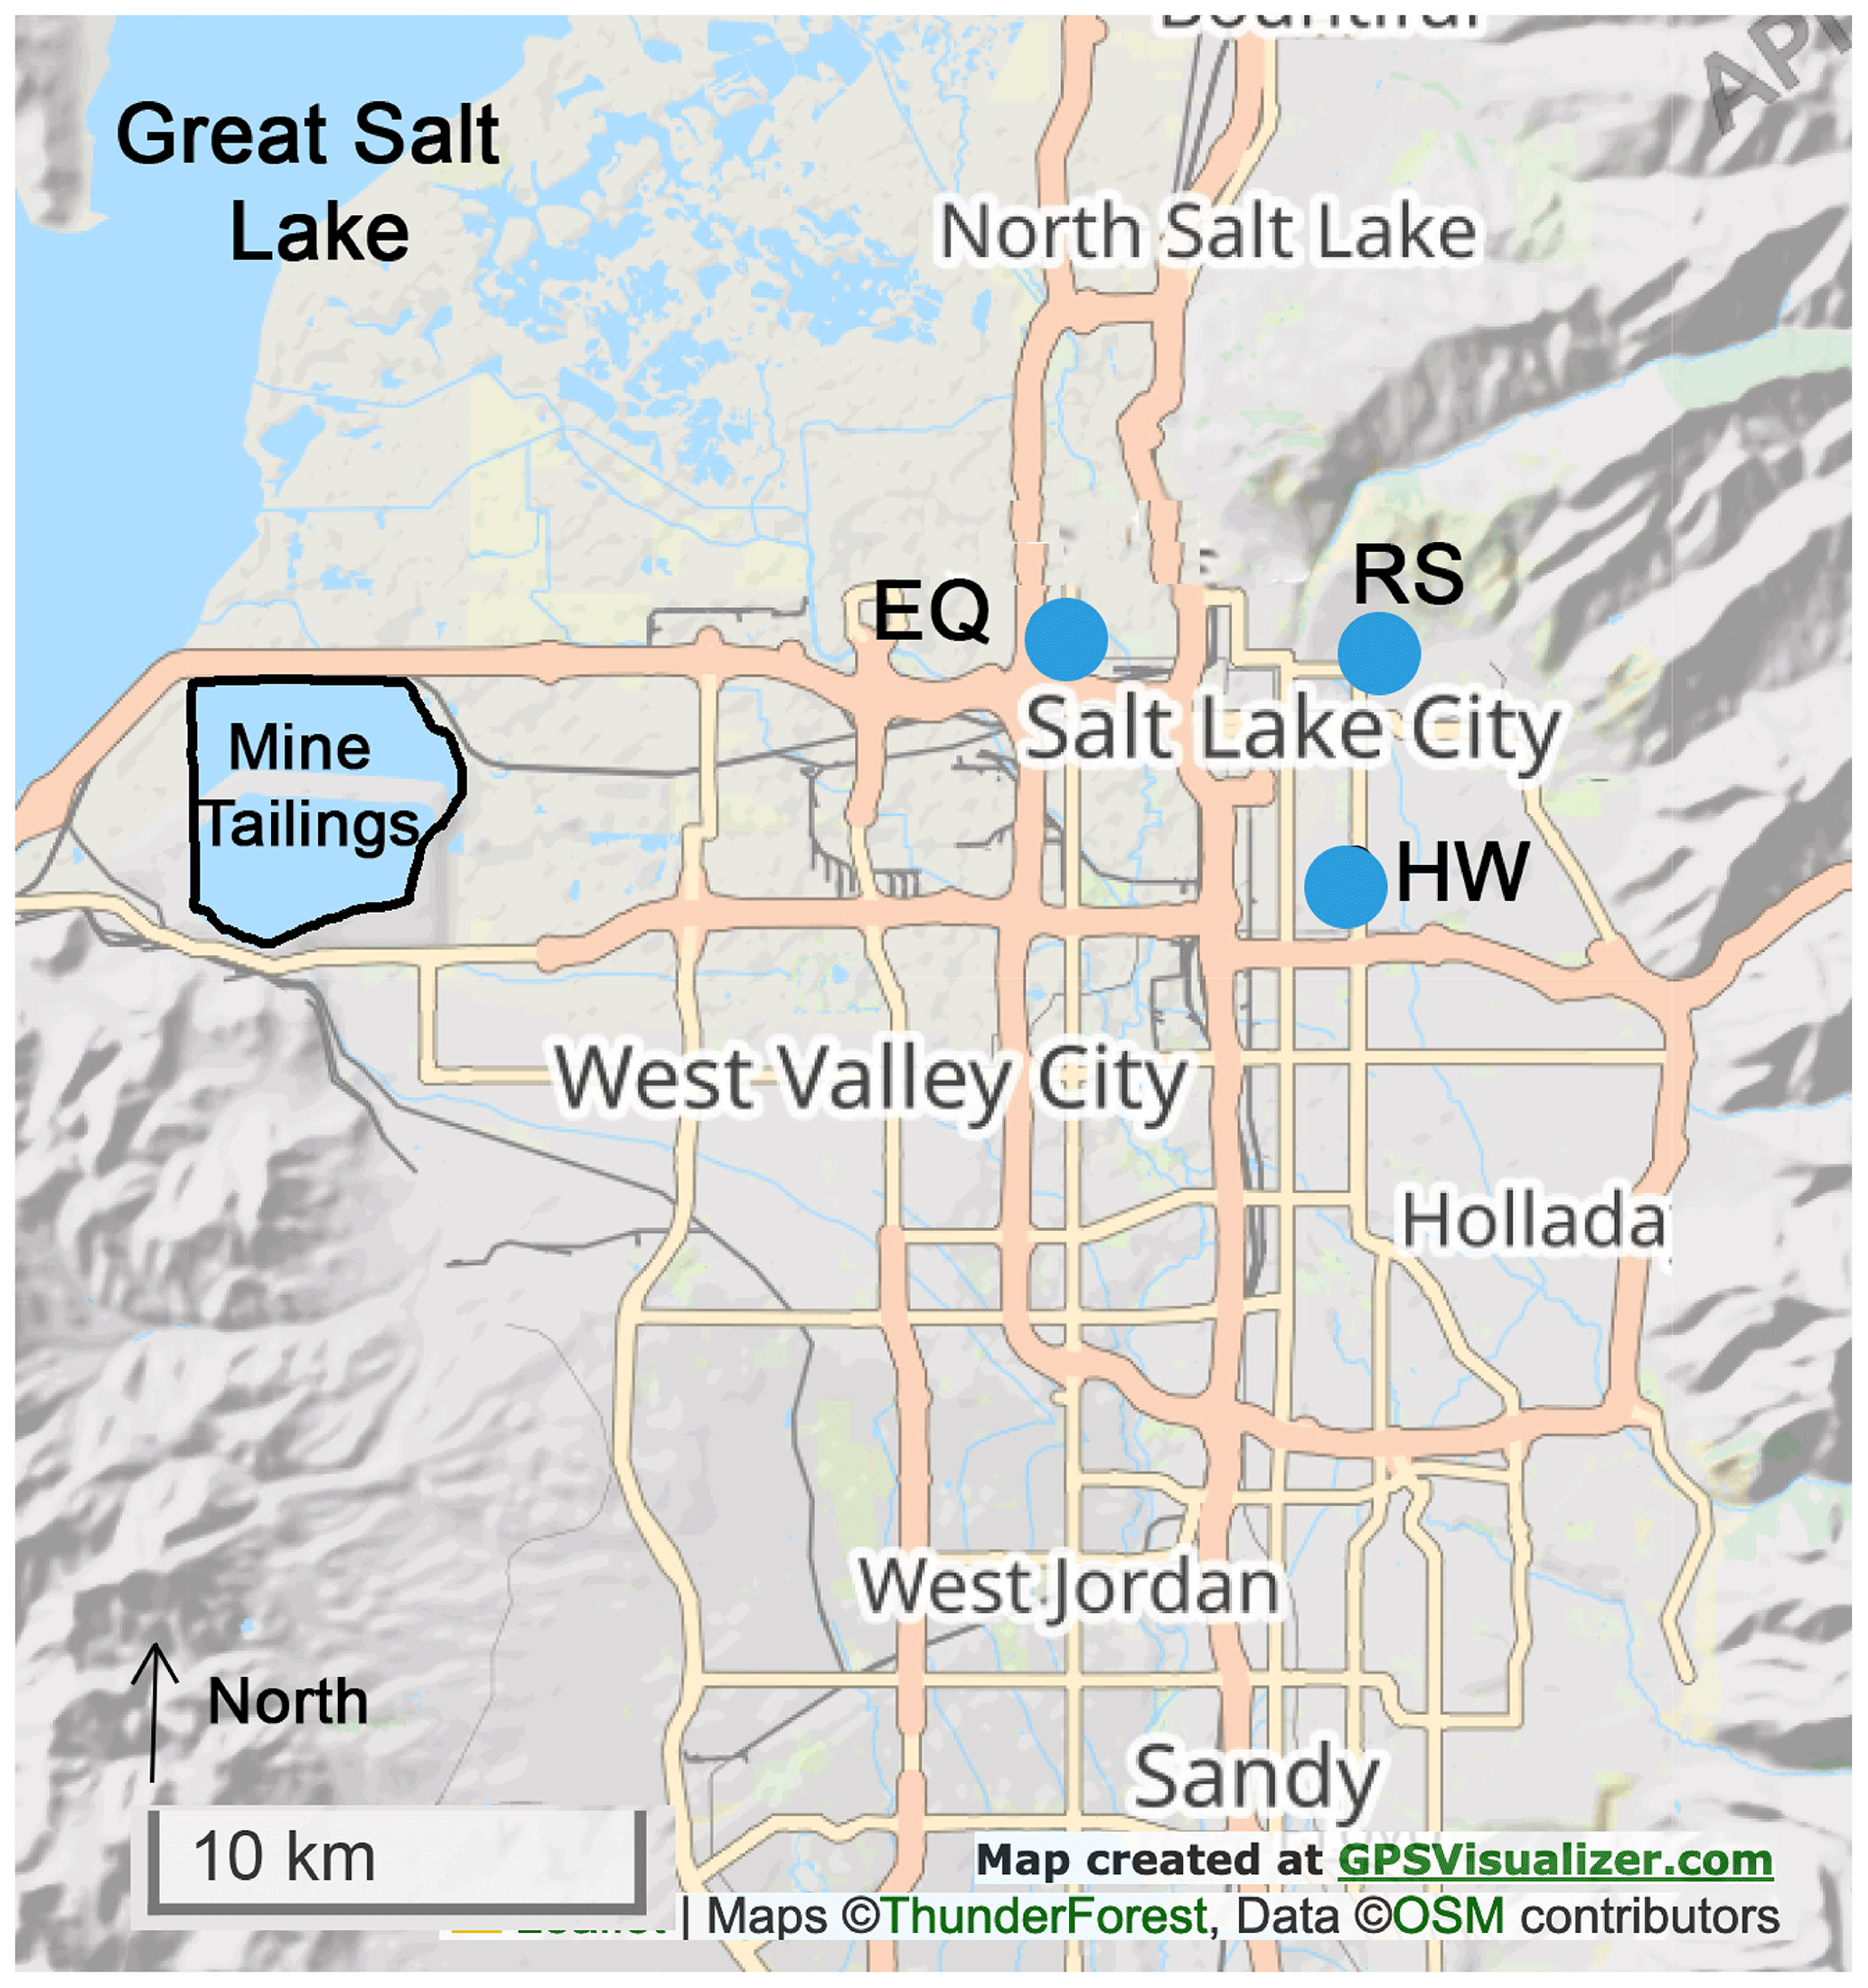
Figure 1Study locations in Salt Lake County: EQ (UDAQ Environmental Quality) site, HW (Hawthorne UDAQ) site, and RS (residential site). The distance between EQ to HW, HW to RS, and EQ to RS is 7.8, 4.3, and 7.35 km, respectively. The OPC sensors and PMSs were collocated at RS and HW sites. Two PurpleAir II sensors were located within 2 km of the EQ monitoring station.
2.1 Low-cost sensors
The low-cost sensors tested in this study include the Alphasense optical particle counter (OPC-N3, Alphasense Ltd, USD 500) and the Plantower PMS5003 (USD 20) integrated into the PurpleAir II (∼ USD 259). The Alphasense OPC-N3 uses a class 1 laser (∼ 658 nm) to detect, size, and count particles in the size range 0.35–40 µm in 24 bins, which is translated, using the embedded algorithm, into estimated PM1, PM2.5, and PM10 mass concentrations. The default setting for the OPC-N3's refractive index is 1.5 (real part) and for density is 1.65 g cm−3, and these default settings were used throughout this study. The OPC-N3 uses an internal fan to create flow and reports a sample flow rate (∼ 0.28 L min−1 and a total flow rate of 5.5 L min−1). Each OPC-N3 was connected to a laptop and used the manufacturer-provided software. The OPC-N3 was set to store measurements every 1 min. The measurements included the date, size bins and counts, pump flow, relative humidity (RH), temperature, and PM1, PM2.5, and PM10 concentration.
The PMS5003 is a low-cost sensor (∼ USD 20, Plantower Technology, China), which has been integrated into a variety of low-cost air quality sensor packages, such as TSI BlueSky and PurpleAir. It uses a fan to create a flow (∼ 0.1 L min−1), and it is equipped with a red laser (∼ 680 ± 10 nm), a scattering angle of 90∘, and a photo-diode detector to covert the scattered light to a voltage pulse (Sayahi et al., 2019; Ouimette et al., 2022). The PMS converts light scattering into several different air quality parameters, including particle counts (0.3–10 µm), PM1, PM2.5, and PM10, although these different metrics are all based on this single measurement, total light scattering. The PMS5003 has been evaluated extensively in the laboratory and the field, and the measurements tend to correlate well with PM1 or PM2.5 concentration, although it performs poorly for larger PM sizes, such as PM2.5–PM10 (Sayahi et al., 2019; Vogt et al., 2021; Kuula et al., 2020; Ouimette et al., 2022). In this study, we used two PurpleAir PA-II sensors at the HW and RS sites, and each PA-II has two PMSs per node. PM10 mass concentration corresponding to a correction factor of 1 (CF = 1) and a data collection rate of every 2 min were used. The data were downloaded from the PurpleAir website. In addition, we evaluated two PurpleAir PA-II sensors located within 2 km of the EQ monitoring station.
All the OPC-N3 sensors were placed inside a custom-built housing to protect the sensor from rain and insects. The details of the housing can be found in the Supplement (Sect. S3).
2.2 Site descriptions
The study includes measurements from the two UDAQ sites (HW and EQ) in Salt Lake County that provide both hourly PM2.5 and PM10 measurements (Fig. 1). UDAQ uses a Thermo Scientific model 5030 SHARP analyzer for measuring hourly PM2.5 concentration and a Met One E-BAM (Beta Attenuation Monitoring) PLUS for measuring PM10 concentration. We placed two PurpleAir PA-II sensors (containing four Plantower PMS5003 sensors named PMS-HW-1A, PMS-HW-1B, PMS-HW-2A, and PMS-HW-2B) and one OPC-N3 (named OPC-HW) at the HW site (Table 1). The PurpleAir PA-II sensors and the OPC-N3 were mounted on poles that extend above the roof of the HW monitoring station. The HW monitoring station is located in an urban residential area (AQS: 49-035-3006, lat: 40.7343, long: −111.8721) at an elevation of 1308 m. This site was established to represent population exposure in the Salt Lake City area, and it is often the controlling monitor for the county. The average of PMS-HW-1A, PMS-HW-2A, and PMS-HW-2B PM10 concentrations at HW was named PMS-HW. PMS-HW-2B was excluded from the PMS-HW average because of its moderate correlation with the other three sensors (Fig. S2 in the Supplement).
We also evaluated two PurpleAir II (containing four Plantower PMS5003 sensors named PMS-EQ-1A, PMS-EQ-1B, PMS-EQ-2A, and PMS-EQ-2B) sensors located near the UDAQ EQ site. One of the sensors was 480 m away (PMS-EQ-1), while the other was 1.82 km away (PMS-EQ-2). The EQ monitoring station (AQS: 49-035-3015, lat: 40.777028, long: −111.94585, elevation 1284 m) is located approximately 14 km southeast of the Great Salt Lake dry lake bed. In addition to PM concentrations, we accessed relative humidity (RH), temperature, wind speed, and wind direction data from the two UDAQ monitoring sites on EPA's AirNow Tech website. EPA-flagged measurements were excluded from this study. UDAQ uses RM Young Ultrasonic Anemometer model 86004 to measure the wind speed and wind direction and an instrument based on a hygroscopic plastic film to measure relative humidity.
The RS was located in the northeastern quadrant of the Salt Lake Valley at an elevation of 1383 m (lat: 40.771938, long: −111.861290). Measurements at this site included four Plantower PMS5003 sensors (labeled as PMS-RS-1A, PMS-RS1B, PMS-RS-2A, and PMS-RS-2B) in two PurpleAir PA-II sensors: one OPC-N3 (labeled as OPC-RS) and one GRIMM (model 1.109, Aerosol Technik Ainring, Germany). The GRIMM employs an internal pump to create a flow of 1.2 L min−1, measures the number concentration of particles of size 0.265–34 µm in 31 size bins, and reports estimated PM1, PM2.5, and PM10 concentrations. The GRIMM measurements were stored every minute in an internal storage card. The GRIMM measurements were not available between 24 April at 18:00 and 26 April 2022 at 14:00 MDT (Mountain Daylight Time). The PurpleAir PA-II sensors and the GRIMM were mounted on the eastern side of a small outbuilding.
2.3 Data analysis
The measurements from the low-cost sensors and the research monitor (GRIMM) were converted to hourly average concentrations and time-synchronized to MDT. Two EPA-flagged measurements corresponding to unexplainable high hourly PM10 concentrations (> 800 µg m−3) from FEM-HW were removed. The low-cost sensors used in this study were not supplemented with dryers, and therefore their performance is affected by high humidity conditions, which can result in condensation and droplet formation (Samad et al., 2021). Consequently, the measurements corresponding to relative humidity greater than 85 % were excluded from the study (< 2 % of total measurements).
Table 2Meteorological and PM characteristics during the non-dust and dust events at the HW monitoring site. The number in parentheses represents the minimum and maximum of the parameter. Parameters for the EQ site can be found in Table S1 (Supplement).
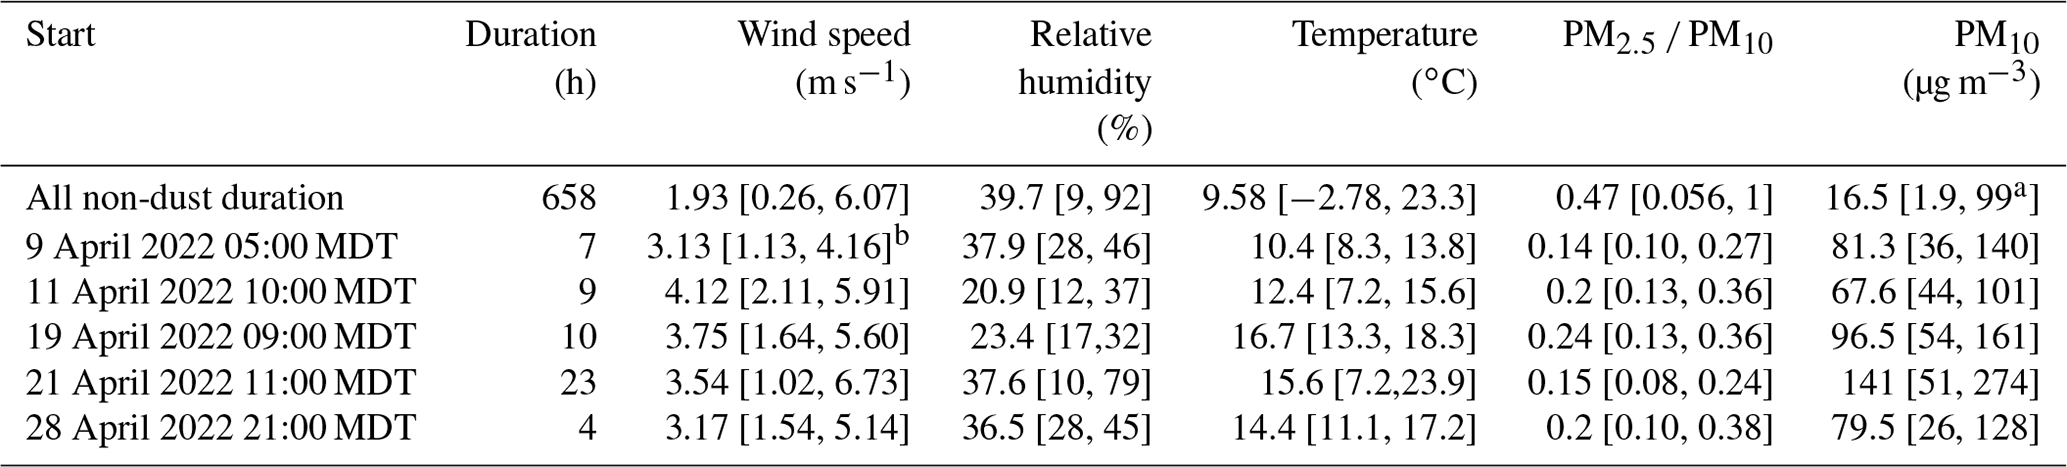
a A single measurement with a high PM10 concentration (99 µg m−3) was observed on 5 April 2022 at 00:00 MDT. The measurement did not meet the dust event criteria and hence was not included in the dust events. b A wind speed of 6.27 m s−1 was observed at the EQ site.
Using the HW and EQ meteorological measurements, we defined dust events as periods with PM10 concentrations exceeding 100 µg m−3 accompanied by winds exceeding 5 m s−1 at either site. These high winds were either observed at the beginning of or during dust events. Each dust event typically included a period of time when PM10 concentrations began increasing before reaching peak values. After wind speeds began to decrease, PM10 concentration decreased gradually. The dust events in this study included the entire time period when wind and PM10 levels decreased until PM10 concentrations reached background levels (< 50 µg m−3). Table 2 (for HW) and Table S1 (for EQ) provide the meteorological parameters (wind speed, wind direction, temperature, and RH), PM2.5 and PM10 concentrations, and PM2.5 PM10 ratios for each event.
We performed a linear regression to relate the PM10 concentration measurements of the low-cost sensors to reference monitors at HW and EQ as well as a research monitor at the RS. Performance guidelines for low-cost PM10 measurements are not yet available. For discussion purposes, we use EPA guidelines for low-cost PM2.5 sensors, which include acceptable performance as a slope of 1 ± 0.35, intercept of 0 ± 5 µg m−3, root mean square error (RMSE) ≤ 7 µ g m−3, normalized root mean square error (NRMSE) ≤ 30 %, and R2 > 0.7 (when compared with the reference monitor) (Duvall et al., 2021b). RMSE and NRMSE were calculated using the following equations:
where “low-cost sensor” represents the low-cost sensor measurement, Ref represents the reference and regulatory measurements, and represents the average of the reference or regulatory monitor measurements.
We also explored a PM2.5 PM10 ratio-based calibration strategy for correcting PMS readings. Based on the ratio of FEM-HW PM2.5 PM10, we segregated the FEM-HW and PMS-HW PM10 measurements into six bins: for PM2.5 PM10: < 0.2, 0.2–0.3, 0.3–0.4, 0.4–0.5, 0.5–0.7, and > 0.7. For each bin, the collocated PMS-HW PM10 concentrations were linearly regressed against the FEM-HW PM10 concentrations to obtain correction factors (slope and intercept). These correction factors were later used to correct the PMS PM10 concentrations at the other two locations (RS and EQ). The PM2.5 PM10 ratios from the GRIMM and OPC-RS at the RS were calculated for use in selecting the appropriate PM-ratio-based correction factor and subsequent correction of the collocated PMSs. At the EQ site, the PM2.5 PM10 ratio from the FEM-EQ was used to select the appropriate PM-ratio-based correction factor and subsequent correction of the nearby PMSs.
Figure 2 shows the hourly average PM10 concentration at the three different sites, with the dust events highlighted in grey. The five dust events were observed at all three locations, and they occurred at approximately the same time. Four of the dust events lasted less than 10 h, and the event on 21 April 2022 lasted 23 h. The PM2.5 PM10 ratio (Table 1) remained less than 0.3 during all the events, indicating the predominant contribution of coarser particles to PM10. For each event, the PM10 concentrations reached at least 100 µg m−3. During the 21 April event, hourly average PM10 concentrations reached 275 µg m−3 at HW, 311 µg m−3 at EQ, and 173 µg m−3 at the RS site (Tables 1 and S1). The lower PM10 concentration at the RS may be due to its residential location, its higher altitude, and its greater distance from dust sources. The OPC-HW and OPC-RS PM10 concentration estimates followed the temporal pattern of the reference and research monitors including during the dust events. Previous studies have observed similar responses for OPC-N3 and OPC-N2 (previous version of the OPC-N3) for dust events (Masic et al., 2020; Vogt et al., 2021). Vogt et al. (2021) found that the OPC-N3 tracked PM10 concentrations from a FIDAS (EN 16450 approved regulatory instrument) for long-range-transport dust events (PM10 range 60–125 µg m−3). The PMSs followed the temporal pattern of the reference and research monitors except during the dust events when the PMSs substantially underestimated PM10 concentration (Fig. 2). Vogt et al. (2021) also found that the PMS5003 underestimated the PM10 concentration during dust events. In addition, Masic et al. (2020) reported that during the Aralkum Desert dust event (PM10 reached 160 µg m−3), the PM10 reported by OPC-N2 agreed well with the GRIMM 11-D (research-grade optical particle sizer), whereas the PMS5003 was not able to detect a large fraction of coarse particles correctly. Most of these studies recorded one dust event during their sampling duration, whereas this study found that the OPC-N3 tracked multiple dust events.
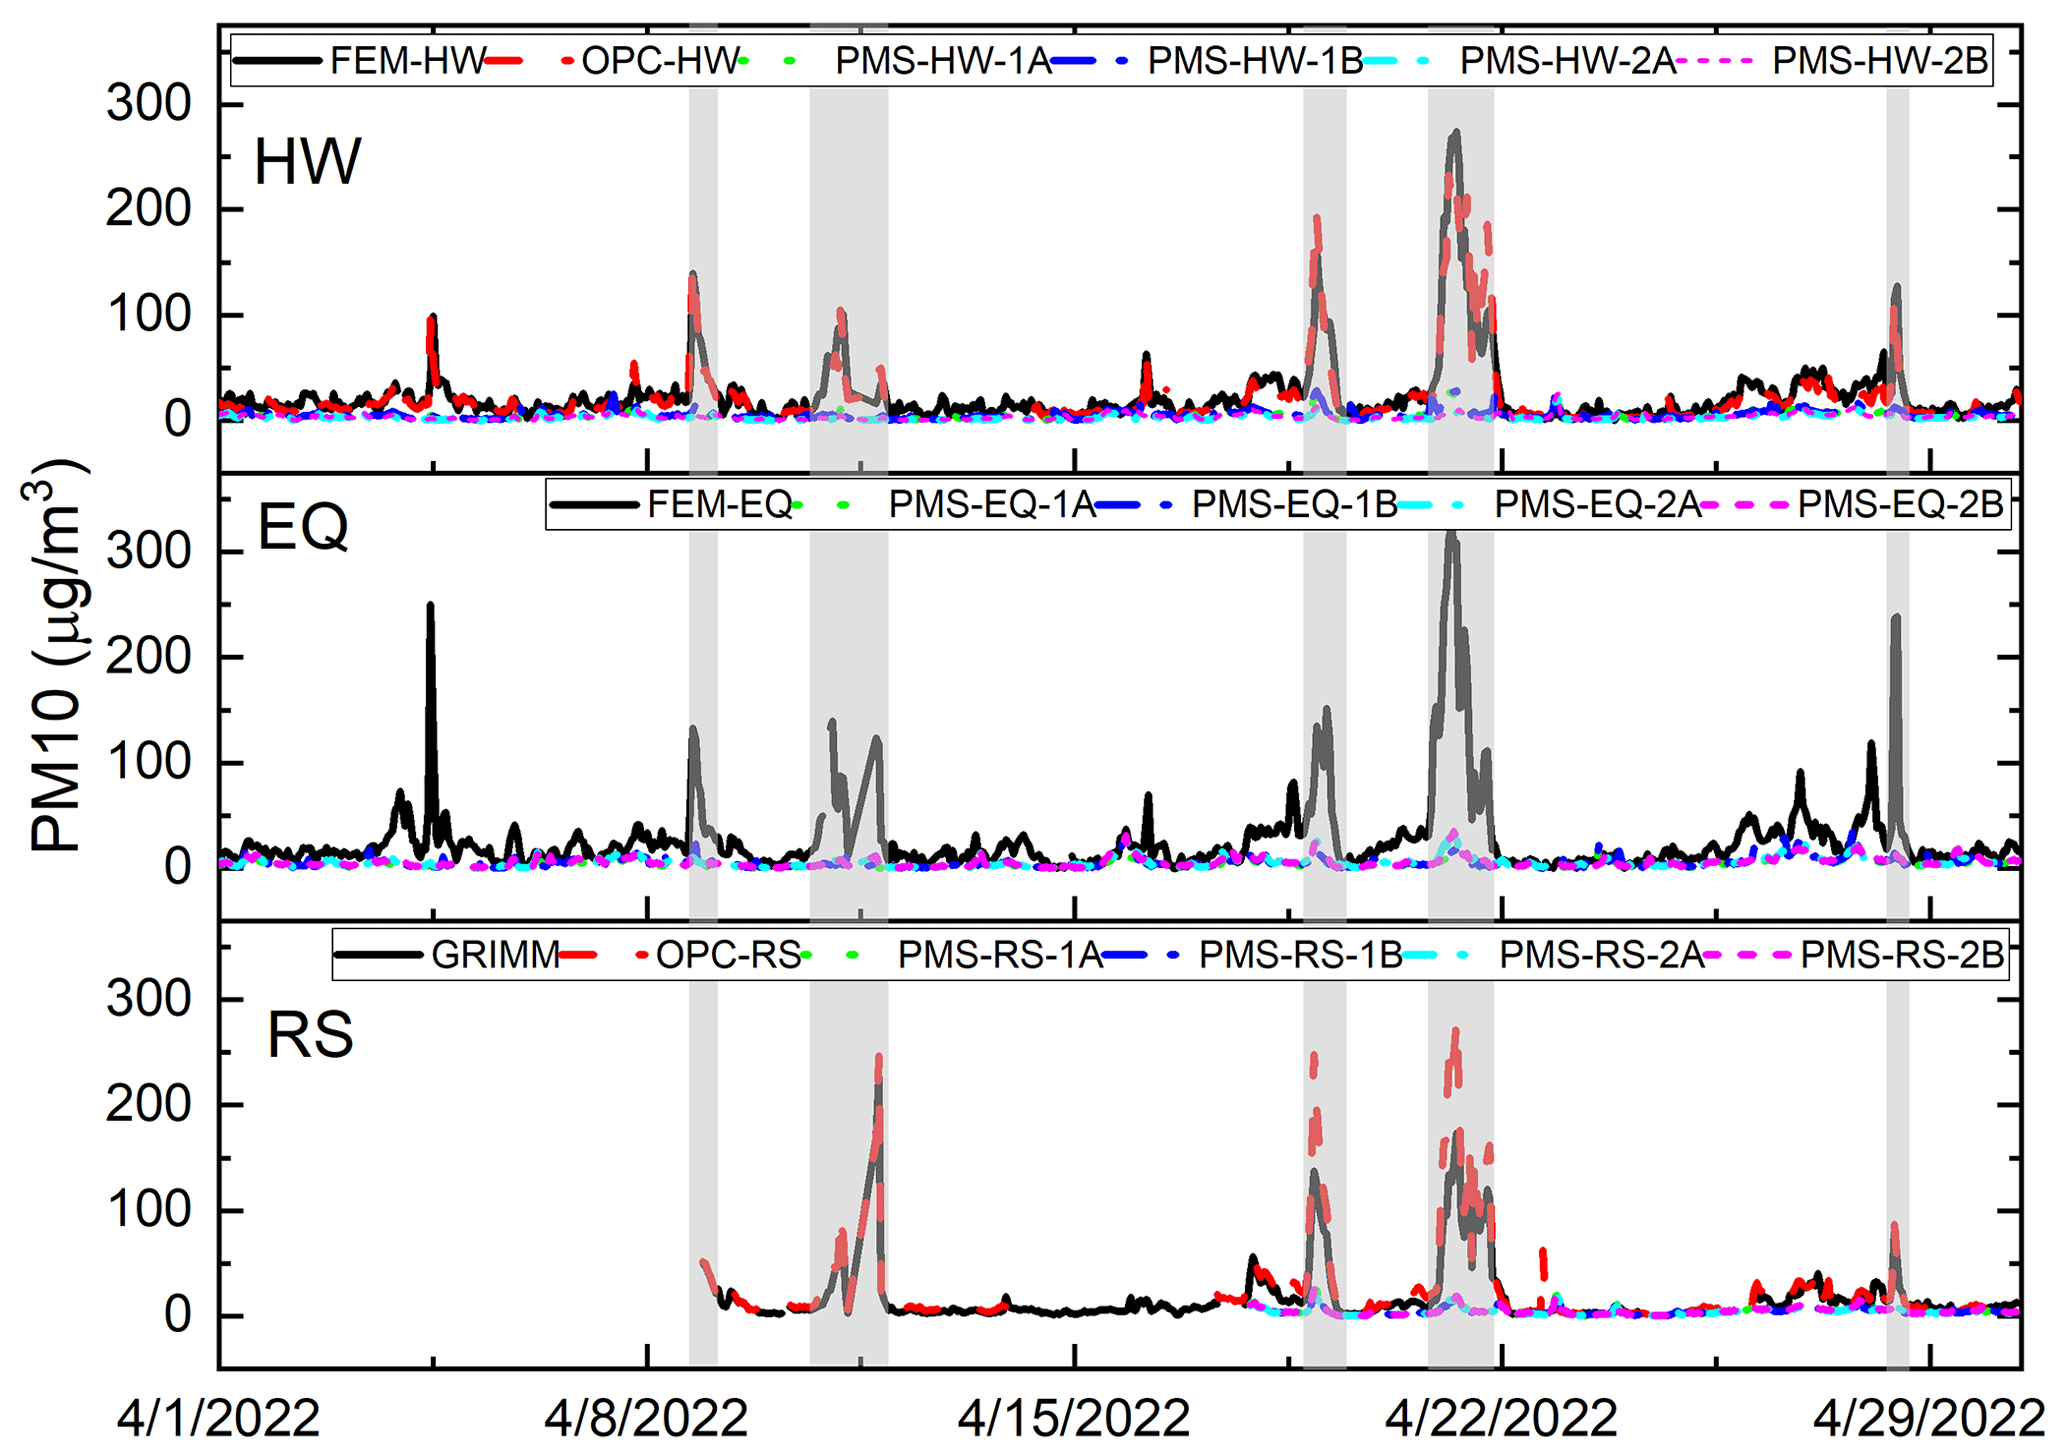
Figure 2Hourly averaged PM10 concentrations from the FEM, research monitors, and low-cost sensors at the three different sites: HW, EQ, and RS. Black solid lines represent reference and research monitors; the red dashed line represents OPC-N3; the green dotted, blue dash-dotted, turquoise dash–dot–dot, and pink short dashed lines represent PMSs. The shaded peaks on 9, 11, 19, 21, and 28 April 2022 correspond to dust events. More details on these events can be found in Table 2.
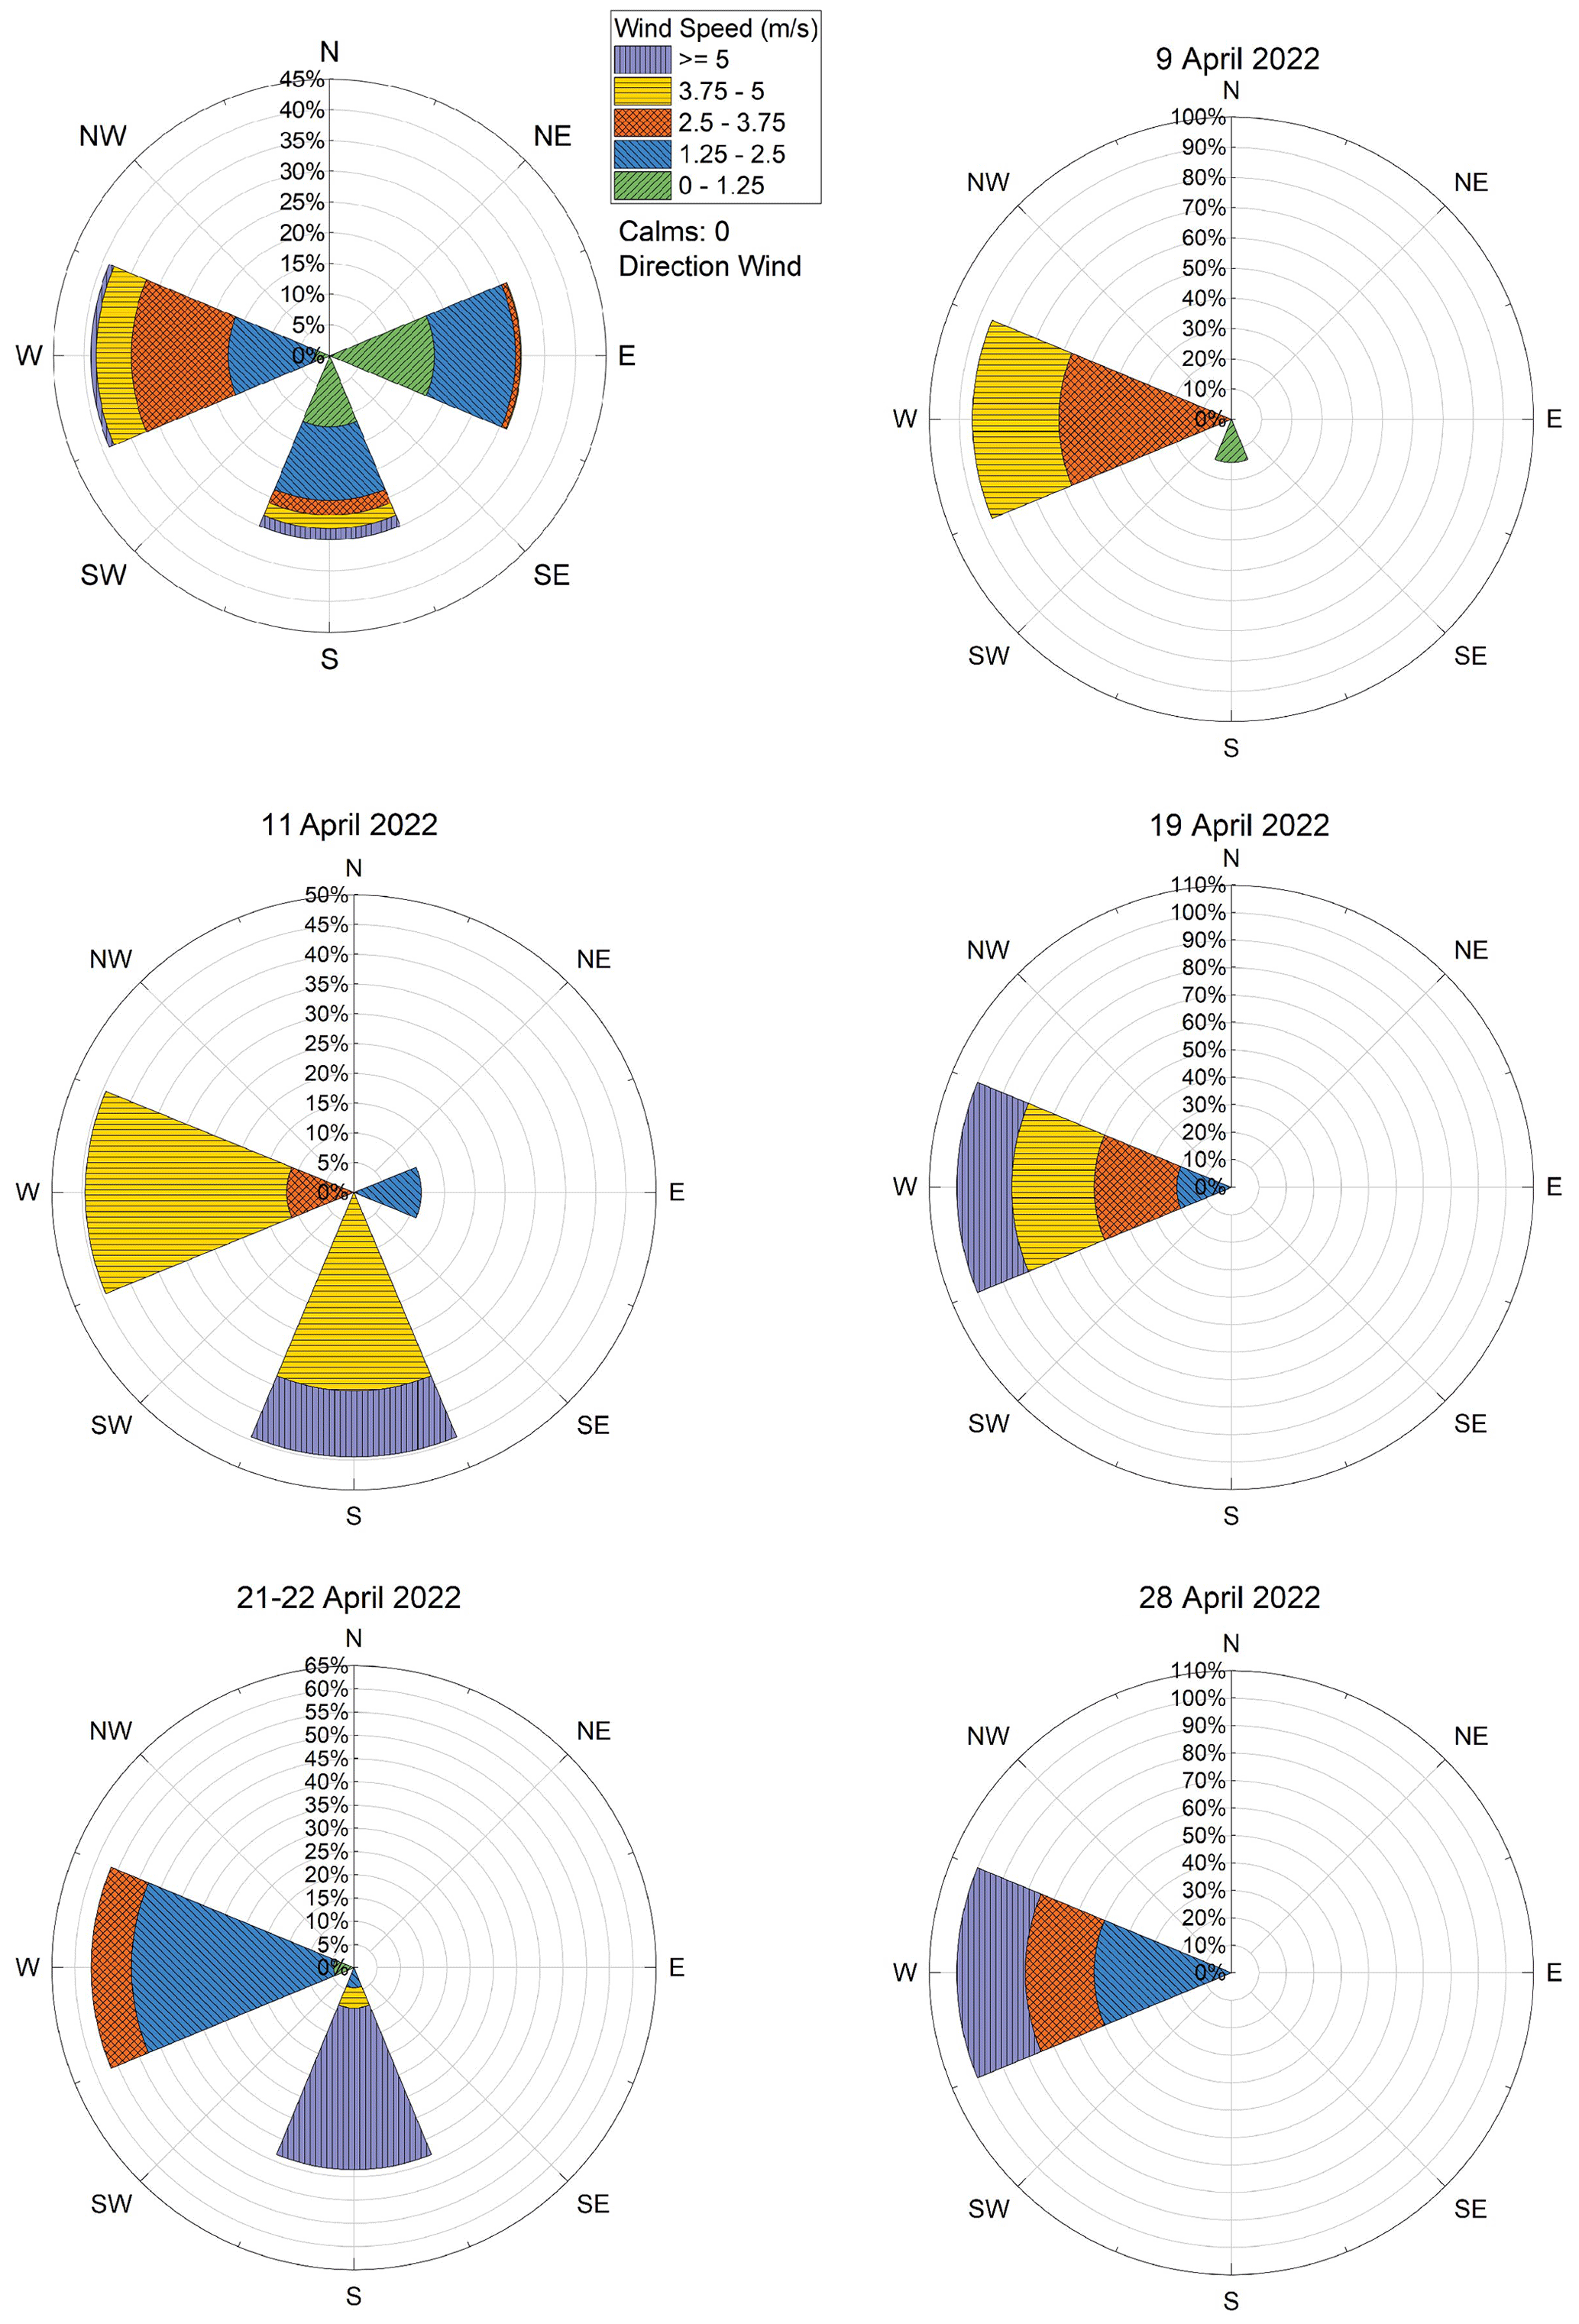
Figure 3Wind roses for April 2022 and individual dust events observed at HW. The wind roses for the EQ site can be found in the Supplement (Fig. S13).
Figure 3 shows wind roses for April 2022 and each of the dust events. During the month of April, winds exceeding 5 m s−1 were observed at HW during 2.5 % of the hours (1.81 % south predominant and 0.69 % west predominant). For dust events observed on 11 and 21–22 April, the high winds came from the south, whereas, for the rest of the events, high winds predominantly came from the west. The different wind directions could be transporting dust from different sources, such as the playas to the south and west of the Salt Lake Valley, the exposed playas of the Great Salt Lake, or local sources, such as mine tailing, gravel operations, unpaved roads, and an open-pit copper mine (Hahnenberger and Nicoll, 2012; Perry et al., 2019). All study monitoring sites are located west and southwest of the Great Salt Lake (Perry et al., 2019). Identifying the sources of the windblown dust and the effects of these differences on sensor performance would require a thorough analysis of the meteorology, the PM composition, and size distribution during the study period.
3.1 OPC-N3 performance
Figure 4 illustrates the strong correlation between the OPC-N3 and the PM10 concentration measured by the FEM at the HW site and the GRIMM monitor at the RS where the coefficient of determination ranges from 0.865 to 0.937. The intercept, slope, and R2 were within the guidelines suggested by the EPA for low-cost PM2.5 sensors, although the RMSE and NRMSE (uncorrected measurements) exceeded the guidelines (12.4 µg m−3 and 53.5 %, respectively; Fig. 4). Vogt et al. (2021) also observed a similar slope (0.84–0.9 µg m−3) and RMSE (12–13 µg m−3) for OPC-N3 hourly PM10 compared to FIDAS, but with a lower correlation (R2 0.58–0.64) and for lower concentrations than this study. Vogt et al. (2021) did not correct the PM10 measurements for relative humidity, and approximately 20 %–30 % of their measurements corresponded to high humidity conditions (RH > 85 %); the inclusion of elevated RH conditions may have affected their correlations. The coefficient of determination in this study dropped to 0.81 after the inclusion of measurements corresponding to RH above 85 %, which corresponded to just 2 % of the total measurements (Fig. S1). Mukherjee et al. (2017) also reported correlations as high as 0.81 for OPC-N2 compared to BAM PM10 measurements in the Cuyama Valley of California, with OPC-N2 reporting PM10 concentrations as high as 750 µg m−3. Mukherjee et al. (2017) also did not correct the OPC data for relative humidity, which may have affected their correlations. Our study as well as previous studies suggest that the OPC-N3 and OPC-N2 tend to underestimate the PM10 concentrations compared to the BAM (Mukherjee et al., 2017; Imami et al., 2022). The operating principle of the BAM and OPC-N3 differ. The BAM PM10 measurements are based on beta attenuation and do not require assumptions about particle properties or particle size distribution. In contrast, OPCs rely on the measured particle size distribution and assumed or measured particle properties (i.e., refractive index, shape, and density that can be size-dependent) to estimate mass concentration. In addition, particles < 0.3 µm in diameter do not scatter light sufficiently. Consequently, some deviation from the mass measured by the FEM is expected. The assumptions about refractive index and shape affect how particles are size-classified, and in addition assumptions about density affect estimates of mass concentration.
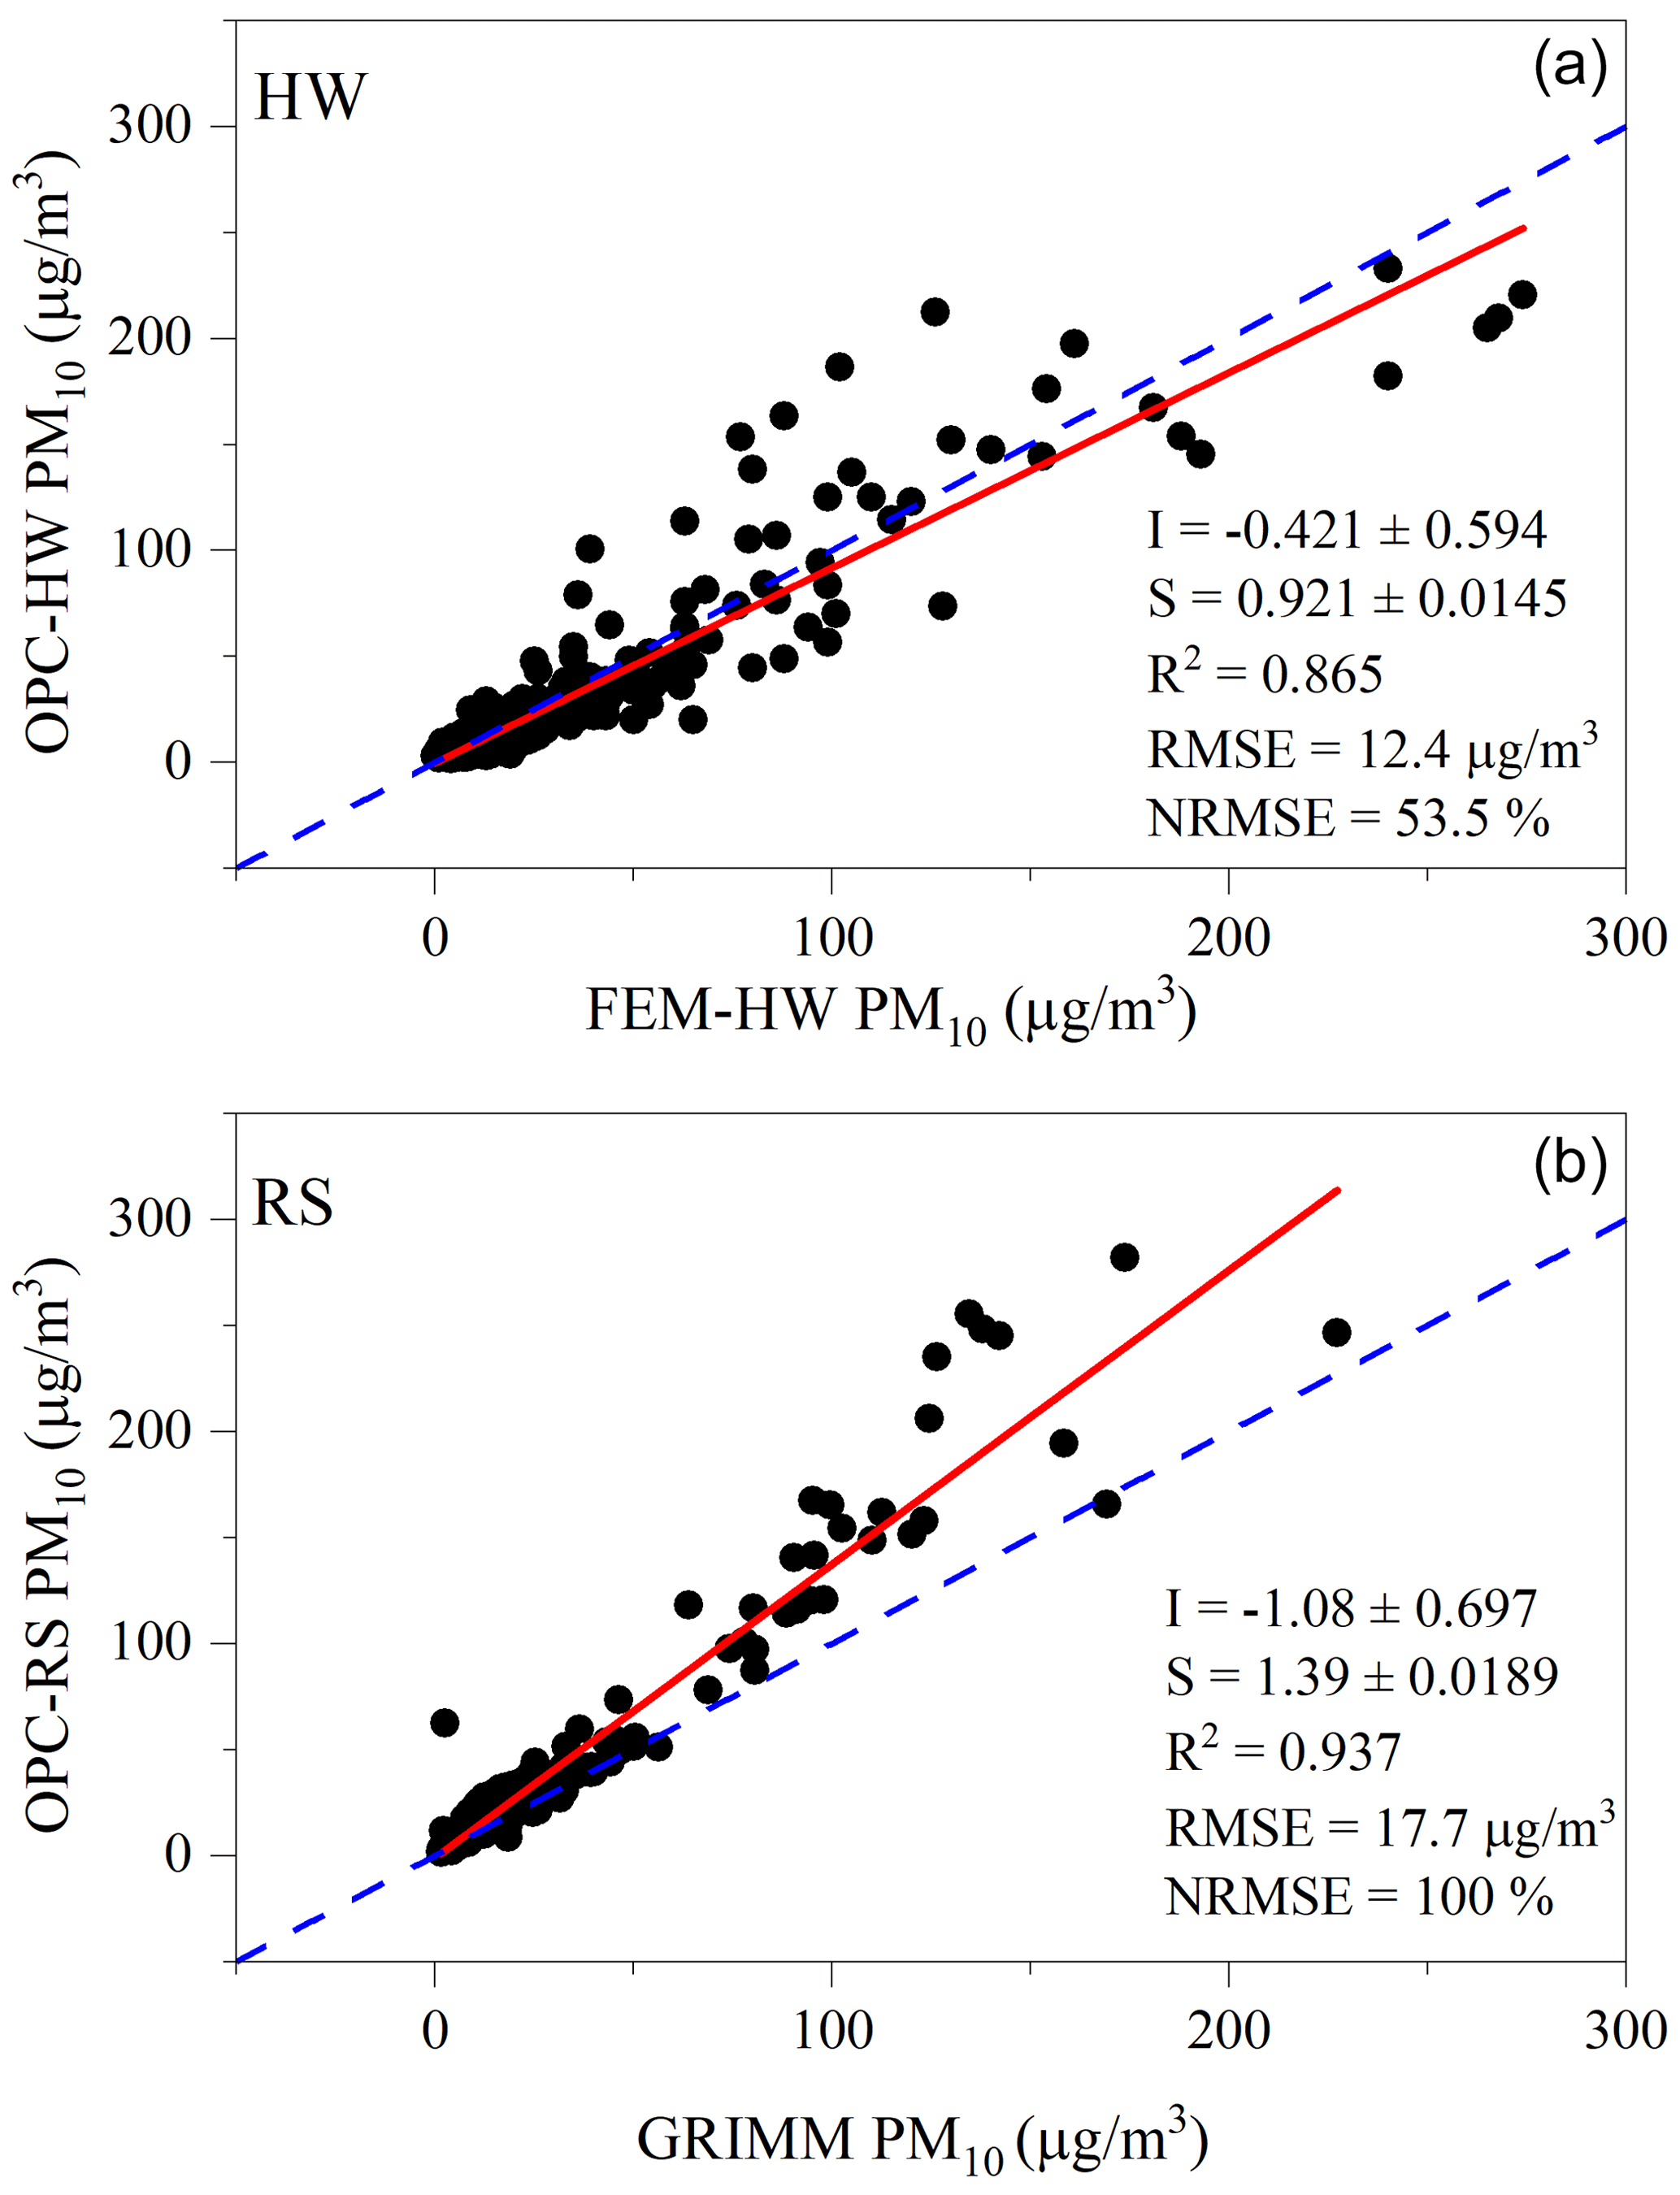
Figure 4Hourly averaged PM10 concentration for (a) OPC-HW vs. FEM-HW for the period between 1 and 30 April 2022. (b) OPC-RS vs. GRIMM PM10 concentration at the RS for the sampling period 9–30 April 2022. The red solid line represents a linear fit, and the blue dashed line represents the 1 : 1 line. I: intercept; S: slope.
At the RS site, the OPC-RS showed a strong correlation with the GRIMM (R2 > 0.9) and somewhat overestimated the PM10 concentration (slope 1.45) compared to the GRIMM's default settings (Fig. 4). Such behavior from OPC-N3 and its predecessor model OPC-N2 has been observed previously. Crilley et al. (2018) also observed this same behavior for PM10 for the OPC-N2 versus the GRIMM (1.108) and reported that the OPC-N2 estimated 2 to 5 times greater PM10 mass than the GRIMM. Sousan et al. (2016) observed a slope of 1.6 for the Alphasense OPC-N2 compared to a GRIMM (1.108) for Arizona road dust. They attributed this behavior to the higher detection efficiency of OPC-N2 for particles > 0.8 µm compared to the GRIMM and the effect of aerosol composition on OPC-N2 readings. Unlike Sousan et al. (2016), Bezantakos et al. (2018), using polystyrene spheres (size: 0.8, 1, 2.5, 5.1, 7.2, and 10.2 µm), reported that the OPC-N2 overestimated particle number concentrations compared to GRIMM (1.109) for all sizes, not just > 1 µm.
Crilley et al. (2018) considered high relative humidity to be a controlling factor behind the overestimation by the OPC-N2. Badura et al. (2018) also reported a strong effect of relative humidity on the OPC-N2 measurements. We excluded measurements corresponding to RH > 85 % because we focus on dust events, and RH is low during these events. We investigated the effect of RH (after excluding values > 85 %) by performing a multilinear regression with the FEM-HW as the dependent variable and the OPC-HW PM10 concentration and RH as independent variables. Adding RH did not significantly improve the correlation coefficient (not including RH: R2 = 0.865, RMSE = 12 µg m−3; including RH: R2 = 0.872, RMSE = 11.7 µg m−3; Sect. S1, Supplement). Hygroscopic growth changes with PM composition (Masic et al., 2020), and correcting measurements using a constant humidity coefficient can inject noise into the results. In addition, the Salt Lake Valley is in an arid region, and 82 % of PM measurements corresponded to an RH of less than 60 %. Consequently, the measurements were not corrected for the relative humidity for this study.
3.2 Performance of the PMS5003
Figures 5, 7 (top), and 8 (top) illustrate the PMSs' poor to moderate correlations (R2 between 0.128 and 0.482) with reference and research measurements of PM10 concentration; these sensors underestimate the PM10 concentration (slope < 0.09), particularly during dust events. These sensors also show high RMSEs (> 30 µg m−3). Poor performance of PMSs for PM10 has been reported previously (Masic et al., 2020; Sayahi et al., 2019). Unlike the OPC-N3, PMSs are nephelometers (Ouimette et al., 2022) and not optical particle counters, and their response decreases with increasing size. Previous studies reported a decreased response from PMS5003 sensors for particles larger than 0.5 µm (He et al., 2020; Kuula et al., 2020; Tryner et al., 2020). Kuula et al. (2020) and Tryner et al. (2020) observed constant particle size distributions from the PMS5003 regardless of actual particle size (exposed monodisperse particles from polystyrene latex spheres, 0.1–2 µm, or generated with dioctyl sebacate 0.5–10 µm). The PMSs' inability to detect coarse particles (aerodynamic size between 2.5 and 10 µm) is due to its truncation of the forward-scattered light and its limited ability to aspirate coarse particles into the device (Ouimette et al., 2022).

Figure 5PMS PM10 concentration vs. FEM-HW PM10 concentration. PMS-HW represents the average of three PMSs (PMS-HW-1A, PMS-HW-2A, and PMS-HW-2B). The solid red line represents a linear fit, and the blue line represents the 1 : 1 line. The plot includes measurements recorded between 1 and 30 April 2022. I: intercept, and S: slope. Each measurement represents hourly averaged PM10 concentrations.
The PMSs also exhibited some inter-sensor variability during this study (Fig. S2). One sensor, PMS-HW-1B, exhibited a fair correlation with the other three PMSs (R2 = 0.53–0.55 with slopes differing by more than 50 %). The remaining three sensors (when compared to each other) had R2 greater than 0.7, although their slopes differed by 40 % (slope: PMS-HW-2A vs. PMS-HW-1A = 0.504; PMS-HW-2B vs. PMS-HW-1A = 0.577). In terms of response to PM10 and correlation with the reference monitor, PMS-HW-1 (A and B) performed somewhat better than PMS-HW-2 (A and B) (RMSE < 35 µg m−3 and R2 > 0.4 compared to RMSE < 36 and R2 > 0.15).
Sensor-to-sensor variability has been reported in previous studies of PMSs, particularly for PM2.5 concentration (Sayahi et al., 2019; Tagle et al., 2020). The two PurpleAir II sensors (four PMSs) at the HW site were deployed on different dates. PMS-HW-1 was deployed on 24 April 2020, whereas the PMS-HW-2 was deployed on 20 September 2019. These sensors could be from different manufacturing batches, and they experienced different amounts of time in the field. Sensor aging can cause differences in PMS performance (Tryner et al., 2020). In addition, because the PMSs are inefficient at measuring particles larger than PM2.5 in diameter, as evidenced by the low slopes in Fig. 5, small differences (potentially due to sensor orientation and inherent differences in the sensors themselves) can magnify sensor-to-sensor variability. Mukherjee et al. (2017) and Duvall et al. (2021a) discuss the importance of sampler positioning for PM10 measurements. For presentation purposes, we have excluded the PMS-HW-1B, which exhibited poor correlation with the other PMSs (PMS-HW-1A, PMS-HW-2A, and PMS-HW-2B), averaged the remaining three PMS PM10 concentrations at HW, and compared the average of the three sensors to the PM10 concentrations measured by the FEM. Figure 5 shows the poor R2 between the average of all PMSs and FEM PM10 (R2 = 0.279), as well as how the PMS-HW underestimates the PM10 composition (slope of 0.0463).
3.3 Using PM2.5 PM10 ratios to obtain size-segregated PMS correction factors
The effect of correcting the PMS measurements with PM2.5 PM10 ratio-based factors on PMS performance was explored as a strategy to obtain correction factors that could enable the PMS measurements to infer PM10 concentrations. The PM2.5 PM10 ratio, calculated using the PM2.5 and PM10 concentrations reported by the FEM-HW, was used to segregate the PMS-HW measurements into six bins for PM2.5 PM10: < 0.2, 0.2–0.3, 0.3–0.4, 0.4–0.5, 0.5–0.7, and > 0.7. For all the binned ratios (Fig. 6), the PMS showed a consistent R2 greater than 0.6 (compared to R2 values of 0.128–0.482 prior to binning), but with very different slopes for the different PM2.5 PM10 bins. The slope varied between 17 and 1.07, with the magnitude decreasing with the PM2.5 PM10 ratio. Note that Figs. 4 and 5 show the FEM on the x axes, whereas Fig. 6 shows the regression equations used for correcting the PMS measurements (with FEM on the y axes). During the dust events, the PM2.5 PM10 ratio was less than 0.3, supporting the large contribution from dust and the corresponding large magnitude of the PM10 concentration. The PM10 concentrations were lowest for the high PM2.5 PM10 ratios (> 0.7), and most PM10 concentrations were below 5 µg m−3, which is close to the BAM's lower limit of detection (Hart, 2013) and likely contributes to the low correlation observed for this ratio.
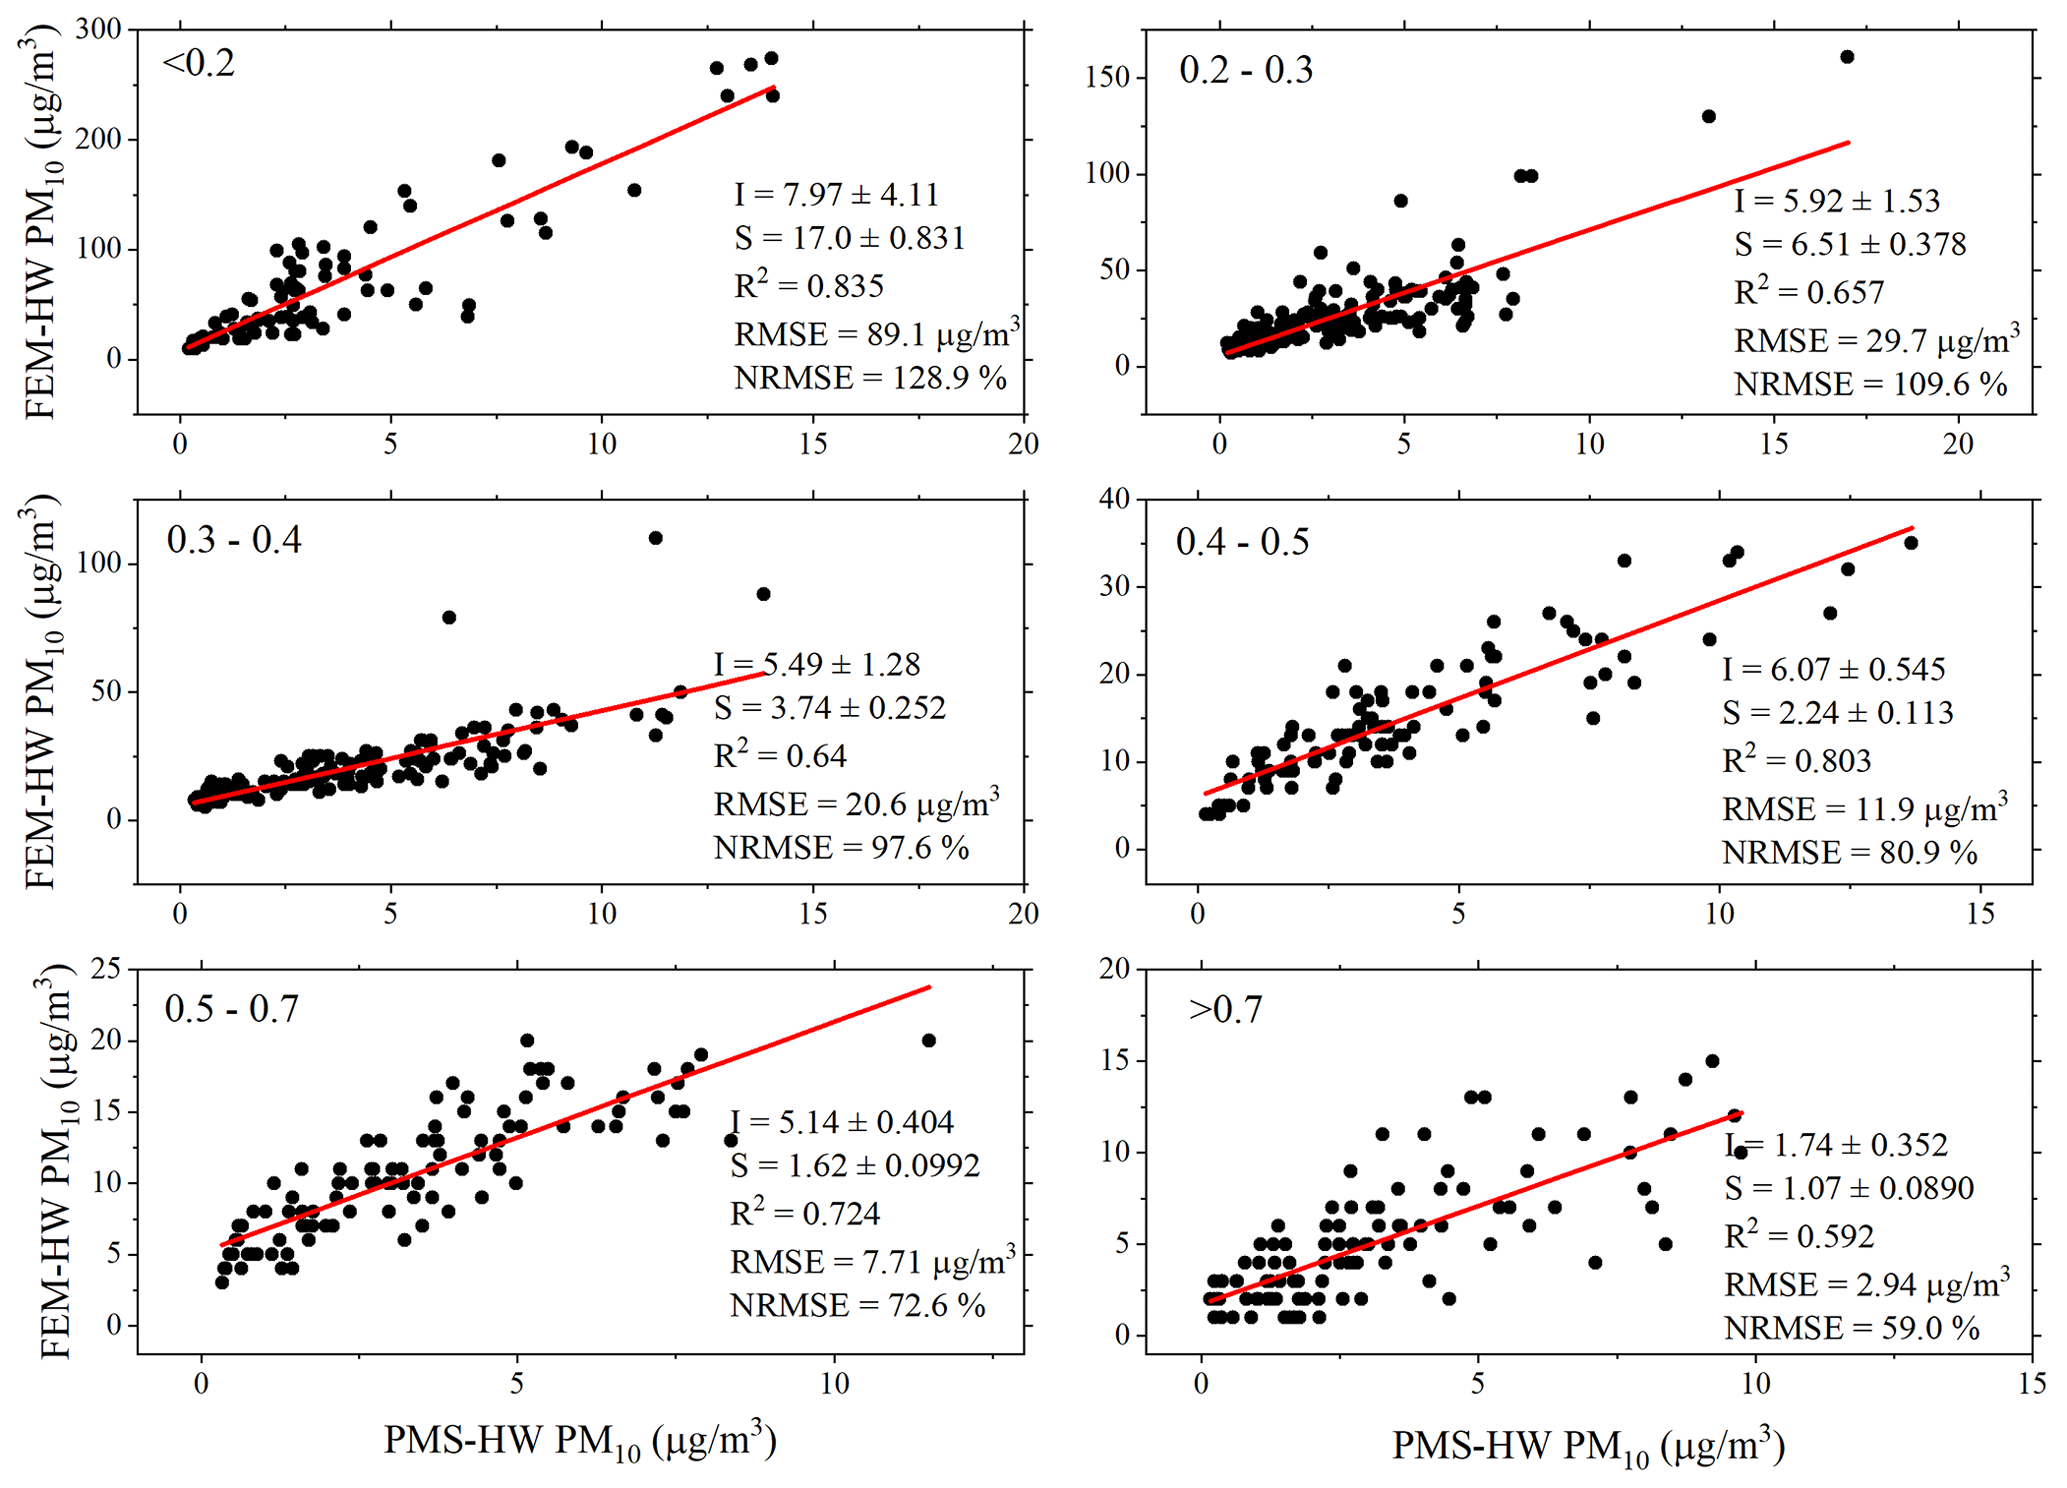
Figure 6PMS-HW PM10 concentration (average of three PMSs at HW) vs. FEM-HW PM10 concentration for different PM2.5 PM10 bins. The RMSE and NRMSE have units of micrograms per cubic meter (µg m−3) and percent (%), respectively. Each measurement represents hourly averaged PM10 concentrations.
The slope and intercept for each bin were used as correction factors, called PM-ratio-based correction factors, to correct the PMS PM10 measurements at the other two locations, i.e., RS and EQ.
3.4 Correcting PMS data at RS and EQ sites
Similar to the HW site, the PMS PM10 concentration measurements at the RS (Fig. 7, top) exhibited poor to moderate correlation (R2 0.32–0.49, RMSE > 33 µg m−3) compared to the research monitor and underestimated the PM10 concentrations (slope < 0.099). We corrected the raw PMS PM10 concentration measurements using the PM-ratio-based correction factors obtained from the HW site and the PM2.5 PM10 ratio from the GRIMM or the OPC to select a correction factor for each of the six PM2.5 PM10 bins. Using the GRIMM provided ratios, Fig. 7 (middle) shows that at the RS, after PM-ratio-based correction of the PM10 measurements, the correlation for all the PMSs improved significantly (R2 > 0.77) and the RMSEs decreased (< 18 µg m−3). The R2 varied between 0.773 and 0.810, and the slopes varied between 0.526 and 0.717. The intercept was a little higher (7–10 µg m−3) than the EPA-suggested guideline for low-cost PM2.5 sensors. All the PMSs at RS were freshly deployed and were all mounted on the eastern side of a small building. These sensors exhibited good inter-sensor correlation (Fig. S4, R2 > 0.97, slope > 0.77) and therefore exhibited very similar improvement with all the sensors using the PM-ratio-based correction. The correlations between PMS PM10 and GRIMM PM10 concentrations were also good (R2 > 0.7) when considering PM10 < 50 µg m−3 (Fig. S8 vs. Fig. S9), indicating that PM-ratio-based correction factors are applicable during more typical ambient levels of PM10 (without dust events).
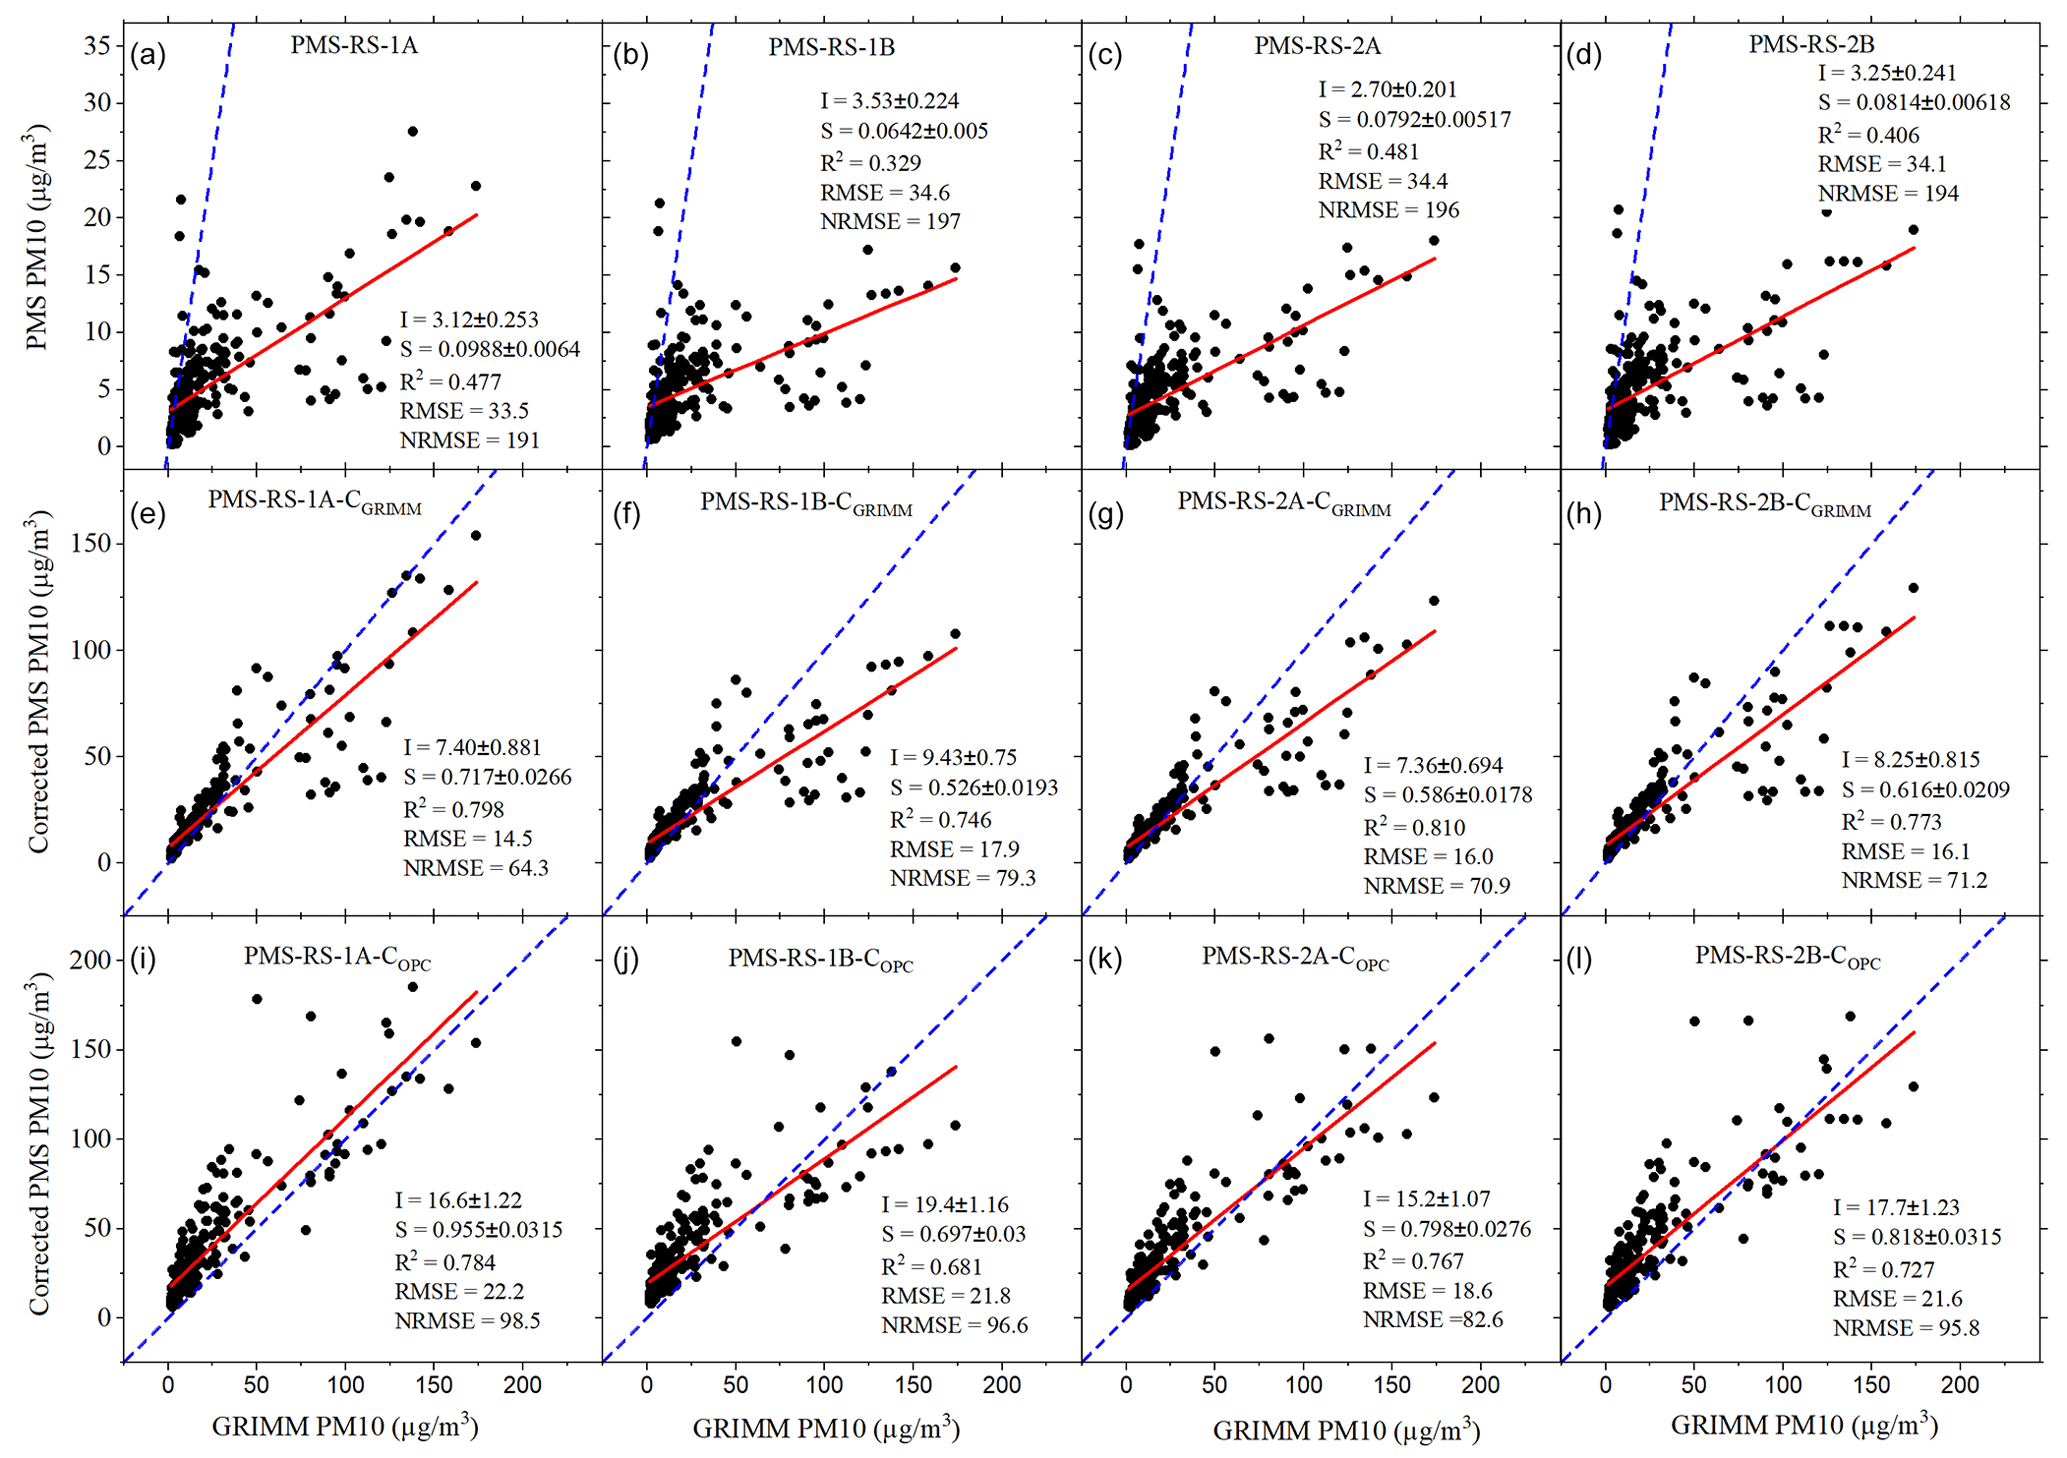
Figure 7(a–d) Uncorrected PMS PM10 concentration vs. GRIMM PM10 concentration at RS the site. (e–h) Corrected PM10 concentrations using the PM-ratio-based correction factors developed at HW and the PM2.5 PM10 ratios provided by the GRIMM at the RS. (i–l) Corrected PM10 concentrations using the PM-ratio-based correction factors developed at HW and the PM2.5 PM10 ratios provided by the OPC-RS at the RS. The solid red line represents the linear fit, and the blue dashed line represents the 1 : 1 line. The plots include measurements recorded between 18 and 30 April 2022. I: intercept; S: slope. The RMSE and NRMSE have units of micrograms per cubic meter (µg m−3) and percent (%), respectively. Each measurement represents hourly averaged PM10 concentrations.
Figure 7 (bottom) illustrates a similar strategy at the RS site but using the OPC-RS to provide the PM2.5 PM10 ratio. It also shows that the correlation for PMSs improved after applying the PM-ratio-based correction using the OPC-RS for the ratio (R2 = 0.681–0.784). After correction, the slope also increased and varied between 0.589 and 0.813. The corrected RMSE (18.6–22.2 µg m−3) and intercept (15.2–19.4 µg m−3) were somewhat higher than that observed when using GRIMM-reported PM ratios (Fig. 7, middle). From Fig. 7 (bottom), the PM-ratio-based corrected PMS PM10 concentration for PM10 < 50 µg m−3 was always above the 1 : 1 line; i.e., the PMS PM10 concentration was overestimated. The OPC-RS efficiency in counting particles smaller than 0.8 µm is lower than the GRIMM (Bezantakos et al., 2018; Sousan et al., 2016) and therefore underestimates PM2.5 mass. Figure S5 also illustrates this overestimation in our study, where for low PM2.5 and PM10 concentrations (90 % of the measurements when PM2.5 < 12 µg m−3 and PM10 < 40 µg m−3) the OPC-RS underestimated the PM2.5 mass compared to the GRIMM, although the OPC-RS PM10 concentrations were similar to those of the GRIMM. The underestimated PM2.5 measurements from the OPC affected the PM2.5 PM10 ratios, which for the OPC-RS remained lower than those reported by the GRIMM (Fig. S6). The magnitude of the PM-ratio-based correction factors (Fig. 6) was inversely related to the PM2.5 PM10 ratio. Since the OPC-RS reported ratios were always low, the corrected PM10 measurements below 50 µg m−3 were overestimated (Fig. S10).

Figure 8(a–d) Uncorrected PMS PM10 concentration vs. FEM-EQ PM10 concentrations at the EQ site. (e–h) Corrected PM10 concentrations using the correction factors developed at HW and the PM2.5 PM10 ratios calculated using FEM-EQ PM10 and PM2.5 concentrations. The solid red line represents the linear fit, and the blue dashed line represents the 1 : 1 line. The plots include measurements recorded between 1 and 30 April 2022. I: intercept; S: slope. The RMSE and NRMSE have units of micrograms per cubic meter (µg m−3) and percent (%), respectively. Each measurement represents hourly averaged PM10 concentrations.
At the EQ site, we used the PM2.5 PM10 ratios from FEM measurements at the EQ site coupled with the PM-ratio-based correction factors developed at the HW site to correct the PMS PM10 concentrations from sensors located near the EQ site. Correcting the PMS PM10 concentrations using this approach did improve the correlation with FEM-EQ (Fig. 8). Before the correction, all the PMSs had poor correlation with the FEM (R2 < 0.342 and slope < 0.0737). The R2 improved to 0.617–0.797, and the slope increased to 0.602–1.38 after PM-ratio-based correction. The RMSE decreased and ranged 21.5–35.6 µg m−3. The intercept increased and varied between 6.06 and 15.4. The sensors at this site showed moderate inter-sensor correlation (Fig. S7), which was expected as these sensors were not collocated. The different correlations with respect to FEM-EQ for the two PurpleAir II sensors were also expected as these sensors were not collocated with the FEM-EQ.
This study has several limitations. The sensors' performance was evaluated for a month-long period in April 2022 and focused primarily on dust events, which commonly occur during this month. Understanding the OPC-N3 performance and whether using a PM2.5 PM10 ratio-based correction could improve correction factors for PMSs in other seasons and under different environmental conditions, like wildfires and cold air pools, would require a longer period of evaluation. This study used four PMS5003 sensors at the HW site, and unlike the RS site, the sensors at HW were deployed at different times. These sensors showed moderate inter-sensor correlation, suggesting the need for further investigation of sensor age, sensor siting for PM10 measurements, and potentially recalibration. This study occurred in an arid region, with RH generally less than 60 %. This study did not find a significant improvement by adding RH to a calibration model between the OPC-N3 and the FEM. However, this study excluded measurements with RH > 85 % (< 2 % of total measurements), a range in which previous studies have identified a significant effect of RH (Crilley et al., 2018), and the applicability of this study's results to other, more humid, regions would need to be evaluated. The correction factors derived in this study used an average of three collocated PMS measurements at a single site. In the absence of detailed information about ambient particle properties, this study used default constant density for all the size bins for OPC-N3. The Alphasense OPC-N3 allows the user to change the size-bin specific density for better estimates of PM10, and if size-bin density and refractive index were available, the OPC measurements could potentially be improved. Our proposed PM-ratio-based calibration method relies on local measurements of the PM2.5 PM10 ratio. This requires FEM or other accurate measurements of PM2.5 and PM10 concentration, and the needed spatial distribution of these accurate PM2.5 and PM10 concentrations would need to be determined.
This study evaluated the performance of Alphasense OPC-N3 PM10 measurements compared to FEM and GRIMM measurements during multiple dust events at two locations (HW and RS). The OPC-N3 tracked all the dust events at the two locations and exhibited a strong correlation with reference measurements (R2 = 0.865–0.937), RMSE of 12.4–17.7 µg m−3, and NRMSE of 53.5 %–100 %. Uncorrected PMS5003 PM10 measurements showed poor to moderate correlation (R2 < 0.49) with the reference and research monitors at three locations (HW, RS, and EQ), with RMSE of 33–45 µg m−3 and NRMSE of 145 %–197 %. The PMS measurements severely underestimated the PM10 concentrations (slope < 0.099). We evaluated a PM-ratio-based correction method to improve estimates of PM10 concentration from PMSs. After applying this method, PMS PM10 concentrations correlated reasonably well with FEM measurements (R2 > 0.63) and GRIMM measurements (R2 > 0.76); the RMSE decreased to 15–25 µg m−3 and NRMSE decreased to 64 %–132 %. Our results suggest that it may be possible to leverage measurements from existing networks relying on low-cost PM2.5 sensors to obtain better resolved spatial estimates of PM10 concentration using a combination of PMSs and measurements of PM2.5 and PM10, such as those provided by FEMs, research-grade instrumentation, or the OPC-N3.
The raw and processed data used in the paper can be found at https://doi.org/10.7278/S50d-xbns-3ge3 (Kelly and Kaur, 2022).
The supplement related to this article is available online at: https://doi.org/10.5194/amt-16-2455-2023-supplement.
KEK and KK conceptualized the research and collected and analyzed the data. KK developed the original draft, and KEK reviewed the original draft. KEK provided the supervision and acquired the funding.
Kerry E. Kelly has a financial interest in the company Tellus Networked Solutions, LCC, which commercializes solutions for environmental monitoring. Their technology was not used as part of this work.
Publisher's note: Copernicus Publications remains neutral with regard to jurisdictional claims in published maps and institutional affiliations.
This article is part of the special issue “Dust aerosol measurements, modeling and multidisciplinary effects (AMT/ACP inter-journal SI)”. It is not associated with a conference.
This material is based upon work supported by the National Science Foundation under grant no. 2012091 (Collaborative Research Network Cluster: Dust in the Critical Zone) and under grant no. 2228600 (CIVIC-PG: TRACK A: Community Resilience through Engaging, Actionable, Timely, High-Resolution Air Quality Information – CREATE-AQI). Thanks to PurpleAir for donating two PA-II sensors to the project.
This research has been supported by the National Science Foundation (grant nos. 2012091 and 2228600).
This paper was edited by Paolo Laj and reviewed by Shahrul Nadzir and two anonymous referees.
Akinwumiju, A. S., Ajisafe, T., and Adelodun, A. A.: Airborne Particulate Matter Pollution in Akure Metro City, Southwestern Nigeria, West Africa: Attribution and Meteorological Influence, Journal of Geovisualization and Spatial Analysis, 5, 11, https://doi.org/10.1007/s41651-021-00079-6, 2021.
Alhasa, K., Mohd Nadzir, M., Olalekan, P., Latif, M., Yusup, Y., Iqbal Faruque, M., Ahamad, F., Abd. Hamid, H., Aiyub, K., Md Ali, S., Khan, M., Abu Samah, A., Yusuff, I., Othman, M., Tengku Hassim, T., and Ezani, N.: Calibration Model of a Low-Cost Air Quality Sensor Using an Adaptive Neuro-Fuzzy Inference System, Sensors, 18, 4380, https://doi.org/10.3390/s18124380, 2018.
Alphasense Ltd: https://www.alphasense.com/wp-content/uploads/2022/09/Alphasense_OPC-N3_datasheet.pdf, last access: 12 October 2022.
Ardon-Dryer, K. and Kelley, M. C.: Particle size distribution and particulate matter concentrations during synoptic and convective dust events in West Texas, Atmos. Chem. Phys., 22, 9161–9173, https://doi.org/10.5194/acp-22-9161-2022, 2022.
Bächler, P., Szabadi, J., Meyer, J., and Dittler, A.: Simultaneous measurement of spatially resolved particle emissions in a pilot plant scale baghouse filter applying distributed low-cost particulate matter sensors, J. Aerosol Sci., 150, 105644, https://doi.org/10.1016/j.jaerosci.2020.105644, 2020.
Badura, M., Batog, P., Drzeniecka-Osiadacz, A., and Modzel, P.: Evaluation of low-cost sensors for ambient PM2.5 monitoring, J. Sens., 2018, 5096540, https://doi.org/10.1155/2018/5096540, 2018.
Bezantakos, S., Schmidt-Ott, F., and Biskos, G.: Performance evaluation of the cost-effective and lightweight Alphasense optical particle counter for use onboard unmanned aerial vehicles, Aerosol Sci. Tech., 52, 385–392, https://doi.org/10.1080/02786826.2017.1412394, 2018.
Bi, J., Wildani, A., Chang, H. H., and Liu, Y.: Incorporating Low-Cost Sensor Measurements into High-Resolution PM 2.5 Modeling at a Large Spatial Scale, Environ. Sci. Technol., 54, 2152–2162, https://doi.org/10.1021/acs.est.9b06046, 2020.
Bílek, J., Bílek, O., Maršolek, P., and Buček, P.: Ambient air quality measurement with low-cost optical and electrochemical sensors: An evaluation of continuous year-long operation, Environments – MDPI, 8, 114, https://doi.org/10.3390/environments8110114, 2021.
Bogan, M., Al, B., Kul, S., Zengin, S., Oktay, M., Sabak, M., Gümüşboğa, H., and Bayram, H.: The effects of desert dust storms, air pollution, and temperature on morbidity due to spontaneous abortions and toxemia of pregnancy: 5-year analysis, Int. J. Biometeorol., 65, 1733–1739, https://doi.org/10.1007/s00484-021-02127-8, 2021.
Bousiotis, D., Singh, A., Haugen, M., Beddows, D. C. S., Diez, S., Murphy, K. L., Edwards, P. M., Boies, A., Harrison, R. M., and Pope, F. D.: Assessing the sources of particles at an urban background site using both regulatory instruments and low-cost sensors – a comparative study, Atmos. Meas. Tech., 14, 4139–4155, https://doi.org/10.5194/amt-14-4139-2021, 2021.
Cai, H., Yang, Y., Luo, W., and Chen, Q.: City-level variations in aerosol optical properties and aerosol type identification derived from long-term MODIS/Aqua observations in the Sichuan Basin, China, Urban Clim., 38, 100886, https://doi.org/10.1016/j.uclim.2021.100886, 2021.
Caplin, A., Ghandehari, M., Lim, C., Glimcher, P., and Thurston, G.: Advancing environmental exposure assessment science to benefit society, Nat. Commun., 10, 1236, https://doi.org/10.1038/s41467-019-09155-4, 2019.
Caubel, J. J., Cados, T. E., Preble, C. v., and Kirchstetter, T. W.: A Distributed Network of 100 Black Carbon Sensors for 100 Days of Air Quality Monitoring in West Oakland, California, Environ. Sci. Technol., 53, 7564–7573, https://doi.org/10.1021/acs.est.9b00282, 2019.
Chakravarty, K., Vincent, V., Vellore, R., Srivastava, A. K., Rastogi, A., and Soni, V. K.: Revisiting Andhi in northern India: A case study of severe dust-storm over the urban megacity of New Delhi, Urban Clim., 37, 100825, https://doi.org/10.1016/j.uclim.2021.100825, 2021.
Chu, M. D. T., Gillooly, S. E., Levy, J. I., Vallarino, J., Reyna, L. N., Cedeño Laurent, J. G., Coull, B. A., and Adamkiewicz, G.: Real-time indoor PM2.5 monitoring in an urban cohort: Implications for exposure disparities and source control, Environ. Res., 193, 10561, https://doi.org/10.1016/j.envres.2020.110561, 2021.
Clifford, H. M., Spaulding, N. E., Kurbatov, A. V., More, A., Korotkikh, E. V., Sneed, S. B., Handley, M., Maasch, K. A., Loveluck, C. P., Chaplin, J., McCormick, M., and Mayewski, P. A.: A 2000 Year Saharan Dust Event Proxy Record from an Ice Core in the European Alps, J. Geophys. Res.-Atmos., 124, 12882–12900, https://doi.org/10.1029/2019JD030725, 2019.
Crilley, L. R., Shaw, M., Pound, R., Kramer, L. J., Price, R., Young, S., Lewis, A. C., and Pope, F. D.: Evaluation of a low-cost optical particle counter (Alphasense OPC-N2) for ambient air monitoring, Atmos. Meas. Tech., 11, 709–720, https://doi.org/10.5194/amt-11-709-2018, 2018.
Dastoorpoor, M., Idani, E., Goudarzi, G., and Khanjani, N.: Acute effects of air pollution on spontaneous abortion, premature delivery, and stillbirth in Ahvaz, Iran: a time-series study, Environ. Sci. Pollut. R., 25, 5447–5458, https://doi.org/10.1007/s11356-017-0692-9, 2018.
Diokhane, A. M., Jenkins, G. S., Manga, N., Drame, M. S., and Mbodji, B.: Linkages between observed, modeled Saharan dust loading and meningitis in Senegal during 2012 and 2013, Int. J. Biometeorol., 60, 557–575, https://doi.org/10.1007/s00484-015-1051-5, 2016.
Dubey, R., Patra, A. K., Joshi, J., Blankenberg, D., Kolluru, S. S. R., Madhu, B., and Raval, S.: Evaluation of low-cost particulate matter sensors OPC N2 and PM Nova for aerosol monitoring, Atmos. Pollut. Res., 13, 101335, https://doi.org/10.1016/j.apr.2022.101335, 2022a.
Dubey, R., Patra, A. K., Joshi, J., Blankenberg, D., and Nazneen: Evaluation of vertical and horizontal distribution of particulate matter near an urban roadway using an unmanned aerial vehicle, Sci. Total Environ., 836, 155600, https://doi.org/10.1016/j.scitotenv.2022.155600, 2022b.
Duvall, R. M., Hagler, G. S. W., Clements, A. L., Benedict, K., Barkjohn, K., Kilaru, V., Hanley, T., Watkins, N., Kaufman, A., Kamal, A., Reece, S., Fransioli, P., Gerboles, M., Gillerman, G., Habre, R., Hannigan, M., Ning, Z., Papapostolou, V., Pope, R., Quintana, P. J. E., and Lam Snyder, J.: Deliberating Performance Targets: Follow-on workshop discussing PM10, NO2, CO, and SO2 air sensor targets, Atmos. Environ., 246, 118099, https://doi.org/10.1016/j.atmosenv.2020.118099, 2021a.
Duvall, R. M., Clements, A., Hagler, G., Kamal, A., Kilaru, V., Goodman, L., Frederick, S., Johnson Barkjohn, K., VonWald, I., Greene, D., and Dye, T.: Performance Testing Protocols, Metrics, and Target Values for Fine Particulate Matter Air Sensors: Use in Ambient, Outdoor, Fixed Site, Non-Regulatory Supplemental and Informational Monitoring Applications, U.S. EPA Office of Research and Development, Washington, DC, EPA/600/R-20/280, 2021b.
EPA: https://www.epa.gov/outdoor-air-quality-data/interactive-map-air-quality-monitors, last access: 5 October 2022.
Feenstra, B., Papapostolou, V., Hasheminassab, S., Zhang, H., Boghossian, B. der, Cocker, D., and Polidori, A.: Performance evaluation of twelve low-cost PM2.5 sensors at an ambient air monitoring site, Atmos. Environ., 216, 116946, https://doi.org/10.1016/j.atmosenv.2019.116946, 2019.
Gomes, J., Esteves, H., and Rente, L.: Influence of an Extreme Saharan Dust Event on the Air Quality of the West Region of Portugal, Gases, 2, 74–84, https://doi.org/10.3390/gases2030005, 2022.
Goudie, A. S.: Desert dust and human health disorders, Environ. Int., 63, 101–113, https://doi.org/10.1016/j.envint.2013.10.011, 2014.
Hahnenberger, M. and Nicoll, K.: Meteorological characteristics of dust storm events in the eastern Great Basin of Utah, U.S.A., Atmos. Environ., 60, 601–612, https://doi.org/10.1016/J.ATMOSENV.2012.06.029, 2012.
Harr, L., Sinsel, T., Simon, H., Konter, O., Dreiseitl, D., Schulz, P., and Esper, J.: PM2.5 exposure differences between children and adults, Urban Clim., 44, 101198, https://doi.org/10.1016/j.uclim.2022.101198, 2022a.
Harr, L., Sinsel, T., Simon, H., and Esper, J.: Seasonal Changes in Urban PM2.5 Hotspots and Sources from Low-Cost Sensors, Atmosphere, 13, 694, https://doi.org/10.3390/atmos13050694, 2022b.
Hart, D.: BAM-1020 Detection Limit, Met One Technical Bulletin, Met One Instruments, Inc., https://metone.com/wp-content/uploads/2019/04/bam-1020_detection_limit.pdf (last access: 5 October 2022), 2013.
He, M., Kuerbanjiang, N., and Dhaniyala, S.: Performance characteristics of the low-cost Plantower PMS optical sensor, Aerosol Sci. Tech., 54, 232–241, https://doi.org/10.1080/02786826.2019.1696015, 2020.
Huang, J., Ji, M., Xie, Y., Wang, S., He, Y., and Ran, J.: Global semi-arid climate change over last 60 years, Clim. Dynam., 46, 1131–1150, https://doi.org/10.1007/s00382-015-2636-8, 2016.
Imami, A. D., Driejana, Villegas, E. R., and McFiggans, G.: Evaluation of Alphasense OPC-N2 sensor for PM10 measurement in the North Jakarta, ASEAN Engineering Journal, 12, 243–248, https://doi.org/10.11113/aej.V12.17853, 2022.
Jayaratne, E. R., Johnson, G. R., McGarry, P., Cheung, H. C., and Morawska, L.: Characteristics of airborne ultrafine and coarse particles during the Australian dust storm of 23 September 2009, Atmos. Environ., 45, 3996–4001, https://doi.org/10.1016/j.atmosenv.2011.04.059, 2011.
Jones, B. A.: After the Dust Settles: The Infant Health Impacts of Dust Storms, J. Assoc. Environ. Resour. Econ., 7, 1005–1032, https://doi.org/10.1086/710242, 2020.
Kaliszewski, M., Włodarski, M., Młyńczak, J., and Kopczyński, K.: Comparison of low-cost particulate matter sensors for indoor air monitoring during covid-19 lockdown, Sensors, 20, 1–17, https://doi.org/10.3390/s20247290, 2020.
Keet, C. A., Keller, J. P., and Peng, R. D.: Long-Term Coarse Particulate Matter Exposure Is Associated with Asthma among Children in Medicaid, Am. J. Respir. Crit. Care Med., 197, 737–746, https://doi.org/10.1164/rccm.201706-1267OC, 2018.
Kelly, K. and Kaur, K.: Dataset for: Performance evaluation of the Alphasense OPC-N3 and Plantower PMS5003 sensor in measuring dust events in the Salt Lake Valley, Utah, The Hive: University of Utah Research Data Repository [data set], https://doi.org/10.7278/S50d-xbns-3ge3, 2022.
Kelly, K. E., Xing, W. W., Sayahi, T., Mitchell, L., Becnel, T., Gaillardon, P.-E., Meyer, M., and Whitaker, R. T.: Community-Based Measurements Reveal Unseen Differences during Air Pollution Episodes, Environ. Sci. Technol., 55, 120–128, https://doi.org/10.1021/acs.est.0c02341, 2021.
Kosmopoulos, G., Salamalikis, V., Pandis, S. N., Yannopoulos, P., Bloutsos, A. A., and Kazantzidis, A.: Low-cost sensors for measuring airborne particulate matter: Field evaluation and calibration at a South-Eastern European site, Sci. Total Environ., 748, 141396, https://doi.org/10.1016/j.scitotenv.2020.141396, 2020.
Kumar, S., Singh, A., Srivastava, A. K., Sahu, S. K., Hooda, R. K., Dumka, U. C., and Pathak, V.: Long-term change in aerosol characteristics over Indo-Gangetic Basin: How significant is the impact of emerging anthropogenic activities?, Urban Clim., 38, 100880, https://doi.org/10.1016/j.uclim.2021.100880, 2021.
Kuula, J., Mäkelä, T., Aurela, M., Teinilä, K., Varjonen, S., González, Ó., and Timonen, H.: Laboratory evaluation of particle-size selectivity of optical low-cost particulate matter sensors, Atmos. Meas. Tech., 13, 2413–2423, https://doi.org/10.5194/amt-13-2413-2020, 2020.
Lim, C. C., Kim, H., Vilcassim, M. J. R., Thurston, G. D., Gordon, T., Chen, L.-C., Lee, K., Heimbinder, M., and Kim, S.-Y.: Mapping urban air quality using mobile sampling with low-cost sensors and machine learning in Seoul, South Korea, Environ. Int., 131, 105022, https://doi.org/10.1016/j.envint.2019.105022, 2019.
Liu, L., Duan, Y., Li, L., Xu, L., Yang, Y., and Cu, X.: Spatiotemporal trends of PM2.5 concentrations and typical regional pollutant transport during 2015–2018 in China, Urban Clim., 34, 100710, https://doi.org/10.1016/j.uclim.2020.100710, 2020.
Mallet, M., Tulet, P., Serça, D., Solmon, F., Dubovik, O., Pelon, J., Pont, V., and Thouron, O.: Impact of dust aerosols on the radiative budget, surface heat fluxes, heating rate profiles and convective activity over West Africa during March 2006, Atmos. Chem. Phys., 9, 7143–7160, https://doi.org/10.5194/acp-9-7143-2009, 2009.
Masic, A., Bibic, D., Pikula, B., Blazevic, A., Huremovic, J., and Zero, S.: Evaluation of optical particulate matter sensors under realistic conditions of strong and mild urban pollution, Atmos. Meas. Tech., 13, 6427–6443, https://doi.org/10.5194/amt-13-6427-2020, 2020.
Mei, H., Han, P., Wang, Y., Zeng, N., Liu, D., Cai, Q., Deng, Z., Wang, Y., Pan, Y., and Tang, X.: Field evaluation of low-cost particulate matter sensors in Beijing, Sensors, 20, 1–17, https://doi.org/10.3390/s20164381, 2020.
Mohd Nadzir, M. S., Ooi, M. C. G., Alhasa, K. M., Bakar, M. A. A., Mohtar, A. A. A., Nor, M. F. F. M., Latif, M. T., Hamid, H. H. A., Ali, S. H. M., Ariff, N. M., Anuar, J., Ahamad, F., Azhari, A., Hanif, N. M., Subhi, M. A., Othman, M., and Nor, M. Z. M.: The Impact of Movement Control Order (MCO) during Pandemic COVID-19 on Local Air Quality in an Urban Area of Klang Valley, Malaysia, Aerosol Air Qual. Res., 20, 1237–1248, https://doi.org/10.4209/aaqr.2020.04.0163, 2020.
Mukherjee, A., Stanton, L. G., Graham, A. R., and Roberts, P. T.: Assessing the utility of low-cost particulate matter sensors over a 12-week period in the Cuyama valley of California, Sensors, 17, 1805, https://doi.org/10.3390/s17081805, 2017.
Nor, N. S. M., Yip, C. W., Ibrahim, N., Jaafar, M. H., Rashid, Z. Z., Mustafa, N., Hamid, H. H. A., Chandru, K., Latif, M. T., Saw, P. E., Lin, C. Y., Alhasa, K. M., Hashim, J. H., and Nadzir, M. S. M.: Particulate matter (PM2.5) as a potential SARS-CoV-2 carrier, Sci. Rep., 11, 2508, https://doi.org/10.1038/s41598-021-81935-9, 2021.
Ouimette, J. R., Malm, W. C., Schichtel, B. A., Sheridan, P. J., Andrews, E., Ogren, J. A., and Arnott, W. P.: Evaluating the PurpleAir monitor as an aerosol light scattering instrument, Atmos. Meas. Tech., 15, 655–676, https://doi.org/10.5194/amt-15-655-2022, 2022.
Perry, K. D., Crosman, E. T., and Hoch, S. W.: Results of the Great Salt Lake Dust Plume Study (2016–2018), University of Utah, 1–305, 2033148, https://collections.lib.utah.edu/ark:/87278/s6qw8qhv (last access: 12 October 2022), 2019.
Pope, F. D., Gatari, M., Ng'ang'a, D., Poynter, A., and Blake, R.: Airborne particulate matter monitoring in Kenya using calibrated low-cost sensors, Atmos. Chem. Phys., 18, 15403–15418, https://doi.org/10.5194/acp-18-15403-2018, 2018.
Runström Eden, G., Tinnerberg, H., Rosell, L., Möller, R., Almstrand, A. C., and Bredberg, A.: Exploring Methods for Surveillance of Occupational Exposure from Additive Manufacturing in Four Different Industrial Facilities, Ann. Work. Expo. Health, 66, 163–177, https://doi.org/10.1093/annweh/wxab070, 2022.
Samad, A., Mimiaga, F. E. M., Laquai, B., and Vogt, U.: Investigating a low-cost dryer designed for low-cost PM sensors measuring ambient air quality, Sensors, 21, 1–18, https://doi.org/10.3390/s21030804, 2021.
Sayahi, T., Butterfield, A., and Kelly, K. E.: Long-term field evaluation of the Plantower PMS low-cost particulate matter sensors, Environ. Pollut., 245, 932–940, https://doi.org/10.1016/j.envpol.2018.11.065, 2019.
Schweitzer, M. D., Calzadilla, A. S., Salamo, O., Sharifi, A., Kumar, N., Holt, G., Campos, M., and Mirsaeidi, M.: Lung health in era of climate change and dust storms, Environ. Res., 163, 36–42, https://doi.org/10.1016/j.envres.2018.02.001, 2018.
Sousan, S., Koehler, K., Hallett, L., and Peters, T. M.: Evaluation of the Alphasense optical particle counter (OPC-N2) and the Grimm portable aerosol spectrometer (PAS-1.108), Aerosol Sci. Tech., 50, 1352–1365, https://doi.org/10.1080/02786826.2016.1232859, 2016.
Sousan, S., Regmi, S., and Park, Y. M.: Laboratory evaluation of low-cost optical particle counters for environmental and occupational exposures, Sensors, 21, 4146, https://doi.org/10.3390/s21124146, 2021.
Soy, F. K.: The effects of dust storms on quality of life of allergic patients with or without asthma, The Turkish Journal of Ear Nose and Throat, 26, 19–27, https://doi.org/10.5606/kbbihtisas.2016.56254, 2016.
Speranza, A., Caggiano, R., Margiotta, S., and Trippetta, S.: A novel approach to comparing simultaneous size-segregated particulate matter (PM) concentration ratios by means of a dedicated triangular diagram using the Agri Valley PM measurements as an example, Nat. Hazards Earth Syst. Sci., 14, 2727–2733, https://doi.org/10.5194/nhess-14-2727-2014, 2014.
Sugimoto, N., Shimizu, A., Matsui, I., and Nishikawa, M.: A method for estimating the fraction of mineral dust in particulate matter using PM2.5-to-PM10 ratios, Particuology, 28, 114–120, https://doi.org/10.1016/j.partic.2015.09.005, 2016.
Tagle, M., Rojas, F., Reyes, F., Vásquez, Y., Hallgren, F., Lindén, J., Kolev, D., Watne, Å. K., and Oyola, P.: Field performance of a low-cost sensor in the monitoring of particulate matter in Santiago, Chile, Environ. Monit. Assess., 192, 171, https://doi.org/10.1007/s10661-020-8118-4, 2020.
Tam, W. W. S., Wong, T. W., Wong, A. H. S., and Hui, D. S. C.: Effect of dust storm events on daily emergency admissions for respiratory diseases, Respirology, 17, 143–148, https://doi.org/10.1111/j.1440-1843.2011.02056.x, 2012.
Tong, D. Q., Wang, J. X. L., Gill, T. E., Lei, H., and Wang, B.: Intensified dust storm activity and Valley fever infection in the southwestern United States, Geophys. Res. Lett., 44, 4304–4312, https://doi.org/10.1002/2017GL073524, 2017.
Trianti, S.-M., Samoli, E., Rodopoulou, S., Katsouyanni, K., Papiris, S. A., and Karakatsani, A.: Desert dust outbreaks and respiratory morbidity in Athens, Greece, Environ. Health, 16, 72, https://doi.org/10.1186/s12940-017-0281-x, 2017.
Tryner, J., Mehaffy, J., Miller-Lionberg, D., and Volckens, J.: Effects of aerosol type and simulated aging on performance of low-cost PM sensors, J. Aerosol Sci., 150, 105654, https://doi.org/10.1016/j.jaerosci.2020.105654, 2020.
US EPA: https://aqs.epa.gov/aqsweb/airdata/download_files.html, last access: 4 October 2022.
Vogt, M., Schneider, P., Castell, N., and Hamer, P.: Assessment of low-cost particulate matter sensor systems against optical and gravimetric methods in a field co-location in norway, Atmosphere, 12, 961, https://doi.org/10.3390/atmos12080961, 2021.
WHO: https://www.who.int/news-room/fact-sheets/detail/ambient-(outdoor)-air-quality-and-health, last access: 5 October 2022.
Williams, A. P., Cook, B. I., and Smerdon, J. E.: Rapid intensification of the emerging southwestern North American megadrought in 2020–2021, Nat. Clim. Chang., 12, 232–234, https://doi.org/10.1038/s41558-022-01290-z, 2022.
Xu, G., Jiao, L., Zhang, B., Zhao, S., Yuan, M., Gu, Y., Liu, J., and Tang, X.: Spatial and temporal variability of the PM2.5 PM10 ratio in Wuhan, Central China, Aerosol Air Qual. Res., 17, 741–751, https://doi.org/10.4209/aaqr.2016.09.0406, 2017.