the Creative Commons Attribution 4.0 License.
the Creative Commons Attribution 4.0 License.
 | 02 Jun 2023
The four-wavelength Photoacoustic Aerosol Absorption Spectrometer (PAAS-4λ)
Franz Martin Schnaiter
Claudia Linke
Eija Asmi
Henri Servomaa
Antti-Pekka Hyvärinen
Sho Ohata
Yutaka Kondo
Emma Järvinen
In this paper, the Photoacoustic Aerosol Absorption Spectrometer (PAAS-4λ) is introduced. PAAS-4λ was specifically developed for long-term monitoring tasks in (unattended) air quality stations. It uses four wavelengths coupled to a single acoustic resonator in a compact and robust set-up. The instrument has been thoroughly characterized and carefully calibrated in the laboratory using NO2/air mixtures and Nigrosin aerosol. It has an ultimate 1σ detection limit below 0.1 Mm−1, at a measurement precision and accuracy of 3 % and 10 %, respectively. In order to demonstrate the PAAS-4λ suitability for long-term monitoring tasks, the instrument is currently validated at the air quality monitoring station Pallas in Finland, about 140 km north of the Arctic circle. A total of 11 months of PAAS-4λ data from this deployment are presented and discussed in terms of instrument performance. Intercomparisons with the filter-based photometers of a continuous soot monitoring system (COSMOS), the Multi-Angle Absorption Photometer (MAAP), and Aethalometer (AE33) demonstrate the capabilities and value of PAAS-4λ, as well as for the validation of the widely used filter-based instruments.
- Article
(4644 KB) - Full-text XML
-
Supplement
(10417 KB) - BibTeX
- EndNote


Black carbon (BC) particles from combustion emissions (i.e. soot) are commonly monitored by filter-based methods like Aethalometers. In these methods, the ambient air is sampled through quartz fibre filters, where aerosol particles are deposited in the filter matrix. The attenuation of light by absorption from dark particles embedded in the filter is then continuously measured by light transmission through the filter while the aerosol is sampled. The correlation between the measured attenuation coefficient bATN of the filter-embedded particles to the absorption coefficient babs of the particles in airborne state is derived from specific calibration procedures (Weingartner et al., 2003). A fundamental problem with such filter-based methods is that the filter matrix also interacts with the light through multiple light scattering, which increases the light path within the filter matrix by an unknown factor. As a consequence, the light-absorbing particles deposited in the filter matrix are participating in the light absorption process many times, which results in an increase in bATN with respect to babs. The light attenuation by the particle-loaded filter is further affected by the number of particles deposited in the filter matrix, in addition to their optical properties by the so-called loading or shadowing effect. Here, the accumulated particle mass (typically on one side of the filter) can result in a total blocking of light portions, so that particle mass located deeper in the filter receives relatively less light. This leads, in general, to a decrease in bATN with respect to babs. However, this effect might be partially counterbalanced by any light-scattering particle mass that is co-deposited in the filter matrix. Therefore, the raw attenuation measurements have to be corrected for the above effects by introducing the correction factors C and R(ATN) for the multiple-scattering and loading effect, respectively (Weingartner et al., 2003).
There are many studies investigating these effects and providing correction schemes for C and R(ATN). For example, the recent study by Luoma et al. (2021) compared different correction algorithms based on a multi-year data set from a boreal forest site in Finland. The general result of this study is that the multiple-scattering correction factor Cref for the Aethalometer® AE31 (Aerosol Magee Scientific, USA) varies between 3.09 and 3.34 (median value) among the different correction schemes but with a total variability between 2.23 and 4.26 (5th and 95th percentiles). Thus, uncertainties of nearly 100 % can occur in hourly averaged data most likely depending on the actual variability in aerosol composition, size, and concentration (i.e. pollution level). The term Cref indicates that the C value was deduced by using the babs measurements from a colocated Multi-Angle Absorption Photometer (MAAP; Thermo Fisher Scientific, USA, model 5012, discontinued) as reference. It has to be noted that the MAAP also represents a filter-based method but consists of a separate measurement of the diffuse light scattering from the particle-loaded filter matrix (Petzold and Schönlinner, 2004), which has been proven to be less prone to filter-induced artefacts even under high aerosol light-scattering contributions (e.g. Schnaiter et al., 2005). The finding of highly variable C values at the Finnish boreal site is supported by reported Cref factors from different locations that indicate higher C values for sites that are influenced by higher pollution levels (Collaud Coen et al., 2010). Furthermore, Luoma et al. (2021) concluded that the correction factors C and R(ATN) are most likely also wavelength dependent to an unknown extent. This has consequences for the reliability of the deduced wavelength dependence of babs, i.e. the absorption Ångström exponent (AAE), which is frequently used to perform a source apportionment of the aerosol in terms of fossil fuel combustion (e.g. Kirchstetter et al., 2004), mineral dust (e.g. Petzold et al., 2009), or biomass burning sources (e.g. Sandradewi et al., 2008). In order to deduce the spectral absorption coefficient babs(λ) more reliably, and independent of the level and type of pollution, non-intrusive methods like photoacoustic spectroscopy (PAS) or photo-thermal interferometry (e.g. Visser et al., 2020) have to be applied (Moosmüller et al., 2009). Having such instruments with sufficient robustness, stability, and sensitivity available also for a long-term deployments at (remote) field sites would be ideal, not only for highly accurate measurements of babs and AAE but also for further investigations of the above uncertainties in the filter-based instruments that are the most commonly applied for long-term measurements at different sites (Luoma et al., 2021).
PAS for aerosol research has been greatly improved within the last decade, mainly as a consequence of large development steps in laser technology. Several PAS instruments have been developed in different research labs that show low detection levels and measure at several wavelengths (Lewis et al., 2008; Ajtai et al., 2010; Haisch et al., 2012; Lack et al., 2012; Sharma et al., 2013; Linke et al., 2016; Fischer and Smith, 2018; Foster et al., 2019). Instruments that comprise several wavelengths coupled to a single acoustic resonator are the most promising concepts in terms of future operations in air monitoring stations. Up to now, these state-of-the-art instruments have mainly been used in lab studies or in dedicated field projects but never in remote monitoring stations. The reasons might be that these instruments still need considerable maintenance to keep them operational or are tied to specific research projects. A commercial three-wavelength PAS instrument became available by the beginning of the 2010s (PASS-3; Droplet Measurement Technologies, USA) that was an extension of the two-wavelength prototype versions originally developed at the Desert Research Institute, Reno, USA (Lewis et al., 2008). However, this instrument was discontinued later.
In this paper, the four-wavelength Photoacoustic Aerosol Absorption Spectrometer (PAAS-4λ) is introduced. The PAAS-4λ is based on a prototype version developed at KIT (Linke et al., 2016) but has been significantly improved in size, sensitivity, stability, and operability through the research spin-off company schnaiTEC GmbH. Recently, schnaiTEC GmbH has started to market the PAAS-4λ with the goal of making this state-of-the-art PAS technology available for laboratory research, air quality studies, and long-term monitoring tasks at remote air quality stations. To reach these goals, the PAAS-4λ instrument is currently operated at the Finnish air quality monitoring station Pallas, which is located about 140 km north of the Arctic circle. Data from this deployment are shown here to demonstrate the PAAS-4λ functionality in this target operational environment. The design and operation principle of PAAS-4λ is presented in Sect. 2, followed by a description of the instrument characterization and calibration procedures in Sect. 3. Measurement examples from the long-term deployment at the Pallas remote field site are presented and discussed in Sect. 4. A summary and an outlook is given in Sect. 5.
The fundamental operational principle of photoacoustic (PA) systems for gas and aerosol detection, including PA cell design considerations, is reviewed elsewhere (Rosencwaig, 1980; Miklós et al., 2001; Bozóki et al., 2011; Haisch, 2012). Here only those aspects of the PA theory and instrument design that are relevant for the PAAS-4λ are described. The PA signal is generated in an aerosol-containing, light-absorbing particulate matter compound by illuminating the aerosol by means of a modulated incident (laser) light with a modulation frequency of fm. By absorbing the light in the on phase of the modulation, the light-absorbing (dark) particles heat up, while the non-absorbing (white) particles do not. In the subsequent off phase of the modulation, the deposited heat is released to the surrounding gas, resulting in a local pressure change. As the incident light is continuously modulated, the induced pressure fluctuations are also periodic, resulting in a sound wave with frequency fm that is expanding in the aerosol. If the PA signal generation is conducted in an acoustic resonator, and if the modulation frequency of the incident light is tuned to one of the acoustic modes of this resonator, then the sound wave is amplified. A sensitive microphone attached to the PA cell then detects and converts the sound pressure to a voltage. The generated PA signal can be expressed as follows (Ajtai et al., 2010; Bozóki et al., 2011):
with S being the PA signal (in V), P0 the Fourier component of the incident light power (in W), M the sensitivity of the microphone (in V Pa−1), Ccell the PA cell constant (in Pa m W−1), σabs the absorption cross section of the particles (in m2), c the number concentration of the absorbing particles (in m−3), and Ab the background signal (in Pa W−1). As the aerosol is, in general, composed of different absorbing particle species with different absorption cross sections σabs, the term σabs⋅c in Eq. (1) is replaced by babs, which is the total absorption coefficient of the aerosol (in m−1). Hence, the physical quantity measured by PAAS-4λ is the absorption coefficient babs.
Following the above operation principle, a photoacoustic spectrometer (PAS) basically consists of (i) modulated lasers, (ii) a photoacoustic cell equipped with microphone and laser power measurement, and (iii) electronics for control and signal filtering. These components are presented in more detail in the following sections for the PAAS-4λ system.
2.1 Optics unit
The optics unit of PAAS-4λ hosts the lasers, the photoacoustic cell, and the laser power meter (Fig. 1). These components are set up on a 13 mm thick aluminium base plate with a 380 mm × 380 mm edge length. The optics base plate is supported by four 1.5 in (3.81 cm) diameter stainless steel posts each equipped with a 1 in (2.54 cm) thick Sorbothane foot (AV5; Thorlabs Inc., USA) for passive vibration insulation. A 462 mm × 422 mm × 200 mm () birch plywood housing with 13 mm panel thickness hosts the optics set-up. The housing is equipped with a laser interlock switch and, thus, represents a class 1 laser enclosure for eye- and skin-safe routine operation without any laser safety precautions necessary at the deployment site. Two ventilators implemented in the front panel in conjunction with a passive heat sink underneath the optics base plate ensure sufficient release of the heat dissipated by the lasers into the base plate. This results in stable thermal conditions inside the optics unit with an equilibrium temperature of about 30 ∘C.
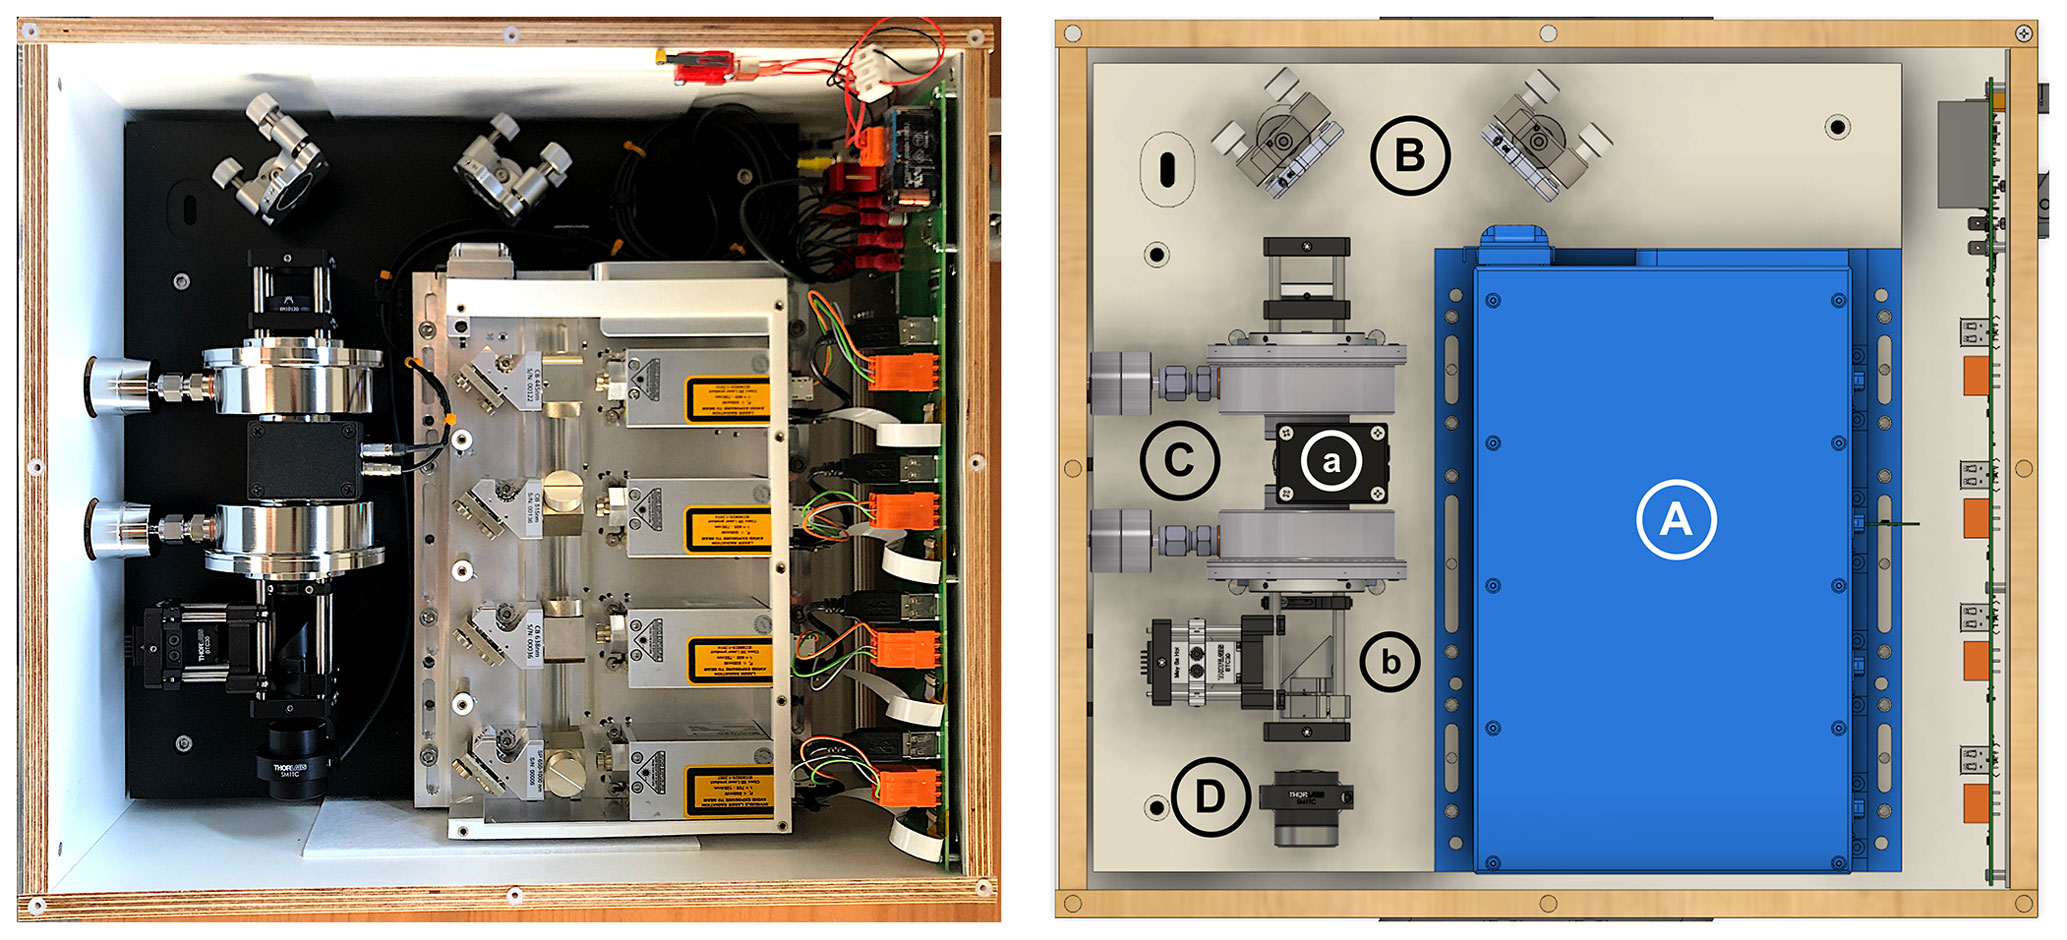
Figure 1The optics unit of PAAS-4λ. On the left is a photo with the laser combiner lid opened. In this set-up, the laser combiner hosts four lasers. On the right is a design model with the labels of the main components, namely the laser combiner (A), beam steering mirrors (B), a PA cell (C) with a microphone unit (a) and beam splitter optics (b), and laser power meter (D).
2.1.1 Laser system
The lasers are implemented in a beam combiner that can host up to four lasers (LightHUB®-4; Omicron-Laserage Laserprodukte GmbH, Rodgau-Dudenhofen, Germany). Diode lasers with different emission wavelengths are used in the laser combiner according to the user needs (LuxX+®; Omicron-Laserage Laserprodukte GmbH, Rodgau-Dudenhofen, Germany). The wavelength range that can be covered by these lasers is from 375 nm in the near-UV to 1550 nm in the near-infrared (IR). The lasers can be digitally modulated over a wide frequency range up to 250 MHz; they have a circular Gaussian beam profile with a specified () diameter of 1.25±0.25 mm, a beam ellipticity of better than 1.1 : 1.0, a vertical polarization ratio of > 100 : 1, and a long-term power stability below 0.5 % over 8 h. The laser diode is temperature stabilized to 25 ∘C by a Peltier device dissipating heat to the base plate of approximately 5 to 10 W. Each individual laser in the LightHUB® consists of a beam shifter and a beam combiner. The beam combiners are equipped with specific dichroic filters according to the actual laser wavelengths that are used in the system. The LightHUB® optics allows a stable alignment of the up to four laser beams on a single optical axis. Two beam steering mirrors with broadband anti-reflection coating (e.g. BB1-E02, Thorlabs Inc., USA, for the 400 to 750 nm wavelength range) are used to overlap the combined laser beam with the optical axis of the PA cell. These mirrors are aligned with two Polaris® low-drift kinematic mounts (POLARIS-K1; Thorlabs Inc., USA), which provide excellent long-term alignment stability of less than 2 µrad after a thermal cycling of 12 ∘C.
2.1.2 Photoacoustic cell
Figure 2 shows a cross section of the photoacoustic cell of the PAAS-4λ system. The PA cell basically represents a resonant longitudinal open acoustic cavity. The cavity comprises a tube of 6.5 mm diameter and 49 mm length that is drilled in a 16 mm diameter cylindrical stainless-steel body. The tube walls are polished to a residual roughness of less than Ra=0.6 µm. The cavity consists of a 4 mm diameter hole positioned at the half length of the tube; i.e. at the position of the anti-node of the fundamental longitudinal mode that will host the microphone duct of 1.35 mm diameter. The cavity has the following longitudinal acoustic modes:
where l is the length of the cavity and c the speed of sound. The term Δl has to be added to each open cavity end to take into account the mismatch between the one-dimensional field inside the cavity and the three-dimensional field outside (Miklós et al., 2001). The PAAS-4λ acoustic resonator thus has a nominal frequency of f1=3240 Hz, assuming a speed of sound of c=343 m s−1 (at 20 ∘C), a cavity length of l=49 mm, and an end correction length Δl≈0.61r, with r=3.25 mm as the cavity radius. Note from Eq. (2) that f1 depends on the temperature of the air inside the cavity, since the speed of sound is mainly temperature dependent. This gives a frequency shift of about 6 Hz ∘C−1, which has to be taken into account when operating the PAAS-4λ system under rough thermal conditions, where the temperature inside the optics unit is unstable and varies by more than 5 to 10 ∘C. See Fig. S4 in the Supplement for a frequency scan of the fundamental longitudinal mode f1 of the PA cell.
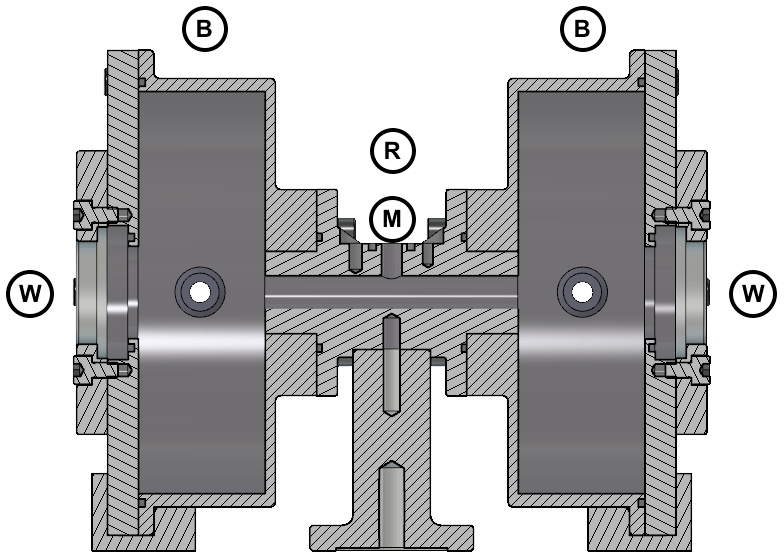
Figure 2The photoacoustic cell of PAAS-4λ with the following main components: acoustic resonator (R), acoustic buffers (B), and laser entrance and exit windows (W). The position of the microphone (not shown) is indicated by (M).
The 6.5 mm diameter acoustic cavity is steplessly expanded to 78 mm diameter at both ends, where two acoustic buffers are mounted (Fig. 2). These buffers comprise the aerosol inlet and outlet ports in addition to the laser entrance and exit windows (WL11050, Thorlabs Inc., USA) that complete the PA cell. The buffers are used to simulate open cavity end conditions and to suppress ambient acoustic noise around the cavity resonance frequency (Bozóki et al., 2011). Further acoustic buffers are connected to the inlet and outlet aerosol flow ports (located next to the C label in Fig. 1) to suppress acoustic noise in the flow system (e.g. generated by a turbulent flow or by the pump system).
The cell constant in Eq. (1) can be calculated from the specifications of the acoustic resonator (Bozóki et al., 2011).
with γ being the ratio of specific heat constants, fm the modulation frequency (in Hz) that is adapted to the resonance frequency f1 of the cavity, Ares the cross-sectional area of the resonator (in m2), Q the quality factor of the excited acoustic mode, and G the so-called geometric factor that describes the spatial overlap between the laser beam and the acoustic eigenmode of the resonator. For a well-designed PA cell, the geometric factor is close to unity. With the resonator diameter of m, the fundamental longitudinal mode frequency of f1=3240 Hz, and the resonator quality factor of Q=21, a cell constant of Ccell=12.4 Pa m W−1 results. The used microphone (Knowles; model EK-3029) has a manufacturer-specified sensitivity at the frequency f1=3240 Hz of about −50 dB (relative to 1.0 V/0.1 Pa), which corresponds to a microphone sensitivity M=0.032 V Pa−1. Taking into account the microphone preamplifier gain of about 580 and the lock-in amplifier gain of 30 (typically used in the calibration procedure), a cell constant of about Ccell=6900 V m W−1 is calculated for the PAAS-4λ cell. Here it has to be noted that the actual values of the microphone sensitivity M, the microphone preamplifier gain, and the quality factor Q, as well as the geometric overlap factor G, can significantly vary from unit to unit and, therefore, a characterization and calibration procedure is required to deduce the cell constant more reliably for the actual unit (see Sect. 3.1).
The laser power P0 of the modulated laser is measured behind the PA cell exit window with a photodiode power sensor (S121C; Thorlabs Inc., USA). As it turned out that backscattered light from the diffusing element of the S121C sensor is producing a measurable increase in the PA signal background, beam splitting optics is implemented in the exit laser path consisting of an iris and a 7 : 30 (R:T) beam splitter plate (BST10; Thorlabs Inc., USA) that is reflecting approximately 80 % to 90 % of the laser beam power into a beam dump (BTC30; Thorlabs Inc., USA). In this way, the diffuse backscattering is efficiently suppressed.
2.2 Electronics unit
The electronics unit of PAAS-4λ is implemented in a 19 in (48.26 cm) rack enclosure (INS 48680-L; Bopla Gehäuse Systeme GmbH, Germany) with a height of 310 mm, a width of 449 mm, and a depth of 495.5 mm as part of the three-unit modular instrument set-up (see Fig. S1 in the Supplement for a photograph of the complete system). The unit comprises the following three major components (Fig. S2): the embedded real-time controller (cRIO-9063; National Instruments Corp., USA), the dual-phase lock-in amplifier (LIA-MVD-200-L; FEMTO Messtechnik GmbH, Germany), and the touchscreen panel computer (Panelmaster 0881; ICO Innovative Computer GmbH, Germany). The embedded controller hosts four interface modules, namely two digital input/output (I/O) boards (NI-9402) to provide the laser modulation and the lock-in reference frequency signals, one analogue input board (NI-9205) to acquire the lock-in amplifier output voltages in addition to the output from the temperature and humidity sensor, and a relay board (NI-9485) to provide switches for controlling peripheral equipment like the zero-air filter bypass that is implemented in a separate flow unit (Fig. S1). The FPGA module of the cRIO-9063, in conjunction with one of the two digital I/O boards, is used as a four-channel transistor–transistor logic (TTL) frequency generator with user-adjustable frequency and duty cycle that drives the modulation of the lasers. This frequency generator is implemented with a bandwidth of 40 MHz, which gives a resolution of 1 Hz at the modulation frequency. The modulation frequency of the lasers can be independently set, which allows a simultaneous operation of all lasers at different frequencies and duty cycles. However, as the current set-up hosts only one lock-in amplifier, the lasers are usually operated in a sequential measurement procedure with the same frequency and duty cycle. A simultaneous measurement procedure with slightly different laser frequencies is possible in future set-ups that host separate lock-in amplifiers for each individual laser.
The pre-amplified microphone signal is analysed by a dual-phase lock-in amplifier using the TTL laser modulation signal as reference. The lock-in amplifier converts (demodulates) the alternating current (AC) signal from the microphone to an amplified direct current (DC) signal at the output, while effectively suppressing the noise with a bandwidth-adjustable low-pass filter. The LIA-MVD-200-L lock-in amplifier has the three different modes of operation, including “high dynamic reserve”, “low drift”, and “ultra stable”. We use the ultra-stable mode in the PAAS-4λ, as this provides an excellent low-drift output signal, with a DC drift of only 5 ppm K−1 at a still-sufficient dynamic reserve of 15 dB. The PAAS pre-amplified background signal is typically of the order of 100 µV, with a noise level of about 10 mV rms (see Fig. S3). Even at this relatively high noise level, lock-in gain settings up to 3000 are within the dynamic reserve of the ultra-stable mode without overloading the amplifier. The time constant of the low-pass filter is set to 1 or 3 s for typical long-term measurements, where the PAAS signal is averaged over several minutes. The 3 dB bandwidth of the low-pass filter is very narrow, with 0.16 or 0.05 Hz for a time constant of 1 or 3 s, respectively. To further improve the noise suppression, a second-order low-pass filter with a roll-off slope of −12 dB per octave is applied in the PAAS-4λ lock-in amplifier.
The electronics unit comprises a touchscreen panel computer for experiment control, data acquisition, and data storage. A graphical user interface (GUI) was designed in LabVIEW (National Instruments Corp., USA) that fits to the 800 × 600 pixel-resolution touchscreen and that can be controlled without keyboard and mouse. One part of the PAAS LabVIEW software package is installed on the cRIO-9063 real-time controller that is feeding the FPGA with the frequency generator code. Furthermore, this cRIO application acts as middleware between the FPGA (connected to the digital output boards), the analogue input board, and the relay board of the cRIO's embedded system and the GUI application of the panel computer. In this way, the time-critical tasks of modulation frequency generation and data acquisition are autonomously running on the real-time embedded system, which is separated from the Windows GUI application on the panel computer. Measurement data are then simply requested from the cRIO application, according to the presets given by the user through the GUI application. The basic concept of the GUI application is to autonomously operate the PAAS-4λ through predefined measurement sequences. A script-based sequence language has been specifically developed that provides the sequence steps (“Laser”, “Measure”, “Relay”, “Repeat”, “Scan”, and “Wait”), which can be arbitrarily combined and arranged in a measurement sequence by the user. Each sequence step has a set of keys that defines the measurement or control tasks that need to be conducted within the step. The Measure step, for example, has the keys to the “NumberOfPoints” and “DistanceBetweenPoints[timeConst]”, which define how many samples (points) are averaged for a stored measurement and at what time difference these samples are taken. Here, the time difference is defined as the integer multiples of the lock-in amplifier time constant because the low-pass filter conducts exponential moving average in the time domain. The Scan step allows the autonomous performance of a frequency scan at predefined times (e.g. to correct the cell resonance frequency for temperature drifts). With the Relay step, the user has access to the relay board and, thus, can implement peripheral equipment into the measurement sequence. This is primarily used for purging filtered air in background measurement cycles but controlling, for example, inlet switches, denuder bypasses, or calibration gas provisions is also possible. This concept of predefined measurement sequences is an important prerequisite for any unattended long-term deployment of PAAS-4λ.
3.1 Calibration
The PAAS-4λ is calibrated using premixed NO2/synthetic air calibration gas bottles (Air Liquide Deutschland GmbH; CRYSTAL gas mixture, with 2σ maximum relative uncertainty of ±5 %). Different concentrations are used here, with nominal volume mixing ratios of 200, 1000, and 5000 ppb (parts per billion). NO2 is widely used as a calibration gas for aerosol PAS applications (e.g. Arnott et al., 2000; Fischer and Smith, 2018) because the molecular absorption cross section is well known (Vandaele et al., 2002). However, as the NO2 spectrum is strongly varying across the visible spectrum, the calibration requires the knowledge of the NO2 absorption cross section that is relevant to the specific PAAS-4λ laser emission line. Therefore, each laser unit's emission spectrum is evaluated using a compact Czerny-Turner charge coupled device (CCD) spectrometer (CCS100/M, Thorlabs Inc., USA), with a spectral accuracy better than 0.5 nm within the 350 to 700 nm spectral range, before being installed into PAAS-4λ. Figure 3 shows an example of the emission spectrum measured for a PAAS-4λ LuxX®+ laser unit, with a nominal emission wavelength of 515 nm. The high-resolution molecular absorption cross section of NO2, shown in blue in Fig. 3, has a significant variation from about 1.2 to cm2 molec.−1 in a 10 nm spectral window around the actual laser emission. The measured laser emission spectrum is therefore mathematically convolved with the molecular NO2 absorption cross section to deduce the laser-specific absorption cross section. In this example, a systematic bias of about 40 % is generated in the calibration when using the manufacturer's nominal emission wavelength, i.e. 515 nm, instead of the measured emission wavelength spectrum of the laser unit. The emission spectra measured for the 405 and 660 nm lasers of the corresponding PAAS-4λ unit are given in the Supplement (Fig. S5), together with the emission spectra measured for another PAAS-4λ unit.
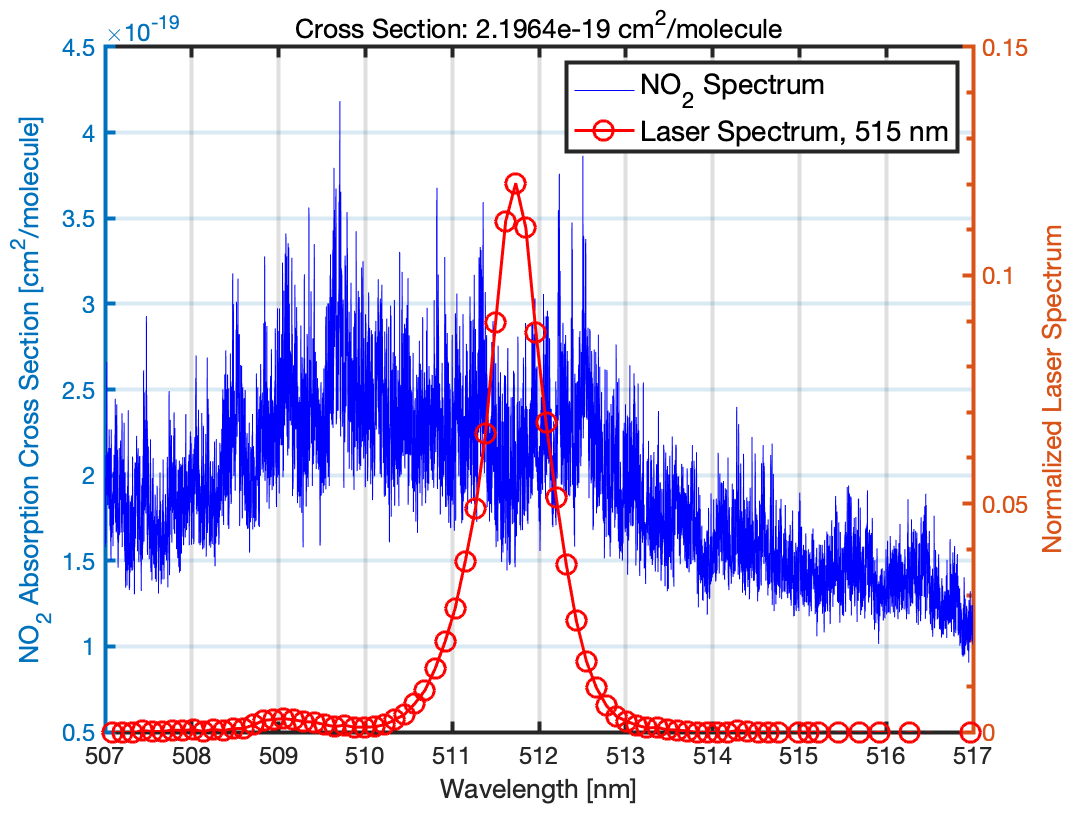
Figure 3Normalized laser emission spectrum of the 515 nm LuxX®+ laser implemented in the PAAS-4λ-02-005 unit (red). The high-resolution NO2 molecular absorption cross section from Vandaele et al. (2002) is depicted in blue. A laser-specific absorption cross section of cm2 molec.−1 is deduced from the convolution of both spectra.
In the calibration procedure, premixed calibration gas is diluted step-wise with synthetic air by mixing the two gas flows in a specifically designed turbulent mixing chamber. The total flow is always set to 5 SLPM using two mass flow controllers. From this NO2/synthetic airflow, PAAS-4λ is sampling with 1 SLPM. The calibration procedure always starts with the undiluted premixed bottle concentration to bring the cell surfaces into equilibrium with the calibration gas (Fig. S6). The bottle NO2 mixing ratio is then measured in five dilution steps (1 : 5, 2 : 5, 3 : 5, 4 : 5) and also undiluted (5 : 5). At each dilution, step the instrument measures 4 × 20 s periods of the lock-in R output for each laser in a cycle, with 10 s waiting time after each laser switch. The individual measurements per dilution step are then averaged and corrected for the background signal from pure synthetic air that is measured before and after the calibration procedure. With the above initial bottle gas concentrations, this calibration procedure spans a NO2 mixing ratio from 200 to 5000 ppb, which corresponds to more than 3 orders of magnitude in the NO2 absorption coefficient, which is from about m−1 at a wavelength of 660 nm to m−1 at a wavelength of 405 nm, respectively. Figure 4 clearly demonstrates that the PA cell is represented by a single calibration constant, which in turn means that the individual laser beams are well aligned to one axis and that their beam profiles are similar; otherwise, the geometric overlap factor G of Eq. (3) would be different for the different lasers.
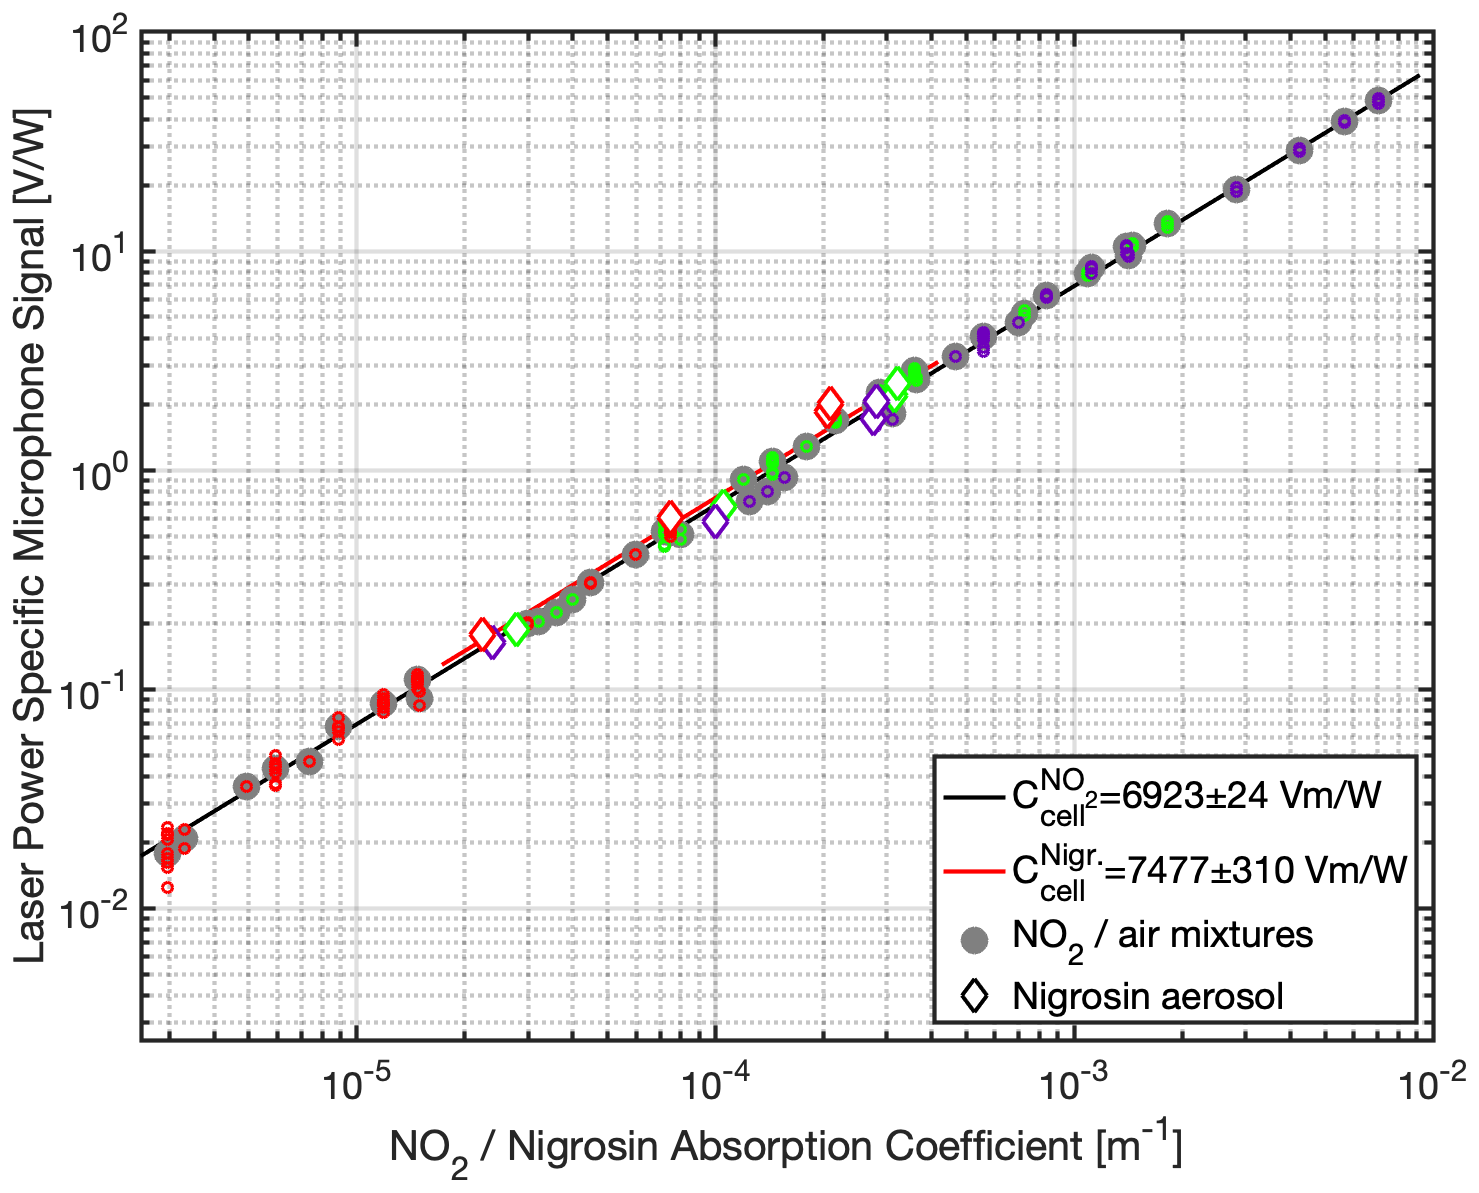
Figure 4Calibration of a PAAS-4λ unit (SN PAAS-3L-01-003) hosting only three lasers, with nominal wavelengths of 405 nm (purple), 515 nm (green), and 660 nm (red). NO2/synthetic air mixtures were presented to the instrument in a specific step-wise procedure (open circles). The cell constant of 6923±24 V m W−1 is represented by the slope coefficient ±1σ of the linear regression fit to the averaged data per NO2 concentration (black line and bold grey circles). The data show a correlation coefficient of R2=0.998 with the linear fit model. The calibration is verified using size-selected Nigrosin aerosol particles (diamond symbols). A cell constant of 7477±310 V m W−1 is deduced for the Nigrosin data only (red line). The two independently deduced cell constants differ by 8 %. See the text for details.
It is important to note here that the NO2 absorption measurements at the 405 nm wavelength are affected by NO2 photolysis (Roehl et al., 1994). By knowing the actual laser emission spectrum, the quantum yield of the NO2 photolysis, and the exothermic reaction energy, the reduction in the PA signal by NO2 photolysis can be calculated and corrected. According to the data presented in Roehl et al. (1994), the NO2 photolysis quantum yield is 0.41 for the peak emission wavelength of 404.8 nm, as deduced for the PAAS-4λ unit used in this calibration (PAAS-3L-01-003; Fig. S5). This means that only 59 % of the absorbed photon energy is transferred into the PA signal. However, after the dissociation of NO2, the released oxygen atoms can react with oxygen molecules to form ozone. This reaction is exothermic and therefore has the potential to contribute to the generation of the PA signal. The released heat of 143 kJ mol−1 accounts for about 20 % of the initially absorbed photon energy, increasing the energy fraction available for the generation of the PA signal to 79 %.
Based on this calculation, a correction factor of 1.3 is applied in Fig. 4 for the 405 nm measurements, which is within the range of correction factors between 1.29 to 1.56 reported elsewhere for the same laser wavelength (Tian et al., 2013; Nakayama et al., 2015). A linear regression of the NO2 deduces a regression slope (i.e. the cell constant V m W−1), which is in a very good agreement with the theoretical value of 6900 V m W−1 given in Sect. 2.1.2. The low relative uncertainty of 0.35 % of the regression analysis is a result of the intrinsic high dynamic range and the wide linearity of PAS systems for gas measurements (Bluvshtein et al., 2017). An instrument precision of 3 % is deduced from day-to-day calibrations using the same bottle mixture and applying identical dilution procedures at controlled stable ambient conditions in the laboratory.
PAAS-4λ measurements using monodisperse Nigrosin particles are compared in Fig. 4 to verify the NO2 calibration. For this, Nigrosin dye (Thermo Fisher Scientific Inc.; CAS 8005-03-6) is dissolved in water and is dispersed, dried, and size-segregated using a differential mobility analyser (DMA; model 3080; TSI, USA). Three sizes were selected and analysed by PAAS-4λ, with mobility-equivalent diameters of 150, 200, and 250 nm. It is well known that the residual Nigrosin particles from this aerosolization procedure are spherical (e.g. Lack et al., 2006). With the refractive index of Nigrosin deduced by Bluvshtein et al. (2017) from ellipsometric measurements on thin film samples, the expected spectral absorption cross section of these monodisperse particles can be calculated using Mie theory. A comparison of the measured and calculated spectral absorption cross sections are given in Fig. S7 in the Supplement. A condensation particle counter (CPC; model 3775; TSI, USA) was operated parallel to the PAAS-4λ behind the DMA to obtain the particle number concentration of the size-segregated samples. The deduced cell constant V m W−1 is in good agreement with the above NO2-deduced constant, given the elevated uncertainty in the Nigrosin calibration procedure. This uncertainty is due to the combined uncertainties in the particle size selection and the particle number concentration measurement and is expressed by the elevated relative uncertainty of 4 % deduced from the regression analysis. An instrument accuracy of about 10 % can be estimated from the two independent calibrations, even though the Nigrosin calibration procedure has not been fully optimized yet. As detailed in Bluvshtein et al. (2017), it is very likely that the remaining discrepancy between the two calibration methods is due to the uncertainty in the refractive index of Nigrosin used in the Mie calculations.
3.2 Instrument performance
The detection limit of PAS and filter-based light absorption instruments is usually characterized by performing an Allan variance or deviation analysis (e.g. Fischer and Smith, 2018; Asmi et al., 2021). Although the Allan deviation analysis is primarily used to define the maximum averaging time that can be deployed without averaging over a significant signal drift (i.e. the characteristic instrument drift stability), the Allan deviation for a specific averaging time also equals the 1σ detection limit of the instrument in case the signal noise shows white noise characteristics (Asmi et al., 2021). To characterize the PAAS-4λ stability and detection limit, particle-filtered laboratory air needs to be sampled over a long period of time (e.g. 40 h in Fig. 5). As can be seen in Fig. 5, the PAAS-4λ drift stability is typically between 1000 and 3000 s, which is when the 1σ Allan deviation starts to deviate from the white noise characteristic decrease with averaging time τ. This means that after about 30 min measurement time, the instrument background (i.e. particle-filtered ambient air) should be measured to obtain a drift-free background that corresponds to the aerosol sample period in between. An ultimate 1σ detection limit around or below 0.1 Mm−1 can be deduced from the Allan deviation analysis in Fig. 5. Interestingly, the characteristic PAAS-4λ Allan deviation plot shown in Fig. 5 is very similar to the corresponding plot shown in Fig. 2 of Fischer and Smith (2018) for a state-of-the-art four-wavelength PAS system with a single PA cell (MultiPAS-IV). This is remarkable given that the MultiPAS-IV uses a multi-pass mirror set-up around the PA cell to increase the laser power inside the cell by 30 to 56 times, while the PAAS-4λ works with just one laser pass. One can speculate that a PAS optical set-up with just one laser pass through the cell is more stable and less prone to temperature- or vibration-dependent alignment drifts compared to a system with an additional multi-pass optical cell.
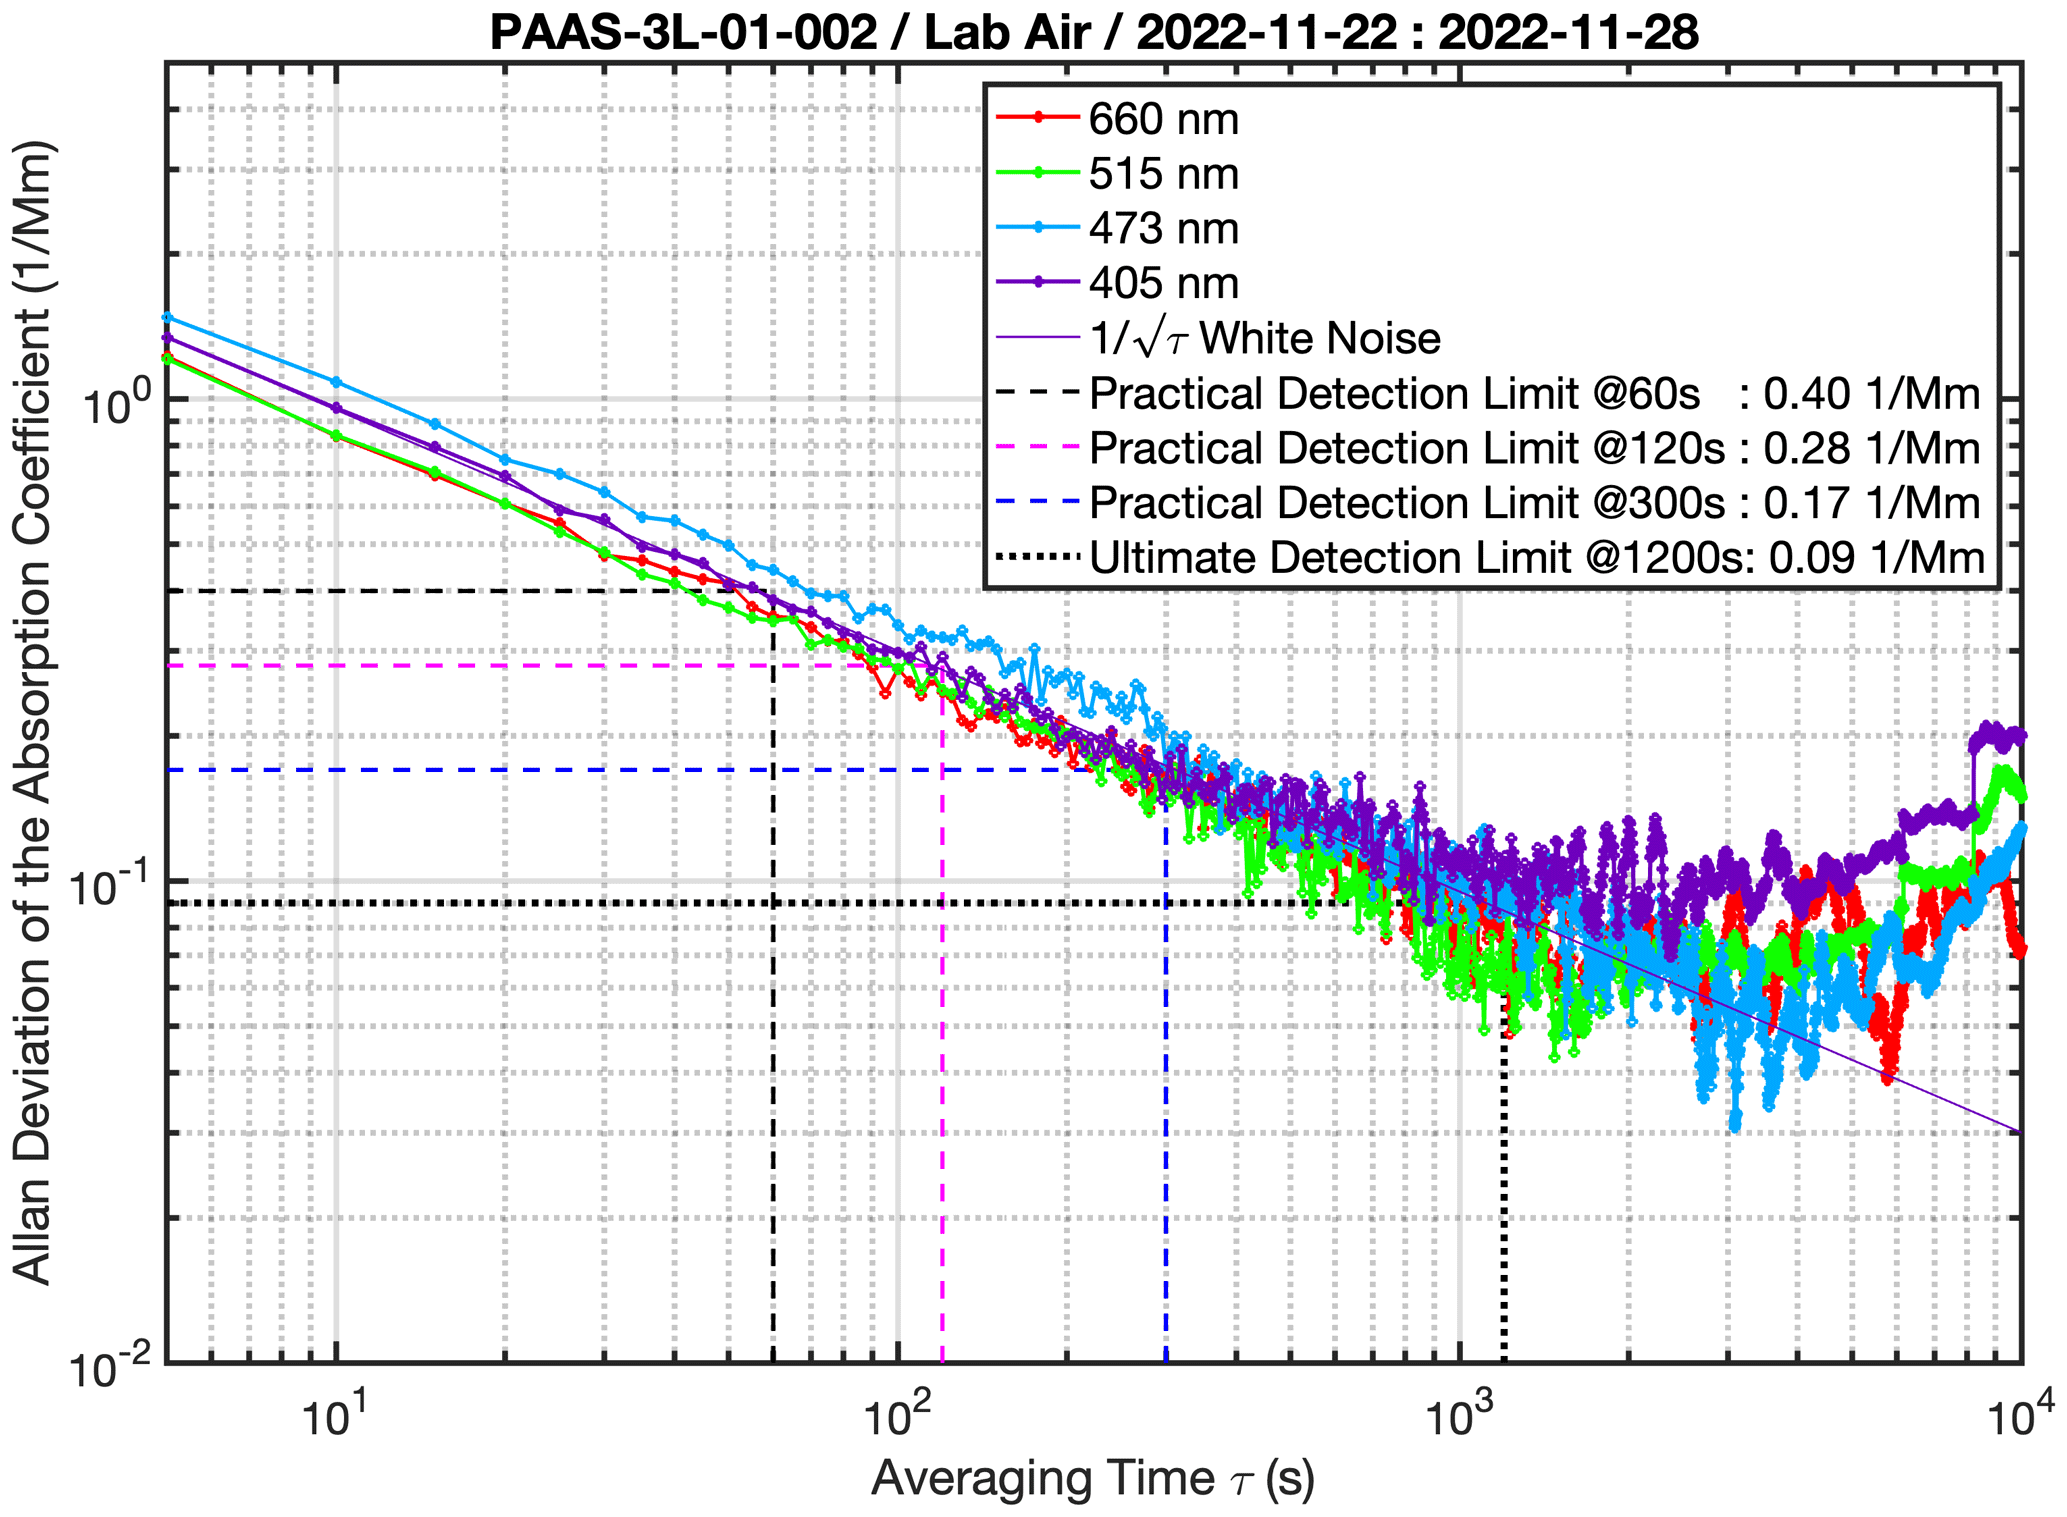
Figure 5Allan deviation analysis of a 40 h background measurement. The instrument sampled particle-filtered laboratory air with a basic averaging time of 5 s per laser wavelength. A white noise characteristic slope is plotted for the 405 nm wavelength (thin purple line). Signal drift starts between 1000 and 3000 s averaging time, resulting in an ultimate detection limit of less than 0.1 Mm−1 for these averaging times. More practical detection limits for averaging times of 60, 120, and 300 s are indicated by dashed black, magenta, and blue lines, respectively.
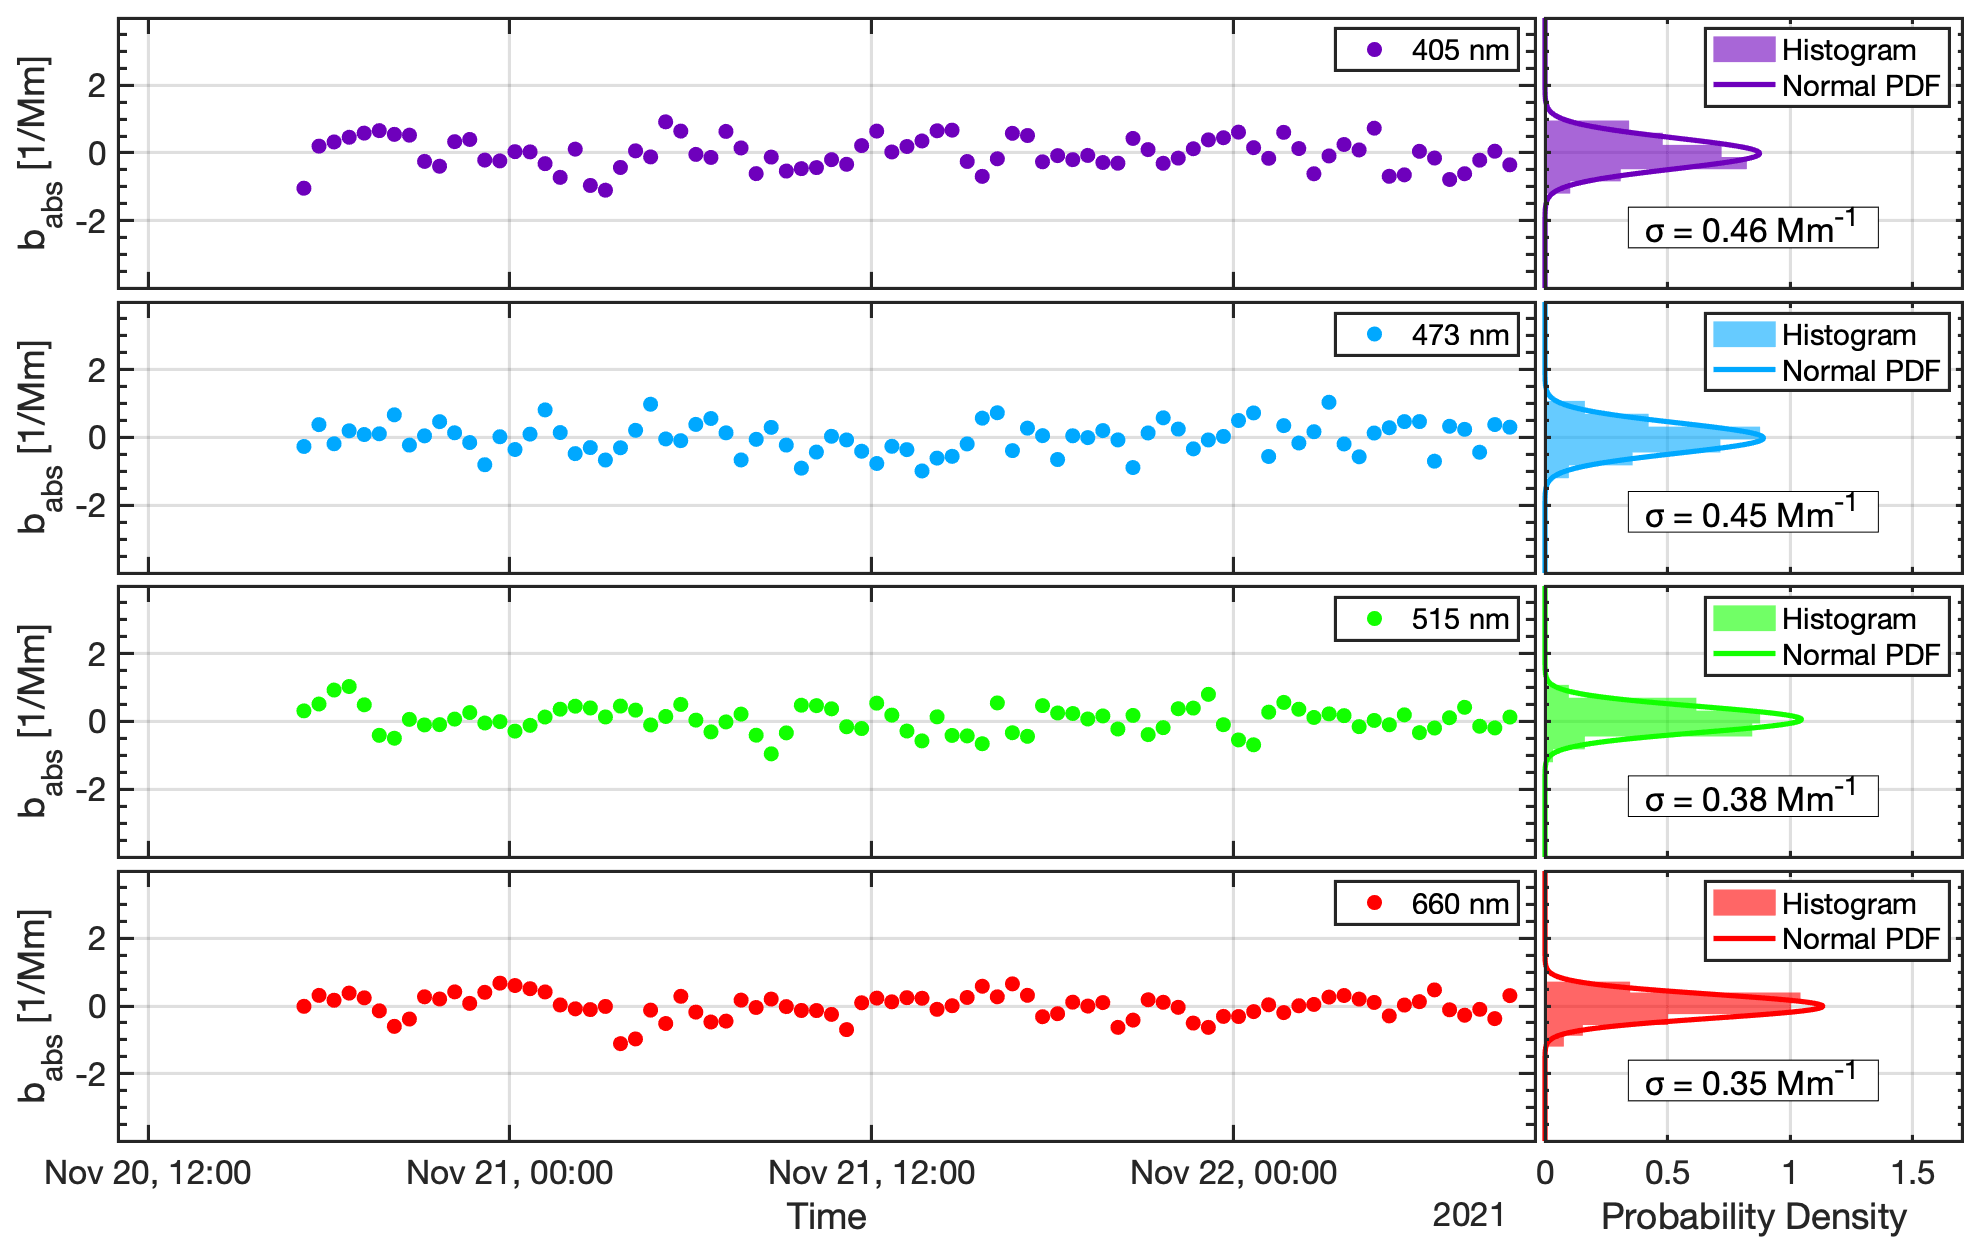
Figure 6Background data of Fig. 5 reanalysed to simulate a typical measurement sequence, where the sample measurements are background corrected every 30 min (left panels). Averaging times are 5 and 1 min per laser wavelength in the sample and background periods, respectively. Histograms of the background-corrected data and corresponding 1σ deviations are given in the right panels. See the text for details.
As already mentioned, the Allan deviation analysis is useful for deducing the signal drift stability and the ultimate detection limit, but it can also be used to estimate the practical detection limits for other, more realistic averaging times. This is especially important for sequential measuring systems, like the PAAS-4λ, where the actual averaging time is the sample or background period divided by the number of lasers in the system. For long-term field measurements, a typical sample period is 20 min, followed by a particle-filtered background period of 4 min that is sandwiched between two cell-flushing periods of 3 min each. Thus, one sample filter cycle has a total duration of 30 min. This results in effective averaging times per laser of 5 min for the sample period and 1 min for the background period. According to Fig. 5, the 1σ detection limits for 1 and 5 min averaging times are 0.4 and 0.2 Mm−1, respectively. One can assume that in such a measurement procedure the larger detection limit of the background period will define the overall limit. To verify this assumption, the background data of Fig. 5 were reanalysed, assuming such a measurement procedure. The 40 h background data are subdivided into alternating sample filter cycles, each consisting of a 20 min sample period and a 4 min background period that is sandwiched by two 3 min flushing periods. The data in each sample and background period are then averaged, resulting in 5 and 1 min laser averages, respectively. Finally, the averaged data of two background periods before and after a sample period are averaged and subtracted from the corresponding averaged sample data to calculate the background-corrected data; the same procedure is applied to the field data in Sect. 4. The result of this analysis is shown in Fig. 6. By comparing Figs. 5 and 6, it is clear that the 1σ detection limit that is expected for background-corrected 20 min sample data in a 30 min sample background cycle is defined by the shorter background periods, as the 1σ values given in Fig. 6 match the 60 s detection limit indicated in Fig. 5.
In the following, data from long-term PAAS-4λ measurements at an unattended remote monitoring station are presented. The data are collected at an air quality monitoring station located in the Finnish Arctic on top of the Sammaltunturi fell (67∘58′ N, 24∘7′ E; 560 m a.s.l. – above sea level), which is about 140 km north of the Arctic circle. The station, referred to as Pallas from now on, belongs to the Pallas–Sodankylä Atmosphere–Ecosystem Supersite Facility operated by the Finnish Meteorological Institute, which is also part of the Aerosols, Clouds, and Trace gases Research InfraStructure (ACTRIS) project. Details of the site and the ongoing measurements can be found in Lohila et al. (2015). The station usually resides in relatively clean Arctic background air, with monthly median BC mass concentrations below 50 ng m−3 (Asmi et al., 2021). Only from time to time is the station influenced by long-range transported anthropogenic pollution from central and southern Europe and from biomass burning aerosol emitted by wildfires in northern Eurasia (Hyvärinen et al., 2011). The location of the Pallas station in conjunction with its unattended operation makes it ideal for testing novel monitoring instruments. PAAS-4λ measurements at Pallas have been ongoing since December 2021.
Ambient aerosol and gas compositions are continuously monitored at Pallas by a suite of permanently installed instruments, from which the filter-based absorption photometers, the Aethalometer® (Aerosol Magee Scientific, USA; model A33) and the MAAP, have been selected for the intercomparison of babs(λ) with PAAS-4λ measurements. Furthermore, the PAAS-4λ is also compared against a COSMOS instrument that has been deployed at Pallas since 2019. COSMOS is a filter-based absorption photometer with a specific inlet that is heated to 300 ∘C to remove volatile light-scattering particles and BC coatings from the sampled aerosol. Therefore, the filter-based light attenuation measured by COSMOS has a direct and fixed correlation with the BC mass concentration (MBC), with no cross-sensitivity to light-scattering aerosol mass. This has been demonstrated by intercomparison studies with a single-particle soot photometer (SP2; Droplet Measurement Technologies, Longmont, CO, USA) in the laboratory and at different field sites. Details of the COSMOS instrument can be found in Ohata et al. (2021) and references therein.
The AE33, COSMOS, and PAAS-4λ instruments sample from a main inlet, which is a total aerosol inlet designed to collect both aerosol particles and the cloud droplets during the in-cloud periods at the station. Of the total volumetric flow through the total aerosol inlet of 40 L min−1, a fraction of 16.5 L min−1 is dried with Nafion dryer (MD-700; Perma Pure LLC) and divided between different instruments by a sample manifold consisting of 6 mm outer diameter exit tubes. Conductive silicon tubing with an inner diameter of 4.8 mm is used to connect the instruments to the manifold. The MAAP instrument is connected to a separate, size-selective interstitial inlet equipped with a PM2.5 sampling head and a separate Nafion drier (MD-700; Perma Pure LLC). A difference in aerosol sampling between the total and the interstitial inlet for absorbing aerosol is significant, mainly during the in-cloud periods, which are therefore separated in the data (Hyvärinen et al., 2011). Sampling flows are set to 5.0, 0.7, 10.0, and 1.0 L min−1 for the AE33, COSMOS, MAAP, and PAAS-4λ, respectively. COSMOS uses a cyclone impactor with a cut size of 1 µm to remove supermicron-sized particles from the aerosol. All other instruments do not use an additional impactor.
4.1 Instrument long-term performance
A total of 11 months of PAAS-4λ data from the Pallas station is used to analyse the instrument long-term performance. These data cover the period from 21 December 2021 to 21 November 2022. During this period, the collected data cover 99 % of the time (Table 1). The remaining unintended data gaps are due to forced operating system updates and a station power outage that all resulted in a forced reboot of the instrument panel computer. None of the data gaps is due to a failure of one of the instrument components like laser, electronics, or flow system components, which clearly demonstrates the technological readiness of PAAS-4λ for unattended long-term operation at remote air quality stations. The relatively long data gaps from the unintended computer reboots in Table 1 result from the unawareness of the remote user rather than being evoked by the incident itself. In any of these cases, the data acquisition could be restarted via remote access without the attendance of station personnel. An automated data acquisition restart after a computer reboot will be implemented in future long-term deployments.
Table 1Overview of data gaps and the resulting data coverage during 11 months of unattended operation of PAAS-4λ at Pallas, Finland.
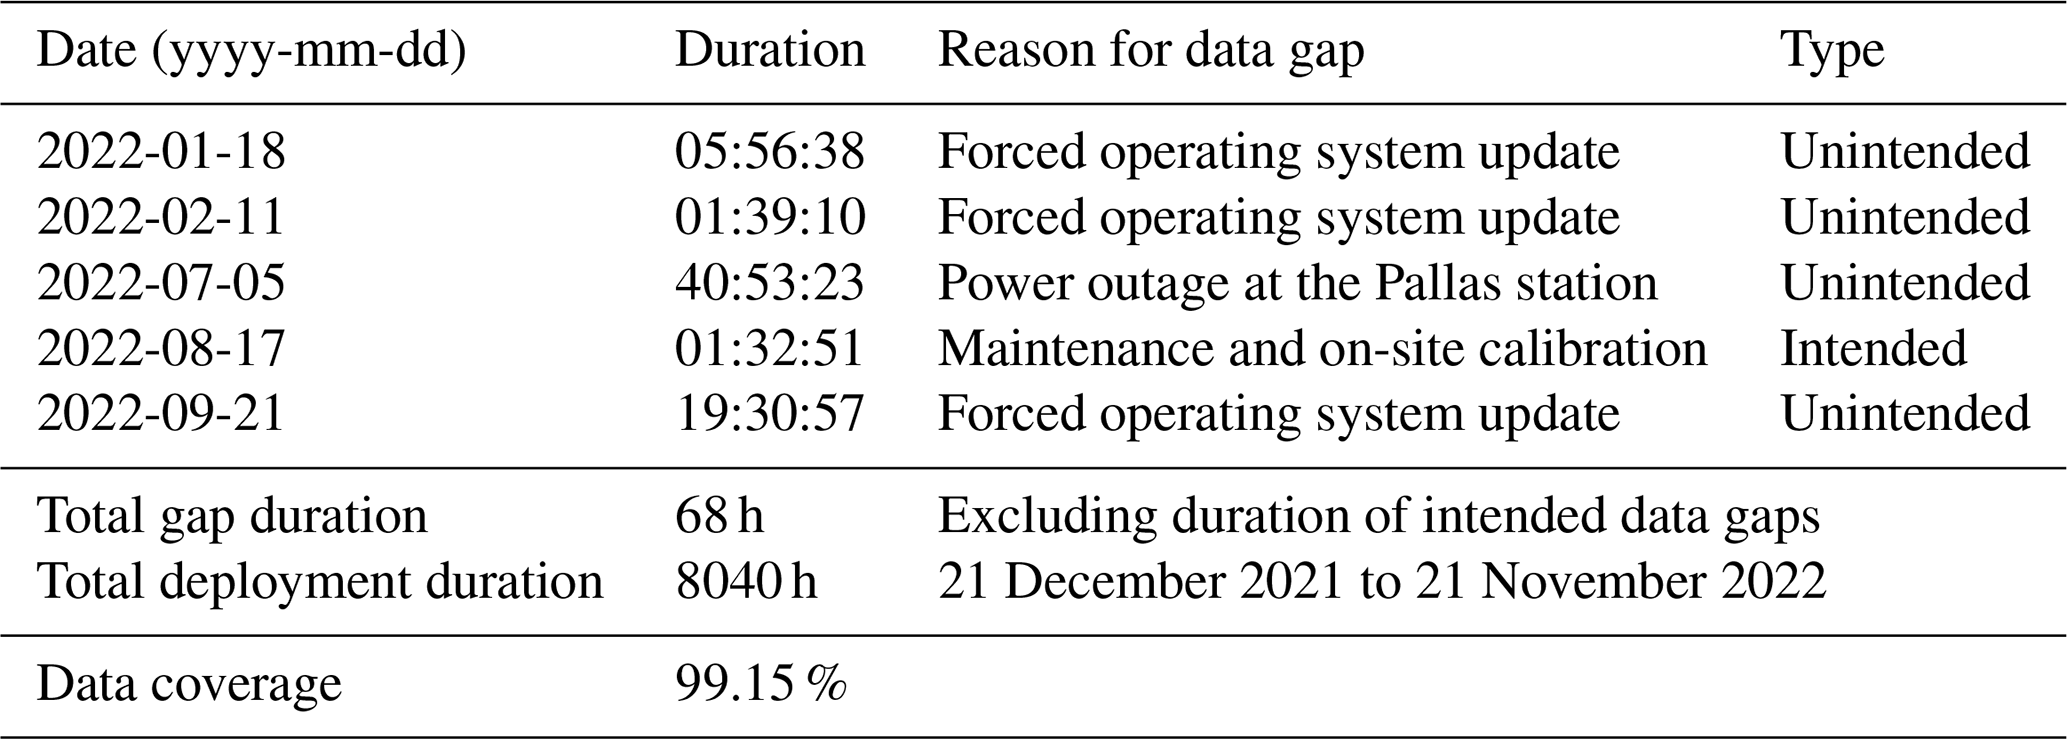
Figure 7 shows the temperature and relative humidity (RH) variations in the sampled aerosol during this deployment time. The PAAS-4λ temperature and RH sensor (E+E Elektronik, Austria; model EE23-T6) is located downstream of the PA cell in the flow unit. As mentioned in Sect. 2.1, the dissipated heat from the lasers results in a stabilized temperature inside the optics housing of about 30 ∘C. The PA cell metal body is adapting to this temperature within a warm-up time of about 1 h. The RH inside the photoacoustic cell can then be translated from the RH and temperature of the aerosol measured outside the optics housing downstream of the PA cell. Figure 7 clearly shows that, most of the time, the aerosol inside the PA cell has an RH below 30 %. Only during the summer months was the RH elevated but generally limited to values below 35 %, with 4 d in July where RH reached 40 %. This is important, as the photoacoustic signal starts to show significant low biases of more than 10 % for RH values larger than a critical RH of about 35 % (Langridge et al., 2013).
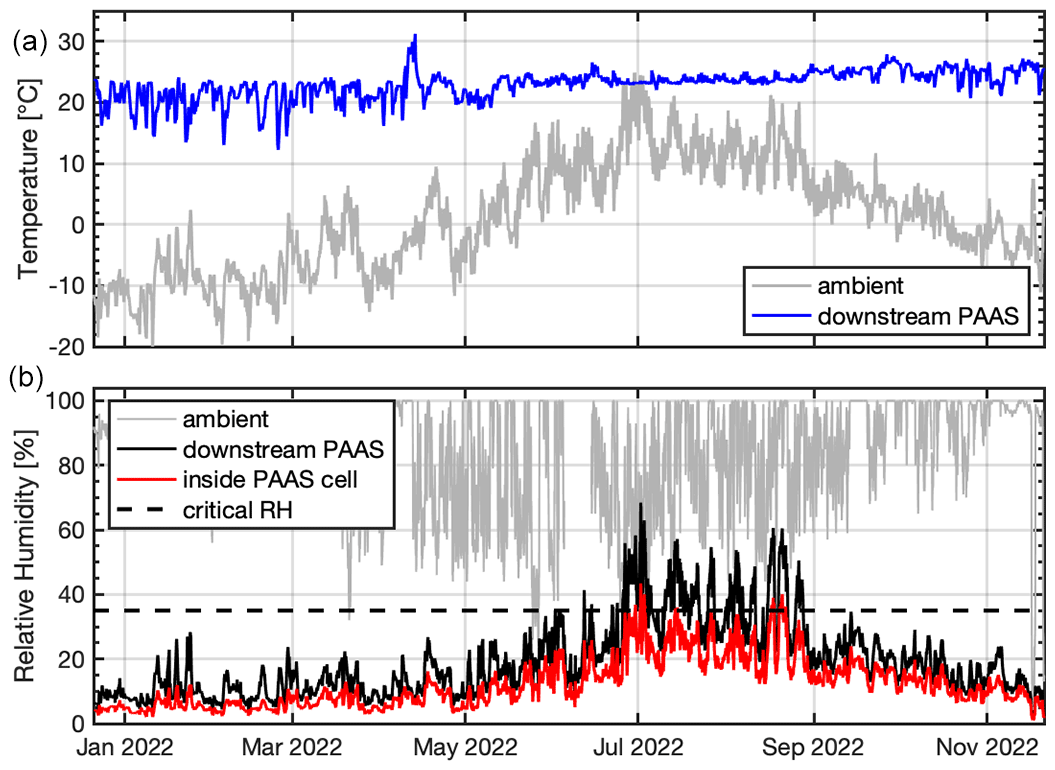
Figure 7Variation in the aerosol temperature and relative humidity (RH) measured downstream of the PAAS-4λ optics unit inside the flow unit (blue and black lines, respectively). Ambient temperature and RH measured outside the Pallas station are also shown (grey lines). The RH measurement downstream of the PA cell is translated to the elevated temperature conditions inside the optics unit by assuming a fixed PA cell temperature of 30 ∘C (red line). The critical RH of 35 %, given by Langridge et al. (2013) for unbiased PAS measurements, is indicated by the dashed black line.
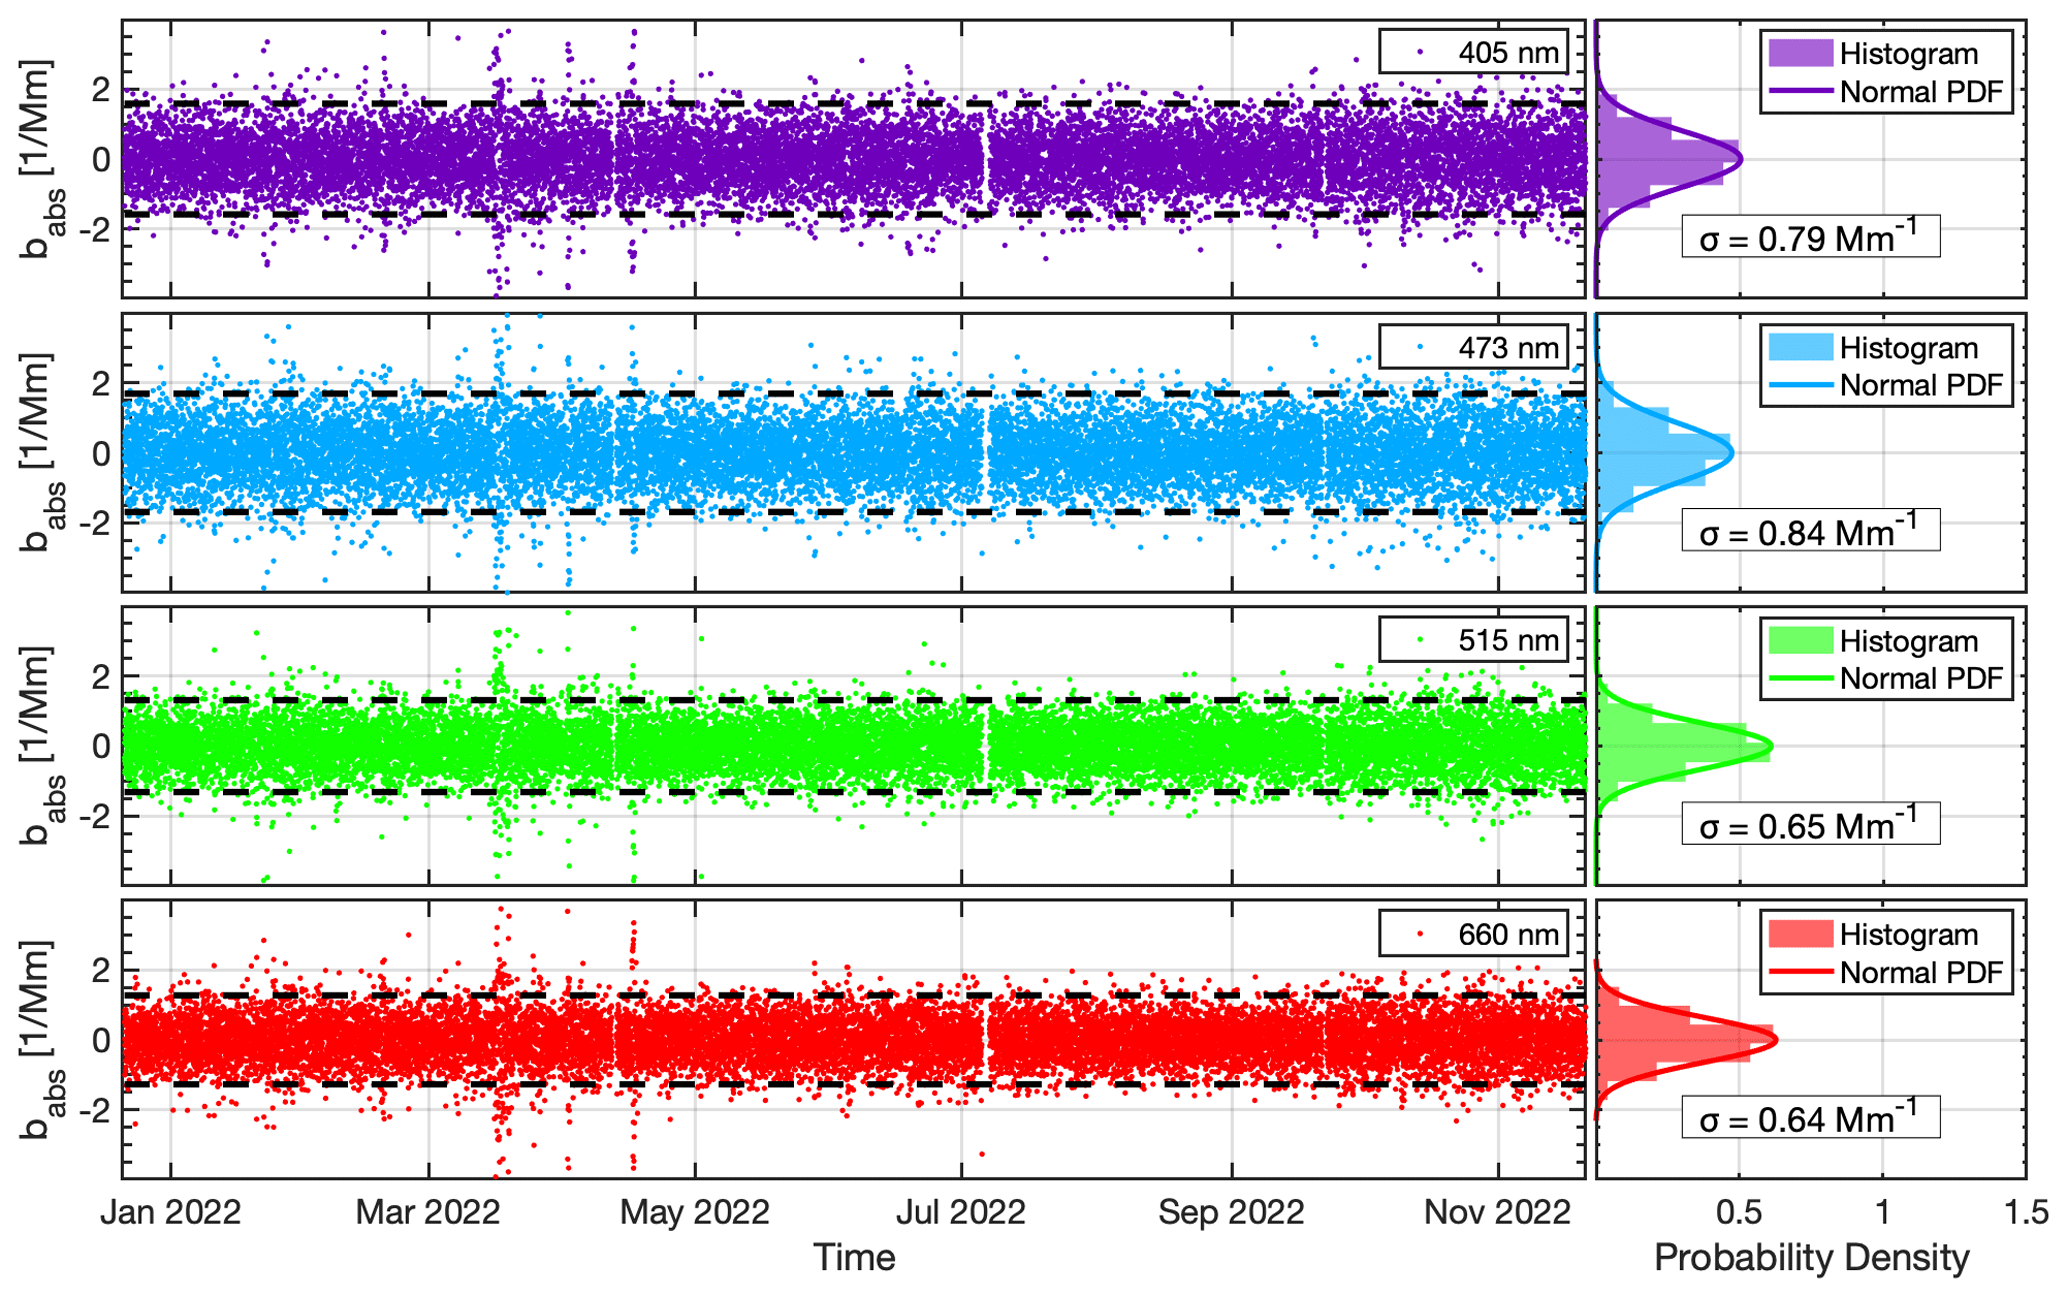
Figure 8Difference between the two filtered-air (background) measurements of all filter sample filter cycles that were conducted over a period of 11 months during the unattended PAAS-4λ deployment at Sammaltunturi. Each data point reflects the difference between two consecutive 1 min averaged filtered-air measurements that are 30 min apart. The dashed horizontal lines represent the ±2σ detection limit.
To verify the detection limit, which has been deduced from the laboratory data shown in Sect. 3.2 for the long-term operation at Pallas, the particle-filtered air (background) data from Pallas are analysed. The background correction procedure that is applied to the PAAS-4λ raw data averages two consecutive 1 min averaged background measurements of a filter sample filter cycle and subtracts this average from the corresponding sample measurement. One can, therefore, assume that the difference between these two background measurements defines the uncertainty in the corresponding sample measurement. Figure 8 depicts the difference between two consecutive background measurements that are 30 min apart over the course of the instrument deployment at Pallas, which encompasses a total of 16 000 data points. The data are normally distributed around the zero line, with 1σ distribution widths that are a factor of roughly 2 larger than the corresponding 1 min averages of the laboratory Allan analysis shown in Fig. 5 and the corresponding background analysis shown in Fig. 6. In contrast to the laboratory conditions, the conditions in- and outside the Pallas station likely cause higher levels of ambient electromagnetic and sound noise, in addition to larger fluctuations in the temperature, aerosol relative humidity, and trace gas composition of the sampled air, which jointly impacts the PAAS-4λ measurements. In particular, the impact of light-absorbing trace gases like, for example, NO2 or O3 that are co-transported with combustion aerosol can be clearly seen in Fig. 8 by the higher background fluctuations in the March to May period when the station was frequently influenced by long-range transported pollution episodes (see Sect. 4.2).
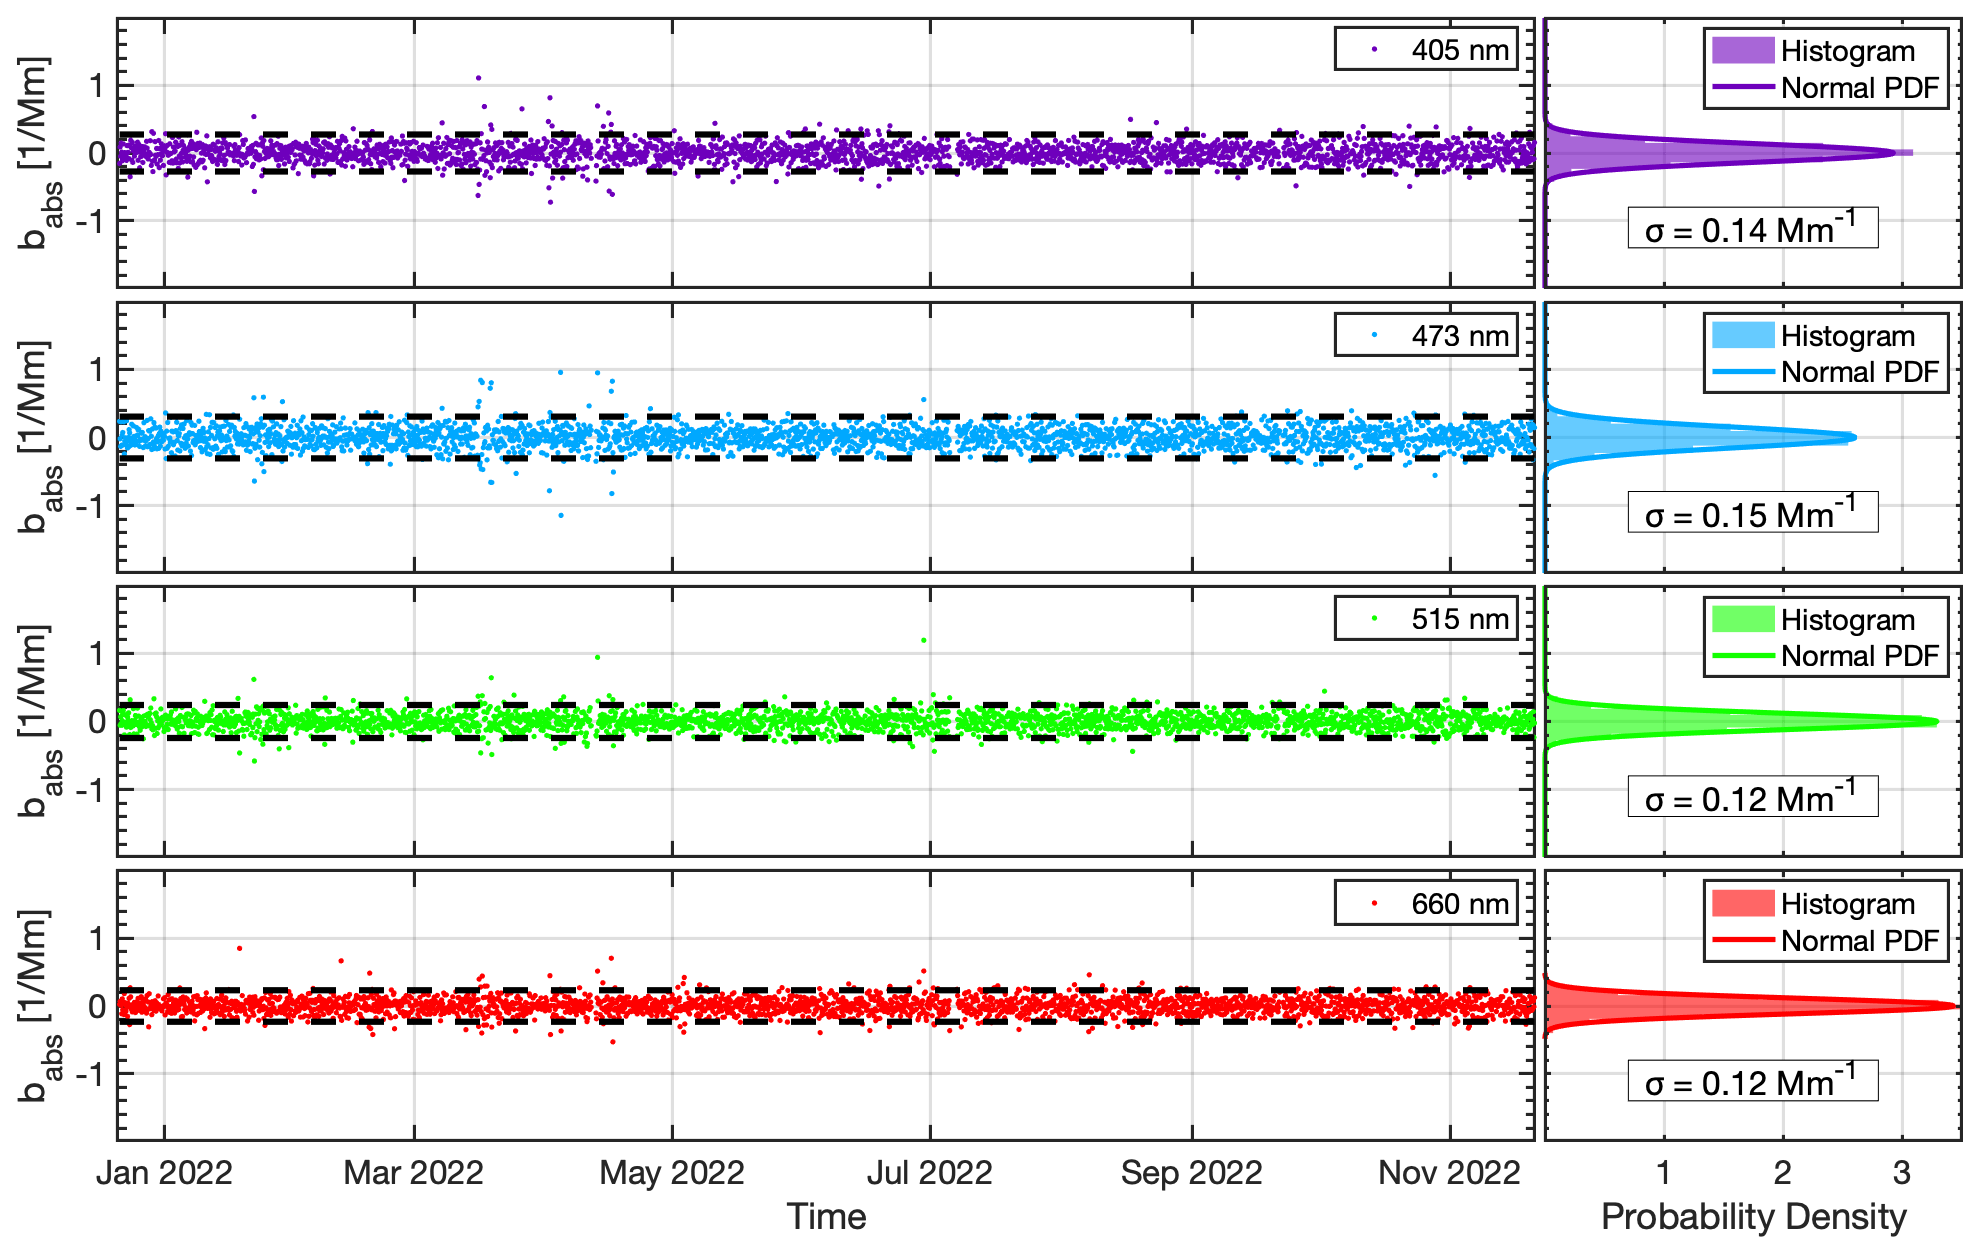
As the long-term PAAS-4λ measurements at Pallas are basically averaged over 3 h before using them in any instrument intercomparison or scientific analysis, the background data of Fig. 8 are averaged over 3 h in Fig. 9. This averaging pushes the 1σ distribution widths into a range that agrees with the Allan analysis result shown in Fig. 5. A 2σ detection limit of 0.28, 0.3, 0.24, and 0.24 Mm−1 can therefore be deduced for the 3 h averaged PAAS-4λ measurements from Pallas for the 405, 473, 515, and 660 nm wavelengths, respectively.
4.2 Time series and instrument intercomparisons
The time series of background-corrected PAAS-4λ absorption coefficients babs(λ) measured at Pallas during the long-term deployment are shown in Fig. 10a. Concurrent measurements of the BC mass concentration MBC by the COSMOS instrument are shown as well. Both data sets are averaged over 3 h. , In general, the data reflect the very clean Arctic background conditions expected at Pallas, with annual averages of BC between 60 and 70 ng m−3 (Hyvärinen et al., 2011). Actually, the COSMOS data reveal a lower averaged BC mass concentration of only 22 ng m−3 for the measurement period discussed here. Pollution episodes with higher babs(λ) values of typically 1 to 3 Mm−1, corresponding to MBC values between 50 and 200 ng m−3, are clearly distinct from this clean Arctic background. The pollution episodes last for time periods of typically more than 12 h and show a higher frequency of occurrence in the winter and spring period compared to summer and autumn. At Pallas, these episodes can be attributed to polluted air masses that are transported from central and eastern Europe to northern Finland (Hyvärinen et al., 2011).
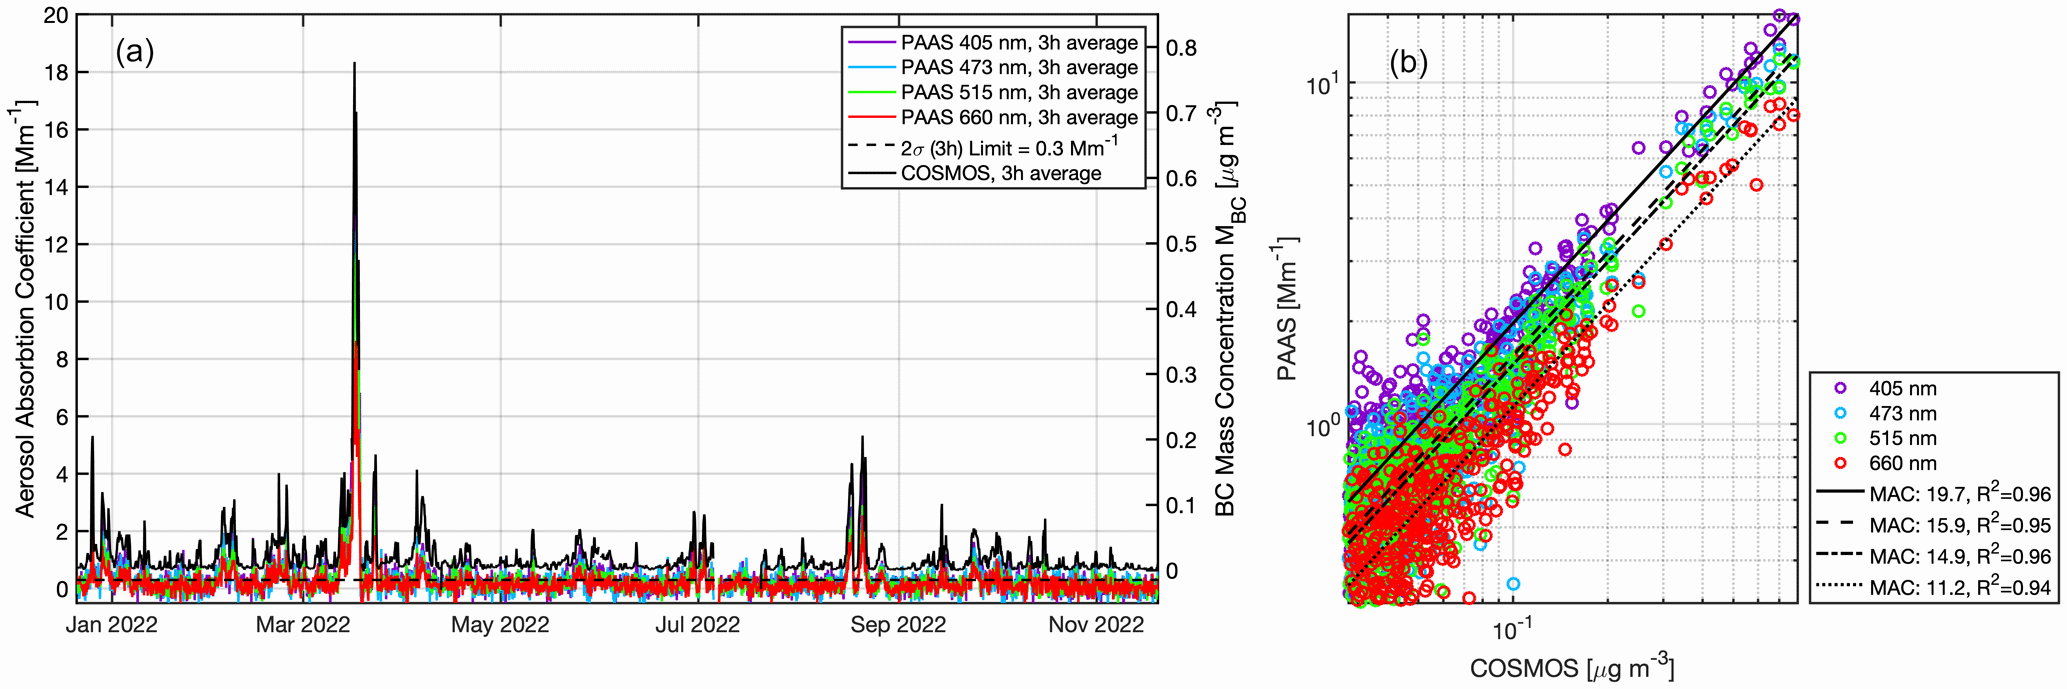
Figure 10Comparison of the PAAS-4λ absorption coefficients with concurrent measurements with the COSMOS instrument for a time period of 11 months (a). Correlation analysis of the same data (b), which gives the mass-specific absorption cross section (MAC) for each PAAS-4λ wavelength given in the legend. Each data set is averaged over 3 h.
The PAAS-4λ absorption coefficients babs(λ) are strongly correlated with the BC mass concentration MBC from COSMOS (R2=0.94–0.96), resulting in mass-specific absorption cross sections (MACs) of 19.7, 15.9, 14.9, and 11.2 m2 g−1 for the 405, 473, 515, and 660 nm wavelengths, respectively (Fig. 10b). Ohata et al. (2021) compared long-term MBC measurements by COSMOS with concurrent filter-based babs measurements by Aetholometers, MAAPs, and particle soot absorption photometers (PSAPs) from four Arctic sites including Pallas. They deduced an average MAC of 13±1.6 m2 g−1 at λ=550 nm from all measurements, covering a period from 2012 to 2021. Interpolating the MAC(515 nm) = 14.9 m2 g−1, deduced from the PAAS-4λ versus COSMOS correlation in Fig. 10b, to a wavelength of λ=550 nm results in MAC(550 nm) =13.8 m2 g−1, which is in excellent agreement with the Arctic average from Ohata et al. (2021). Here, the absorption Ångström exponent (AAE) of 1.14 deduced from the MAC(λ) of Fig. 10b is used for the interpolation. Furthermore, interpolating the MAC(660 nm) of 11.2 m2 g−1 from PAAS-4λ to the MAAP wavelength of λ=637 nm results in a MAC(637 nm) of 11.7 m2 g−1, which is 10 % lower than the MAC(637 nm) = 13.0 m2 g−1 given by Ohata et al. (2021) for the COSMOS versus MAAP correlation from Pallas for the July 2020 to July 2021 time period but still within their variability range of 27 %.
As mentioned in Sect. 1, a common problem of the filter-based measurement methods of babs(λ) is that the raw filter attenuation data bATN have to be corrected for multiple light-scattering and particle loading effects within the filter matrix, which significantly affects their measurement uncertainty. It has been concluded that concurrent measurements with non-intrusive methods like PAS over longer time periods in the field would be ideal to further investigate these uncertainties under target operational conditions. The following paragraphs should therefore briefly emphasize the potential contributions from long-term PAAS-4λ deployments in air quality monitoring stations for validating commonly used filter-based instruments and their correction schemes.
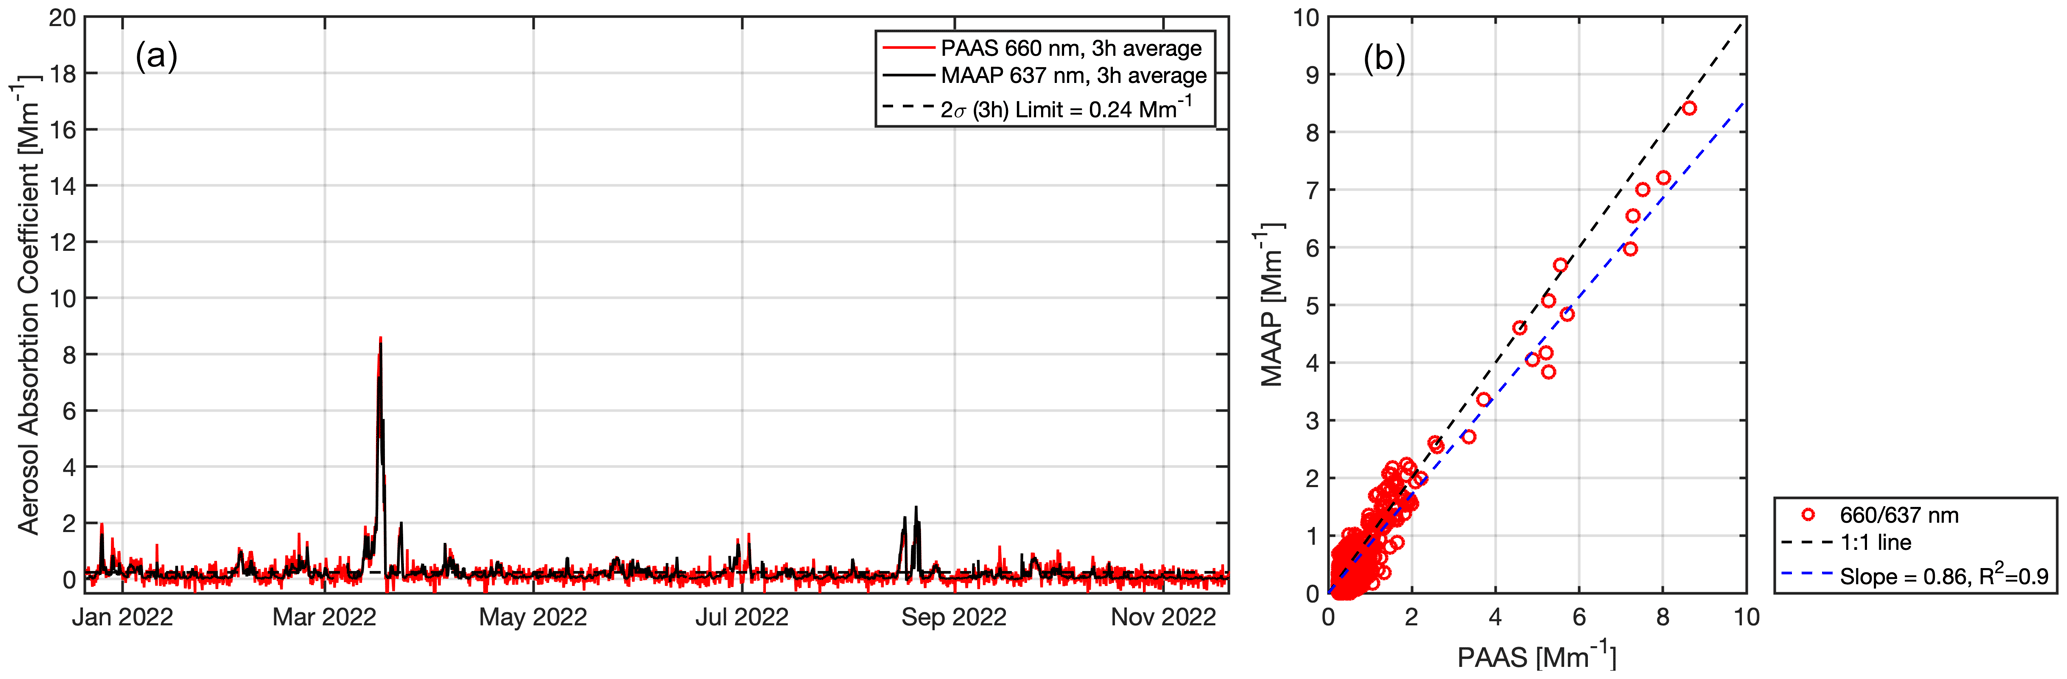
Figure 11Comparison of the PAAS-4λ absorption coefficient for 660 nm with concurrent measurements with the MAAP instrument for 637 nm for a time period of 11 months (a). Correlation analysis of the same data (b). Each data set is averaged over 3 h.
The MAAP instrument is generally considered to be a valid reference for babs, as it is does not rely on an empiric corrections of the multiple-scattering and loading effects but uses additional measurements of diffusely scattered radiation in the backward hemisphere that allows the determination of babs analytically within a radiative transfer model of the particle-loaded filter (Petzold and Schönlinner, 2004). The intercomparison of MAAP with PAAS-4λ for the 11-month deployment period of PAAS-4λ at Pallas verifies this consideration (Fig. 11). The two data sets are well correlated, with a correlation coefficient of R2=0.9. The regression slope of 0.86 is within the ∼ 20 % combined accuracy of the two instruments (i.e. 10 % for PAAS-4λ and 12 % for MAAP).
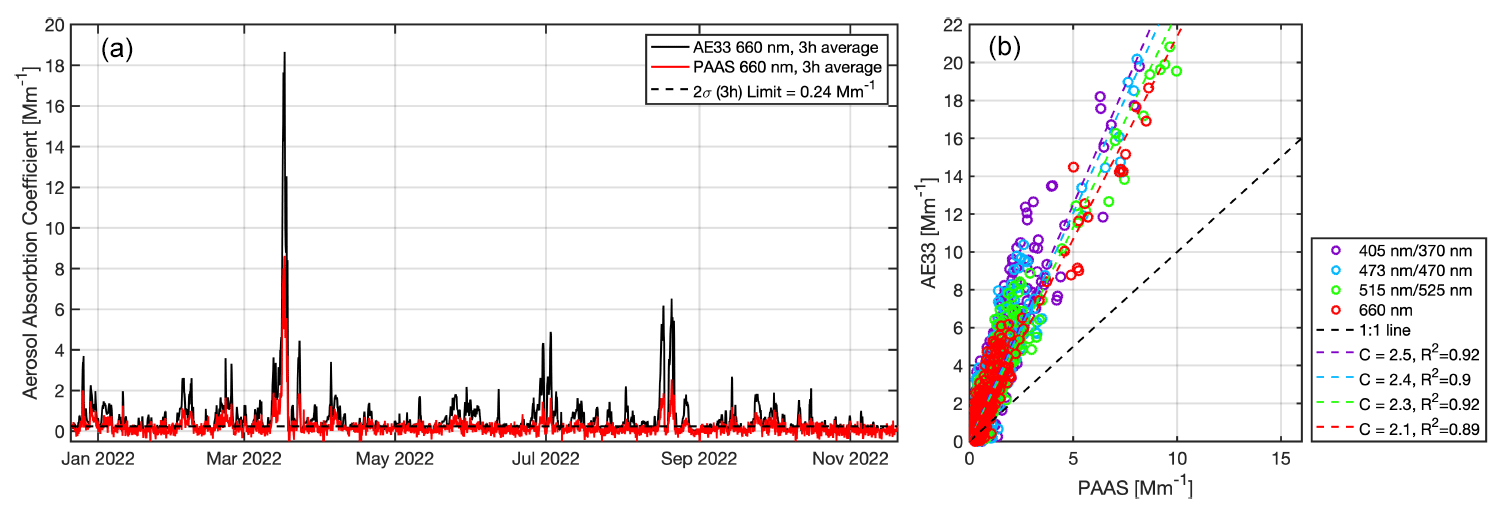
Figure 12Comparison of the PAAS-4λ absorption coefficient for 660 nm, with concurrent measurements of the same wavelength with the Aethalometer® (AE33) instrument for a time period of 11 months (a). Correlation analysis of the same data but now for four wavelength pairs (PAAS/AE33) (b). Each data set is averaged over 3 h.
Aethalometers® are the most widely used filter-based instruments and are, therefore, most intensively characterized and developed. The latest instrument version (AE33) uses a dual-spot approach to obtain an online compensation of the filter loading effect (Drinovec et al., 2015). Figure 12 shows the intercomparison of AE33 with PAAS-4λ over the period of use of PAAS-4λ at Pallas so far. Only those wavelengths have been selected from the available seven wavelengths of AE33 that have the closest match with the wavelengths of the PAAS-4λ unit deployed at Pallas. The two data sets are well correlated, with correlation coefficients R2 between 0.89 and 0.92. The regression slope equals the multiple-scattering correction factor C, assuming that babs from PAAS-4λ represents an unbiased reference. Correction factors of 2.5, 2.4, 2.3, and 2.1 are determined for the 405/370, 473/470, 515/520, and 660 nm wavelength pairs, respectively. The factor C=2.1 at 660 nm is in a very good agreement with the factors 2.13±0.57 for pure diesel soot and 2.29±1.36 for diesel soot externally mixed with ammonium sulfate particles, as determined by Weingartner et al. (2003) for the same wavelength of the AE30 Aethalometer®. Their data were acquired in aerosol chamber experiments, with the difference in the spectral extinction and total scattering measurements being the reference for the absorption coefficient (Schnaiter et al., 2003). Furthermore, the C(660 nm) = 2.1 factor also fits the broad C(637 nm) factor range of 1.99–2.78 given in Yus-Díez et al. (2021) for AE33 versus MAAP correlation analyses of data from different urban and regional backgrounds and mountaintop sites.
The correction factors C in Fig. 12 also indicate a weak negative wavelength dependence, with larger values for shorter wavelengths, which is an interesting observation, as it contradicts the current assumption of no or a rather positive dependence (Yus-Díez et al., 2021). A first statistical analysis of the individual 3 h averaged C(λ) factors confirms the wavelength trend found in the regression analysis, with differences in the median C(λ) factors that are statistically significant according to the Wilcoxon rank sum test. However, further detailed analyses of the Pallas data set are necessary to strengthen this observation in relation to the actual aerosol composition (i.e. the single-scattering albedo). Furthermore, as long-range transported pollution episodes are nicely contrasting the clean Arctic background with absorption coefficients around the detection limit of PAAS-4λ, these episodes can be specifically analysed in terms of instrument intercomparisons. An example of such an analysis is given in the Supplement (Fig. S9).
Photoacoustic aerosol spectroscopy (PAS) is one of the non-intrusive methods of measuring the spectral absorption coefficient babs(λ) of the atmospheric aerosol that comprises fine-mode combustion particles like black carbon (BC) in varying mass fractions. It represents an alternative method to the commonly used filter-based absorption photometers, like the Aethalometer®, which are prone to measurement errors that are difficult to correct. These errors are caused by multiple light scattering and total particle light absorption within the filter matrix that is continuously accumulating particles. Even though PAS instruments are not affected by particle light scattering or total light absorption by the particles, they are commonly regarded to have less sensitivity and robustness and need significantly more user interference to keep them operational (compared to filter-based instruments). Therefore, PAS instruments are usually not considered to be suitable for long-term monitoring tasks in (remote) air quality monitoring stations.
In this work, the commercial four-wavelength Photoacoustic Aerosol Absorption Spectrometer PAAS-4λ is introduced that has been specifically designed for unattended operation in remote air quality monitoring stations. The PAAS-4λ combines a compact and robust four-laser beam combiner with a single photoacoustic (PA) cell in a simple optical arrangement. This optical set-up is implemented in a laser class 1 enclosure equipped with a thermal concept, using the dissipated heat from the lasers to thermally stabilize PA cell at about 30 ∘C. Dual-phase lock-in technology in combination with an embedded real-time frequency generator is used to sensitively detect the photoacoustic signal even under elevated electronic and sound noise conditions. A touchscreen computer is implemented in the electronics unit of PAAS-4λ, where the instrument application autonomously operates the instrument through predefined measurement sequences that also allow the control of peripheral components, e.g. for implementing inlet switch cycles or calibration procedures in the measurement sequence.
A calibration procedure using certificated NO2/air mixtures in step-wise dilution sequences is applied, which improves the calibration repeatability, resulting in a given instrument precision of 3 %. When calibrating with NO2, knowledge of the actual laser emission spectra is crucial to achieve a high instrument accuracy. Therefore, the laser emission spectra are routinely measured in the calibration procedures, resulting in a given instrument accuracy of 10 % that was verified in separate calibration runs using size-segregated Nigrosin particles. The Allan analysis of the PAAS-4λ background signal reveals a very good ultimate 1σ detection limit of 0.1 Mm−1, which is comparable to other non-commercial, state-of-the-art multi-wavelength PAS instruments (e.g. Fischer and Smith, 2018). However, under usual operational settings with particle-free background measurements every 30 min, the shorter background averaging time defines the detection limit. The practical 1σ detection limit is deduced in the range between 0.35 and 0.46 Mm−1, again in good agreement with the Fischer and Smith (2018) instrument.
To demonstrate the instrument performance under target operational conditions, a PAAS-4λ unit has been installed in December 2021 at the remote air quality monitoring station Pallas located in Finland, which i about 140 km north of the Arctic circle. The instrument has been acquiring data continuously since then, with only very minor involvement from local station personnel. During the deployment so far, the instrument worked very reliably, with a data coverage of more than 99 %. By analysing the background data that were captured every 30 min, practical 1σ detection limits between 0.64 and 0.79 Mm−1 are deduced that are higher than those from the laboratory. Here, the variability in the absorbing trace gases in the sampled air might cause at least part of these higher limits. Averaging the data over 3 h reduces the detection limits to the range from 0.12 to 0.15 Mm−1.
Instrument intercomparisons between PAAS-4λ and the filter-based photometers MAAP, AE33, in addition to the COSMOS BC monitor are presented for the 11-month deployment period at Pallas. In any case, there is a strong correlation observed between PAAS-4λ and these filter-based instruments. The correlation between PAAS-4λ and the BC mass concentration from COSMOS revealed mass-specific absorption cross sections (MAC) of 11.2, 14.9, 15.9, and 19.7 m2 g−1 for the 660, 515, 473, and 405 nm wavelengths, respectively. The single-wavelength MAAP photometer is frequently used as a reference instrument for the aerosol absorption coefficient babs(637 nm), which is confirmed in the correlation analysis with babs(660 nm) from PAAS-4λ, giving a linear regression slope of 0.86 that is within the combined accuracy of both instruments. Finally, the intercomparison of PAAS-4λ with the Aethalometer® AE33 results in multiple scattering correction factors C(λ) of 2.1, 2.3, 2.4, and 2.5 for the 660, 515/520, 473/470, and 405/370 nm wavelength pairs, respectively.
The time series and instrument intercomparisons presented in this work are intended to give the first insights into the applicability and value of PAAS-4λ for long-term aerosol monitoring purposes in (remote) air quality stations. Future analyses of such data will help give a better understanding of the contribution of light-absorbing particles to the aerosol composition, sources, atmospheric processing, long-term trends, and the role of combustion aerosol for climate forcing. Furthermore, this study has demonstrated, for the first time, the utility of the PAS technology for long-term unattended monitoring operations. This makes the technology a noteworthy candidate for the correct quantification of light-absorbing particles and their spectral absorption properties in monitoring networks alongside commonly used filter-based methods.
The data used for the intercomparison of PAAS-4λ with AE33, MAAP, and COSMOS are available from https://doi.org/10.5445/IR/1000158429 (Schnaiter et al., 2023) in the KITOpen repository, the central open-access publication platform of KIT (email: kitopen@bibliothek.kit.edu).
The supplement related to this article is available online at: https://doi.org/10.5194/amt-16-2753-2023-supplement.
FMS led the PAAS-4λ development and the installation at Pallas as part of the ATMO-ACCESS project. FMS analysed the PAAS-4λ, AE33, and MAAP data with the help of APH, EA, HS, and EJ. SO and YK provided the COSMOS data. FMS calibrated and characterized the PAAS-4λ instrument with the help of CL. All co-authors contributed to the interpretation of the results. FMS wrote the paper with the help of all co-authors.
Franz Martin Schnaiter and Emma Järvinen are members of schnaiTEC GmbH, the PAAS-4λ manufacturer. Franz Martin Schnaiter is employed part-time by schnaiTEC GmbH.
Publisher’s note: Copernicus Publications remains neutral with regard to jurisdictional claims in published maps and institutional affiliations.
The authors thank the custodian of the Sammaltunturi station Mirka Hatanpää and the station team for their logistical help.
This work has been supported by the research programme “Changing Earth – Sustaining our Future” of the German Helmholtz Association. Emma Järvinen has been supported by the Helmholtz Association's Initiative and Networking Fund (grant no. VH-NG-1531). Eija Asmi, Henri Servomaa, and Antti-Pekka Hyvärinen have been supported by the ACCC Flagship of the Academy of Finland (grant no. 337552). The deployment of PAAS-4λ at the Pallas–Sodankylä Atmosphere–Ecosystem Supersite Facility is part of a project that has been supported by the European Commission under the Horizon 2020 Research and Innovation Framework Programme (H2020-INFRAIA-2020-1; grant no. 101008004). The COSMOS measurements at Pallas have been supported by the Japanese Ministry of Education, Culture, Sports, Science and Technology (MEXT), the Japan Society for the Promotion of Science KAKENHI grants (grant no. JP20H00638), the Arctic Challenge for Sustainability II (ArCS II) project (grant no. JPMXD1420318865), and the Environment Research and Technology Development Funds (grant no. JPMEERF20202003) of the Environmental Restoration and Conservation Agency of Japan.
The article processing charges for this open-access publication were covered by the Karlsruhe Institute of Technology (KIT).
This paper was edited by Pierre Herckes and reviewed by two anonymous referees.
Ajtai, T., Ágnes Filep, Schnaiter, M., Linke, C., Vragel, M., Bozóki, Z., Szabó;, G., and Leisner, T.: A novel multii-wavelength photoacoustic spectrometer for the measurement of the UV-vis-NIR spectral absorption coefficient of atmospheric aerosols, J. Aerosol Sci., 41, 1020–1029, 2010. a, b
Arnott, W. P., Moosmüller, H., and Walker, J. W.: Nitrogen dioxide and kerosene-flame soot calibration of photoacoustic instruments for measurement of light absorption by aerosols, Rev. Sci. Instrum., 71, 4545, https://doi.org/10.1063/1.1322585, 2000. a
Asmi, E., Backman, J., Servomaa, H., Virkkula, A., Gini, M. I., Eleftheriadis, K., Müller, T., Ohata, S., Kondo, Y., and Hyvärinen, A.: Absorption instruments inter-comparison campaign at the Arctic Pallas station, Atmos. Meas. Tech., 14, 5397–5413, https://doi.org/10.5194/amt-14-5397-2021, 2021. a, b, c
Bluvshtein, N., Flores, J. M., He, Q., Segre, E., Segev, L., Hong, N., Donohue, A., Hilfiker, J. N., and Rudich, Y.: Calibration of a multi-pass photoacoustic spectrometer cell using light-absorbing aerosols, Atmos. Meas. Tech., 10, 1203–1213, https://doi.org/10.5194/amt-10-1203-2017, 2017. a, b, c
Bozóki, Z., Pogány, A., and Szabó, G.: Photoacoustic instruments for practical applications: Present, potentials, and future challenges, Appl. Spectrosc. Rev., 46, 1–37, https://doi.org/10.1080/05704928.2010.520178, 2011. a, b, c, d
Collaud Coen, M., Weingartner, E., Apituley, A., Ceburnis, D., Fierz-Schmidhauser, R., Flentje, H., Henzing, J. S., Jennings, S. G., Moerman, M., Petzold, A., Schmid, O., and Baltensperger, U.: Minimizing light absorption measurement artifacts of the Aethalometer: evaluation of five correction algorithms, Atmos. Meas. Tech., 3, 457–474, https://doi.org/10.5194/amt-3-457-2010, 2010. a
Drinovec, L., Močnik, G., Zotter, P., Prévôt, A. S. H., Ruckstuhl, C., Coz, E., Rupakheti, M., Sciare, J., Müller, T., Wiedensohler, A., and Hansen, A. D. A.: The ”dual-spot” Aethalometer: an improved measurement of aerosol black carbon with real-time loading compensation, Atmos. Meas. Tech., 8, 1965–1979, https://doi.org/10.5194/amt-8-1965-2015, 2015. a
Fischer, D. A. and Smith, G. D.: A portable, four-wavelength, single-cell photoacoustic spectrometer for ambient aerosol absorption, Aerosol Sci. Tech., 52, 393–406, https://doi.org/10.1080/02786826.2017.1413231, 2018. a, b, c, d, e, f
Foster, K., Pokhrel, R., Burkhart, M., and Murphy, S.: A novel approach to calibrating a photoacoustic absorption spectrometer using polydisperse absorbing aerosol, Atmos. Meas. Tech., 12, 3351–3363, https://doi.org/10.5194/amt-12-3351-2019, 2019. a
Haisch, C.: Photoacoustic spectroscopy for analytical measurements, Meas. Sci. Technol., 23, 1–17, https://doi.org/10.1088/0957-0233/23/1/012001, 2012. a
Haisch, C., Menzenbach, P., Bladt, H., and Niessner, R.: A wide spectral range photoacoustic aerosol absorption spectrometer, Anal. Chem., 84, 8941–8945, https://doi.org/10.1021/ac302194u, 2012. a
Hyvärinen, A. P., Kolmonen, P., Kerminen, V. M., Virkkula, A., Leskinen, A., Komppula, M., Hatakka, J., Burkhart, J., Stohl, A., Aalto, P., Kulmala, M., Lehtinen, K. E., Viisanen, Y., and Lihavainen, H.: Aerosol black carbon at five background measurement sites over Finland, a gateway to the Arctic, Atmos. Environ., 45, 4042–4050, https://doi.org/10.1016/j.atmosenv.2011.04.026, 2011. a, b, c, d
Kirchstetter, T. W., Novakov, T., and Hobbs, P. V.: Evidence that the spectral dependence of light absorption by aerosols is affected by organic carbon, J. Geophys. Res.-Atmos., 109, D21208, https://doi.org/10.1029/2004JD004999, 2004. a
Lack, D. A., Lovejoy, E. R., Baynard, T., Pettersson, A., and Ravishankara, A. R.: Aerosol Absorption Measurement using Photoacoustic Spectroscopy: Sensitivity, Calibration, and Uncertainty Developments, Aerosol Sci. Tech., 40, 697–708, https://doi.org/10.1080/02786820600803917, 2006. a
Lack, D. A., Richardson, M. S., Law, D., Langridge, J. M., Cappa, C. D., McLaughlin, R. J., and Murphy, D. M.: Aircraft instrument for comprehensive characterization of aerosol optical properties, part 2: Black and brown carbon absorption and absorption enhancement measured with photo acoustic spectroscopy, Aerosol Sci. Tech., 46, 555–568, https://doi.org/10.1080/02786826.2011.645955, 2012. a
Langridge, J. M., Richardson, M. S., Lack, D. A., Brock, C. A., and Murphy, D. M.: Limitations of the Photoacoustic Technique for Aerosol Absorption Measurement at High Relative Humidity, Aerosol Sci. Tech., 47, 1163–1173, https://doi.org/10.1080/02786826.2013.827324, 2013. a, b
Lewis, K., Arnott, W. P., Moosmüller, H., and Wold, C. E.: Strong spectral variation of biomass smoke light absorption and single scattering albedo observed with a novel dual-wavelength photoacoustic instrument, J. Geophys. Res.-Atmos., 113, 1–14, https://doi.org/10.1029/2007JD009699, 2008. a, b
Linke, C., Ibrahim, I., Schleicher, N., Hitzenberger, R., Andreae, M. O., Leisner, T., and Schnaiter, M.: A novel single-cavity three-wavelength photoacoustic spectrometer for atmospheric aerosol research, Atmos. Meas. Tech., 9, 5331–5346, https://doi.org/10.5194/amt-9-5331-2016, 2016. a, b
Lohila, A., Penttilä, T., Jortikka, S., Aalto, T., Anttila, P., Asmi, E., Aurela, M., Hatakka, J., Hellén, H., Henttonen, H., Hänninen, P., Kilkki, J., Kyllönen, K., Laurila, T., Lepistö, A., Lihavainen, H., Makkonen, U., Paatero, J., Rask, M., Sutinen, R., Tuovinen, J.-P., Vuorenmaa, J., and Viisanen, Y.: Preface to the special issue on integrated research of atmosphere, ecosystems and environment at Pallas, Boreal Environ. Res., 20, 431–454, https://helda.helsinki.fi/handle/10138/228278 (last access: 26 May 2023), 2015. a
Luoma, K., Virkkula, A., Aalto, P., Lehtipalo, K., Petäjä, T., and Kulmala, M.: Effects of different correction algorithms on absorption coefficient – a comparison of three optical absorption photometers at a boreal forest site, Atmos. Meas. Tech., 14, 6419–6441, https://doi.org/10.5194/amt-14-6419-2021, 2021. a, b, c
Miklós, A., Hess, P., and Bozóki, Z.: Application of acoustic resonators in photoacoustic trace gas analysis and metrology, Rev. Sci. Instrum., 72, 1937–1955, https://doi.org/10.1063/1.1353198, 2001. a, b
Moosmüller, H., Chakrabarty, R. K., and Arnott, W. P.: Aerosol light absorption and its measurement: A review, J. Quant. Spectrosc. Ra., 110, 844–878, https://doi.org/10.1016/j.jqsrt.2009.02.035, 2009. a
Nakayama, T., Suzuki, H., Kagamitani, S., Ikeda, Y., Uchiyama, A., and Matsumi, Y.: Characterization of a three wavelength photoacoustic soot spectrometer (Pass-3) and a photoacoustic extinctiometer (pax), J. Meteorol. Soc. Jpn., 93, 285–308, https://doi.org/10.2151/jmsj.2015-016, 2015. a
Ohata, S., Mori, T., Kondo, Y., Sharma, S., Hyvärinen, A., Andrews, E., Tunved, P., Asmi, E., Backman, J., Servomaa, H., Veber, D., Eleftheriadis, K., Vratolis, S., Krejci, R., Zieger, P., Koike, M., Kanaya, Y., Yoshida, A., Moteki, N., Zhao, Y., Tobo, Y., Matsushita, J., and Oshima, N.: Estimates of mass absorption cross sections of black carbon for filter-based absorption photometers in the Arctic, Atmos. Meas. Tech., 14, 6723–6748, https://doi.org/10.5194/amt-14-6723-2021, 2021. a, b, c, d
Petzold, A. and Schönlinner, M.: Multi-angle absorption photometry – A new method for the measurement of aerosol light absorption and atmospheric black carbon, J. Aerosol Sci., 35, 421–441, https://doi.org/10.1016/j.jaerosci.2003.09.005, 2004. a, b
Petzold, A., Rasp, K., Weinzierl, B., Esselborn, M., Hamburger, T., Dörnbrack, A., Kandler, K., Schütz, L., Knippertz, P., Fiebig, M., and Virkkula, A.: Saharan dust absorption and refractive index from aircraft-based observations during SAMUM 2006, Tellus B, 61, 118–130, https://doi.org/10.1111/j.1600-0889.2008.00383.x, 2009. a
Roehl, C. M., Orlando, J. J., Tyndall, G. S., Shetter, R. E., Vazquez, G. J., Cantrell, C. A., and Calvert, J. G.: Temperature dependence of the quantum yields for the photolysis of NO2 near the dissociation limit, J. Phys. Chem.-US, 98, 7837–7843, https://doi.org/10.1021/j100083a015, 1994. a, b
Rosencwaig, A.: Photoacoustics and Photoacoustic Spectroscopy, Chemical analysis; 57A Wiley Interscience Publication, Wiley, New York, ISBN 0471044954, 1980. a
Sandradewi, J., Prévôt, A. S., Weingartner, E., Schmidhauser, R., Gysel, M., and Baltensperger, U.: A study of wood burning and traffic aerosols in an Alpine valley using a multi-wavelength Aethalometer, Atmos. Environ., 42, 101–112, https://doi.org/10.1016/j.atmosenv.2007.09.034, 2008. a
Schnaiter, M., Horvath, H., Möhler, O., Naumann, K. H., Saathoff, H., and Schöck, O. W.: UV-VIS-NIR spectral optical properties of soot and soot-containing aerosols, J. Aerosol Sci., 34, 1421–1444, 2003. a
Schnaiter, M., Schmid, O., Petzold, A., Fritzsche, L., Klein, K. F., Andreae, M. O., Helas, G., Thielmann, A., Gimmler, M., Möhler, O., Linke, C., and Schurath, U.: Measurement of Wavelength-Resolved Light Absorption by Aerosols Utilizing a UV-VIS Extinction Cell, Aerosol Sci. Tech., 39, 249–260, https://doi.org/10.1080/027868290925958, 2005. a
Schnaiter, M., Linke, C., Asmi, E., Servomaa, H., Hyvärinen, A.-P., Ohata, S., Kondo, Y., and Järvinen, E.: Air quality monitoring data from Pallas, Finland for the period between December 21, 2021 and November 21, 2022, which was used for an intercomparison of aerosol light absorption instruments, KITOpenData, KIT Library [data set], https://doi.org/10.5445/IR/1000158429, 2023. a
Sharma, N., Arnold, I. J., Moosmüller, H., Arnott, W. P., and Mazzoleni, C.: Photoacoustic and nephelometric spectroscopy of aerosol optical properties with a supercontinuum light source, Atmos. Meas. Tech., 6, 3501–3513, https://doi.org/10.5194/amt-6-3501-2013, 2013. a
Tian, G., Moosmüller, H., and Arnott, W. P.: Influence of photolysis on multispectral photoacoustic measurement of nitrogen dioxide concentration, J. Air Waste Manage., 63, 1091–1097, https://doi.org/10.1080/10962247.2013.790323, 2013. a
Vandaele, A. C., Hermans, C., Fally, S., Carleer, M., Colin, R., Mérienne, M. F., Jenouvrier, A., and Coquart, B.: High-resolution Fourier transform measurement of the NO2 visible and near-infrared absorption cross sections: Temperature and pressure effects, J. Geophy. Res.-Atmos., 107, ACH 3-1–ACH 3-12, https://doi.org/10.1029/2001JD000971, 2002. a, b
Visser, B., Röhrbein, J., Steigmeier, P., Drinovec, L., Močnik, G., and Weingartner, E.: A single-beam photothermal interferometer for in situ measurements of aerosol light absorption, Atmos. Meas. Tech., 13, 7097–7111, https://doi.org/10.5194/amt-13-7097-2020, 2020. a
Weingartner, E., Saathoff, H., Schnaiter, M., Streit, N., Bitnar, B., and Baltensperger, U.: Absorption of light by soot particles: determination of the absorption coefficient by means of aethalometers, J. Aerosol Sci., 34, 1445–1463, https://doi.org/10.1016/S0021-8502(03)00359-8, 2003. a, b, c
Yus-Díez, J., Bernardoni, V., Močnik, G., Alastuey, A., Ciniglia, D., Ivančič, M., Querol, X., Perez, N., Reche, C., Rigler, M., Vecchi, R., Valentini, S., and Pandolfi, M.: Determination of the multiple-scattering correction factor and its cross-sensitivity to scattering and wavelength dependence for different AE33 Aethalometer filter tapes: a multi-instrumental approach, Atmos. Meas. Tech., 14, 6335–6355, https://doi.org/10.5194/amt-14-6335-2021, 2021. a, b
- Abstract
- Introduction
- Instrument design and operation principle
- Instrument calibration and performance
- Measurement examples from a remote field site
- Summary
- Data availability
- Author contributions
- Competing interests
- Disclaimer
- Acknowledgements
- Financial support
- Review statement
- References
- Supplement