the Creative Commons Attribution 4.0 License.
the Creative Commons Attribution 4.0 License.
 | 28 Jun 2023
Design and evaluation of a thermal precipitation aerosol electrometer (TPAE)
Shipeng Kang
Tongzhu Yu
Yixin Yang
Jiguang Wang
Huaqiao Gui
Jianguo Liu
A new aerosol electrometer (AE), the thermal precipitation aerosol electrometer (TPAE), was designed for use with particles of sizes less than 300 nm, and its performance was experimentally evaluated. The TPAE combines the thermal precipitator with a microcurrent measurement circuit board (i.e., pre-amplifier) for measuring the current carried by collected particles. The thermal precipitator is in the disk-to-disk configuration. Heating paste and air cooling were adopted to establish the desired temperature gradient in the precipitation chamber. At a sample flow rate of 0.3 L min−1 and a temperature gradient of 264 K cm−1, the precipitation efficiency of 70 nm particles reaches ∼100 %. The measurement range of the designed aerosol electrometer is fA, and the accuracy is ±2 fA (2500 to 6.25×107 cm−3 using a flow rate of 0.3 L min−1 and assuming that only singly charged particles exist in the sample). During the evaluation process, the electrical performance of the TPAE was first tested using sodium chloride (NaCl) and soot particles previously classified by a differential mobility analyzer (DMA) and compared to the reference. The precipitation performance of the TPAE was then characterized as functions of the temperature gradient, sampling flow rate and particle size. It was shown that the particle collection efficiency of the built-in thermal precipitator is inversely proportional to the sampling flow rate and proportional to the temperature gradient. The effect of particle size on the particle collection efficiency was minor for NaCl particles of sizes between 23 and 200 nm. Unlike that which was observed for the NaCl particles, a slightly positive correlation between the collection efficiency and the mobility size for soot particles (in the size range of 30–160 nm) was observed. This observation might be due to the existence of soot agglomerates. Compared to existing electrometers, the TPAE does not require the use of high-efficiency filters and includes the additional feature of the “soft” collection of particles for offline particle characterization as well as aerosol current measurement.
- Article
(4465 KB) - Full-text XML
- BibTeX
- EndNote


Instruments for measuring the integral parameters of aerosol particles, e.g., the total number, surface area and mass concentration of particles, are important for the characterization of particulate matter (PM) emitted from various PM sources. Example applications of such instruments include the measurement of vehicle particle emissions (Faxvog and Roessler, 2007; Kheirkhah et al., 2020), ocean aerosols (Held et al., 2011), atmospheric aerosols (Hillemann et al., 2014) and urban particles (Mølgaard et al., 2013, Etzion and Broday, 2018; Alas et al., 2019). Furthermore, such measurement instruments could be combined with a size or mobility classifier, e.g., differential mobility analyzers (DMAs), for measuring the size distribution of aerosol particles. An example of the above is electrical mobility particle sizers, which are widely applied for measuring the size distribution of fine and ultrafine particles.
Condensation particle counters (CPCs) and aerosol electrometers (AEs) are both typically used for the characterization of the total number concentration of aerosol particles. CPCs count the number of particles over a given time by enlarging the particle size (via condensation of the working fluid vapor) and counting them one by one (via optical means). The single-particle counting process of CPCs makes them suitable for measuring the number concentration of particles, particularly at low concentrations. CPCs have also been combined with DMAs (as scanning mobility particle sizers or SMPSs) to measure the size distribution of submicrometer-sized particles. The measurement task described above can also be accomplished by electrical means, where particles are first required to be electrically charged. The charge or current carried by the aerosol particles is then measured by an aerosol electrometer (AE) according to Liu and Pui (1975). Therefore, aerosol charges are required to work with AEs to measure the number concentration of particles (i.e., with the known average charges on particles provided by the charger). Another important usage of AEs is to calibrate the performance of CPCs using DMA-classified particles (Giechaskiel et al., 2009). A commercial version of the aerosol electrometer is the TSI Model 3068B. Note that the charger–AE assembly in that model has been applied to measure the total mass and surface area concentration of particles. However, the measurement tasks were accomplished by empirical calibration of the assembly responses via selected calibration particles. The calibration curves may be varied when measuring particles with the composition different to that of calibration particles.
A Faraday cup equipped with a high-efficiency filter is typically used in aerosol electrometers to collect sampled particles and to induce the current resulting from the continuous collection of charged particles. Yang et al. (2018a, b) developed an aerosol electrometer in which particles were collected by a metal filter, and then the current carried by particles was directly measured by a microcurrent measurement circuit (i.e., pre-amplifier) through a copper probe. The miniature diffusion size classifier (miniDiSC) developed by Fierz et al. (2018) used two filter stages to collect particles of different sizes, in which a porous metal filter is used in the first stage to collect small particles. Liu et al. (2020) developed a miniature electrical ultrafine particle sizer (mini-eUPS) in which a miniature aerosol electrometer was used after a plate electrical mobility classifier to detect the current carried by DMA-classified particles. A tapered element oscillating microbalance (TEOM) filter disk is used in the mini aerosol electrometer. Seol et al. (2000) developed a Faraday cup electrometer for operation at 200–930 Pa of pressure in which porous metal mesh and filters are used for collecting charged particles. Intra and Tippayawong (2014) used an aerosol electrometer to measure atmospheric ions and charged particles in which the particle collection was achieved using a high-efficiency particulate air (HEPA) filter.
Charged particles could also be collected by inertial impaction on electrically isolated metal substrates from which the current from the continuous collection of charged particles can be directly measured. An example of an instrument that uses such a technique is the electrical low-pressure impactor (ELPI; Keskinen et al., 1992). Electrical precipitation is another method for collecting charged particles, such as what is used in the Engine Exhaust Particle Sizer (EEPS) reported by Tammet et al. (2002) and Wang et al. (2016a, b). Electrostatic precipitation is also used in aerosol samplers for offline characterization of collected particles. A nanometer aerosol sampler (TSI model 3089; Dixkens and Fissan, 1999) is one example of such an aerosol sampler. The collection of charged particles either by filtration, inertial impaction or electrical means makes it possible to alter the morphology of collected particles, particularly for particle agglomerates (e.g., soot particles). However, the methods above are not favored for offline SEM analysis of particles, if required.
Compared to the collection methods described above, the collection of particles by thermal precipitation is a good candidate for the “soft” collection of particles, e.g., disk (Kethley et al., 1952; Wang et al., 2012a), plate-to-plate (Tsai and Lu, 1995) and cylindrical thermal precipitator (Bredl and Grieve, 1951; Wang et al., 2012b). Furthermore, the minor particle size effect on particle collection by thermal precipitation (for particles of sizes less than 300 nm) has been documented (Wang et al., 2012a). Note that collection by inertial impaction favors inertial particles, and electrical collection favors diffusive particles. The effectiveness of both collection methods depends significantly on the particle size.
In a thermal precipitator, particles are introduced into a precipitation zone in which a temperature gradient is established. The direction of the temperature gradient is typically perpendicular to that of the flow direction. Once the particles enter the precipitation chamber, the thermophoretic force moves the particles from the hot plate to the cold plate, and the particles eventually precipitate. If the cold plate is well insulated from other metal structures, it could serve as an electrode for current measurement, which also favors the cold environment due to the reduction of thermal noise. However, the cold plates of existing thermal precipitators cannot be directly connected to an electrometer due to poor electrical insulation. The structure and cooling methods of thermal precipitators must be redesigned for integrating thermal precipitation particle collection with the measurement of the aerosol current.
The objective of this work is thus the development of a thermal precipitation aerosol electrometer (TPAE), combining both thermal precipitation with current measurement for charged particles in one device. The overall performance of the prototype was experimentally calibrated and compared to that offered by Faraday cup aerosol electrometers. For the electrical performance evaluation, the zero point and response time of the electrometer was calibrated, and the linear correlation of readouts of the TPAE and the reference was examined. For the thermal precipitation performance, the collection efficiency of the TPAE was investigated as functions of the temperature gradient, sampling flow rate and particle sizes. NaCl particles and soot particles were used as test particles.
Figure 1 shows the schematic diagram of the thermal precipitation aerosol electrometer (TPAE). The TPAE consists of two parts: one part for the thermal deposition of particles and the other for the measurement of current carried by collected particles. The thermal precipitation part is in the disk-to-disk configuration. Sampled aerosol particles enter the precipitation chamber from the inlet tube located at the disk center, then radially flow outwards in the space defined by two separated and centered disks, and eventually exit through a series of evenly distributed holes (at the outer diameter of the disks) to a circumferential chamber designed at the disk edge. A temperature gradient is established between two aluminum disks (with the top disk heated and the bottom disk cooled). The spacing between the two disks is controlled by PEEK (polyetheretherketone) gaskets. To improve the precipitation efficiency of particles and reduce the size of the TPAE, the constructed thermal precipitation chamber is 0.5 mm in gap distance and its diameter is 120 mm. In the thermal precipitation chamber, the temperature gradient deflects the motion of sampled particles from the flow. The top disk is heated by attaching a heating paster on its outside, while the cold disk is cooled by air flowing in the chamber underneath the precipitation chamber (i.e., air-cooling chamber). Driven by the suction from the outlet of the air-cooling chamber, the cooling air enters the chamber through a series of holes located close to the chamber's outer diameter. The flow rate of cooling air (∼20 L min−1) is monitored by a mass flowmeter (Beijing Sevenstar Flow, Model CS100). Four thermistors (Songtian Electronics, 100 KΩ) were used to measure the temperatures of the heat and cold disks.
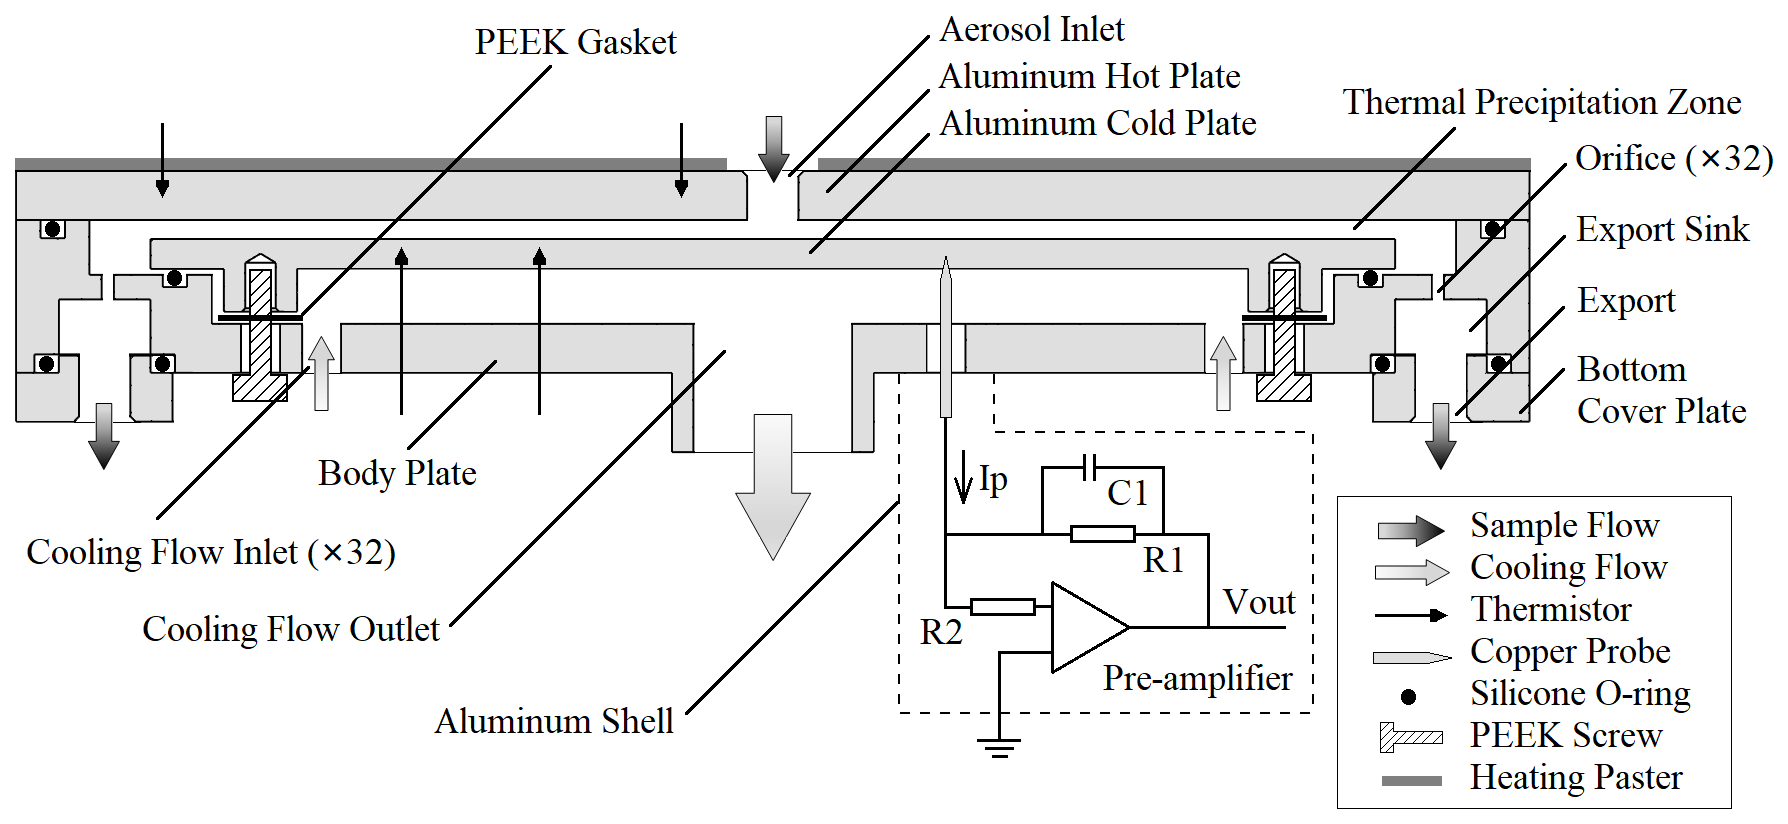
Figure 1Schematic diagram of the prototype thermal precipitation aerosol electrometer (TPAE).
A spring-loaded solid copper pin is attached to the cold disk for measuring the current carried by the collected particles. With the above arrangement, the cold disk serves as the electrode for the current measurement and is enclosed in the cage formed by the hot metal plate and the air-cooling chamber, protecting the pre-amplifier from potential electromagnetic interference. Note that the copper pin is exposed to the cooling air, and the thermal noise of the pre-amplifier can also be reduced if cold air is used. As shown by the dashed line in Fig. 1, the current carried by the charged particles was measured through a R1 resistor of 10 GΩ so that Vout at the output pin of the pre-amplifier (ADA4530-1) can be calculated using the current. The supply voltage of the pre-amplifier is ±5 V, resulting in the measuring range of the TPAE being ±5 V/10 GΩ fA. A capacitor C1 (47 pF) was used to suppress the noise bandwidth. The current and the number of sampled particles (assuming all the particles are carrying the same charges) can be calculated using Eqs. (1) and (2), where ΔIp is the increment of discharge current, ΔVout is the increment of the pre-amplifier output, ΔNp is the increment of the number of collected particles, e is the elementary charge, x is the average charge of the charged particles (determined by an aerosol charger, which is not a part of the TPAE), and η is the particle collection efficiency:
In practical terms,
where Ipm and Voutm are measured values while I0, V0 and N0 are the zero-point value of the thermal precipitation aerosol electrometer. The zero points, x and η, are parameters to be determined by experiments. To calculate Npm in the measurements, the zero point must be measured under the charged-particle-free flow condition (i.e., with a HEPA filter placed at the inlet of the TPAE).
To evaluate the performance of the TPAE, the basic performance of the electrometer and the particle collection efficiency of the thermal precipitation zone must first be investigated. The basic performance of the electrometer includes the zero point, the low response time, and its output linearity with the readout of a reference electrometer.
3.1 Experimental setup
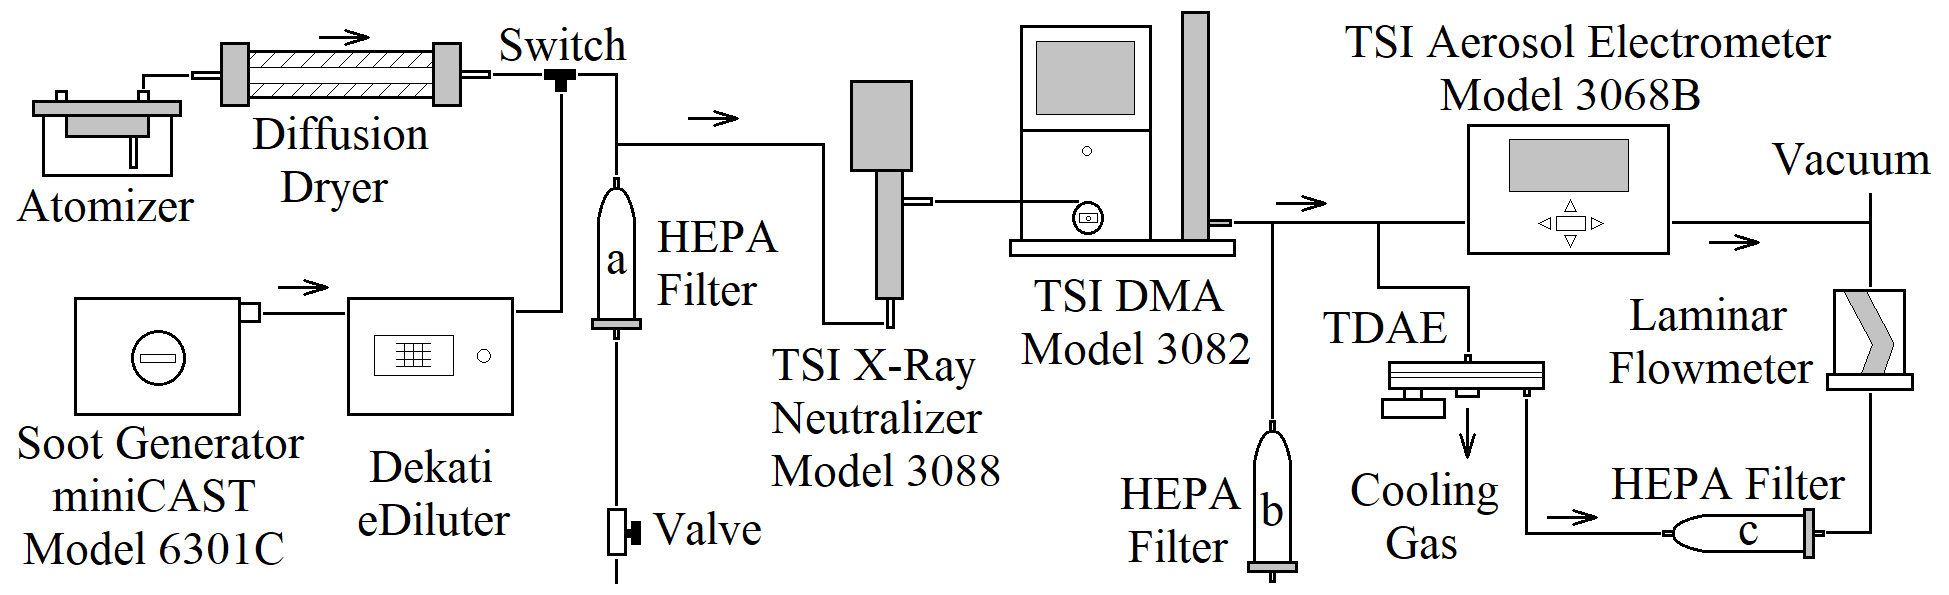
Figure 2 shows the schematic diagram of the experimental setup to investigate the performance of the TPAE. The aerosol electrometer (TSI Model 3068B) was selected as the reference in the setup. NaCl droplets were generated by the atomizer (TSI Model 9302) with aqueous NaCl solutions of 0.005 g mL−1, and a diffusion-type dryer was used to remove the water in droplets. Soot particles were generated by a soot generator (Jing, Model miniCAST 6301C) with propane as the fuel. A diluter was applied to reduce the soot particle concentration. A differential mobility analyzer (DMA, TSI Model 3082) was utilized to classify test particles of selected electrical mobility sizes. Particles entering the DMA were passed through a soft X-ray aerosol charger (TSI Model 3088). A bypass line with a HEPA filter and a valve was included preceding the charger to make sure that the desired flow rate was entering the charger and the DMA. The prototype and a Faraday cup aerosol electrometer (TSI Model 3068B) were set up in parallel connected downstream of the DMA. The other bypass line with a HEPA filter was also included to ensure the total flow rate required for operation of the prototype and reference electrometer. The sampled particle-laden flow was driven by a vacuum pump and monitored by a laminar flowmeter. The sampled particle flow after the TPAE was passed through a HEPA filter to remove any uncollected particles prior to the laminar flowmeter. The cooling air of the TPAE was driven by suction from the outlet of the air-cooling chamber via a pump. A vacuum pump was connected to the TSI aerosol electrometer to drive its flow rate. Note that the sampling flow rates of the TPAE and the TSI electrometer were kept the same in the experiments.
The Voutm of the TPAE was then converted to digital signals, which were sent to a PC so that Ipm could be recorded in real time at 4 Hz and averaged to 1 Hz.
3.2 Experimental design
3.2.1 Measurement of zero point
A stable zero point is the basis for any current measurement by an electrometer. A high fluctuation of the zero point increases the threshold signal-to-noise ratio, making the measurement less sensitive, and a drifting of the zero point results in inaccurate measurements. An experiment using the setup described in the previous section was carried out to measure the zero point trend during the warm-up of the TPAE. In this part of the experiments, the air flow was entirely provided by the bypass line installed after the DMA, which was accomplished by shutting down the soot generator and valve in the bypass line installed before the soft X-ray aerosol charger. The sampling flow rates of the TPAE was set at 0.3 L min−1. The cooling air flow rate was at ∼20 L min−1. According to preliminary experiments, particles of sizes smaller than 100 nm were totally collected under this setting (thus it was set to be the typical TPAE working condition). Note that, due to the fact that the zero point varies based on the ambient temperature and many other environmental factors, it is measured prior to each test measurement.
3.2.2 Experiment of response time
A step response experiment was performed to measure the response time of the TPAE. For an aerosol electrometer, the response time is affected by the rate of particle collection and the performance of the pre-amplifier. In this part of the calibration, the soot generator was used. The temperature gradient of the TPAE was set at 264 K cm−1. The sample flow rates of the TPAE and the TSI aerosol electrometer were kept at either 0.3 or 0.6 L min−1. The response time of the TPAE was tested under two working settings, i.e., at 0.3 L min−1 to study the full precipitation efficiency (∼100 %) and at 0.6 L min−1 for the low collection efficiency. After the two aerosol electrometers were warmed up, a switch valve (installed between the atomizer and soot generator lines) was used to manually impose a step change in the number concentration of soot particles. The DMA was set to classify soot particles with an electrical mobility size of 70 nm.
3.2.3 Investigation of the linearity of two aerosol electrometer readouts
This part of the experiment calibrated the readout linearity of both the TPAE and the TSI aerosol electrometer. The collection efficiency of the HEPA filter used in the TSI aerosol electrometer is close to 100 %. The particle collection efficiency of the TPAE was assumed to be constant with the given temperature gradient and sampling flow rate according to previous works (Wang et al., 2012a). For this calibration, soot particles of various concentrations were produced. The electrical mobility size of test particles was 70 nm (classified by the DMA). The temperature gradient of the TPAE was maintained at 264 K cm−1 and the sampling flow rates of the TPAE and the TSI aerosol electrometer were both set at 0.3 L min−1. For each test concentration, the average of the readouts in 1 min was reported for the comparison.
3.2.4 Study of the particle collection efficiency of the TPAE
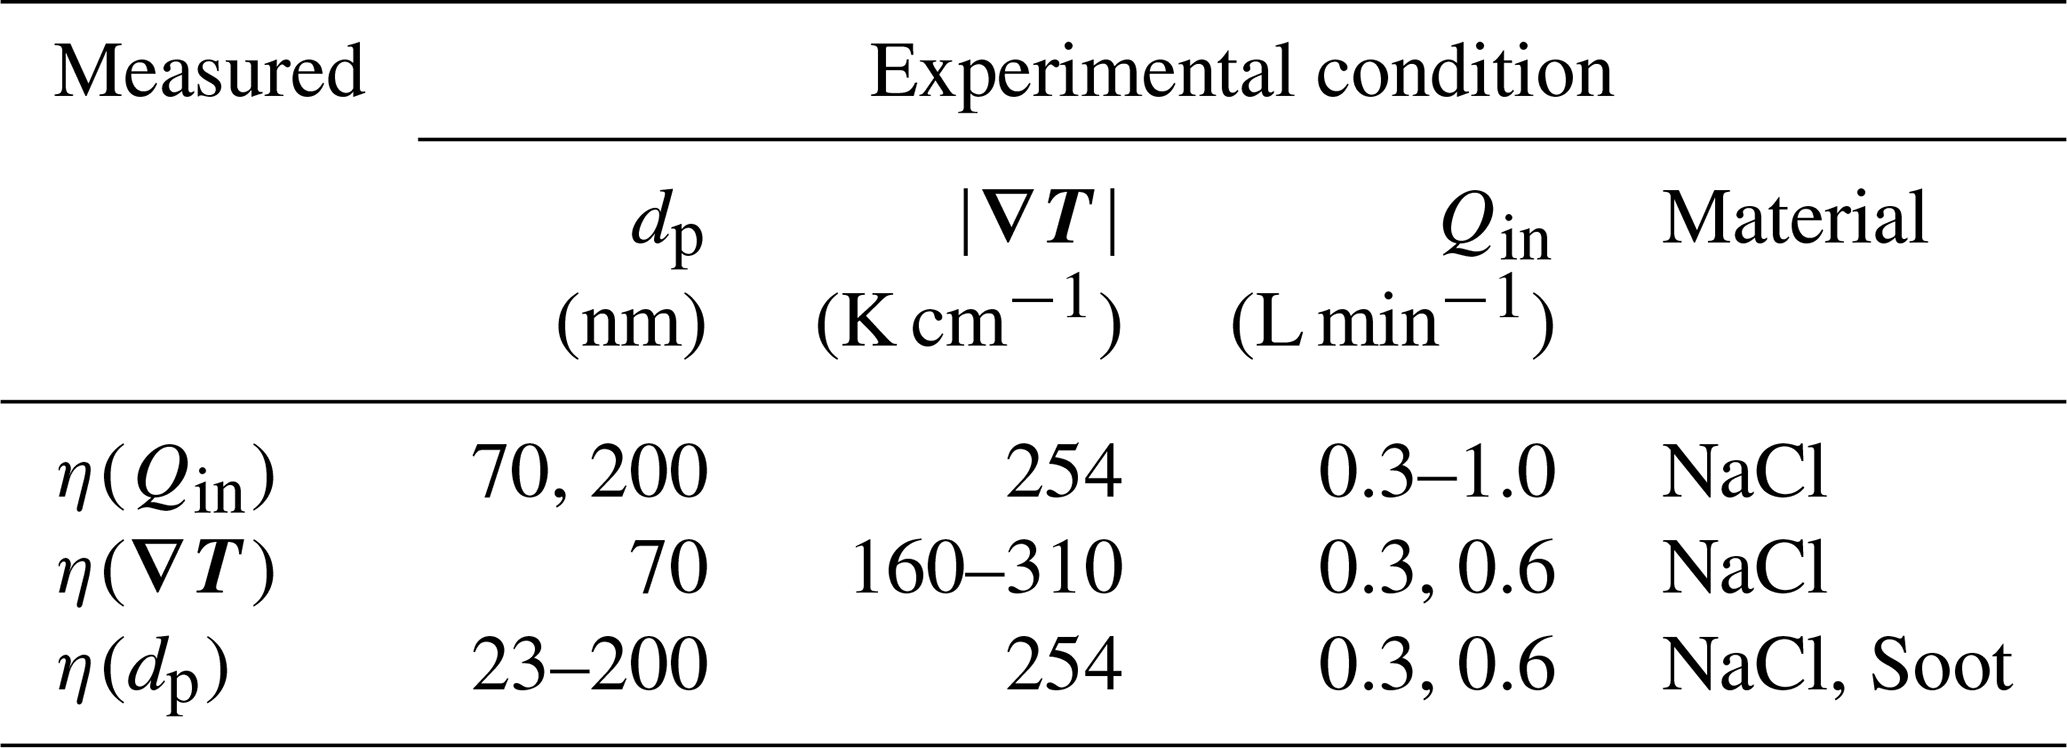
For this part of the study, the collection efficiency of the TPAE was measured as the function of the sampling flow rate, temperature gradient and electrical mobility size, i.e., η(Qin), η(∇T) and η(dp), respectively, where ∇T is the temperature gradient of thermal precipitation field, dp is the electromigration particle diameter and Qin is the sampling flow rate. For the measurements of η(Qin) and η(∇T) of the prototype, sodium chloride particles with electrical mobility diameters ranging from 23–200 nm were tested, while for η(dp), both sodium chloride and soot particles were tested.
By keeping the transport tubes that connect the DMA exit to both the TPAE and the TSI aerosol electrometer the same length, it was assumed that the particle loss in the tubes was the same since the sampling flow rate of both electrometers was kept the same for a given test. The collection efficiency, η, was then calculated by Eq. (4), where Is is the current measured by the TSI aerosol electrometer:
The temperature gradient, ∇T, was calculated by Eq. (5), where W is the gap distance of the thermal precipitation zone, and the direction of ∇T is perpendicular to the disks (from the hot one to the cold one):
Varying the ∇T was done by changing the cooling flow rate. The electrical mobility diameter, dp, of the test particles was determined by the DMA operation, whose ratio of sheath flow to aerosol sampling flow rate was 4:1. The sampling flow rate of the TPAE, Qin, was controlled by a valve and monitored by a laminar flowmeter. Table 1 summarizes the experimental conditions for this part of the study.
Table 1Experimental conditions for the measurements of TPAE collection efficiency.
3.3 Model for the particle collection efficiency of thermal precipitation
To validate the measured particle collection efficiency of the TPAE, we applied the model developed by Wang et al. (2012a) to calculate the thermal deposition efficiency of thermal precipitators in the disk-to-disk configuration and compared them to our measurements. The details of the model can be found in the work of Wang et al. (2012a). A summary of the model is given for reference. Assuming that the flow is steady-state, incompressible, laminar and axisymmetric, and that particles are evenly distributed at the entrance, the collection efficiency of thermal precipitators in the disk configuration can be calculated as
where Qin is the aerosol sampling flow rate, r the radius of the precipitation disk and the thermal velocity is Vth, which is calculated as
where ∇T is the temperature gradient, T is the absolute temperature of particles, ρg is the density of carry gas and H is the thermophoretic coefficient. According to Talbot et al. (1980), H can be calculated by Eq. (8), where kg and kp are the conductivity of air and the particle, respectively; Cs=1.147, Ct=2.20 and Cm=1.146 are constants; Cc is the Cunningham correction factor calculated by Eq. (9).
where α=1.142, β=0.558, γ=0.999, Kn is the Knudsen number and λ is the mean free path of air.
According to Eq. (6), the collection efficiency, η, is inversely proportional to Qin.
4.1 Performance of electrometer
4.1.1 Zero-point measurement
Figure 3 shows the readouts of the TPAE during warm-up. For reference, the temperatures of the hot and cold disks are also given in the figure. At the initial time, the zero point of the electrometer was approximately 57 fA, and the temperatures of the hot and cold disks were both 22.3∘. During warm-up, the temperatures of the plates rose at different rates, establishing the increasing temperature gradient. The hot and cold disk temperatures eventually stabilized at 61.40∘ (±0.20∘) and 48.15∘ (±0.15∘), respectively. In the meantime, the TPAE readout reduced and finally stabilized at −20.68 fA (±2 fA). The warm-up of the prototype took approximately 40 min to establish the temperature gradient of 265 K cm−1 (±7 K cm−1). A higher temperature gradient can be realized by increasing the heating and cooling powers.
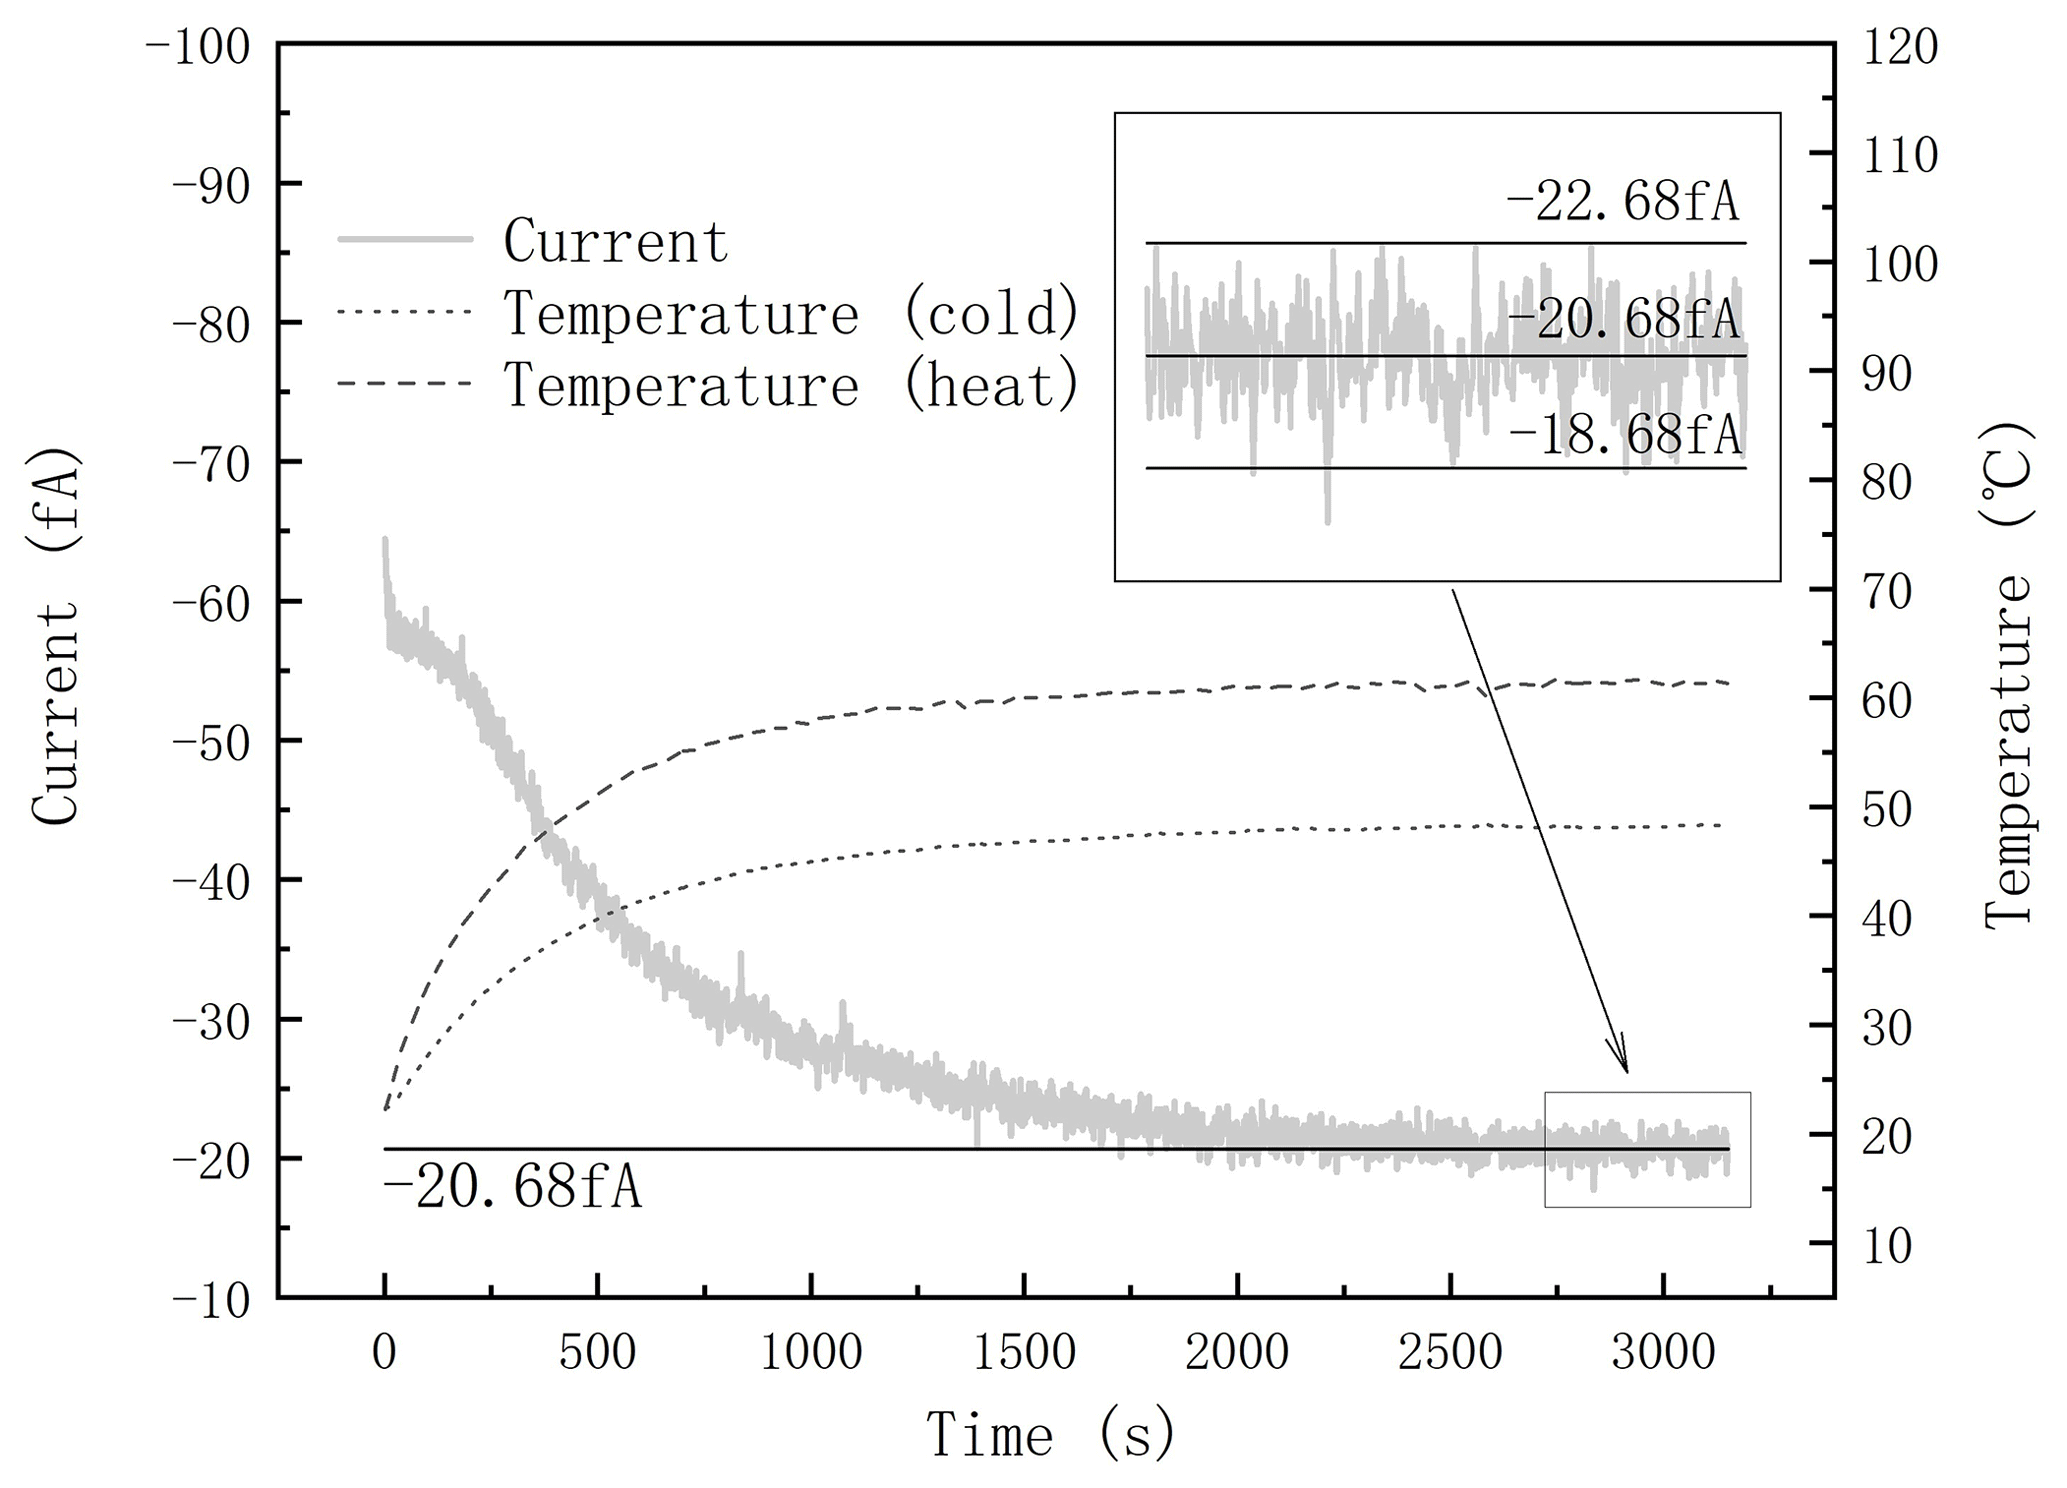
Assuming that particles in the sample gas are singly charged, sampling flow rate is Q, and e is elementary charge, the current I can be calculated as eNQ, where N is the particle number concentration. If Q=0.3 L min−1, N=1250 (cm−3) per femtoampere, the ±2 fA fluctuation is the equivalent of ±2500 cm−3.
4.1.2 Response time measurement
Figure 4 shows the readout of the TPAE experiencing a step change in the number concentration of soot particles at sampling flow rates of 0.3 L min−1 (a) and 0.6 L min−1 (b). For reference, the readout of the TSI aerosol electrometer is also included. It is found that the trends of the TPAE and the TSI aerosol electrometer are consistent. Ideally, ITPAE(t) equals ηI3068(t), t>0, where is the particle collection efficiency of the TPAE. The efficiency data as a function of time are also included in the figure. During the time periods of 0–30 and 140–170 s with the sampling flow rate at 0.3 L min−1, and the periods of 0–16 and 80–100 s with 0.6 L min−1, the current readouts were very low (close to zero), resulting in an unsteady η. Conversely, during the time periods of 40–120 and 25–70 s for the flow rates of 0.3 and 0.6 L min−1, respectively, the collection efficiency was constant. This is because the number concentration of the test particles was stable and the η was kept constant (i.e., 98.5 % (±1 %) for the 0.3 L min−1 case and 56.0 % (±1 %) for the 0.6 L min−1 case).
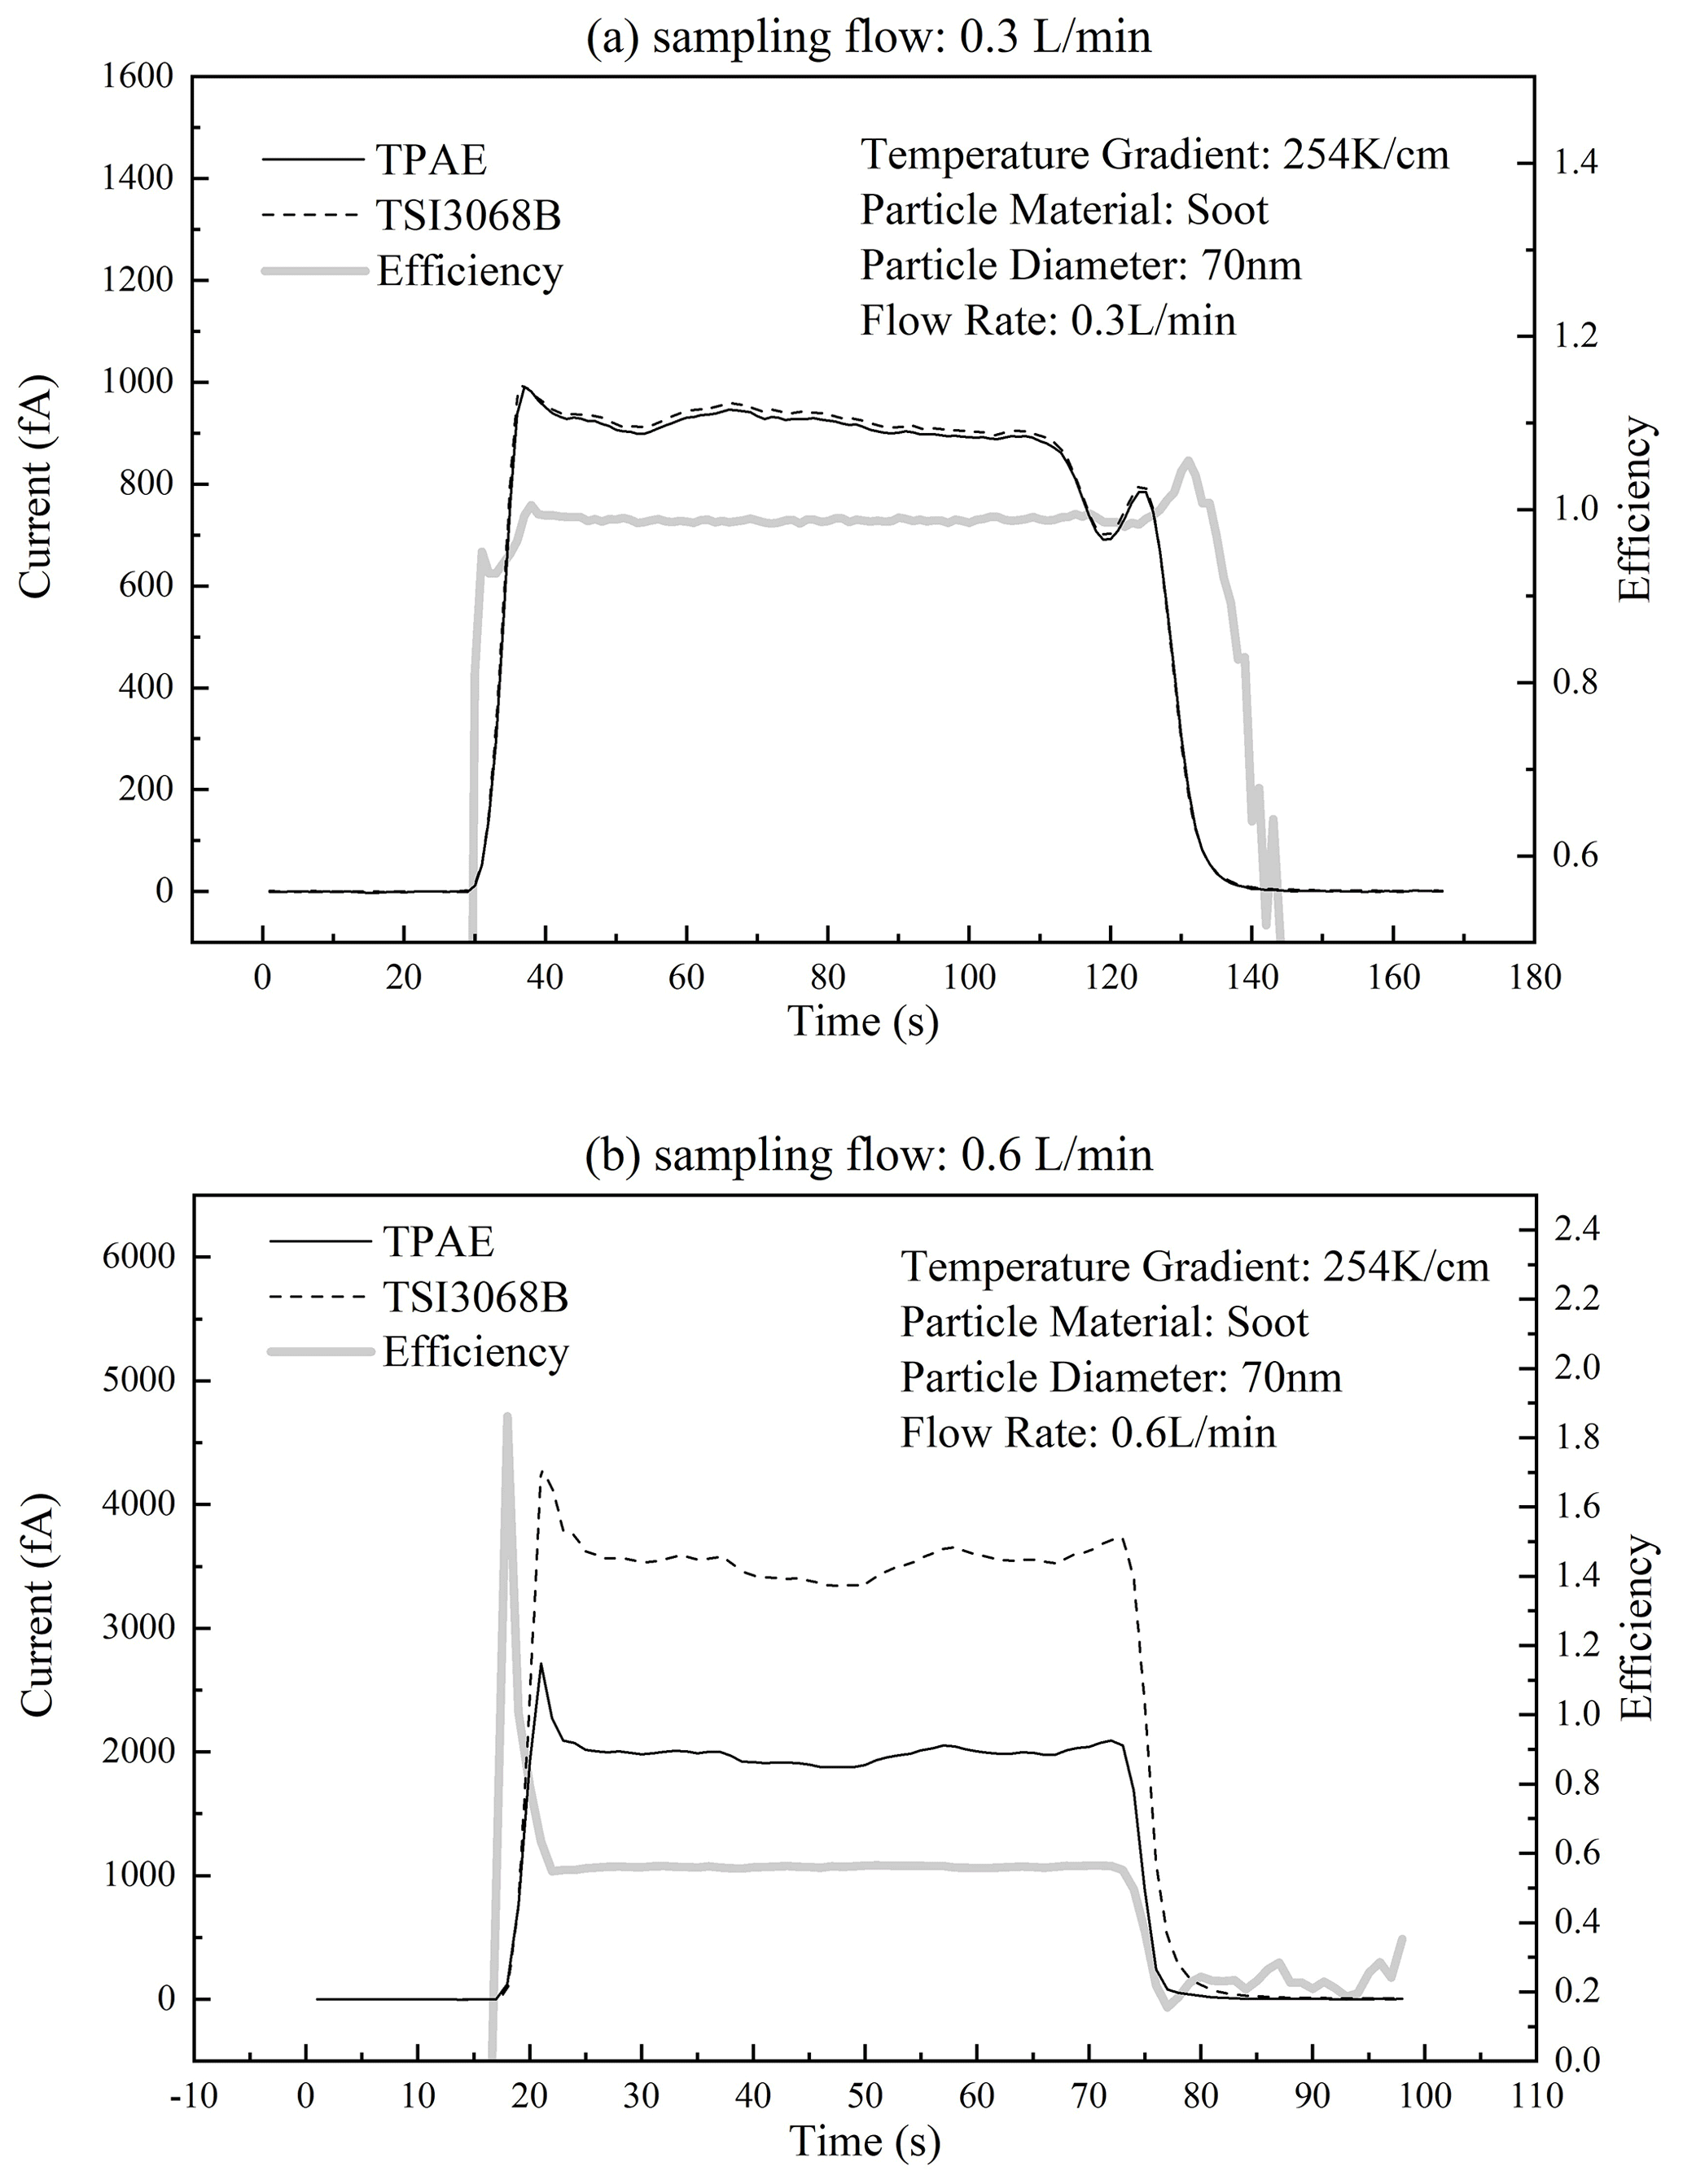
Figure 4The readout of the TPAE in response to the step particle concentration change. The readout of the TSI aerosol electrometer was also included as the reference.
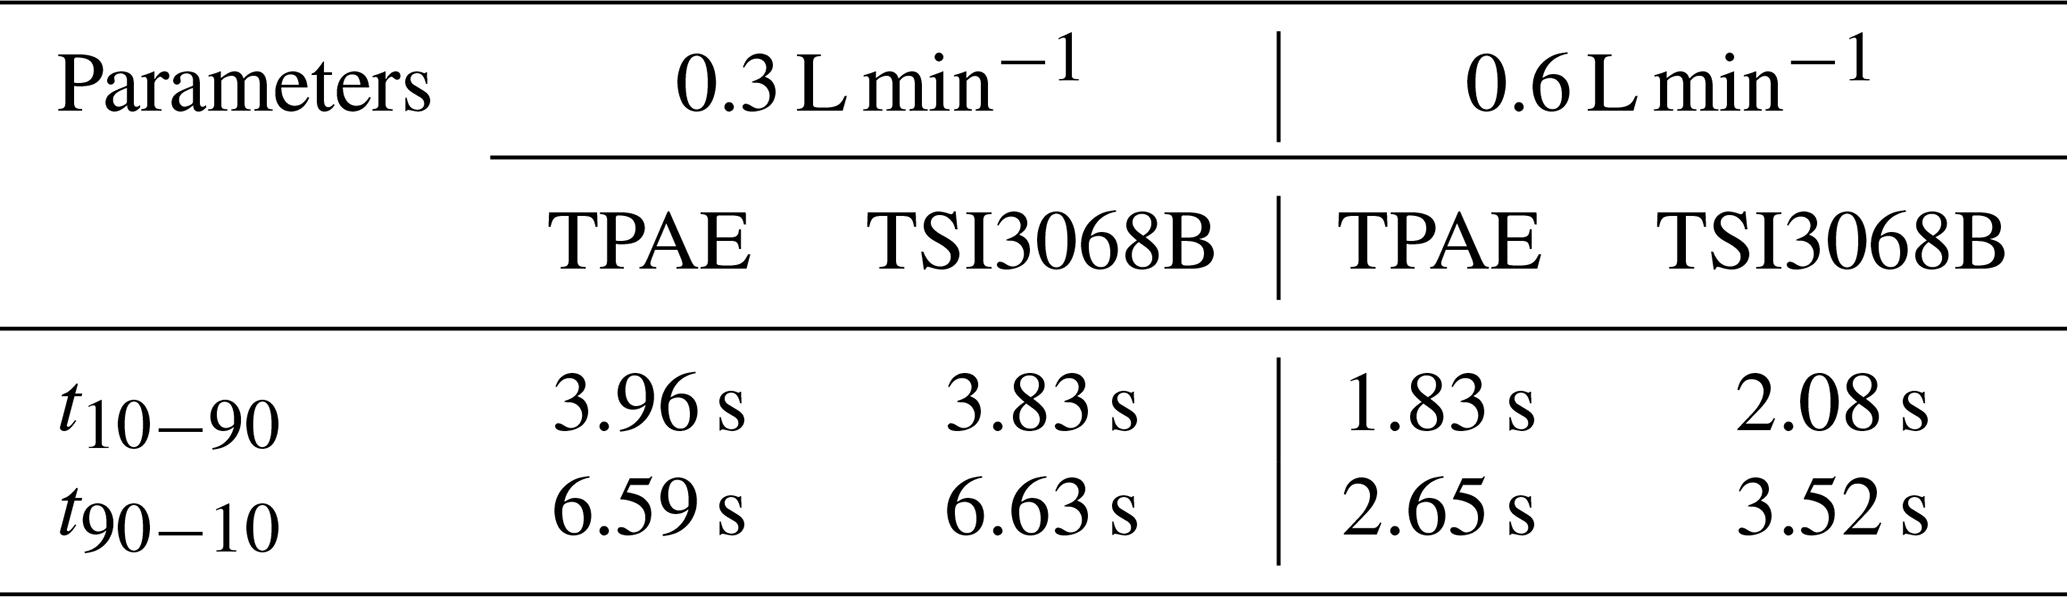
For the sampling flow rate of 0.3 L min−1, the collection efficiency during the time period of 30–40 s was less than 98.5 %, indicating that the response of the TPAE to a step rise in the particle concentration is slower than that offered by the TSI aerosol electrometer. The same observation can be found in the time period of 125–135 s. However, the response time difference between the two electrometers is within 1 s. A similar conclusion can be reached by examining the case with the sampling flow rate of 0.6 L min−1. Therefore, the response of the TPAE can keep up with that of the TSI aerosol electrometer within 1 s. The response of the AEs can be characterized by the times for the reading to rise from 10 % to 90 % of the final readout and for the reading to reduce from 90 % of an initial reading to 10 % when subjected to a step change in the particle concentration, i.e., t10−90 and t90−10, respectively. The values of t10−90 and t90−10 calculated from Fig. 4 are summarized in Table 2. Compared to the response times of the TSI3068B, the TPAE response time is almost the same as that of the TSI3068B at the flow rate of 0.3 L min−1 and slightly faster at the flow rate of 0.6 L min−1.
4.1.3 Readout linearity between two aerosol electrometers
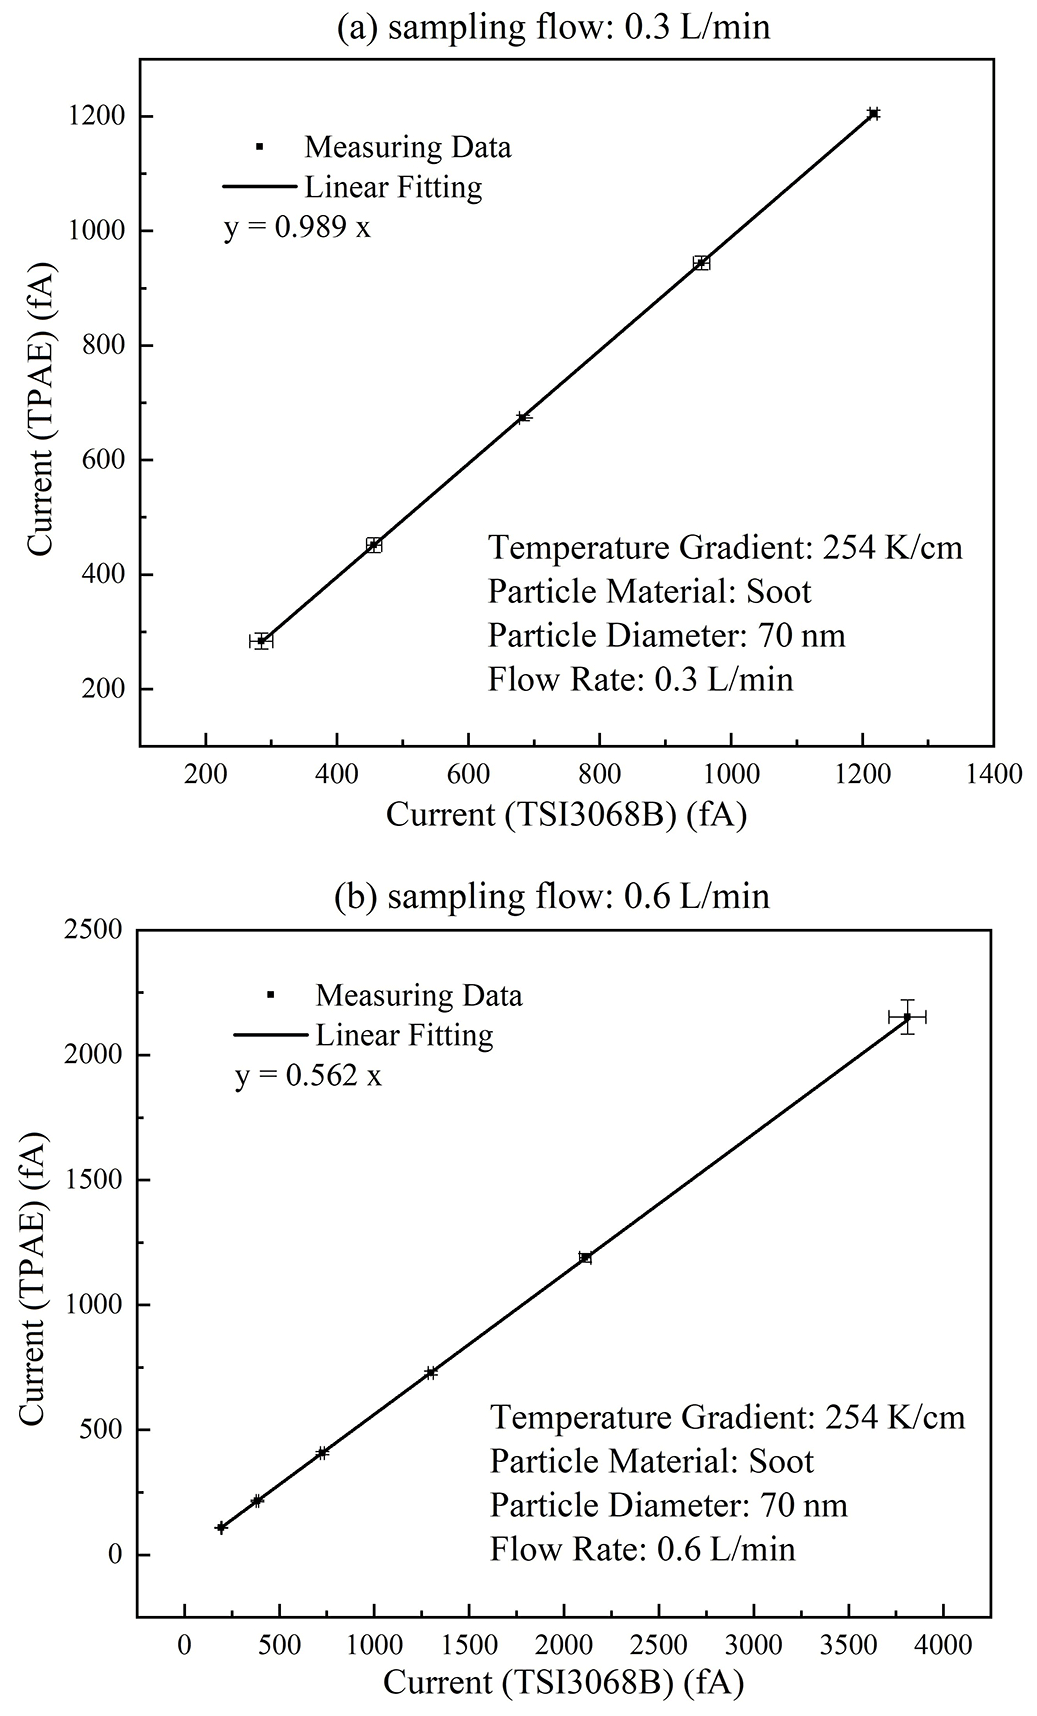
Figure 5 shows the readout correlation between the TPAE and TSI aerosol electrometers at the sampling flow rates of 0.3 and 0.6 L min−1. A linear correlation between the two readouts was observed. In the case of 0.3 L min−1 (Fig. 5a), the best linear fitting resulted in a slope of 0.989. Note that the slope of this best linear fitting is the particle collection efficiency of the TPAE. It is because the collection efficiency of the TSI aerosol electrometer is close to 100 %. Similarly, in the case of 0.6 L min−1 (Fig. 5b), the best linear fitting with a straight line obtained a slope of 0.562. The observation above of reduced particle collection efficiency with the increase of sampling flow rate is expected according to Eq. (3).
4.2 Investigation of TPAE particle collection efficiency
4.2.1 Effect of temperature gradient
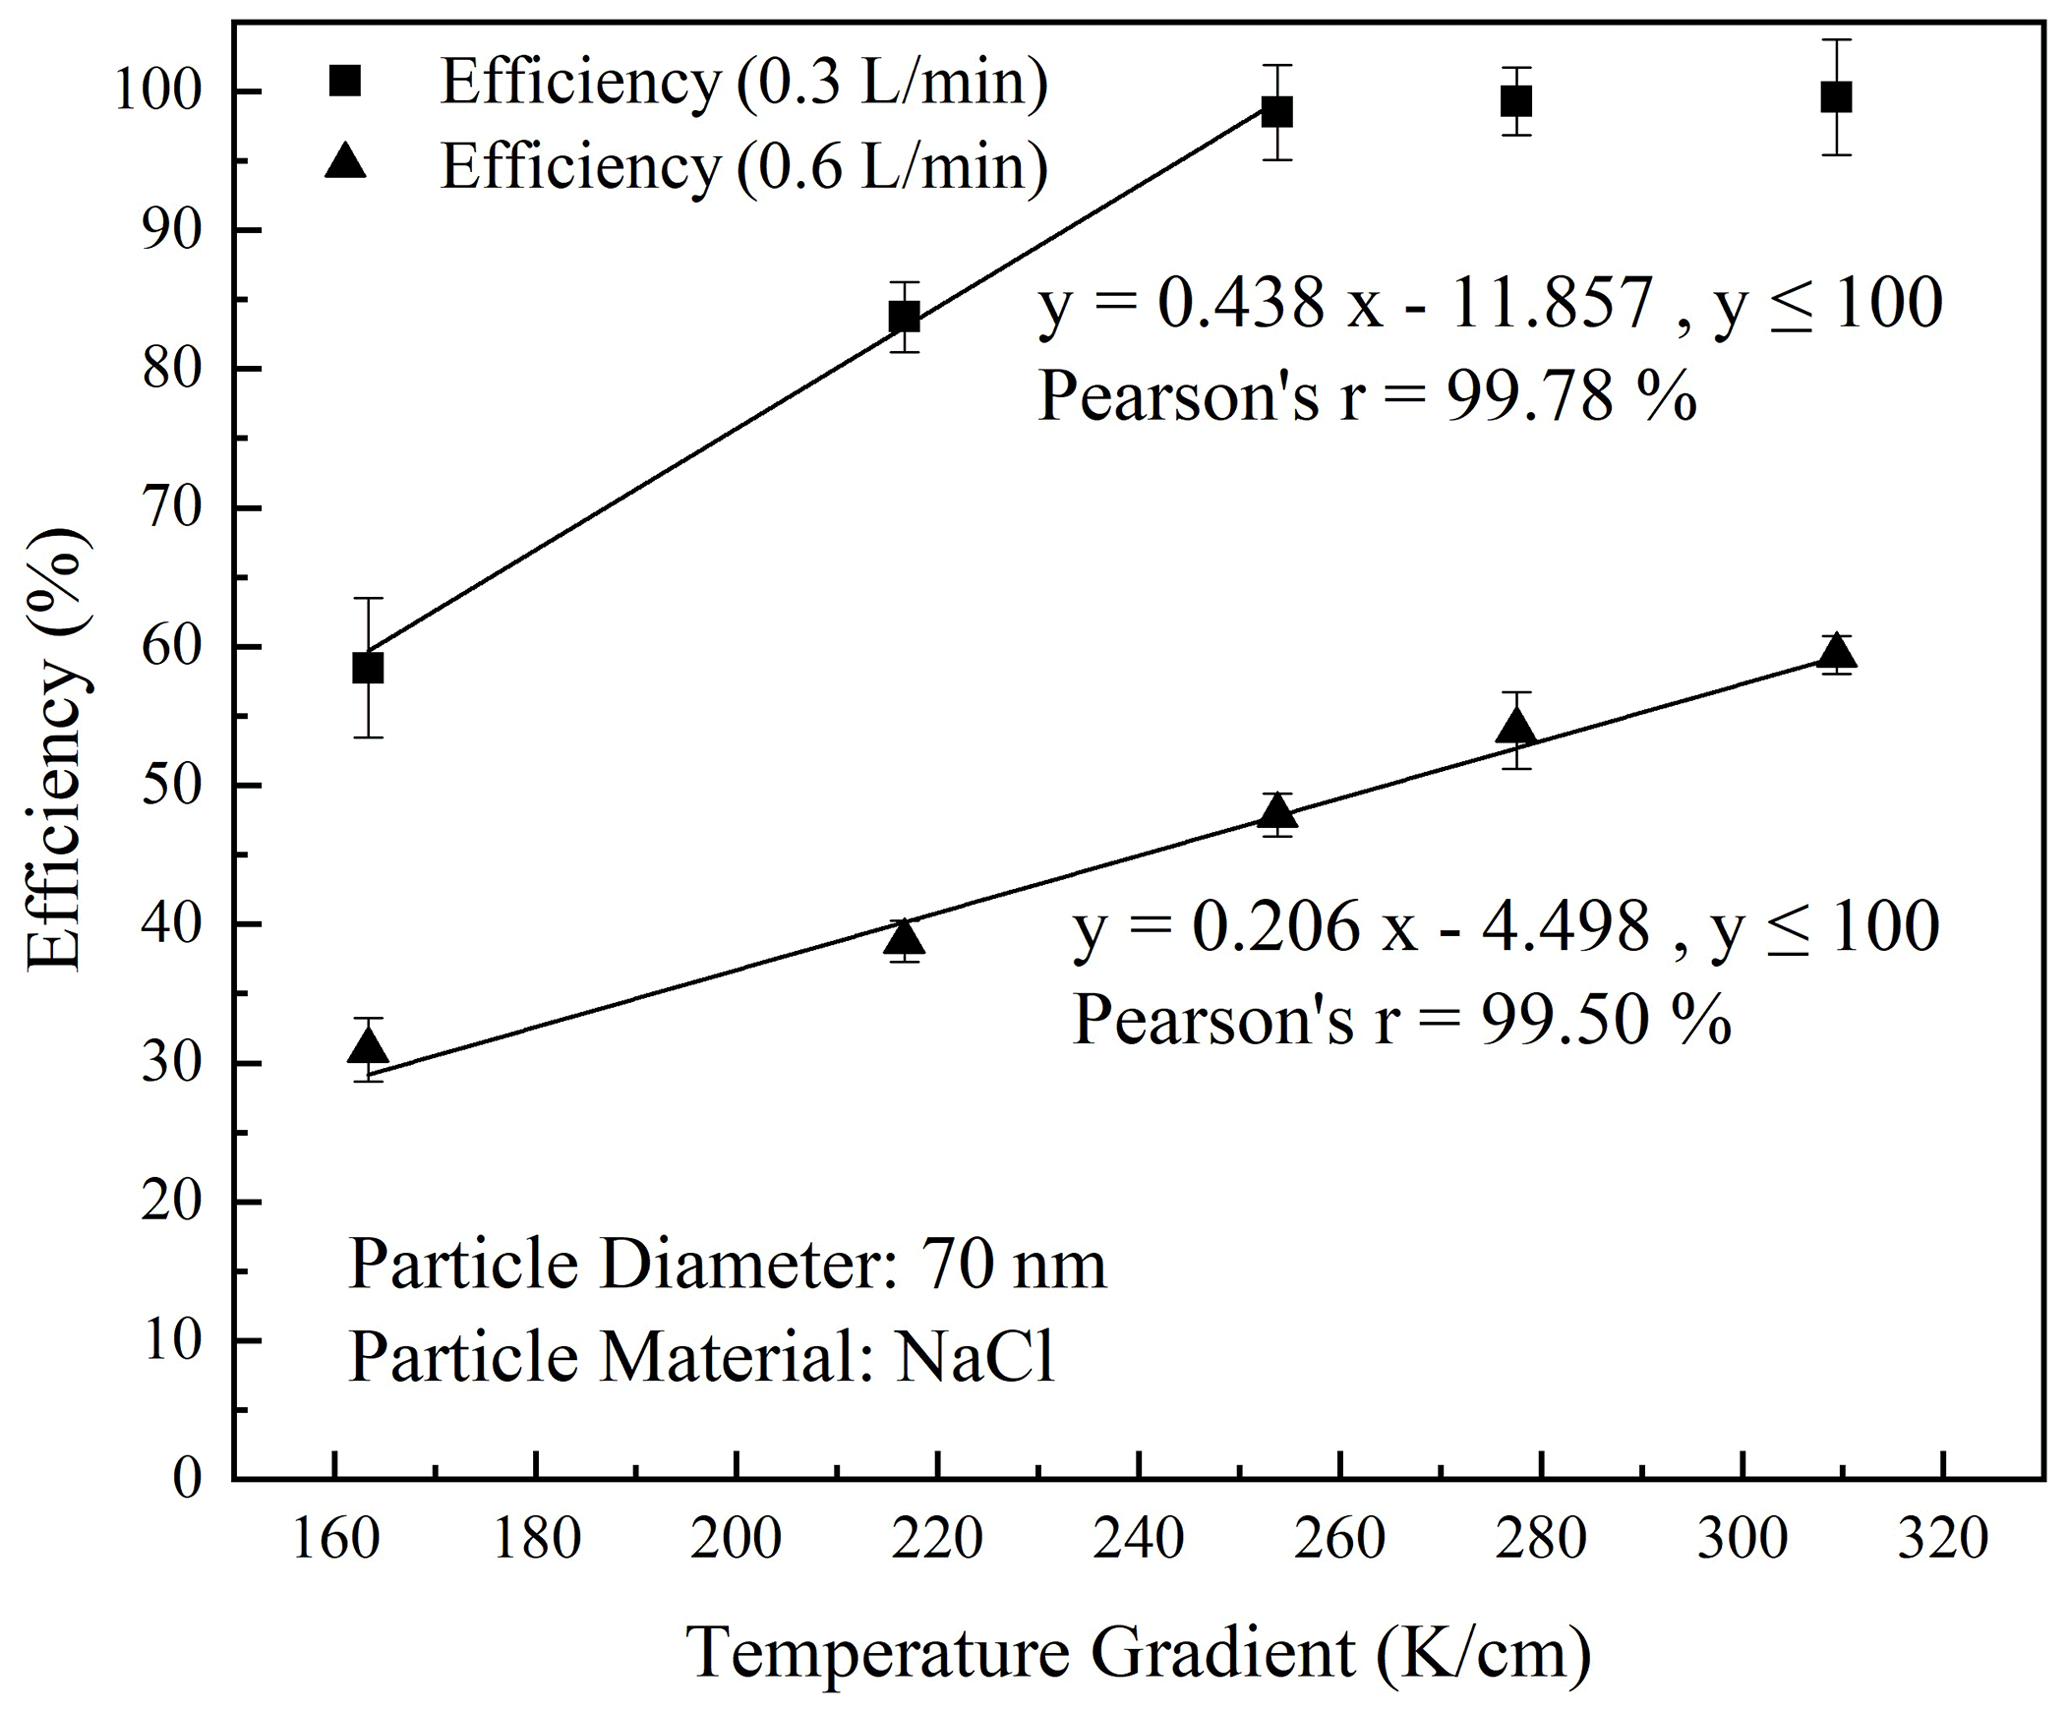
Figure 6 shows the particle collection efficiency of the TPAE as the function of the temperature gradient for NaCl particles of 70 nm in size and at the sampling flow rates of 0.3 and 0.6 L min−1. It is found that, for the 0.3 L min−1 flow rate, the collection efficiency linearly increases with the increase of the temperature gradient, and the collection efficiency reached ∼100 % when the gradient exceeded 264 K cm−1. For the flow rate of 0.6 L min−1, the collection efficiency is again linearly increased with the increase of temperature gradient within the test gradient range but did not reach ∼100 % collection efficiency. The above experimental observation is consistent with that given by Eq. (6).
4.2.2 Effects of sampling flow rate and particle size
In this part of the experiments, the temperature gradient in the TPAE was set at 264 K cm−1 and NaCl particles of 70 and 200 nm in sizes were selected for this investigation. The sampling flow rate of the TPAE was varied from 0.3 to 1.0 L min−1. Figure 7 shows the measured particle collection efficiency of the TPAE as a function of the sampling flow rate for a given particle size. As expected, for a given particle size, the collection efficiency was reduced as the sampling flow rate increased, and the reduction characteristics followed what was expected from Eq. (3); i.e., the collection efficiency is inversely proportional to the sampling flow rate (Qin). As a result, the products of and remained 30.0±1.7 % L min−1 and 26.2±2.0 % L min−1, respectively.
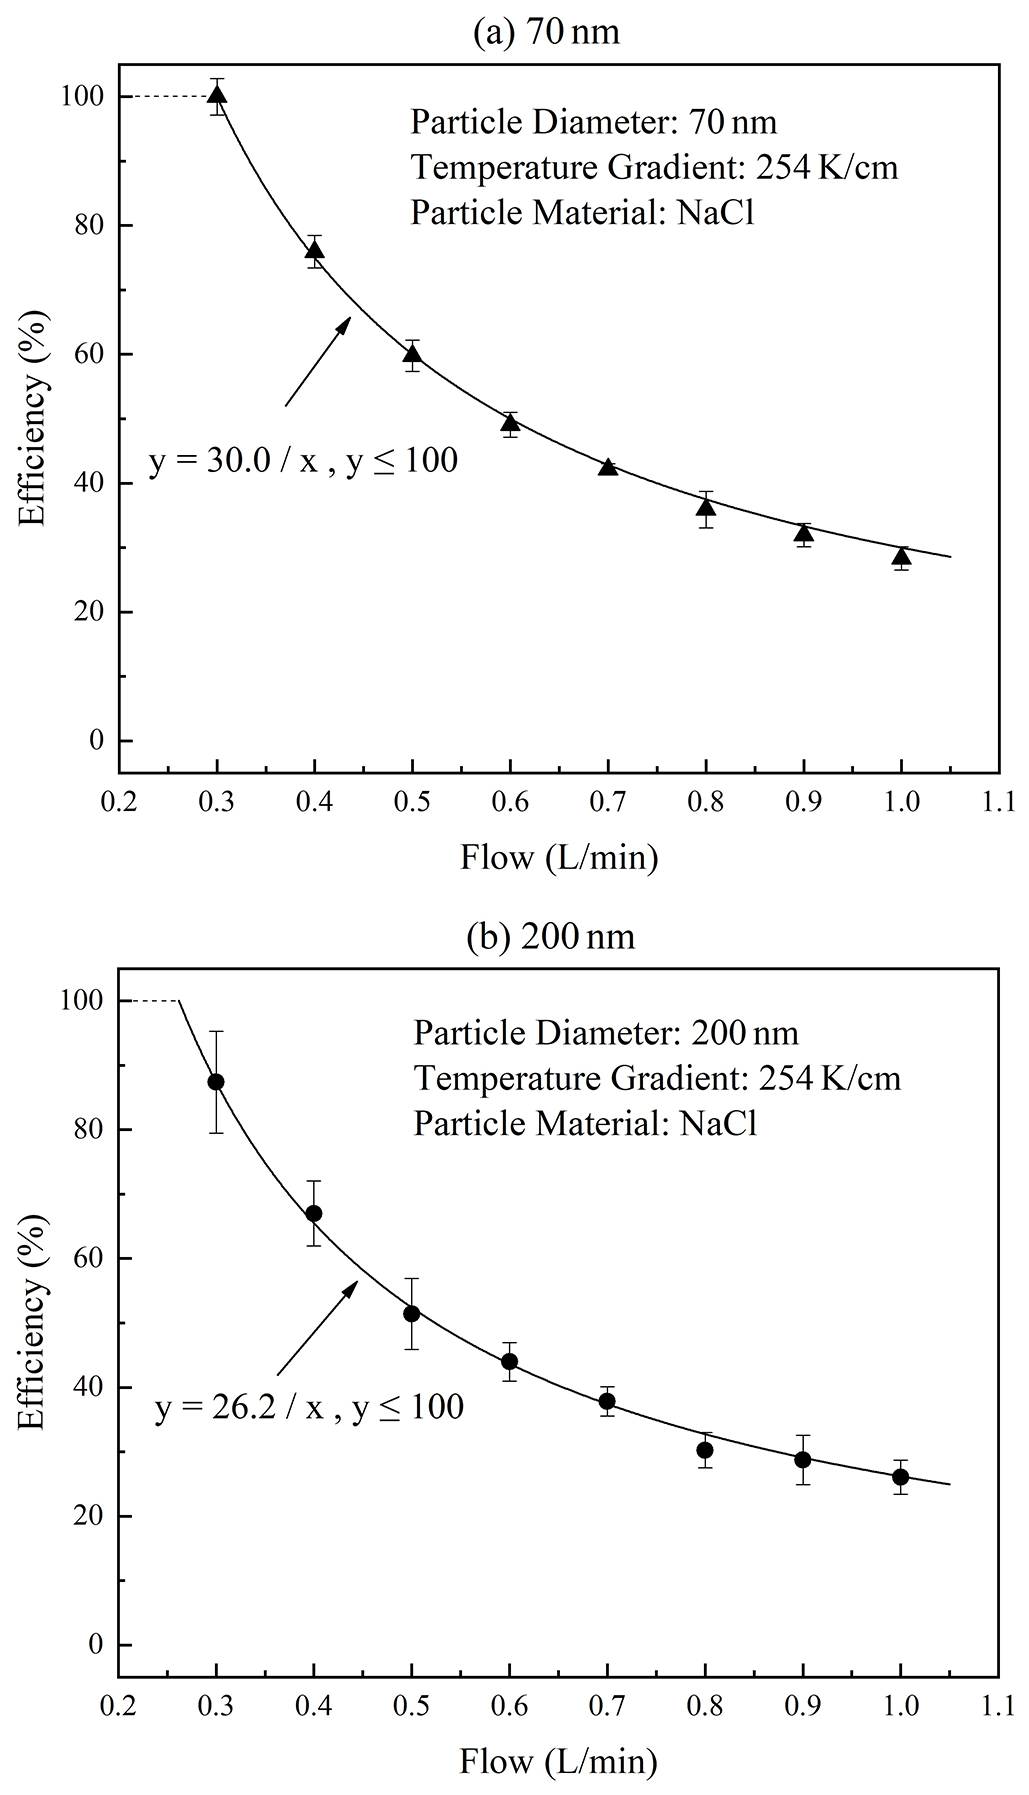
Figure 7The particle collection efficiency of the TPAE as the function of sampling flow rate at two different NaCl particles sizes, i.e., (a) 70 and (b) 200 nm.
The effect of particle size on the TPAE collection efficiency is given in Fig. 8 for the sampling flow rates of 0.3 and 0.6 L min−1. For particle sizes less than 120 nm, the efficiency was ∼98.9 % and ∼48.5 % for both 0.3 and 0.6 L min−1 flow rates, respectively. As the particle diameter increased, the collection efficiency of the TPAE was slightly decreased, which is consistent with the thermal precipitation velocity obtained in previous works (Beresnev et al., 2019; Wang et al., 2012a). According to Eqs. (7)–(9), the larger the particle size, the lower the thermal precipitation velocity.
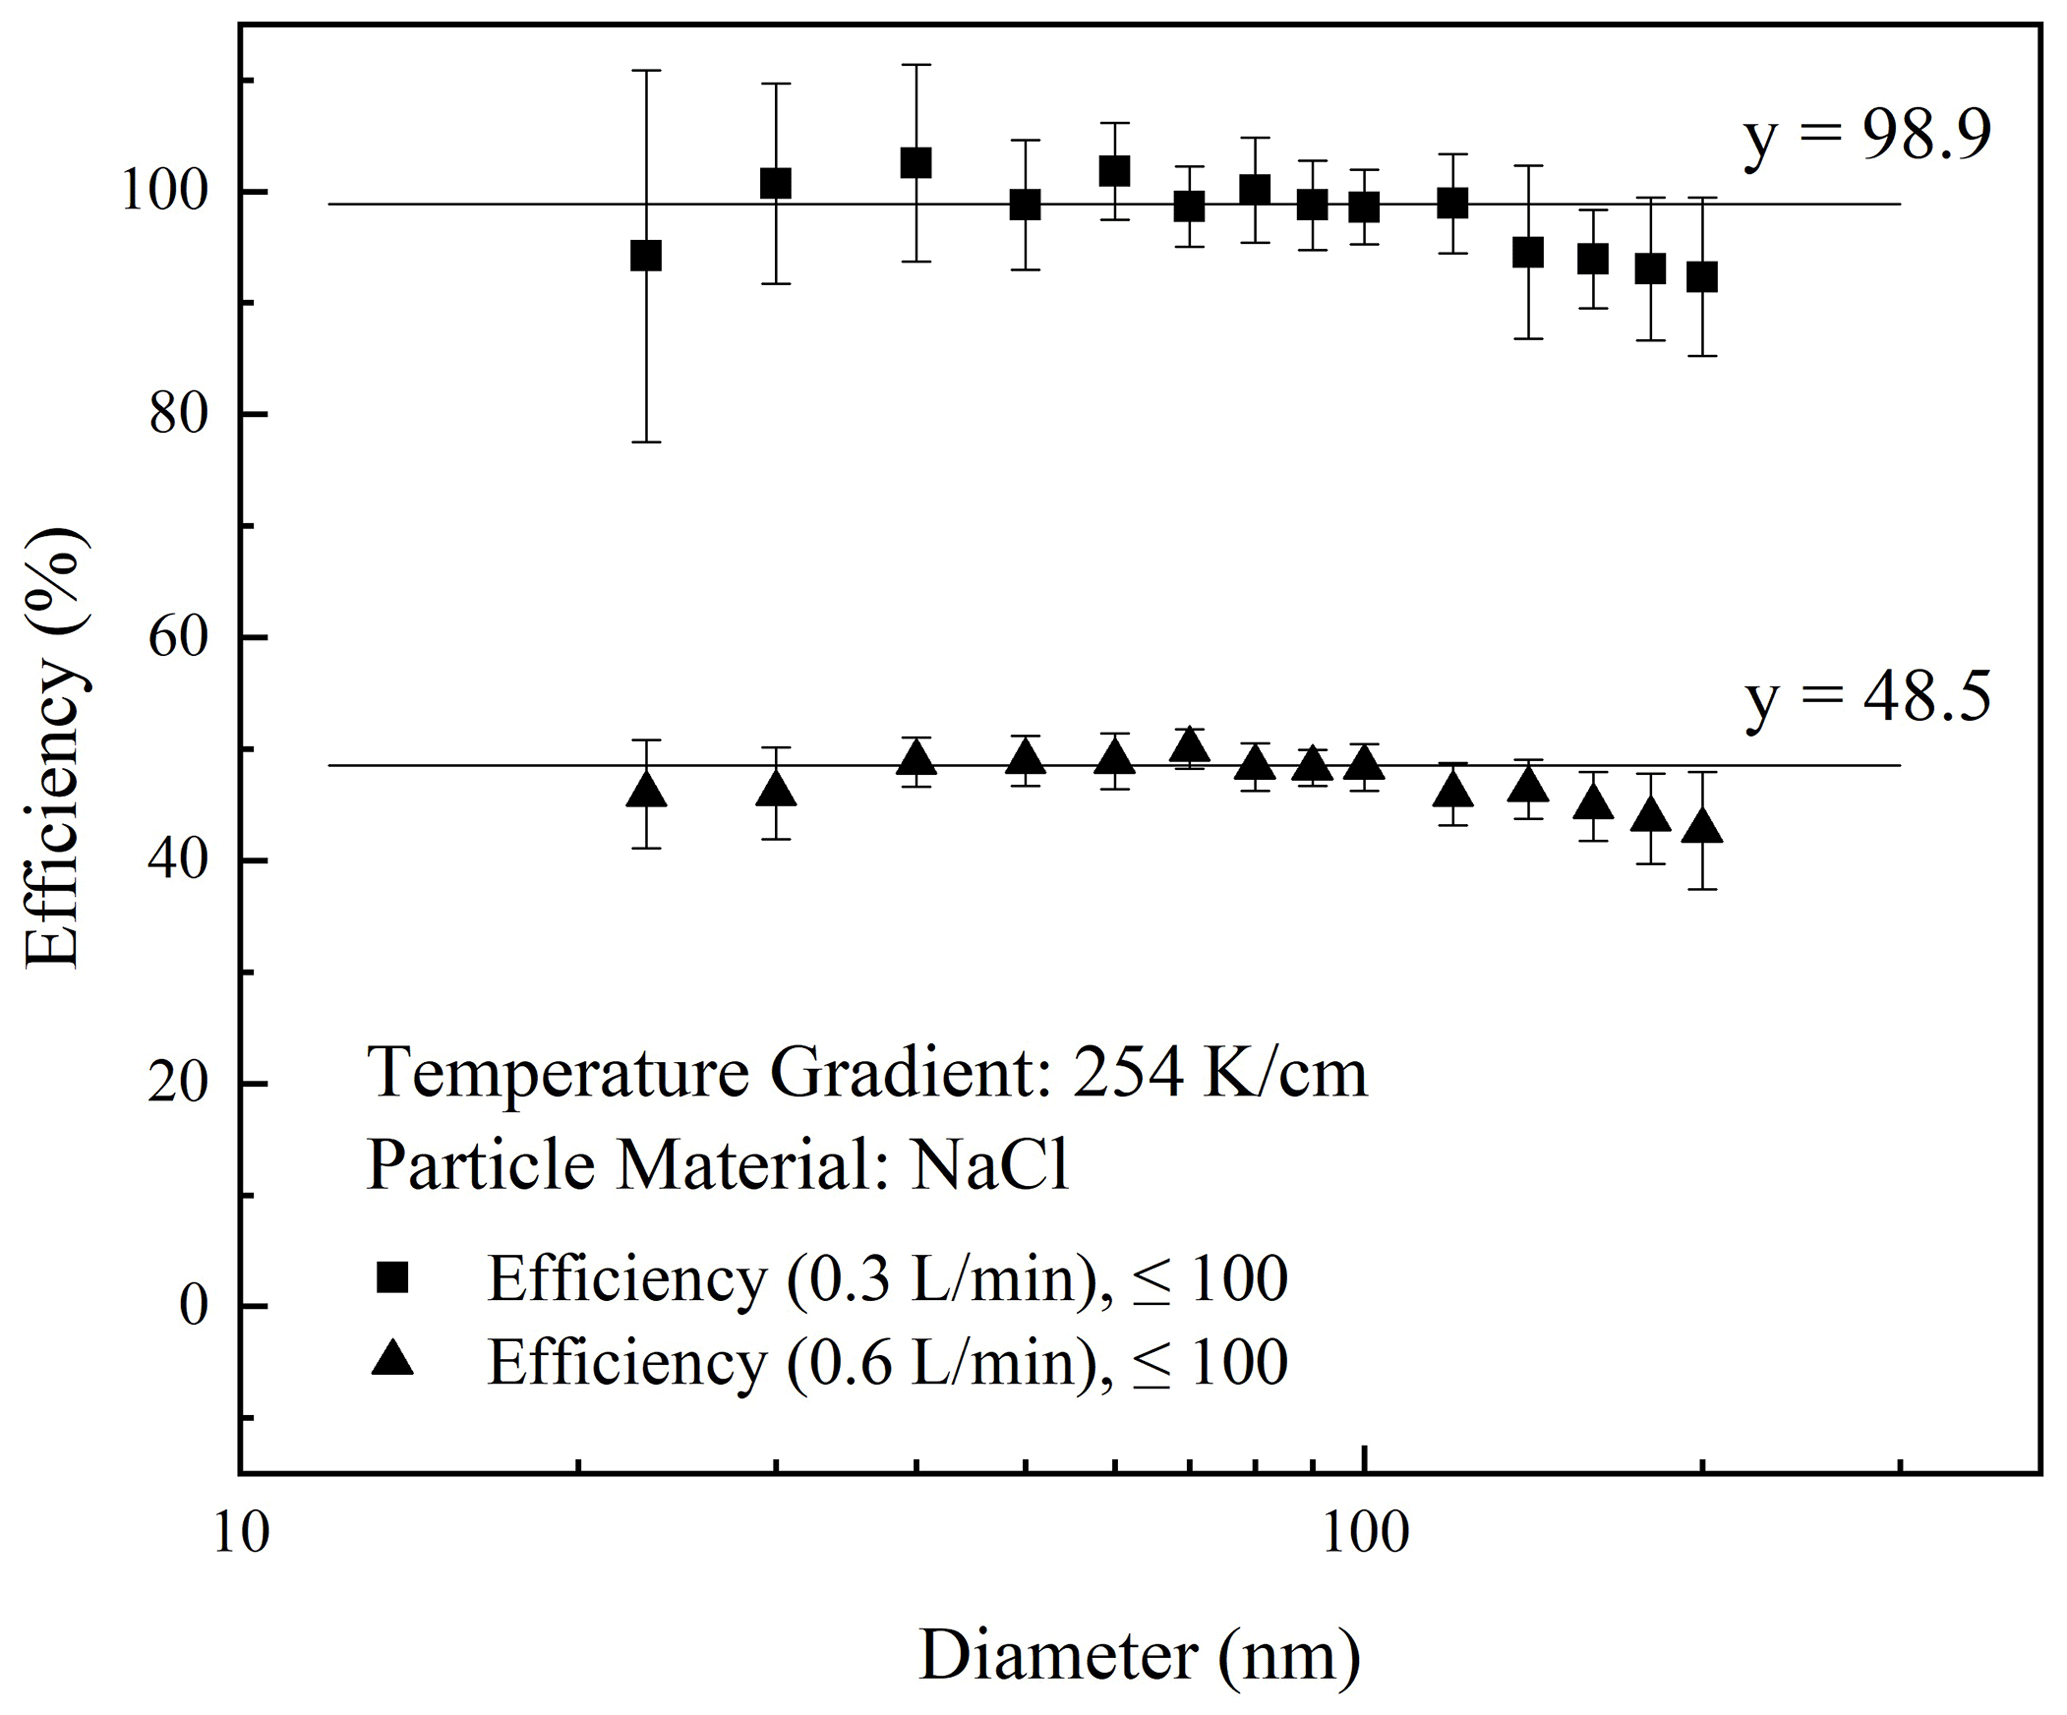
Figure 8The measured TPAE particle collection efficiency as a function of the NaCl particle size for the sampling flow rate of 0.3 and 0.6 L min−1.
4.2.3 Collection efficiency for soot particles
In addition to NaCl particles, soot particles were also used for the collection efficiency measurement. The electrical mobility size of soot particles ranging from 23 to 200 nm was tested. The measured particle collection efficiency as a function of electrical mobility size at the temperature gradient of 264 K cm−1 and the sampling flow rates of 0.3 and 0.6 L min−1 is given in Fig. 9. A slightly positive correlation of the collection efficiency with the electrical mobility size was found. As shown in Fig. 9, the collection efficiency at the sampling flow rate of 0.3 L min−1 achieved ∼100 % as the particle size increased. In the case of 0.6 L min−1, the collection slightly increased with the increase of electrical mobility particle size. The experiment results are consistent with that reported by Beresnev et al. (2019). It is known that soot particles are agglomerates of primary particles. Their thermal precipitation velocity cannot be estimated using Eqs. (7)–(9) because the equation assumes particles are solid and in a spherical shape. For soot particles, their density and thermal conductivity are very different from the bulk material, and their shapes are not spherical. The effect of particle shape may play an important role in the thermal deposition of soot particles, because the collection efficiency of 23 nm soot particles at the sampling flow rate of 0.6 L min−1 was 46.4 %, which approximately equals that of NaCl particles (45.9 %). This may be because soot agglomerates are structured only by a few of the primary particles at small mobility sizes.
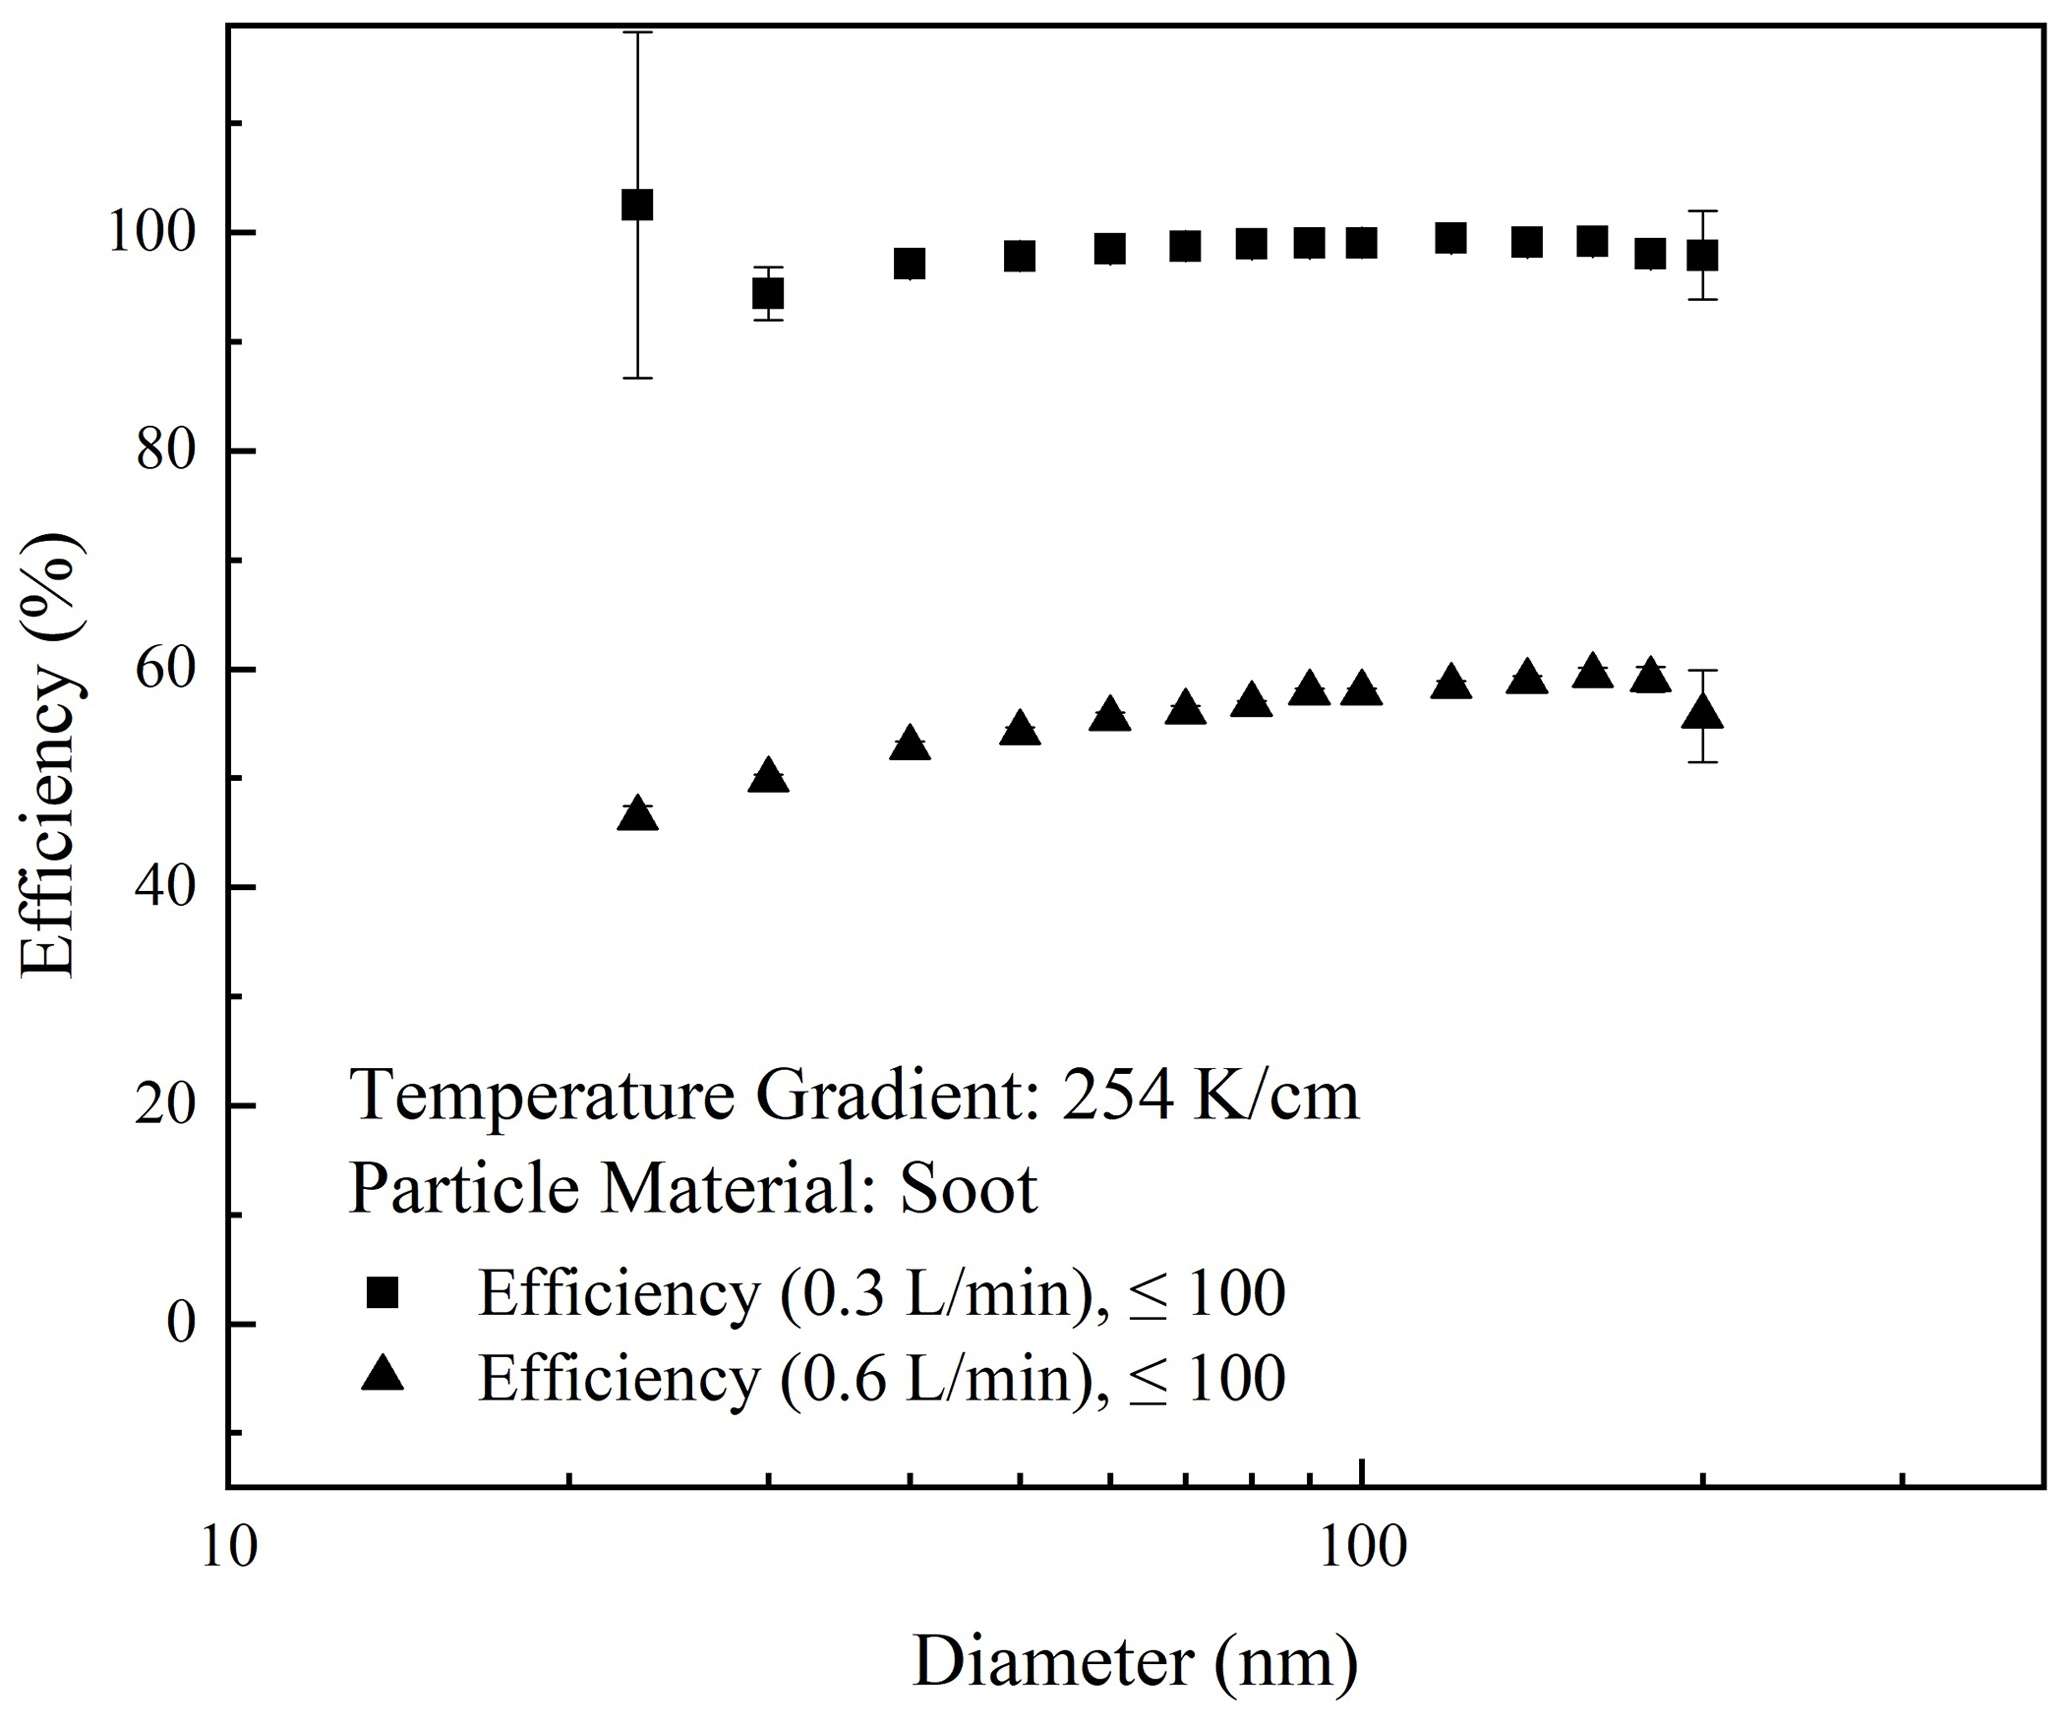
Figure 9The measured TPAE particle collection efficiency as a function of the soot particle size for the sampling flow rate of 0.3 and 0.6 L min−1.
A new type of aerosol electrometer, the thermal precipitation aerosol electrometer (TPAE), has been developed in this work. Its overall performance has been experimentally calibrated and compared with that of a reference (TSI aerosol electrometer). The design of the TPAE integrates the thermal precipitation chamber with a microcurrent measurement circuit. The precipitation chamber is in the disk-to-disk configuration and its temperature gradient is established by heating the top disk and cooling the bottom disk. Air cooling was used in the TPAE instead of the liquid cooling used in previous works. A current probe (i.e., solid copper pin) in the microcurrent measurement circuit was attached to the cold disk (converting it into an electrode), which was enclosed by the top disk and air-cooling chamber to minimize the potential interference from the ambient electromagnetic waves.
For the performance calibration, the zero point of the prototype was first measured during warm-up to the stable operation. The zero-point current converged to 20.68 fA (±2 fA) for the TPAE. The measurement of the TPAE response time was also conducted and compared to that of the reference. It was found that the difference between both electrometers was within 1 s. A linear correlation between the readouts of both aerosol electrometers was also confirmed.
The collection efficiency of the TPAE was experimentally investigated. It was found that the effects of temperature gradient, sampling flow rate and particle size on the particle collection efficiency are consistent with those obtained from previous models and experimental data. In addition to NaCl particles, soot particles were also used in the collection efficiency measurements. It was found that the collection efficiency of soot particles was slightly increased as the mobility particle sizes increased at a given setting of sampling flow rate and temperature gradient, which is different from that of NaCl particles. This observation is probably due to the fact that soot particles in large mobility sizes are agglomerates of the primary particles instead of solid, spherical particles (which is what is assumed by the models), and that soot agglomerates have different density and thermal conductivities compared with those of the bulk materials.
Requests for all data in this study and any questions regarding the data can be directed to Shipeng Kang (spkang@mail.ustc.edu.cn).
SK: writing – original draft, visualization, data curation and analysis. TY: sample collection, project administration. YY: resources, data validation. JW: experiment design. HG: writing – review. JL: conceptualization, supervision. DC: writing – review and editing, experiment design, formal analysis.
The contact author has declared that none of the authors has any competing interests.
Publisher’s note: Copernicus Publications remains neutral with regard to jurisdictional claims in published maps and institutional affiliations.
This article is part of the special issue “In-depth study of the atmospheric chemistry over the Tibetan Plateau: measurement, processing, and the impacts on climate and air quality (ACP/AMT inter-journal SI)”. It is not associated with a conference.
This research was supported by the National Natural Science Foundation of China (grant no. 42005108), the Science and Technological Fund of Anhui Province (grant no. 2008085MD116), Major Subject of Science and Technology of Anhui Province (grant no. 202003a07020005), Strategic Priority Research Program of the Chinese Academy of Sciences (grant no. XDA23010200), the National Engineering Laboratory for Mobile Source Emission Control Technology (grant no. NELMS2020A09) and the HFIPS Director's Fund (grant no. BJPY2021A04).
This research has been supported by the National Natural Science Foundation of China (grant no. 42005108).
This paper was edited by Xin Li and reviewed by Christof Asbach and one anonymous referee.
Alas, H. D. C., Weinhold, K., Costabile, F., Di Ianni, A., Müller, T., Pfeifer, S., Di Liberto, L., Turner, J. R., and Wiedensohler, A.: Methodology for high-quality mobile measurement with focus on black carbon and particle mass concentrations, Atmos. Meas. Tech., 12, 4697–4712, https://doi.org/10.5194/amt-12-4697-2019, 2019.
Beresnev, S. A., Vasiljeva, M. S., and Kochneva, L. B.: Motion of fractal-like aggregates: particle settling velocity and thermophoresis, Atmospheric and Oceanic Optics, 32, 528–533, https://doi.org/10.1134/s102485601905004x, 2019.
Bredl, J. and Grieve, T. W.: A thermal precipitator for the gravimetric estimation of solid particles in flue gases, J. Sci. Instrum., 28, 21–23, 1951.
Dixkens, J. and Fissan, H.: Development of an electrostatic precipitator for off-line particle analysis, Aerosol Sci. Tech., 30, 438–453, 1999.
Etzion, Y. and Broday, D. M.: Highly resolved spatiotemporal variability of fine particle number concentrations in an urban neighborhood, J. Aerosol Sci., 117, 118–126, https://doi.org/10.1016/j.jaerosci.2018.01.004, 2018.
Faxvog, F. R. and Roessler, D. M.: Mass concentration of diesel particle emissions from photoacoustic and opacity measurements, Aerosol Sci. Tech., 1, 225–234, https://doi.org/10.1080/02786828208958590, 2007.
Fierz, M., Houle, C., Steigmeier, P., and Burtscher, H.: Design, calibration, and field performance of a miniature diffusion size classifier, Aerosol Sci. Tech., 45, 1–10, https://doi.org/10.1080/02786826.2010.516283, 2011.
Giechaskiel, B., Wang, X., Horn, H. G., Spielvogel, J., Gerhart, C., Southgate, J., Jing, L., Kasper, M., Drossinos, Y., and Krasenbrink, A.: Calibration of condensation particle counters for legislated vehicle number emission measurements, Aerosol Sci. Tech., 43, 1164–1173, https://doi.org/10.1080/02786820903242029, 2009.
Held, A., Orsini, D. A., Vaattovaara, P., Tjernström, M., and Leck, C.: Near-surface profiles of aerosol number concentration and temperature over the Arctic Ocean, Atmos. Meas. Tech., 4, 1603–1616, https://doi.org/10.5194/amt-4-1603-2011, 2011.
Hillemann, L., Zschoppe, A., Caldow, R., Sem, G. J., and Wiedensohler, A.: An ultrafine particle monitor for size-resolved number concentration measurements in atmospheric aerosols, J. Aerosol Sci., 68, 14–24, https://doi.org/10.1016/j.jaerosci.2013.10.007, 2014.
Intra, P. and Tippayawong, N.: Development and evaluation of a Faraday Cup Electrometer for measuring and sampling atmospheric ions and charged aerosols, Particul. Sci. Technol., 33, 257–263, https://doi.org/10.1080/02726351.2014.952392, 2014.
Keskinen, J., Pietarinen, K., and Lehtimaki, M.: Electrical Low-Pressure Impactor, J. Aerosol Sci., 23, 353–360, 1992.
Kethley, T. W., Gordon, M. T., and Orr, C.: A thermal precipitator for aerobacteriology, Science, 116, 368–369, 1952.
Kheirkhah, P., Baldelli, A., Kirchen, P., and Rogak, S.: Development and validation of a multi-angle light scattering method for fast engine soot mass and size measurements, Aerosol Sci. Tech., 54, 1083–1101, 2020.
Liu, B. Y. H. and Pui, D. Y. H.: On the performance of the electrical aerosol analyzer, J. Aerosol Sci., 6, 249–264, 1975.
Liu, Q., Liu, D., Chen, X., Zhang, Q., Jiang, J., and Chen, D.-R.: A cost-effective, miniature electrical ultrafine particle sizer (mini-eUPS) for ultrafine particle (UFP) monitoring network, Aerosol Air Qual. Res., 20, 231–241, https://doi.org/10.4209/aaqr.2018.11.0427, 2020.
Mølgaard, B., Birmili, W., Clifford, S., Massling, A., Eleftheriadis, K., Norman, M., Vratolis, S., Wehner, B., Corander, J., Hämeri, K., and Hussein, T.: Evaluation of a statistical forecast model for size-fractionated urban particle number concentrations using data from five European cities, J. Aerosol Sci., 66, 96–110, https://doi.org/10.1016/j.jaerosci.2013.08.012, 2013.
Seol, K. S., Tsutatani, Y., Camata, R. P., Yabumoto, J., Isomura, S., Okada, Y., Okuyama, K., and Takeuchi, K.: A differential mobility analyzer and a Faraday Cup Electrometer for operation at 200–930 Pa pressure, J. Aerosol Sci., 31, 1389–1395, 2000.
Talbot, L., Cheng, R. K., Schefer, R. W., and Willis, D. R.: Thermophoresis of particles in a heated boundary-layer, J. Fluid Mech., 101, 737–758, 1980.
Tammet, H., Mirme, A., and Tamm, E.: Electrical aerosol spectrometer of Tartu University, Atmos. Res., 62, 315–324, 2002.
Tsai, C.-J. and Lu, H.-C.: Design and evaluation of a plate-to-plate thermophoretic precipitator, Aerosol Sci. Tech., 22, 172–180, https://doi.org/10.1080/02786829408959738, 1995.
Wang, B., Ou, Q., Tao, S., and Chen, D.-R.: Performance study of a disk-to-disk thermal precipitator, J. Aerosol Sci., 52, 45–56, https://doi.org/10.1016/j.jaerosci.2012.04.004, 2012a.
Wang, B., Tao, S., and Chen, D.-R.: A cylindrical thermal precipitator with a particle size-selective inlet, Aerosol Sci. Tech., 46, 1227–1238, https://doi.org/10.1080/02786826.2012.704097, 2012b.
Wang, X., Grose, M. A., Avenido, A., Stolzenburg, M. R., Caldow, R., Osmondson, B. L., Chow, J. C., and Watson, J. G.: Improvement of Engine Exhaust Particle Sizer (EEPS) size distribution measurement – I. Algorithm and applications to compact-shape particles, J. Aerosol Sci., 92, 95–108, https://doi.org/10.1016/j.jaerosci.2015.11.002, 2016a.
Wang, X., Grose, M. A., Caldow, R., Osmondson, B. L., Swanson, J. J., Chow, J. C., Watson, J. G., Kittelson, D. B., Li, Y., Xue, J., Jung, H., and Hu, S.: Improvement of Engine Exhaust Particle Sizer (EEPS) size distribution measurement – II. Engine exhaust particles, J. Aerosol Sci., 92, 83–94, https://doi.org/10.1016/j.jaerosci.2015.11.003, 2016b.
Yang, Y., Yu, T., Zhang, J., Wang, W., Gui, H., Du, P., and Liu, J.: Design and evaluation of an Aerosol Electrometer with low noise and a wide dynamic range, Sensors-Basel, 18, 1614, https://doi.org/10.3390/s18051614, 2018a.
Yang, Y., Yu, T., Zhang, J., Wang, J., Wang, W., Gui, H., and Liu, J.: On the performance of an Aerosol Electrometer with enhanced detection limit, Sensors-Basel, 18, 3889, https://doi.org/10.3390/s18113889, 2018b.
- Abstract
- Introduction
- Design of thermal precipitation aerosol electrometer
- Experimental setup and data analysis
- Results and discussion
- Conclusion
- Data availability
- Author contributions
- Competing interests
- Disclaimer
- Special issue statement
- Acknowledgements
- Financial support
- Review statement
- References