the Creative Commons Attribution 4.0 License.
the Creative Commons Attribution 4.0 License.
 | 24 Aug 2023
The impact of Aeolus winds on near-surface wind forecasts over tropical ocean and high-latitude regions
Charlotte Bay Hasager
To detect global wind profiles and improve numerical weather prediction (NWP), the European Space Agency (ESA) launched the Aeolus satellite carrying a spaceborne Doppler wind lidar in 2018. After the successful launch, the European Centre for Medium-Range Weather Forecasts (ECMWF) performed the observing system experiments (OSEs) to evaluate the contribution of Aeolus data to NWP. This study aims to assess the impact of Aeolus wind assimilation in the ECMWF model on near-surface (10 m height) wind forecasts over tropical ocean regions by taking buoy measurements for reference and over high-latitude regions by taking weather station data for reference for the year 2020. The assessments were conducted mainly through inter-comparison analysis. The results show that Aeolus data assimilation has a limited impact on sea surface wind forecasts for tropical regions when compared with buoy measurements. For the high-latitude regions in the Northern Hemisphere, Aeolus is able to improve near-surface wind forecasts. This positive impact is more evident as the forecast time step is extended, during the first half year of 2020 and during the winter months. In addition, the v component tends to benefit more from the Aeolus observations than the u component. For the Southern Hemisphere, a few error reductions are observed but exist randomly. Overall, this in situ data-based assessment expands our understanding of the role of Aeolus data assimilation with the global NWP model in predicting near-surface wind for tropical oceans and high-latitude regions.
- Article
(7703 KB) - Full-text XML
- BibTeX
- EndNote


For characterizing global wind profiles and improving numerical weather prediction (NWP), the first spaceborne Doppler wind lidar (DWL) carried by the Aeolus satellite was launched in August 2018 by the European Space Agency (ESA). The mission operated for more than 4 years and ended in April 2023. Following a sun-synchronous orbit, Aeolus passed over the Equator at 06:00 local time (LT) during descending orbits and 18:00 LT during ascending orbits and sampled the whole globe every 12 h with eight orbits. Wind retrieval of Aeolus is based on the Doppler-shifted frequency between emitted light pulses and backscattered light from air molecules (i.e. Rayleigh scattering) as well as from large particles, such as cloud droplets and ice crystals, in the atmosphere (i.e. Mie scattering). By measuring this small difference, wind velocity along the line of sight (LOS) can be obtained, which is further converted to the approximately east–west horizontal LOS wind component using the off-nadir angle of 35∘ (Andersson et al., 2008). The detected wind profiles, ranging from the surface to about 30 km in height with 24 vertical bins, can be used to improve NWP, capture gravity waves, track volcanic eruptions, etc. (Banyard et al., 2021; Rennie et al., 2021; Parrington et al., 2022).
After the successful launch, calibration and validation work has been widely carried out worldwide. Owing to the continually improved data processing chain, from baseline 10 with M1-temperature-based bias correction and daily updates of global offset bias removal (Data Innovation and Science Cluster, 2020), the systematic errors in both Rayleigh-clear winds and Mie-cloudy winds are almost within 0.5 m s−1, with the exception of some cases in the polar regions, and the random errors mainly vary between 4 and 8 m s−1 for Rayleigh-clear winds and between 2.0 and 5 m s−1 for Mie-cloudy winds (Belova et al., 2021; Iwai et al., 2021; Witschas et al., 2022; Zuo et al., 2022). However, what should be noted is that Aeolus has suffered unexpected signal loss since the launch, probably due to the decreasing emitted laser energy for the FM-A period (August 2018–June 2019) and/or laser-induced contamination for the FM-B period (July 2019–September 2022) (Straume-Lindner et al., 2021). The data quality assessment based on the second reprocessed data set (2B11) by the European Centre for Medium-Range Weather Forecasts (ECMWF) revealed that the estimated random error in Rayleigh-clear wind increased by 40 % from ∼5 to ∼7 m s−1 during July 2019–October 2020 due to the gradual signal reduction in DWL, while this instrument issue has less influence on Mie-cloudy winds, with estimated random errors remaining at ∼3.5 m s−1 (Rennie and Isaksen, 2023).
Although Aeolus suffers from unexpected signal loss and growing errors, its wind products have been employed to improve NWP through data assimilation, an approach that integrates recent observations with a previous forecast to achieve the best estimate of the current atmospheric state (ECMWF, 2020). For evaluating the contribution of Aeolus observations to NWP, the observing system experiments (OSEs) with and without Aeolus data assimilation have been performed with global NWP models at many institutions, including the ECMWF, National Oceanic and Atmospheric Administration (NOAA), Deutscher Wetterdienst (DWD), Météo-France, and UK Met Office (Cress et al., 2022; Garrett et al., 2022; Forsythe and Halloran, 2022; Pourret et al., 2022; Rennie and Isaksen, 2023). The assessment of the ECMWF OSEs demonstrated that Aeolus winds are able to improve vector wind and temperature forecasts, especially in the upper troposphere and/or lower stratosphere over tropical and polar regions (Rennie et al., 2021). Similar results were also found from the OSEs with the NOAA's Global Forecast System, the DWD model, and the Environment and Climate Change Canada Global Forecast System (Cress et al., 2022; Garrett et al., 2022; Laroche and St-James, 2022). Moreover, regarding the weather and climate events, Aeolus is able to improve the track forecasts for tropical cyclones in the eastern Pacific basin and Atlantic basin (Garrett et al., 2022) and benefits the forecasts of the West African Monsoon as well as the changes in the El Niño–Southern Oscillation (ENSO) state over the eastern Pacific by capturing the large-scale atmospheric circulation (Cress et al., 2022).
However, the existing assessments mainly focused on the forecasts at pressure levels or upper air, while the impacts of Aeolus data assimilation on near-surface wind forecasts lack detailed study. This research gap needs to be complemented since the relevant scientific investigation could provide valuable information for future applications in wind-related activities, such as ocean shipping and wind farm operation and maintenance. Due to the relatively low spatial and temporal resolution of Aeolus wind observations, global models are more likely to benefit from Aeolus data assimilation than high-resolution regional models (Hagelin et al., 2021; Mile et al., 2022; Rennie and Isaksen, 2023). Therefore, as a starting point, we would like to focus on the ECMWF model first. This will give us a better understanding of the influence of Aeolus on near-surface wind forecasts, which in turn guides us in applying Aeolus winds to regional models for practical applications. Considering that tropical oceans and polar regions are favourable to extreme weather but lack in situ measurements, and the model performance is usually not satisfactory in these regions, yielding, for example, large bias over the Intertropical Convergence Zone (ITCZ) (Sandu et al., 2020), we would like to investigate whether Aeolus can contribute to more reliable wind forecasts for these regions.
Regarding the reference data set for evaluation, many verifications related to Aeolus OSEs were conducted by inter-comparing with model analysis that has global coverage and deals with the representation error between the model scale and scales of observations (Garrett et al., 2022; Laroche and St-James, 2022; Rennie and Isaksen, 2023). However, there are fewer in situ measurements available over tropical and polar regions, and the mesoscale convections are not resolved well in the global NWP models, which leads to the large uncertainties in model analysis data in these regions (Sandu et al., 2020; King et al., 2022). Given this, taking in situ measurements as the reference can avoid this issue to some extent.
Hence, to complement the existing studies, this study aims to assess the impact of Aeolus wind assimilation on near-surface wind forecasts over tropical ocean regions between 30∘ N and 30∘ S by taking buoy measurements for reference. Furthermore, we investigated the high-latitude region >60∘ N in the Northern Hemisphere (NH) and the high-latitude region >60∘ S in the Southern Hemisphere (SH) by taking weather station data for reference. Our hypothesis is that the assimilation of Aeolus winds will reduce the forecast error. Since the overall data quality of Aeolus is reduced in the second half year of 2020 compared to the first half year due to the weakening signals, our hypothesis is that the assimilation of Aeolus winds can reduce the forecast error relatively more during the first half year compared to the second half year. In the tropics, seasonal effects are very limited, while in the high-latitude regions, the seasonal variability is high, so for those we also investigated the forecast for the seasons. The assessments were conducted mainly through inter-comparison analysis based on the high-resolution Tco639 OSEs in the ECMWF model for the entire year of 2020.
Sections 2 and 3 introduce the data and methods used in this study. Section 4 presents the main research findings, followed by Sect. 5 for discussions. The final section makes a short summary of the study and draws conclusions.
2.1 Observing system experiments with ECMWF model
This study is based on the ECMWF OSEs with the second reprocessed Aeolus L2B baseline 11 data and the near real-time L2B baseline 11/12 data assimilated during the FM-B period (Rennie and Isaksen, 2023). The applied model version is CY47R2 with an atmosphere outer-loop resolution of Tco639 L137 (∼18 km grid size). Observations from nominally operational satellites and conventional sources were assimilated. The OSEs include a control experiment without Aeolus assimilation and an experiment with Aeolus Rayleigh-clear and Mie-cloudy wind assimilation through the four-dimensional variational (4D-Var) data assimilation technique. For the lower troposphere (>850 hPa), only Mie-cloudy winds with an estimated error smaller than 5 m s−1 were assimilated into the model. Detailed information on quality control decisions for the OSEs is documented in Rennie and Isaksen (2023). Figure 1 illustrates the geographical distribution of the averaged number of L2B Mie-cloudy winds assimilated per cycle below 850 hPa. More low-level Aeolus winds are assimilated over the ocean regions than inland regions and over low- to mid-latitude regions than high-latitude regions.
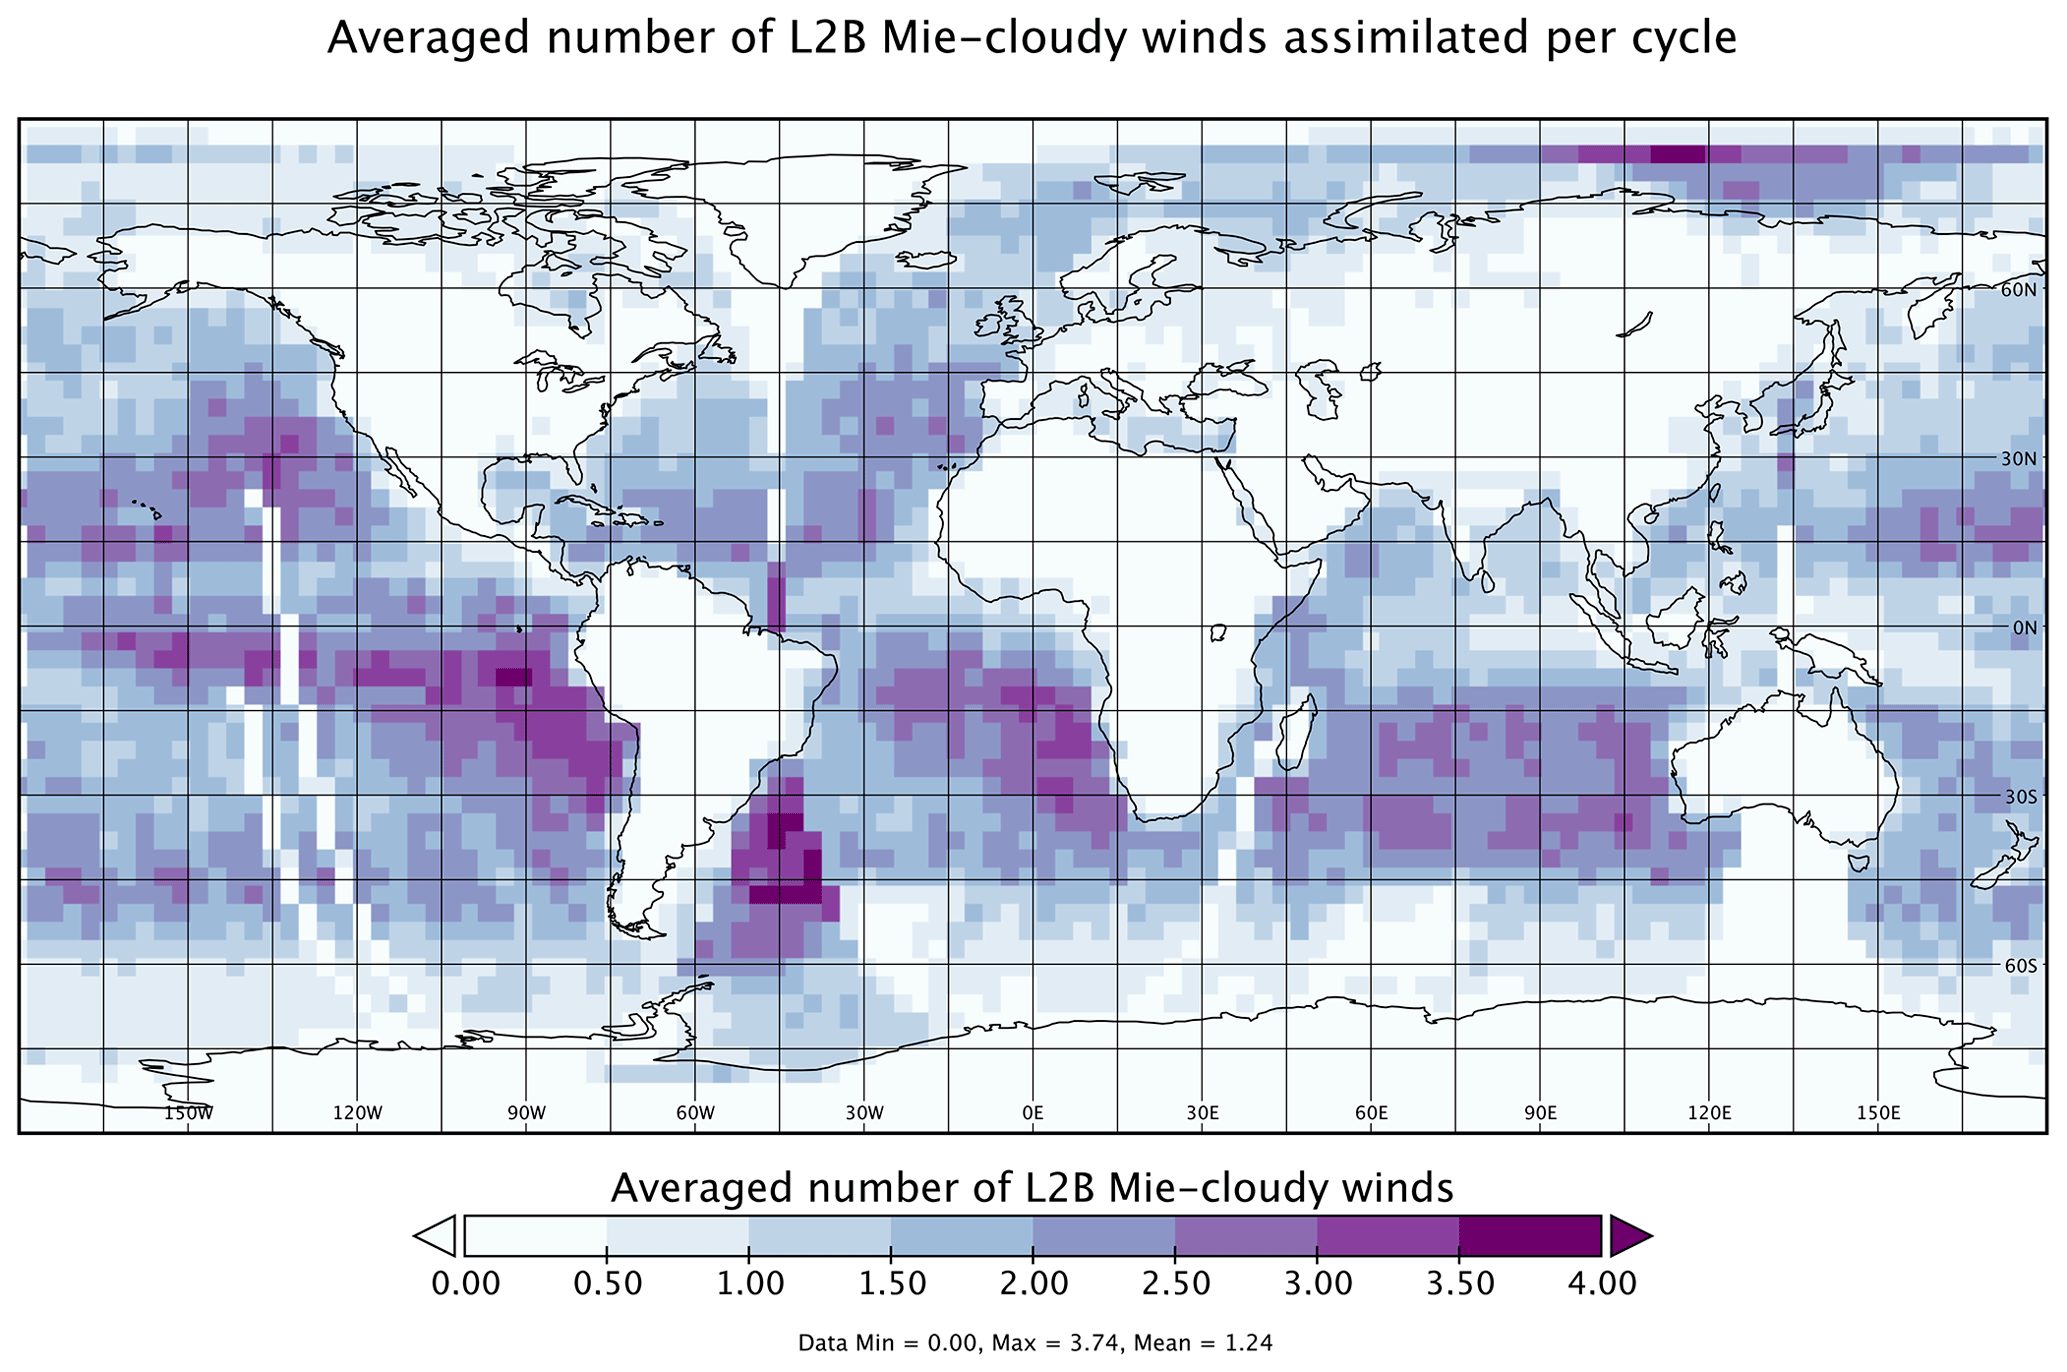
Figure 1The averaged number of L2B Mie-cloudy winds at pressure >850 hPa assimilated into the model.
The 10 d forecasts based on the 00:00 UTC analysis of the zonal (u) and meridional (v) wind components at 10 m height were obtained from the ECMWF Meteorological Archival and Retrieval System (MARS) for evaluation (ECMWF Research Department, 2022). The interval of forecast steps is 24 h. The data cover the completed year of 2020.
2.2 Buoy measurements
The tropical moored-buoy measurements over the Atlantic Ocean, Indian Ocean and Pacific Ocean were obtained from the Global Tropical Moored Buoy Array (Pacific Marine Environmental Laboratory, 2022). The extracted parameters include the zonal (u) and meridional (v) wind components, wind speed, and wind direction with a temporal resolution of 10 min or 1 h. The missing values and data flagged as low-quality have been removed. Finally, there are 11 buoys available in the Atlantic Ocean, 9 in the Indian Ocean and 55 in the Pacific Ocean, the locations of which are displayed in Fig. 2. To make all measurements have an identical temporal resolution, we averaged the 10 min wind speeds to hourly wind speeds. Furthermore, to collocate with wind forecasts from the OSEs, the buoy winds were extrapolated from an anemometer height of 3.5 or 4 to 10 m by using the method described in Bidlot et al. (2002).
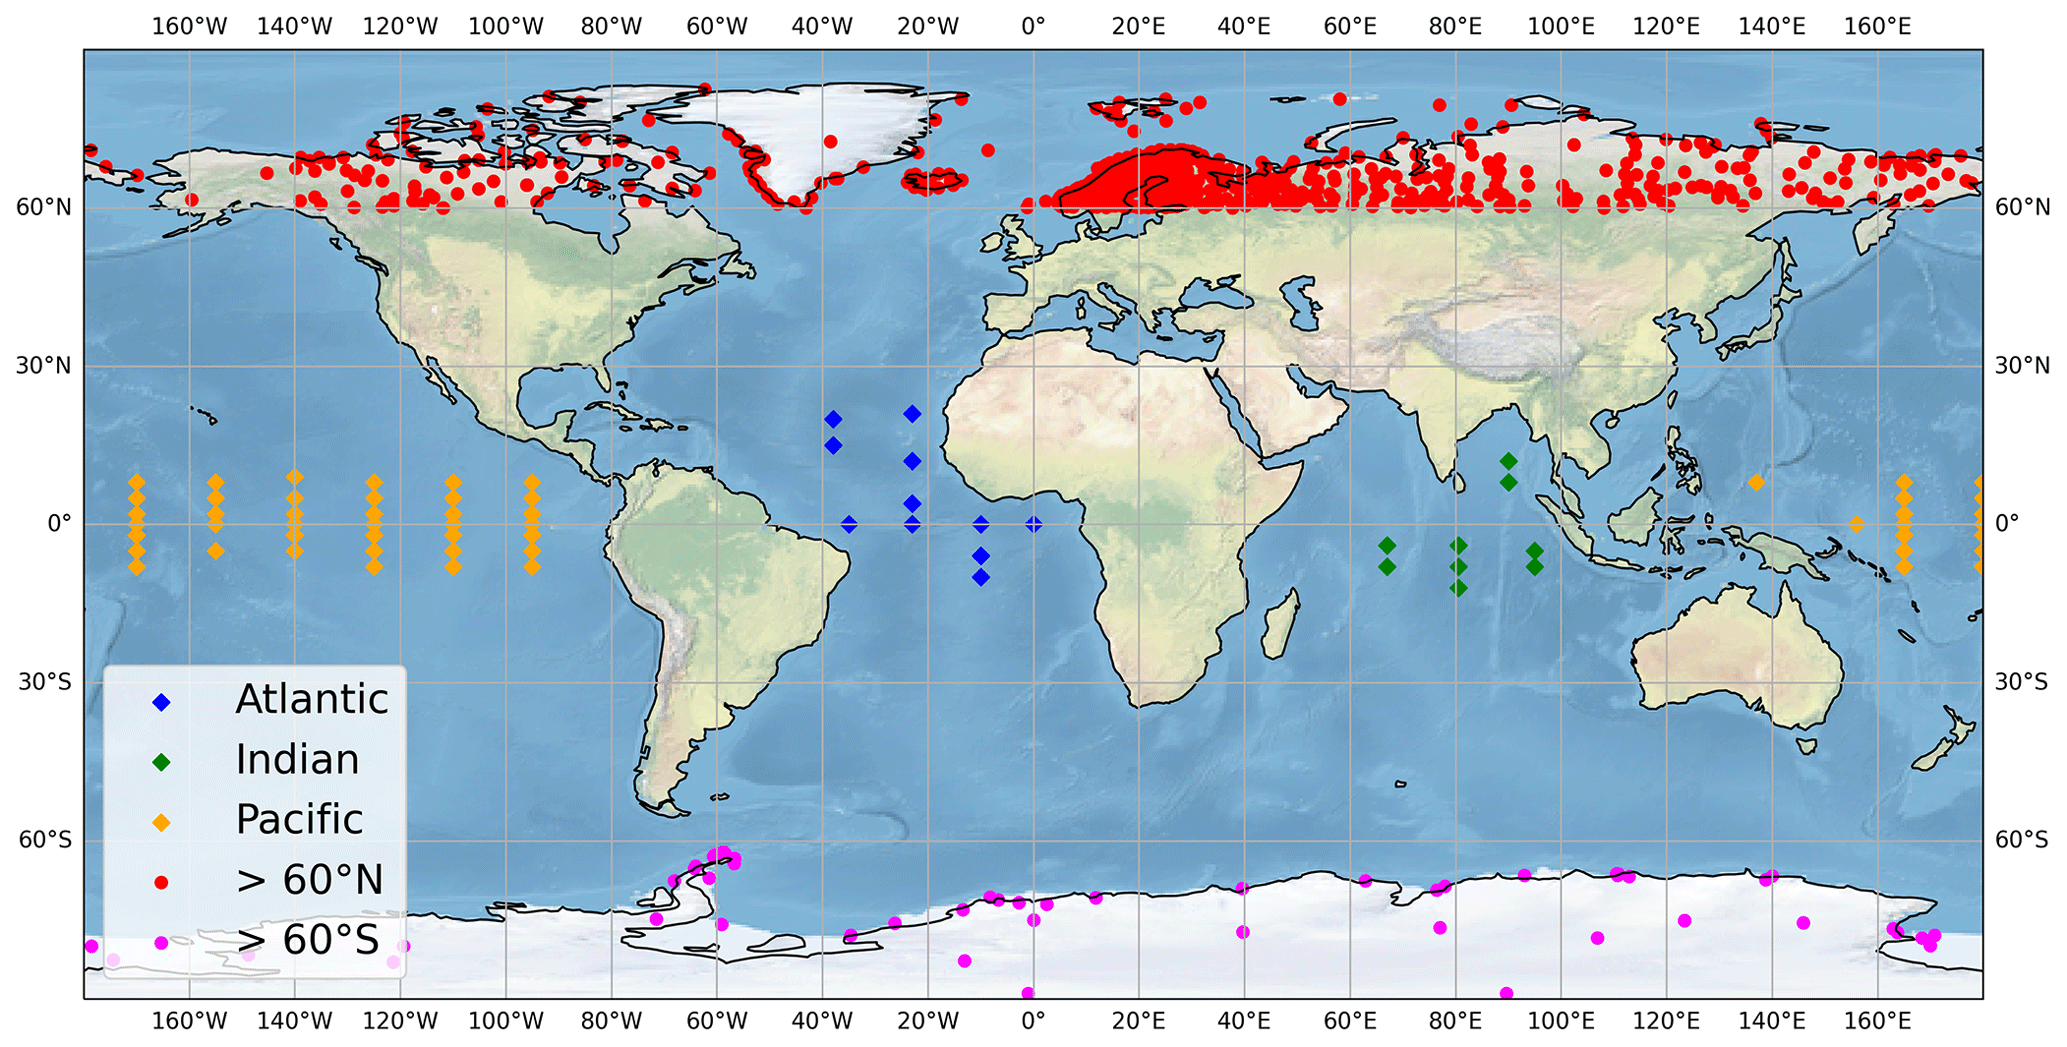
Figure 2The geographical location of moored buoys in the tropical oceans and weather stations at high latitudes >60∘ N and high latitudes >60∘ S (background image made with Natural Earth. Free vector and raster map data at https://www.naturalearthdata.com/, last access: 18 June 2023).
2.3 Weather station data
Surface synoptic observations over high-latitude regions (>60∘ N and >60∘ S) were extracted from the global hourly Integrated Surface Database (ISD) (National Centers for Environmental Information, 2022). Only the wind speeds and directions that passed all quality control checks were kept for further analysis. Additionally, we calculated the correlation coefficients (R) between in situ measurements and the control experiments at T+0 h, and the stations with weak correlations (R<0.5) were removed. One reason is that when the poor correlations are caused by very limited data samples during the study period, such as due to freezing or instrument malfunction, we consider the data quality of those available samples to still be questionable. Another reason is that the weak correlations may imply a limited spatial representativeness of those stations, especially over the complex terrain. After quality control, there are 751 (223) and 56 (30) stations available (removed) over the high-latitude regions in the Northern Hemisphere and Southern Hemisphere, respectively (Fig. 2).
To evaluate the wind forecasts from OSEs, we take buoy measurements or weather station observations for reference. We quantified the normalized change in the root-mean-square errors (RMSEs) with and without Aeolus data assimilation for all paired data samples, thus determining whether Aeolus can improve the model performance or not over each study region. The normalized change in RMSE (NCRMSE) is given as
where is the wind forecast with or without Aeolus data assimilation, oi,in situ is the in situ measurements from either buoys or weather stations, and N is the total number of paired data samples for each study region or each case. The statistical significance of NCRMSE was quantified at the 95 % confidence interval (not shown on plots).
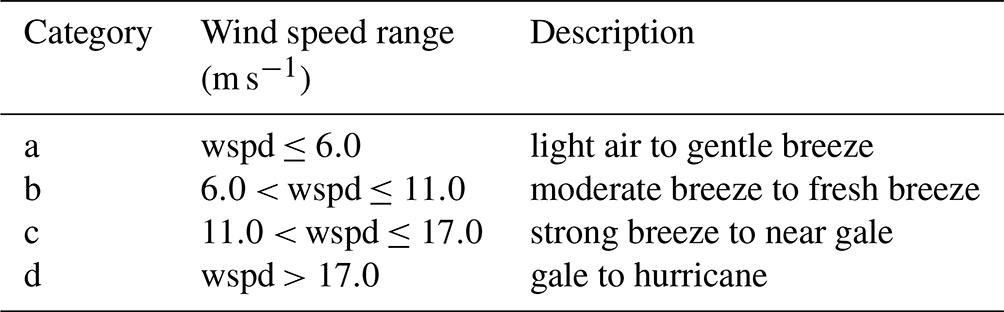
The analyses were performed for each ocean basin, regions >60∘ N and >60∘ S, respectively, aiming to provide error information geographically. We focus on error information of each wind component as well as wind speed instead of vector wind as the former is more relevant to practical applications. We also divided the study period into 2 half years to evaluate the sensitivity of wind forecasts to Aeolus data quality. For high-latitude regions, the study was also carried out for each season. Moreover, for the region >60∘ N, we divided the data samples into four categories based on the in situ wind speeds (Table 1) and investigated the impact of Aeolus under different wind speed ranges (Met Office, 2023). Apart from these, the Pearson correlation coefficients between forecasts and reference data and between two forecasts with and without Aeolus were also calculated as the additional statistical information to facilitate the study.
4.1 Tropical oceans
4.1.1 Inter-comparison analysis
Figure 3 shows the NCRMSEs from inter-comparison analyses for three ocean basins. For the tropical Atlantic Ocean, the negative values are mainly found within T+72 h for the v component and wind speed. The results for the tropical Indian Ocean do not show any trend in error reduction for wind components and wind speed. Compared to the tropical Atlantic Ocean and Indian Ocean, the Pacific witnesses negative values at more forecast steps, but the magnitude is weaker, mainly within 1 %. The negative values at T+48 h for both wind components and wind speed are common for the three ocean basins. Unfortunately, none of the negative NCRMSEs are statistically significant at the 95 % confidence interval; thus, the overall impact of Aeolus on sea surface wind forecasts is neutral for tropical regions. In addition, Aeolus data quality appears to have no influence on improving surface wind forecasts over the tropical ocean regions, as shown in Fig. 4 by taking the Pacific Ocean as an example.
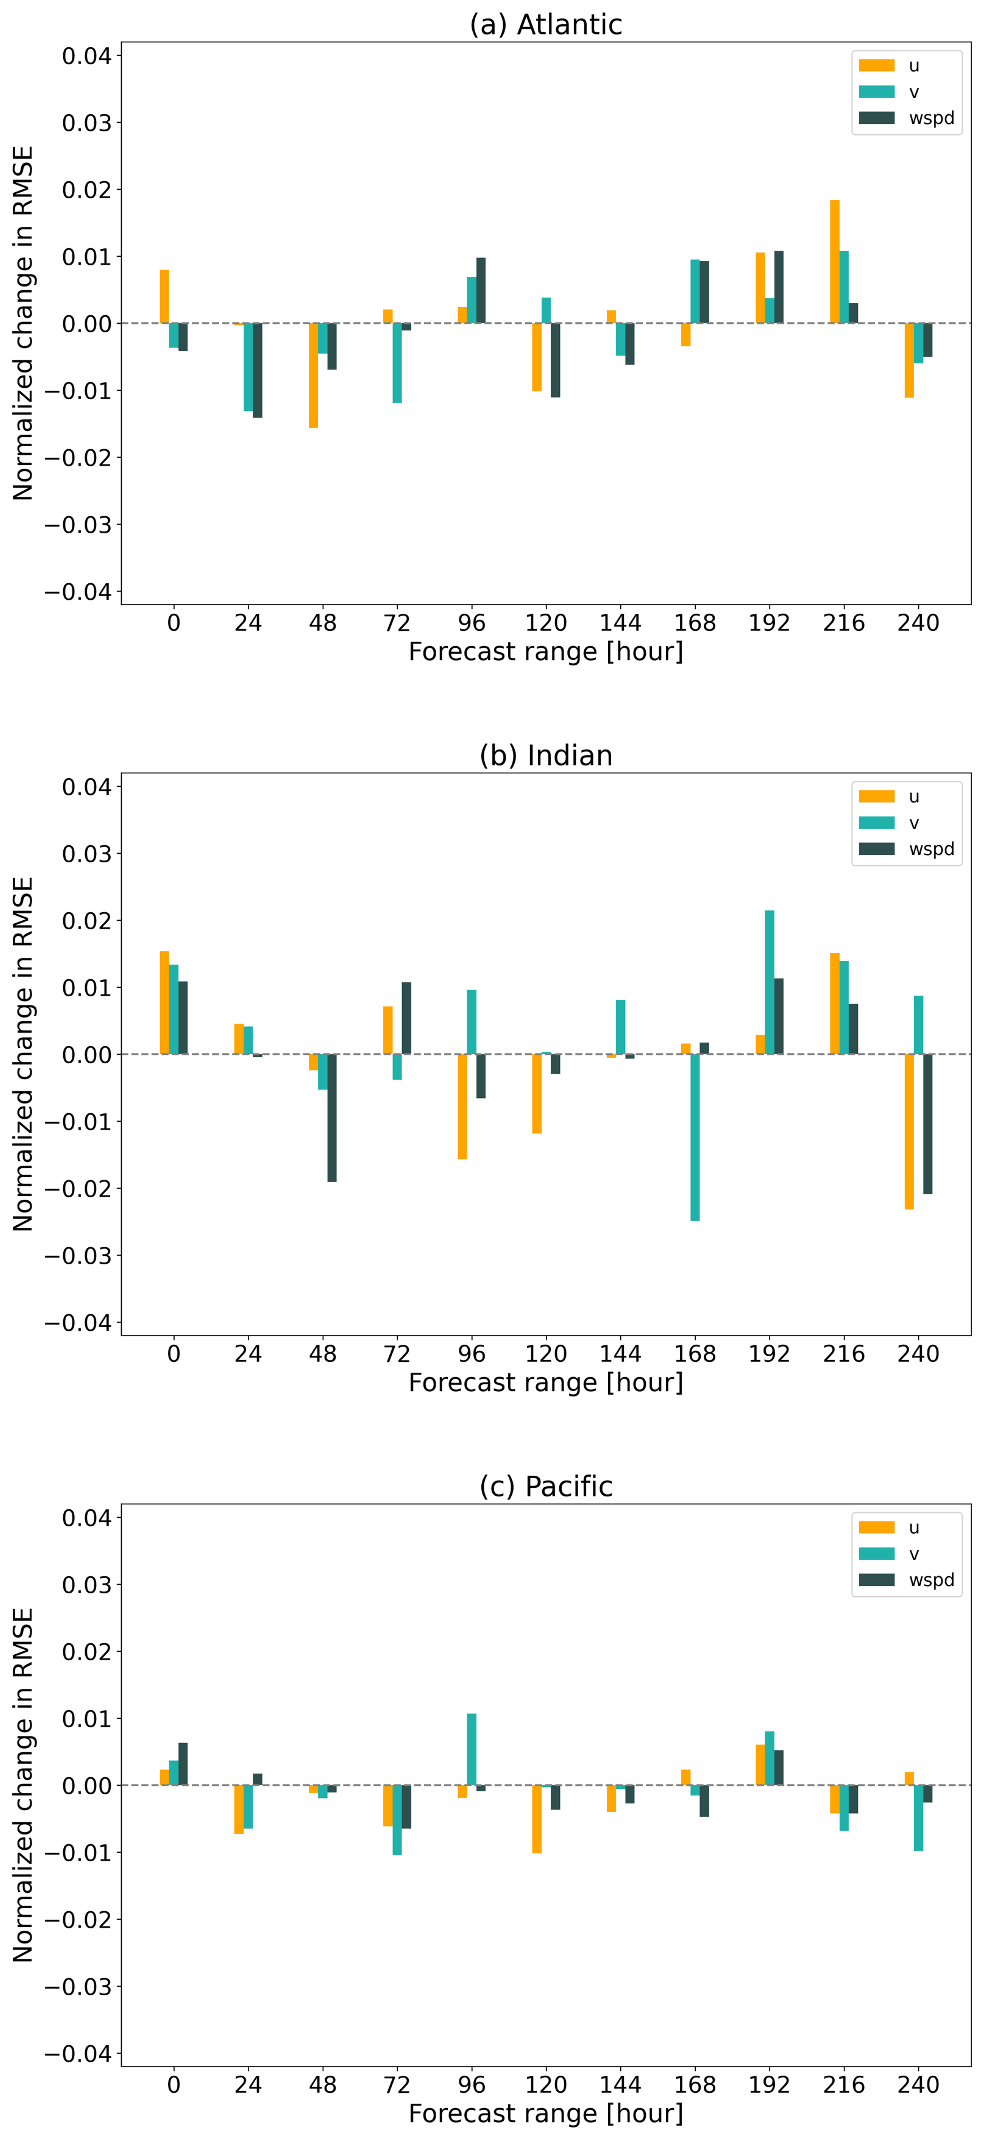
Figure 3Normalized change in RMSE for the u and v wind components and wind speed (wspd) for the tropical Atlantic Ocean (a), Indian Ocean (b) and Pacific Ocean (c) for the year 2020. The ECMWF OSE forecasts with and without Aeolus are compared against buoy data. Note that negative values indicate error reduction, implying an improvement in the forecast with Aeolus assimilation.
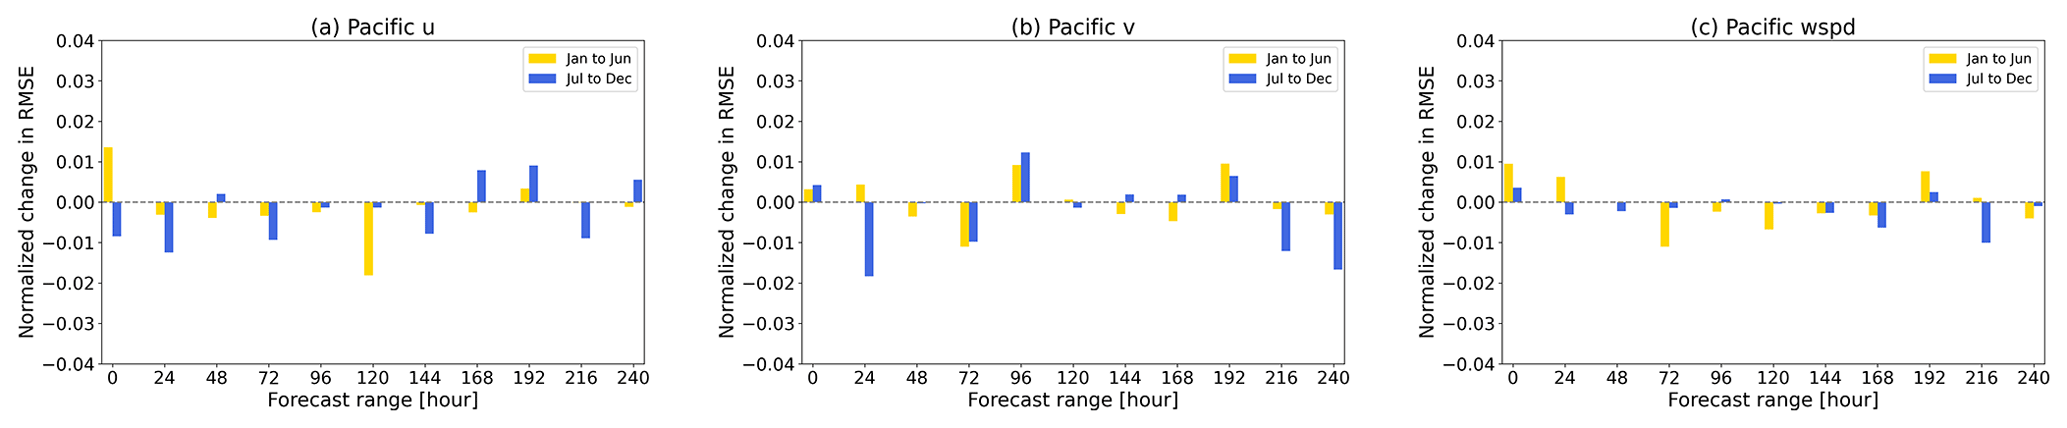
Figure 4Normalized change in RMSE for the u and v wind components and wind speed (wspd) during the first and the second half year of 2020 for the tropical Pacific Ocean. The ECMWF OSE forecasts with and without Aeolus are compared against buoy data.
4.1.2 Correlations of data sets
The correlation coefficients show that the forecast experiment with and without Aeolus is highly correlated up to T+120 h, with R values greater than 0.9 for both the u and v components as well as wind speed. As the forecast is extended, the correlations between the two forecasts and between the forecasts and buoy measurements weaken but do not decrease too much for tropical ocean basins with R values greater than 0.7 at T+240 h for most cases. Figure 5 is an example of the tropical Pacific at the T+120 h forecast step. The results show the u and v components with R values around 0.95 for the forecasts with and without Aeolus, while for wind speed, the R value is around 0.90. The R values for the u and v components are around 0.81 (Fig. 5e and f) and 0.80 (Fig. 5h and i) for the forecasts (with and without Aeolus data) versus buoy data, which indicates that there is almost no increase in correlation after assimilating Aeolus winds. In summary, the zonal and meridional wind components are better resolved in the forecast model than the wind speed. The correlations do not reveal much improvement in forecast skill between the two forecasts. Similar results are also found for the tropical Atlantic Ocean and Indian Ocean (not shown).
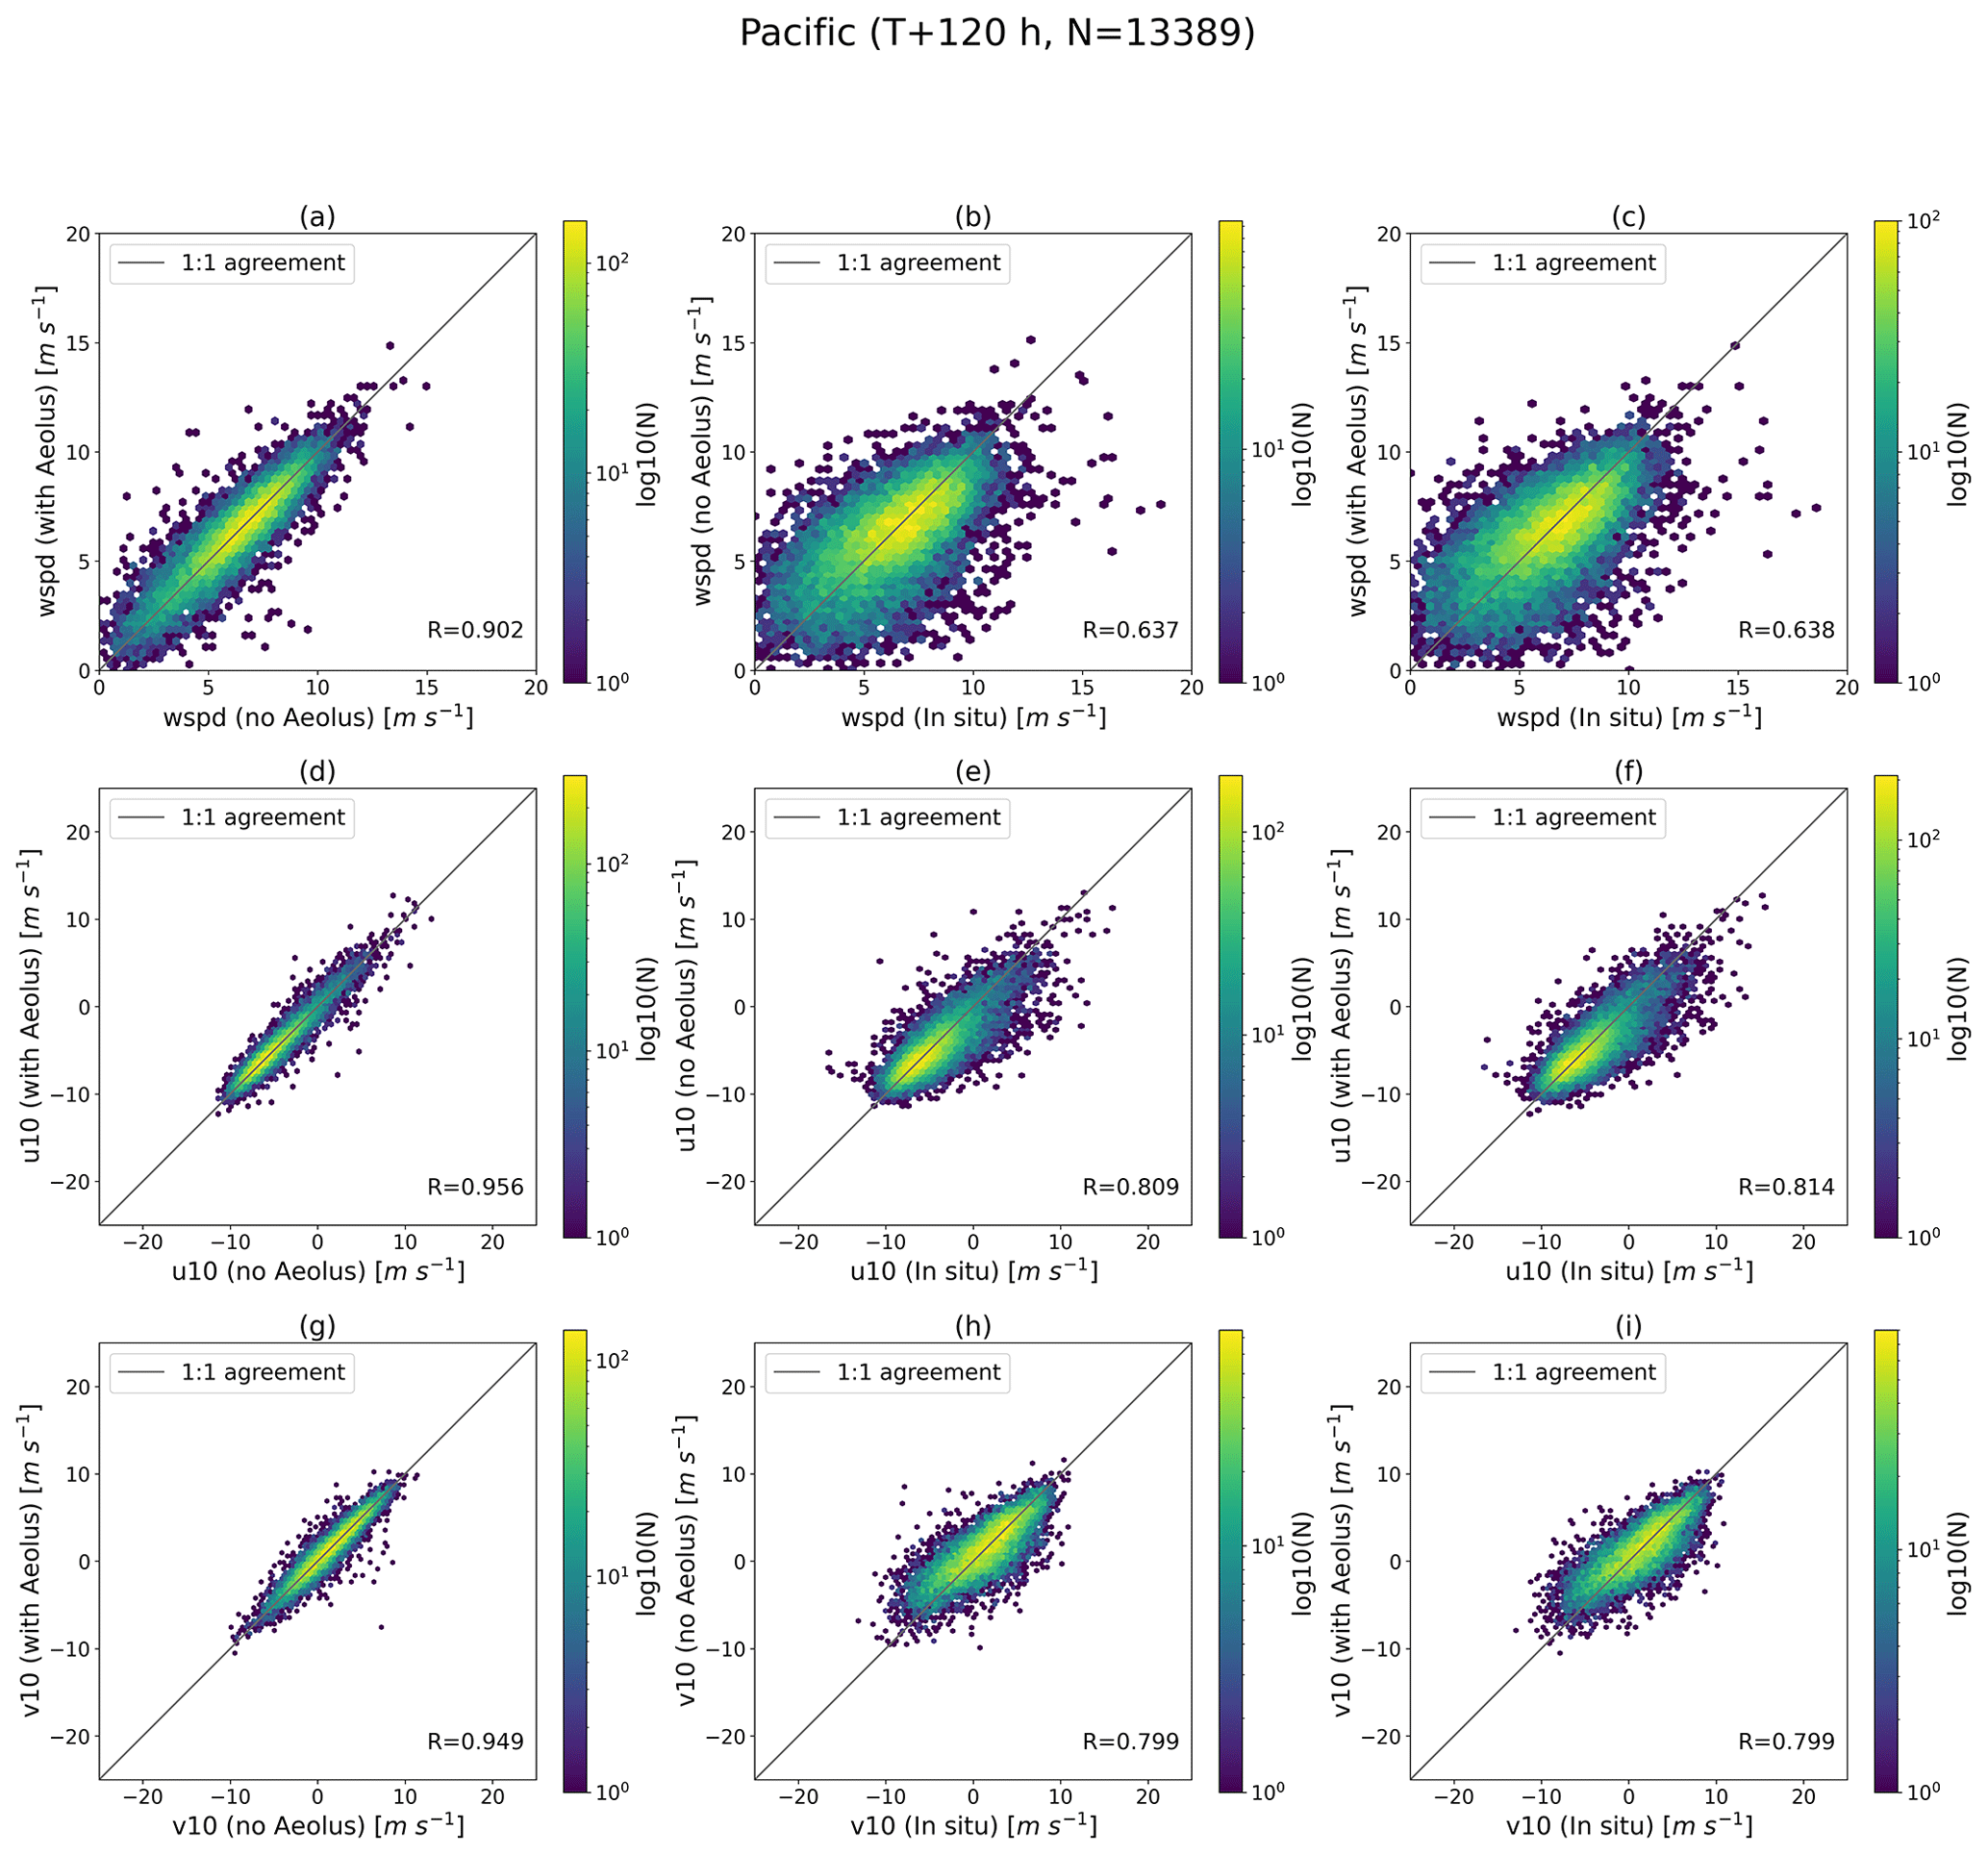
Figure 5Hexagonal binning plots of the u and v components and wind speed (wspd) at the T+120 h forecast step for the tropical Pacific Ocean for the year 2020 based on ECMWF OSE forecasts with and without Aeolus and buoy data. The colour of each hexagon indicates the number of samples in it.
4.2 High-latitude region in the Northern Hemisphere (>60∘ N)
4.2.1 Inter-comparison analysis
Over the high-latitude region in the Northern Hemisphere, the NCRMSEs for the u and v components and wind speed are almost negative and decrease as the forecast time is extended, which implies that Aeolus tends to make a positive contribution to medium-range, near-surface wind forecasts (Fig. 6). A significant positive impact is found at T+120 h, T+216 h and T+240 h for the u component; from T+192 h for the v component; and at T+192 h and T+216 h for wind speed. Aeolus was found to have a more positive impact on the v component, with the largest error reduction of 2.4 % at T+216 h. Regarding the results for different wind speed categories (Fig. 7), the noticeable error reductions tend to exist earlier from the T+96 h forecast step for moderate to fresh breezes (6< wspd ≤11 m s−1) compared to the light-wind category; for the category of strong breeze to near gale (11< wspd ≤17 m s−1), the negative NCRMSEs for the v component exist from the T+120 h forecast step, while the largest impacts on the u and v components are observed at T+216 h and T+192 h, respectively, when wind speeds are greater than 17 m s−1, but a further demonstration is required due to a limited number of data samples in this category (N of around 1200). In terms of the results for 2 half years, the NCRMSEs of the u and v components are generally lower from T+120 h during the first half year compared with those for the second half year (Fig. 8a and b). This suggests that Aeolus's data quality is important for near-surface wind forecasts. With respect to the results for each season (Fig. 9), Aeolus makes a greater contribution from T+120 h onwards to the u component forecasts during boreal winter (January, February and December) than during boreal summer (June, July and August). For the v component, the most noticeable error reductions of 3.3 % exist at T+168 h during winter months and 4.4 % at T+216 h during spring (March, April and May).
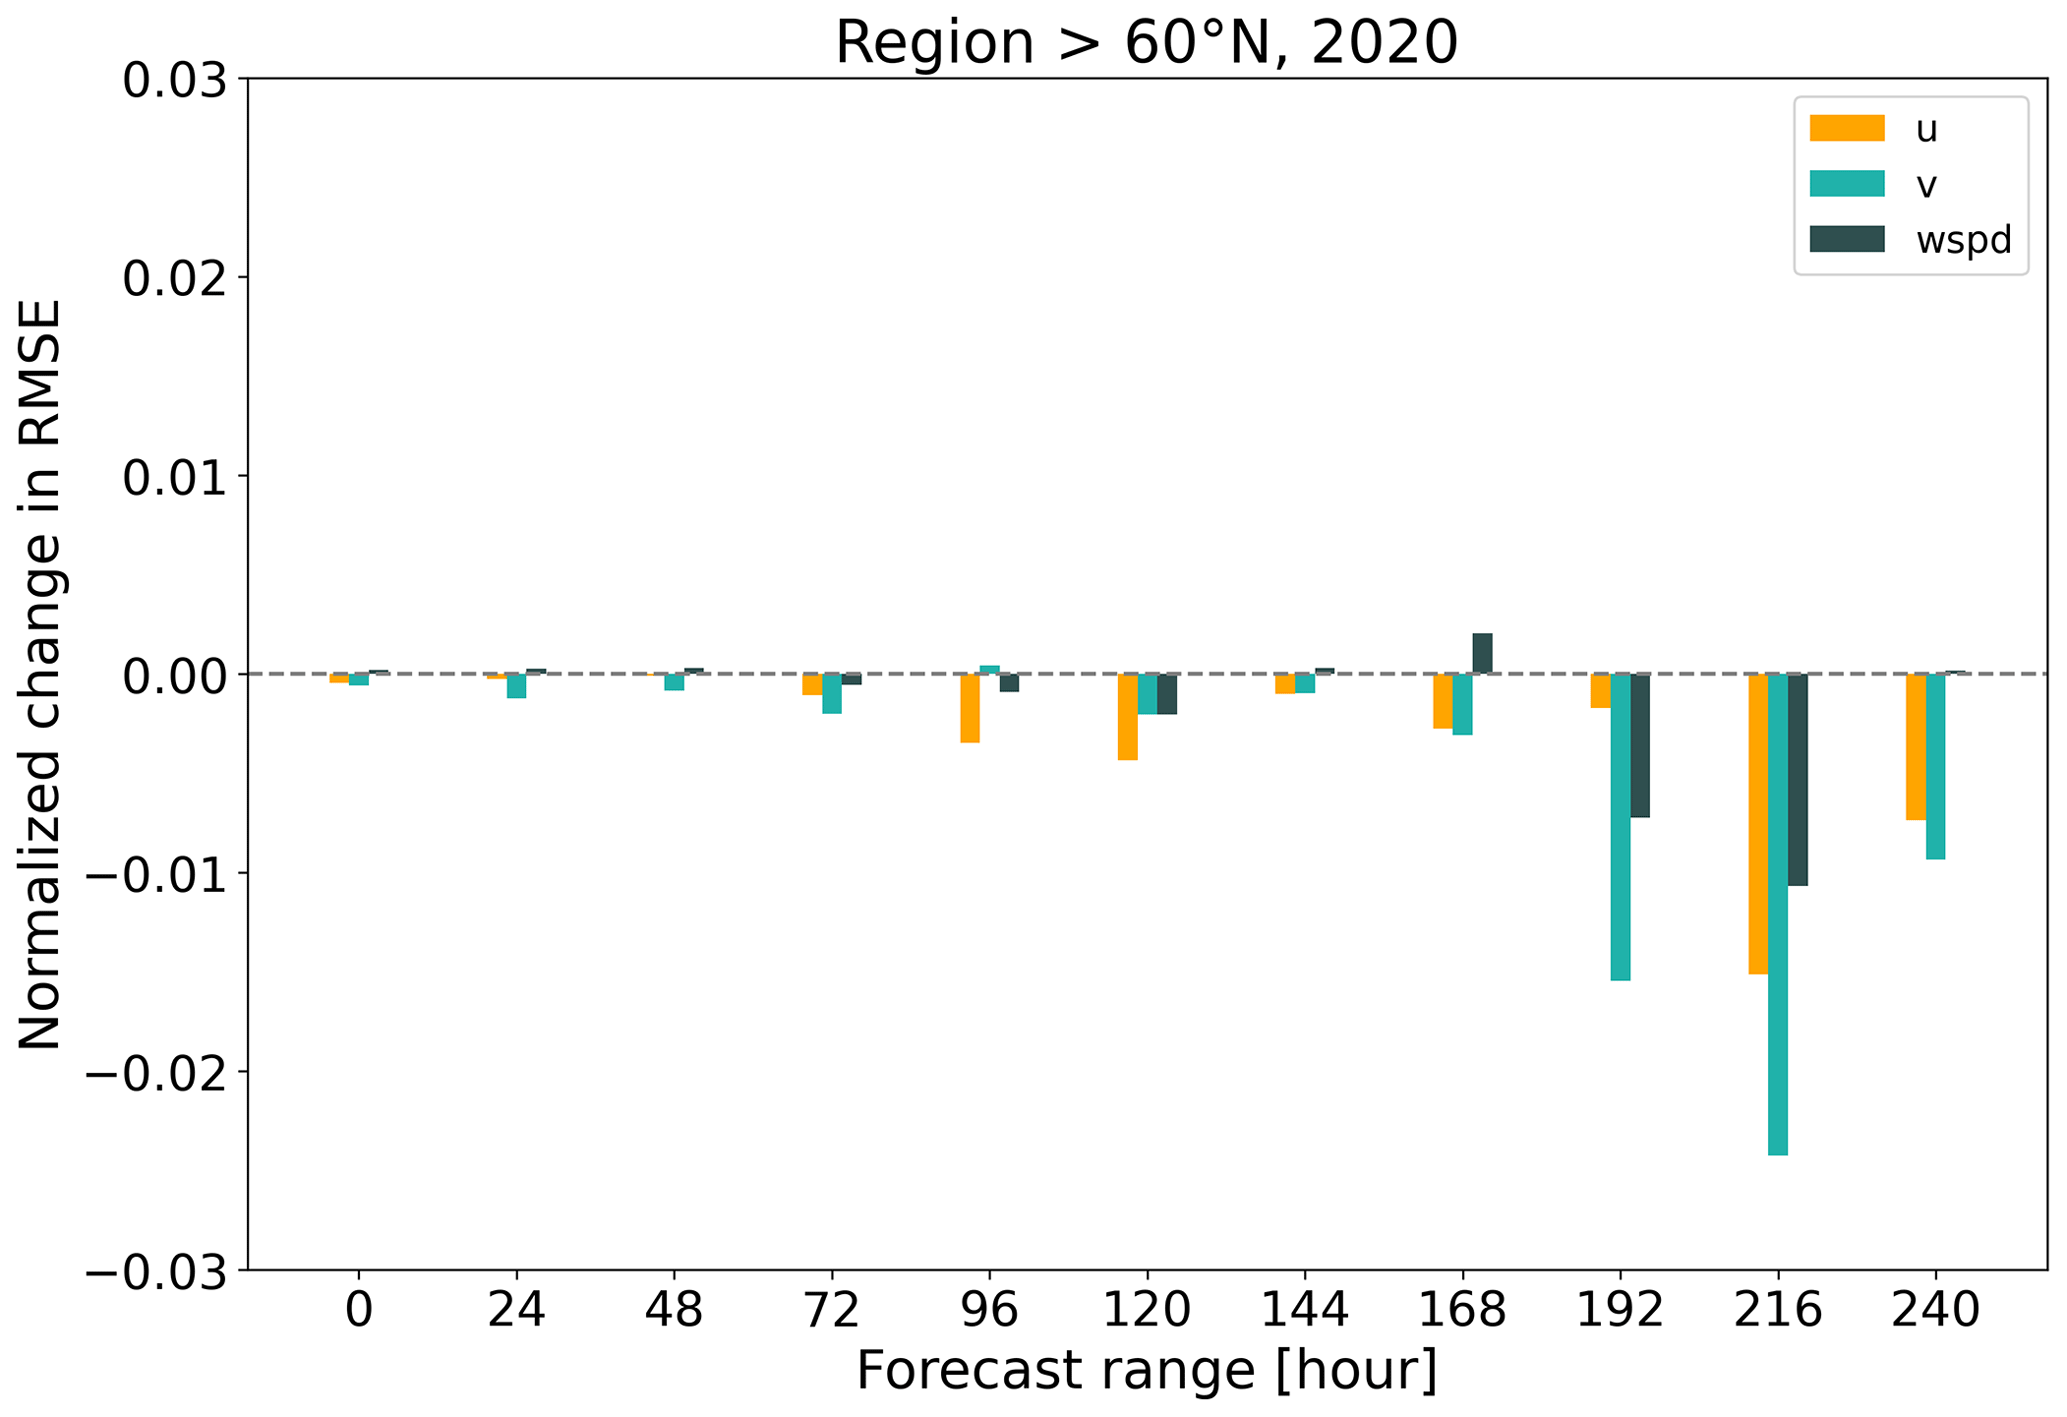
Figure 6Normalized change in RMSE of the u and v components and wind speed (wspd) as a function of forecast range for the region >60∘ N for the year 2020. The ECMWF OSE forecasts with and without Aeolus are compared against weather station data.
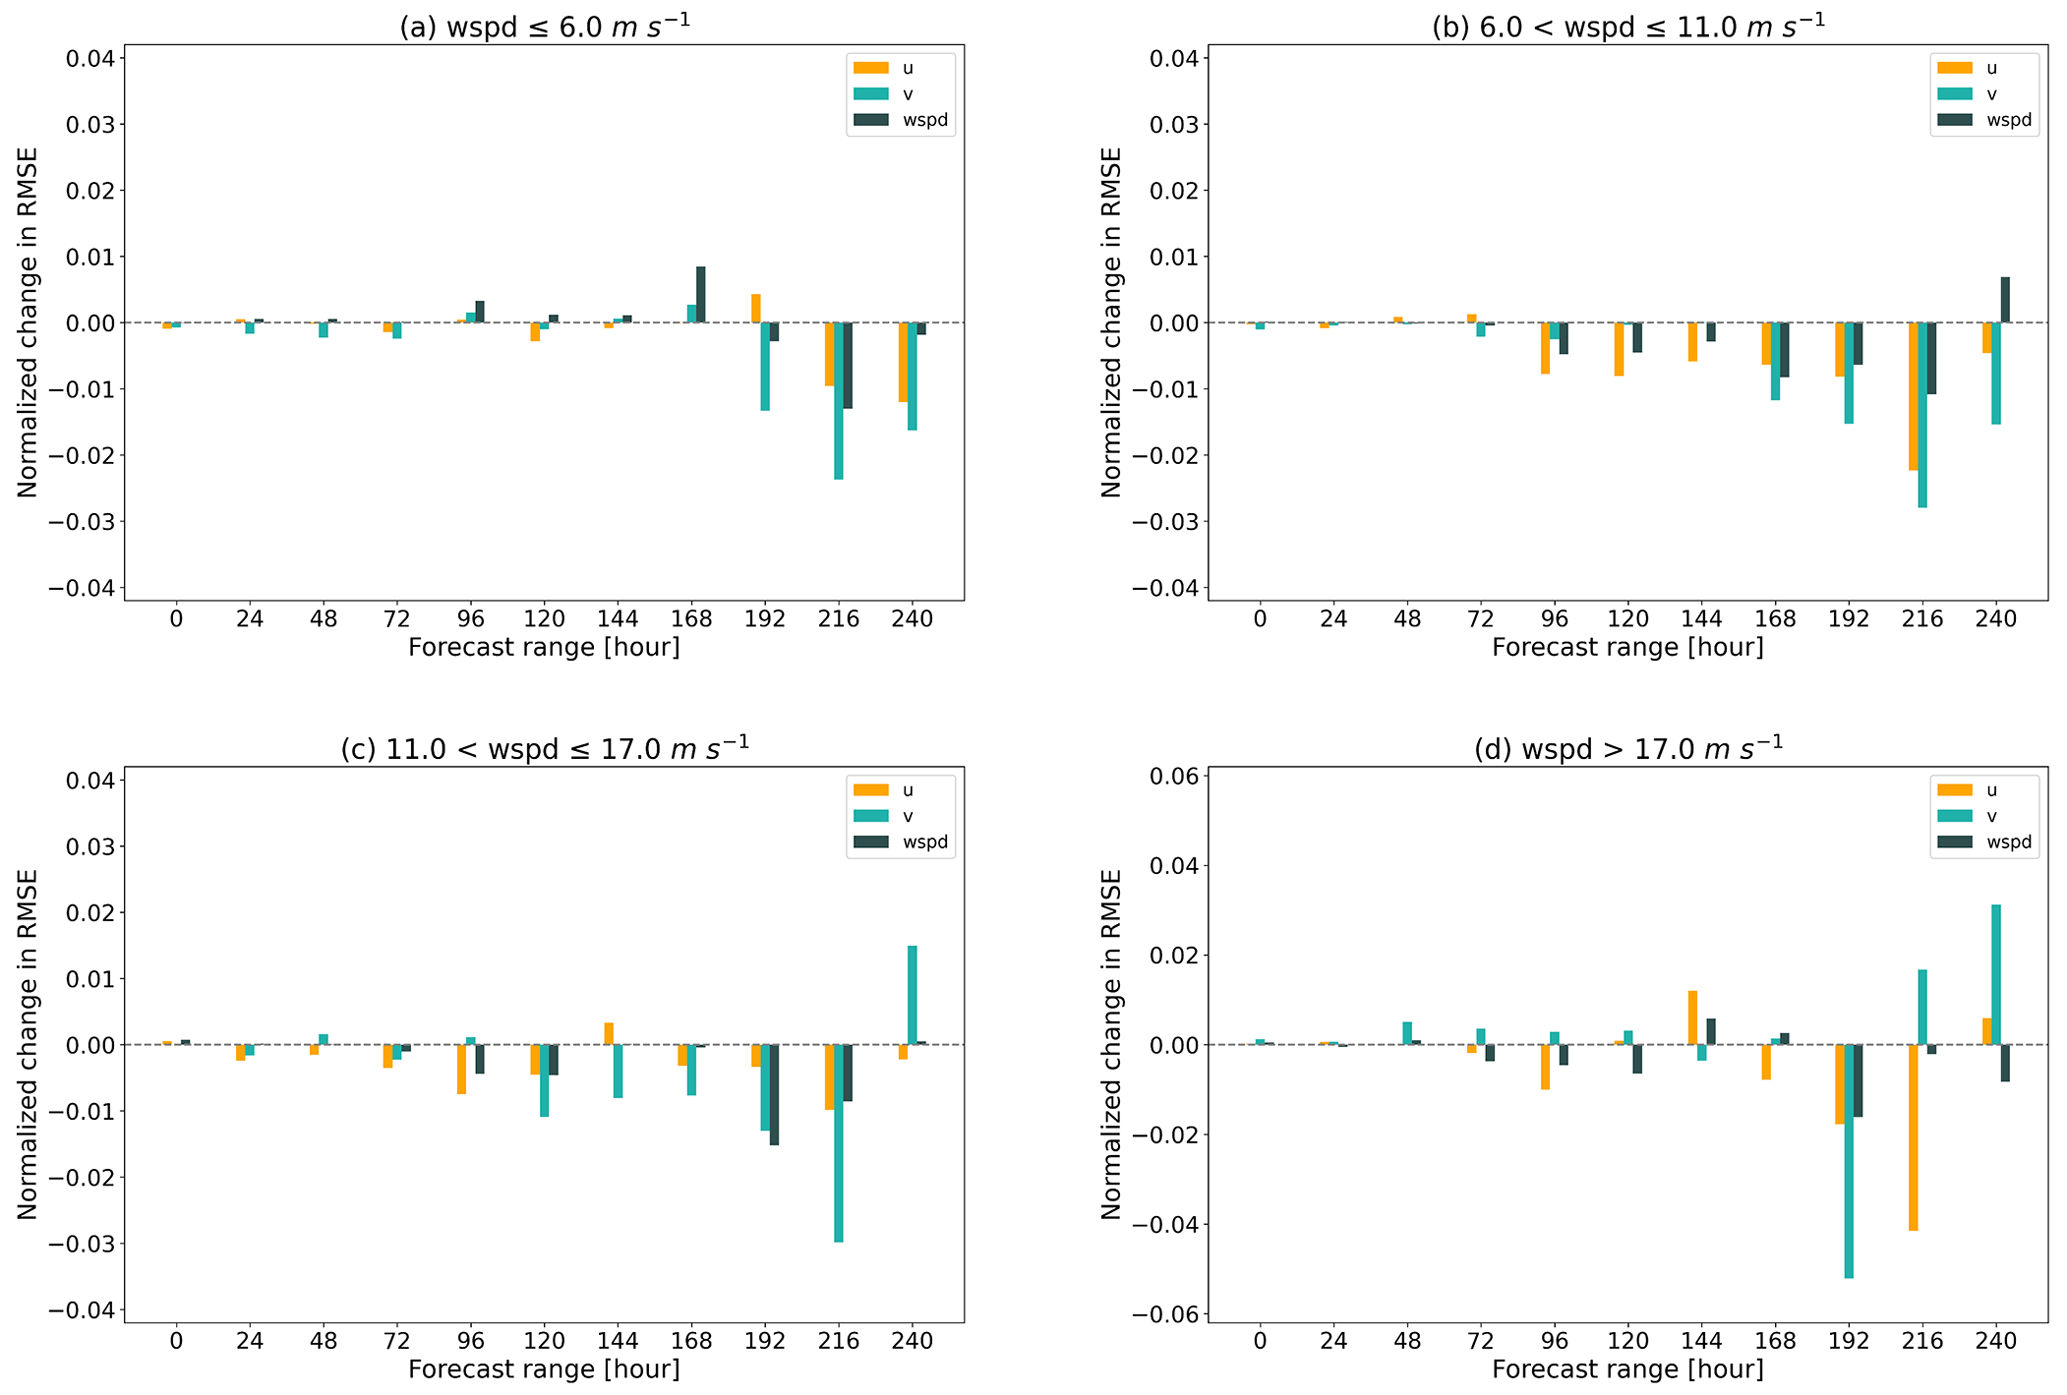
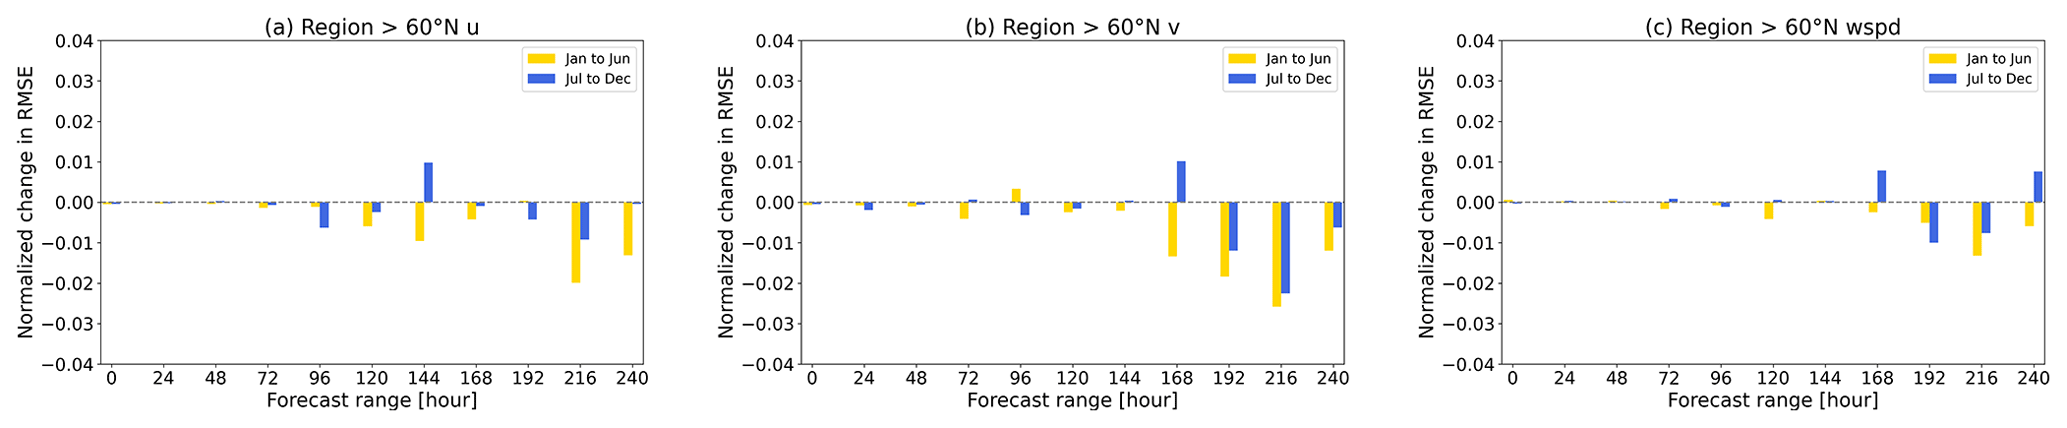
Figure 8Normalized change in RMSE of the u and v components and wind speed (wspd) as a function of forecast range during each half year of 2020 for the region >60∘ N. The ECMWF OSE forecasts with and without Aeolus are compared against weather station data.
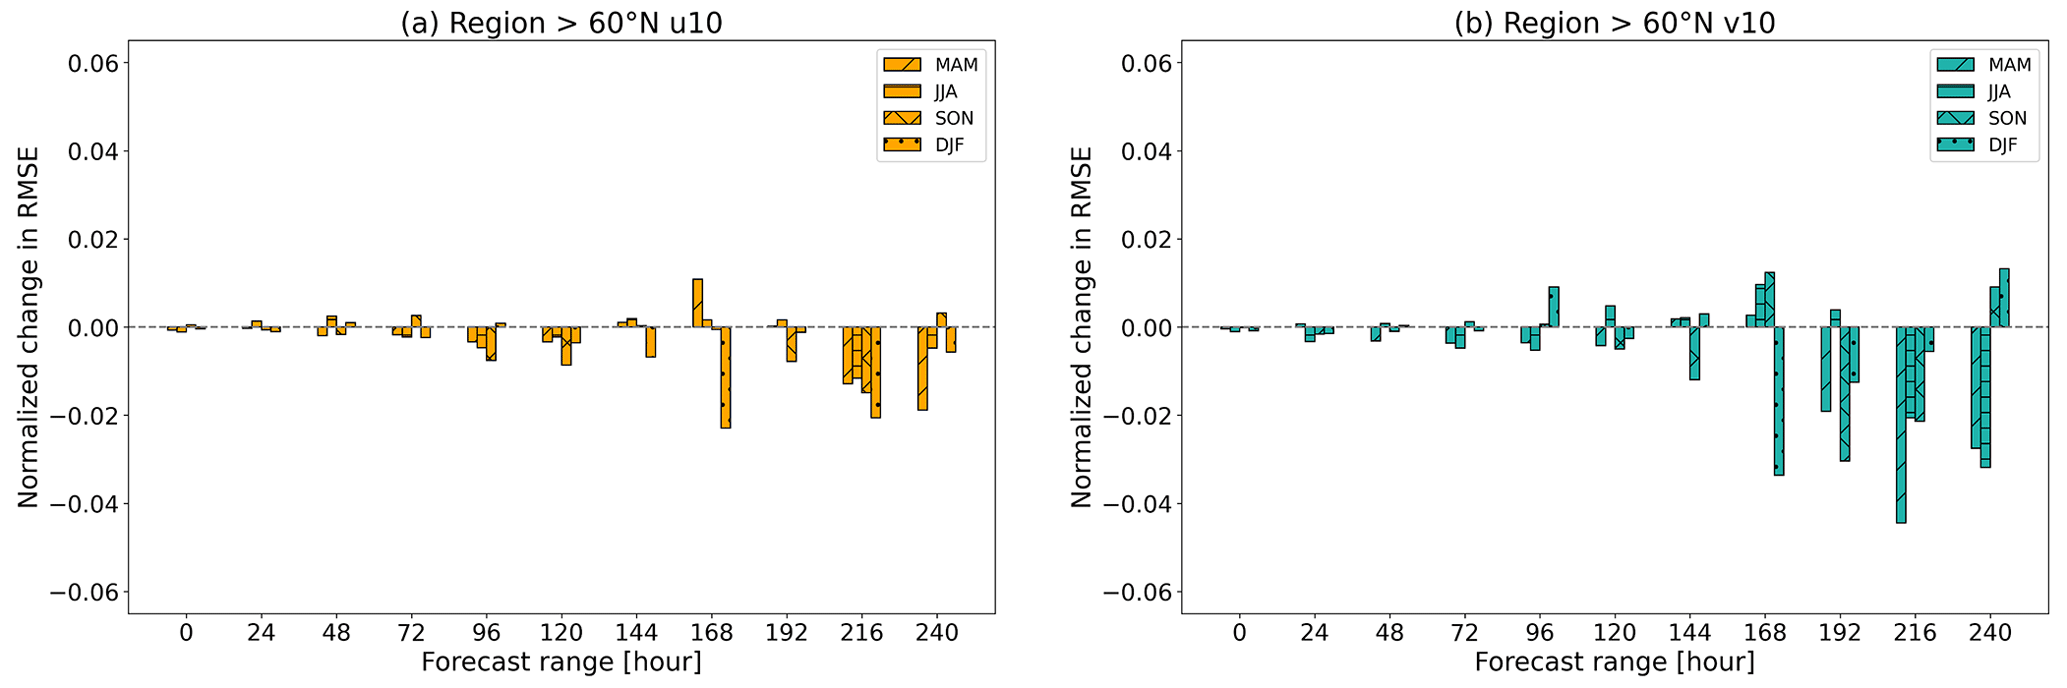
Figure 9Seasonal variation in normalized change in RMSE of the u and v components as a function of forecast range for the region >60∘ N for the year 2020. The ECMWF OSE forecasts with and without Aeolus are compared against weather station data. MAM: March, April and May; JJA: June, July and August; SON: September, October and November; DJF: December, January and February.
4.2.2 Correlations of data sets
Regarding the correlations for the region >60∘ N, the wind components and wind speed between the two forecasts with and without Aeolus assimilation are well correlated as the forecast is extended, with R values greater than 0.90 until T+120 h (Fig. 10a, d and g). Moreover, with the forecast extended, the R values of the forecasts with Aeolus versus in situ measurements are slightly larger than the ones without Aeolus data, which is in line with the inter-comparison analysis, suggesting a minimal improvement in wind forecasts. However, in contrast to the inter-comparison analysis, the R value is not sensitive enough to reflect which wind component can benefit more from Aeolus data assimilation.
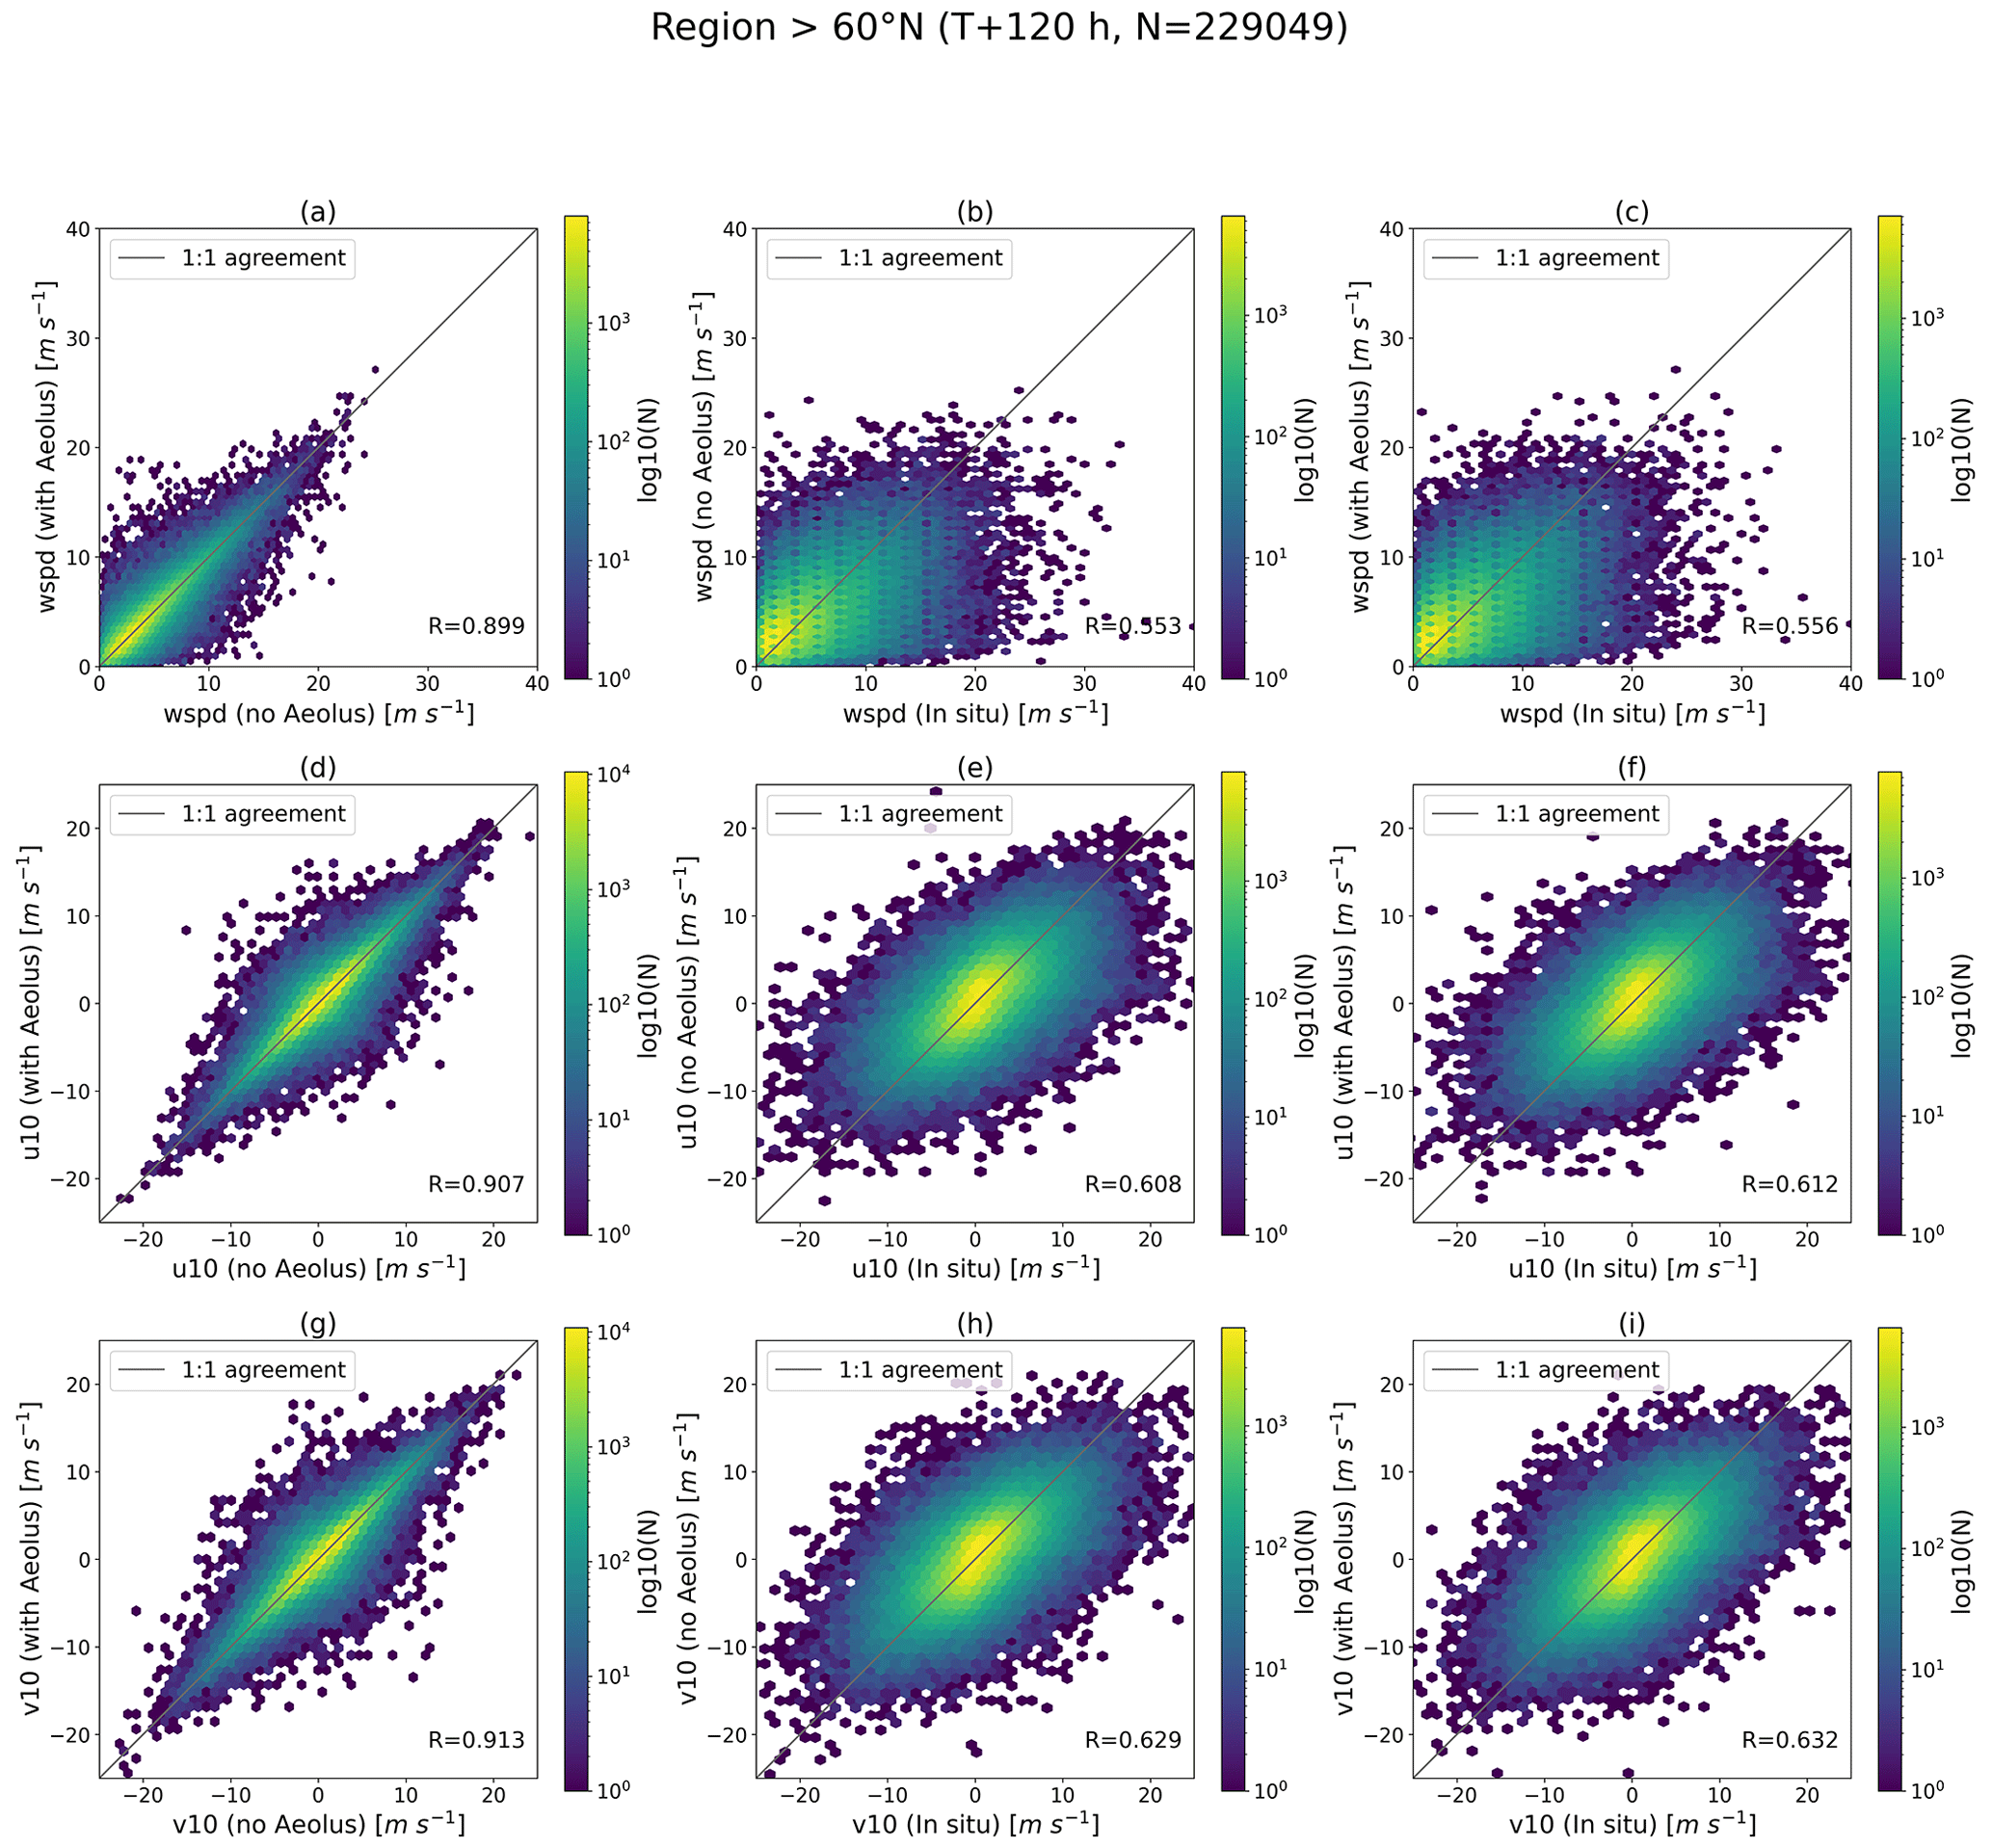
Figure 10Hexagonal binning plots of the u and v components and wind speed at T+120 h for the region >60∘ N for the year 2020 based on the ECMWF OSE forecasts with and without Aeolus and weather station data. The colour of each hexagon indicates the number of samples in it.
4.3 High-latitude region in the Southern Hemisphere (>60∘ S)
4.3.1 Inter-comparison analysis
For the Southern Hemisphere, the impact of Aeolus on wind forecasts is nearly neutral when considering the whole study period, with a significant error reduction only at T+216 h for wind speed forecasts (Fig. 11). Regarding the results for 2 different half years, more negative NCRMSEs of the u component and wind speed were found within T+96 h and at T+216 h and T+240 h during the first half year of 2020 (Fig. 12). With respect to seasonal results (Fig. 13), as the forecast range is extended, there are more negative NCRMSEs in the u component than in the v component, although these exist randomly in any season.
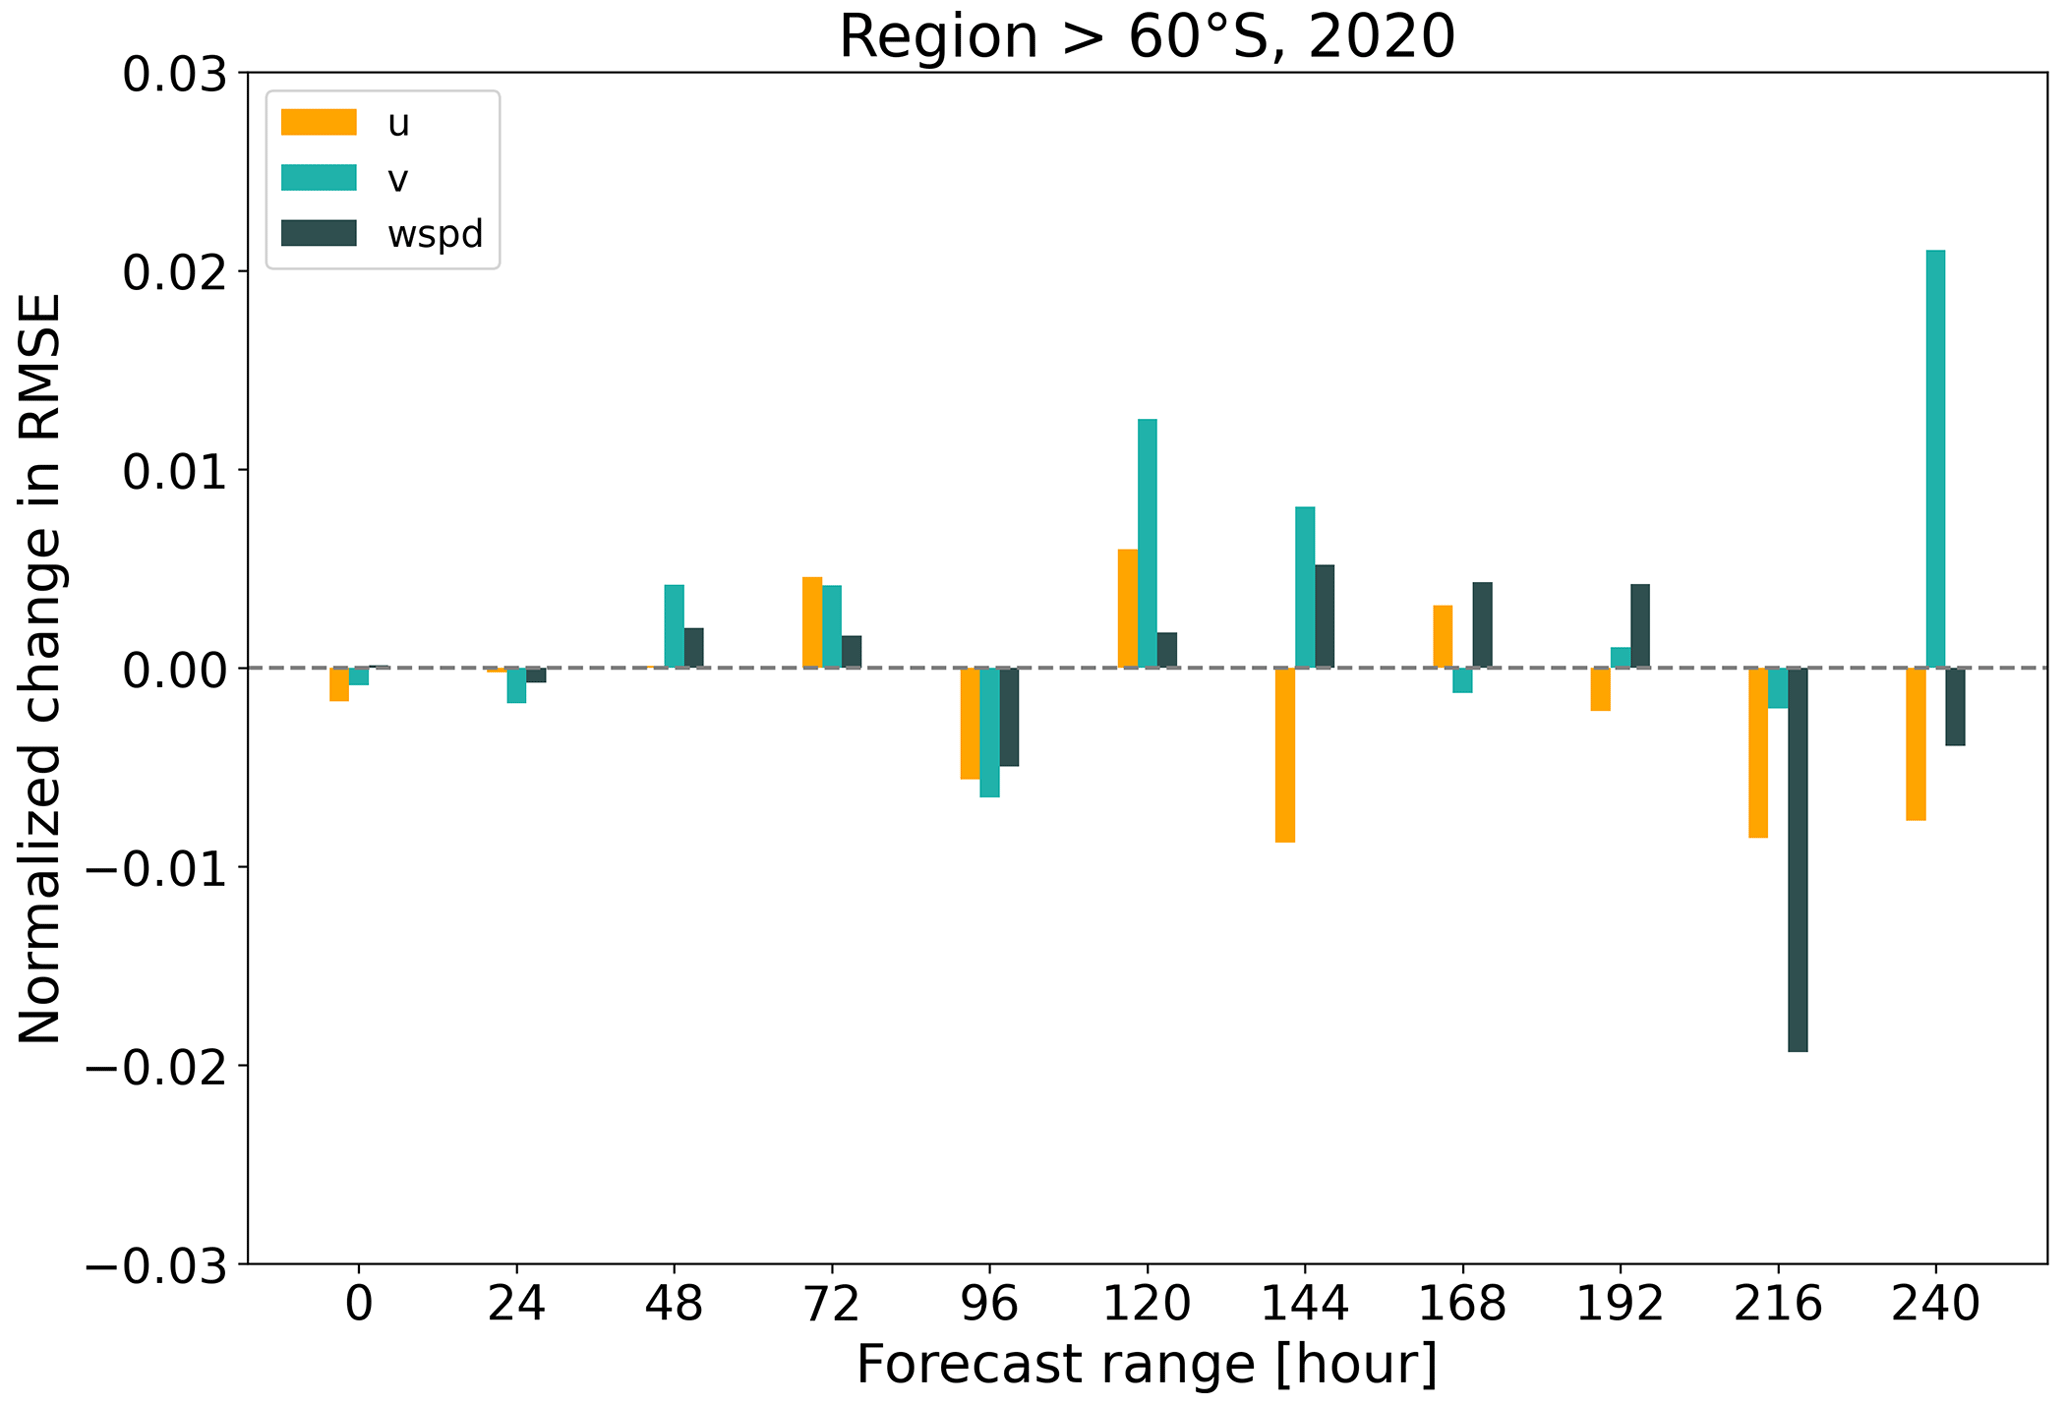
Figure 11Normalized change in RMSE of the u and v components and wind speed (wspd) as a function of forecast range for the region >60∘ S for the year 2020. The ECMWF OSE forecasts with and without Aeolus are compared against weather station data.
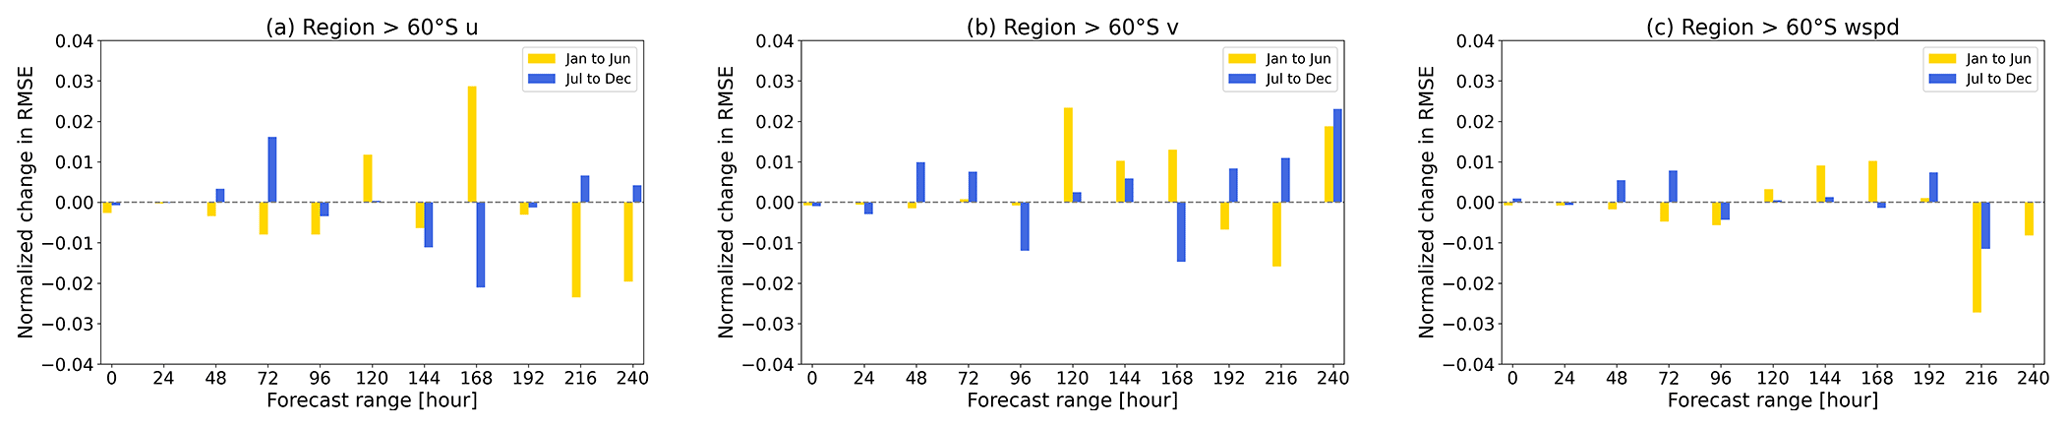
Figure 12Normalized change in RMSE of the u and v components as a function of forecast range for 2 different half years of 2020 for the region >60∘ S. The ECMWF OSE forecasts with and without Aeolus are compared against weather station data.
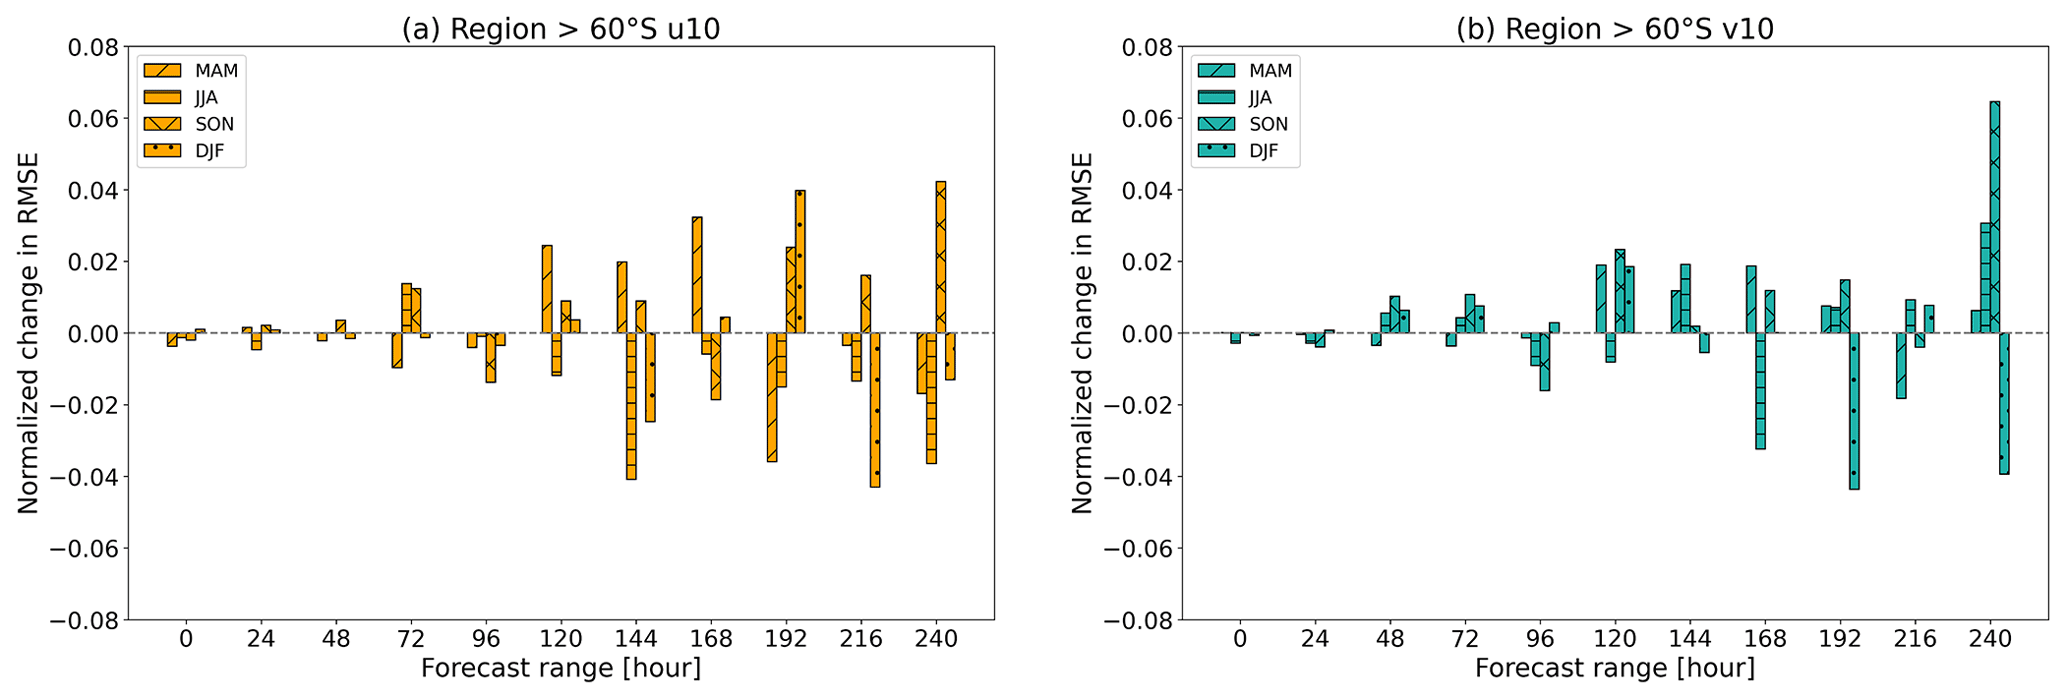
Figure 13Seasonal variation in normalized change in RMSE of the u and v components as a function of forecast range for the region >60∘ S for the year 2020. The ECMWF OSE forecasts with and without Aeolus are compared against weather station data. MAM: March, April and May; JJA: June, July and August; SON: September, October and November; DJF: December, January and February.
4.3.2 Correlations of data sets
Regarding the correlations for the region >60∘ S, the wind components and wind speed between the two forecasts show strong agreement as the forecast is extended, with R values consistently greater than 0.89 up to T+120 h (Fig. 14a, d and g). This pattern is comparable with the results for the region >60∘ N, although the number of data samples is much lower in the region >60∘ S. Moreover, the R values decrease gradually with forecast time, but the correlations for the u and v components are stronger than those for the wind speed for all forecast steps. In addition, the correlations between the forecasts and the in situ measurements are generally consistent with the inter-comparison results, with R values of the forecasts with Aeolus versus in situ data higher than the ones without Aeolus, corresponding to the negative NCRMSEs.
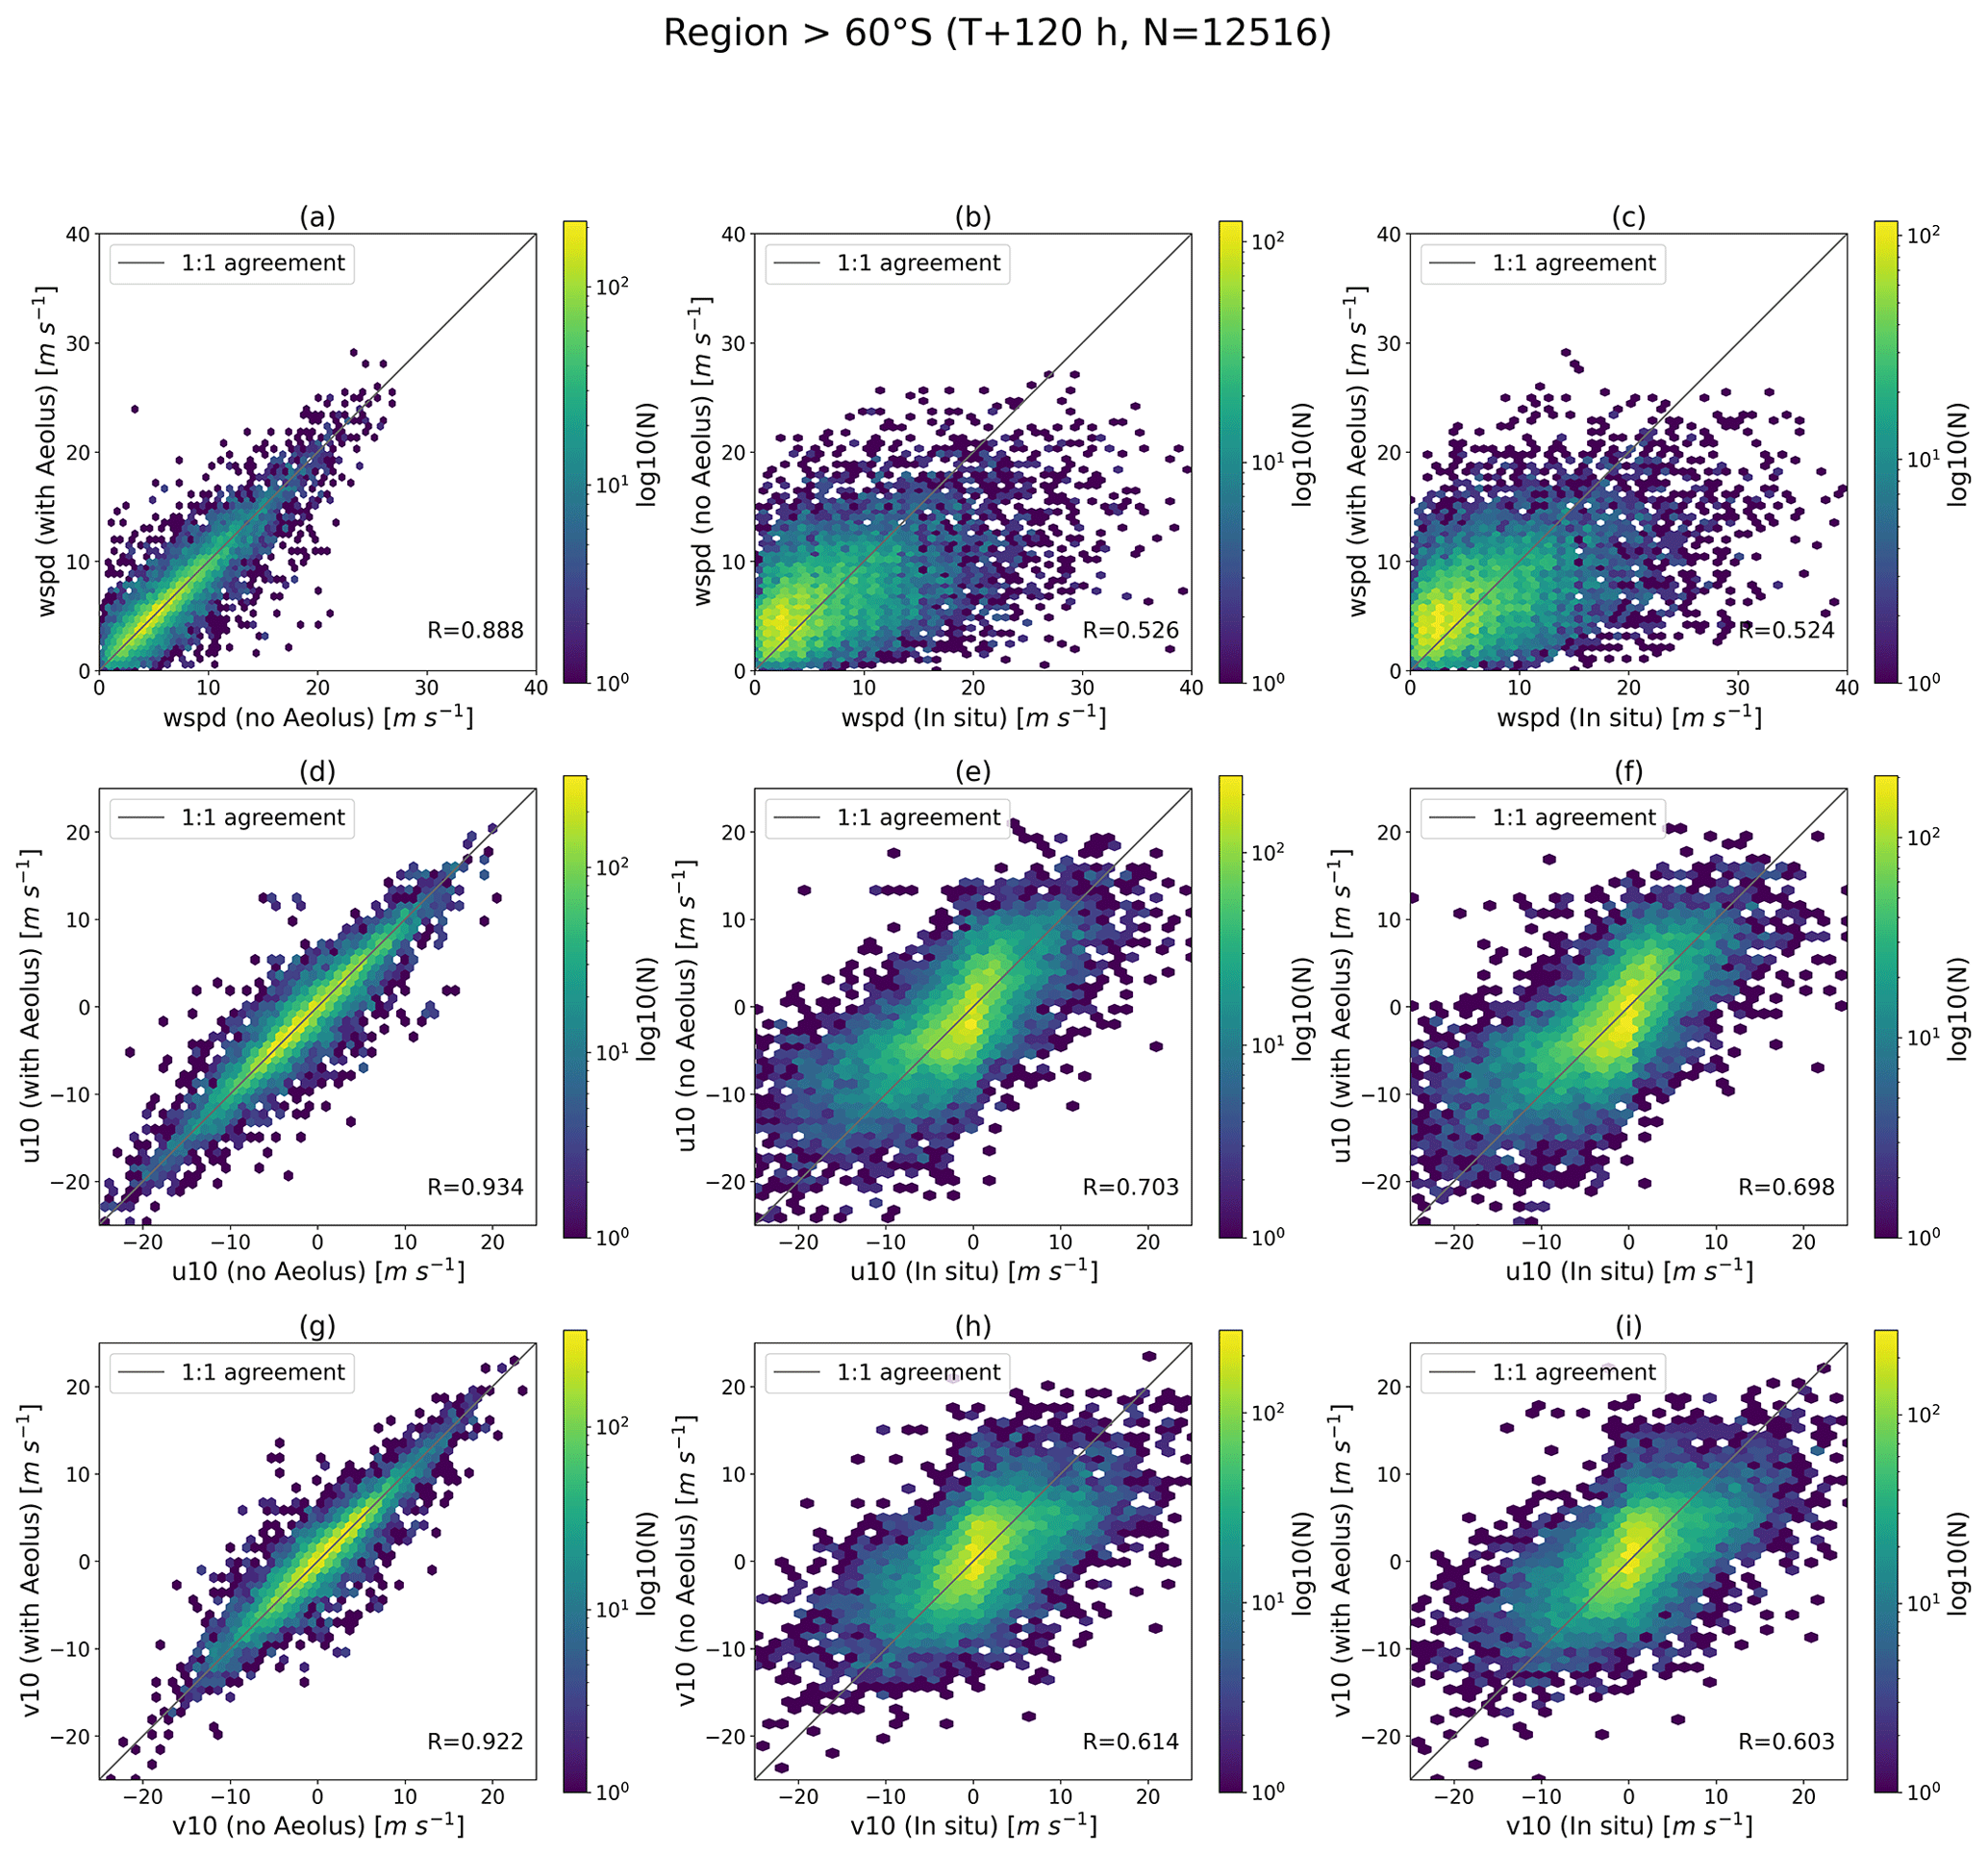
Figure 14Hexagonal binning plots of the u and v components and wind speed at +120 h forecast for the region >60∘ S for the year 2020 based on the ECMWF OSE forecasts with and without Aeolus and weather station data. The colour of each hexagon indicates the number of samples in it.
By taking in situ measurements for reference, we evaluated the impact of Aeolus data assimilation on wind forecasts at the near-surface level based on the ECMWF OSEs. According to the results of inter-comparison analyses for tropical oceans, the impact of Aeolus on sea surface wind forecasts is nearly neutral overall. However, negative NCRMSE values are observed across all three ocean basins at the T+48 h forecast step. Despite not being statistically significant, this result is consistent with the verifications based on the model analysis at the ECMWF (Rennie and Isaksen, 2023), but further demonstration is required with more in situ measurements.
For the NH high-latitude region, Aeolus makes more positive impacts as the forecast is extended. This result is partly comparable with the analysis-based verifications at the ECMWF, with a noticeable positive impact obtained at the T+216 h forecast step (Rennie and Isaksen, 2023). The main difference is that in our study, this evident positive impact exists at more forecast steps from T+192 h to T+240 h, which is in part due to the different reference data we use and the different spatial coverage they have. In addition, since there are a limited number of low-level Aeolus winds inland assimilated into the ECMWF model, we suspect that this positive impact is probably associated with the downward propagation of Aeolus increments to the surface as the changes in stratospheric initial conditions can affect tropospheric circulation in subsequent forecasts (Kodera et al., 1990; Christiansen, 2001; Charlton et al., 2004; Tripathi et al., 2015). Moreover, the greater positive impact is found for the v component at many forecast steps. One possible reason is that at higher latitudes, Aeolus measurements are closer to meridional winds, thus leading to a greater impact on the v component.
To assess the impact of Aeolus data quality on its contribution to wind forecasts, we also divided the study period into two half-year periods. There are more evident error reductions during the first half year than during the second half year for the high-latitude region in the NH, which suggests that the increasing random errors in Aeolus due to signal loss may degrade its impacts on wind forecasts at the surface level. With respect to the impact of different seasons, the results for the region >60∘ N show that Aeolus tends to have a more positive impact on wind forecasts during the winter months than during the summer months. This is partly attributed to the seasonal variation in solar background noise, which leads to larger random errors in Rayleigh-clear winds during summer months over polar regions and in the stratosphere (Reitebuch et al., 2022), thus resulting in larger forecast errors correspondingly. Another possible reason for the seasonal variation in error reduction is the different contributions of Aeolus data assimilation under different wind speed ranges. According to Fig. 7, more error reductions are found when wind speeds are greater than 6 m s−1 for the region >60∘ N. Thus, during the stormy season, which is usually the wintertime for the high-latitude regions, there could be more evident error reductions.
Different from the results for the high-latitude region in the NH, Aeolus winds seem to have a limited impact on improving wind forecasts for the region >60∘ S. This may be due to the poor spatial coverage of weather stations in Antarctica. Apart from this, the model may perform differently when applied to the region >60∘ S due to the coarse model resolution in representing ice sheets and mountainous terrain in Antarctica (Bromwich et al., 2005), which could impair the contribution of Aeolus to surface wind forecasts.
In this study, the normalized change in the RMSEs between the control experiment and the experiment with Aeolus is not statistically significant at a significance level of 0.05 for many cases and forecast steps. We consider this in part to be due to the limited number of buoys and weather stations distributed over the study regions. Another possible reason could be the representativeness of the point-based measurements compared to the coarse model resolution, which makes the errors between in situ measurements and model outputs large and random.
In terms of the evaluation method, apart from the conventional inter-comparison analysis like what we used in this study, triple collocation (TC) analysis is another beneficial method for environmental parameter evaluation when there are three independent data sets (Stoffelen, 1998; Vogelzang and Stoffelen, 2012). Different from the inter-comparison analysis that regards a reference data set free of errors, TC analysis assumes that each data set is linearly correlated with the truth. Following the equation derivation documented in Vogelzang and Stoffelen (2012), the primary output of TC is the error standard deviation (ESD) of each data set, which allows us to compare the quality of different data sets. We made an attempt to implement the TC method in our cases (results are not shown). The results can generally reflect the impact of Aeolus on wind forecasts, with the ESD from the forecast with Aeolus lower than the one without Aeolus, implying a positive impact of Aeolus. But the ESD values may be inaccurate since the errors in the two forecasts are not fully independent because they are from the same NWP model. Theoretically, not taking this dependence into account may lead to the ESDs of two forecasts being underestimated and the ESD of in situ measurements overestimated since the error covariances of the two forecasts are greater than zero (Caires and Sterl, 2003). Therefore, to obtain accurate results when implementing the TC method to assess two correlated data sets, quantifying the non-zero covariance or making a further modification to the method may be required.
With the help of in situ measurements, the contribution of Aeolus wind assimilation to near-surface wind forecasts was assessed for tropical oceans (between 30∘ N and 30∘ S) and high-latitude regions (>60∘ N and >60∘ S) through both inter-comparison analysis and correlation analysis. The wind predictions come from the high-resolution Tco639 OSEs with the ECMWF model.
The results indicate that Aeolus wind assimilation has a limited impact on the sea surface wind forecasts for the tropical oceans, however, which requires further demonstration with more data samples. For the high-latitude region in the NH, error reductions are observed for many forecast steps, and this positive impact becomes more evident with extended forecasts. Moreover, more error reductions are found during the first half year of 2020 and during the winter months owing to the better behaviour of Aeolus and its greater contribution to the moderate to strong wind forecasts. Furthermore, the v wind component is likely to benefit more from Aeolus data assimilation than the u component for the region >60∘ N. Unlike the NH, the contribution of Aeolus to the region >60∘ S is not obvious, and further investigation with more in situ measurements is required. Correlation analysis also reflects the influence of Aeolus on surface wind forecasts to some extent.
Notwithstanding the limited spatial coverage of the reference data, the research findings of this study provide information on the role of Aeolus data assimilation with the ECMWF model in near-surface wind forecasts over the tropical ocean and the high-latitude regions.
The OSEs were conducted by Michael Rennie and Lars Isaksen from the ECMWF, and the u and v wind components were extracted from MARS (https://www.ecmwf.int/en/forecasts/dataset/ecmwf-research-experiments, login required; ECMWF Research Department, 2022). The buoy measurements were obtained from the Global Tropical Moored Buoy Array (https://www.pmel.noaa.gov/tao/drupal/disdel/, last access: 4 August 2022; Pacific Marine Environmental Laboratory, 2022). Wind information at weather stations is accessed via Integrated Surface Database (https://www.ncei.noaa.gov/products/land-based-station/integrated-surface-database#:~:text=GlobalClimateStationSummariesSummariesaresimpleindicators,orlongertimeperiodsorforcustomizedperiods, last access: 11 August 2022; National Centers for Environmental Information, 2022).
HZ obtained the data, performed the data analysis and drafted the manuscript. CBH helped in interpreting the research findings. HZ revised the manuscript critically.
The contact author has declared that neither of the authors has any competing interests.
Publisher’s note: Copernicus Publications remains neutral with regard to jurisdictional claims in published maps and institutional affiliations.
We would like to thank the Royal Netherlands Meteorological Institute (KNMI) for being the secondment host institution. Our special appreciation goes to Ad Stoffelen from KNMI, who gave us the idea to conduct this study, and to Gert-Jan Marseille from KNMI for his assistance with OSE data retrieval. We would also like to show our gratitude to Michael Rennie and Lars Isaksen from the ECMWF for conducting the OSEs and MARS for data access. We thank the National Oceanic and Atmospheric Administration Pacific Marine Environmental Laboratory for buoy data and the National Centers for Environmental Information for wind measurements at weather stations.
This study is a part of the Marie Skłodowska-Curie Actions Innovation Training Network: Lidar Knowledge Europe (LIKE), supported by the European Union's Horizon 2020 research and innovation programme (grant no. 858358). The Otto Mønsted Foundation supported half of the expenses for the secondment at KNMI.
This paper was edited by Markus Rapp and reviewed by two anonymous referees.
Andersson, E., Dabas, A., Endemann, M., Ingmann, P., Källén, E., Offiler, D., and Stoffelen, A.: ADM-Aeolus Science Report, SP-1311, ESA, 121 pp., https://esamultimedia.esa.int/multimedia/publications/SP-1311/SP-1311.pdf (last access: 2 September 2022), 2008.
Banyard, T. P., Wright, C. J., Hindley, N. P., Halloran, G., Krisch, I., Kaifler, B., and Hoffmann, L.: Atmospheric Gravity Waves in Aeolus Wind Lidar Observations, Geophys. Res. Lett., 48, e2021GL092756, https://doi.org/10.1029/2021GL092756, 2021.
Belova, E., Kirkwood, S., Voelger, P., Chatterjee, S., Satheesan, K., Hagelin, S., Lindskog, M., and Körnich, H.: Validation of Aeolus winds using ground-based radars in Antarctica and in northern Sweden, Atmos. Meas. Tech., 14, 5415–5428, https://doi.org/10.5194/amt-14-5415-2021, 2021.
Bidlot, J.-R., Holmes, D. J., Wittmann, P. A., Lalbeharry, R., and Chen, H. S.: Intercomparison of the Performance of Operational Ocean Wave Forecasting Systems with Buoy Data, Weather Forecast., 17, 287–310, https://doi.org/10.1175/1520-0434(2002)017<0287:IOTPOO>2.0.CO;2, 2002.
Bromwich, D. H., Monaghan, A. J., Manning, K. W., and Powers, J. G.: Real-Time Forecasting for the Antarctic: An Evaluation of the Antarctic Mesoscale Prediction System (AMPS), Mon. Weather Rev., 133, 579–603, https://doi.org/10.1175/MWR-2881.1, 2005.
Charlton, A. J., O'neill, A., Lahoz, W. A., and Massacand, A. C.: Sensitivity of tropospheric forecasts to stratospheric initial conditions, Q. J. Roy. Meteor. Soc., 130, 1771–1792, https://doi.org/10.1256/qj.03.167, 2004.
Christiansen, B.: Downward propagation of zonal mean zonal wind anomalies from the stratosphere to the troposphere: Model and reanalysis, J. Geophys. Res., 106, 27307–27322, https://doi.org/10.1029/2000JD000214, 2001.
Caires, S. and Sterl, A.: Validation of ocean wind and wave data using triple collocation, J. Geophys. Res., 108, 3098, https://doi.org/10.1029/2002JC001491, 2003.
Cress, A., Martin, A., Born, M., and Weismann, M.: Impact of Aeolus HLOS winds in the global NWP System of DWD, Towards an operational Doppler Wind Lidar Programme, Darmstadt, Germany, 8–9 September 2022, EUMETSAT, https://www.eventsforce.net/eumetsat/frontend/reg/tAgendaWebsite.csp?pageID=15588&ef_sel_menu=247&eventID=38&mode= (last access: 1 November 2022), 2022.
Data Innovation and Science Cluster (DISC): Summary of Quality of Aeolus Data Products from 1st Reprocessing Campaign covering June to December 2019, ESA, https://earth.esa.int/eogateway/documents/20142/0/Aeolus-Summary-Reprocessing-1-DISC.pdf (last access: 2 November 2022), 2020.
ECMWF: Fact sheet: Earth system data assimilation, ECMWF, https://www.ecmwf.int/sites/default/files/medialibrary/2020-05/ecmwf-fact-sheet-data-assimilation.pdf (last access: 10 November 2022), 2020.
ECMWF Research Department: ECMWF Research Experiments (RD), ECMWF [data set], https://www.ecmwf.int/en/forecasts/dataset/ecmwf-research-experiments, last access: 28 July 2022.
Forsythe, M. and Halloran, G.: Impact of Aeolus Doppler Wind Lidar at the UK Met Office, Towards an operational Doppler Wind Lidar Programme, Darmstadt, Germany, 8–9 September 2022, EUMETSAT, https://www.eventsforce.net/eumetsat/frontend/reg/tAgendaWebsite.csp?pageID=15588&ef_sel_menu=247&eventID=38&mode= (last access: 1 November 2022), 2022.
Garrett, K., Liu, H., Ide, K., Hoffman, R. N., and Lukens, K. E.: Optimization and impact assessment of Aeolus HLOS wind assimilation in NOAA's global forecast system, Q. J. Roy. Meteor. Soc., 148, 2703–2716, https://doi.org/10.1002/qj.4331, 2022.
Hagelin, S., Azad, R., Lindskog, M., Schyberg, H., and Körnich, H.: Evaluating the use of Aeolus satellite observations in the regional numerical weather prediction (NWP) model Harmonie–Arome, Atmos. Meas. Tech., 14, 5925–5938, https://doi.org/10.5194/amt-14-5925-2021, 2021.
Iwai, H., Aoki, M., Oshiro, M., and Ishii, S.: Validation of Aeolus Level 2B wind products using wind profilers, ground-based Doppler wind lidars, and radiosondes in Japan, Atmos. Meas. Tech., 14, 7255–7275, https://doi.org/10.5194/amt-14-7255-2021, 2021.
King, G. P., Portabella, M., Lin, W., and Stoffelen, A.: Correlating Extremes in Wind Divergence with Extremes in Rain over the Tropical Atlantic, Remote Sensing, 14, 1147, https://doi.org/10.3390/rs14051147, 2022.
Kodera, K., Yamazaki, K., Chiba, M., and Shibata, K.: Downward propagation of upper stratospheric mean zonal wind perturbation to the troposphere, Geophys. Res. Lett., 17, 1263–1266, https://doi.org/10.1029/GL017i009p01263, 1990.
Laroche, S. and St-James, J.: Impact of the Aeolus Level-2B horizontal line-of-sight winds in the Environment and Climate Change Canada global forecast system, Q. J. Roy. Meteor. Soc., 148, 2047–2062, https://doi.org/10.1002/qj.4300, 2022.
Met Office: Beaufort wind force scale, Met Office, https://www.metoffice.gov.uk/weather/guides/coast-and-sea/beaufort-scale, last access: 24 February 2023.
Mile, M., Azad, R., and Marseille, G.-J.: Assimilation of Aeolus Rayleigh-Clear Winds Using a Footprint Operator in AROME-Arctic Mesoscale Model, Geophys. Res. Lett., 49, e2021GL097615, https://doi.org/10.1029/2021GL097615, 2022.
National Centers for Environmental Information (NCEI): Integrated Surface Database (ISD), NCEI, National Oceanic and Atmospheric Administration, https://www.ncei.noaa.gov/products/land-based-station/integrated-surface-database#:~:text=Global%20Climate%20Station%20Summaries%20Summaries%20are%20simple%20indicators,or%20longer%20time%20periods%20or%20for%20customized%20periods, last access: 11 August 2022.
Pacific Marine Environmental Laboratory (PMEL): Global Tropical Moored Buoy Array, National Oceanic and Atmospheric Administration, PMEL, National Oceanic and Atmospheric Administration, https://www.pmel.noaa.gov/tao/drupal/disdel/, last access: 4 August 2022.
Parrington, M., Rennie, M., Inness, A., and Duncan, D.: Monitoring the atmospheric impacts of the Hunga-Tonga eruption, ECMWF, https://www.ecmwf.int/en/newsletter/171/news/monitoring-atmospheric-impacts-hunga-tonga-eruption (last access: 2 November 2022), 2022.
Pourret, V., Šavli, M., Mahfouf, J., Raspaud, D., Doerenbecher, A., Bénichou, H., and Payan, C.: Operational assimilation of Aeolus winds in the Météo-France global NWP model ARPEGE, Q. J. Roy. Meteor. Soc., 148, 2652–2671, https://doi.org/10.1002/qj.4329, 2022.
Reitebuch, O., Krisch, I., Lemmerz, C., Lux, O., Marksteiner, U., Masoumzadeh, N., Weiler, F., Witschas, B., Filomarino, V. C., Meringer, M., Schmidt, K., Huber, D., Nikolaus, I., Fabre, F., Vaughan, M., Reissig, K., Dabas, A., Flament, T., Lacour, A., Mahfouf, J.-F., Seck, I., Trapon, D., Abdalla, S., Isaksen, L., Rennie, M., Benedetti, A., McLean, W., Henry, K., Donovan, D., de Kloe, J., Marseille, G.-J., Stoffelen, A., Wang, P., van Zadelhoff, G.-J., Perron, G., Jupin-Langlois, S., Pijnacker-Hordijk, B., Veneziani, M., Bucci, S., Gostinicchi, G., Di Ciolo, L., Bley, S., Geiss, A., Kanitz, T., Straume, A.-G., Wernham, D., Krisna, T., von Bismarck, J., Colangeli, G., Trivigno, V., Romanazzo, M., Aprile, S., and Parrinello, T.: Contributions from the DISC to accomplish the Aeolus mission objectives, Aeolus 3rd Anniversary Conference, Taormina, Italy, 23–27 March 2022, https://elib.dlr.de/186034/ (last access: 20 October 2022), 2022.
Rennie, M. and Isaksen, L.: The NWP impact of Aeolus Level-2B winds at ECMWF, ECMWF, 265 pp., https://confluence.ecmwf.int/display/AEOL/L2B+team+technical+reports+and+relevant+papers?preview=/46596815/348788257/AED-TN-ECMWF-NWP-025--20230809_v7.0.pdf (last access: 17 August 2023), 2023.
Rennie, M. P., Isaksen, L., Weiler, F., de Kloe, J., Kanitz, T., and Reitebuch, O.: The impact of Aeolus wind retrievals on ECMWF global weather forecasts, Q. J. Roy. Meteor. Soc., 147, 3555–3586, https://doi.org/10.1002/qj.4142, 2021.
Sandu, I., Bechtold, P., Nuijens, L., Beljaars, A., and Brown, A.: On the causes of systematic forecast biases in near-surface wind direction over the oceans, ECMWF, 21 pp., https://www.ecmwf.int/sites/default/files/elibrary/2020/19545- causes-systematic-forecast-biases-near-surface-wind-direction-over-oceans.pdf (last access: 22 February 2023), 2020.
Stoffelen, A.: Toward the true near-surface wind speed: Error modeling and calibration using triple collocation, J. Geophys. Res., 103, 7755–7766, https://doi.org/10.1029/97JC03180, 1998.
Straume-Lindner, A. G., Parrinello, T., Von Bismarck, J., Bley, S., Wernham, D., Kanitz, T., Alvarez, E., Fischey, P., De Laurentis, M., Fehr, T., Ehlers, F., Duc Tran, V., Krisch, I., Reitebuch, O., and Renni, M.: ESA'S Wind Mission Aeolus - Overview, Status and Outlook, in: 2021 IEEE International Geoscience and Remote Sensing Symposium IGARSS, IGARSS 2021 - 2021 IEEE International Geoscience and Remote Sensing Symposium, Brussels, Belgium, 12–16 July 2021, IEEE, 755–758, https://doi.org/10.1109/IGARSS47720.2021.9554007, 2021.
Tripathi, O. P., Baldwin, M., Charlton-Perez, A., Charron, M., Eckermann, S. D., Gerber, E., Harrison, R. G., Jackson, D. R., Kim, B., Kuroda, Y., Lang, A., Mahmood, S., Mizuta, R., Roff, G., Sigmond, M., and Son, S.: The predictability of the extratropical stratosphere on monthly time-scales and its impact on the skill of tropospheric forecasts, Q. J. Roy. Meteor. Soc., 141, 987–1003, https://doi.org/10.1002/qj.2432, 2015.
Vogelzang, J. and Stoffelen, A.: Triple collocation, Royal Netherlands Meteorological Institute, 22 pp., https://cdn.knmi.nl/system/data_center_publications/files/000/068/914/original/triplecollocation_nwpsaf_tr_kn_021_v1.0.pdf?1495621500 (last access: 27 January 2022), 2012.
Witschas, B., Lemmerz, C., Geiß, A., Lux, O., Marksteiner, U., Rahm, S., Reitebuch, O., Schäfler, A., and Weiler, F.: Validation of the Aeolus L2B wind product with airborne wind lidar measurements in the polar North Atlantic region and in the tropics, Atmos. Meas. Tech., 15, 7049–7070, https://doi.org/10.5194/amt-15-7049-2022, 2022.
Zuo, H., Hasager, C. B., Karagali, I., Stoffelen, A., Marseille, G.-J., and de Kloe, J.: Evaluation of Aeolus L2B wind product with wind profiling radar measurements and numerical weather prediction model equivalents over Australia, Atmos. Meas. Tech., 15, 4107–4124, https://doi.org/10.5194/amt-15-4107-2022, 2022.