the Creative Commons Attribution 4.0 License.
the Creative Commons Attribution 4.0 License.
 | 28 Sep 2023
Quality assessment of aerosol lidars at 1064 nm in the framework of the MEMO campaign
Longlong Wang
Zhichao Bu
Anzhou Wang
Song Mao
Detlef Müller
Yubao Chen
Xuan Wang
Aerosol lidar networks can play an important role in revealing structural characteristics of the atmospheric boundary layer, the urban heat island effect, and the spatial distribution of aerosols, especially in relation to the monitoring of atmospheric pollution in megacities. To fulfill the need of the monitoring and numerical forecasting of atmospheric pollution, an aerosol lidar network is proposed by the China Meteorological Administration which serves as an important part of the “MegaCity Experiment on Integrated Meteorological Observation in China” (MEMO). To ensure a high standard of data quality and traceability of measurement error, an inter-comparison campaign, dedicated to the quality assessment of lidar systems from different institutes and manufacturers, was designed and performed at Beijing Southern Suburb Observatory in September 2021. Six Mie–Rayleigh lidar systems at 1064 nm were involved in this campaign. The strategies for lidar self-evaluations and inter-comparisons were predefined. A lidar system at 1064 nm, which was developed by the Atmospheric Remote Sensing group at Wuhan University, was selected as the reference lidar system after passing all strict self-evaluation quality checks. The reference lidar system serves as the cornerstone for evaluating the performance of other lidar systems. After using the Rayleigh fit and signal-to-noise evaluation self-tests for each individual lidar system as a fast check of the data quality, the range-corrected signal and backscatter coefficient obtained from all the lidar systems were inter-compared with a reference lidar system. In the end, the lidar systems passed the quality control/assurance, ensuring that the standard deviation of range-corrected signal could be controlled within 5 % at 500–2000 m and 10 % at 2000–5000 m. For the derived aerosol backscatter coefficients, standard deviations can be controlled within 10 % at 500–2000 and 2000–5000 m. The quality assurance strategy lays down a solid basis for atmospheric lidar at near-infrared wavelengths and will be applied in Chinese lidar network development.
- Article
(2869 KB) - Full-text XML
- BibTeX
- EndNote


Atmospheric lidar plays a crucial role in observing the Earth’s atmosphere. It enhances our understanding of the roles that clouds and aerosols play in our climate system by providing profiles of the aerosol backscatter coefficient, extinction coefficient, and other intensive optical properties with high temporal and vertical spatial resolution (Sugimoto and Lee, 2006; Müller et al., 2007; Mona et al., 2012). In addition, it has been utilized to observe the vertical distribution of water content (e.g., Whiteman, 2003; Liu et al., 2022), temperature (e.g., Hauchecorne et al., 1992; Weng et al., 2018), cloud layers and cloud phase (e.g., Haarig et al., 2016; Lolli et al., 2018; He et al., 2022), and, in particular, aerosol distributions and characteristics (such as smoke plumes and the properties and transport of mineral dust aerosols, marine aerosols, and other pollutants; see, e.g., Papayannis et al., 2009; Engelmann et al., 2021; Groß et al., 2011; Qin et al., 2016; Mamouri and Ansmann, 2017; Wang et al., 2019a; Yin et al., 2019; Wang et al., 2019b; Yin et al., 2021; Wang et al., 2022) in the atmosphere.
For the investigation of long-range aerosol transport mechanisms, it is necessary to extend the scale of investigation region, which is achievable by establishing large ground-based lidar networks such as the EARLINET (European Aerosol Lidar NETwork; D'Amico et al., 2015) in Europe, which is a part of the Aerosol Cloud and Trace Gases Research Infrastructure (ACTRIS) and also PollyNET (POrtabLe Lidar sYstem NETwork, operated as a part of EARLINET; Baars et al., 2016), AD-NET (Asian Dust and aerosol lidar observation network; Sugimoto and Lee, 2006) in Asia, and MPLNET (Micro-Pulse Lidar NETwork; Welton et al., 2001; Lolli et al., 2019) around the world. To obtain a quantitative, unbiased, quality-assured, and statistically significant dataset of lidar observations, the lidar instruments must be consistent in their performance after being deployed at long-range distributed multiple stations. Therefore, ensuring the accuracy and consistency of the dataset is a crucial issue for the reliability of a lidar network. However, lidar systems are rather complex, containing several subsystems that are not easily standardized, and their performance is critically dependent on a number of adjustments. Lidar calibration is one of the main processes used to ensure instrument accuracy. In one method of calibration, measurements are compared between an un-calibrated lidar and a reference instrument, which is used to check the accuracy of lidar products. There have been various methods used for calibrating a lidar. MPLNET was calibrated by normalizing their signal to the molecular profile but requires knowledge of the aerosol optical depth of the atmosphere to correct the transmission loss of laser power (Welton et al., 2001; Lolli et al., 2019). Since the MPLNET lidar sites are co-located with AERosol RObotic NETwork (AERONET; Holben et al., 1998) sites, the aerosol optical depth can be derived directly from the AERONET column optical depths measured by a sun photometer. A comprehensive method for self-checking lidar hardware was proposed by EARLINET (Freudenthaler et al., 2018). To achieve comparable performance at many stations, EARLINET used to perform direct inter-comparisons at the system level (Grabbe et al., 1996; McDermid et al., 1990; Ferrare et al., 1995; Sherlock et al., 1999; Freudenthaler et al., 2010). In addition, the Lidar Calibration Centre (LiCal) was established using the reference lidar system to calibrate and assess other lidars and ceilometers (Matthais et al., 2004; Böckmann et al., 2004; Sicard et al., 2009; Pappalardo et al., 2014; D'Amico et al., 2015; Wandinger et al., 2016; Papagiannopoulos et al., 2016; Proestakis et al., 2019; Campbell et al., 2002).
Since lidar systems in EARLINET were developed independently at stations in different countries, the aerosol lidars and their retrieval algorithms used are not the same (D'Amico et al., 2015). The generally accepted way to check the quality and reliability of lidar performance is to place many lidar systems for co-located measurement and data comparison simultaneously. Once good consistency from multiple lidar data is achieved, all of these lidars are considered accurate (Matthais et al., 2004; Böckmann et al., 2004; Sicard et al., 2009). In 2000, there were 19 lidar sites from 11 countries in Europe that made up EARLINET. In 2009, EARLINET organized a lidar inter-comparison campaign, where 11 systems from 9 sites were jointly compared in Leipzig, Germany (Freudenthaler et al., 2010). After that, the other lidars were calibrated using the system that had been compared, and the whole inter-comparison process was completed in 2013 (Papagiannopoulos et al., 2016; Proestakis et al., 2019). Finally, the deviation of lidar returned signal was less than 2 %, the deviation of boundary layer aerosol backscattering signal was less than 10 %, and the average deviation was less than 5 % (Wandinger et al., 2016). On the basis of mutual calibration, EARLINET has established three calibration centers in Italy, Romania, and Germany for lidar calibration (D'Amico et al., 2015; Pappalardo et al., 2014).
The American MPLNET observatory has been online since the 1990s and now has 82 sites around the world. Since 2000, MPLNET has used a standardized lidar system for networking calibrations, and all of them use unified automated data analysis algorithms. The overall hardware of MPLNET is produced by the manufacturer, and preliminary hardware verification is completed (Campbell et al., 2002). It was then transported to the Goddard Space Flight Center (GSFC) for testing and inter-comparison with a standard lidar (Córdoba-Jabonero et al., 2021).
The Mie–Rayleigh lidar at 1064 nm is commonly used for aerosol in particular smoke and volcanic ash as well as cirrus (Haarig et al., 2018; Vaughan et al., 2019; Pauly et al., 2019; Li et al., 2020; Yuan et al., 2022; Haarig et al., 2022) due to its higher atmospheric transmission than that at 355 and 532 nm (Salvoni et al., 2021; Wu et al., 2020; Liang et al., 2019; Xian et al., 2020; Xu et al., 2022). Accurate measurements of aerosol and cloud backscatter coefficient at 1064 nm are critical to improving our understanding of various physical properties of the atmosphere, specifically how clouds and aerosols radiatively impact our Earth in the infrared (Pauly et al., 2019). Due to the weaker molecular signal-to-noise ratio (SNR) at 1064 nm compared to 532 nm for these instruments, it is very challenging to find the pure molecular signal as a reference at 1064 nm, so calibration for 1064 nm attenuated total backscatter (ATB) is based on the 532 nm ATB calibration (Vaughan et al., 2019). The 1064 nm signal is calibrated utilizing the 532 nm calibrated signals within cirrus clouds. For any individual profile, the CALIPSO at 1064 nm calibration coefficient is simply the product of the interpolated instantaneous value of the scale factor time history and the corresponding calibration coefficient at 532 nm. However, the backscatter lidars at 1064 nm to fill the existing observational gaps within the existing lidar networks at the global scale are in continuous growth due to the advantages of low-cost, unattended, and continuous operation, while there are few studies that focus on their quality control and assessment of their hardware and data (Wiegner and Geiß, 2012).
In order to quantitatively assess the direct impact of aerosol concentration on air quality and exclude the interference of meteorological factors, it is important to deeply understand the frequent outbreaks of long-term air pollution in large regions (such as the Beijing–Tianjin–Hebei region and its surrounding areas). Currently, China is in the process of building a comprehensive and stereoscopic observation network (Lv et al., 2020; Huang et al., 2019; Chen et al., 2019), which may lead to isolated and one-sided measurements from each observation station; therefore qualitative analysis of the spatiotemporal association between the stations with a non-biased, comprehensive, and statistical dataset is urgently needed. As atmospheric lidars are shifting from qualitative to quantitative applications, the requirements for its instrument function and data quality are increasingly high, and direct mutual comparison must be made at the system level. China has made great efforts to mitigate its long-standing environmental problem in recent years. There are many aerosol lidar observation stations in China, which are mainly polarization Mie–Rayleigh lidars at 532 nm. In 2017, Chen et al. (2019) carried out self-calibration and inter-comparison experiments of multiple aerosol lidar for the first time in Beijing. Subsequently, an inter-comparison experiment involving 12 lidar systems was carried out using a reference lidar system (REAL-VIS at 532 nm) in 2019. At present, Chinese lidar calibration methods mainly focus on the influence of system performance on aerosol backscattering coefficient retrieval at 532 nm; thus the calibration and inter-comparison of 1064 nm channel are not only missing in China but also rarely reported in other regions or countries.
Based on the lidar inter-comparison observation campaign in September 2021 in the Beijing Southern Suburb Observatory, this paper introduces the lidar quality assessment strategy for 1064 nm lidar. The methods of self-calibration and inter-comparison for 532 nm lidar by EARLINET were adopted. For the systematic improvement of lidar hardware and evaluation of the reliability of the 1064 nm channel of many sets of lidar systems, the deviations of the Mie–Rayleigh signal and its influence on the backscatter coefficient were analyzed. This inter-comparison campaign aims to provide a relatively comprehensive quality assessment and control scheme for a single-wavelength lidar system at 1064 nm, optimize the data consistency comparison and verification scheme among multiple lidar systems, and quantitatively evaluate the errors of data products, so as to lay a foundation for the subsequent establishment of a long-term and stable megacity aerosol lidar observation network. The campaign methodology and the results are discussed in the following. In Sect. 2, an overview of the campaign with the description of involved lidar systems, and the strategy applied is given. In Sect. 3, the self-test and inter-comparison results are presented. Finally, Sect. 4 gives the conclusions and an outlook for future work.
2.1 Inter-comparison campaign overview
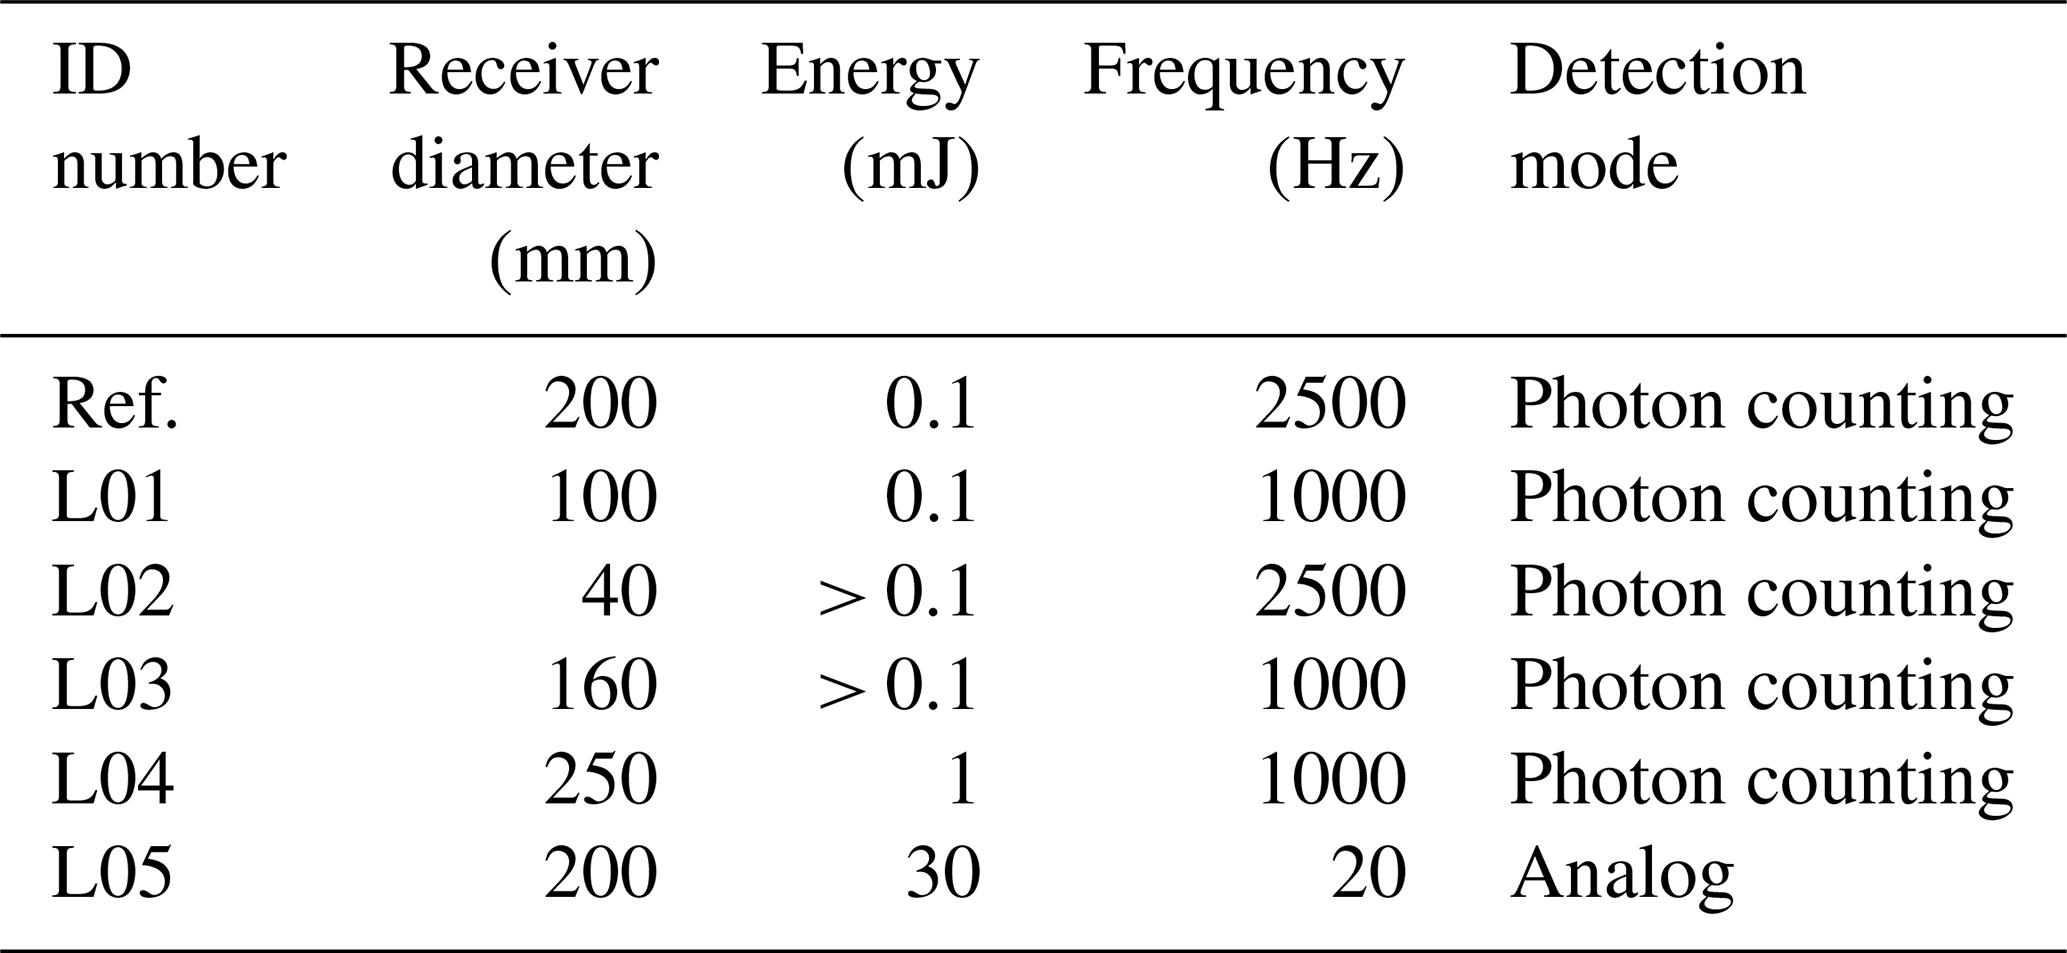
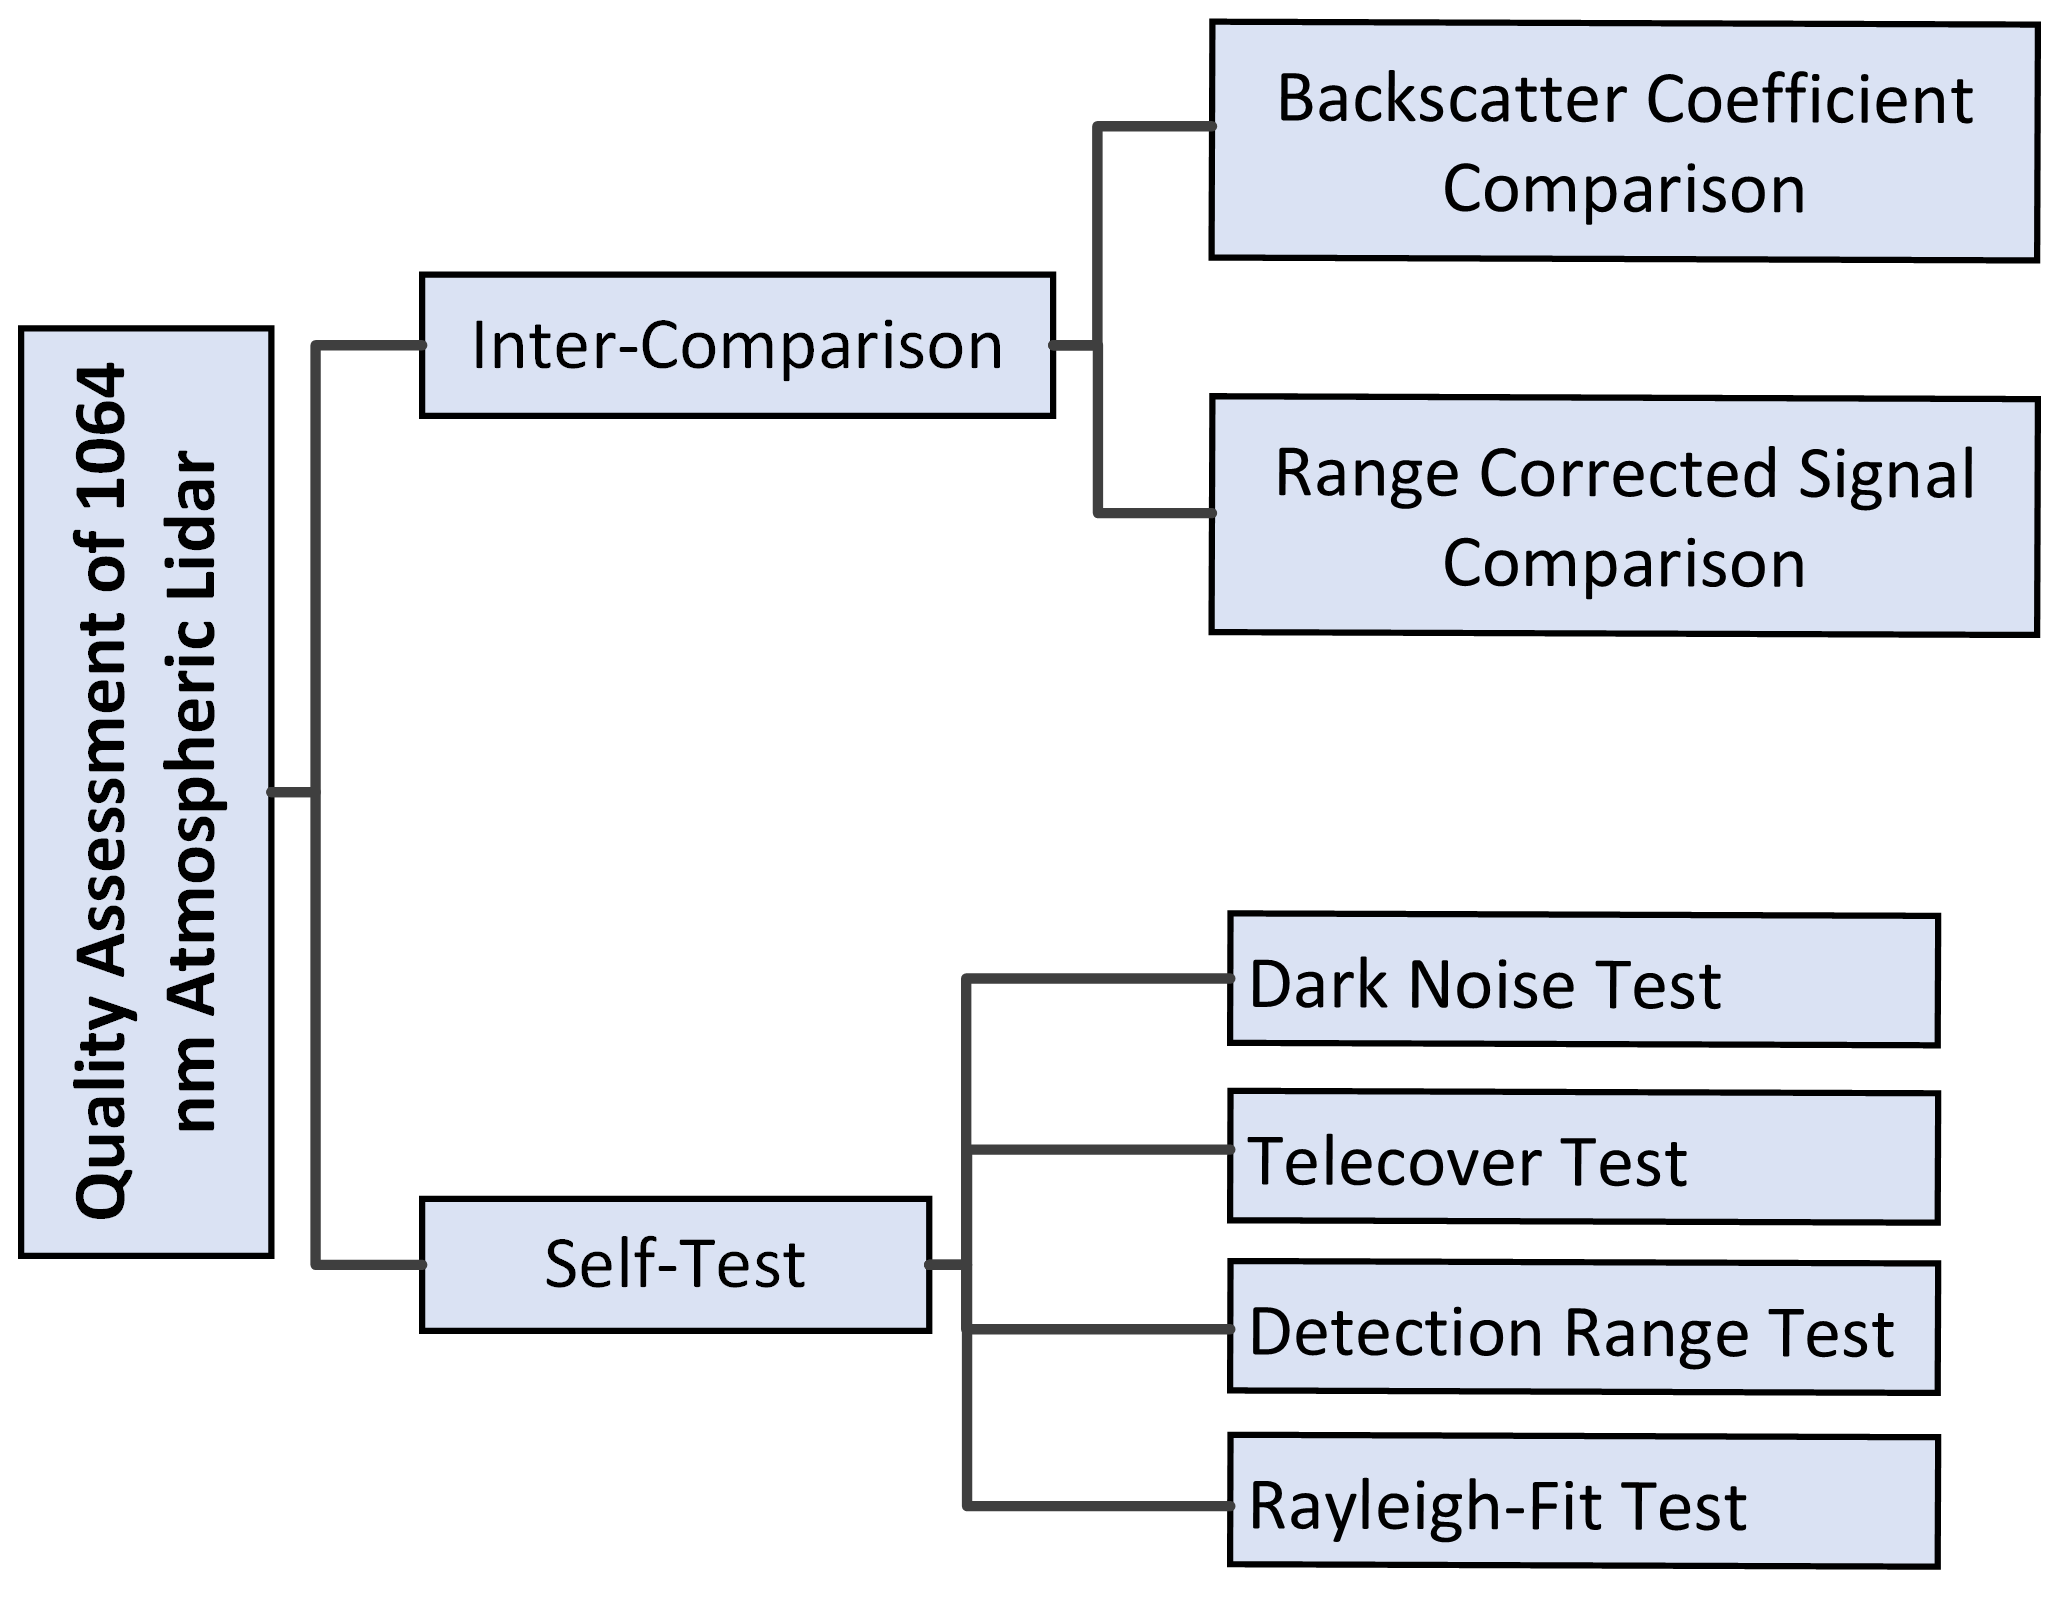
This inter-comparison campaign was carried out at the Nanjiao observatory on the southern outskirts of Beijing (39.95∘ N, 116.39∘ E; 39 m a.s.l.) on 27 September 2021. It was organized by the China Meteorological Administration, as one part in the framework of the MEMO campaign. During the campaign, the weather was calm with a wind speed of less than 3 m s−1. Cirrus was present and covered the height from 7 to 12 km most of the time. For the campaign, six co-located lidar systems with infrared Mie–Rayleigh channels were involved. These instruments were manufactured by different specialized companies with featured configurations, including different emission and reception modules. The ID numbers were made up for each lidar system at 1064 nm for easier identification, and their hardware parameters were provided by their manufacturers, which are summarized in Table 1. As it is very difficult to construct a mean signal as an absolute reference for the inter-comparison, the lidar at 1064 nm developed by Wuhan University was employed as a reference system because each of its components was well characterized, and the system was well calibrated using the EARLINET quality assurance standards (Freudenthaler et al., 2018) as well as being inter-compared with respect to the standardized lidar at 532 nm (Chen et al., 2019). It has the ability to observe the atmosphere at the range from 0.2 km up to more than 10 km in nighttime conditions at 1064 nm with a repetition rate of 2500 Hz, a 0.1 mJ laser emitter, and a diameter of 200 mm using a Cassegrain telescope receiver. The backscattered 1064 nm light is extracted by an interference filter at the center wavelength 1064.2 nm with 1 nm bandwidth provided by Alluxa Inc. (https://www.alluxa.com/, last access: 6 August 2023). In order to eliminate the background noise from the detector, the backscattering signal is collected by a single-photon avalanche diode (SPAD; SPCM-AQRH-13, Excelitas Canada Inc., https://www.excelitas.com/product/spcm-aqrh, last access: 6 August 2023) with photon-counting mode, and its output signal is amplified and digitized by the configurable lidar acquisition system (CLASS; Advanced Lidar Applications S.R.L, https://alasystems.it/, last access: 6 August 2023) with a spatial resolution of 15 m. In this campaign, all lidar systems employed a SPAD detector with photon-counting mode except for the no. L05 lidar system for which the analog detection mode of the avalanche photodiode detector (APD) was applied. The inter-comparison observation includes two parts. The first part was self-calibration according to the EARLINET quality assurance tool (Freudenthaler et al., 2018), which includes the Rayleigh fit, the detectable range check, and the telecover test. The second part was inter-comparison with the measurements taken from reference lidar, as can be seen in Fig. 1. The China Meteorological Administration (CMA) is promoting the use of lidar instruments and their data among the Chinese lidar network. To achieve this goal, inter-comparison was conducted at the hardware level; the range-corrected lidar signals were inter-compared directly. And the inter-comparison of the aerosol backscatter coefficient at 1064 nm retrieved by each lidar system was also performed in this study.
Table 1The ID numbers of lidar systems at 1064 nm and their hardware parameters provided by the manufacturers.
2.2 Inter-comparison strategy
In the entire measurements from all the lidar systems, the raw data were sampled with a time resolution of 1 min and range resolution of 15 m. This uniformity in data collection makes the inter-comparison easier. The measurement data were reformatted and processed by the Atmospheric Lidar Evaluation program (ALiE; Yin, 2023) after some basic configurations. The assessment report and figures can be generated automatically to assist the lidar performance evaluations. The program structure can be found in Fig. 2.
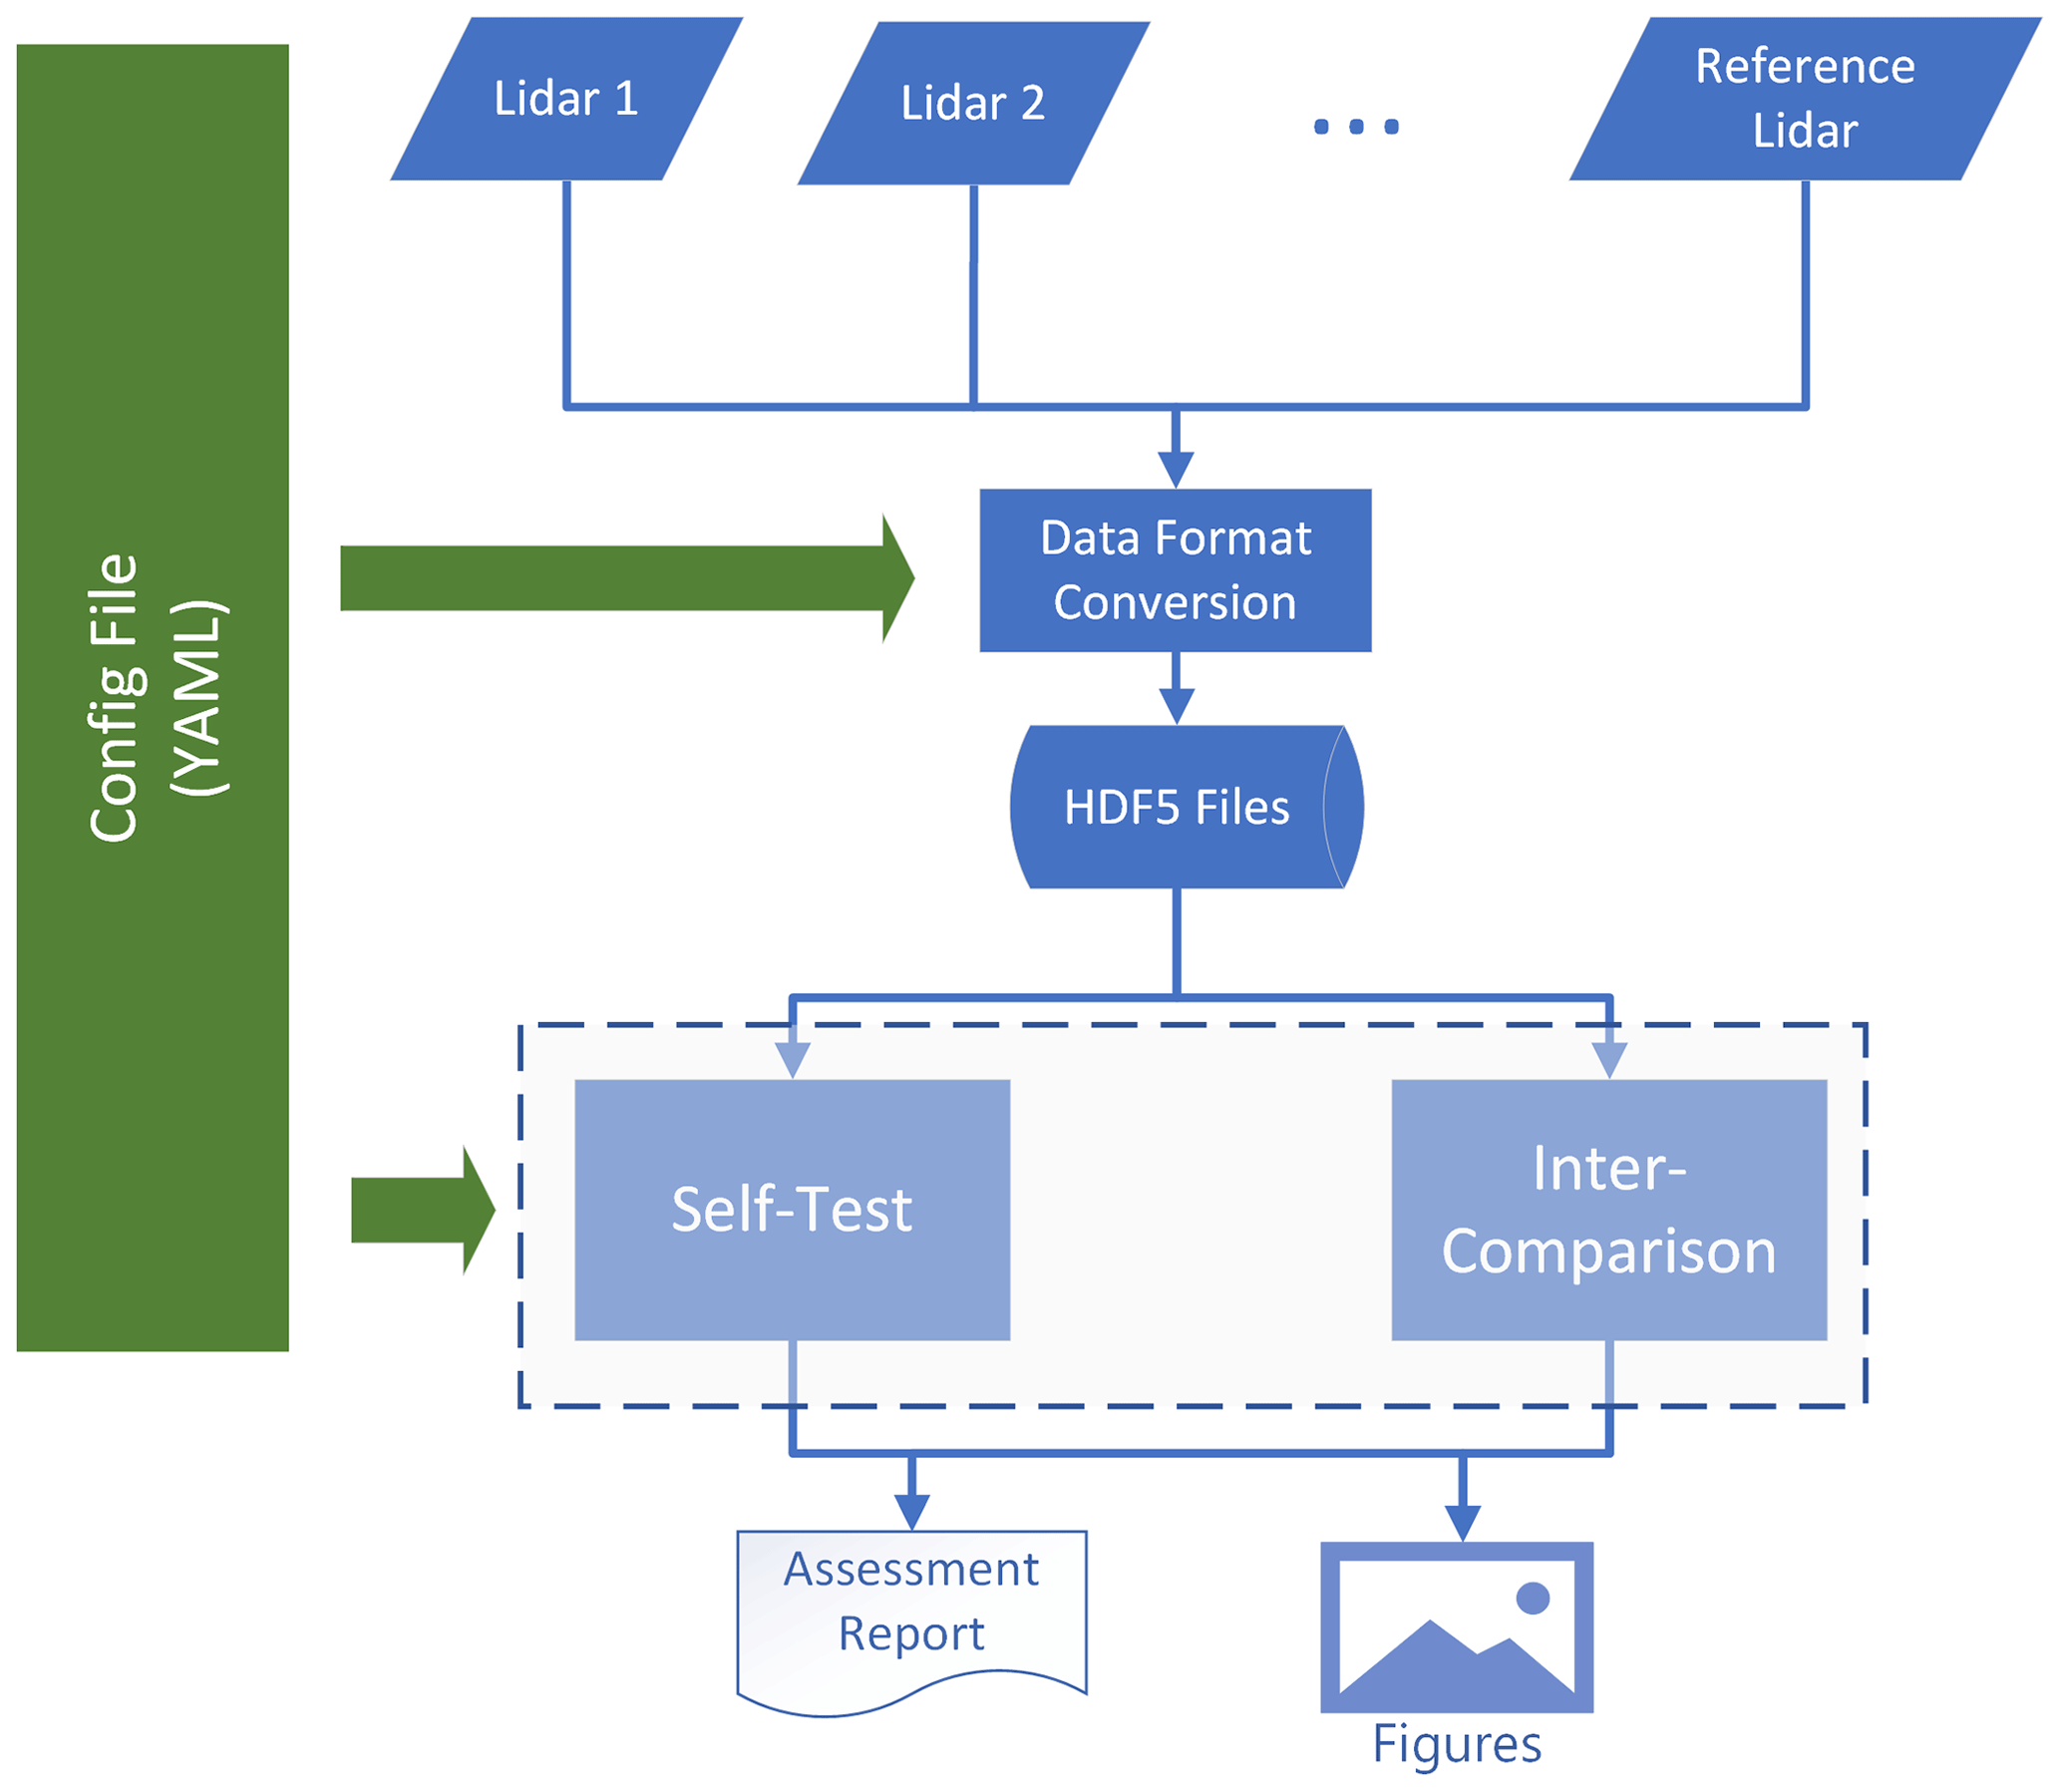
Figure 2Software structure of the Atmospheric Lidar Evaluation program for 1064 nm atmospheric lidar inter-comparison, in which “YAML” stands for a human-readable data-serialization language and is widely used for cross-platform software configurations. “HDF5” stands for Hierarchical Data Format, which is commonly used for atmospheric data storage.
All the measurement data were pre-processed before being used in self-tests and inter-comparisons. Within pre-processing, systematic effects were corrected, for instance, through dead-time and pre-trigger corrections. Every single system has been self-calibrated through Rayleigh fitting with the calculated molecular attenuated backscatter coefficient, using the standard atmospheric model according to Freudenthaler et al. (2018). In order to quickly evaluate the detectable ability of each system, its signal-to-noise ratio (SNR) was assessed to estimate the detectable range using the existing method (Morille et al., 2007). Before the inter-comparison of each lidar signals was carried out, all the range-corrected signals (RCSs) were normalized based on the signal obtained from the reference lidar system in order to avoid biases due to the difference in each lidar efficiencies or transmissions. Normalized range-corrected signal was obtained by fitting with the respective received powers from altitude zi Pnorm(λr,zi) at reference range zmin to zmax after the subtraction of solar background noise as
where λr is the wavelength of lidar signal, and i is the number of lidar systems. Because the comparison should be made between simultaneous observations, a period of no less than 30 min was selected during a continuous observation for at least 180 min, and the aerosol vertical distributions are also relatively stable during the selecting period. The range-corrected signal is obtained using the raw collection data after the cumulative average, background subtraction, and range correction. After obtaining the normalized range-corrected signal, the aerosol backscattering coefficient was calculated according to the algorithm from Fernald (1984). The selected reference height interval is 6000–6500 m, and the fixed lidar ratio of 50 sr is adopted. Using the range square correction or aerosol backscattering coefficient from reference lidar as the reference signal, the relative deviation of the profile from the other lidars is calculated according to Eq. (2):
where δ is the relative deviation between two lidar systems, Sref is the reference lidar signal, and St is the lidar signal and aerosol backscatter coefficient to be compared. Then, in order to assess the lidar performances within the dense aerosol loading and relatively aerosol-free region, their averaged relative deviation was calculated by integrating the profile signals within 0.5–2 km (dense aerosol loading) and 2–5 km (aerosol free) respectively:
where is the averaged relative deviation within 0.5–2 and 2–5 km, and n is the sampling points in the selected height intervals.
3.1 Self-test results
Each lidar signal at 1064 nm is performed using the Rayleigh fit test (Fig. 3). Because the effects caused by saturation of detectors can be found from lidar signal intensity, we decided to fit the molecular attenuated backscatter coefficient to the RCSs of each lidar system in this study. The normalization range was chosen to be from 6000 to 7000 m, which is in an aerosol-free region and still has a good signal-to-noise ratio. However, the no. L05 lidar adopted the normalization range between 12 000 to 13 000 m due to its signal distortion at the range from 3000 to 7000 m. The mean relative deviation of all Rayleigh fits within the normalization range was found to be less than 5 % (Table 2), which indicated the good agreements between all the lidar signals and the atmospheric molecular attenuated backscattering coefficient in the free atmosphere. As Fig. 3a–e show, all the lidar signals were found that can present the near real atmospheric molecular backscattering in an aerosol-free region, which is about from 3000 to 7000 m. However, the signal of the no. L05 lidar (Fig. 3f) was found to float up with the increased range above 3000 m; therefore the real atmospheric molecular backscattering can not be presented with this system. We assumed such a problem was caused by the electronic noise from the analog detector.
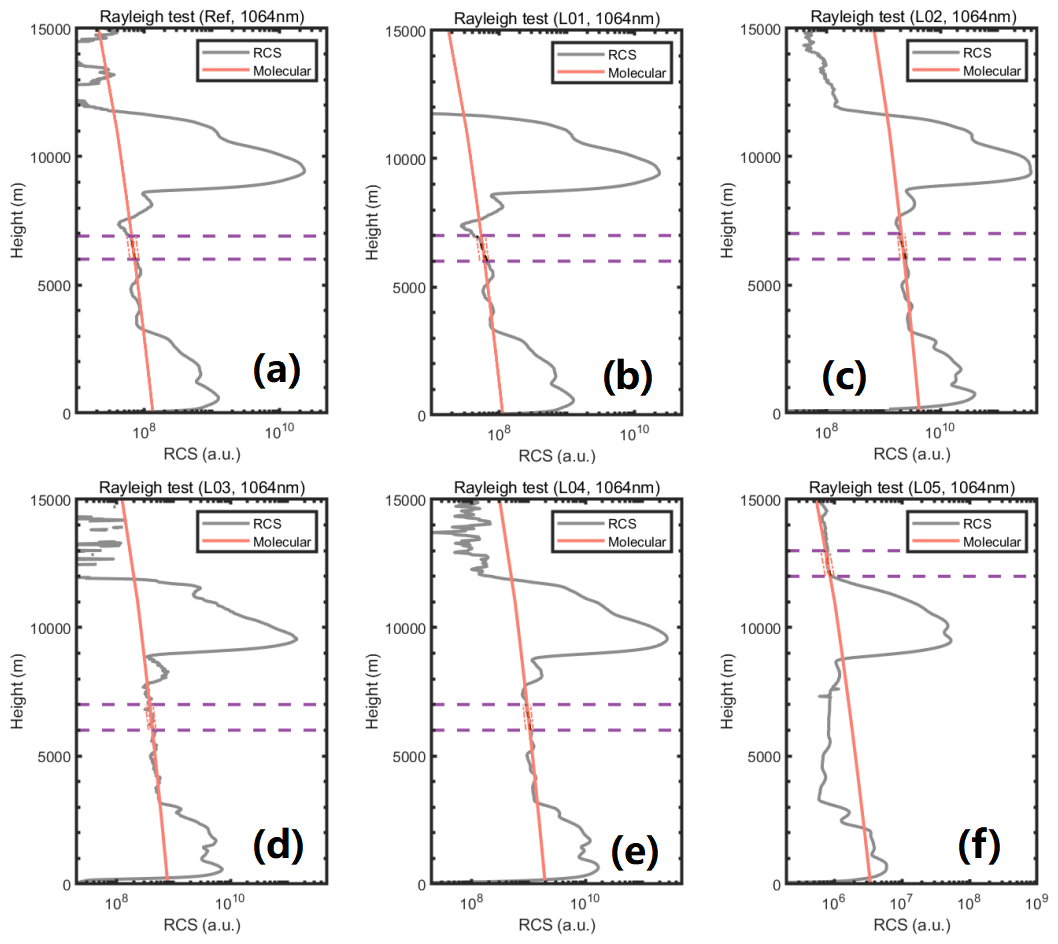
Figure 3Rayleigh fit (orange) to the normalized range-square-correction signals for the range-corrected signals (RCSs) of each lidar system at 1064 nm (grey) during 18:00 to 18:30 China standard time (CST) on 27 September 2021. Horizontal dashed light-blue lines indicate the selected aerosol-free region. (a) RCSs from the reference lidar system, (b) RCSs from the no. L01 lidar system, (c) RCSs from the no. L02 lidar system, (d) RCSs from the no. L03 lidar system, (e) RCSs from the no. L04 lidar system, and (f) RCSs from the no. L05 lidar system.
Table 2The mean relative deviation (MRD) of Rayleigh fit for each lidar system is indicated for each selected normalization range (1000 m range interval).
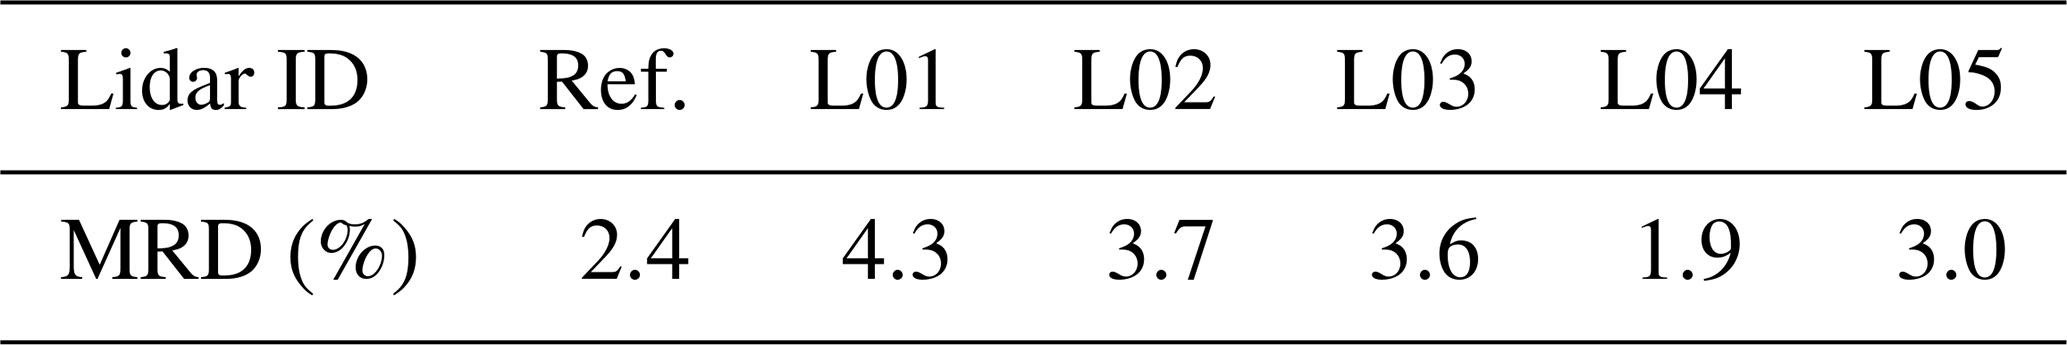
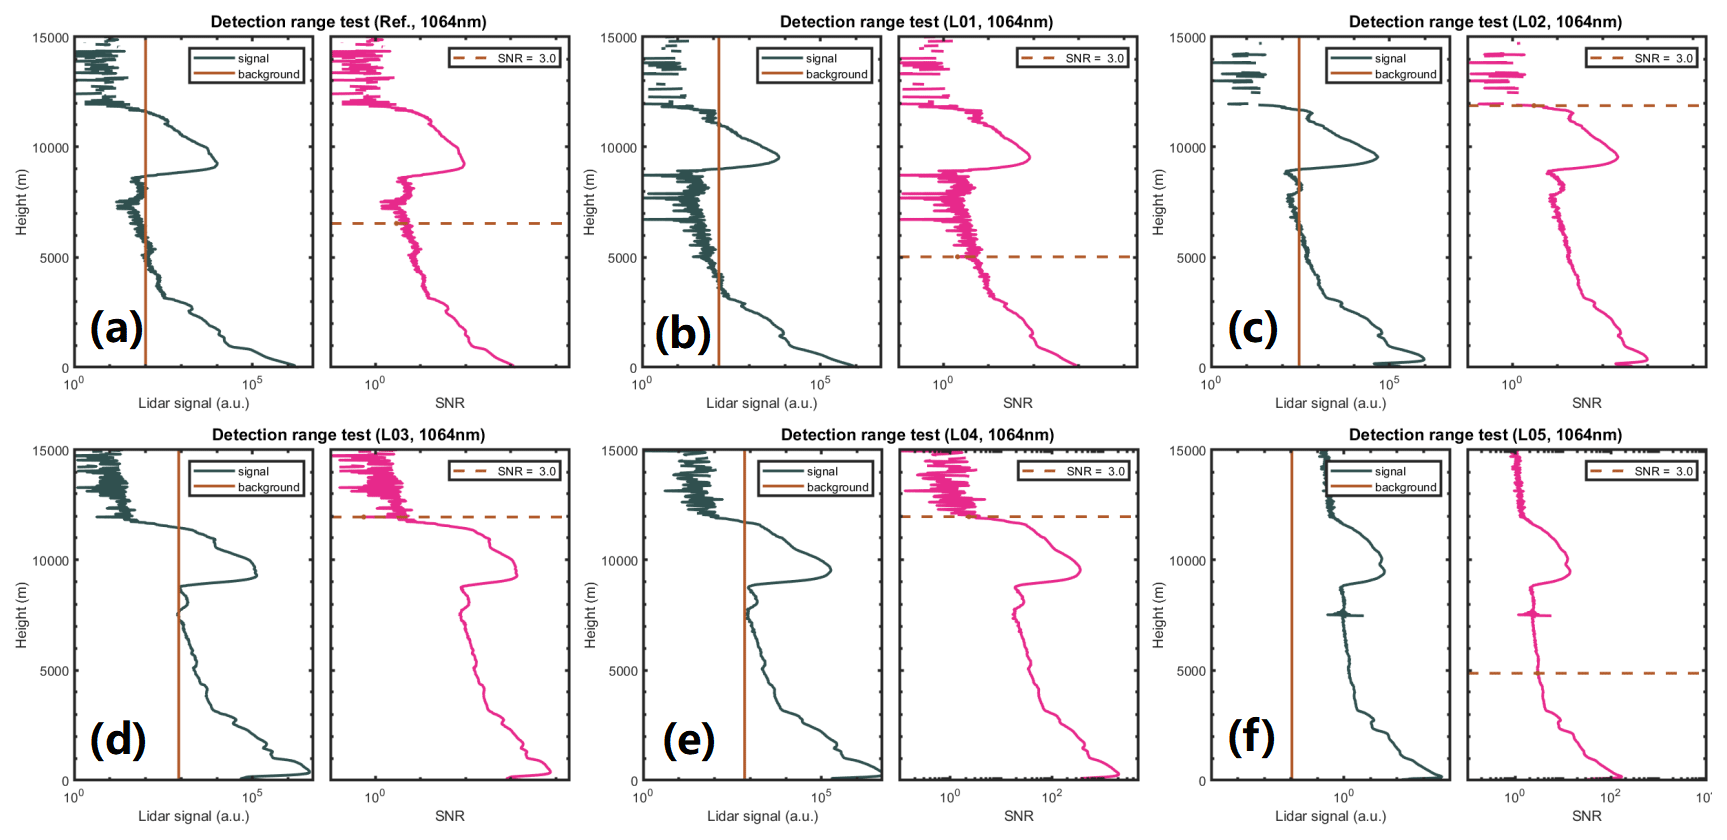
Figure 4The detection range test results of raw signals at 1064 nm from each lidar system during the same period as the Rayleigh fit (Fig. 3). The black curves represent the signals with its background. The vertical orange lines indicate the value of the background from each lidar systems. The pink curves represent the signals with its signal-to-noise ratio (SNR = 3) region. The horizontal dashed orange lines indicate where the SNR is equal to 3. (a) Lidar signal from the reference lidar system, (b) lidar signal from the no. L01 lidar system, (c) lidar signal from the no. L02 lidar system, (d) lidar signal from the no. L03 lidar system, (e) lidar signal from the no. L04 lidar system, (f) lidar signal from the no. L05 lidar system. All lidar signals were corrected by dead time and bin shifts.
The SNR was analyzed as well in order to check the detectable range of each lidar system. In this test, lidar profiles were averaged in 30 min time intervals. The background noise was calculated by the last 50 range bins of signal, and the SNR was calculated according to the method described by (Morille et al., 2007). We defined the lidar signals as valid when the value of SNR is larger than 3. The maximum detectable range of the lidar systems was found to be over 7000 m (Fig. 4a–e) except for lidar no. L05, which was affected by the problem with noise over 5 km (Fig. 4f). The assumption can also be confirmed that lidar no. L05 has a problem with the noise.
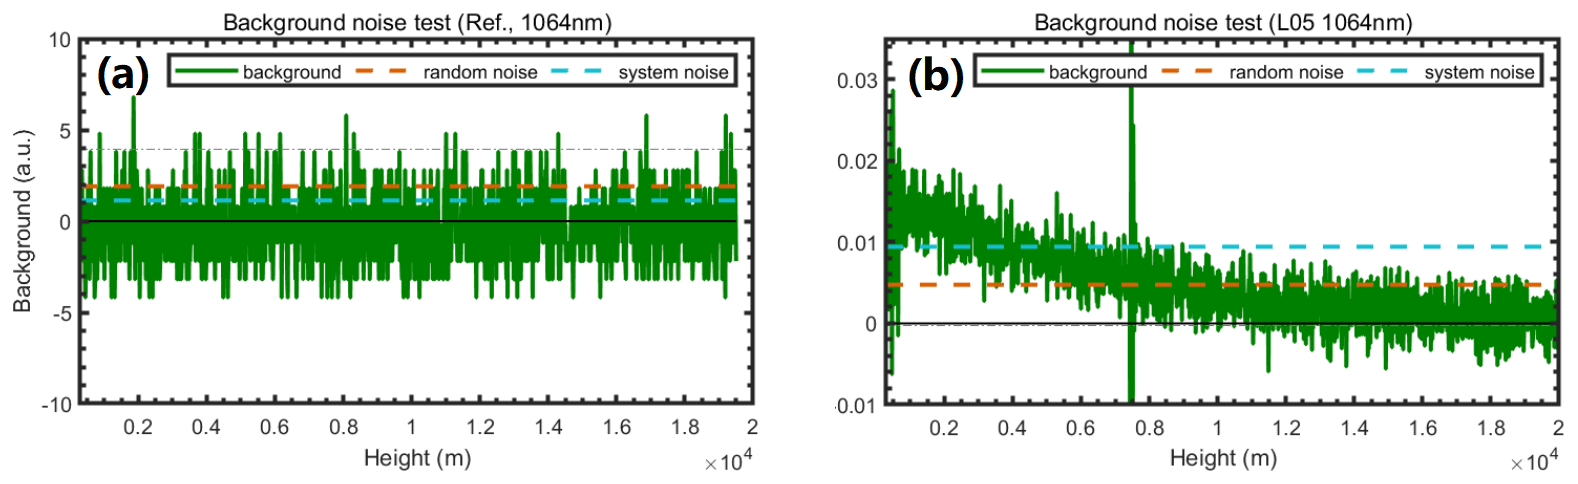
Figure 5The background noise test results of the photon-counting SPAD and analog APD detectors. The green lines indicate the background noise directly collected by lidar system. The dashed orange lines indicate random noise. The dashed sky-blue lines indicate system noise. The horizontal black lines indicate the value of zero. (a) The test result from the reference lidar and (b) the test result from lidar no. L05.
The self-test of the Rayleigh test and the detectable range test are able to evaluate the lidar system performances on long-range detection; however, the quantitative accuracy of aerosol loading and cloud bases still relies on the inter-comparison. The near-infrared channel of aerosol lidar usually suffers from the low sensitivity or high electronic noise of the analog detectors, therefore causing severe distortion of atmospheric observation, particularly in the aerosol-free region (Sicard et al., 2009), as shown by the example in Fig. 3f. In this inter-comparison campaign, five of six lidar system employed the photon-counting mode using the SPADs. In such cases, we expected the interference of electronic noise in the signals can be solved. In order to verify our assumption, the dark measurements were performed for both detectors in photon-counting SPAD mode and analog APD mode (Fig. 5). The reference lidar system was selected as an example of SPAD performance to compare with the APD performance. The random noise is determined by the mean standard deviation of background noise, and the system noise is determined by the mean standard deviation of random noise of all the ranges. The background noise from SPAD detection showed random distribution around zero with the range (Fig. 5a), and the random noise is smaller than system noise, which means the signals have fewer effects by the noise caused by the detectors. Conversely, the background noise from APD detection showed not only a decreasing structure with an increasing range above zero (Fig. 5b) but also that the system noise caused by strange structures with a range is twice as big as random noise caused by the sampling time, in addition to the sharp peak noise that existed around 7500 m. Therefore the big distortion could not be ignored directly to eliminate the background noise using the tail of the raw signals (Freudenthaler et al., 2018).
3.2 Inter-comparison results
The data were collected continuously over at least 3 h so that it was possible to select a 30 min period with calm weather and stable aerosol distribution conditions. Figure 6 showed each lidar signal performance on aerosol loading distributions on 27 September 2021 between 15:00 and 23:00 China standard time (CST). As a quick look, good consistencies were found between all the lidar measurements, such as almost the same height of cirrus cloud bottoms (above 8000 m) and tops (around 11 000–12 000 m) as well as the aerosol distributed under about 3000 m. Therefore, the results indicated that the signals from each lidar system are comparable qualitatively, and they are also able to observe the vertical distributions of aerosol and cloud relatively well during the temporal and space evolution.
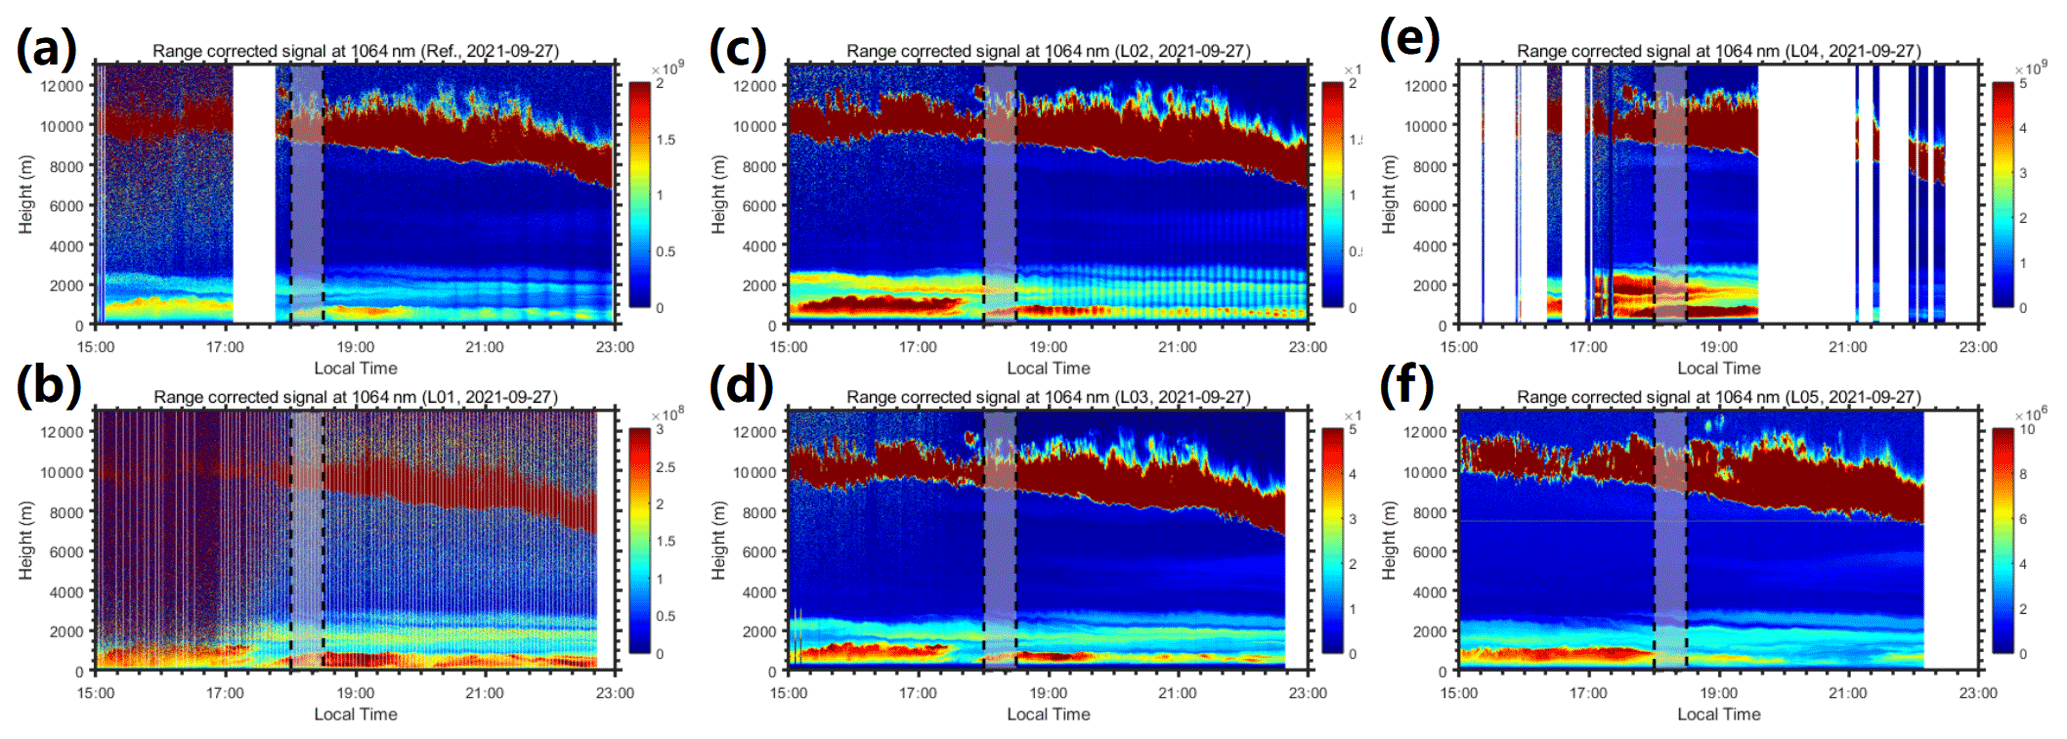
Figure 6Quick looks of aerosol loading observation from different lidar measurements on 27 September 2021 between 15:00 and 23:00 CST. The grey rectangle shadows indicate the selected periods for single profile inter-comparison between 18:30 and 19:00 CST. The RCSs at 1064 nm were taken from (a) the reference lidar system, (b) the L01 lidar system, (c) the L02 lidar system (the ripples were caused by unstable laser energy due to the rapid temperature change), (d) the L03 lidar system, (e) the L04 lidar system (the multiple interruptions were caused by the operation issue during the measurement), and (f) the L05 lidar system. All data were sampled at 1 min temporal resolution and 15 m range resolution.
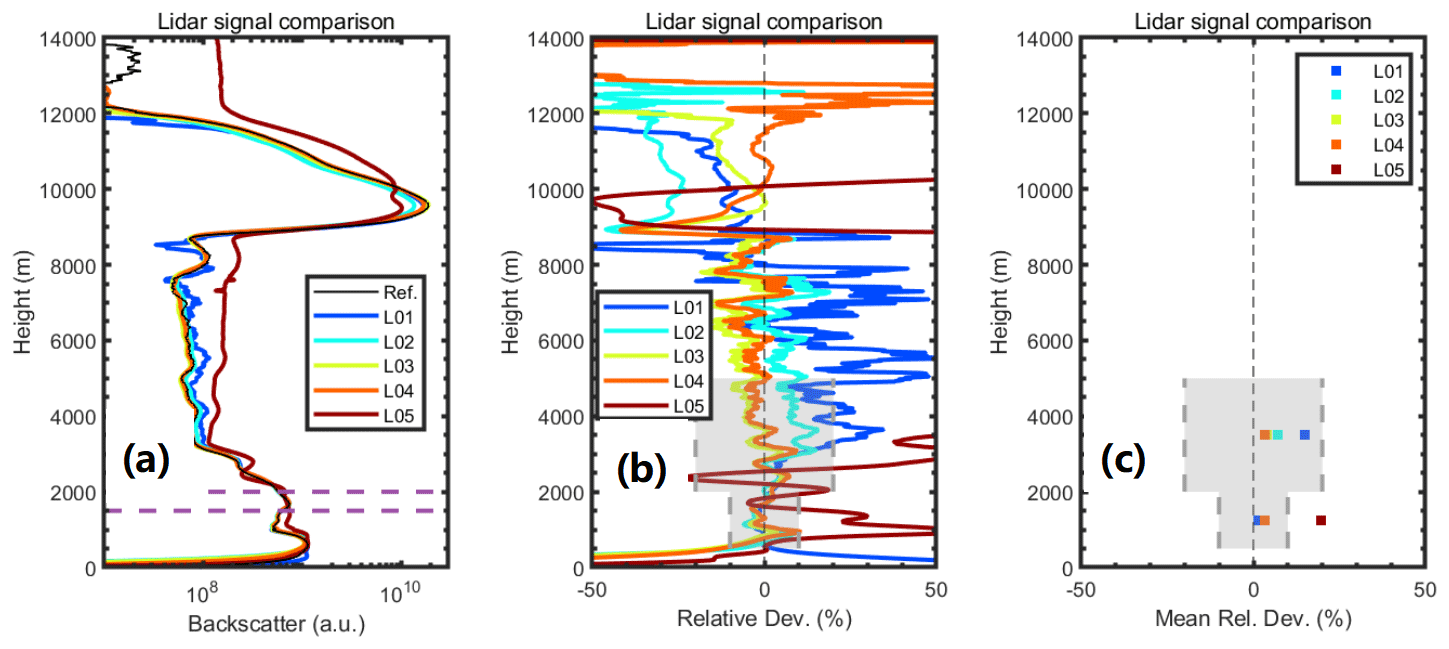
Figure 7The inter-comparison results for RCSs from all the lidar systems in the period of 18:30–19:00 CST on 27 September 2021. The horizontal dashed lines indicate the adopted normalization window for each RCSs. The vertical dashed lines in the middle indicate zero relative deviation. The rectangle shadows indicate 10 % of relative deviation within 500–2000 m and 20 % of relative deviation within 2000–5000 m. (a) Normalized RCS profiles, (b) the profiles of relative deviations of lidar no. L01–L05 with the reference, and (c) the mean relative deviations of lidar no. L01–L05 with the reference.
In order to quantitatively analyze the inter-comparison results, the normalized RCSs were inter-compared, and the differences of each lidar system were presented. Due to the different overlap ranges in the near range and multiple scattering properties in the clouds, the inter-comparison of RCSs was mainly investigated in the region of 500–2000 m (the main aerosol layer) and 2000–5000 m (the clear atmosphere expected). Lidar observations between 18:30 and 19:00 CST from each lidar system were averaged for inter-comparison. The window range from 1500 to 2000 m was adopted to normalize all the RCSs because the aerosol loading is relatively stable, and it also has less effect on the lidar system in such a range. As Fig. 7a shows, good consistencies were found between all the RCSs for the detection of cirrus cloud base about 8000 m and aerosol loading below 3000 m. As the results are shown in the Rayleigh test, all the lidar systems performed with a reliable detection ability in the relatively clean atmospheric region between about 3000 and 8000 m, except for lidar no. L05. Due to the significant differences in the incomplete overlap region between different lidar systems, large relative deviations were observed within the 500 m range (Fig. 7b). As a result, a meaningful comparison can not be made. While the relative deviations between lidar no. L01-L04 and the reference lidar were under 50 % from the range 500 to 12 000 m, the relative deviations were found less than 20 % in the range from 500 up to 12 000 m and less than 5 % in the range from 500 up to 5000 m between lidar no. L02–L04 and the reference lidar. The overestimation of no. L01 was found to be about 20 %–40 % above 3000 m, and the underestimation of no. L01 was found to be about 40 % in the cirrus, which is probably due to its poor SNR in the higher range or multiple scattering effects by the cloud layer. Lidar no. L05 had a larger overestimation (over 50 %) with the reference lidar as well as the others in the aerosol-free region but underestimate the aerosol loading and cirrus about 20 %–50 %. In order to avoid the effect by the spatial variance, the mean relative deviations were also presented (Fig. 7c). The mean relative deviations within 500–2000 and 2000–5000 m were found to be less than 5 % and 10 % respectively, except for lidar no. L05.
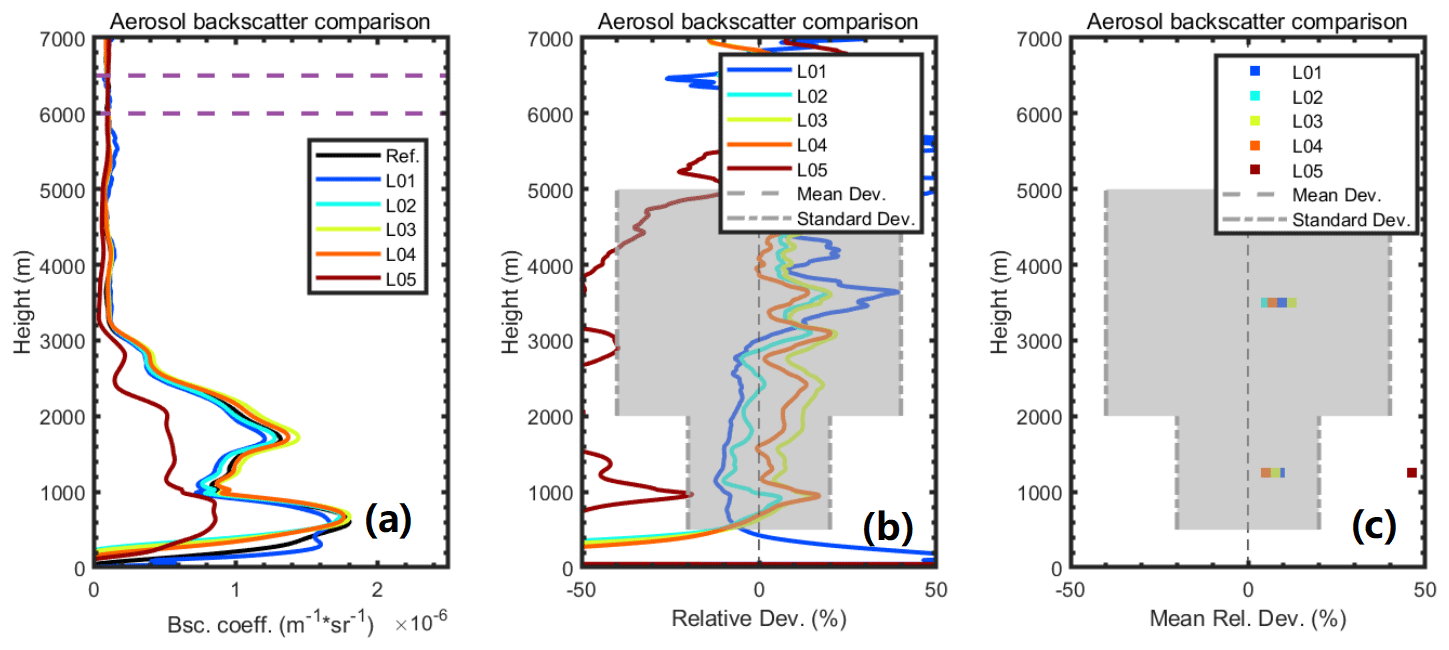
Figure 8The inter-comparison results for aerosol backscatter coefficient at 1064 nm from all the lidar systems in the same periods with Fig. 7. The horizontal dashed lines indicate the referred aerosol-free window used for the retrieval algorithm. The vertical dashed lines in the middle indicate zero of relative deviation. The rectangle shadows indicate 10 % of relative deviation within 500–2000 m and 20 % of relative deviation within 2000–5000 m. (a) The aerosol backscatter coefficient profiles at 1064 nm, (b) the profiles of relative deviations of the aerosol backscatter coefficient profiles from lidar no. L01–L05 with its from reference, (c) the mean relative deviations of the aerosol backscatter coefficient profiles from lidar no. L01–L05 with its from reference.
In order to find the results of uncertainties propagated from the RCSs to the aerosol optical products, the Fernald algorithm for all the RCSs was used with the same assumed fixed lidar ratio of 50 sr, and the same reference height of the aerosol-free region (6–6.5 km) was also selected for aerosol backscatter coefficient retrieval. The RCSs were taken the same as in Fig. 7, but the range resolution of all RCSs was resampled to be 100 m. The aerosol backscatter coefficient profiles at 1064 nm are shown in Fig. 8a under 7000 m, and the relative deviation profiles of no. L01–L05 with the reference lidar were analyzed as shown in Fig. 8b. The relative deviations of aerosol backscatter coefficient at 1064 nm from lidar no. L01–L04 with the reference lidar were within 10 % from the range 500 to 5000 m in general, while large relative deviations (about −50 %) were found between lidar no. L05 and the reference lidar in the range from 500 up to 5000 m. It can also be seen that maximum mean relative deviation both in the height range of 500–2000 m and in the height range of 2000–5000 m was less than 10 % in Fig. 8c. Compared with the relative deviations of RCSs, there is no evident increase in relative deviations after the aerosol backscatter coefficient retrieved by taking the same algorithm from the no. L01–L04 lidar systems, but larger relative deviations were found between the lidar's RCS and aerosol backscatter coefficient from the no. L05 lidar. Therefore, it may indicate that the relative deviations can be amplified if the lidar signal is distorted.
In September 2021, the Mie–Rayleigh scattering channel at 1064 nm of six aerosol lidars participated in MEMO lidar inter-comparison campaign to be evaluated and calibrated at the Beijing Southern Suburb Observatory. A reference lidar at 1064 nm is used to construct a signal as an absolute reference for this inter-comparison, and the unified algorithm was also adopted to process the raw lidar signals. Although self-tests, such as the Rayleigh fit test and SNR evaluation, can be used as a fast signal check in the far range, direct lidar inter-comparison at 1064 nm is still very necessary and an efficient way to quantitatively assess the lidar performances in regions of densely distributed aerosol. In this campaign, a good agreement of RCSs and backscatter coefficients at 1064 nm was obtained with the defined references using the photon-counting detection mode of the SPADs, except the relative deviation of no. L05 lidar, with the analog detection mode of the APD, that was still higher. The profiles of relative deviation of lidar signals are less than 5 % within 500–2000 m and 10 % within 2000–5000 m, except no. L01, which was higher, probably due to the misalignment. The mean relative deviation of lidar signals within 500–2000 and 2000–5000 m is a little lower than the profiles of relative deviation. The profiles of relative deviation of aerosol products (backscatter coefficient) are slightly higher than those of lidar signals within 500–2000 and 2000–5000 m using the unified algorithm, and similar performances were found in the mean relative deviation of aerosol products within 500–2000 and 2000–5000 m. However, the relative deviation of aerosol products can also be amplified from the lidar signals if it is large enough, such as the performance of no. L05. In general, the relative deviations of the above were found within the maximum boundary of permissibility proposed by EARLINET; thus confidence is gained in the reliability of the signals provided by each lidar system in the channels at 1064 nm for a future lidar network in China. As this is the first report on lidar inter-comparison at 1064 nm in China, the inter-comparison of the polarization channel at 532 nm, the Raman channel at 386 and 607 nm for aerosol extinction coefficients, and the Mie–Rayleigh channel at 355 nm will be explored further.
The Atmospheric Lidar Intercomparison Evaluator software, developed by Zhenping Yin, is available at https://doi.org/10.5281/zenodo.8381875 (Yin, 2023).
The data are available from the corresponding author on reasonable request.
All the authors made contributions to this research work and paper. In particular, LW, ZY, and XW designed the whole strategy of this work. LW organized the observation campaign, analyzed the data, acquired the research funding, and wrote the manuscript draft. ZY, SM, YY, and XW analyzed the data, participated in the scientific discussions, and reviewed and proofread the manuscript. AW and ZB participated in the observations and data collections. DM, YC, and XW reviewed and proofread the manuscript. XW and YC acquired the research funding and led the study. All authors have read and agreed to the published version of the paper.
The contact author has declared that none of the authors has any competing interests. At the time of the research, the manufacturers of the lidar instruments, which provided data in the study, had no role in the design of the study, analyses, interpretation of data, writing of the manuscript, or decision to publish the results.
Publisher’s note: Copernicus Publications remains neutral with regard to jurisdictional claims in published maps and institutional affiliations.
We are grateful to Darsun Laser Technology Co. Ltd.; the China Aerospace Science and Technology Corporation; and the Institute of Oceanographic Instrumentation, Shandong Academy of Science, who were the manufacturers of the lidar instruments, for providing data for this study.
This research has been supported by the National Natural Science Foundation of China (grant nos. 62105248 and 42205130).
This paper was edited by Daniel Perez-Ramirez and reviewed by two anonymous referees.
Baars, H., Kanitz, T., Engelmann, R., Althausen, D., Heese, B., Komppula, M., Preißler, J., Tesche, M., Ansmann, A., Wandinger, U., Lim, J.-H., Ahn, J. Y., Stachlewska, I. S., Amiridis, V., Marinou, E., Seifert, P., Hofer, J., Skupin, A., Schneider, F., Bohlmann, S., Foth, A., Bley, S., Pfüller, A., Giannakaki, E., Lihavainen, H., Viisanen, Y., Hooda, R. K., Pereira, S. N., Bortoli, D., Wagner, F., Mattis, I., Janicka, L., Markowicz, K. M., Achtert, P., Artaxo, P., Pauliquevis, T., Souza, R. A. F., Sharma, V. P., van Zyl, P. G., Beukes, J. P., Sun, J., Rohwer, E. G., Deng, R., Mamouri, R.-E., and Zamorano, F.: An overview of the first decade of PollyNET: an emerging network of automated Raman-polarization lidars for continuous aerosol profiling, Atmos. Chem. Phys., 16, 5111–5137, https://doi.org/10.5194/acp-16-5111-2016, 2016. a
Böckmann, C., Wandinger, U., Ansmann, A., Bösenberg, J., Amiridis, V., Boselli, A., Delaval, A., De Tomasi, F., Frioud, M., Grigorov, I. V., and Hågård, A.: Aerosol lidar intercomparison in the framework of the EARLINET project. 2. Aerosol backscatter algorithms, Appl. Optics, 43, 977–989, 2004. a, b
Campbell, J. R., Hlavka, D. L., Welton, E. J., Flynn, C. J., Turner, D. D., Spinhirne, J. D., Scott III, V. S., and Hwang, I.: Full-time, eye-safe cloud and aerosol lidar observation at atmospheric radiation measurement program sites: Instruments and data processing, J. Atmos. Ocean. Tech., 19, 431–442, 2002. a, b
Chen, Y., Li, F., Shao, N., Wang, X., Wang, Y., Hu, X., and Wang, X.: Aerosol Lidar Intercomparison in the Framework of the MEMO Project. 1. Lidar Self Calibration and 1 st Comparison Observation Calibration Based on Statistical Analysis Method, in: 2019 International Conference on Meteorology Observations (ICMO), 28–31 December 2019, Chengdu, China, IEEE, 1–5, https://doi.org/10.1109/ICMO49322.2019, 2019. a, b, c
Córdoba-Jabonero, C., Ansmann, A., Jiménez, C., Baars, H., López-Cayuela, M.-Á., and Engelmann, R.: Experimental assessment of a micro-pulse lidar system in comparison with reference lidar measurements for aerosol optical properties retrieval, Atmos. Meas. Tech., 14, 5225–5239, https://doi.org/10.5194/amt-14-5225-2021, 2021. a
D'Amico, G., Amodeo, A., Baars, H., Binietoglou, I., Freudenthaler, V., Mattis, I., Wandinger, U., and Pappalardo, G.: EARLINET Single Calculus Chain – overview on methodology and strategy, Atmos. Meas. Tech., 8, 4891–4916, https://doi.org/10.5194/amt-8-4891-2015, 2015. a, b, c, d
Engelmann, R., Ansmann, A., Ohneiser, K., Griesche, H., Radenz, M., Hofer, J., Althausen, D., Dahlke, S., Maturilli, M., Veselovskii, I., Jimenez, C., Wiesen, R., Baars, H., Bühl, J., Gebauer, H., Haarig, M., Seifert, P., Wandinger, U., and Macke, A.: Wildfire smoke, Arctic haze, and aerosol effects on mixed-phase and cirrus clouds over the North Pole region during MOSAiC: an introduction, Atmos. Chem. Phys., 21, 13397–13423, https://doi.org/10.5194/acp-21-13397-2021, 2021. a
Fernald, F. G.: Analysis of atmospheric lidar observations – Some comments, Appl. Optics, 23, 652–653, 1984. a
Ferrare, R., Melfi, S., Whiteman, D., Evans, K., Schmidlin, F., and Starr, D. O.: A comparison of water vapor measurements made by Raman lidar and radiosondes, J. Atmos. Ocean. Tech., 12, 1177–1195, 1995. a
Freudenthaler, V., Gross, S., Engelmann, R., Mattis, I., Wandinger, U., Pappalardo, G., Amodeo, A., Giunta, A., D'Amico, G., Chaikovsky, A., and Osipenko, F.: EARLI09 – direct intercomparison of eleven EARLINET lidar systems, in: Proceedings of the 25th International Laser Radar Conference, 5–9 July 2010, St. Petersburg, Russia, International Coordination Group on Laser Atmospheric Studies (ICLAS), 5–9, ISBN 9781617826146, 2010. a, b
Freudenthaler, V., Linné, H., Chaikovski, A., Rabus, D., and Groß, S.: EARLINET lidar quality assurance tools, Atmos. Meas. Tech. Discuss. [preprint], https://doi.org/10.5194/amt-2017-395, in review, 2018. a, b, c, d, e
Grabbe, G., Bösenberg, J., Dier, H., Görsdorf, U., Matthias, V., Peters, G., Schaberl, T., and Senff, C.: Intercomparison of ozone measurements between lidar and ECC-sondes, Contributions to atmospheric physics, Gebruder Borntraeger Verlagsbuchhandlung, p. 69, ISSN 00058173, 1996. a
Groß, S., Tesche, M., Freudenthaler, V., Toledano, C., Wiegner, M., Ansmann, A., Althausen, D., and Seefeldner, M.: Characterization of Saharan dust, marine aerosols and mixtures of biomass-burning aerosols and dust by means of multi-wavelength depolarization and Raman lidar measurements during SAMUM 2, Tellus B, 63, 706–724, 2011. a
Haarig, M., Engelmann, R., Ansmann, A., Veselovskii, I., Whiteman, D. N., and Althausen, D.: 1064 nm rotational Raman lidar for particle extinction and lidar-ratio profiling: cirrus case study, Atmos. Meas. Tech., 9, 4269–4278, https://doi.org/10.5194/amt-9-4269-2016, 2016. a
Haarig, M., Ansmann, A., Baars, H., Jimenez, C., Veselovskii, I., Engelmann, R., and Althausen, D.: Depolarization and lidar ratios at 355, 532, and 1064 nm and microphysical properties of aged tropospheric and stratospheric Canadian wildfire smoke, Atmos. Chem. Phys., 18, 11847–11861, https://doi.org/10.5194/acp-18-11847-2018, 2018. a
Haarig, M., Ansmann, A., Engelmann, R., Baars, H., Toledano, C., Torres, B., Althausen, D., Radenz, M., and Wandinger, U.: First triple-wavelength lidar observations of depolarization and extinction-to-backscatter ratios of Saharan dust, Atmos. Chem. Phys., 22, 355–369, https://doi.org/10.5194/acp-22-355-2022, 2022. a
Hauchecorne, A., Chanin, M. L., Keckhut, P., and Nedeljkovic, D.: Lidar monitoring of the temperature in the middle and lower atmosphere, Appl. Phys. B-Lasers O., 55, 29–34, 1992. a
He, Y., Yi, F., Liu, F., Yin, Z., Yi, Y., Zhou, J., Yu, C., and Zhang, Y.: Natural Seeder-Feeder Process Originating From Mixed-Phase Clouds Observed With Polarization Lidar and Radiosonde at a Mid-Latitude Plain Site, J. Geophys. Res.-Atmos., 127, e2021JD036094, https://doi.org/10.1029/2021JD036094, 2022. a
Holben, B. N., Eck, T. F., Slutsker, I. A., Tanré, D., Buis, J. P., Setzer, A., Vermote, E., Reagan, J. A., Kaufman, Y. J., Nakajima, T., and Lavenu, F.: AERONET – A federated instrument network and data archive for aerosol characterization, Remote Sens. Environ., 66, 1–16, 1998. a
Huang, Z., Bi, J., and Huang, J.: Lidar Network over the Belt and Road, in: AGU Fall Meeting Abstracts, 9–13 December 2019, San Francisco, USA, AGU, vol. 2019, A51M–2718, https://www.agu.org/fall-meeting-2019 (last access: 1 August 2023), 2019. a
Li, S., Di, H., Wang, Q., Han, G., Hua, D., and Li, Y.: Retrieval of the aerosol extinction coefficient of 1064 nm based on high-spectral-resolution lidar, J. Quant. Spectrosc. Ra., 256, 107298, https://doi.org/10.1016/j.jqsrt.2020.107298, 2020. a
Liang, L.-Y., Liang, J.-S., Yao, Q., Zheng, M.-Y., Xie, X.-P., Liu, H., Zhang, Q., and Pan, J.-W.: Compact all-fiber polarization-independent up-conversion single-photon detector, Opt. Commun., 441, 185–189, 2019. a
Liu, F., Yi, F., He, Y., Yin, Z., Zhang, Y., and Yu, C.: Spectrally Resolved Raman Lidar to Measure Backscatter Spectra of Atmospheric Three-Phase Water and Fluorescent Aerosols Simultaneously: Instrument, Methodology, and Preliminary Results, IEEE T. Geosci. Remote, 60, 1–13, 2022. a
Lolli, S., Madonna, F., Rosoldi, M., Campbell, J. R., Welton, E. J., Lewis, J. R., Gu, Y., and Pappalardo, G.: Impact of varying lidar measurement and data processing techniques in evaluating cirrus cloud and aerosol direct radiative effects, Atmos. Meas. Tech., 11, 1639–1651, https://doi.org/10.5194/amt-11-1639-2018, 2018. a
Lolli, S., Vivone, G., Lewis, J. R., Sicard, M., Welton, E. J., Campbell, J. R., Comerón, A., D'Adderio, L. P., Tokay, A., Giunta, A., and Pappalardo, G.: Overview of the new version 3 NASA Micro-Pulse Lidar Network (MPLNET) automatic precipitation detection algorithm, Remote Sens., 12, 71, https://doi.org/10.3390/rs12010071, 2019. a, b
Lv, L., Xiang, Y., Zhang, T., Chai, W., and Liu, W.: Comprehensive study of regional haze in the North China Plain with synergistic measurement from multiple mobile vehicle-based lidars and a lidar network, Sci. Total Environ., 721, 137773, https://doi.org/10.1016/j.scitotenv.2020.137773, 2020. a
Mamouri, R.-E. and Ansmann, A.: Potential of polarization/Raman lidar to separate fine dust, coarse dust, maritime, and anthropogenic aerosol profiles, Atmos. Meas. Tech., 10, 3403–3427, https://doi.org/10.5194/amt-10-3403-2017, 2017. a
Matthais, V., Freudenthaler, V., Amodeo, A., Balin, I., Balis, D., Bösenberg, J., Chaikovsky, A., Chourdakis, G., Comeron, A., Delaval, A., and De Tomasi, F.: Aerosol lidar intercomparison in the framework of the EARLINET project. 1. Instruments, Appl. Optics, 43, 961–976, 2004. a, b
McDermid, I. S., Godin, S. M., and Walsh, T. D.: Lidar measurements of stratospheric ozone and intercomparisons and validation, Appl. Optics, 29, 4914–4923, 1990. a
Mona, L., Amodeo, A., D'Amico, G., Giunta, A., Madonna, F., and Pappalardo, G.: Multi-wavelength Raman lidar observations of the Eyjafjallajökull volcanic cloud over Potenza, southern Italy, Atmos. Chem. Phys., 12, 2229–2244, https://doi.org/10.5194/acp-12-2229-2012, 2012. a
Morille, Y., Haeffelin, M., Drobinski, P., and Pelon, J.: STRAT: An automated algorithm to retrieve the vertical structure of the atmosphere from single-channel lidar data, J. Atmos. Ocean. Tech., 24, 761–775, 2007. a, b
Müller, D., Ansmann, A., Mattis, I., Tesche, M., Wandinger, U., Althausen, D., and Pisani, G.: Aerosol-type-dependent lidar ratios observed with Raman lidar, J. Geophys. Res.-Atmos., 112, D16202, https://doi.org/10.1029/2006JD008292, 2007. a
Papagiannopoulos, N., Mona, L., Alados-Arboledas, L., Amiridis, V., Baars, H., Binietoglou, I., Bortoli, D., D'Amico, G., Giunta, A., Guerrero-Rascado, J. L., Schwarz, A., Pereira, S., Spinelli, N., Wandinger, U., Wang, X., and Pappalardo, G.: CALIPSO climatological products: evaluation and suggestions from EARLINET, Atmos. Chem. Phys., 16, 2341–2357, https://doi.org/10.5194/acp-16-2341-2016, 2016. a, b
Papayannis, A., Mamouri, R. E., Amiridis, V., Kazadzis, S., Pérez, C., Tsaknakis, G., Kokkalis, P., and Baldasano, J. M.: Systematic lidar observations of Saharan dust layers over Athens, Greece in the frame of EARLINET project (2004–2006), Ann. Geophys., 27, 3611–3620, https://doi.org/10.5194/angeo-27-3611-2009, 2009. a
Pappalardo, G., Amodeo, A., Apituley, A., Comeron, A., Freudenthaler, V., Linné, H., Ansmann, A., Bösenberg, J., D'Amico, G., Mattis, I., Mona, L., Wandinger, U., Amiridis, V., Alados-Arboledas, L., Nicolae, D., and Wiegner, M.: EARLINET: towards an advanced sustainable European aerosol lidar network, Atmos. Meas. Tech., 7, 2389–2409, https://doi.org/10.5194/amt-7-2389-2014, 2014. a, b
Pauly, R. M., Yorks, J. E., Hlavka, D. L., McGill, M. J., Amiridis, V., Palm, S. P., Rodier, S. D., Vaughan, M. A., Selmer, P. A., Kupchock, A. W., Baars, H., and Gialitaki, A.: Cloud-Aerosol Transport System (CATS) 1064 nm calibration and validation, Atmos. Meas. Tech., 12, 6241–6258, https://doi.org/10.5194/amt-12-6241-2019, 2019. a, b
Proestakis, E., Amiridis, V., Marinou, E., Binietoglou, I., Ansmann, A., Wandinger, U., Hofer, J., Yorks, J., Nowottnick, E., Makhmudov, A., Papayannis, A., Pietruczuk, A., Gialitaki, A., Apituley, A., Szkop, A., Muñoz Porcar, C., Bortoli, D., Dionisi, D., Althausen, D., Mamali, D., Balis, D., Nicolae, D., Tetoni, E., Liberti, G. L., Baars, H., Mattis, I., Stachlewska, I. S., Voudouri, K. A., Mona, L., Mylonaki, M., Perrone, M. R., Costa, M. J., Sicard, M., Papagiannopoulos, N., Siomos, N., Burlizzi, P., Pauly, R., Engelmann, R., Abdullaev, S., and Pappalardo, G.: EARLINET evaluation of the CATS Level 2 aerosol backscatter coefficient product, Atmos. Chem. Phys., 19, 11743–11764, https://doi.org/10.5194/acp-19-11743-2019, 2019. a, b
Qin, K., Wu, L., Wong, M. S., Letu, H., Hu, M., Lang, H., Sheng, S., Teng, J., Xiao, X., and Yuan, L.: Trans-boundary aerosol transport during a winter haze episode in China revealed by ground-based Lidar and CALIPSO satellite, Atmos. Environ., 141, 20–29, 2016. a
Salvoni, D., Boselli, A., Sannino, A., Parlato, L., Ejrnaes, M., Chengjun, Z., You, L., Wang, X., Amoruso, S., and Pepe, G. P.: Demonstration of atmospheric lidar measurement in the infrared wavelength domain with a superconducting nanowire single photon detector, Chem. Engineer. Trans., 84, 175–180, 2021. a
Sherlock, V., Garnier, A., Hauchecorne, A., and Keckhut, P.: Implementation and validation of a Raman lidar measurement of middle and upper tropospheric water vapor, Appl. Optics, 38, 5838–5850, 1999. a
Sicard, M., Molero, F., Guerrero-Rascado, J. L., Pedrós, R., Expósito, F. J., Córdoba-Jabonero, C., Bolarín, J. M., Comerón, A., Rocadenbosch, F., Pujadas, M., and Alados-Arboledas, L.: Aerosol LiDAR intercomparison in the framework of SPALINET – The Spanish LiDAR network: Methodology and results, IEEE T. Geosci. Remote, 47, 3547–3559, 2009. a, b, c
Sugimoto, N. and Lee, C.: Characteristics of dust aerosols inferred from lidar depolarization measurements at two wavelengths, Appl. Optics, 45, 7468–7474, 2006. a, b
Vaughan, M., Garnier, A., Josset, D., Avery, M., Lee, K.-P., Liu, Z., Hunt, W., Pelon, J., Hu, Y., Burton, S., Hair, J., Tackett, J. L., Getzewich, B., Kar, J., and Rodier, S.: CALIPSO lidar calibration at 1064 nm: version 4 algorithm, Atmos. Meas. Tech., 12, 51–82, https://doi.org/10.5194/amt-12-51-2019, 2019. a, b
Wandinger, U., Freudenthaler, V., Baars, H., Amodeo, A., Engelmann, R., Mattis, I., Groß, S., Pappalardo, G., Giunta, A., D'Amico, G., Chaikovsky, A., Osipenko, F., Slesar, A., Nicolae, D., Belegante, L., Talianu, C., Serikov, I., Linné, H., Jansen, F., Apituley, A., Wilson, K. M., de Graaf, M., Trickl, T., Giehl, H., Adam, M., Comerón, A., Muñoz-Porcar, C., Rocadenbosch, F., Sicard, M., Tomás, S., Lange, D., Kumar, D., Pujadas, M., Molero, F., Fernández, A. J., Alados-Arboledas, L., Bravo-Aranda, J. A., Navas-Guzmán, F., Guerrero-Rascado, J. L., Granados-Muñoz, M. J., Preißler, J., Wagner, F., Gausa, M., Grigorov, I., Stoyanov, D., Iarlori, M., Rizi, V., Spinelli, N., Boselli, A., Wang, X., Lo Feudo, T., Perrone, M. R., De Tomasi, F., and Burlizzi, P.: EARLINET instrument intercomparison campaigns: overview on strategy and results, Atmos. Meas. Tech., 9, 1001–1023, https://doi.org/10.5194/amt-9-1001-2016, 2016. a, b
Wang, L., Stanič, S., Bergant, K., Eichinger, W., Močnik, G., Drinovec, L., Vaupotič, J., Miler, M., Gosar, M., and Gregorič, A.: Retrieval of vertical mass concentration distributions – Vipava valley case study, Remote Sens., 11, 106, https://doi.org/10.3390/rs11020106, 2019a. a
Wang, L., Stanič, S., Eichinger, W., Song, X., and Zavrtanik, M.: Development of an automatic polarization raman LiDAR for aerosol monitoring over complex terrain, Sensors, 19, 3186, https://doi.org/10.3390/s19143186, 2019b. a
Wang, L., Mačak, M. B., Stanič, S., Bergant, K., Gregorič, A., Drinovec, L., Močnik, G., Yin, Z., Yi, Y., Müller, D., and Wang, X.: Investigation of Aerosol Types and Vertical Distributions Using Polarization Raman Lidar over Vipava Valley, Remote Sens., 14, 3482, https://doi.org/10.3390/rs14143482, 2022. a
Welton, E. J., Campbell, J. R., Spinhirne, J. D., and Scott III, V. S.: Global monitoring of clouds and aerosols using a network of micropulse lidar systems, in: Lidar Remote Sensing for Industry and Environment Monitoring, SPIE, 4153, 151–158, https://doi.org/10.1117/12.417040, 2001. a, b
Weng, M., Yi, F., Liu, F., Zhang, Y., and Pan, X.: Single-line-extracted pure rotational Raman lidar to measure atmospheric temperature and aerosol profiles, Opt. Express, 26, 27555–27571, 2018. a
Whiteman, D. N.: Examination of the traditional Raman lidar technique. II. Evaluating the ratios for water vapor and aerosols, Appl. Optics, 42, 2593–2608, 2003. a
Wiegner, M. and Geiß, A.: Aerosol profiling with the Jenoptik ceilometer CHM15kx, Atmos. Meas. Tech., 5, 1953–1964, https://doi.org/10.5194/amt-5-1953-2012, 2012. a
Wu, C., Xing, W., Feng, Z., and Xia, L.: Moving target tracking in marine aerosol environment with single photon lidar system, Opt. Laser. Eng., 127, 105967, https://doi.org/10.1016/j.optlaseng.2019.105967, 2020. a
Xian, J., Sun, D., Amoruso, S., Xu, W., and Wang, X.: Parameter optimization of a visibility LiDAR for sea-fog early warnings, Opt. Express, 28, 23829–23845, 2020. a
Xu, W., Yang, H., Sun, D., Qi, X., and Xian, J.: Lidar system with a fast scanning speed for sea fog detection, Opt. Express, 30, 27462–27471, 2022. a
Yin, Z.: ZPYin/ALiE: Atmospheric Lidar Intercomparison Evaluator v1.0 (v1.0), Zenodo [code], https://doi.org/10.5281/zenodo.8381875, 2023. a, b
Yin, Z., Ansmann, A., Baars, H., Seifert, P., Engelmann, R., Radenz, M., Jimenez, C., Herzog, A., Ohneiser, K., Hanbuch, K., Blarel, L., Goloub, P., Dubois, G., Victori, S., and Maupin, F.: Aerosol measurements with a shipborne Sun–sky–lunar photometer and collocated multiwavelength Raman polarization lidar over the Atlantic Ocean, Atmos. Meas. Tech., 12, 5685–5698, https://doi.org/10.5194/amt-12-5685-2019, 2019. a
Yin, Z., Yi, F., Liu, F., He, Y., Zhang, Y., Yu, C., and Zhang, Y.: Long-term variations of aerosol optical properties over Wuhan with polarization lidar, Atmos. Environ., 259, 118508, https://doi.org/10.1016/j.atmosenv.2021.118508, 2021. a
Yuan, Y., Di, H., Liu, Y., Yang, T., Li, Q., Yan, Q., Xin, W., Li, S., and Hua, D.: Detection and analysis of cloud boundary in Xi'an, China, employing 35 GHz cloud radar aided by 1064 nm lidar, Atmos. Meas. Tech., 15, 4989–5006, https://doi.org/10.5194/amt-15-4989-2022, 2022. a