the Creative Commons Attribution 4.0 License.
the Creative Commons Attribution 4.0 License.
 | 20 Oct 2023
Effect of land–sea air mass transport on spatiotemporal distributions of atmospheric CO2 and CH4 mixing ratios over the southern Yellow Sea
Jiaxin Li
Kunpeng Zang
Yi Lin
Yuanyuan Chen
Shuo Liu
Shanshan Qiu
Kai Jiang
Xuemei Qing
Haoyu Xiong
Haixiang Hong
Shuangxi Fang
Honghui Xu
Yujun Jiang
To reveal the spatiotemporal distributions of atmospheric CO2 and CH4 mixing ratios and regulation mechanisms over the China shelf sea, two field surveys were conducted in the southern Yellow Sea in China in November 2012 and June 2013, respectively. The results observed showed that mean background atmospheric CO2 and CH4 mixing ratios were 403.94 (±13.77) ppm and 1924.8 (±27.8) ppb in November 2012 and 395.90 (±3.53) ppm and 1918.0 (±25.7) ppb in June 2013, respectively. An improved data-filtering method was optimised and established to flag atmospheric CO2 and CH4 emission from different sources in the survey area. We found that the spatiotemporal distributions of atmospheric CO2 and CH4 mixing ratios over the southern Yellow Sea were dominated by land–sea air mass transport, which was mainly driven by seasonal monsoon, while the influence of air–sea exchange was negligible. In addition, atmospheric CO2 and CH4 mixing ratios over the southern Yellow Sea could be elevated remarkably at a distance of approximately 20 km offshore by land-to-sea air mass transportation from the Asian continent during the early-winter monsoon.
- Article
(7853 KB) - Full-text XML
- BibTeX
- EndNote


Carbon dioxide (CO2) and methane (CH4) are the two most important greenhouse gases, playing critical roles in Earth's radiation balance (NOAA Global Monitoring Laboratory, 2014; WMO, 2022). Since the Industrial Revolution era (∼ 1750), atmospheric CO2 and CH4 mixing ratios have been increasing, reaching their highest values of 415.7±0.1 ppm and 1908 ±2 ppb in 2021, which were about 149 % and 262 % of the preindustrial levels (WMO, 2022). Increasing atmospheric CO2 and CH4 were unequivocally attributed to anthropogenic emissions, e.g. industrial production, deforestation, fossil fuel consumption (Huang et al., 2003; Peters et al., 2012) and natural source–sink processes (Zang et al., 2017).
For decades, spatiotemporal distributions of atmospheric CO2 and CH4 mixing ratios have attracted more and more attention from the science community. Shipborne observation was considered as one of six common and important methods for observing greenhouse gases (Matsueda et al., 1996; Daube et al., 2002; Dlugokencky et al., 2005; Crosson, 2008; Fang et al., 2015). Based on discrete shipborne sampling and measurement, the latitudinal distribution of CH4 mixing ratios with a sharp drop in the area of 20∘ N in marine boundary air of the North Pacific Ocean was reported and was mainly influenced by air mass transportation driven by both the winter monsoon and trade winds (Matsueda et al., 1996; Dlugokencky et al., 2005). In the coastal area of the Bohai Sea, seasonal variations in atmospheric CO2, CH4 and N2O mixing ratios were mainly influenced by land–sea air mass transportation based on discrete sampling observation (Kong et al., 2010). Moreover, periodically observed CO2 and CH4 mixing ratios in marine boundary air were also used to improve the accuracy of calculated air–sea CO2 flux in the northern South China Sea and the Luzon Strait (Zhai, 2015) and assess impacts of several episodic oil and gas spill events on abnormal air–sea CH4 flux in the Bohai Sea (Zhang et al., 2014).
In recent years, a high-accuracy and high-resolution continuous shipborne observation method has been developed and applied to observe greenhouse gases in marine boundary air (Nara et al., 2014; Zang et al., 2017; Riddick et al., 2019), which could reveal more detailed information associated with their source–sink processes. Latitudinal distributions of both CO2 and CH4 mixing ratios in the China shelf sea boundary air in early spring were observed and were similar to those in the North Pacific Ocean (Matsueda et al., 1996; Zang et al., 2017) and mainly impacted by atmospheric chemical processes, air–sea interaction in the Yangtze River estuary area and land–sea air mass transportation (Zang et al., 2017; Liu et al., 2018). Meanwhile, peak values of CO2 and CH4 mixing ratios in the downwind area of offshore oil and gas platforms, which were recognised as hotspot sources of greenhouse gases, were observed by continuous shipborne measurement systems in the North Sea, the South China Sea and the Bohai Sea. Combined with the Gaussian plume model, CH4 emissions could be quantified via a “top-down” approach (Nara et al., 2014; Riddick et al., 2019; Zang et al., 2020).
Monsoons are a kind of climatic phenomenon in which the dominant wind system changes with seasons (Lyu et al., 2021). The East Asian Monsoon (EAM), comprising the East Asian Summer Monsoon (EASM) and East Asian Winter Monsoon (EAWM), is an important component of the Earth's climate system and significantly influences the socioeconomic, agricultural and cultural development of East Asia (Huang, 1985; Zou et al., 2018; Lyu et al., 2021). Previous studies have shown that the East Asian Monsoon played an important role in global and regional climate variability (Huang, 1985; Chang et al., 2000; Ding et al., 2007; Zhan and Li, 2008). On the one hand, spatiotemporal distributions of CO2 and CH4 in marine boundary air were influenced by multiple processes, such as land–sea air mass transport (Bartlett et al., 2003; Zang et al., 2017), ship emission (Warneke et al., 2005; Law et al., 2013; Bouman et al., 2017; Ding et al., 2018), and oil and gas platforms (Nara et al., 2014; Reddick et al., 2019; Zang et al., 2020). On the other hand, greenhouse gases have been observed and studied in East Asia and the Pacific Ocean based on land (island)-based stations (Fang et al., 2015, 2017) and ship and plane observation platforms for many years (Matsueda et al., 1996; Bartlett et al., 2003; Dlugokencky et al., 2005). However, as an important pathway of atmospheric-component transportation between the Asian continent and Pacific Ocean, spatiotemporal distributions and regulation mechanisms of CO2 and CH4 in the China shelf sea boundary air were still rare (Zhang et al., 2007; Zang et al., 2017; Liu et al., 2018).
In this study, atmospheric CO2 and CH4 mixing ratios in boundary air of the southern Yellow Sea (SYS) were simultaneously observed by a self-assembled shipborne CRDS (cavity ring-down spectroscopy; Picarro G2301, USA) system in November 2012 and June 2013, typical periods of the EASM and the EAWM. The major objectives of this work were (1) to optimise an improved data-filtering approach for continuous mobile shipborne observation of atmospheric CO2 and CH4 mixing ratios, (2) to investigate the influence of air–sea exchange on the spatiotemporal distributions of CO2 and CH4 mixing ratios, and (3) to reveal the regulating mechanisms of the seasonal monsoon on spatiotemporal distributions of CO2 and CH4 in marine boundary air of the SYS during the field surveys.
2.1 Observation area
The Yellow Sea is a semi-enclosed marginal sea, located on the western part of the Pacific Ocean, adjacent to China to the north and west and the Korean Peninsula to the east (Zhang and Chu, 2018; Wang and Zhai, 2021). It is a main pathway of air mass transport between the Asian continent and Pacific Ocean and can be divided into two basins: the northern Yellow Sea (NYS) and the SYS (Lyu et al., 2021). The SYS covers an area of about 10.8×10⁴ km2, with an average depth of 44 m, and is strongly influenced by the EAM system (Zou et al., 2018). As shown in Fig. 1, to study the distributions of atmospheric CO2 and CH4 mixing ratios and their regulation mechanisms, two campaigns were conducted from 2 to 8 November 2012 and from 22 to 29 June 2013, respectively, the typical periods of the EAM (including the summer monsoon and winter monsoon). In order to ensure the comparability of observations, parallel observed CO2 and CH4 data from the three land (island)-based stations (LAN: Lin'an station; JGS: Jeju Gosan station; TAP: Tae-ahn Peninsula station) located in the vicinity are presented and studied in this study.
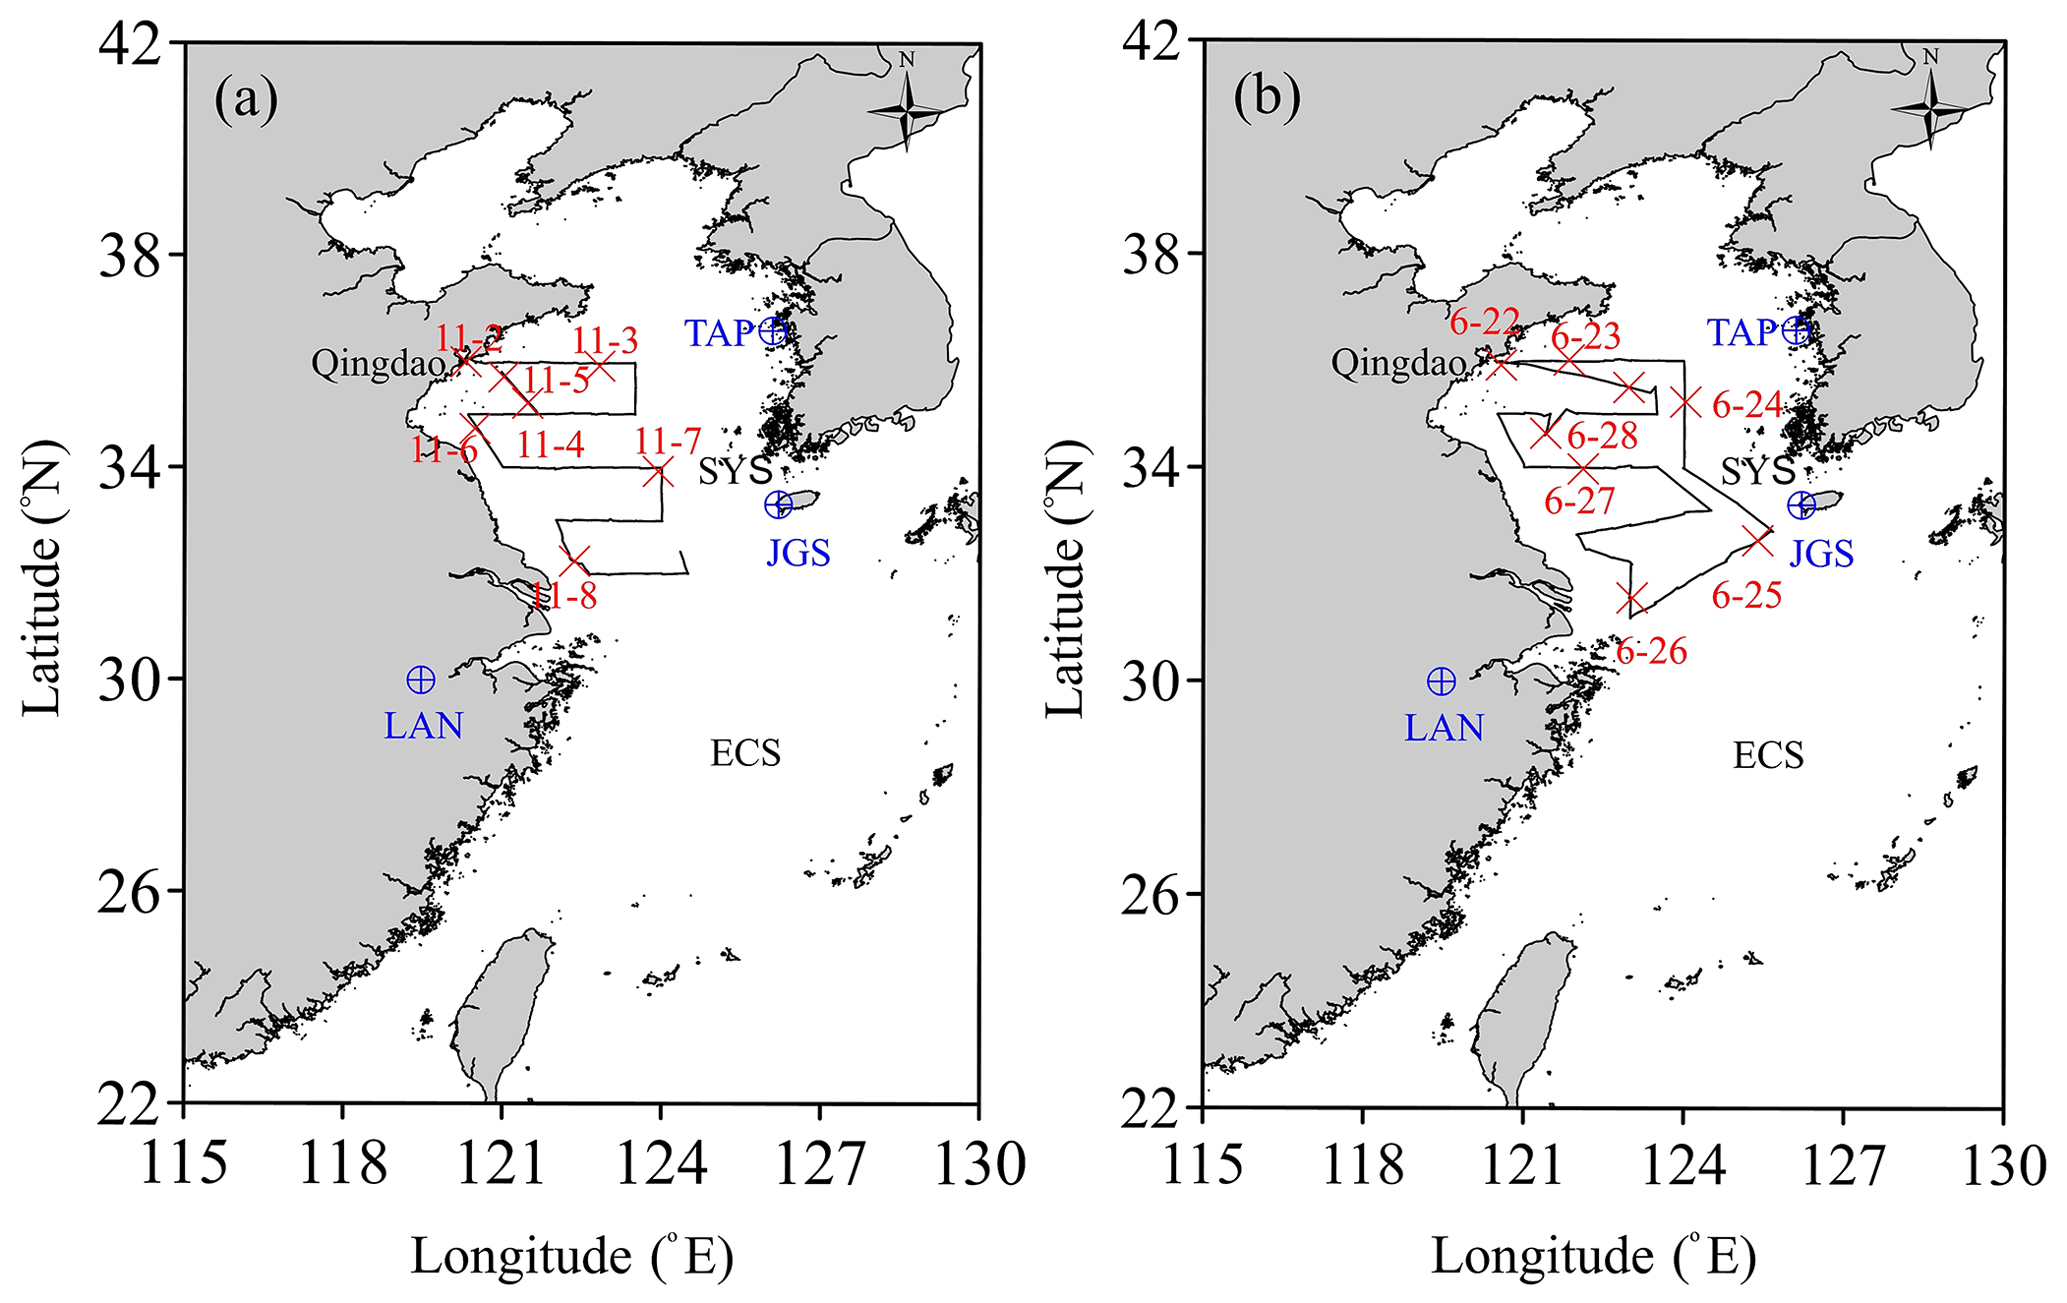
Figure 1Observation area in the SYS. The thick solid black lines represent cruise tracks in November 2012 (a) and June 2013 (b). Symbols represent the Tae-ahn Peninsula station (TAP; 36.73∘ N, 126.13∘ E; 20 m a.s.l.), Jeju Gosan station (JGS; 33.30∘ N, 126.20∘ E; 25 m a.s.l.) and Lin'an station (LAN; 30.18∘ N, 119.44∘ E; 138 m a.s.l.), respectively (https://www.esrl.noaa.gov/gmd/dv/site/site_table.html, last access: 26 October 2022). ECS represents the East China Sea. The red crosses represent the beginning locations of each natural day.
2.2 Measurement of atmospheric CO2 and CH4 mixing ratios
As shown in Fig. 2a, during the field surveys, the air inlet was fixed at the highest point of the bow, about 10 m a.s.l. (above sea level), and near the meteorological sensors to avoid anthropogenic contamination (Zang et al., 2017). Atmospheric CO2 and CH4 mixing ratios were measured by using a self-assembled Picarro system (G2301, Picarro Inc., USA). The Picarro analyser, which can acquire one measurement every 5 s and correct the measurements influenced by water vapour (Rella et al., 2013), has been proven to be excellent for measuring CO2 and CH4 with high precision and accuracy (Crosson, 2008; Fang et al., 2013).
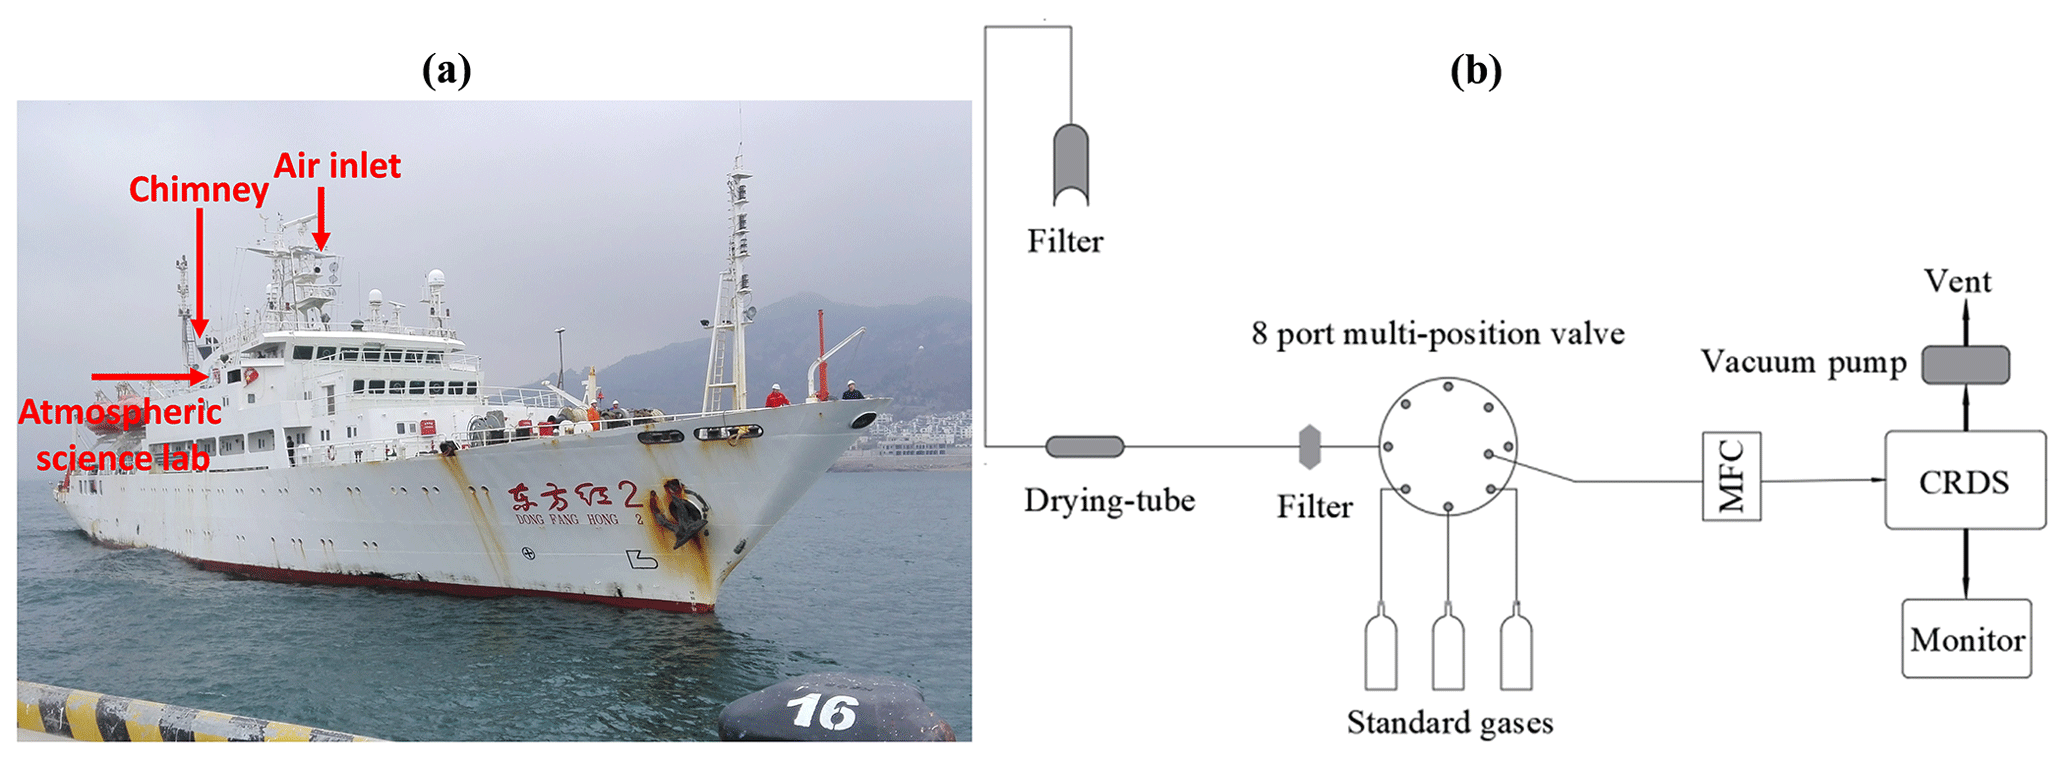
Figure 2The RV Dongfanghong II (a). Schematic diagram of the shipborne Picarro system for observing atmospheric CO2 and CH4 (b).
As shown in Fig. 2b, ambient air was pumped via the dedicated tube by an external vacuum pump and passed through a membrane filter (1.0 µm, Whatman Inc., USA), a drying tube filled with magnesium perchlorate [Mg(ClO4)2] and another filter, respectively, to remove particles and water vapour. Then, it was regulated by valve sequence setting with a dry and clean air sample as well as the standard gases flowed into the CRDS analyser through an eight-port, multi-position valve (Valco Instruments Co. Inc. USA) with a flow rate of 200 mL min−1 controlled by a mass flow controller (Beijing Seven-star electronics Co. LTD. China). Before and after each campaign, the CRDS analyser was calibrated to guarantee its normal operation status. During field surveys, three standard gases were automatically measured in sequence each day, which was regulated by the CRDS analyser. Linear functions were yielded based on measurement results and standard values of three standard gases, i.e. 254.53 (±0.06) ppm, 365.14 (±0.06) ppm and 569.99 (±0.08) ppm for CO2 and 1601.0 (±0.8) ppb, 1925.5 (±0.8) ppb and 2317.7 (±0.5) ppb for CH4, respectively, which were used to calibrate the observed data. The standard gases used were propagated from the WMO primary standards (World Meteorological Organization, WMO, Global Atmospheric Watch, GAW, 2004 scale for CH4, 2007 scale for CO2) to guarantee the consistency, traceability and international comparability of observed data (Dlugokencky et al., 2005).
2.3 Meteorological data
Both of the campaigns were conducted by a ship named RV Dongfanghong II, which was designed for research in multiple disciplines in marine environments with a ship-based atmospheric science lab. Meteorological data, including time, latitude, longitude, cruising speed and direction, wind speed, wind direction, relative humidity, air pressure, and temperature, were observed by the meteorological sensors (RM Young, USA) with a resolution of 10 s and were used to filter and flag the observed CO2 and CH4 mixing ratios and verify simulated wind fields.
2.4 Air mass transport model
HYSPLIT (Hybrid Single Particle Lagrangian Integrated Trajectory model) was developed by the National Oceanic and Atmospheric Administration's Air Resources Laboratory (NOAA-ARL) and the Bureau of Meteorology of Australia and can simulate the air mass transportation combined with the National Centers for Environmental Prediction (NCEP) reanalysis data. The principle of simulating the air mass transportation path is as follows: assuming that particles in the air are floating in the wind, their moving trajectory is the integral of their position vectors in time and space (Zhang et al., 2011; Xia et al., 2018). Backward trajectory analysis uses the mixed single-particle Lagrangian integral transport and diffusion model to calculate the transport route of air particles, analyse the influence of air mass transportation on the spatial and temporal distribution of atmospheric components in the observation area by tracking the transport path, and infer their potential sources. The main parameters required to calculate the backward trajectory are the altitude, latitude and longitude of the starting point. Generally, the calculation is carried for 72 h (Zhan et al., 2009; Zhang et al., 2017, 2019).
3.1 Atmospheric CO2 and CH4 mixing ratios
Generally, CO2 and CH4 mixing ratios decrease with increasing altitude and distance away from continent and decreasing latitude (Matsueda et al., 1996; Bartlett et al., 2003; Zang et al., 2017). Spatiotemporal distributions of atmospheric CO2 and CH4 mixing ratios in shelf seas suggest not only natural characteristics, but also multiple anthropogenic processes, such as marine oil and gas exploration (Nara et al., 2014; Zang et al., 2020), land–sea air mass transportation (Kong et al., 2010; Liu et al., 2018), and malfunction of observation instruments (Zang et al., 2017).
During the two field surveys, atmospheric CO2 mixing ratios ranged from 392.75 to 688.10 ppm in November 2012 (Fig. 3a and b) and ranged from 389.28 to 967.60 ppm in June 2013 (Fig. 3c and d), respectively. Atmospheric CH4 mixing ratios ranged from 1870.6 to 1986.0 ppb in November 2012 (Fig. 4a and b) and ranged from 1820.8 to 2179.0 ppb in June 2013 (Fig. 4c and d), respectively. Atmospheric CO2 and CH4 mixing ratios were comparable with the historical observation results of the Northern Hemisphere (Matsueda et al., 1996; Zang et al., 2017; Liu et al., 2018). Abnormally high observation values were attributed to exhaust gases of ships or anthropogenic interference of analysers.
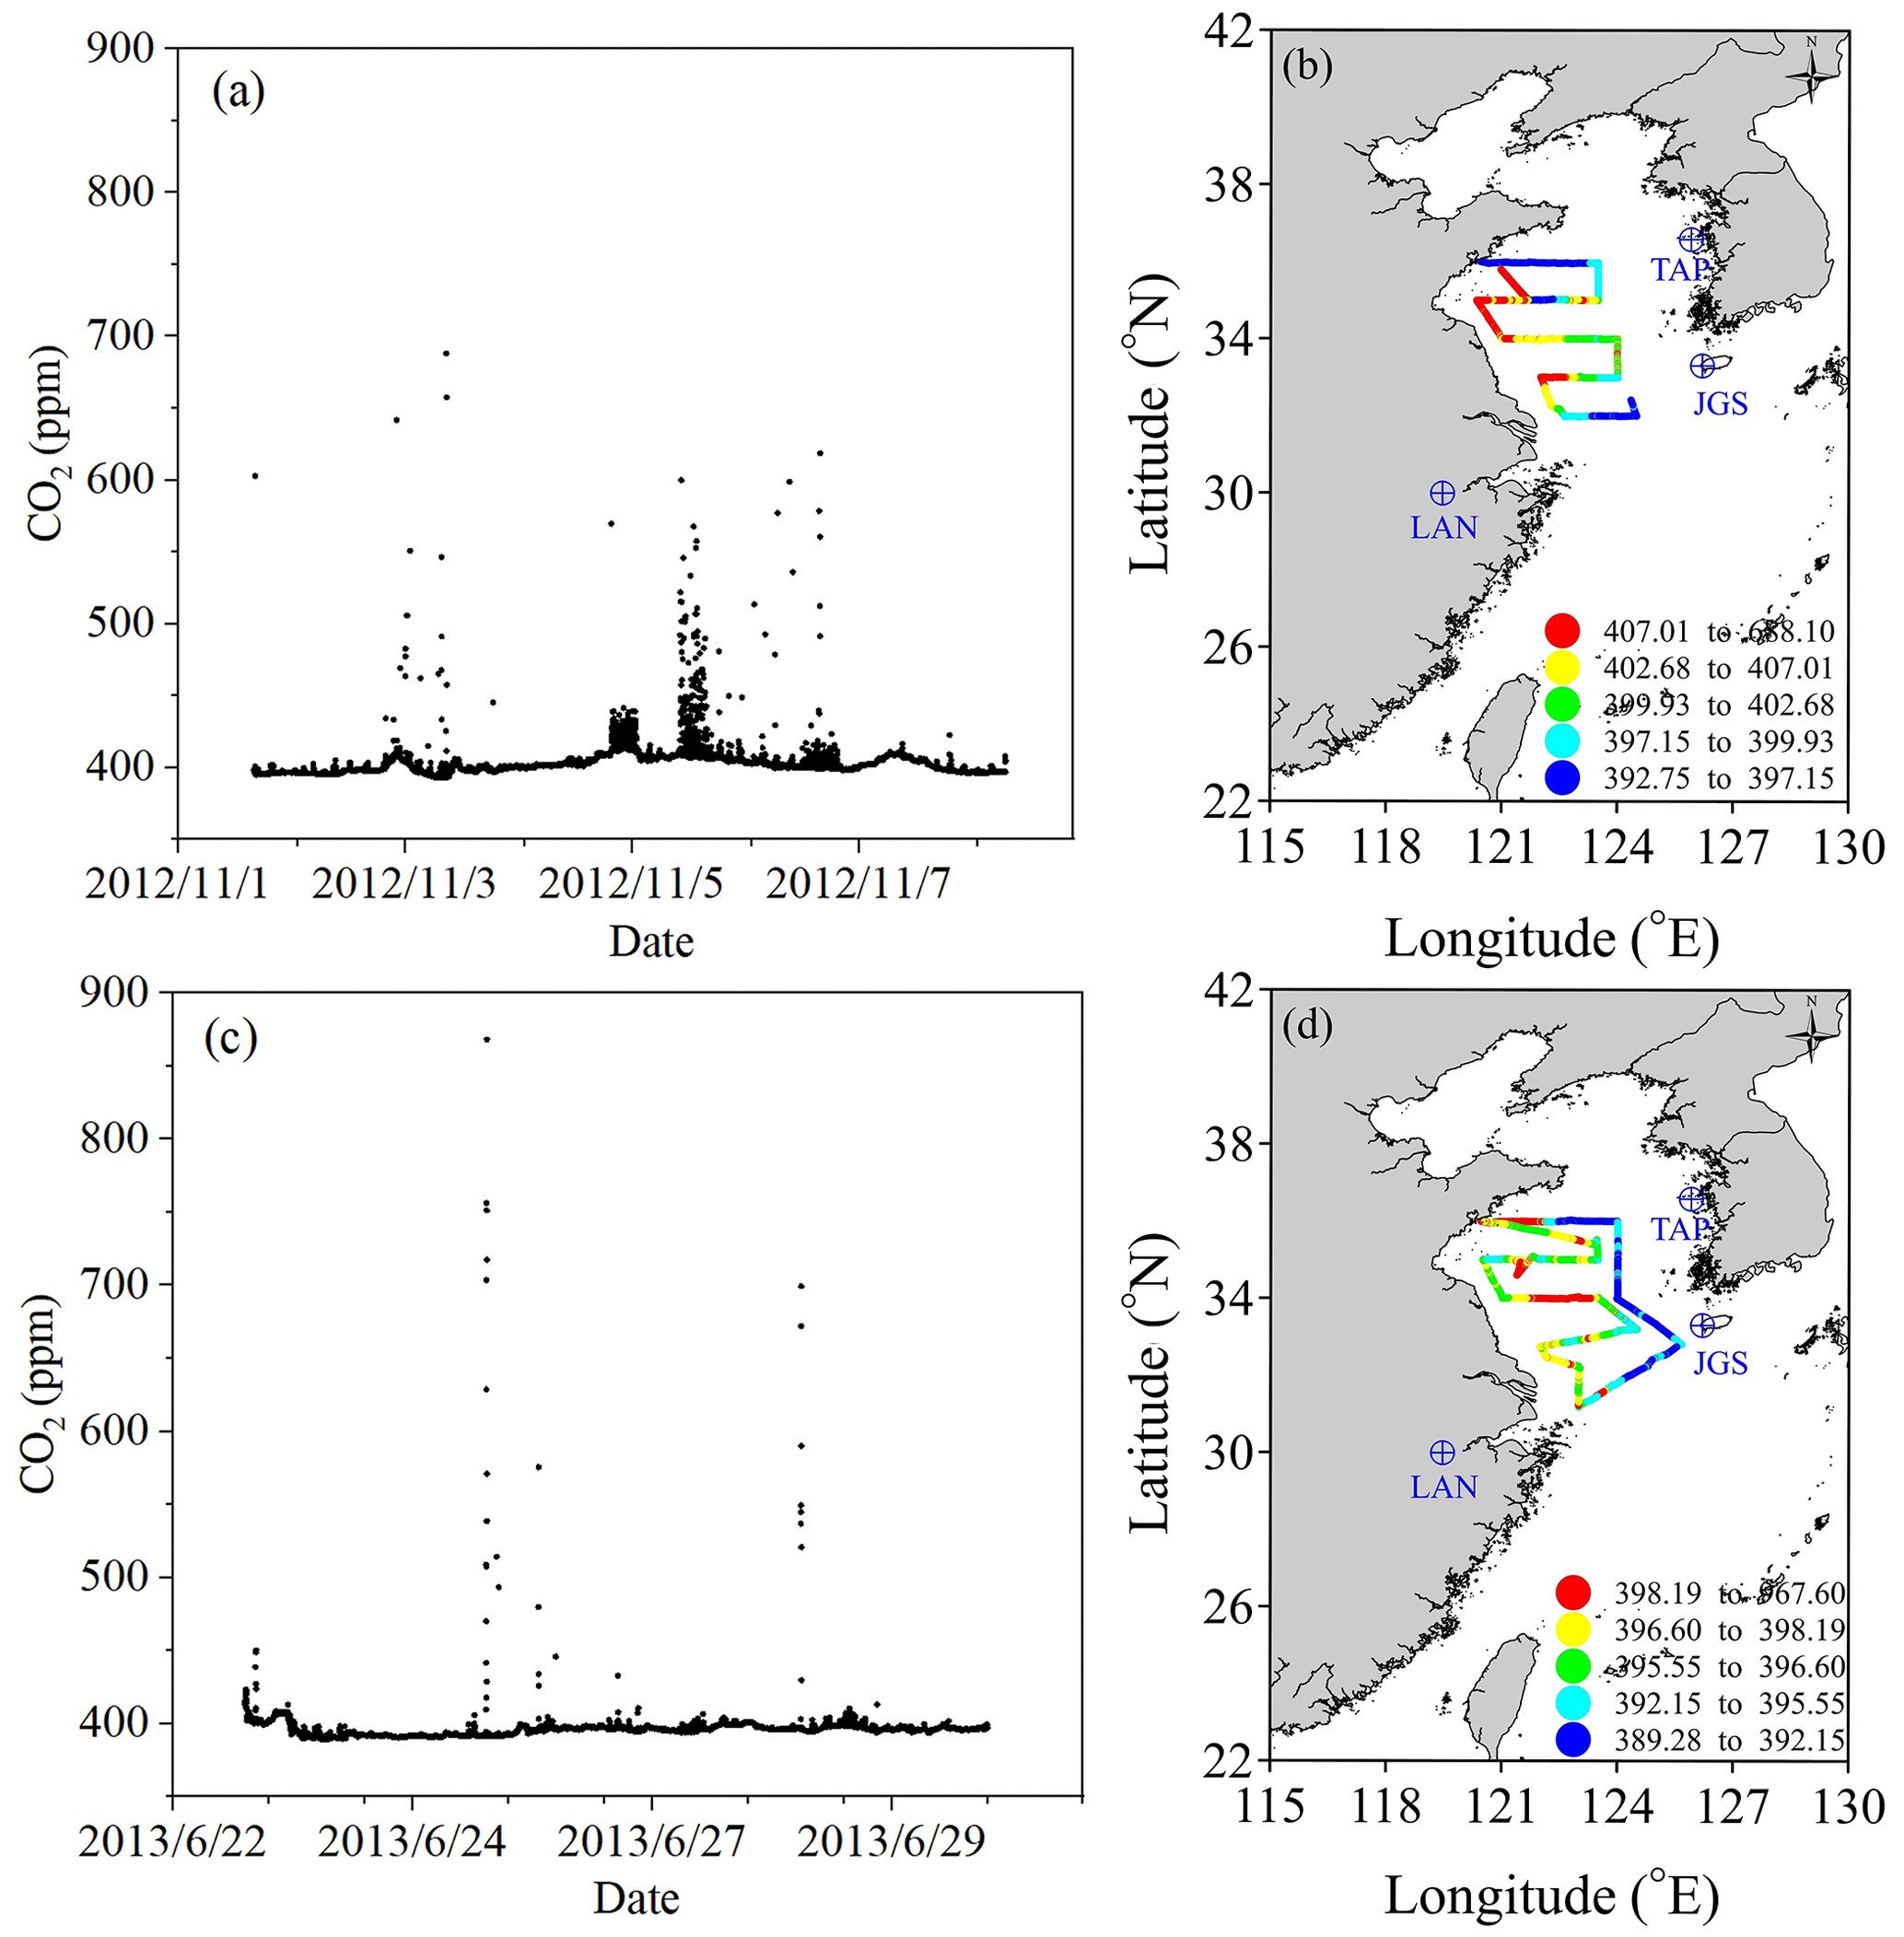
Figure 3Temporal (a, c) and spatial (b, d) distribution of CO2 mixing ratios in November 2012 and June 2013 in the SYS.
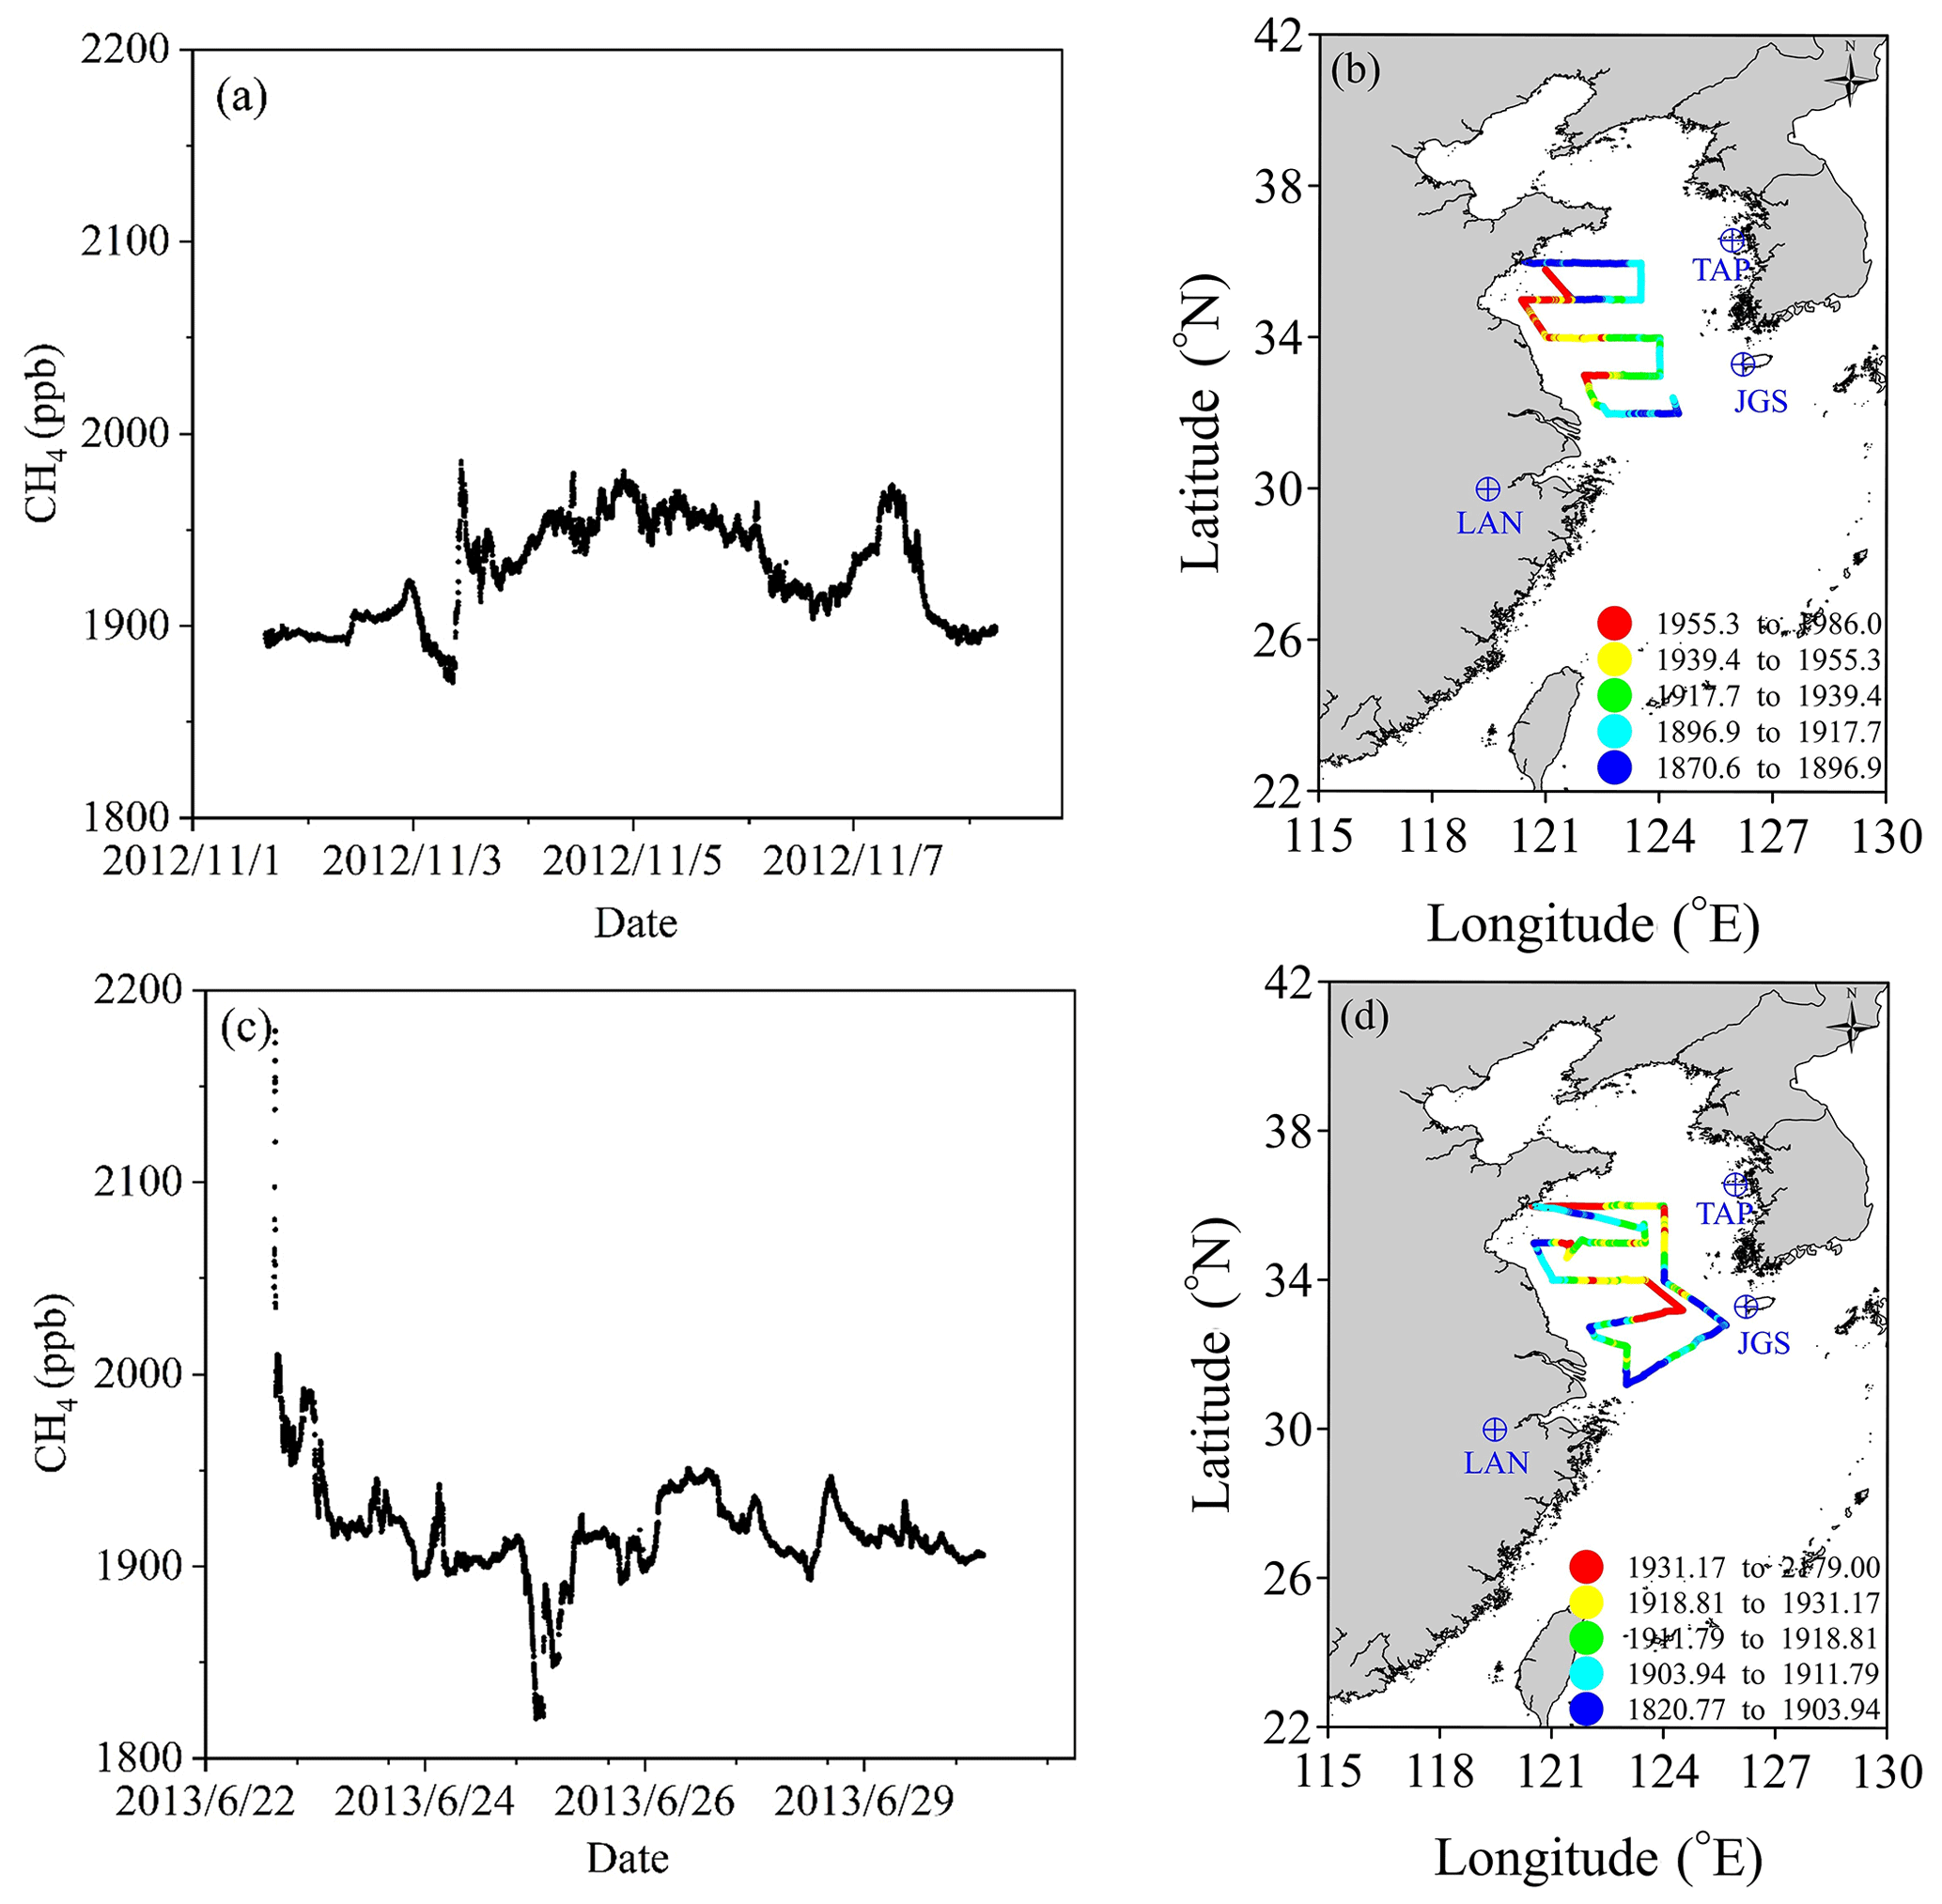
Figure 4Temporal (a, c) and spatial (b, d) distribution of CH4 mixing ratios in November and June in the SYS.
3.2 Wind data
Observed wind data were averaged to hourly data for subsequent analysis. As shown in Fig. 5a, during the survey of November 2012, hourly mean wind speed ranged from 0.05 to 20.46 m s−1 with an average value of 8.09 (±4.17) m s−1. The dominant wind direction was from the north and north-east, indicating that the air masses flowed from the Asian continent to the Pacific Ocean. As shown in Fig. 5c, during the survey of June 2013, hourly mean wind speed ranged from 0.08 to 9.42 m s−1 with an average value of 4.72 (±1.79) m s−1. Conversely, the predominant wind direction turned into south or south-east, which promoted air masses flowing from the Pacific Ocean to the Asian continent. In addition, the observed dominant wind directions (Fig. 5a and c) were consistent with the simulated wind fields (Fig. 5b and d), suggesting typical features of the winter and summer monsoon, which were ideal cases to study the effects of land–sea air mass transportation on the spatiotemporal variations in CO2 and CH4 mixing ratios in the MBL (marine boundary layer) of the SYS.
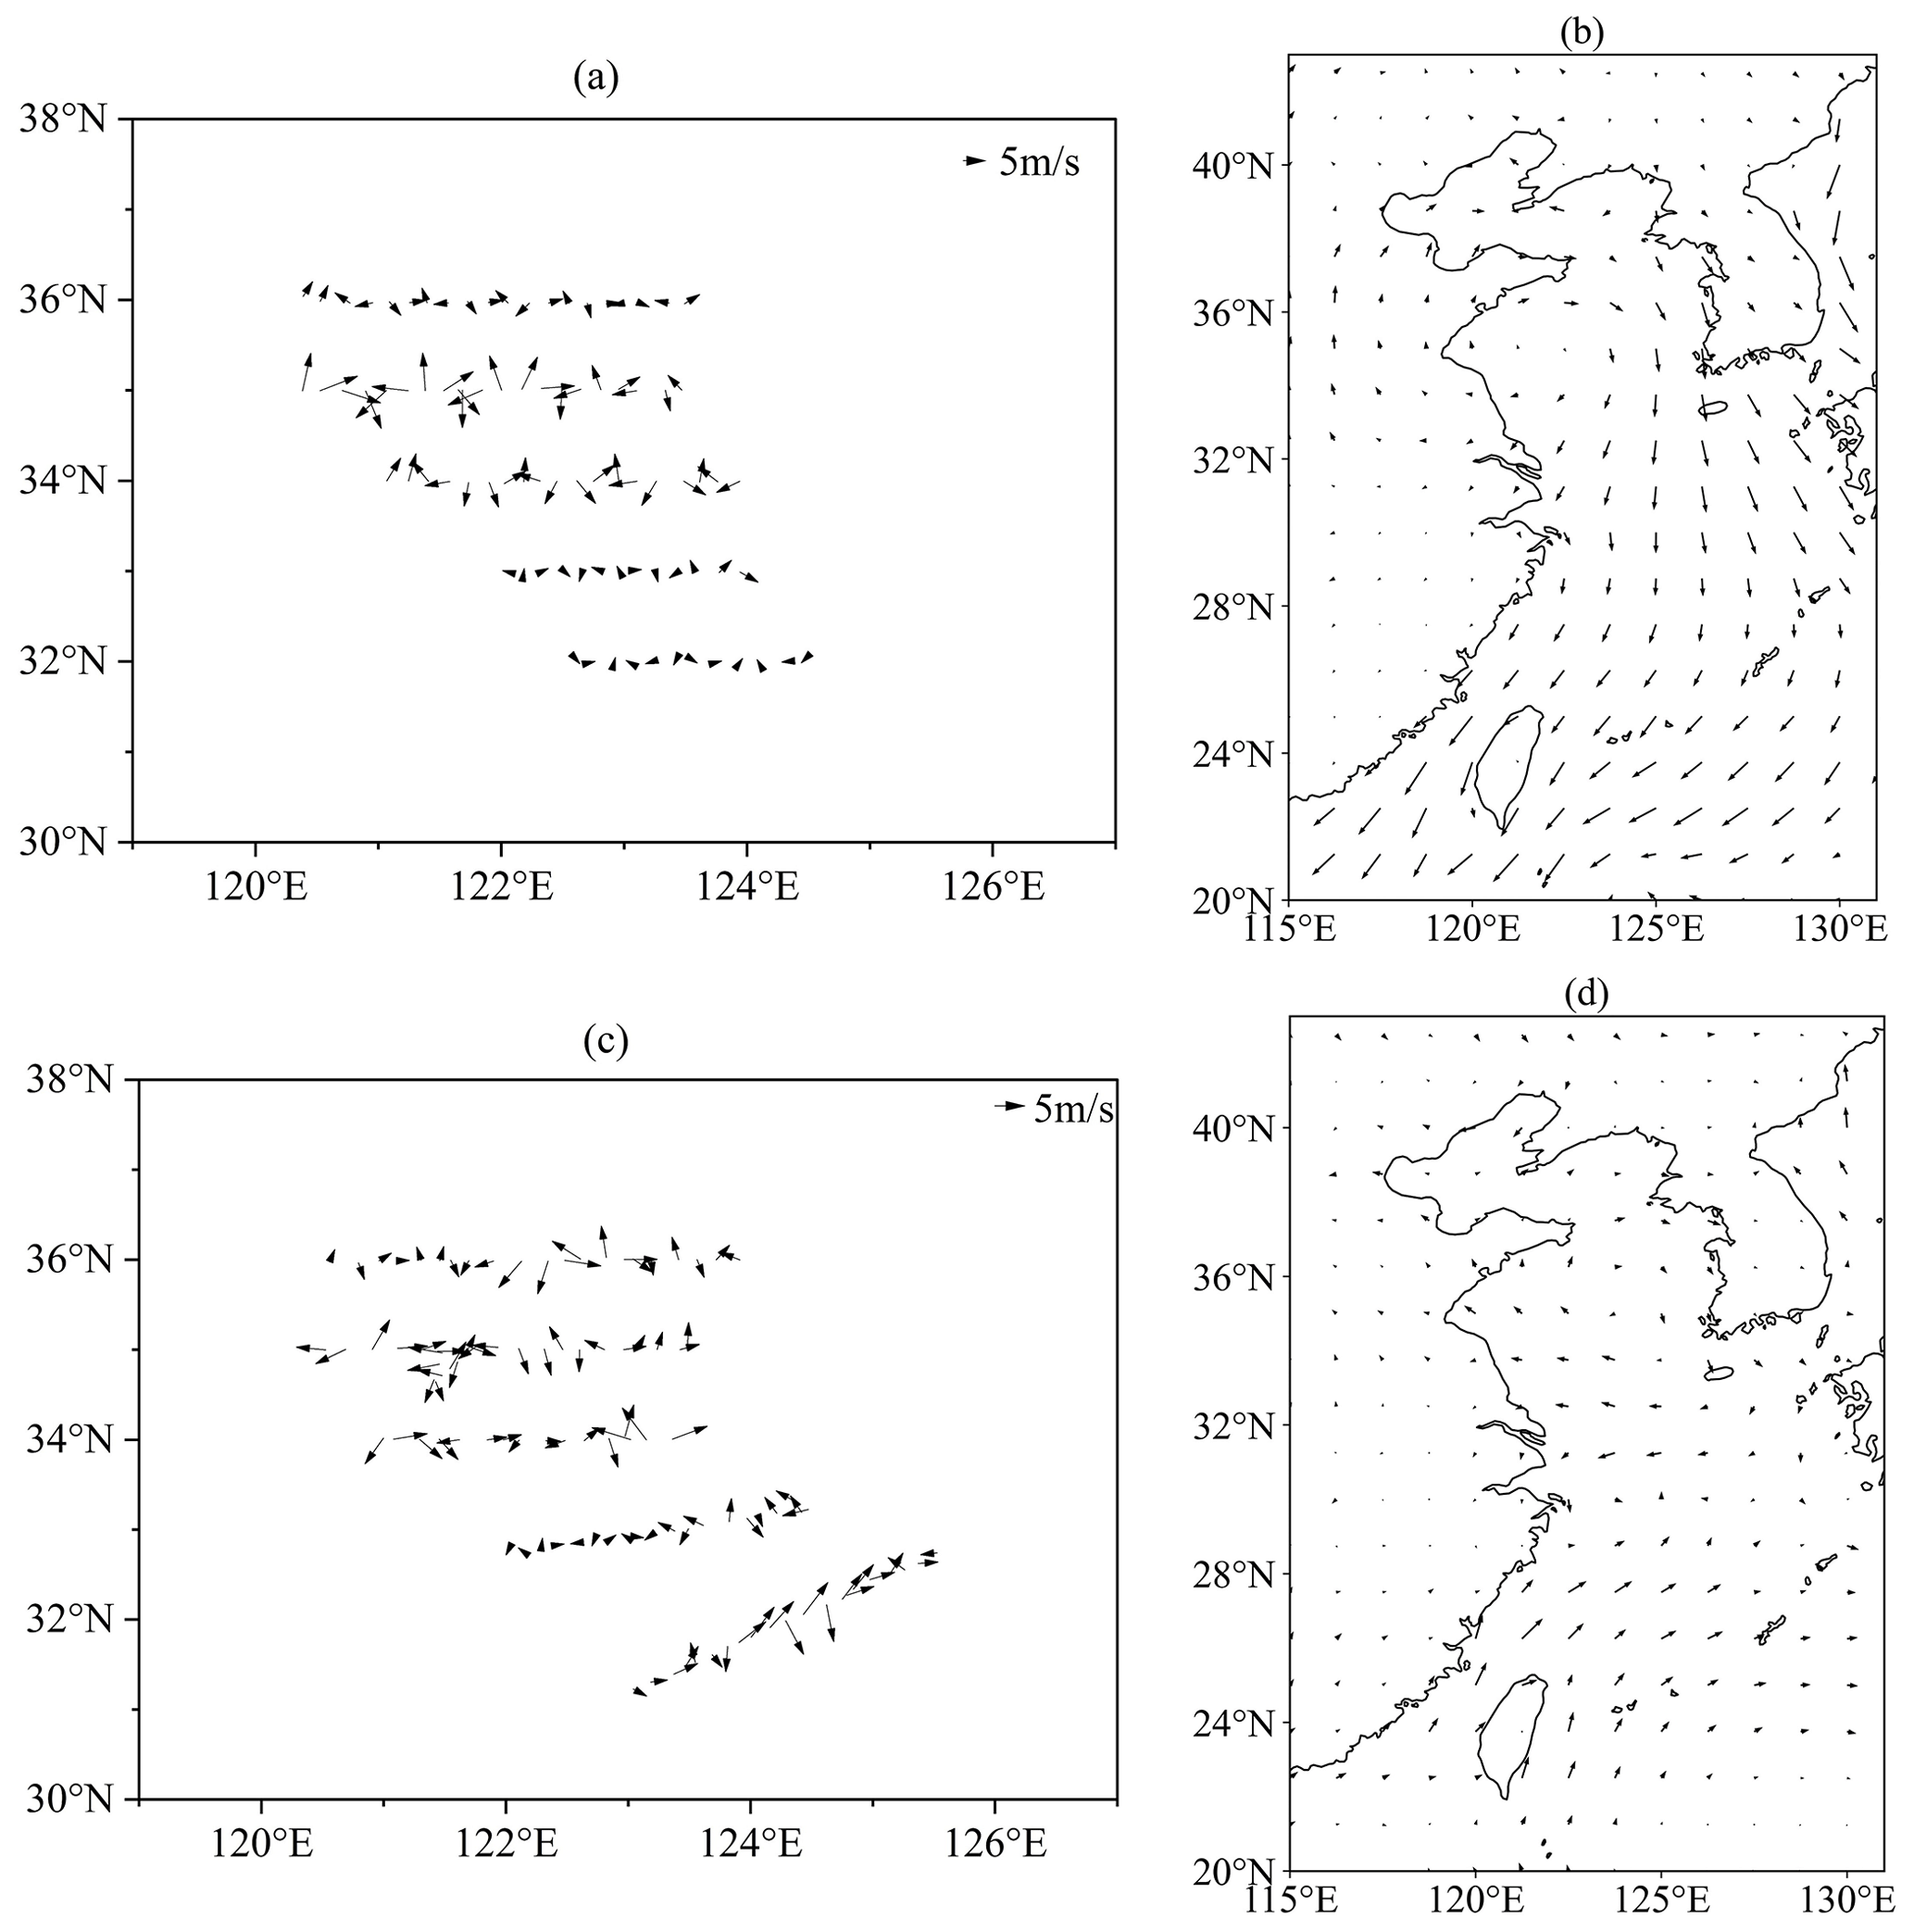
Figure 5Observed wind direction and speed (a, c) and simulation of wind fields (b, d) over the SYS. The simulated wind fields were plotted based on the ERA5 hourly data on pressure levels provided by the European Centre for Medium-Range Weather Forecasts (ECMWF) (https://cds.climate.copernicus.eu/cdsapp#\!/dataset/reanalysis-era5-pressure-levels?tab=form, last access: 4 November 2022).
4.1 Data-filtering approach
Although some empirically based data processes have been reported (Zang et al., 2017; Liu et al., 2018), a specific data-filtering approach for continuous shipborne observation needs to be optimised and established to distinguish impacts of multiple source–sink processes on observed shipborne atmospheric CO2 and CH4 mixing ratios along the cruise tracks, especially in the shelf seas.
Firstly, observed atmospheric CO2 and CH4 mixing ratios along the cruise tracks in November 2012 and June 2013 were calibrated by a linear function, averaged every 1 min and named “raw data” for the subsequent process.
Secondly, according to the voyage record, the abnormal values caused by malfunction of the instrument and impacted by manually refilling the drying tube were flagged (Zang et al., 2017).
Thirdly, when the ship stopped for oceanography investigation at discrete stations or cruised downwind with speeds lower than the wind speed, observed atmospheric CO2 and CH4 mixing ratios might be impacted by the ship's exhaust gas and human activities (Zang et al., 2017; Liu et al., 2018). Previous studies empirically considered 3 kn as the criterion to flag data influenced by the ship's exhaust gas and human activities (Zang et al., 2017; Liu et al., 2018).
In this study, two station measurements are taken as examples, as shown in Fig. 6a and b; when the ship speed slowed down from a normal cruising speed of 11 kn to less than 3 kn, the observed CO2 mixing ratio varied from a smooth pattern with a SD (standard deviation) value less than 0.10 ppm to an intensive fluctuation pattern with a SD value greater than 1.20 ppm due to influences of ship emissions and human activities. According to the quality control criteria of CO2 (±0.10 ppm), which was recommended by the WMO GAW (WMO, 2007), 3 kn was recognised as the threshold. Results showed that 15.5 % and 21.9 % of total observed data in November 2012 and June 2013, respectively, were flagged in this step.
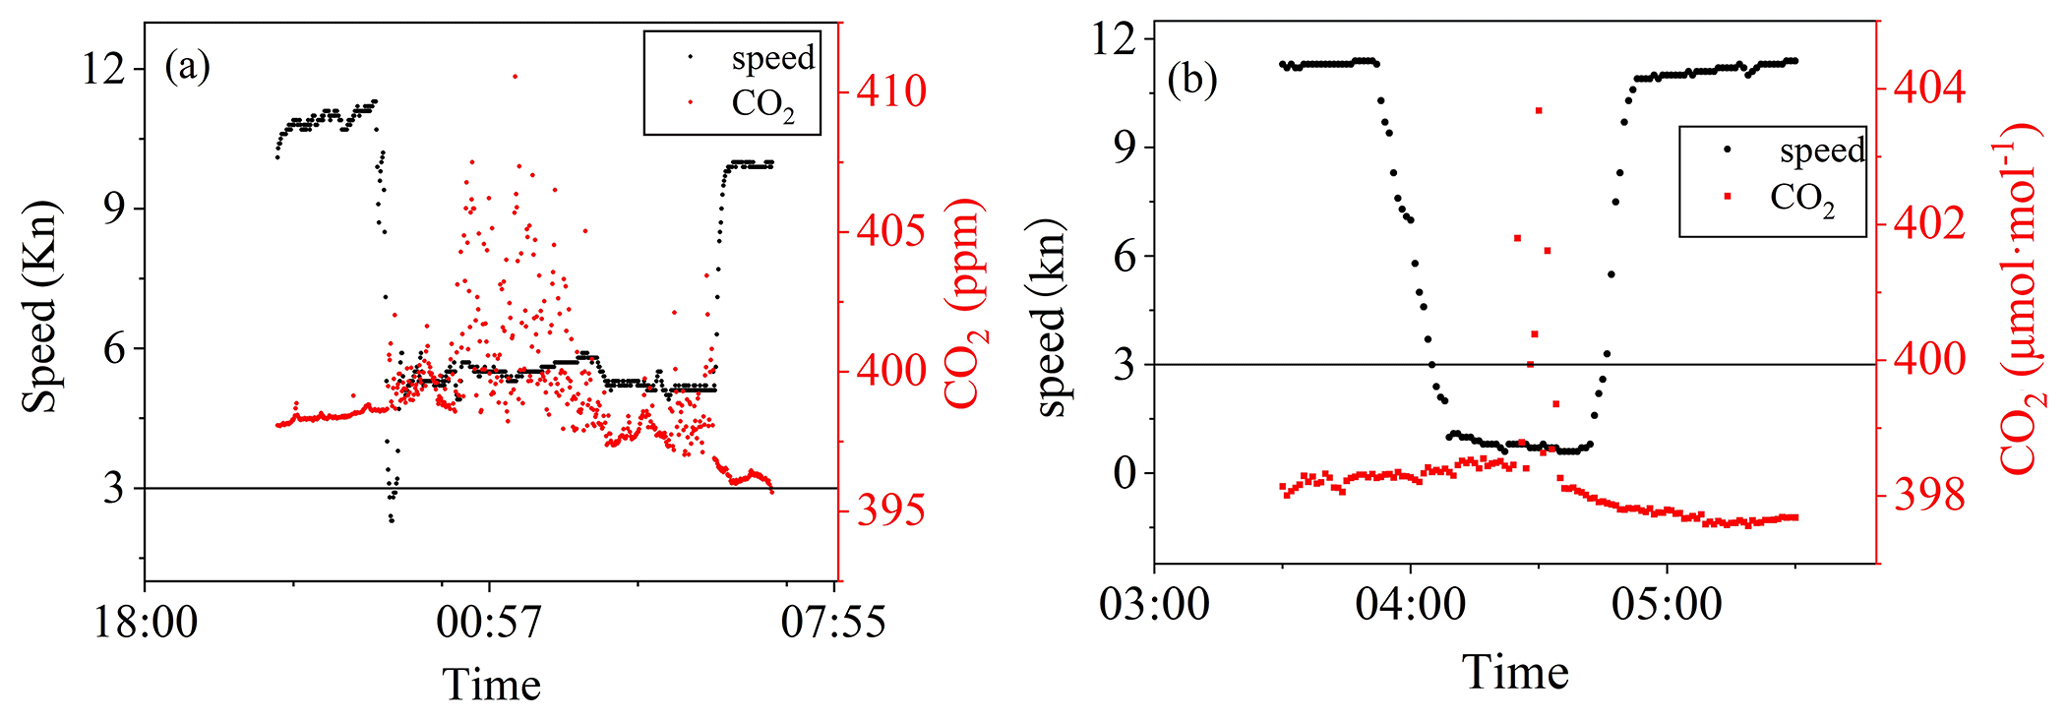
Figure 6Variations in observed CO2 mixing ratios and ship speed from 20:40 (UTC+8; applies to all the figures and text) on 28 June 2013 to 06:40 on 29 June 2013 (a) and 03:30 to 05:30 on 3 November 2012 (b).
Finally, the Pauta criterion (“3σ” method), a widely used data quality control approach in atmospheric greenhouse gas observation (Zhang et al., 2007; Fang et al., 2015; Zang et al., 2017), was introduced to filter and flag the non-background-measurement results. To optimise this process, observation data covered periods of 0.5, 1, 2 and 4 h as calculated, respectively. Any deviation between observed results and average values lying outside ±3 SD was considered to be non-background data and should be flagged. This procedure was repeated until no outliers were identified (Zhang et al., 2007). The results showed that data calculated hourly were optimal because not only could dispersed values be flagged, but the data could also be kept smooth.
As shown in Fig. 7, based on the optimised approach, observed data could be filtered and flagged. The remaining data accounted for 79.5 % and 75.7 % of raw data in November 2012 and June 2013, respectively, and were considered to be background and used for further analysis.
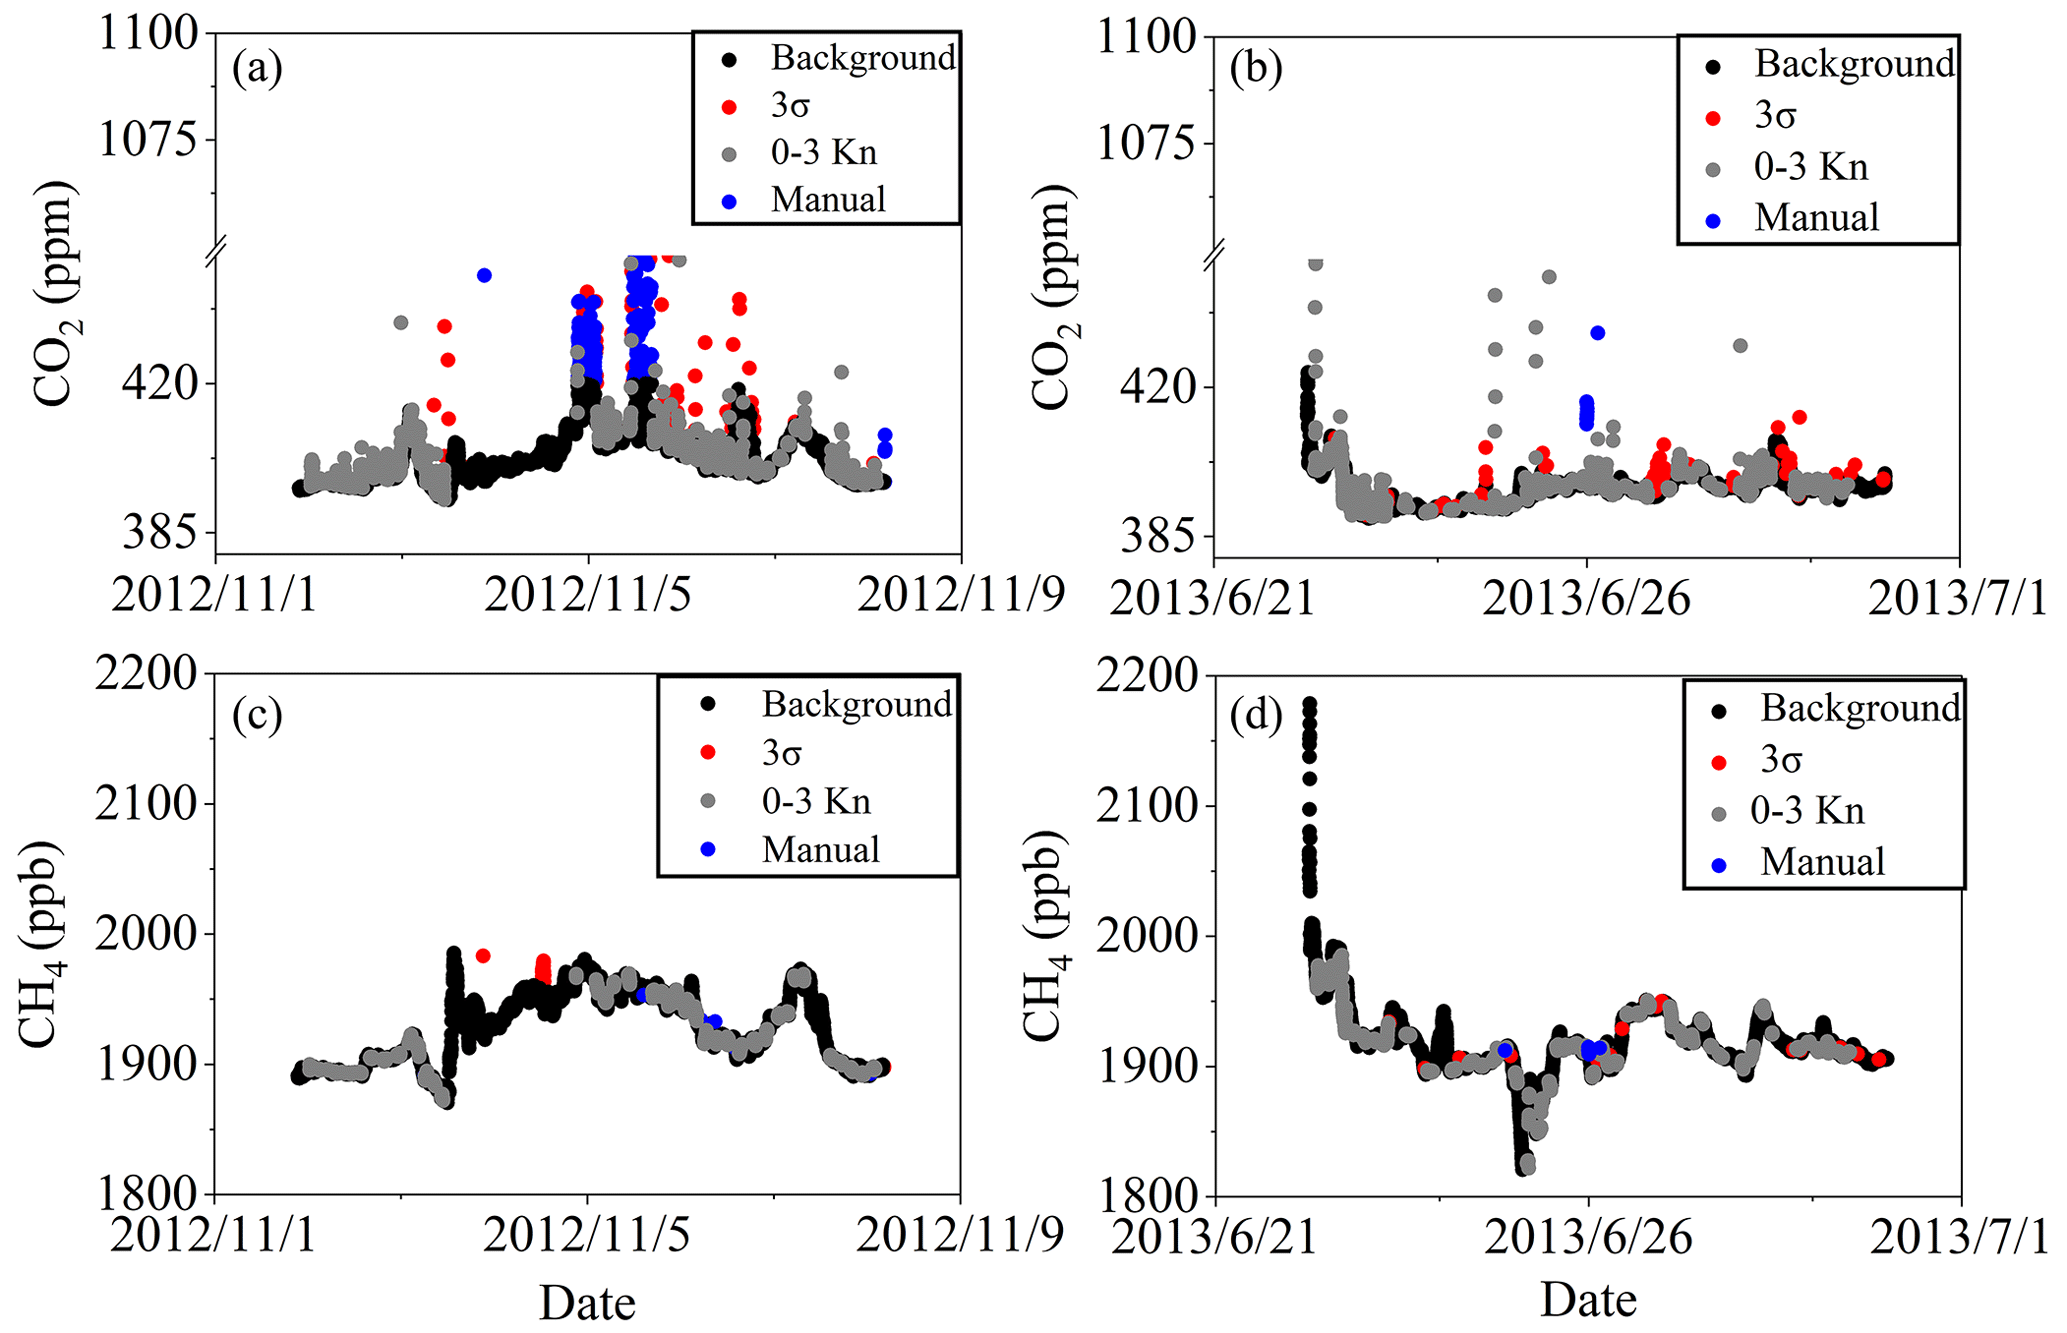
Figure 7Filtered results of CO2 (a, b) and CH4 (c, d) mixing ratios in November 2012 and June 2013. The ordinates of (a) and (b) are broken in the range of 450 to 1050 ppm. Black points represent the background data (Background). Blue points represent data influenced by replacing the dry tube that were manually flagged (Manual). Grey points represent the data influenced by ship emissions at low speed (less than 3 kn). Red points represent the data filtered out by the Pauta criterion (3σ).
Observed mean CO2 mixing ratios were 403.94 (±13.77) ppm and 395.90 (±3.53) ppm in November 2012 and June 2013, respectively, which were slightly lower than previous studies' mean values of 405 and 410 ppm in the SYS and ECS in March 2013 and March 2017, respectively (Zang et al., 2017; Liu et al., 2018). Moreover, the observed mean atmospheric CO2 mixing ratio was almost equal to results observed at the TAP (401.37 ppm) and JGS (403.77 ppm) stations, but approximately 9 ppm higher than the MBL CO2 reference (394.41 to 394.78 ppm in the latitude zone of 30 to 37∘ N) (https://gml.noaa.gov/ccgg/mbl/data.php, last access: 10 October 2022) in November 2012 and almost equal to results observed at the LAN (396.43 ppm) and JGS (398.10 ppm) stations and the MBL CO2 reference (397.38 to 397.92 ppm in the latitude zone of 30 to 37∘ N) in June 2013.
Observed mean CH4 mixing ratios were 1924.8 (±27.8) ppb and 1918.0 (±25.7) ppb in November 2012 and June 2013, respectively, which were slightly higher than historical data of 1915.5 ppb in the SYS in March 2013 (Zang et al., 2017) and higher than the MBL CH4 references of November 2012 (1869.5 to 1880.3 ppb) and June 2013 (1835.3 to 1846.6 ppb).
4.2 Influence of air–sea exchange on distribution of atmospheric CO2 and CH4 mixing ratios
Air–sea exchange is a dynamic process in which CO2 and CH4 molecules diffuse via the interface of surface seawater and overlying atmosphere. Sources and sinks of atmospheric CO2 and CH4 mean they were emitted from or absorbed by seawater. In fact, the magnitude of air–sea CO2 and CH4 exchange varied dramatically in spatial and temporal scale in coastal shallow seas (Yang et al., 2016; Gao et al., 2019). Generally, CO2 and CH4 emitted from the seawater into the air were difficult to trace by atmospheric measurements because they could dilute sharply (Schmale et al., 2005; Kourtidis et al., 2006; Zhai et al., 2014); only shallow seep areas and coastal regions could influence mixing ratios of local atmospheric CO2 and CH4 directly and be measured (Leifer et al., 2006; Luo et al., 2015). Even though the dissolved CO2 and CH4 were not observed in our field surveys, the published data showed that sea-to-air CO2 fluxes were 6.0 (±8.8) mmol m−2 d−1 in November 2012 and 2.6 (±4.3) mmol m−2 d−1 in June 2011 (Wang and Zhai, 2021), and sea-to-air CH4 fluxes were 6.4 in November 2002 and 15.7 in June 2006 (Zhang et al., 2008), respectively, in the SYS.
To estimate the effects of air–sea exchange on mixing ratios of atmospheric CO2 and CH4, we used a simple method described by Kourtidis et al. (2006) and optimised by Zang et al. (2020): assuming a box located above the survey area with a ceiling of 10 m, corresponding to the height of the air inlet in our field surveys. The contents of atmospheric CO2 and CH4 were only impacted by air–sea exchange. When CO2 and CH4 were vented into or absorbed from the box, their mixing ratios would increase or decrease homogeneously, caused by the mean calculated results of sea-to-air CO2 and CH4 fluxes.
Generally, coastal shallow seas are sources of atmospheric CH4, accounting for approximately 75 % of global ocean emissions (Bange et al., 1994). However, according to the calculation formula given by Zang et al. (2020), a sea-to-air CH4 flux of 50.8 could result in an increase of 2 ppb in the atmospheric CH4 mixing ratio in the MBL. Thus, the impacts of the reported mean sea-to-air CH4 fluxes (6.4 and 15.7 in November 2002 and June 2006) on the atmospheric CH4 would not exceed 1 ppb (Zhang et al., 2008). In addition, based on the same method, the impacts of the reported mean sea-to-air CO2 fluxes (Wang and Zhai, 2021) on the atmospheric CO2 mixing ratios were calculated and were no more than 14.1 ppb. Thus, it was reasonable to conclude that influences of air–sea exchange on the distribution of atmospheric CO2 and CH4 mixing ratios were low or negligible compared to the observed variability in atmospheric CO2 and CH4 (Figs. 3 and 4).
4.3 Influences of land–sea air mass transportation on spatiotemporal distribution of atmospheric CO2 and CH4 mixing ratios
The EAWM is closely related to atmospheric-compound transportation from the Asian continent to the western Pacific (Yu et al., 2014). Since two surveys were conducted in November 2012 and June 2013, when the typical winter and summer monsoon seasons were in their early phases, respectively (Lyu et al., 2021), the observation data could give us an ideal opportunity to study the impacts of land-to-sea air mass transportation on spatiotemporal distribution of atmospheric CO2 and CH4 mixing ratios over the SYS. Observed atmospheric CO2 and CH4 mixing ratios were higher in November 2012 (Fig. 8) than in July 2013 (Fig. 9). Except for the Section 1 (S1) and the right end of Section 2 (S2), the spatial distributions showed a decreasing trend with the increase in offshore distance. (Fig. 8).
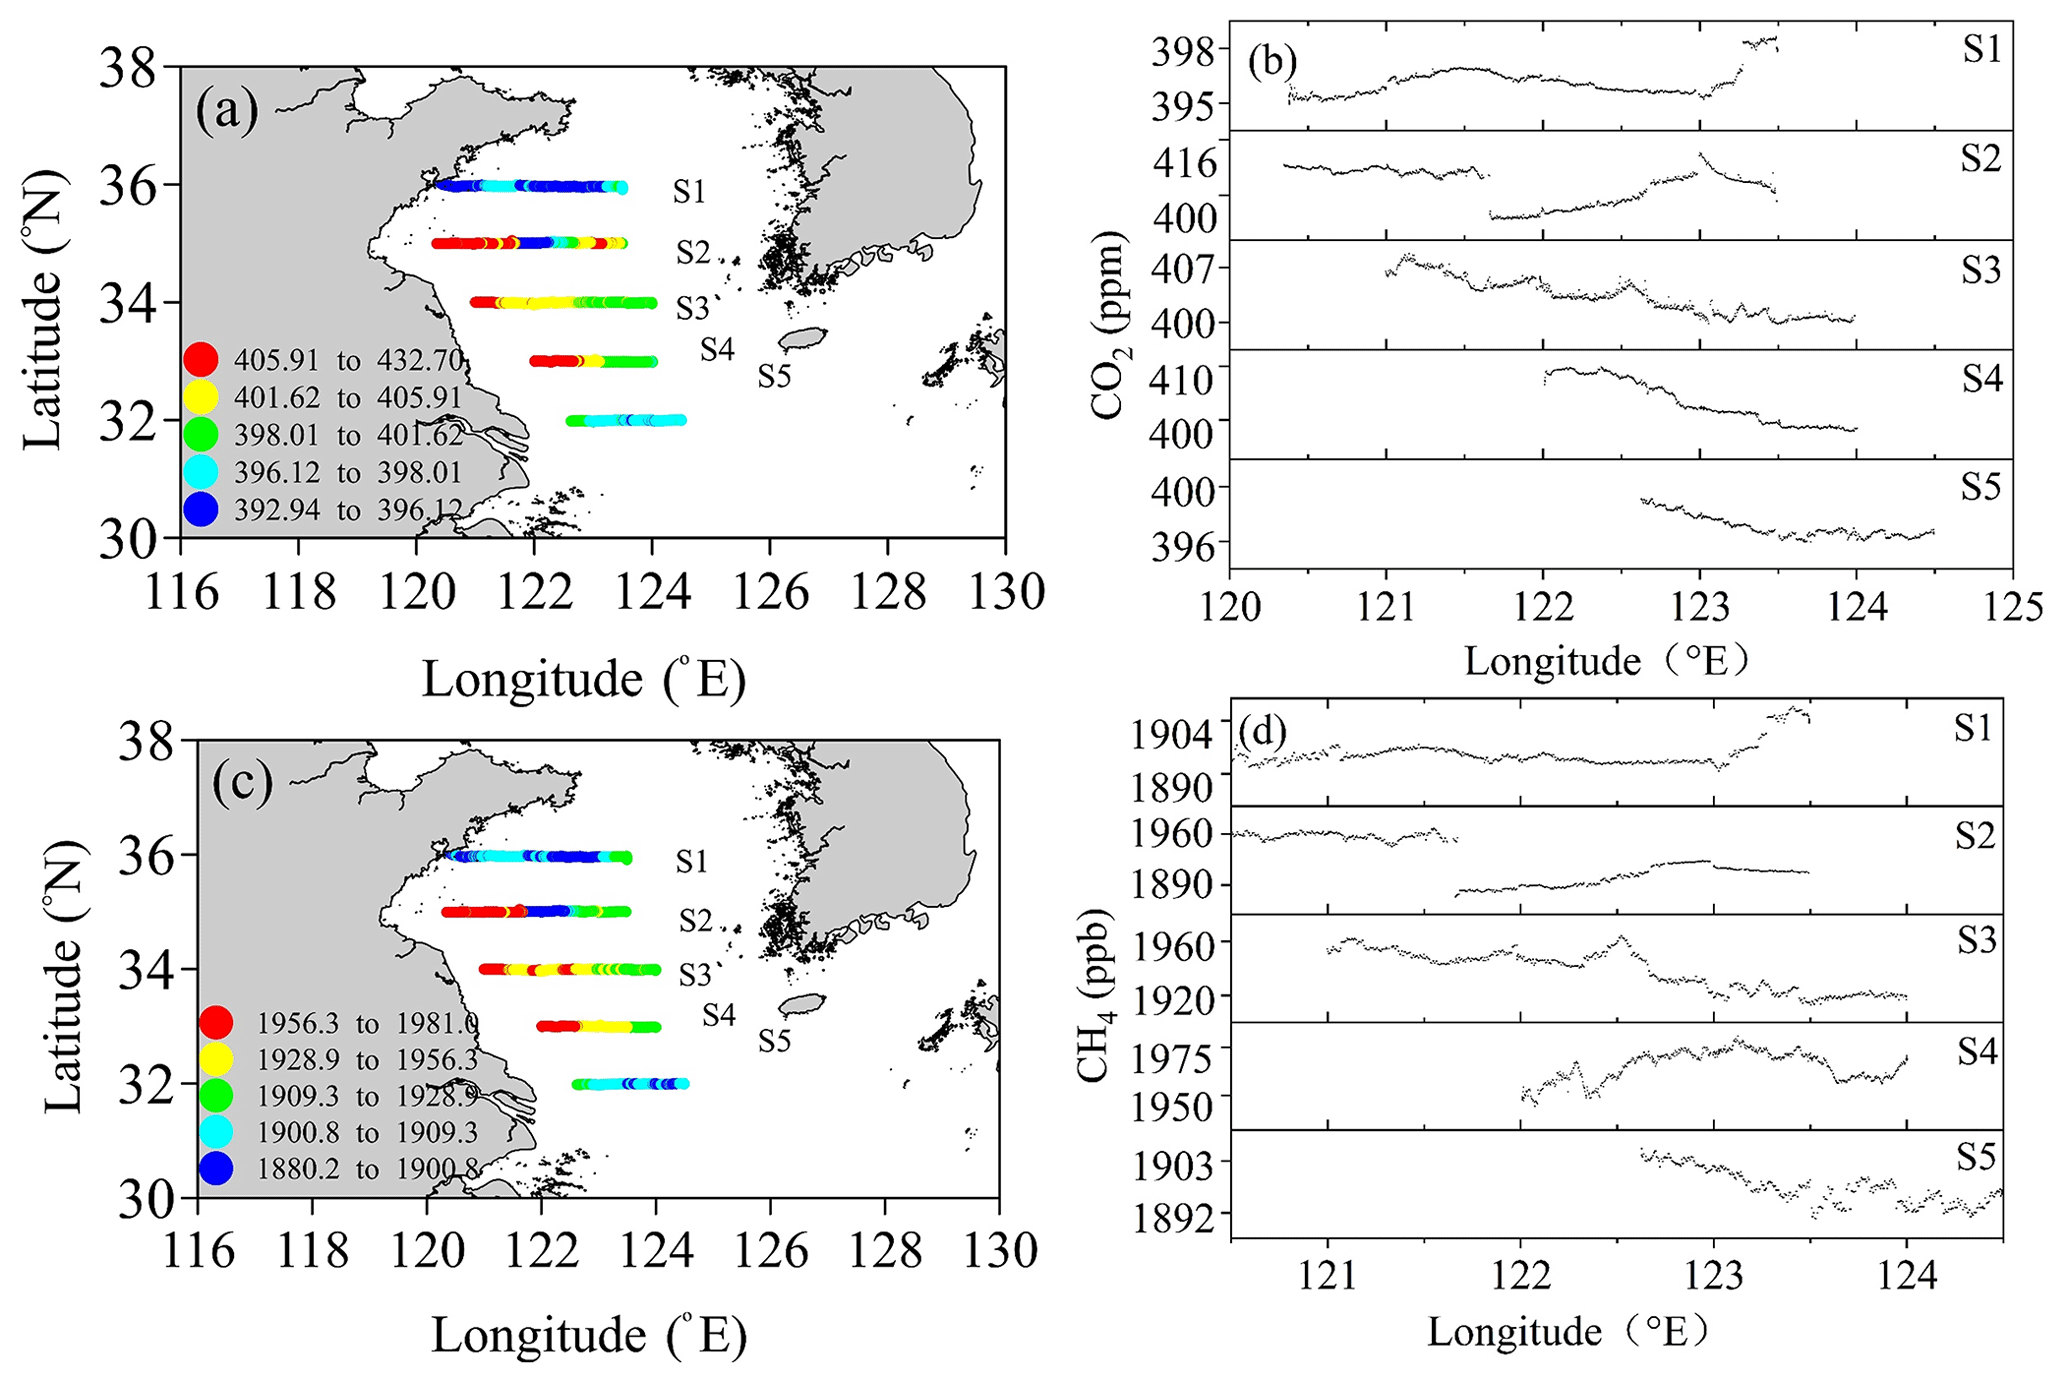
Figure 8Spatial distributions of CO2 and CH4 mixing ratios in the survey area in November 2012.
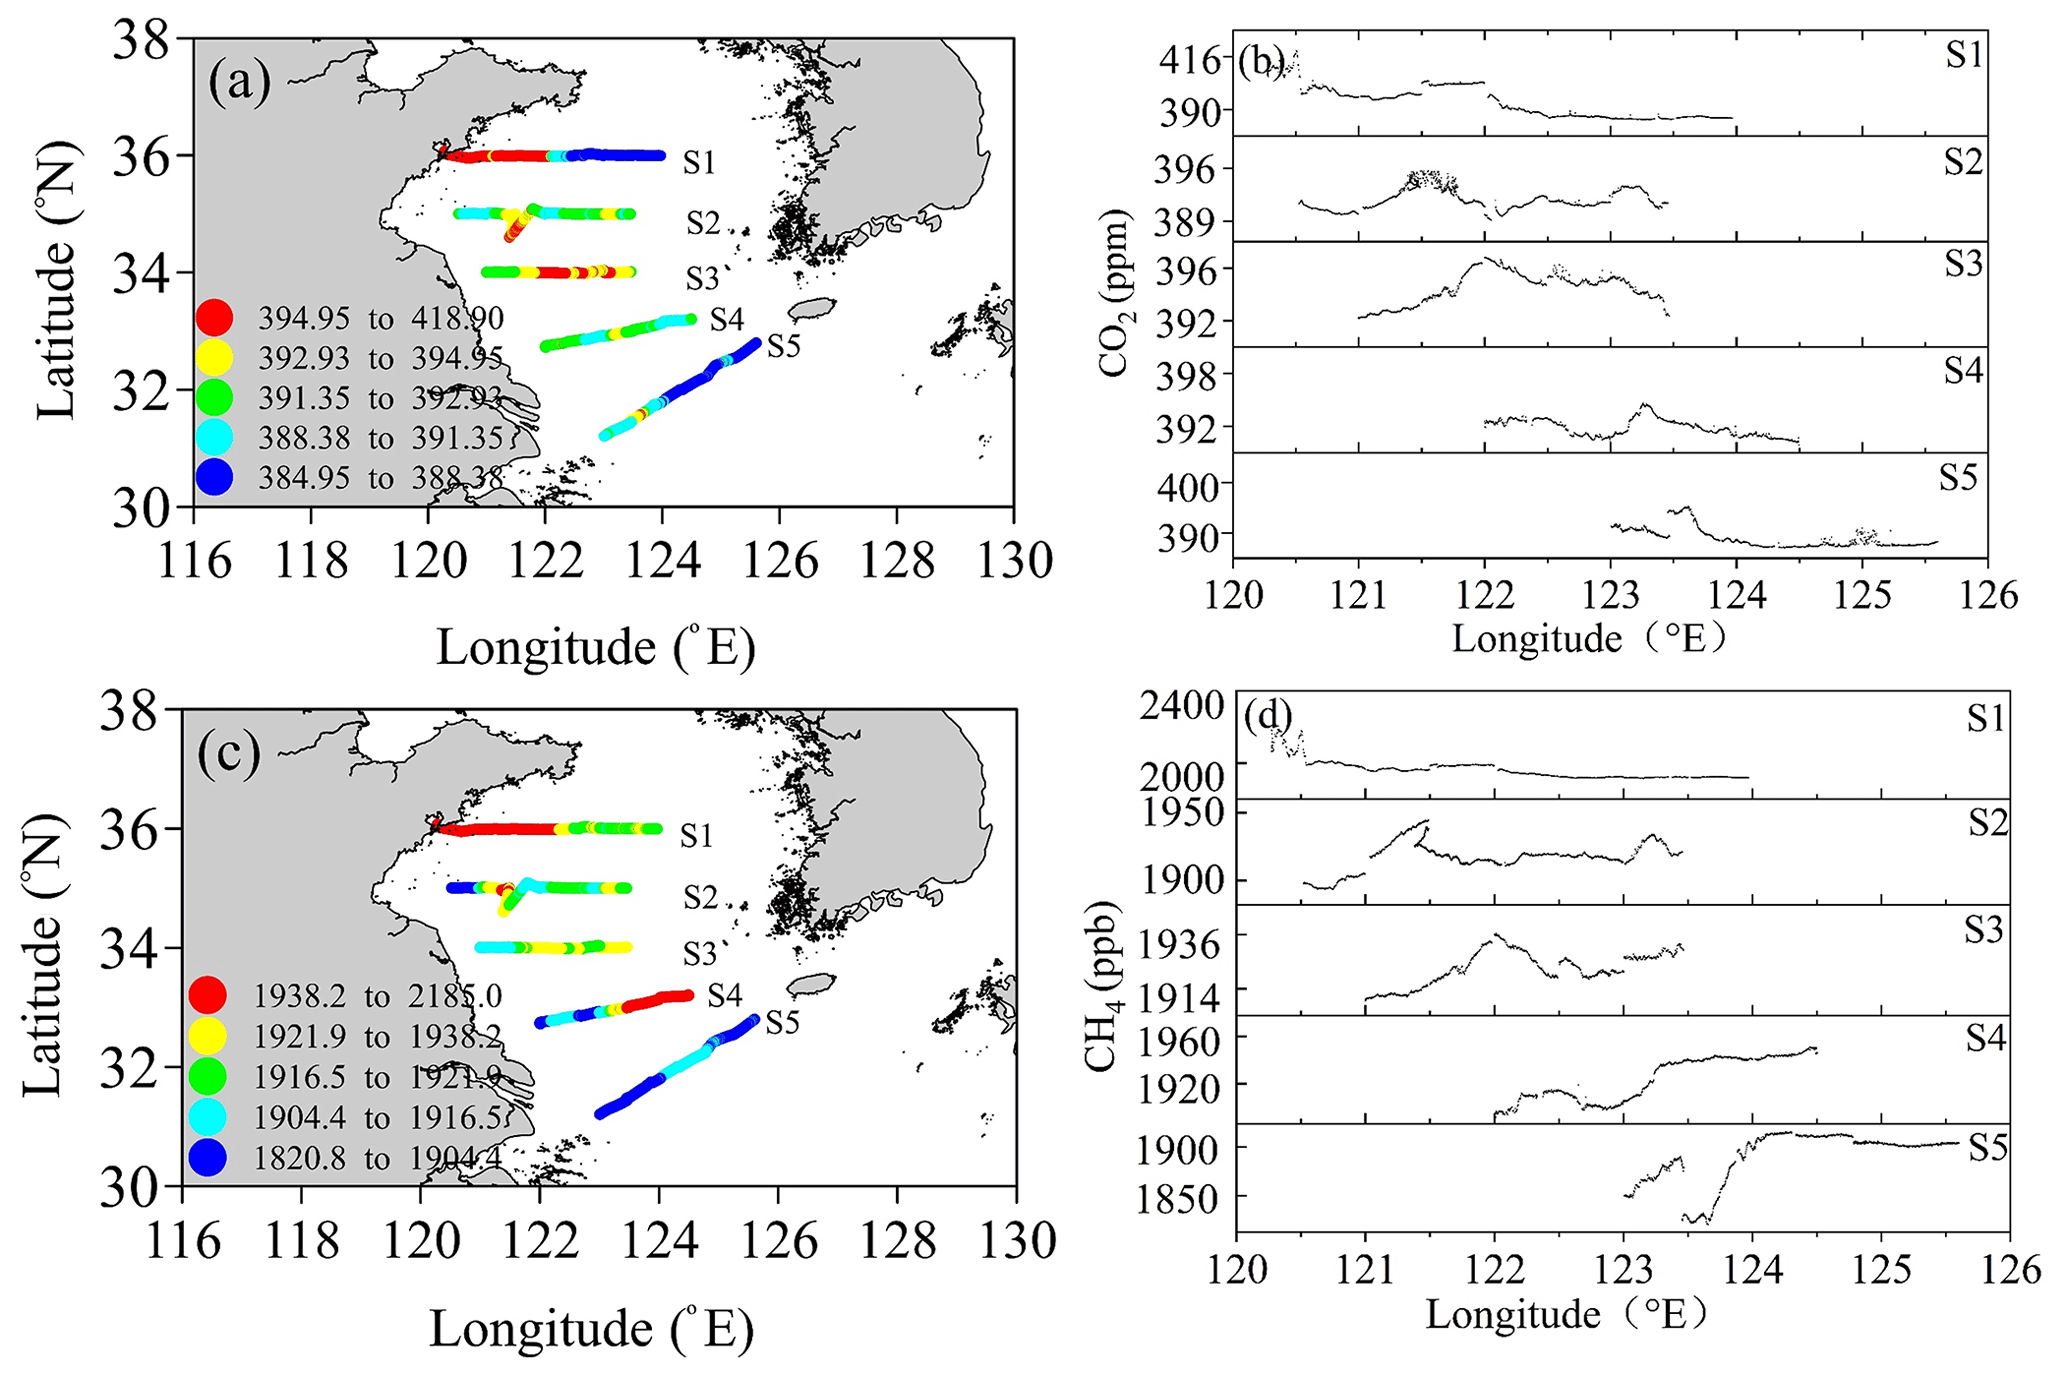
Figure 9Spatial distributions of CO2 and CH4 mixing ratios in the survey area in July 2013.
In-situ-observed data demonstrated that the dominant wind directions were W–NW–NNW for Sections S2, S3, S4 and S5 in November 2012, suggesting that the air masses were transported from the Asian continent to the Pacific Ocean (Fig. 5). Generally, CO2 and CH4 mixing ratios were higher on the continent than those of the MBL (Zhang et al., 2007; Zang et al., 2017; Liu et al., 2018). Land-to-sea air mass transportation driven by the EAWM could result in the horizontal transmission of greenhouse gases. Due to the subsequent mixing and dilution, CO2 and CH4 mixing ratios would decline along the route of wind transport (Bartlett et al., 2003; Kourtidis et al., 2006; Liu et al., 2018). Meanwhile, the mixing ratios of atmospheric CO2 and CH4 were low and homogeneous in Section S1 and the right end of Section 2 because the dominant wind directions were ENE–SE–S, indicating that air masses were transported from the open Pacific Ocean with low CO2 and CH4 content (Matsueda et al., 1996; Bartlett et al., 2003; Zang et al., 2017).
Furthermore, back-trajectory analysis showed that almost all the transport tracks originated from the Asian continent in November 2012 and the South China Sea and the western Pacific Ocean in July 2013 (typical characteristics of the early-summer monsoon) (Fig. 10), which resulted in higher atmospheric CO2 and CH4 mixing ratios in November 2012 (Fig. 8) than in July 2013 (Fig. 9). Seasonal variations in atmospheric CO2 and CH4 mixing ratios were consistent with the variations in atmospheric CO2 mixing ratios in the western Pacific Ocean, where atmospheric-component distributions were dominated by maritime air masses from the Pacific Ocean and polluted air masses from the Asian continent (Matsueda et al., 1996; Zhang et al., 2007; Liu et al., 2018).
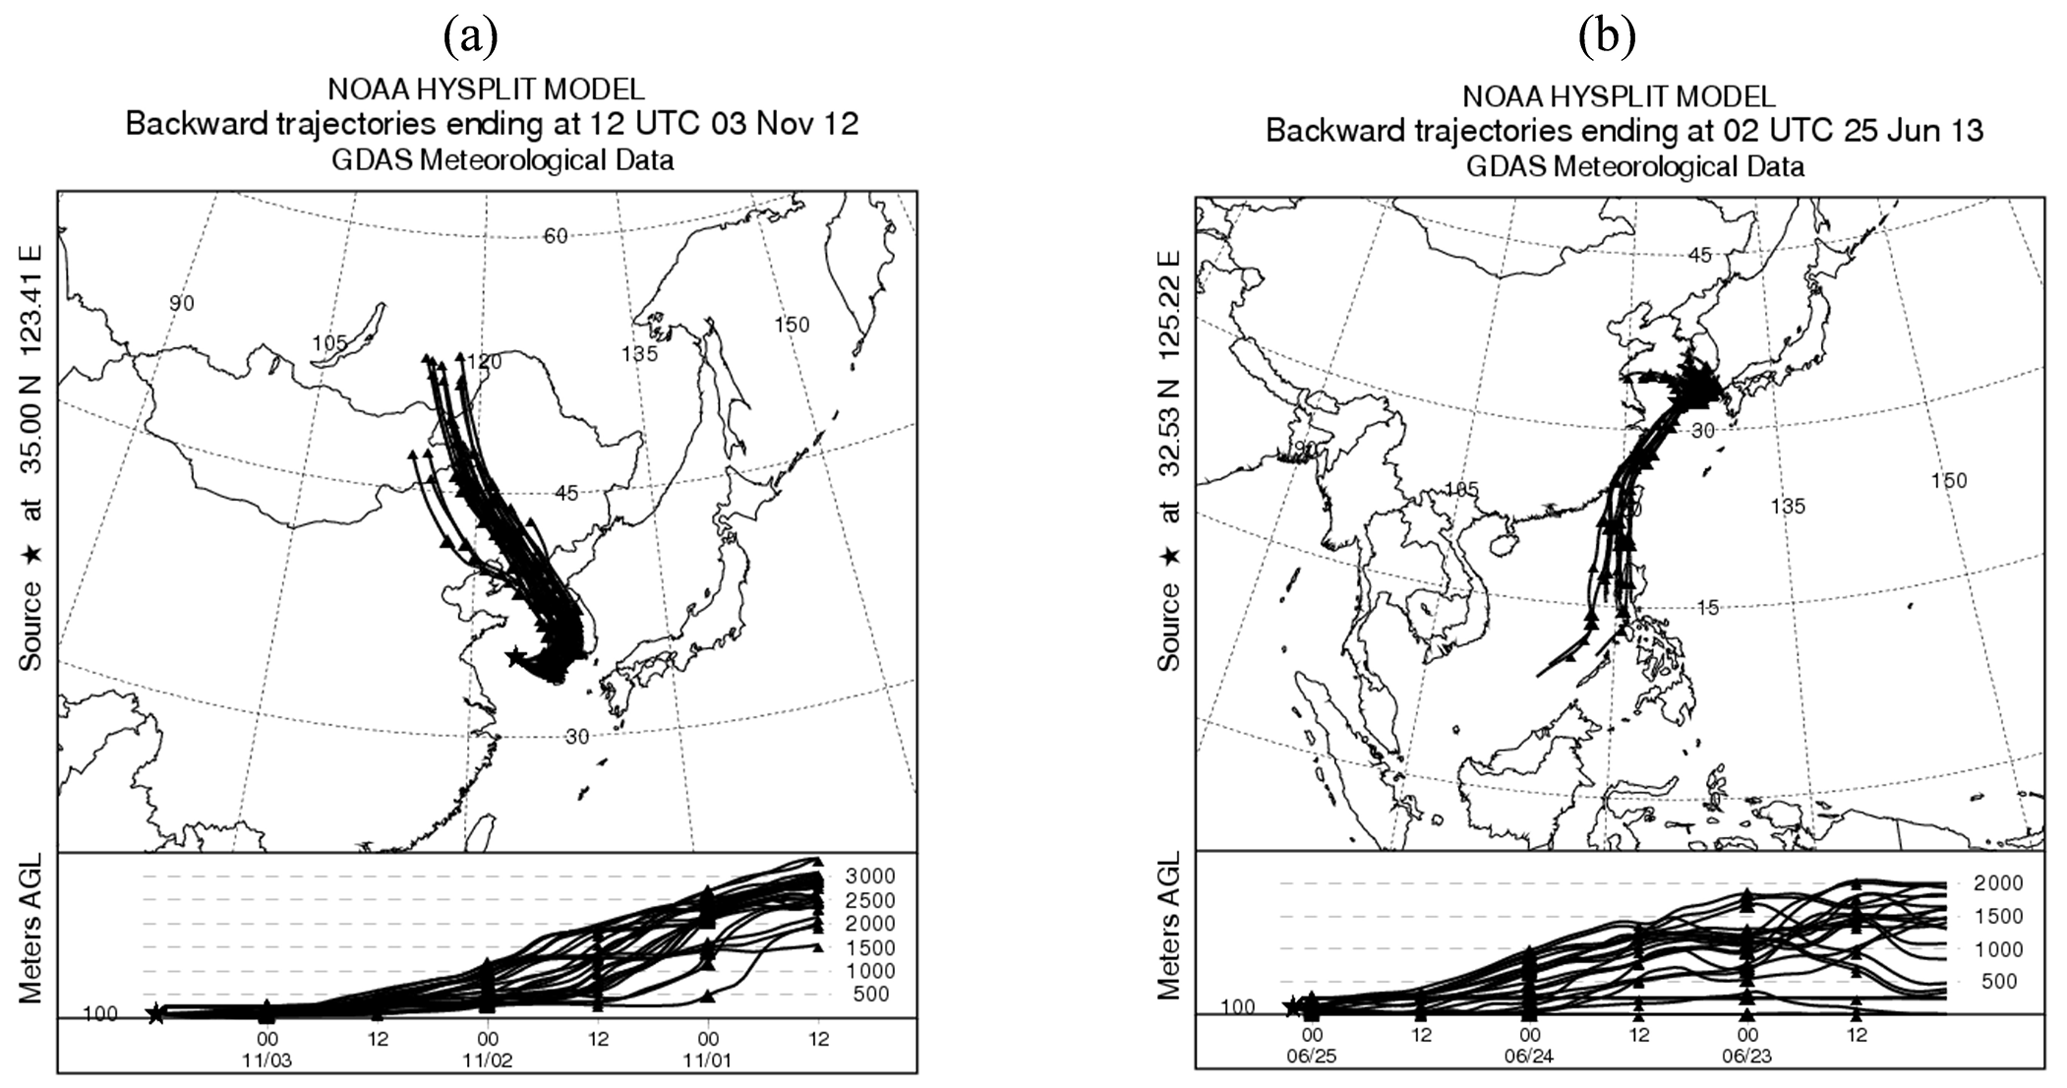
Figure 10The 3 d air back trajectories of two typical locations (a) 35.00∘ N, 123.41∘ E, and (b) 32.53∘ N, 125.22∘ E.
4.4 Estimated distance of land-to-sea air mass transportation
As shown in Fig. 11, atmospheric CO2 and CH4 mixing ratios observed in November 2012 showed the same fluctuating feature versus wind direction, indicating that their variations were dominated by the land-to-sea air mass transportation, which was in agreement with previous studies (Zhang et al., 2007; Zang et al., 2017, 2020; Liu et al., 2018).
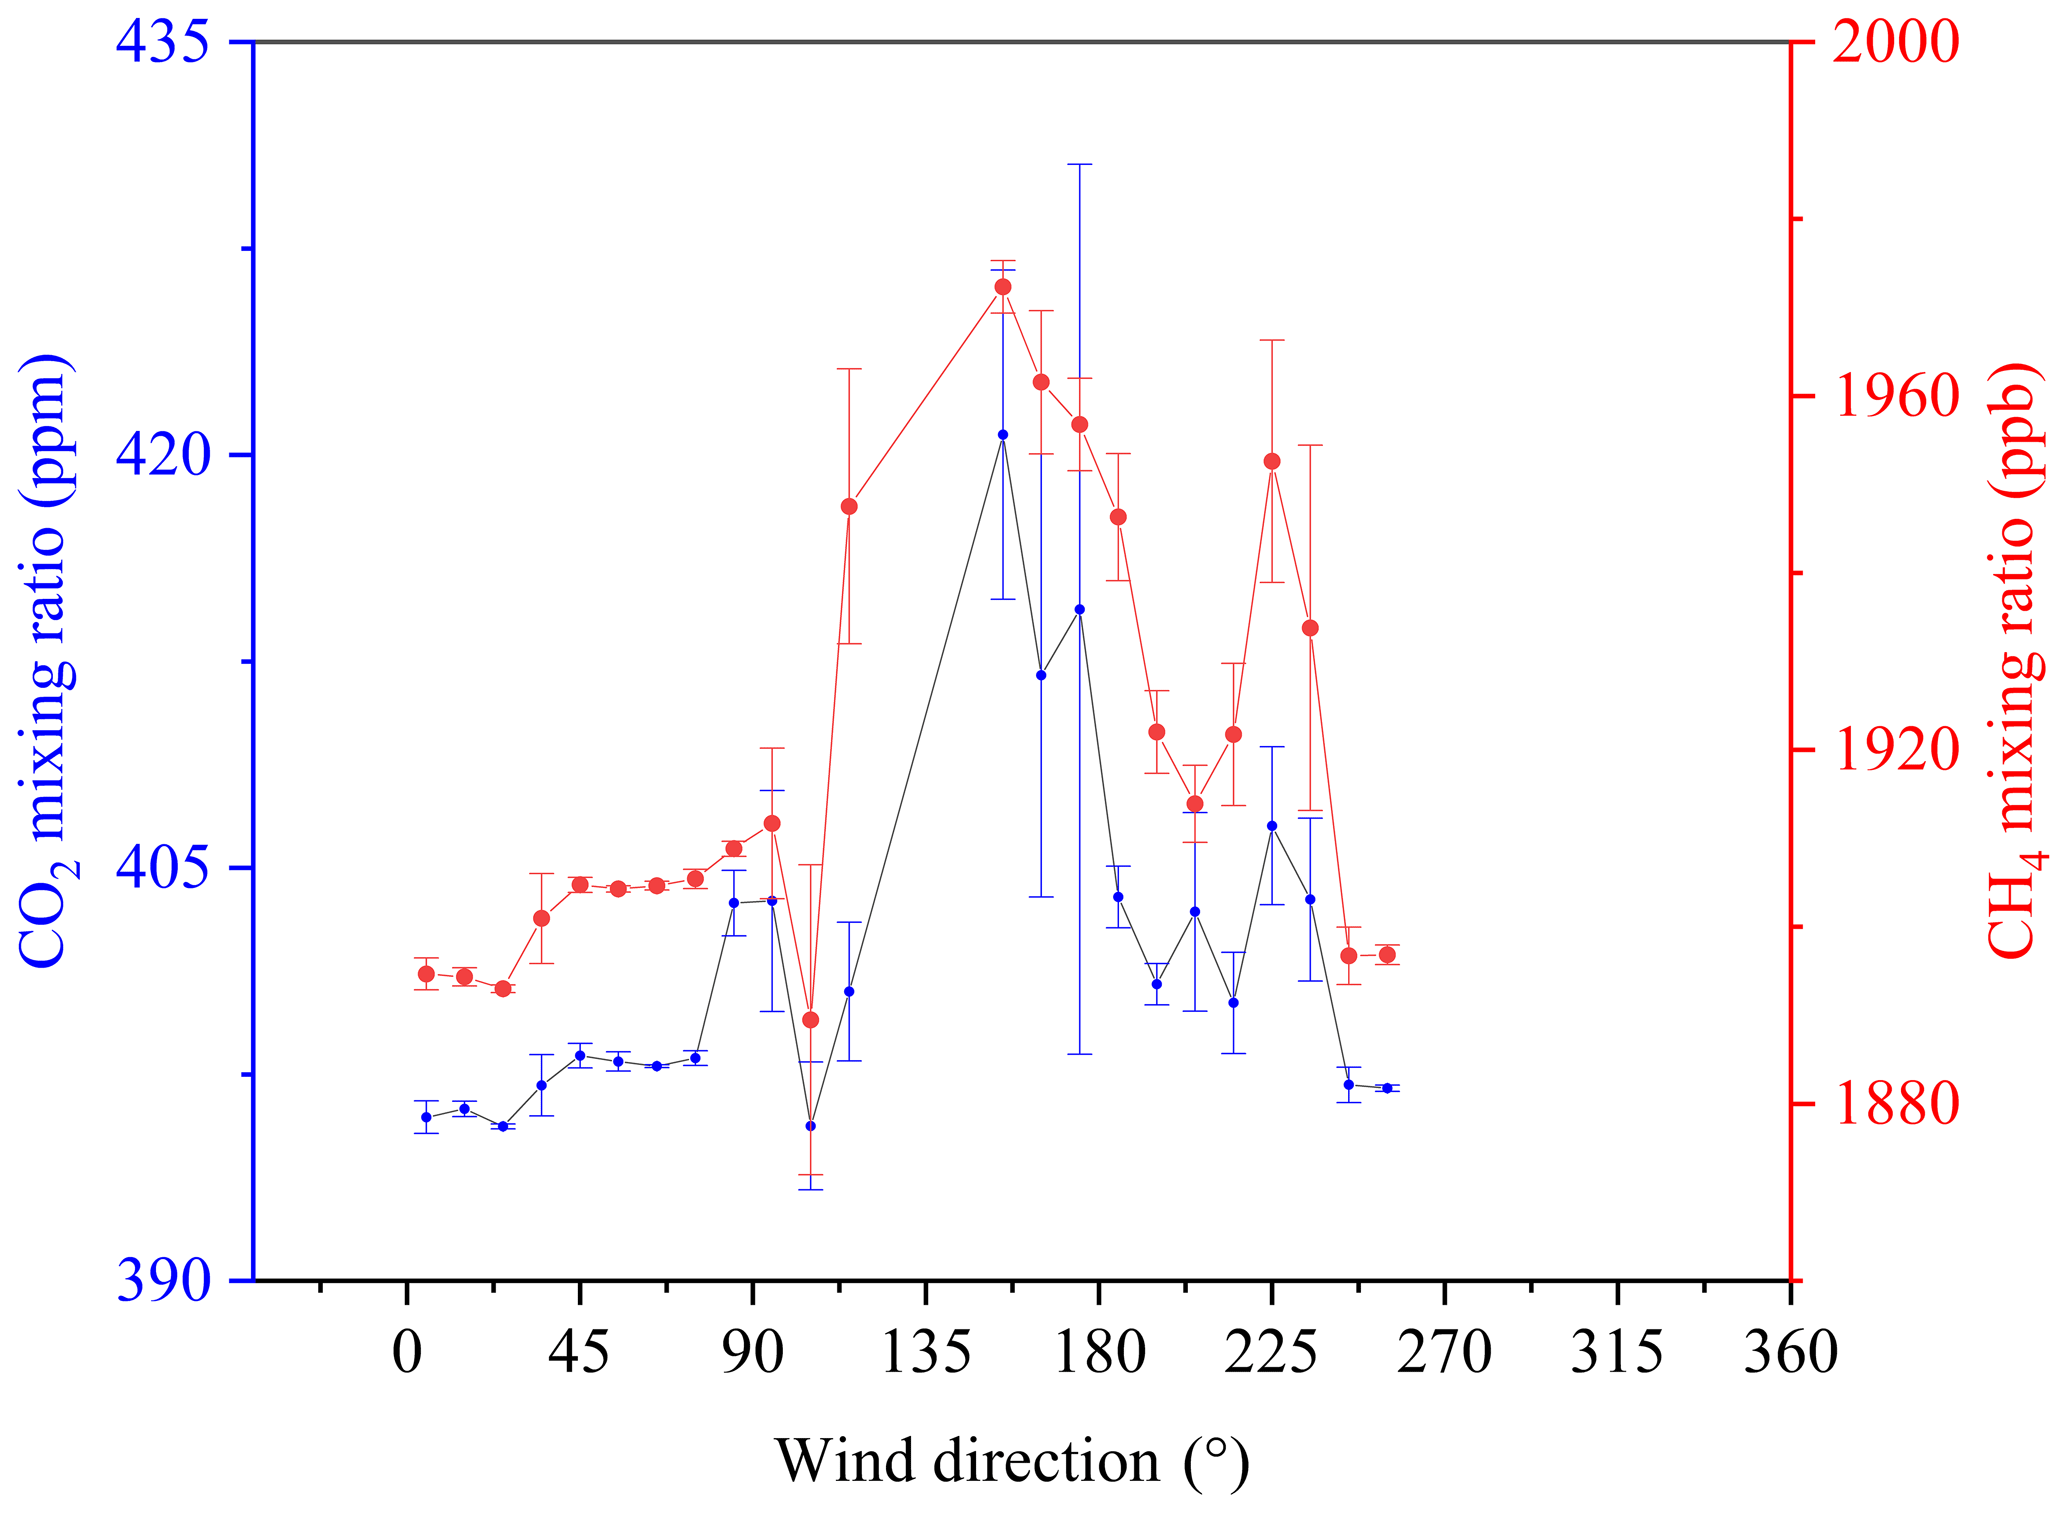
Figure 11Relationship between wind direction and atmospheric mixing ratios of CO2 and CH4, respectively. Error bars indicate standard deviations in each wind direction.
Simulation studies of gas seeps in the Black Sea and the Nord Stream pipeline gas leaks in the Baltic Sea showed that the atmospheric CH4 mixing ratio could be enhanced by the upwind emission source at a distance of 5 to 30 km (Kourtidis et al., 2006; Jia et al., 2022). The NOAA's MBL CO2 and MBL CH4 references were 394.56 ppm and 1875.4 ppb, respectively, in the same latitude zone as the survey area in November 2012. ΔCO2 and ΔCH4 represented deviations between observed atmospheric CO2 and CH4 mixing ratios and MBL CO2 and MBL CH4 references. As shown in Fig. 12, we assumed that the effects of mixing and dilution during the transportation were linear (Kourtidis et al., 2006). The further away the observation site is from the continent, the lower the ΔCO2 and ΔCH4 values are in each survey section. According to the calculated slope values, the gradient would be gradual at 123.30, 123.50 and 123.40∘ E for Section S3, S4 and S5, respectively. Moreover, the offshore distances away from the continent could be calculated as approximately 27.0, 26.3 and 11.7 km, respectively, with a mean value of 21.7 km. Thus, spatial distributions of atmospheric CO2 and CH4 mixing ratios in the China shelf sea could be impacted remarkably by land-to-sea air mass transportation during the early phase of the EAWM.
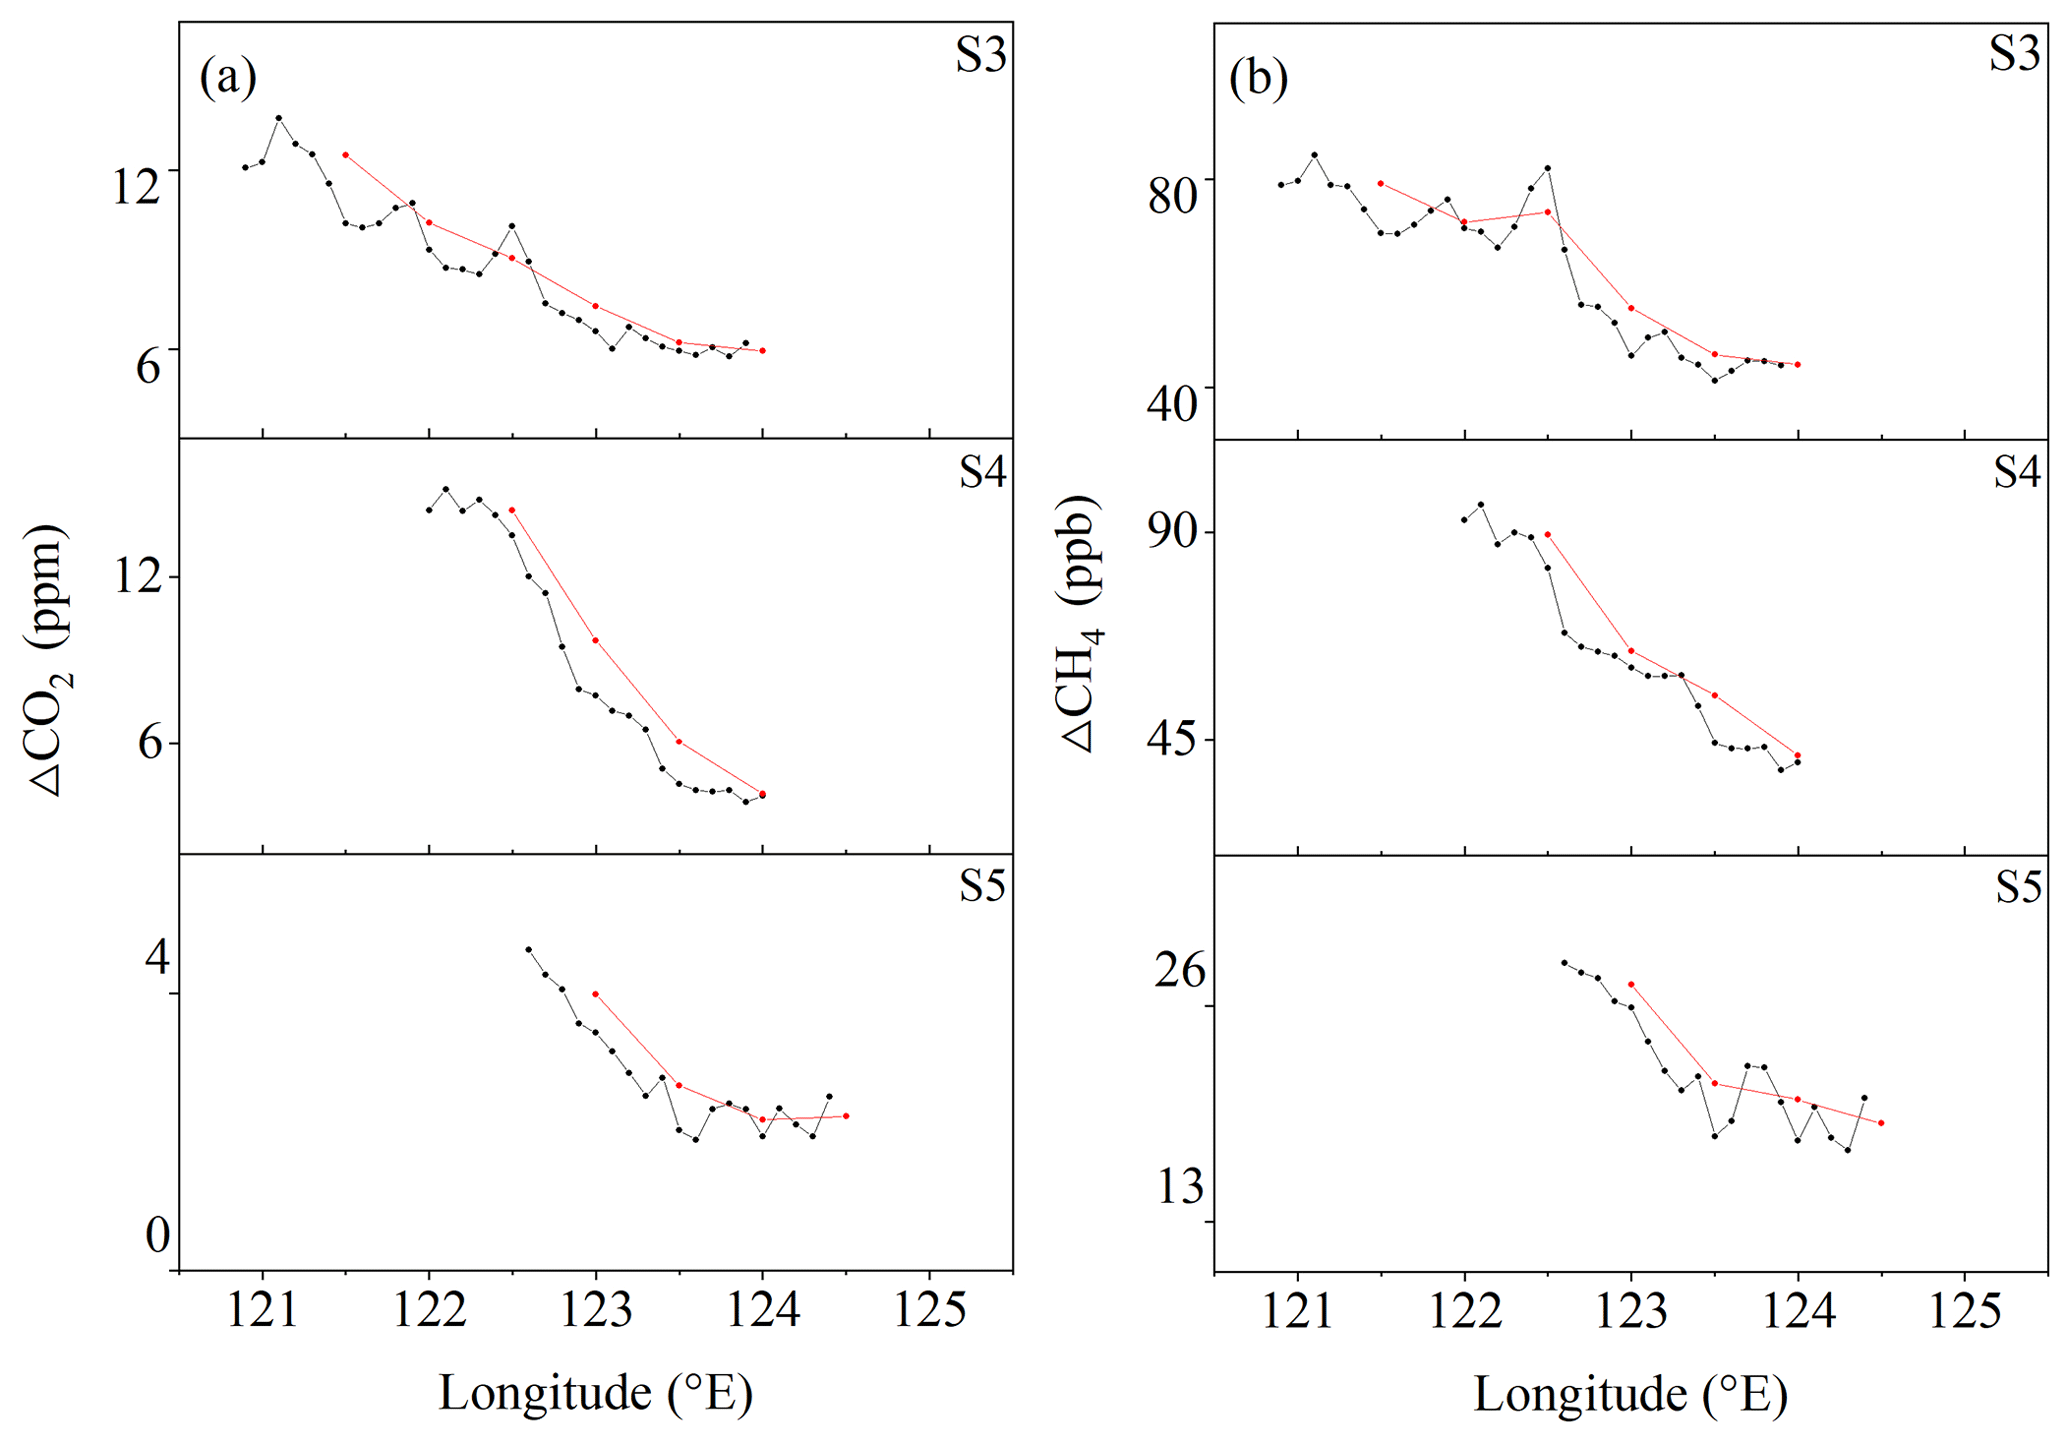
Figure 12The average value of ΔCO2 (a) and ΔCH4 (b) per 0.1∘ (black) or 0.5∘ longitude (red) in November 2012.
Based on the continuously observed shipborne atmospheric CO2 and CH4 mixing ratios and meteorological parameters over the SYS in November 2012 and June 2013, a data-filtering method was optimised and established, which could be used to flag CO2 and CH4 mixing ratios influenced by multiple natural processes and human activities. Spatial and seasonal variations in atmospheric CO2 and CH4 mixing ratios over the SYS were mainly regulated by the EAM, while the influence of air–sea exchange was low or negligible. The summer monsoon resulted in relatively low atmospheric CO2 and CH4 mixing ratios with a gradient increasing from south-east to north-west. Conversely, the winter monsoon enhanced land-to-sea air mass transportation with high atmospheric CO2 and CH4 mixing ratios, which induced decreasing patterns with increasing distance offshore. The effect of land-to-sea air mass transportation on enhanced CO2 and CH4 mixing ratios was estimated with a distance of approximately 20 km offshore during the early period of the EAWM.
The code that is used for figure plotting (Python) can be provided upon request from the corresponding authors (zangkunpeng@zjut.edu.cn, fangsx@zjut.edu.cn).
The ERA5 hourly data on pressure levels are provided at https://doi.org/10.24381/cds.bd0915c6 (Hersbach et al., 2023). The simulated MBL values are produced by the NOAA (https://gml.noaa.gov/aftp/data/trace_gases/, NOAA Global Monitoring Laboratory, 2022).
JL prepared the main part of the paper and performed the corresponding analyses. KZ provided the original data that are used within this study and helped with the data analyses and the preparation of the paper. YL, YC, SL, HoX and YJ provided valuable comments on data processing as well as help in the drawing of Fig. 5. SF, SQ and KJ made suggestions for revising the paper and further standardised the paper. HaX, XQ and HH helped download the MBL reference data.
The contact author has declared that none of the authors has any competing interests.
Publisher’s note: Copernicus Publications remains neutral with regard to jurisdictional claims in published maps and institutional affiliations.
This article is part of the special issue “Profiling the atmospheric boundary layer at a European scale (AMT/GMD inter-journal SI)”. It is not associated with a conference.
The authors wish to thank the crew of the RV Dongfanghong II for their assistance on board. We also thank Edward J. Dlugokencky and colleagues from the Tae-ahn Peninsula station, Jeju Gosan station and Lin'an station. This work was supported by the National Key Research and Development Program of China (project no. 2020YFA0607501); the National Natural Science Foundation of China (project no. 42275113); the Special Support Plan for High-level Talents in Zhejiang Province (project no. 2021R542048); the Joint Funds of the Zhejiang Provincial Natural Science Foundation of China under grant no. LZJMZ23D050002; the Fund of the Key Laboratory of Global Change and Marine-Atmospheric Chemistry, MNR (project no. GCMAC2001); and the Basic Public Welfare Research Program of Zhejiang Province (project no. LGF22D050004).
This work was supported by the National Key Research and Development Program of China (project no. 2020YFA0607501), the National Natural Science Foundation of China (project no. 42275113), the Special Support Plan for High-level Talents in Zhejiang province (project no. 2021R542048), the Joint funds of the Zhejiang Provincial Natural Science Foundation of China under grant no. LZJMZ23D050002, the Fund of Key Laboratory of Global Change and Marine-Atmospheric Chemistry, MNR (project no. GCMAC2001) and the Basic Public Welfare Research Program of Zhejiang Province (project no. LGF22D050004).
This paper was edited by Anca Nemuc and reviewed by two anonymous referees.
Bange, H. W., Bartell, U. H., Rapsomanikis, S., and Andre, M. O.: Methane in the Baltic and North Seas and a Reassessment of the Marine Emissions of Methane, Global Biogeochem Cy., 8, 465–480, https://doi.org/10.1016/j.marchem.2008.02.005, 1994.
Bartlett, K. B., Sachse, G. W., Slate, T., Harward, C., and Blake, D. R.: Large-scale distribution of CH4 in the western North Pacific: Sources and transport from the Asian continent, J. Geophys. Res-Atmos., 108, 8807, https://doi.org/10.1029/2002JD003076, 2003.
Bouman, E. A., Lindstad, E., Rialland, A. I., and Stomman, A. H.: State-of-the-art technologies, measures, and potential for reducing GHG emissions from shipping-A review, Transport. Res. D-Tr. E., 52, 408–421, https://doi.org/10.1016/j.trd.2017.03.022, 2017.
Chang, C., Yi, L., and Chen, G. T.: A numerical simulation of vortex development during the 1992 east Asian summer monsoon onset using the navy's regional model, Mon. Weather Rev., 128, 1604–1631, https://doi.org/10.1175/1520-0493(2000)128<1604:ANSOVD>2.0.CO;2, 2000.
Crosson, E. R.: A cavity ring-down analyzer for measuring atmospheric levels of methane, carbon dioxide, and water vapor, App. Phys. B-Lasers O., 92, 403–408, https://doi.org/10.1007/s00340-008-3135-y, 2008.
Daube, B. C., Boering, K. A., Andrews, A. E., and Wofsy, S. C.: A high-precision fast-response airborne CO2 analyzer for in situ sampling from the surface to the middle stratosphere, J. Atmos. Ocean. Tech., 19, 1532–1543, 2002.
Ding, J., Van Der A, R. J., Mijling, B., Jalkanen, J. P., Johansson, L., and Levelt, P. F.: Maritime NOx emissions over Chinese Seas derived from satellite observations, Geophys. Res. Lett., 45, 2031–2037, https://doi.org/10.1002/2017GL076788, 2018.
Ding, Y. H., Liu, J. J., Sun, Y., Liu, Y., He, J., and Song, Y.: A study of the synoptic-climatology of the Meiyu system in East Asia, Chinese Journal of Atmospheric Sciences, 31, 1082–1101, 2007.
Dlugokencky, E. J., Myers, R. C., Lang, P. M., Masarie, K. A., Crotwell, A. M., Thoning, K. W., Hall, B. D., Elkins, J. W., and Steele, L. P.: Conversion of NOAA atmospheric dry air CH4 mole fractions to a gravimetrically prepared standard scale, J. Geophys. Res., 110, D18306, https://doi.org/10.1029/2005JD006035, 2005.
Fang, S., Tans, P. P., Yao, B., Luan, T., Wu, Y., and Yu, D.: Study of atmospheric CO2 and CH4 at Longfengshan WMO/GAW regional station: The variations, trends, influence of local sources/sinks, and transport, Sci. China Earth Sci., 60, 1886–1895, 2017.
Fang, S. X., Zhou, L. X., Masarie, K. A., Xu, L., and Rella, C. W.: Study of atmospheric CH4 mole fractions at three WMO/GAW stations in China, J. Geophys. Res.-Atmos., 118, 4874–4886, https://doi.org/10.1002/jgrd.50284, 2013.
Fang, S. X., Tans, P. P., Steinbacher, M., Zhou, L. X., and Luan, T.: Comparison of the regional CO2 mole fraction filtering approaches at a WMO/GAW regional station in China, Atmos. Meas. Tech., 8, 5301–5313, https://doi.org/10.5194/amt-8-5301-2015, 2015.
Gao, Z. M., Liu, H. P., and Mcfarland, D. P.: Mechanistic links between underestimated CO2 fluxes and non-closure of the surface energy balance in a semi-arid sagebrush ecosystem, Environ. Res. Lett., 14, 1748–9326, https://doi.org/10.1088/1748-9326/ab082d, 2019.
Hersbach, H., Bell, B., Berrisford, P., Biavati, G., Horányi, A., Muñoz Sabater, J., Nicolas, J., Peubey, C., Radu, R., Rozum, I., Schepers, D., Simmons, A., Soci, C., Dee, D., and Thépaut, J.-N.: ERA5 hourly data on pressure levels from 1940 to present, Copernicus Climate Change Service (C3S) Climate Data Store (CDS) [data set], https://doi.org/10.24381/cds.bd0915c6, 2023.
Huang, R. H.: The influence of the heat source anomaly over Tibetan Plateau on the northern hemispheric circulation anomalies, Acta. Meteorol. Sin., 43, 208–220, 1985.
Huang, R. H., Zhou, L. T., and Chen, W.: The progresses of recent studies on the variabilities of the East Asian monsoon and their causes, Adv. Atmos. Sci., 20, 55–69, 2003.
Jia, M., Li, F., Zhang, Y. Z., Wu, M. S., Li, Y. S., Feng, S. Z., Wang, H. M., Chen, H. L., Ju, W. M., Lin, J., Cai, J. W., Zhang, Y. G., and Jiang, F.: The Nord Stream pipeline gas leaks released approximately 220,000 tonnes of methane into the atmosphere, Environmental Science and Ecotechnology, 12, 2666–4984, https://doi.org/10.1016/j.ese.2022.100210, 2022.
Kong, S., Lu, B., Han, B., Bai, Z. P., Xu, Z., You, Y., Jin, L. M., Guo, X. Y., and Wang, R.: Seasonal variation analysis of atmospheric CH4, N2O and CO2 in Tianjin offshore area, Sci. China Earth Sci., 53, 1205–1215, https://doi.org/10.1007/s11430-010-3065-5, 2010.
Kourtidis, K., Kioutsioukis, I., McGinnis, D. F., and Rapsomanikis, S.: Effects of methane outgassing on the Black Sea atmosphere, Atmos. Chem. Phys., 6, 5173–5182, https://doi.org/10.5194/acp-6-5173-2006, 2006.
Law, C. S., Brévière, E., De Leeuw, G., Garçon, V., Guieu, C., Kieber, D. J., Kontradowitz, S., Paulmier, A., Quinn, P. K., Saltzman, E. S., Stefels, J., and Von Glasow, R.: Evolving research directions in Surface Ocean-Lower Atmosphere (SOLAS) science, Environ. Chem., 10, 1–16, https://doi.org/10.1071/EN12159, 2013.
Liu, Y. S., Zhou, L. X., Tans, P. P., Zang, K. P., and Cheng, S. Y.: Ratios of greenhouse gas emissions observed over the Yellow Sea and the East China Sea, Sci. Total Environ., 33, 1022–1031 https://doi.org/10.1016/j.scitotenv.2018.03.250, 2018.
Luo, X. F., Wei, H., Liu, Z., and Zhao, L.: Seasonal variability of air–sea CO2 fluxes in the Yellow and East China Seas: A case study of continental shelf sea carbon cycle model, Cont. Shelf Res., 107, 69–78, https://doi.org/10.1016/j.csr.2015.07.009, 2015.
Lyu, W. Z., Fu, T. F., Hu, Z. X., Tang, Y. Z., Chen, G. Q., Xu, X. Y., Chen, Y. P., and Chen, S. L.: Sedimentary dynamics of the central South Yellow Sea revealing the relation between east Asian Summer and Winter Monsoon over the past 6000 years, Front. Earth Sci., 9, 689508, https://doi.org/10.3389/feart.2021.689508, 2021.
Matsueda, H., Inoue, H. Y., Ishii, M., and Nogi, Y.: Atmospheric methane over the North Pacific from 1987 to 1993, Geochem. J., 30, 1–15, 1996.
Nara, H., Tanimoto, H., Tohjima, Y., Mukai, H., Nojiri, Y., and Machida, T.: Emissions of methane from offshore oil and gas platforms in Southeast Asia, Sci. Rep.-UK, 4, 6503, https://doi.org/10.1038/srep06503, 2014.
NOAA Global Monitoring Laboratory: The NOAA annual greenhouse gas index (AGGI), NOAA Earth System Research Laboratory, Boulder, Colorado, USA, https://esrl.noaa.gov/gmd/aggi/aggi.html (last access: 20 October 2022), 2014.
NOAA Global Monitoring Laboratory (GML): Simulated MBL values, NOAA GML [data set], https://gml.noaa.gov/aftp/data/trace_gases/, last access: 10 October 2022.
Peters, G., Marland, G., Le Quéré, C., Boden, T., Canadell, J. G., and Raupach, M. R.: Rapid growth in CO2 emissions after the 2008-2009 global financial crisis, Nat. Clim. Change., 2, 2–4, https://doi.org/10.1038/nclimate1332, 2012.
Rella, C. W., Chen, H., Andrews, A. E., Filges, A., Gerbig, C., Hatakka, J., Karion, A., Miles, N. L., Richardson, S. J., Steinbacher, M., Sweeney, C., Wastine, B., and Zellweger, C.: High accuracy measurements of dry mole fractions of carbon dioxide and methane in humid air, Atmos. Meas. Tech., 6, 837–860, https://doi.org/10.5194/amt-6-837-2013, 2013.
Riddick, S. N., Mauzerall, D. L., Celia, M., Harris, N. R. P., Allen, G., Pitt, J., Staunton-Sykes, J., Forster, G. L., Kang, M., Lowry, D., Nisbet, E. G., and Manning, A. J.: Methane emissions from oil and gas platforms in the North Sea, Atmos. Chem. Phys., 19, 9787–9796, https://doi.org/10.5194/acp-19-9787-2019, 2019.
Schmale, O., Greinert, J., and Rehder, G.: Methane emission from high-intensity marine gas seeps in the Black Sea into the atmosphere, Geophys. Res. Lett., 32, L07609, https://doi.org/10.1029/2004GL021138, 2005.
Wang, S. Y. and Zhai, W. D.: Regional differences in seasonal variation of air–sea CO2 exchange in the Yellow Sea, Cont. Shelf Res., 218, 104393, https://doi.org/10.1016/j.csr.2021.104393, 2021.
Warneke, T., de Beek, R., Buchwitz, M., Notholt, J., Schulz, A., Velazco, V., and Schrems, O.: Shipborne solar absorption measurements of CO2, CH4, N2O and CO and comparison with SCIAMACHY WFM-DOAS retrievals, Atmos. Chem. Phys., 5, 2029–2034, https://doi.org/10.5194/acp-5-2029-2005, 2005.
WMO: 14th WMO/IAEA Meeting of experts on carbon dioxide, other greenhouse gases and related tracers measurement techniques, Helsinki, Finland, 10–13 September 2007, GAW Report No. 186, 18 pp., 2007.
WMO: Greenhouse Gas Bulletin (GHG Bulletin): The state of greenhouse gases in the atmosphere based on global observations through 2021, No. 18, https://gaw.kishou.go.jp/publications/bulletin (last access: 15 October 2022), 2022.
Xia, L. J., Liu, L. X., Li, B. Z., and Zhou, L. X.: Spatial and temporal distribution characteristics of atmospheric CO2 in central China, China Environmental Science, 38, 2811–2819, https://doi.org/10.19674/j.cnki.issn1000-6923.2018.0294, 2018.
Yang, M., Bell, T. G., Hopkins, F. E., Kitidis, V., Cazenave, P. W., Nightingale, P. D., Yelland, M. J., Pascal, R. W., Prytherch, J., Brooks, I. M., and Smyth, T. J.: Air–sea fluxes of CO2 and CH4 from the Penlee Point Atmospheric Observatory on the south-west coast of the UK, Atmos. Chem. Phys., 16, 5745–5761, https://doi.org/10.5194/acp-16-5745-2016, 2016.
Yu, G., Chen, Z., Piao, S. L., Peng, C. H., Ciais, P., Wang, Q. F., Li, X. R., and Zhu, X. J.: High carbon dioxide uptake by subtropical forest ecosystems in the East Asian monsoon region, P. Natl. Acad. Sci. USA, 111, 4910–4915, https://doi.org/10.1073/pnas.1317065111, 2014.
Zang, K. P., Zhou, L. X., and Wang, J. Y.: Carbon Dioxide and Methane in the China Sea Shelf Boundary Layer observed by Cavity Ring-Down Spectroscopy, J. Atmos. Ocean. Tech., 34, 2233–2244, https://doi.org/10.1175/JTECH-D-16-0217.1, 2017.
Zang, K. P., Zhang, G., Xu, X. M., and Yao, Z. W.: Impact of air-sea exchange on the spatial distribution of atmospheric methane in the Dalian Bay and adjacent coastal area, China, Chemosphere, 251, 126412, https://doi.org/10.1016/j.chemosphere.2020.126412, 2020.
Zhai, W. D.: Sea surface partial pressure of CO2 and its controls in the northern south China Sea in the non-bloom period in spring, Haiyang Xuebao, 37, 31–40, https://doi.org/10.3969/j.issn.0253-4193.2015.06.004, 2015.
Zhai, W. D., Chen, J. F., Jin, H. Y., Li, H. L., Liu, J. W., He, X. Q., and Bai, Y.: Spring carbonate chemistry dynamics of surface waters in the northern East China Sea: Water mixing, biological uptake of CO2, and chemical buffering capacity, J. Geophys. Res.-Oceans, 119, 5638–5653, 2014.
Zhan, M. J., Sun, J. Y., Zhang, Y. M., Zhang, X. C., Nie, H., Deligeer, Kivekas, N., and Lihavainen, H.: The influence of air mass sources on the particle number concentration and the size distribution at Mt. Waliguan, Journal of Glaciology and Geocryology, 31, 659–663, 2009.
Zhan, R. F. and Li, J. P.: Influence of atmospheric heat sources over the Tibetan Plateau and the tropical western North Pacific on the inter-decadal variations of the stratosphere-troposphere exchange of water vapor, Sci. China Earth Sci., 51, 1179–1193, https://doi.org/10.1007/s11430-008-0082-8, 2008.
Zhang, G. L., Zhang, J., Ren, J. L., Li, J. B., and Liu, S. M.: Distributions and sea-to-air fluxes of methane and nitrous oxide in the North East China Sea in summer, Mar. Chem., 110, 42–55, https://doi.org/10.1016/j.marchem.2008.02.005, 2008.
Zhang, F., Chen, Y. J., Tian, C. G., Wang, X. P., Huang, G. P., Fang, Y., and Zong, Z.: Identification and quantification of shipping emissions in Bohai Rim, China, Sci. Total Environ., 497–498, 570–577, https://doi.org/10.1016/j.scitotenv.2014.08.016, 2014.
Zhang, J. Y., Song, S. H., Xu, R., and Wen, J. H.: Source of airborne particulate matter in Guilin based on backward trajectory model, Environmental Monitoring in China, 33, 42–46, https://doi.org/10.19316/j.issn.1002-6002.2017.02.07, 2017.
Zhang, S. P., Liu, J. W., Xie, S. P., and Meng, X. G.: The formation of a surface anticyclone over the Yellow and East China Seas in spring, J. Meteorol. Soc. Jpn., Ser. II, 89, 119–131, 2011.
Zhang, X. I. A., Nakazawa, T., Ishizawa, M., Aoki, S., Nakaoka, S. I., Sugawara, S., Maksyutov, S., Saeki T., and Hayasaka, T.: Temporal variations of atmospheric carbon dioxide in the southernmost part of Japan, Tellus B, 59, 654–663, 2007.
Zhang, Y., Deng, F., Man, H., Fu, M., Lv, Z., Xiao, Q., Jin, X., Liu, S., He, K., and Liu, H.: Compliance and port air quality features with respect to ship fuel switching regulation: a field observation campaign, SEISO-Bohai, Atmos. Chem. Phys., 19, 4899–4916, https://doi.org/10.5194/acp-19-4899-2019, 2019.
Zhang, Z. P. and Chu, Z. X.: Modern variations in clay minerals in mud deposits of the Yellow and East China Seas and their geological significance, Holocene, 28, 386–395, https://doi.org/10.1177/0959683617729446, 2018.
Zou, L., Hu, B., Li, J., Dou, Y. G., Xie, L. H., and Dong, L.: Middle Holocene Organic Carbon and biomarker records from the South Yellow Sea: relationship to the East Asian Monsoon, J. Ocean U. China, 17, 823–834, https://doi.org/10.1007/s11802-018-3521-y, 2018.