the Creative Commons Attribution 4.0 License.
the Creative Commons Attribution 4.0 License.
 | 30 Oct 2023
Ground-based Multi-AXis Differential Optical Absorption Spectroscopy (MAX-DOAS) observations of NO2 and H2CO at Kinshasa and comparisons with TROPOMI observations
Rodriguez Yombo Phaka
Alexis Merlaud
Gaia Pinardi
Martina M. Friedrich
Michel Van Roozendael
Jean-François Müller
Trissevgeni Stavrakou
Isabelle De Smedt
François Hendrick
Ermioni Dimitropoulou
Richard Bopili Mbotia Lepiba
Edmond Phuku Phuati
Buenimio Lomami Djibi
Lars Jacobs
Caroline Fayt
Jean-Pierre Mbungu Tsumbu
Emmanuel Mahieu
We present a database of MAX-DOAS (Multi-AXis Differential Optical Absorption Spectroscopy) ground-based observations of NO2 and H2CO tropospheric vertical column densities (VCDtropo) performed for the first time in the city of Kinshasa. These measurements were conducted between November 2019 and July 2021 and processed using the standardized inversion tools developed in the ESA FRM4DOAS (Fiducial Reference Measurements for Ground-Based DOAS Air-Quality Observations) project. The retrieved geophysical quantities are used to validate column observations from the TROPOspheric Monitoring Instrument (TROPOMI) over Kinshasa. In the validation, we experiment with three different comparison cases of increasing complexity. In the first case, a direct comparison between MAX-DOAS observations (hourly average of MAX-DOAS VCDtropo at overpass) and TROPOMI shows an underestimation of TROPOMI with a median bias of −38 % for NO2 and −39 % for H2CO based on monthly comparison. The second case takes into account the different vertical sensitivities of the two instruments and the a priori profile. We note significant changes in the median bias for both compounds: −12 % for NO2 and +11 % for H2CO. The third case builds on the second case by considering also the direction of sight of the MAX-DOAS. For this third case, we find a median bias of +44 % for NO2 and a median bias of +4 % for H2CO. However this case is impacted by low sampling and is considered less reliable. The findings from this study underscore the significance of employing a realistic a priori profile in TROPOMI column extraction, particularly within heavily polluted urban zones like Kinshasa. The investigation also highlights the necessity for prudence when integrating the MAX-DOAS line of sight due to the noise generated during subsampling and the limited horizontal sensitivity of MAX-DOAS observations. Importantly, the study further reveals the pronounced pollution levels of NO2, H2CO and aerosols in both the city of Kinshasa and its adjacent regions, underscoring the imperative for consistent monitoring and effective regulatory measures by local authorities.
- Article
(4162 KB) - Full-text XML
-
Supplement
(974 KB) - BibTeX
- EndNote


The population explosion in Africa is a growing source of environmental problems. In particular, many African cities are increasingly affected by air pollution, so air quality in African urban areas is expected to deteriorate in the coming decades with a strong impact on human health (Liousse et al., 2014). NOx (sum of NO and NO2) and formaldehyde (H2CO) are important markers of this pollution. These compounds are also strongly emitted by fires and the biosphere; H2CO is also considered an excellent marker of biogenic volatile organic compound (VOC) emissions (Stavrakou et al., 2009; Bauwens et al., 2016). In the presence of VOCs, high NO2 concentrations lead to increased formation of O3 and aerosols (Crutzen, 1979). H2CO plays a primary role in the oxidative capacity of the atmosphere and affects the global CO balance (e.g., Fortems-Cheiney et al., 2012; Cheng et al., 2018). The VOCs and NO2 react in a nonlinear manner to form O3 in the atmosphere (e.g., Seinfeld and Pandis, 1998).
At the global scale, the main sources of NOx are combustion processes associated with traffic, industrial activities and home heating, whereas H2CO is formed during the atmospheric oxidation of methane and non-methane volatile organic compounds (NMVOCs) of biogenic, pyrogenic and anthropogenic origins (Seinfeld and Pandis, 1998). In tropical regions, particularly in Central Africa, major sources impacting NOx and H2CO include the seasonal biomass burning, the use of charcoal in cooking and road traffic, generally dominated by old smoke-emitting vehicles (Marais and Wiedinmyer, 2016). At present, relatively few studies have addressed NO2 and H2CO sources in Central Africa, and in situ measurements are generally lacking in tropical regions. Although nadir-looking UV–visible spaceborne sensors (e.g., TROPOspheric Monitoring Instrument, TROPOMI) do sample this region, current satellite datasets present biases with respect to independent measurements. For example, TROPOMI H2CO columns tend to systematically underestimate ground-based infrared remote-sensing data in polluted regions (Vigouroux et al., 2020). Regarding tropospheric NO2, columns validation studies indicate moderate underestimations at polluted midlatitude sites (e.g., Dimitropoulou et al., 2020; Zhao et al., 2020; Tack et al., 2021; Verhoelst et al., 2021; Poraicu et al., 2023). However, satellite measurements are poorly characterized in tropical regions.
The Democratic Republic of Congo (DRC), a country in the heart of the Congo Basin, has multiple sources of air pollutants. Alone, it accounts for 54 % of the Congo Basin rainforest, affected by deforestation due to the expansion of agriculture and increasing demand for firewood (Mayaux et al., 2013). The associated emissions can be observed from space by satellite. For example, De Smedt et al. (2015) found that H2CO column hotspots associated with vegetation fires in the region are among the highest in the world. Measurements in Bujumbura (Burundi) using the MAX-DOAS (Multi-AXis Differential Optical Absorption Spectroscopy) technique have shown that the local atmospheric composition is influenced by biogenic VOC emissions from the DRC (Gielen et al., 2014), even though this site is relatively far away from emission sources.
Kinshasa, the capital of the DRC, a large and rapidly expanding megacity of 12 million inhabitants in 2016 that is expected to reach 20 million by 2030 (UN, 2016), is not spared from air pollution problems (McFarlane et al., 2021). It has experienced a rapid increase in the number of motorcycles; a fleet dominated by old vehicles; poorly managed and largely unpaved roads; and, much like other large cities in Central Africa, poor-quality fuel. It is also surrounded by the vast forested areas of the Congo Basin, and most of its population uses charcoal for cooking. A recent study by Vohra et al. (2022), based on space-based observations, has shown that several large African megacities, including Kinshasa, are experiencing significant annual increases in NO2 due to emerging anthropogenic sources. It can also be seen that Kinshasa city center, where most activities take place (traffic, markets, businesses, etc.), is more affected than other parts of the city. In spite of the reported pollution increases, the lack of routine monitoring impedes the development of efficient policies aiming to improve air quality.
In May 2017, a single-axis DOAS system was installed on the roof of the Faculty of Sciences of the University of Kinshasa (UniKin) as part of a collaboration with the Belgian Institute for Space Aeronomy (BIRA-IASB). Based on measurements obtained from this instrument operated from 5 May 2017 to 1 November 2019, Yombo Phaka et al. (2021) identified the presence of a clear annual cycle in NO2 concentrations with higher values during the dry season. A good correlation was found with satellite measurements, although the latter seemed to be biased low compared to the ground-based measurements. In November 2019, the single-axis instrument was replaced by a new MAX-DOAS (Multi-AXis DOAS) system built at BIRA-IASB, significantly increasing the information content of the measurements. The geophysical quantities extracted from these measurements are tropospheric column densities (VCDtropo) and vertical profiles of NO2 and H2CO, as well as aerosol optical depths (AODs) and extinction profiles.
We present MAX-DOAS measurements conducted from November 2019 to July 2021. Vertical columns of NO2 and H2CO are used to validate co-located measurements from the TROPOMI instrument on board the Sentinel-5P (S5P) satellite, and the AOD measured by the MAX-DOAS instrument is compared with the Moderate Resolution Imaging Spectroradiometer (MODIS) satellite data. This paper is subdivided into four sections: Sect. 2 presents the observation site, the retrieval methodology and input parameters; Sect. 3 presents the resulting dataset, as well as comparisons of TROPOMI with MAX-DOAS; Sect. 4 discusses the differences between the datasets; and the final section presents the conclusions.
2.1 Site description and instrumental setup
Figure 1 presents the MAX-DOAS instrument installed on the roof of the Faculty of Science of the University of Kinshasa (UniKin: −4.42∘ S, 15.31∘ E; 315 m a.s.l.) and its surroundings. On clear-sky days during the dry season, the Lumumba tower is visible at 5.7 km from the site. During the wet season, Brazzaville is visible at about 16 km from the site. The reduction in visibility observed in the dry season is due to the presence of aerosols. The UniKin site is located about 5 km from downtown Kinshasa and about 10 km from the Congo River. More details on the city of Kinshasa and its characteristics are described in Yombo Phaka et al. (2021).
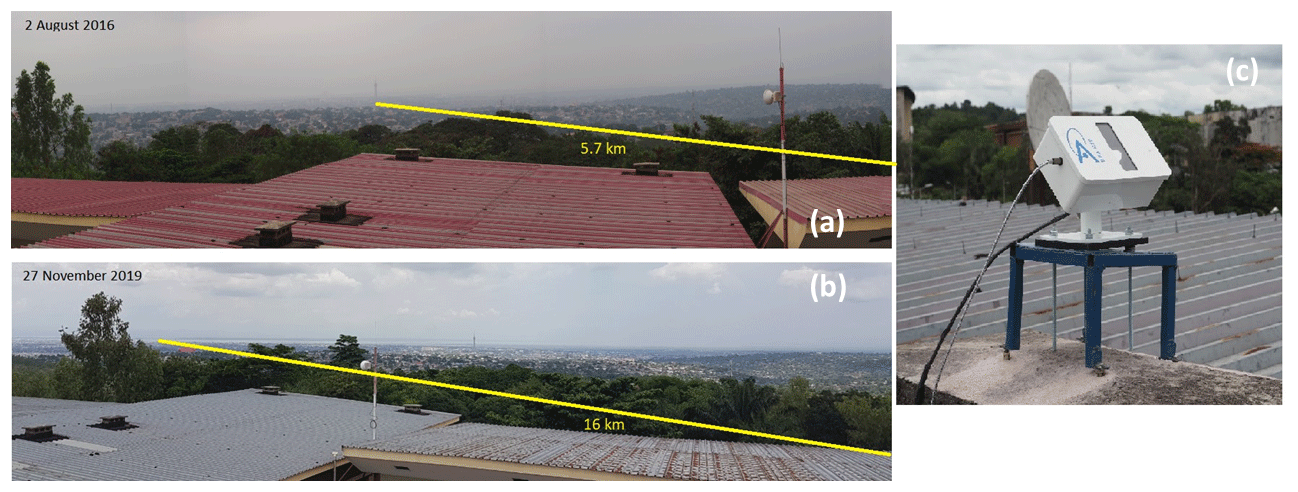
Figure 1The MAX-DOAS instrument as installed on the roof of the Faculty of Science of the University of Kinshasa (c). The yellow lines (a, b) point respectively to the Lumumba tower, visible at 5.7 km from the site, and the city of Brazzaville, visible at about 16 km on clear-sky days.
The MAX-DOAS is an upgrade of the single-axis DOAS instrument described in more detail in our previous study (Yombo Phaka et al., 2021). The spectrometer is an Avantes AvaSpec-ULS2048XL with a spectral range of 280–550 nm and a spectral resolution of 0.7 nm (full width at half maximum). Light enters the spectrometer through a lens connected to an optical fiber 600 µm in diameter. The upgrade first consisted of installing this spectrometer and a single-board computer (PC-104) in a box, which is air-cooled with a fan and equipped with a temperature sensor. This box is located under the roof of UniKin. Secondly and more importantly, we added an optical head on the roof to perform elevation scans. This optical head is based on a homemade box with dimensions of 22 × 14 × 8 cm3 mounted on a pod at 45∘ and pointing 5∘ W of north, i.e., towards the city. Light enters the box through a fused silica window and hits a flat elliptical mirror of minor axis 26.97 mm coated with enhanced aluminum. This mirror is attached to a Hitec servomotor (HS-7985MG) and scans between the horizon and zenith at multiple angles above the horizon (0, 1, 2, 3, 4, 5, 6, 7, 8, 15, 30, 45, 88∘). The mirror reflects the light to a fused silica plano-convex lens of 25 mm diameter and 50 mm focal length, which focuses the light on the optical fiber. In each mirror position, we accumulate light for 50 s leading to a total scan time of about 10 min.
2.2 Retrieval methodology
The retrieval of NO2 and H2CO tropospheric vertical column densities is performed using tools developed as part of the FRM4DOAS project (Fiducial Reference Measurements for Ground-Based DOAS Air-Quality Observations; https://frm4doas.aeronomie.be/, last access: 10 July 2023). FRM4DOAS is an international project funded by the European Space Agency (ESA) and aims at harmonizing and standardizing the data retrieval from MAX-DOAS instruments operated within the international Network for the Detection of Atmospheric Composition Change (NDACC). It incorporates community-based retrieval algorithms into a fully traceable, automated and quality-controlled processing environment.
Spectra recorded by the instruments are delivered in NetCDF4 format to a BIRA-IASB-hosted FTP server. The automated analysis steps which are performed depend on the type of measurement (zenith only or MAX-DOAS) and on the spectral coverage of the instrument and are predefined for each instrument. However, the processing always starts with the production of differential slant column densities (dSCDs) applying the QDOAS analysis tool (Danckaert and Fayt, 2017). The settings for QDOAS depend on the further processing, tropospheric or stratospheric retrieval (stratospheric NO2 or total ozone column), and instrument specifications and are described in the FRM4DOAS Algorithm Theoretical Basis Document (ATBD) (FRM4DOAS ATBD, 2017).
For the specific case of the MAX-DOAS retrievals in Kinshasa, we use three fitting windows: one for the retrieval of NO2 dSCDs and the oxygen-collision complex O2–O2 denoted by O4 dSCDs (in the visible spectral range), one for the retrieval of H2CO (in the UV), and one for O4 dSCDs in the UV range. Details of the retrieval settings are summarized in Table 1. Note that for the two fitting windows in the UV range, we also fit empirical spectral structures to correct for observed artifacts at low elevation angle (see Supplement).
Chance and Kurucz (2010)Vandaele et al. (1996)Serdyuchenko et al. (2014)Rothman et al. (2010)Thalman and Volkamer (2013)Meller and Moortgat (2000)Chance and Spurr (1997)Table 1Main QDOAS analytical parameters for the retrieval of NO2, O4Vis, H2CO and O4UV dSCD.
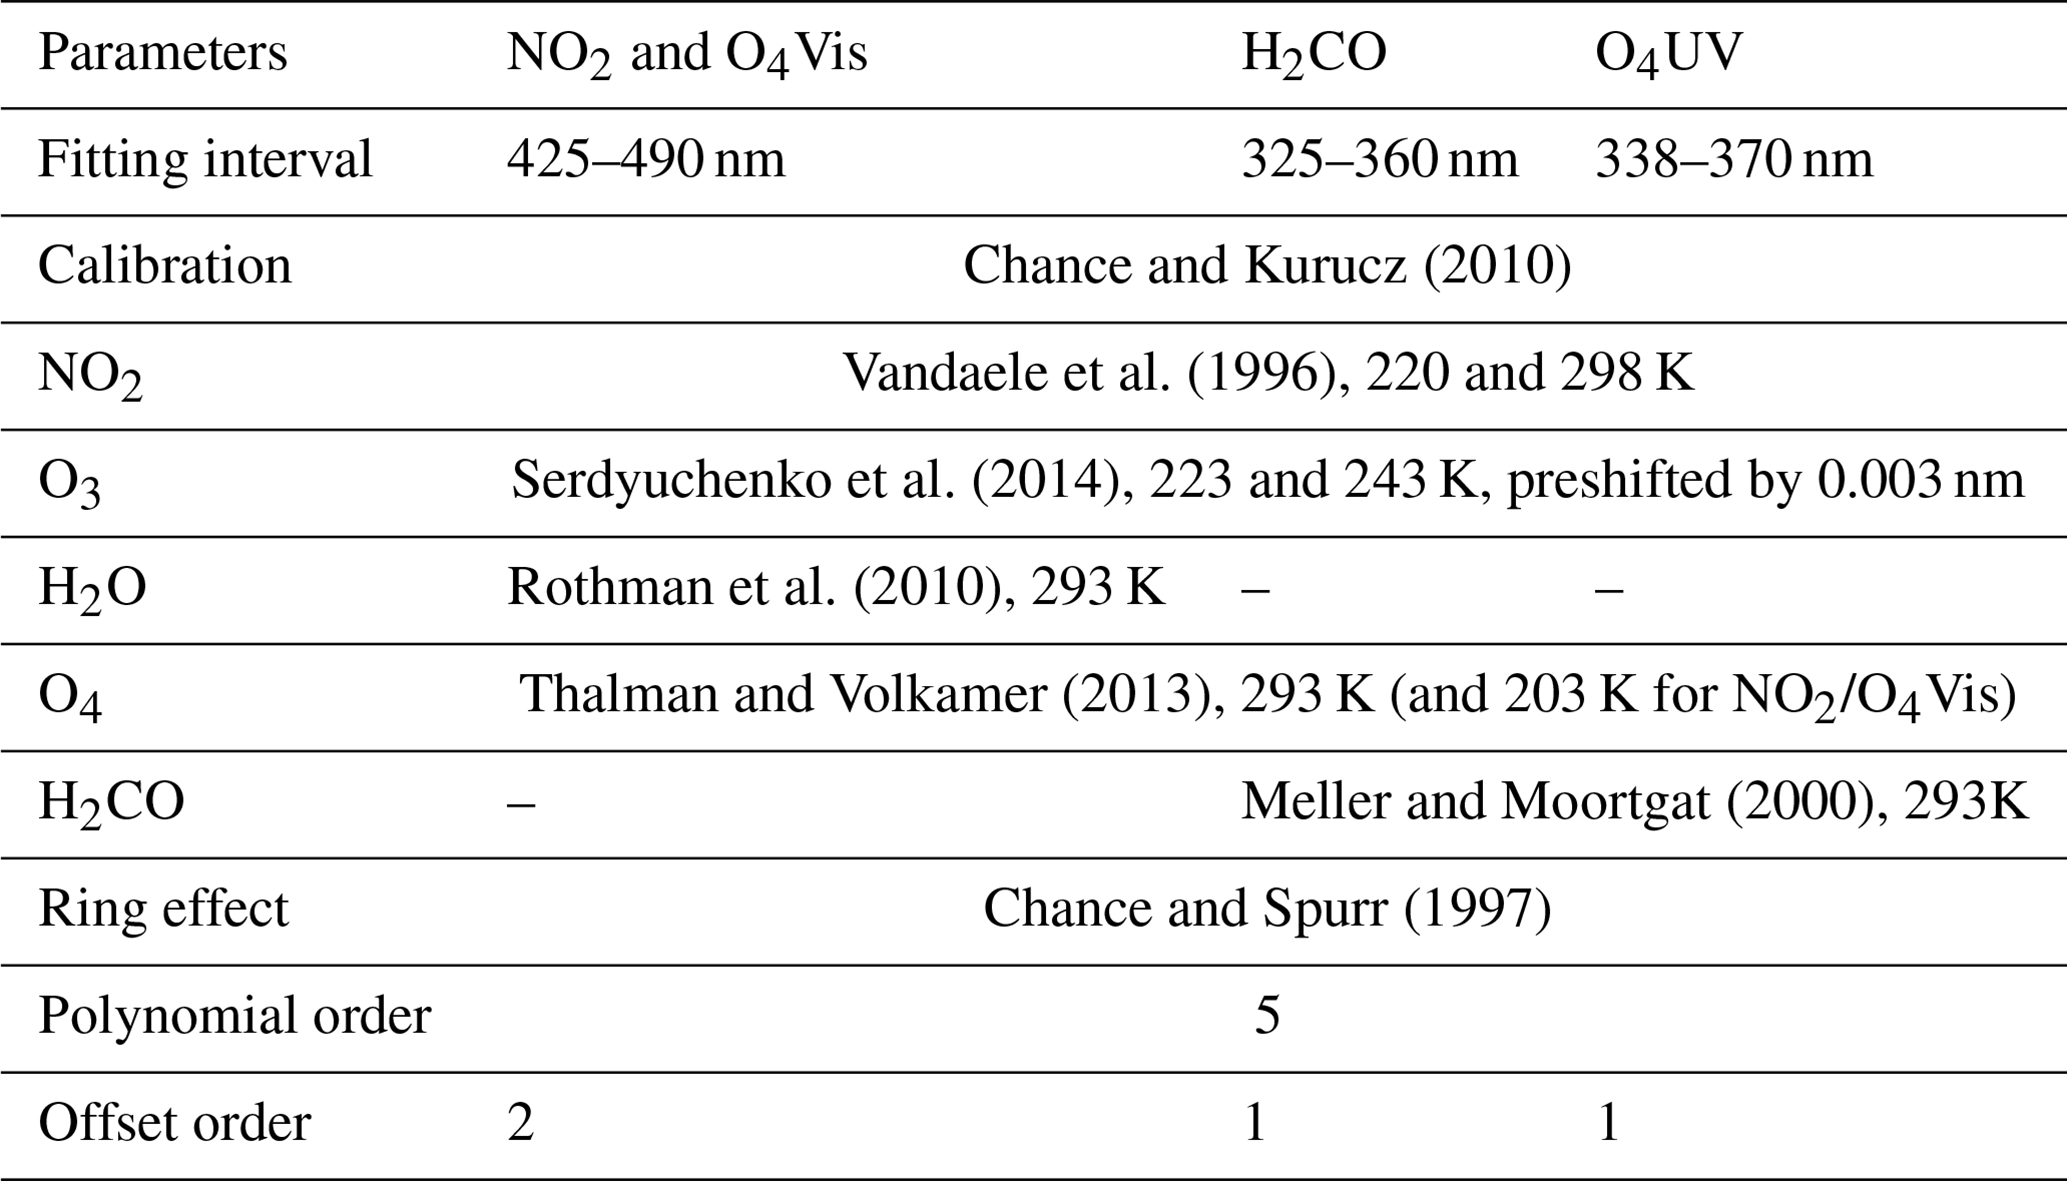
Figure 2 illustrates typical QDOAS fits in the four windows for a spectrum recorded on 20 February 2020 at 09:10 UTC. In each panel, the blue line shows the measured differential optical densities as a function of wavelength and the black curve shows the molecular cross-sections scaled to the measured data. From the DOAS fits, the FRM4DOAS system implements two MAX-DOAS retrieval algorithms: the Mainz Profile Algorithm (MAPA) (Beirle et al., 2019), which is based on a parametrization of the retrieval profile shape and a Monte Carlo approach for the inversion, and the Mexican MAX-DOAS Fit (MMF) (Friedrich et al., 2019), an optimal estimation-based algorithm using the radiative transfer code VLIDORT (Spurr, 2006) as the forward model. Both inversion algorithms have been extensively tested and validated using synthetic (Frieß et al., 2019) and real data (Tirpitz et al., 2021; Karagkiozidis et al., 2022).
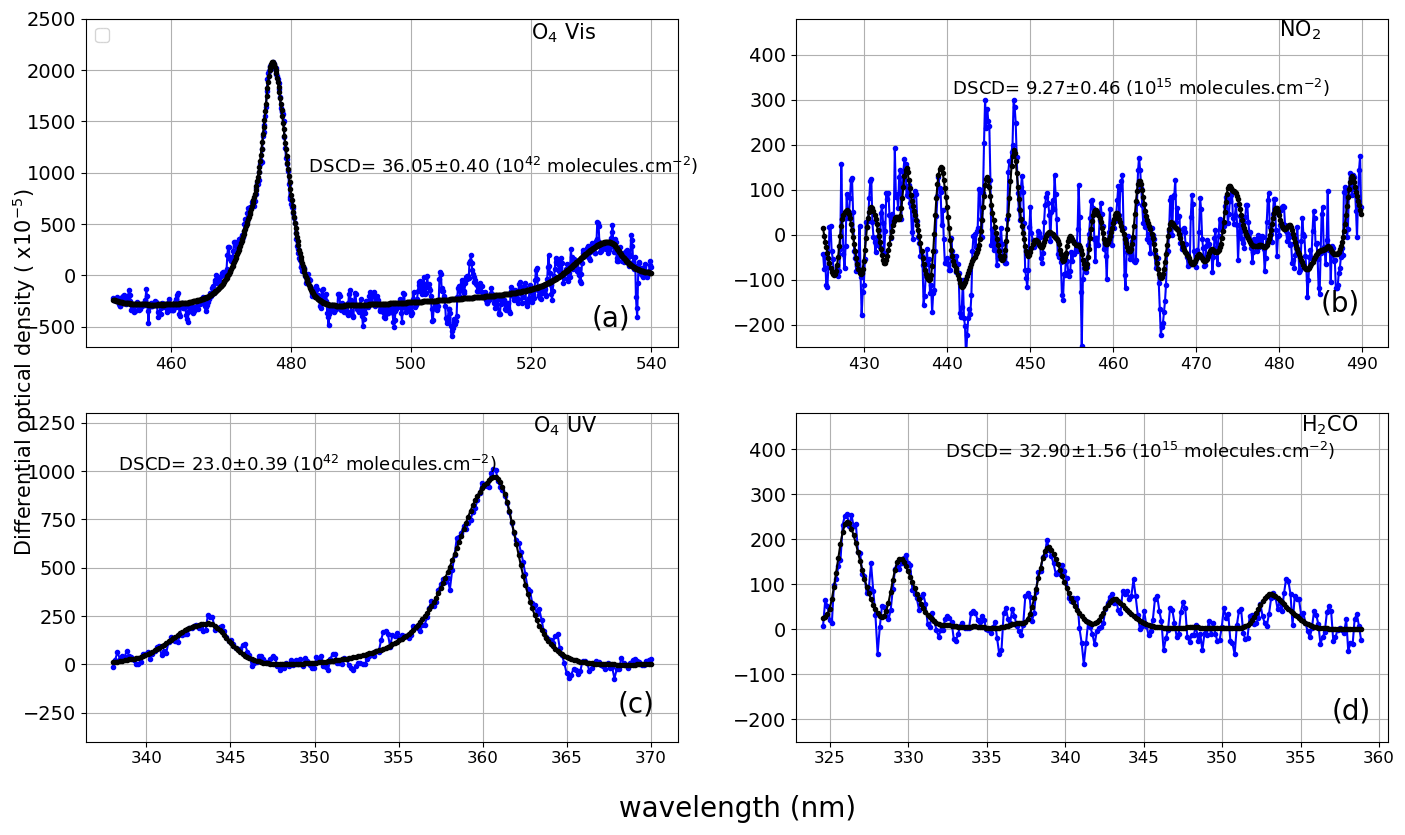
Figure 2Example of QDOAS slant column retrievals for O4 in the visible (a), NO2 (b), O4 in the ultraviolet (c) and H2CO (d) for 20 February 2020 at 09:10 UTC (elevation viewing angle = 5∘). Black lines correspond to molecular cross-sections scaled to the detected absorptions and blue dots represent the measured signal.
In the framework of FRM4DOAS, the current strategy is to use both codes to produce independent profile and column datasets. For operational delivery, only MMF data selected for their consistency with corresponding MAPA results are retained. These results are submitted to the NDACC Rapid Delivery (RD) repository1 and to the ESA EVDC database (https://evdc.esa.int/search/, last access: 10 July 2023). Both MMF and MAPA codes implement a two-step retrieval approach for trace gas profile retrieval. In the first step, the aerosol profile is determined based on a set of O4 dSCDs. In the second step, the retrieved aerosol profile is used to constrain the radiative transfer simulations needed for the trace gas retrieval. This implies that O4 dSCDs must be determined in the visible wavelength region for NO2 and in the UV for H2CO retrieval. Note that, in this work, we only considered MMF due to inconsistencies in the MAPA aerosol retrievals for our Kinshasa spectra.
Currently, in FRM4DOAS, MAPA is mainly used as a quality check, but it does not provide averaging kernels. Due to a sampling effect, using MAPA as a quality check for H2CO introduces a bias in the statistics. Higher VCDs are more likely to be flagged out, leading to discrepancies between MAPA and MMF. When assessing aerosol optical depths (AODs), it becomes evident that MMF-produced AODs closely align with MODIS AODs, while MAPA-derived AODs consistently surpass both MMF and MODIS. We therefore opted to exclude MAPA from this study. Consistency is maintained by applying the same flagging criteria to NO2. Only MMF values for which the quality assurance (QA) is lower than 2 were used. Three conditions should be met to establish this flagging (QA < 2). Firstly, scans with a degree of freedom (dof) below 1.3 are excluded. Secondly, all scans with an average root mean square (rms) (between measured and simulated dSCDs) larger than 4 times the QDOAS-estimated dSCD error are excluded. Furthermore, due to a lack of good a priori knowledge for the aerosols, two aerosol retrievals are performed (differing by a factor 10 in AOD). If the retrieved aerosol profile agrees well, only one trace gas retrieval is performed and no extra test is applied. If however the retrieved aerosol profile differs by more than 10 % (as average partial AOD in each layer), the trace gas profile is performed with both aerosol profiles, and all scans for which the retrieved VCD differs by more than 10 % are flagged as invalid. Tables 2 summarizes the main settings used for the NO2 and H2CO retrievals based on MMF. Note that regarding aerosol parameters (single scattering albedo and phase function moments) and surface albedo, the same default settings were used in both molecules. For the meteorological input parameters, the FRM4DOAS retrieval chain uses an interpolation of a monthly climatology at each station, extracted from global meteorological reanalysis of the European Centre for Medium-Range Weather Forecasts (ECMWF) from 1995 to 2016 produced by the Max Planck Institute for Chemistry (MPIC). An example of a retrieval scan including the measurement for 1 March 2020 at 13:13 UTC is displayed in Fig. 3. Vertical concentration profiles (Fig. 3b, d, f and h) retrieved by MMF and corresponding averaging kernels (AKs) (Fig. 3a, c, e and g) are displayed. In the AK panels, we show the degree of freedom for signal (dofs), and the error bars included in the profile concentration plots show the total errors, including random error components such as smoothing and noise error from the inversion, as well as systematic uncertainties due to absorption cross-section, namely 3 % for NO2 (Vandaele et al., 1998), 9 % for H2CO (Pinardi et al., 2013) and 20% for aerosol properties (Wagner et al., 2009). A priori profiles are represented next to retrieved profiles. The AKs indicate that the inversions are sensitive from the surface up to about 2.5 km.
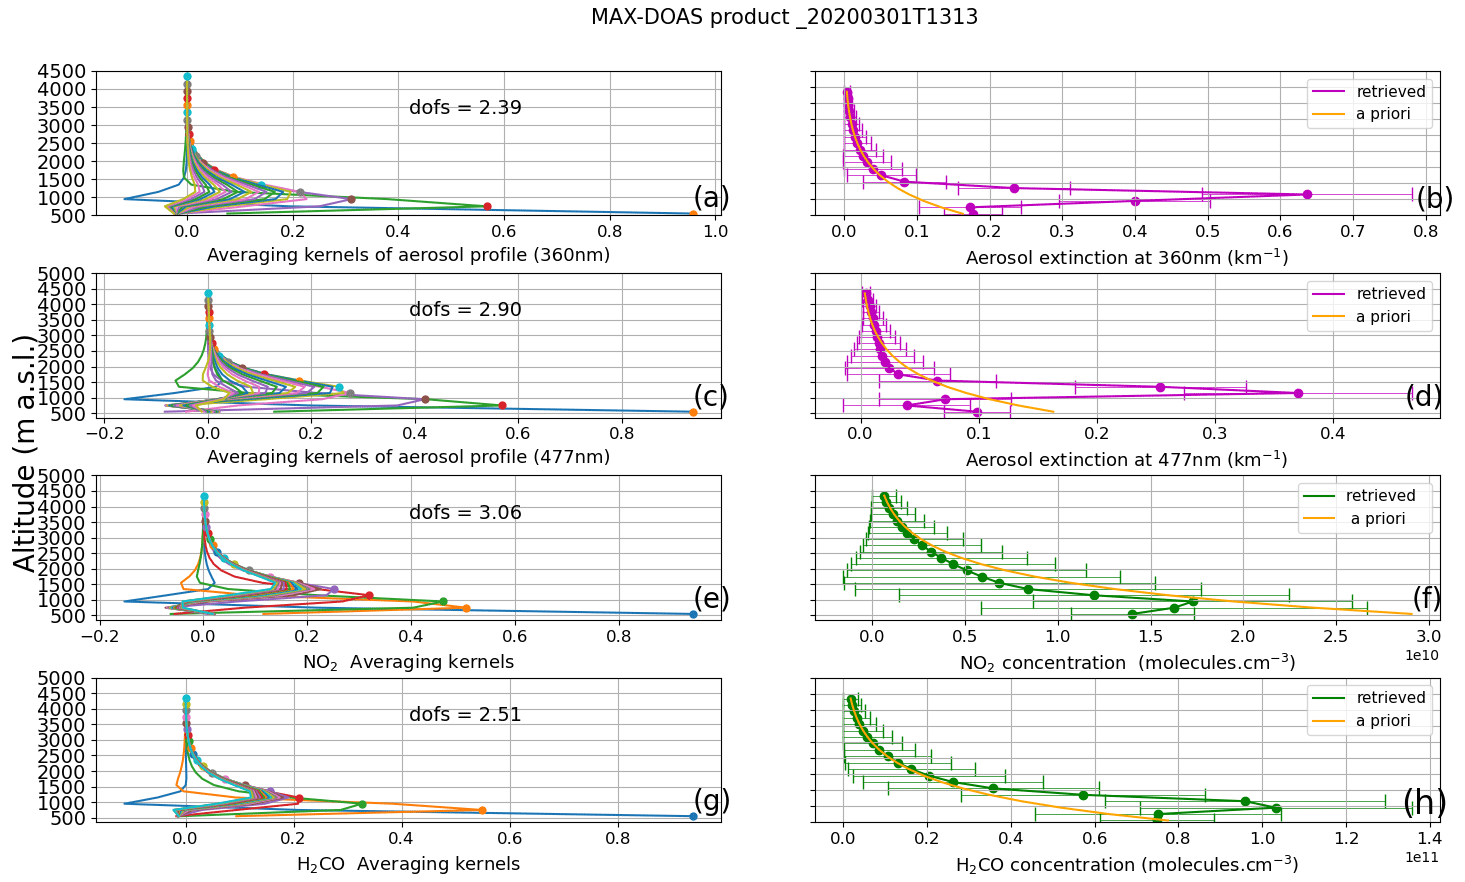
Figure 3Example of FRM4DOAS products around 13:13 UTC on 1 March 2020. The NO2 and H2CO profiles are represented in panels (f) and (h), respectively. Panels (e) and (g) show the corresponding averaging kernels (AKs), which are produced as part of the optical estimation inversion process and provide a measure of the vertical sensitivity of the measurements. Likewise, extinction profiles at 360 and 477 nm are represented in panels (b) and (d), and corresponding AKs are given in panels (a) and (c). The orange curves in the right panels are the a priori profiles. The horizontal bars represent the uncertainty in the retrieved profiles, and, next to AKs, we also display values of the dofs (degree of freedom for signal).
Table 2MMF retrieval settings for NO2 and H2CO observations in Kinshasa.

2.3 TROPOMI data
TROPOMI is a nadir imaging spectrometer that measures reflected sunlight in the ultraviolet, visible, near-infrared and shortwave infrared spectral ranges (Veefkind et al., 2012). The TROPOMI Kinshasa overpasses occur around 12:30 UTC (13:30 LT). Its spatial resolution at nadir is 5.5 km × 3.5 km. TROPOMI data used in this work are based on the S5P-PAL product, which stands for Sentinel-5P Product Algorithm Laboratory for NO2 (https://data-portal.s5p-pal.com/, last access: 2 June 2023), and the Offline product (OFFL; v2.1.4 and v2.2.1) for H2CO. The NO2 product from S5P-PAL is reprocessed with the same processor as version 2.3.1, covering the period from 1 May 2018 to 14 November 2021. For more technical details on the two products used, the reader is referred to the ATBD, available at http://www.tropomi.eu/data-products/ (last access: 25 May 2023). We selected only those pixels associated with a quality value (QA value > 0.75 for NO2 and QA value > 0.5 for H2CO) following the recommendations of van Geffen et al. (2022) and De Smedt et al. (2021).
This TROPOMI dataset has been exploited in this work in three ways. Firstly, we apply the oversampling technique to this dataset in order to provide information on the horizontal distribution of the two target compounds around the measuring site (see next paragraph). Secondly, direct comparisons between the standard TROPOMI product and ground-based measurements are performed. Thirdly, comparisons are performed that take into account differences in the vertical sensitivity of the MAX-DOAS and TROPOMI instruments (see Sect. 2.5). Note that for these comparisons with ground measurements, only pixels within a radius of 20 km around the observation site were selected. The choice of 20 km was made for three main reasons: (1) consistency with the horizontal sensitivity of the MAX-DOAS instrument, which generally varies between 3 and 20 km depending on visibility conditions, as shown in Fig. 1; (2) reduction in random uncertainty in TROPOMI data, especially for H2CO, as tested by Vigouroux et al. (2020); and (3) consistency with Yombo Phaka et al. (2021) – a study similar to this one – and also other studies such as Pinardi et al. (2020) and Irie et al. (2008), which tested these selection criteria for the case of NO2.
The oversampling technique consists of long-term averaging of the satellite data on a very fine spatial grid, 0.01∘ × 0.011∘ (1×1 km2), in a small domain around the station (41∘–51∘ S, 14.81∘–15.81∘ E). In this way, a high signal-to-noise ratio is achieved at high spatial resolution but at the expense of temporal resolution. We use TROPOMI data between January 2020 and June 2021, i.e., roughly the period of the MAX-DOAS measurements at Kinshasa. The technique takes advantage of the variable offset and geometry of the satellite measurement from day to day. This technique has been previously applied to SO2 and NO2 (de Foy et al., 2009; McLinden et al., 2012) and H2CO (e.g., Zhu et al., 2014) from the Ozone Monitoring Instrument (OMI). We oversample both H2CO and NO2 vertical columns from TROPOMI. The column measurement for a given TROPOMI pixel is assumed to apply to a circle defined by the center of the pixel and a radius of 3.5 km. In this way, each 0.011∘ × 0.011∘ pixel accumulates ≈ 200 measurements over the considered time period.
The resulting distributions in Fig. 4 show clear hot spots over the city of Kinshasa, with maximum values of ≈ 4.75 × 10¹⁵ molec. cm−2 and ≈ 16.0 × 10¹⁵ molec. cm−2 for NO2 and H2CO, respectively. Although the instrument is located outside the most polluted area, the instrument points towards downtown Kinshasa, where NO2 and H2CO levels are highest. These values are even higher when viewed in the direction of the MAX-DOAS, i.e., to the north of the city, precisely in downtown Kinshasa.
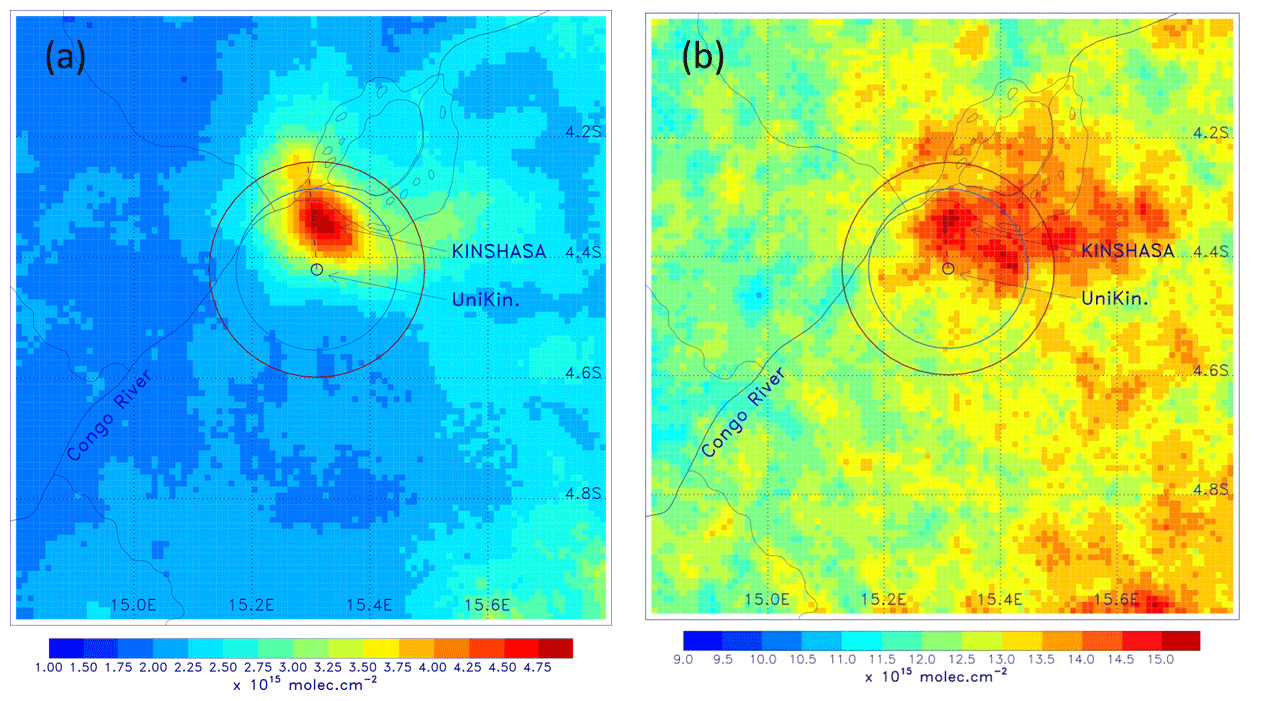
Figure 4Distribution of oversampled NO2 (a) and H2CO (b) TROPOMI tropospheric columns in the station area (4–5∘ S, 14.8–15.8∘ E), from January 2020 to June 2021. The blue and brown circles represent the 15 and 20 km radius circles around the station, respectively. The vertical dashed black line represents the pointing direction of the MAX-DOAS instrument.
2.4 GEOS-Chem model output
We use a standard full chemistry simulation performed with the Goddard Earth Observing System Chemistry (GEOS-Chem) model. GEOS-Chem is a 3D chemistry model that calculates local variations in atmospheric concentrations due to emissions, chemistry and deposition. The GEOS-Chem model has seen multiple applications across various regions of Africa (Lunt et al., 2019; Marais et al., 2019; Bockarie et al., 2020). We use version 12.0.2 (https://doi.org/10.5281/zenodo.1455215) runs implementing MERRA-2 assimilated meteorological fields at a horizontal resolution of 2∘ × 2.5∘ (latitude and longitude) on a vertical grid of 72 levels up to 0.01 hPa (about 80 km). Emission inventories are taken into account using the Harvard Harmonized Emissions Component (HEMCO; Keller et al., 2014) version 2.1.008. Our simulation includes EDGAR v4.3 for fossil fuel emissions, EMEP and NEI2011 for regional anthropogenic emissions, GFED v4 for fire emissions, MEGAN v2.1 for biogenic emissions, and RETRO for non-methane volatile organic compound (COVNM) emissions. In particular, the Diffuse and Inefficient Combustion Emissions in Africa (DICE-Africa) inventory is implemented to provide African anthropogenic emissions, as in Marais and Wiedinmyer (2016). DICE-Africa includes emissions from domestic and commercial use of wood from forests, household combustion of harvest residues, charcoal production and use, gas flaring, ad hoc oil refining (Niger Delta only), kerosene use, diesel/petrol generators, and vehicles (including motorcycles). We use in the present study global multiyear simulations initiated in 2010, meaning that the years investigated here are unaffected by the initial conditions. The model outputs are saved every 2 h.
2.5 Intercomparison methodology
Three different cases are explored in this study to compare the TROPOMI observations to those of MAX-DOAS.
- Case 1:
-
we select all TROPOMI pixels within a radius of 20 km around the observation site and compare the average column over the valid pixels to the average MAX-DOAS column around the overpass time.
- Case 2:
-
we recalculate the values of TROPOMI VCDtropo selected in case 1, using the median of the MAX-DOAS daily median profiles according to Eqs. (1) and (2) following Dimitropoulou et al. (2020). This recalculation is necessary to account for the different vertical sensitivity and a priori profile shapes of the TROPOMI and MAX-DOAS retrievals.
where VCD represents the smoothed MAX-DOAS columns, AVKSP5 is the averaging kernel of TROPOMI, and is the median profiles of the MAX-DOAS (in partial columns) discussed further below. We use the daily median profiles of MAX-DOAS to perform these transformations, in accordance with Dimitropoulou et al. (2020). VCD is the recalculated TROPOMI column using the MAX-DOAS profile as an a priori profile. The index i denotes summation on the different layers.
- Case 3:
-
we proceed as in the previous case but select only the pixels that lie in the azimuth direction of the instrument (355∘). Previous studies have used this approach, exploiting the availability of measurements in different azimuth directions (Chen et al., 2009; Irie et al., 2008; Ma et al., 2013; Dimitropoulou et al., 2020). We then apply the transformation of case 2 to these selected pixels. The selection of TROPOMI pixels in the MAX-DOAS viewing direction is performed in three steps illustrated in Fig. 5. First, a horizontal profile (0 to 10 km) is created, consisting of 20 equally spaced points (distance of 0.5 km), starting from UniKin (4.42∘ S, 15.31∘ E) and oriented in the viewing direction of the instrument (355∘). Second, geographical coordinates are assigned to each of the points. Finally, among the pixels lying within 20 km of the observation site (24 in Fig. 5a), only a few pixels cross the created line (3 pixels in Fig. 5b). Those are the pixels selected for the test within the MAX-DOAS line of sight.
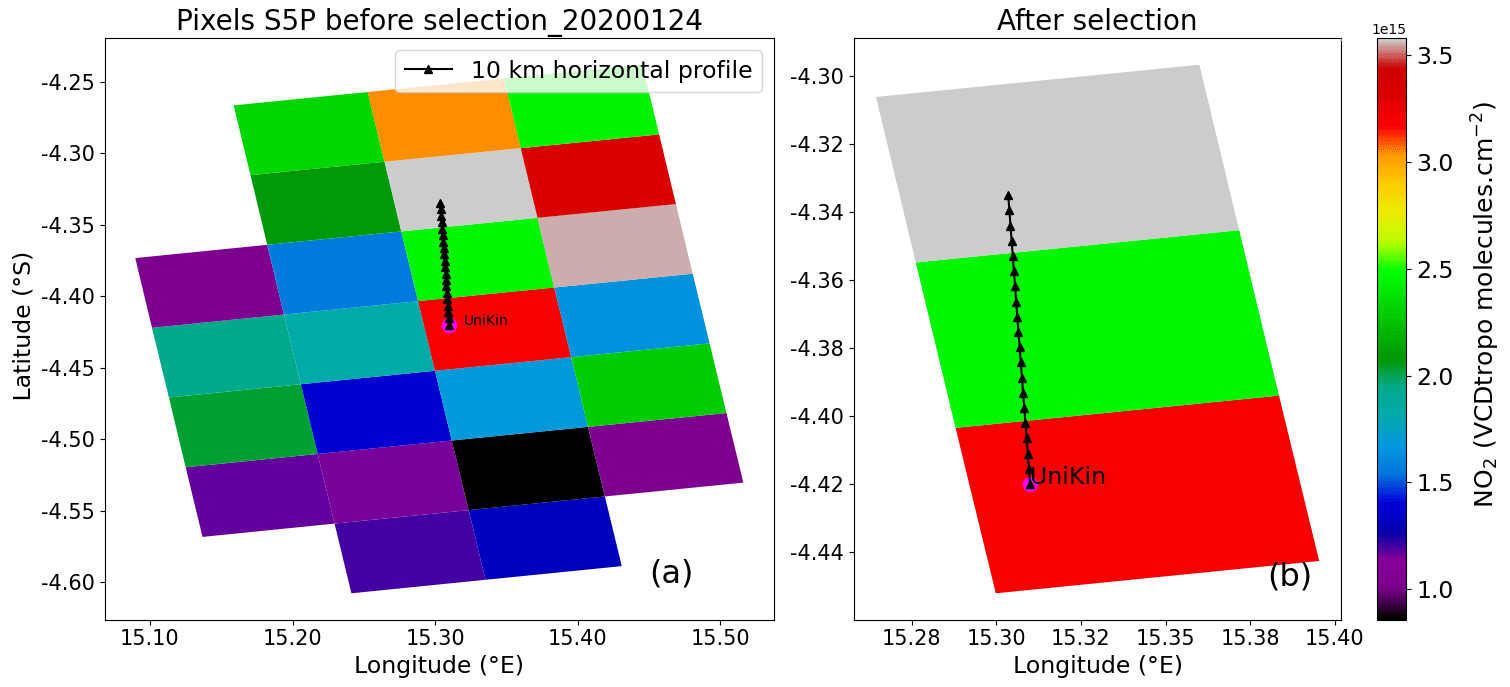
Figure 5Illustration of the approach taking into account the pixels along the MAX-DOAS viewing direction. Panel (a) shows all the pixels selected within a 20 km radius of the UniKin, and panel (b) shows the pixels selected along the viewing direction shown as a black line.
In all three studied cases, the selected MAX-DOAS measurements are hourly averages at the overpass time. Numerical results of daily and monthly averages are also presented for each case. Absolute median differences (satellite (SAT) minus ground-based (GB) measurements expressed in 1015 molec. cm−2), relative median differences ((SAT−GB)GB, in %) and least-squares linear regression statistics were calculated for each case. The results obtained for NO2 and H2CO are summarized in Sect. 3.2.
Figure 6 illustrates the daily median retrieved MAX-DOAS profiles (green dots) of NO2 and H2CO for 8 June and 15 November 2020, 1 d in the dry season and 1 d in the rainy season, respectively. The daily median profile of TM5 (orange curves) and GEOS-Chem for each molecule (red curves) is also shown for these 2 d. TM5 is a global chemistry transport model that is used to derive the a priori vertical profiles of NO2 and H2CO in TROPOMI product retrievals with a horizontal resolution of 1∘ × 1∘ (Williams et al., 2017). The horizontal bars represent the standard deviations related to each case. In panel a, the NO2 profiles recovered by MAX-DOAS are found to be reasonably close to those of the two models. This behavior is typical of all MAX-DOAS daily median NO2 profiles during the dry season (see Fig. C1). The MAX-DOAS profile seems to fit fairly well with the TM5 and GEOS-Chem profiles for the dry season. However, during the rainy season, in panel c, as on all the other days (see Fig. C1), both models underestimate the MAX-DOAS profile for all altitudes. Regarding H2CO, TM5 is found to overestimate the MAX-DOAS profile in the wet season. Most importantly, the TM5 profile during both seasons shows a fairly significant contribution in the upper troposphere, above 3 km, not found in the MAX-DOAS profile (see Fig. C1). This large difference in vertical profile can seriously impact the recalculation of TROPOMI columns performed in case 2 and have an impact on the comparisons presented in Sect. 3.2.
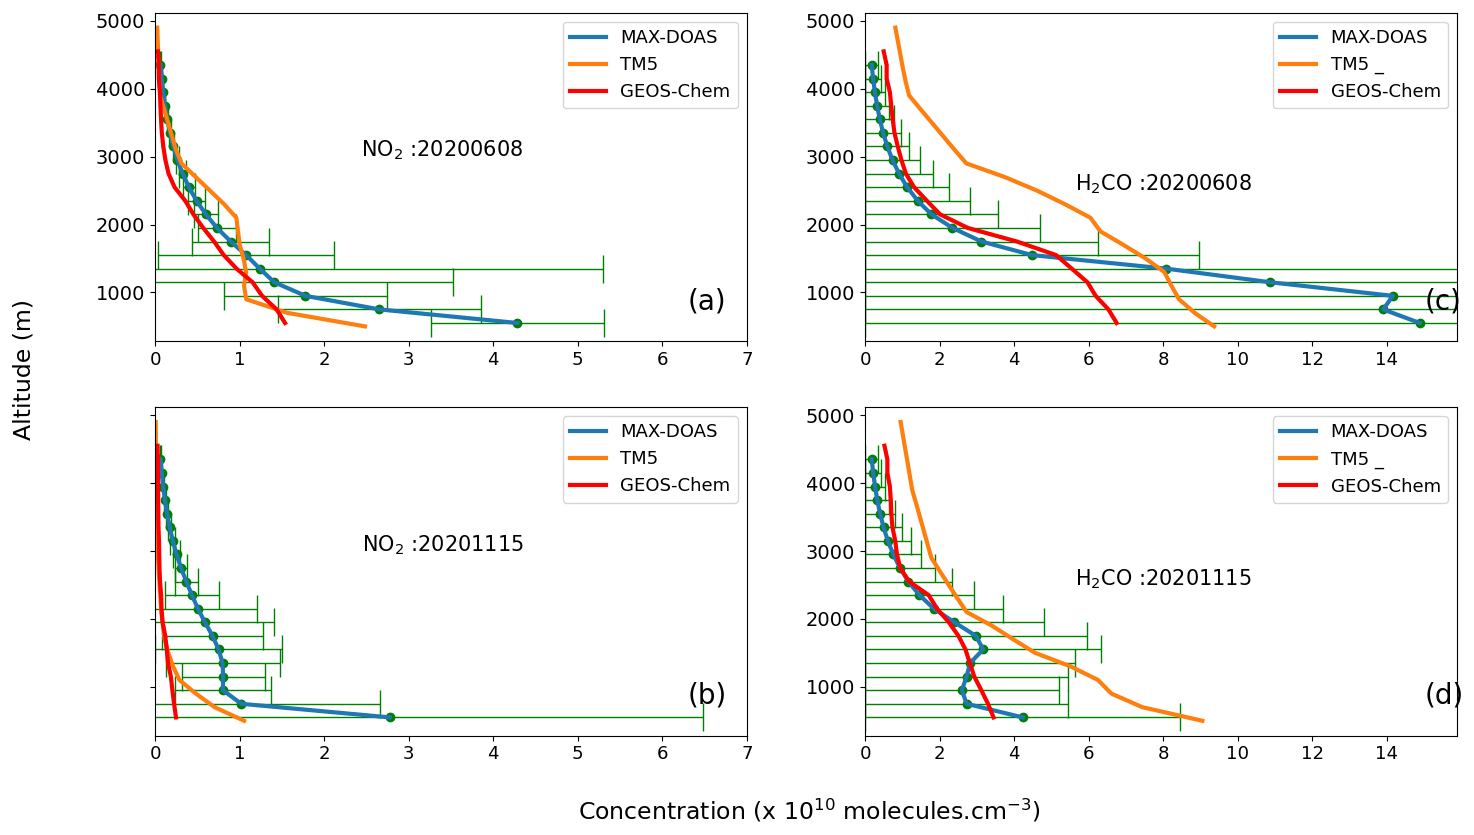
Figure 6MAX-DOAS, TM5 and GEOS-Chem median profiles of NO2 (a, b) and H2CO (c, d). The error bars represent the standard deviation. The daily MAX-DOAS median profiles shown in green dots are illustrated by the type of profile used to recalculate the tropospheric vertical column densities according to Eqs. (1) and (2).
The following section provides a description of the MAX-DOAS database of NO2 and H2CO VCDtropo and aerosol optical depth (AOD) and presents the results of comparisons made between model and satellite. In Sect. 2, we show the tropospheric columns and AOD time series, as well as the trace gases diurnal and seasonal variations. In Sect. 3.2, we present the MAX-DOAS and TROPOMI comparisons according to the three cases described in Sect. 2.5.
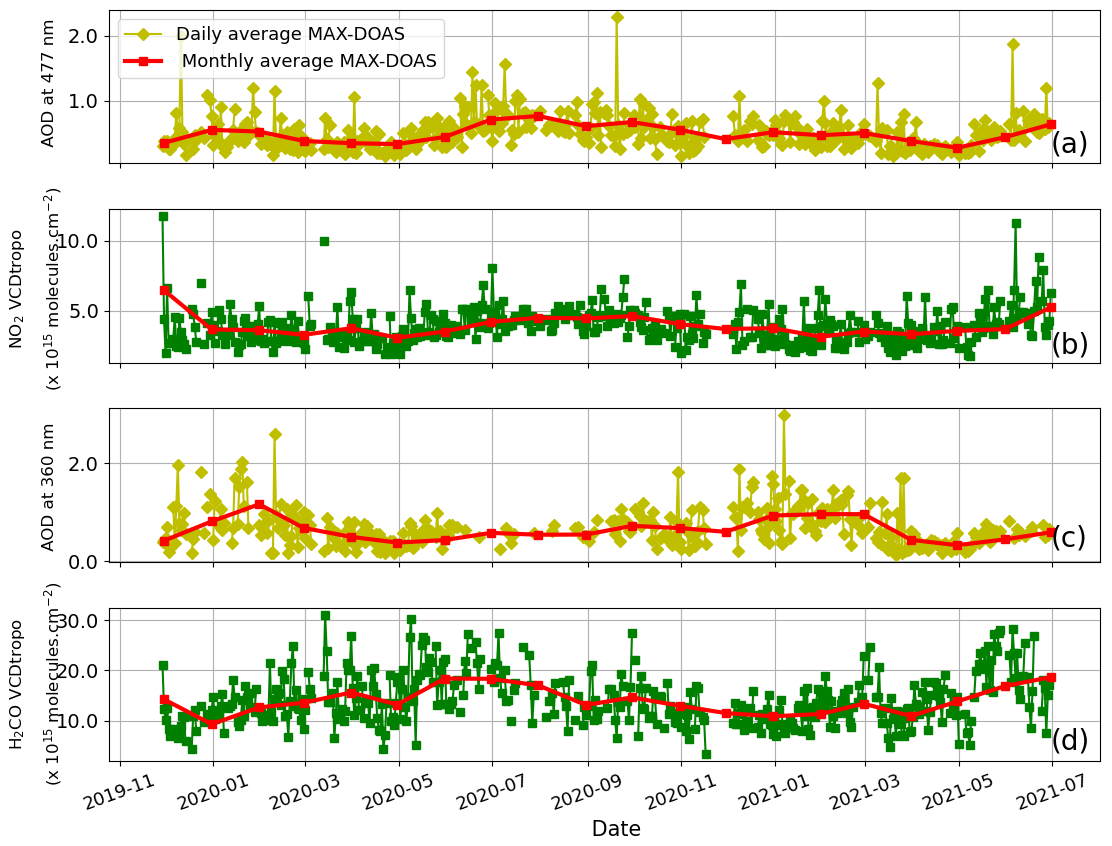
Figure 7MAX-DOAS aerosol optical depth (AOD) measured at 477 nm (a) and 360 nm (c) and VCDtropo of NO2 (b) and H2CO (d) measured between November 2019 and July 2021. In each panel, both daily and monthly averages are displayed.
3.1 Overview of the MAX-DOAS database
Figure 7 shows the VCDtropo of NO2 and H2CO (panels b, d) and the AOD (panels a, c). In each panel, the red curve represents the monthly average of the geophysical quantity displayed, while the other curve connects the daily averages. AOD is retrieved in the visible (477 nm; panel a) and in ultraviolet (360 nm; panel c). The absence of measurements in November 2020 is due to a technical problem. The other gaps visible especially in panels c and d for H2CO and AOD are due to data removed from our database for not having satisfied the MMF selection criteria.
During the study period, the daily averages of the tropospheric vertical NO2 columns vary between 1.8 × 10¹⁵ and 11.8 × 10¹⁵ molec. cm−2, while the tropospheric vertical H2CO columns range between 3.5 × 10¹⁵ molec. cm−2 and 31 × 1015 molec. cm−2, with higher values measured during the dry seasons.
The AOD daily averages observed at 360 nm vary between 0.1 and 2.9 and are generally higher than the AOD observed at 477 nm varying between 0.1 and 2.2 due to increased scattering by aerosols at short wavelengths. Larger AOD values are also observed during the dry season, like for NO2 and H2CO, as illustrated by the decrease in visibility shown in Fig. 1 (panels a, b). This AOD increase can be explained by the accumulation of dust in the atmosphere over Kinshasa in the dry season due to the lack of cleaning effect of precipitation. This increase in AOD during the dry season is also confirmed by the MODIS AOD measurements. Figure D1 provides a good correspondence between the MODIS AODs at 550 nm and those of MAX-DOAS observed at 477 nm.
Figure 8 shows the mean diurnal variations in NO2 and H2CO VCDtropo, calculated for all ground-based (GB) measurements. Three different periods are shown in these figures. The first period, from 1 January to 14 May, covers the short dry season, characterized by little rainfall. The second period, from 15 May to 14 September, covers the long dry season, when there is virtually no rainfall. The third period runs from 15 September to 31 December, covering the long rainy season.
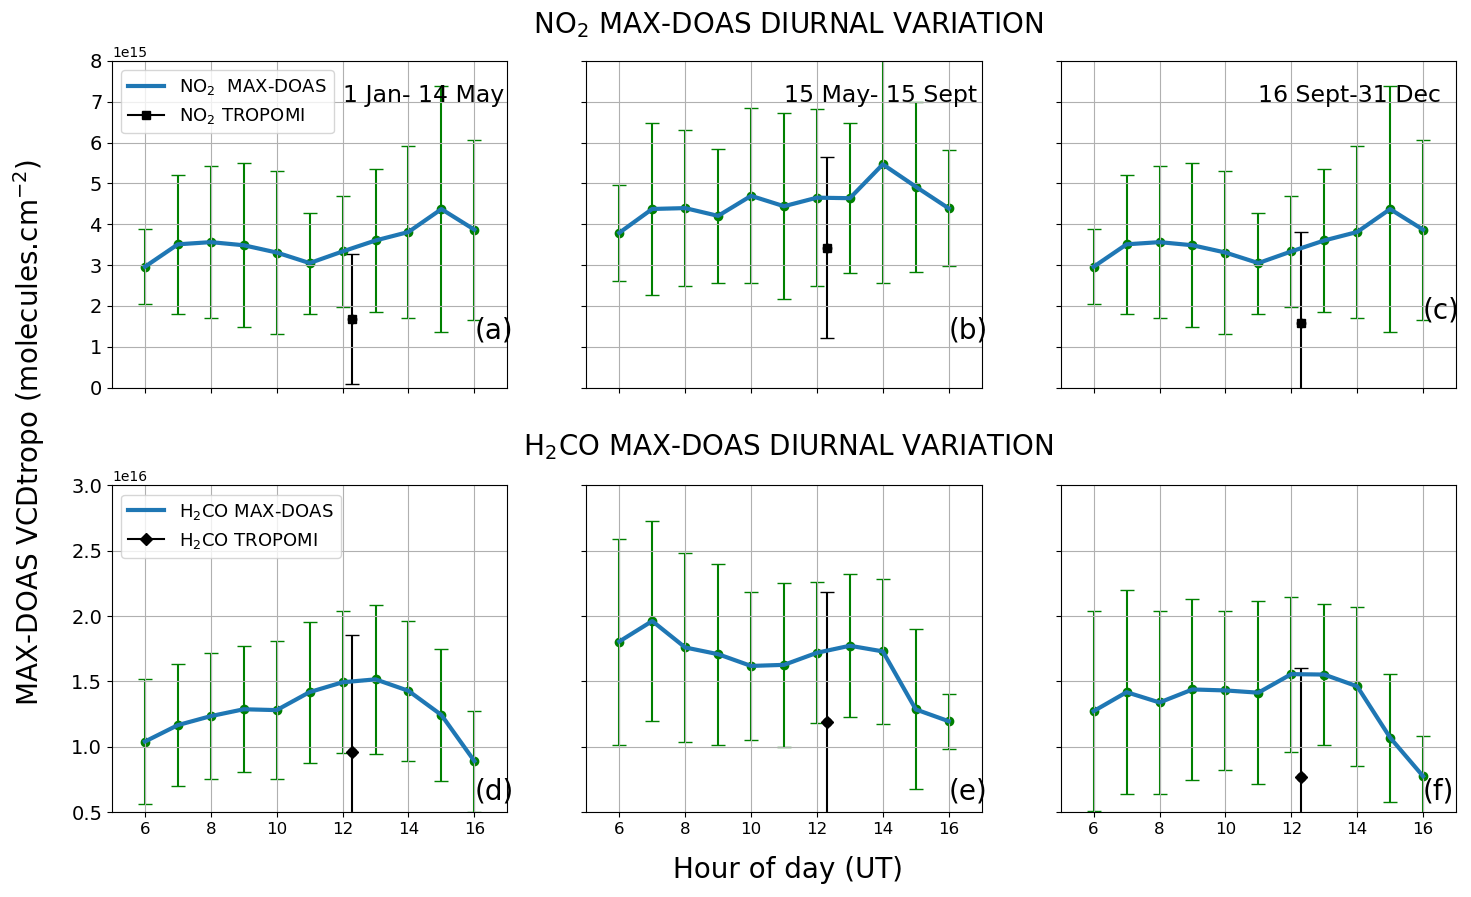
Figure 8Mean diurnal variations in NO2 (a, b, c) and H2CO (d, e, f) VCDtropo observed by the MAX-DOAS instrument (blue dots) and by TROPOMI (black dots) over the city of Kinshasa between November 2019 and July 2021. The error bars represent the (1σ) standard deviation of VCDtropo computed for each hour within the specified period.
Table 3Statistics summary for the MAX-DOAS and TROPOMI NO2 comparisons.
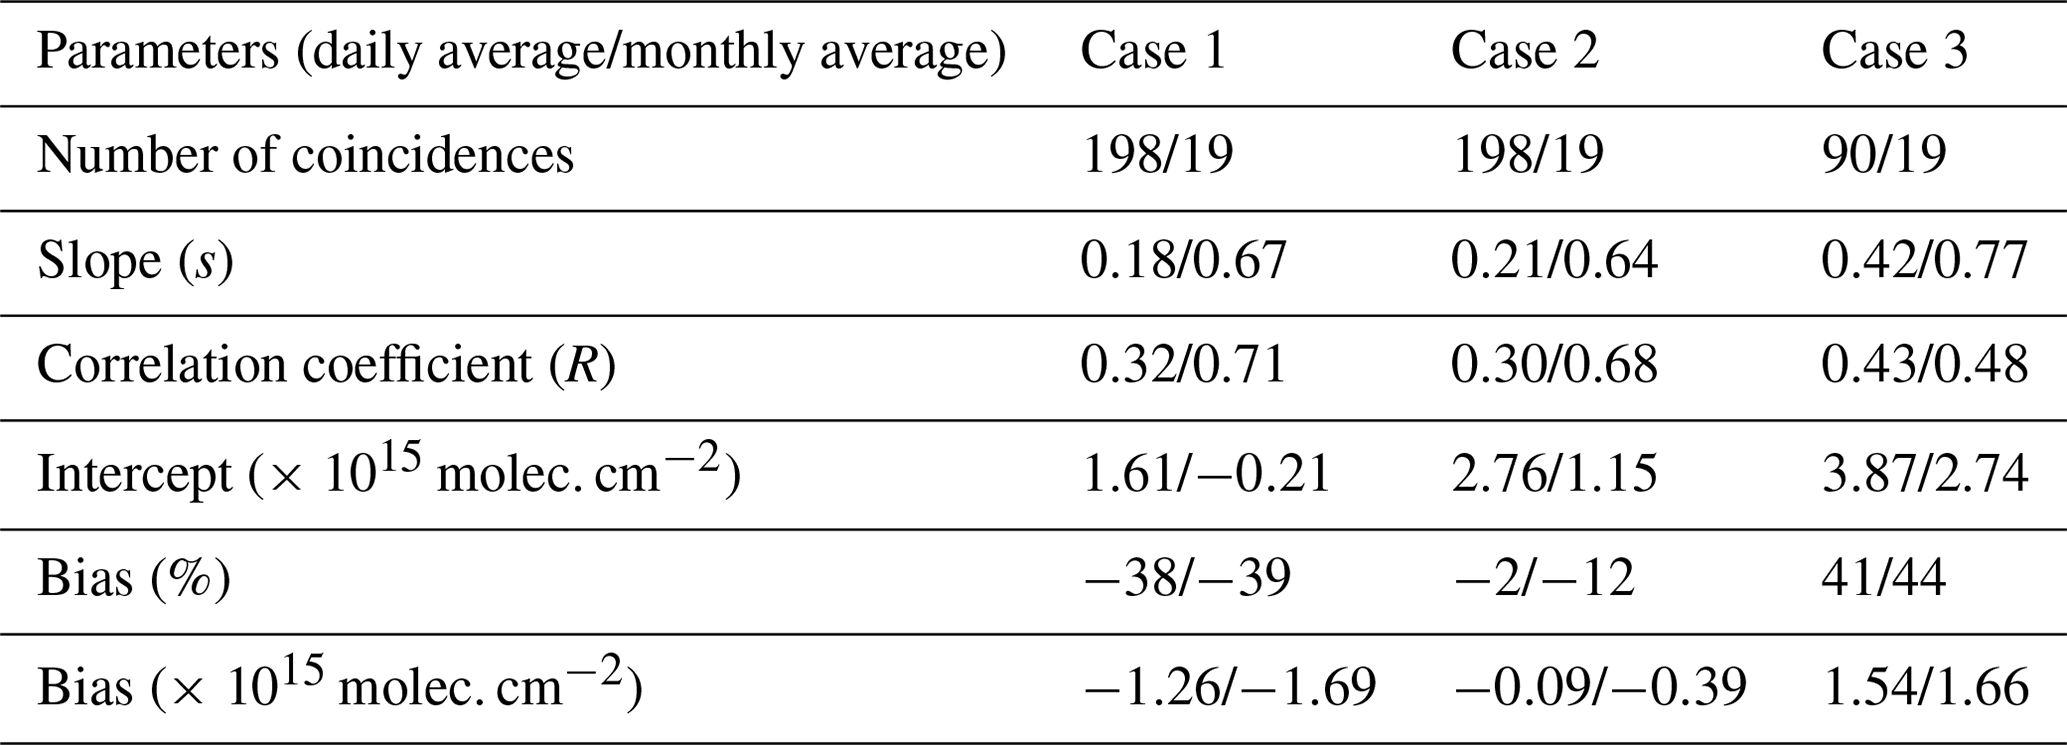
Case 1: direct comparison, all pixels. Case 2: recalculated TROPOMI, all pixels. Case 3: recalculated TROPOMI, azimuth-based selection.
Regarding NO2 VCDtropo, we note a weak diurnal increase of similar amplitude during the three periods mentioned above. In the case of H2CO VCDtropo, the diurnal variation (also similar during the three periods) seems to be characterized by a maximum around noon, in good agreement with Stavrakou et al. (2015). This behavior could be related to the diurnal pattern of biogenic emissions and fires. Isoprene emissions are favored by light and warm conditions (Guenther et al., 2006). Most of the fires occur around noon (70 %) and 13:00 UTC (22 %), as reported by Cizungu et al. (2021) at the Luki Biosphere Reserve (5.5∘ S, 13.3∘ E) close to Kinshasa. The warmer and drier weather from noon onward favors the occurrence of fires and their spread. This would affect the H2CO production with some delay due to the VOC oxidation. The oxidation of biogenic VOCs such as isoprene and monoterpenes leads to H2CO typically after a few hours (Marais et al., 2012). For pyrogenic VOCs, their lifetime is highly variable, from a few hours to several days (Stavrakou et al., 2009).
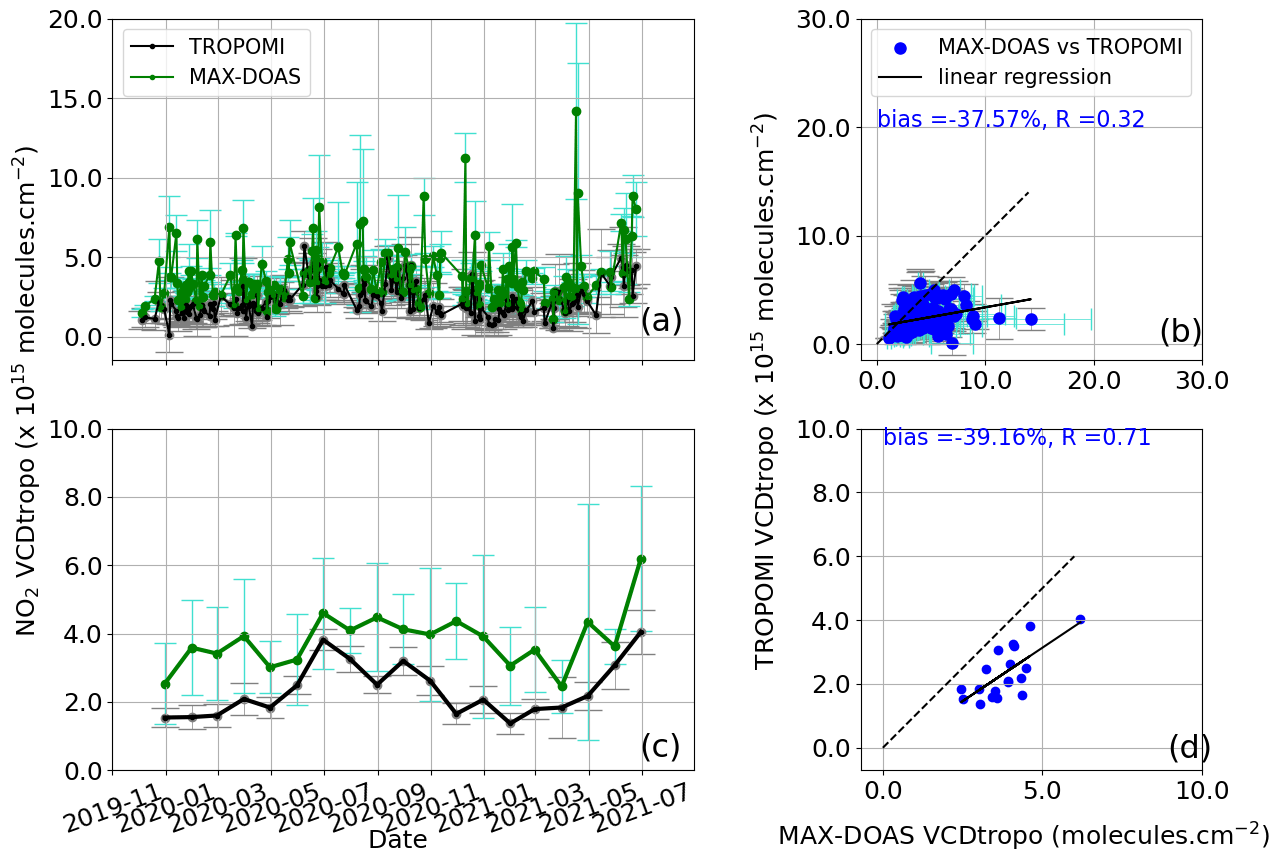
Figure 9Case 1 – NO2: comparison of daily (a) and monthly (c) tropospheric vertical column densities of MAX-DOAS (green dots) and TROPOMI (black dots) over Kinshasa from 1 November 2019 to 1 July 2021. The MAX-DOAS is the hourly average coincidence day of TROPOMI satellite overpass. Error bars are (1σ) standard deviations. (b, d) Linear regressions between the two datasets.
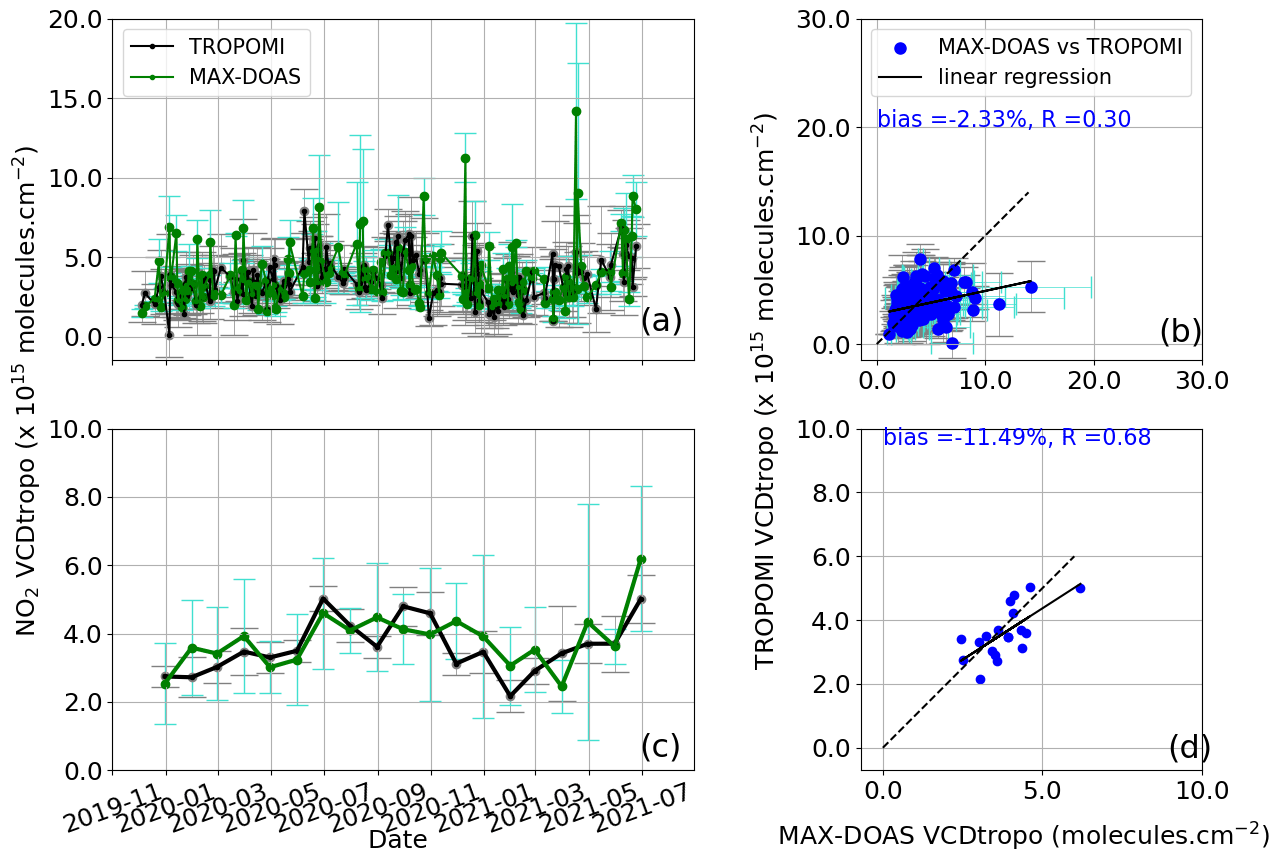
Figure 10Case 2 – NO2: comparison of daily (a) and monthly (c) tropospheric vertical column densities of MAX-DOAS (green dots) and TROPOMI (black dots) over Kinshasa from 1 November 2019 to 1 July 2021. The MAX-DOAS is the hourly average coincidence day of TROPOMI satellite overpass. The individual TROPOMI points are those obtained from Eqs. (1) and (2) as described in the second case. Error bars are (1σ) standard deviations. (b, d) Least-squares linear regressions between the two datasets.
3.2 Intercomparison MAX-DOAS versus TROPOMI
Table 3 summarizes the results from the comparisons in three cases. The direct comparisons between TROPOMI and MAX-DOAS observations (case 1, see Fig. 9) yield poor agreement. We note low slopes (s) of 0.18 and 0.67 for the daily and monthly comparisons, respectively, and correlation coefficients (R) of 0.32 and 0.71. The corresponding intercepts are large, of the order of −1.26 × 10¹⁵ molec. cm−2 (daily) and −0.21 × 10¹⁵ molec. cm−2 (monthly), showing a strong contribution of the additive component. High negative median biases are also associated with these results, of the order of −1.26 × 10¹⁵ molec. cm−2 (−37.57 %) and −1.69 × 10¹⁵ molec. cm−2 (−39.16 %) for the daily and monthly comparisons, showing a strong underestimation of the TROPOMI observations relative to the MAX-DOAS observations. It should be noted that similar results were obtained using zenith measurements at the same site for NO2 (Yombo Phaka et al., 2021). An underestimation of TROPOMI NO2 observations was also frequently reported over large cities, e.g., by Griffin et al. (2019), Ialongo et al. (2020), Zhao et al. (2020), Marais et al. (2021), Cai et al. (2022), and Verhoelst et al. (2021), using NDACC ZSL-DOAS, MAX-DOAS and Pandonia global networks.
Moving to case 2, results are improved by making use of the MAX-DOAS profile shape information. Despite the relatively similar profile shapes of TM5 and MAX-DOAS (Figs. 6a, C1b), the impact of using the MAX-DOAS profiles as a priori profiles in TROPOMI column retrieval appears to be significant. The agreement between the two datasets improves considerably compared to the first case, particularly in terms of reducing the median bias, while the slopes and correlation coefficients have maintained nearly identical values. We find a slope of 0.21 and 0.64 for daily and monthly comparisons, respectively, and correlation coefficients of 0.30 and 0.68 (see Fig. 10). On the other hand, there is a high additive component at the intercept, where 2.76 × 10¹⁵ and 1.15 × 10¹⁵ molec. cm−2 are noted for the daily and monthly comparisons. Negative median bias are also associated with these results, of the order of −0.09 × 10¹⁵ molec. cm−2 (−2.33 %) and −0.39 × 10¹⁵ molec. cm−2 (−11.49 %) for the daily and monthly comparisons, respectively. These results show the large impact of the a priori profile in the TROPOMI validation process and confirm results from previous studies (e.g., Dimitropoulou et al., 2020).
The comparison in case 3, for which only TROPOMI pixels lying in the MAX-DOAS viewing direction are selected, is the most complex approach, since it takes into account the ground-based observation direction and the impact of the a priori profile shape on the TROPOMI retrieval (see Fig. A1 in Appendix A). Although this case is potentially more realistic than case 2 as it addresses the spatial heterogeneity of the target compound in a more refined way, it implies a sharp reduction in the number of points making up the comparison sample. The number of TROPOMI data used for each co-location with MAX-DOAS measurements is reduced by about a factor of 0.15 on average (see Fig. 5) in comparison to case 2. The number of days with valid data is also reduced from 198 to 90. Therefore, given the noise in the TROPOMI column data, the regression of case 3 should be considered with caution. Furthermore, as seen in Fig. 4, the NO2 field shows a steep gradient along the line of sight between UniKin and a distance of 10 km. Case 3 assumes a uniform sensitivity of MAX-DOAS along the 10 km of the line of sight, even though the instrument is likely more sensitive to shorter distances, where NO2 columns are lower. We note an increase relative to case 2 of the TROPOMI bias to around 40 % for daily and monthly comparisons. The possible causes explaining these differences are discussed in Sect. 4.
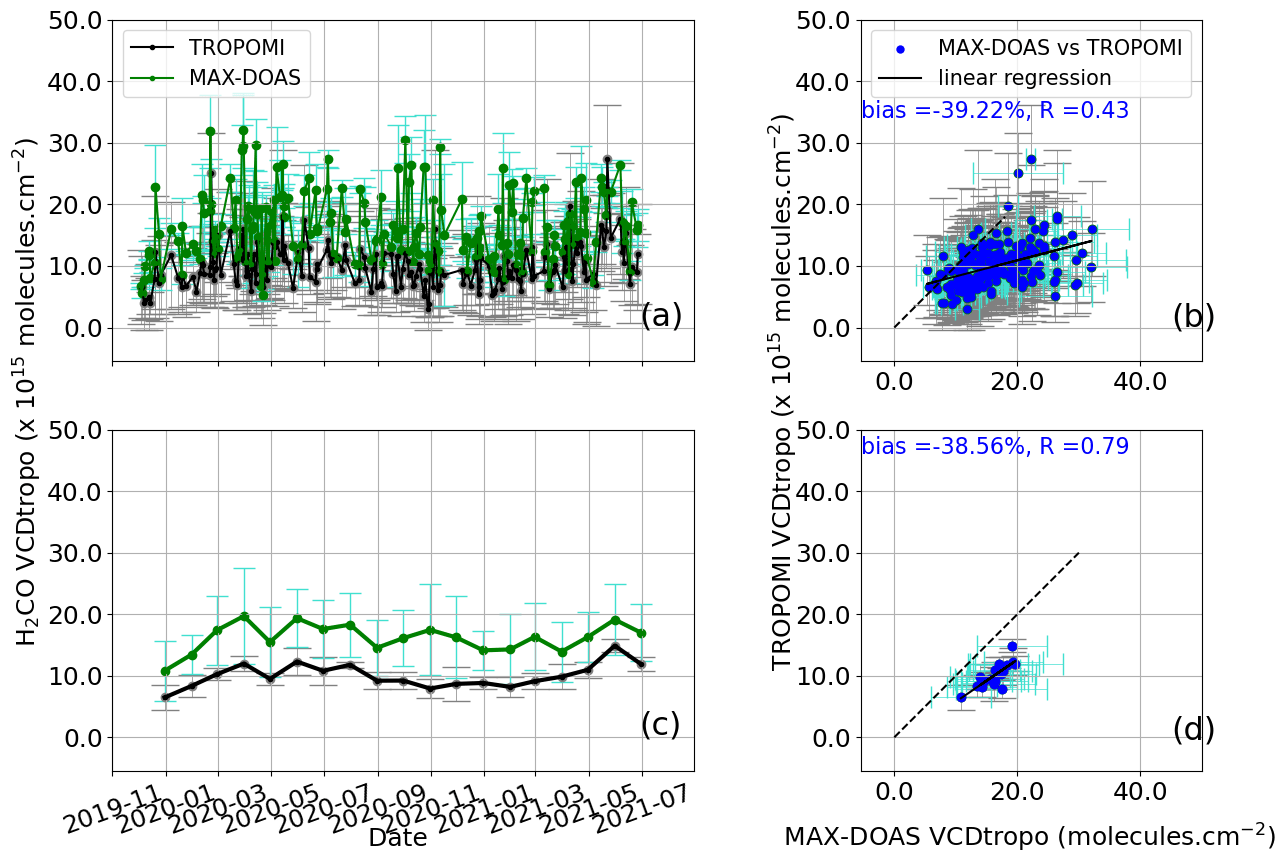
Figure 11Case 1 – H2CO: comparison of daily (a) and monthly (c) tropospheric vertical column densities of MAX-DOAS (green dots) and TROPOMI (black dots) over Kinshasa from 1 November 2019 to 1 July 2021. The MAX-DOAS is the hourly average coincidence day of TROPOMI satellite overpass. Error bars are (1σ) standard deviations. (b, d) Least-squares linear regressions between the two datasets.
Table 4 summarizes the results for H2CO. As for NO2, the direct comparison (case 1; Fig. 11) shows a strong median bias between TROPOMI and MAX-DOAS of around −5.91 × 10¹⁵ (−39 %) (s = 0.26, R = 0.43) for daily averages and −6.00 × 10¹⁵ (−39 %) (s = 0.68, R = 0.79) for monthly averages. TROPOMI is therefore underestimated. These results (daily comparisons) are close to those presented in De Smedt et al. (2021) for the polluted sites of the National Autonomous University of Mexico (UNAM) in Mexico and Xianghe in China. We note an underestimation of TROPOMI compared to the ground measurements, with H2CO levels ranging from 1 to 25 × 1015 molec. cm−2. Chan et al. (2020) and De Smedt et al. (2021) have also reported this underestimation in the case of large cities characterized by high pollution. The high H2CO column levels (between 10 and 20 × 1015 molec. cm−2 on monthly average) characterize Kinshasa as a highly polluted area (columns higher than 8 × 10¹⁵ molec. cm−2) according to the methodology of Vigouroux et al. (2020), who validated TROPOMI H2CO using an extensive network of ground-based Fourier-transform infrared (FTIR) stations. In the same study, an average of 8.4 and 28 × 1015 molec. cm−2 were observed at the Paramaribo and Porto Velho stations, which are a highly polluted equatorial region in the same way as Kinshasa. Also in that study, we note a correlation coefficient of 0.9 between TROPOMI and the FTIR instrument of the Porto Velho station, value close to the one found in Kinshasa between TROPOMI and MAX-DOAS in case 1 (monthly comparison).
For case 2 (Fig. 12), when taking the MAX-DOAS median profile as an a priori profile, the median bias is highly reduced around 0.01 × 10¹⁵ (0.05 %) (s = 0.30, R = 0.20) for daily averages and 1.89 × 10¹⁵ molec. cm−2 (11 %) (s = 1.00, R = 0.73) for monthly averages. These results demonstrate the impact of applying the change a priori as in the case of NO2. Those results are in agreement with those of De Smedt et al. (2021), who found that the negative bias of TROPOMI H2CO against MAX-DOAS data at highly polluted sites (Mexico City and Xianghe) was reduced when substituting the TM5 profiles with the MAX-DOAS profiles in the TROPOMI product. The effect was weaker for less polluted sites such as Uccle (De Smedt et al., 2021). In Sect. 4, we investigate the possible causes of this significant decrease in bias.
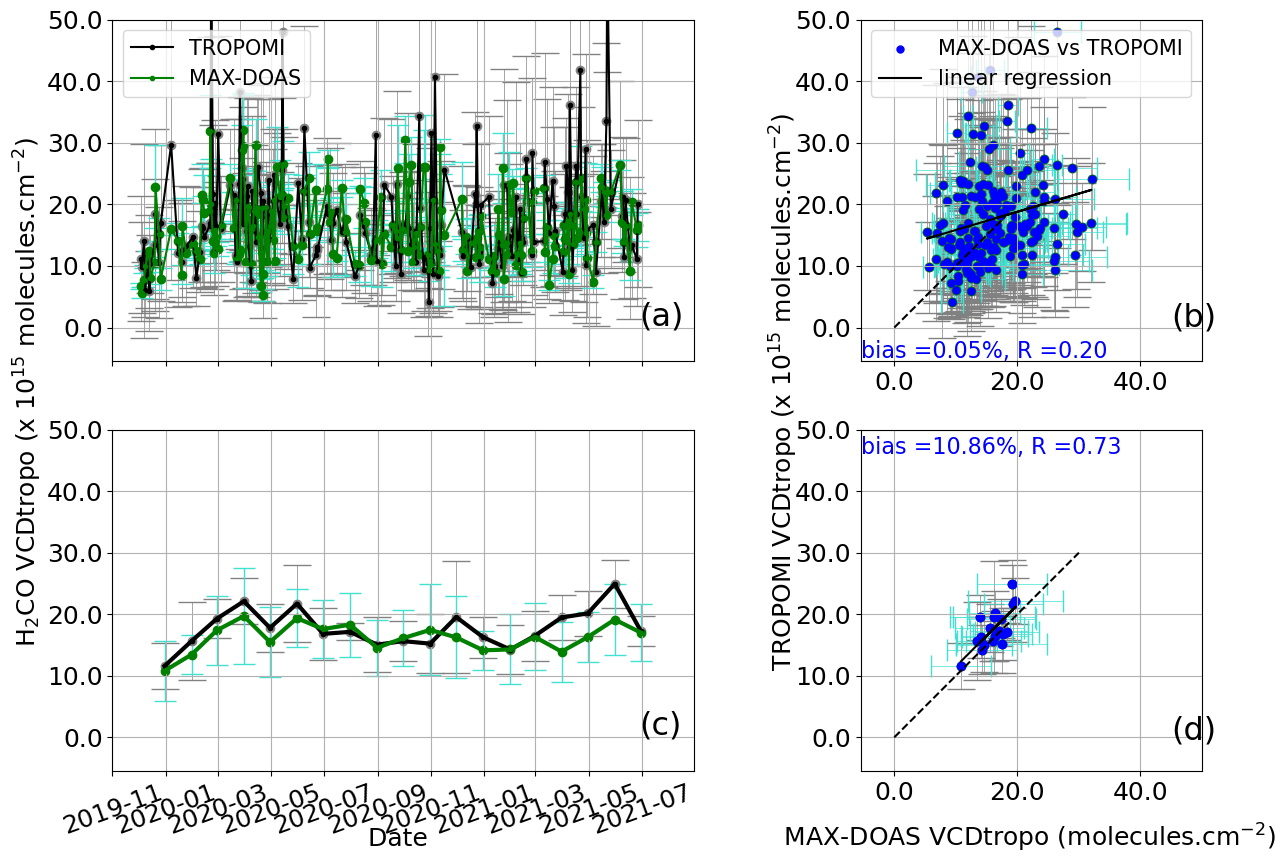
Figure 12Case 2 – H2CO: comparison of daily (a) and monthly (c) tropospheric vertical column densities of MAX-DOAS (green dots) and TROPOMI (black dots) over Kinshasa from 1 November 2019 to 1 July 2021. The MAX-DOAS is the hourly average coincidence day of TROPOMI satellite overpass. The individual TROPOMI points are those obtained from Eqs. (1) and (2) as described in the second case. Error bars are (1σ) standard deviations. (b, d) Least-squares linear regressions between the two datasets.
The third case (Fig. B1 in Appendix B) shows an improved agreement between the two datasets despite a sharp reduction in the number of points included in the comparative sampling. Slopes and correlation coefficients are s = 0.37 and R = 0.25 for daily comparisons and s = 0.90 and R = 0.55 for monthly comparisons. The median bias is estimated at about 5 % for both daily and monthly comparisons, which represents a strong improvement on case 2. We discuss these differences in Sect. 4.
Table 4Statistics summary for the MAX-DOAS and TROPOMI H2CO comparisons.
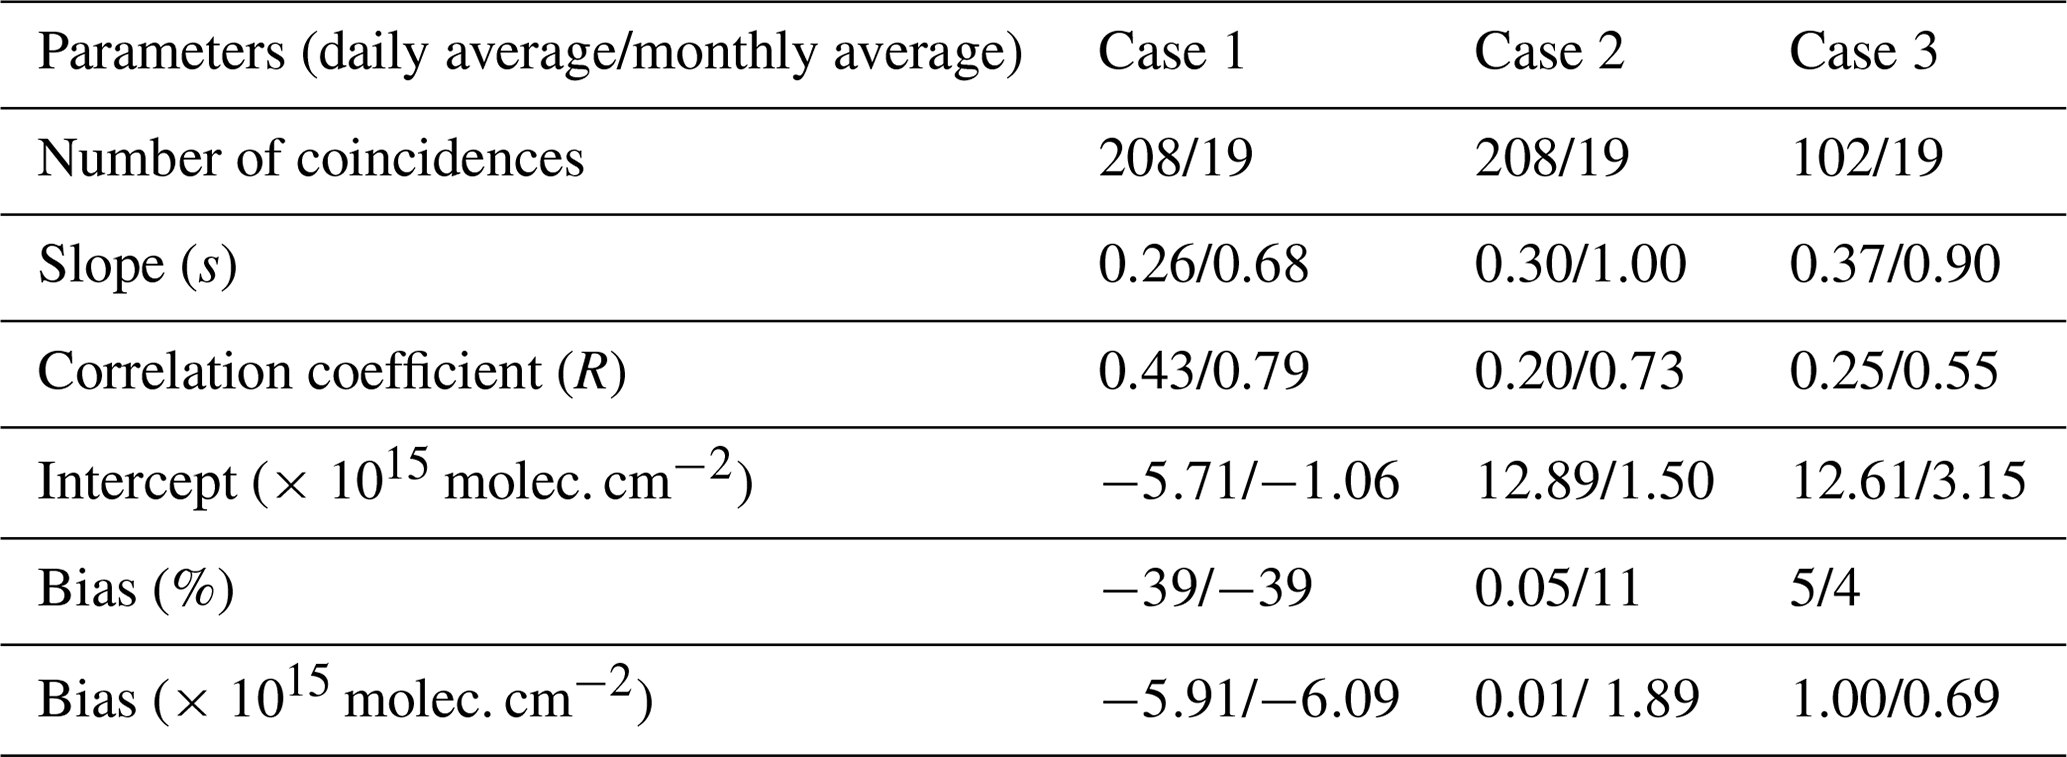
Case 1: direct comparison, all pixels. Case 2: recalculated TROPOMI, all pixels. Case 3: recalculated TROPOMI, azimuth-based selection.
The main conclusions of the comparisons between TROPOMI and MAX-DOAS data are as follows. First, there is a general underestimation of TROPOMI NO2 and H2CO columns in comparison to the ground-based observations, when the differences in vertical sensitivity and a priori profile shapes are not taken into account. Once those are considered in the comparison, there is a substantial improvement in the comparison statistics, especially a strong impact on the reduction in the median difference between TROPOMI and MAX-DOAS. The comparison using selected TROPOMI pixels along the line of sight of the MAX-DOAS instrument shows a substantial increase in the TROPOMI averages, especially for NO2, in line with the strong heterogeneity of the target compounds shown in Fig. 4. However, this approach is more strongly affected by the TROPOMI noise and likely overestimates the influence of the very polluted city center, located 5–10 km from the station.
The general underestimation of TROPOMI compared to MAX-DOAS observations (case 1) can be partly understood by the limitation of nadir-viewing satellites to capture the high pollution lying near the ground (averaging kernels often below 1 for the first kilometers close to the ground), as is often the case in large cities. Kinshasa and its surroundings, with its high population density, intense road traffic and the common use of embers from wood burned in the forest, is highly polluted. Figure 4 shows elevated concentrations of both molecules in downtown Kinshasa, located to the north of the measuring station, aligned with the viewing direction of the instrument. The southern part of the 20 km radius around the site is less polluted than the northern part, which may contribute to the underestimation of TROPOMI column averages in this radius. Furthermore, satellite retrieval heavily relies on choices made for the a priori profile. The a priori profile used in the inversion of the initial TROPOMI product is based on the TM5 global model, featuring a coarse horizontal resolution of 1∘ × 1∘ (Williams et al., 2017), which is in contrast to the fine horizontal resolution of TROPOMI (3.5 × 5.5 km2) and leads to biased comparisons. Accounting for sensitivity through TROPOMI averaging kernels in conjunction with the MAX-DOAS profile (case 2) allowed us to deduce a correction factor. This factor is employed to update the initial TROPOMI product and notably mitigate the bias between TROPOMI and MAX-DOAS. The correction has a significantly more noticeable impact on H2CO compared to NO2. This difference is attributed to the weaker vertical sensitivity near the surface in the UV range (H2CO) as opposed to the visible range (NO2). Consequently, the influence of MAX-DOAS profiles is more substantial for H2CO than for NO2.
Additional uncertainties stem from clouds and aerosols present practically the whole year in this region, affecting the accuracy of the satellite retrievals in the troposphere (e.g., Boersma et al., 2004; Koelemeijer et al., 2001; Heckel et al., 2011; Leitão et al., 2010; McLinden et al., 2014). As seen in Fig. 7, AOD values can reach values up to 3 in the dry season. Although the TROPOMI dataset selected in our study has been filtered to remove the high cloudiness scenes (QA > = 0.75 for NO2 and QA > = 0.5 for H2CO), it should be noted that this filtering does not totally eliminate all the scenes affected by clouds and aerosols. Lorente et al. (2017) estimate that the a priori profile, combined with the surface albedo and cloud parameters, can lead to uncertainties of up to 47 % in the inversion of the TROPOMI datasets.
Considering only TROPOMI pixels intersecting the MAX-DOAS view (case 3) leads to elevated VCDs due to spatial variations in NO2 and H2CO around Kinshasa. The northward-oriented pixels (Fig. 4) show higher concentrations, further amplified by applying the transformation of Eq. (1), explaining pronounced NO2 biases. MAX-DOAS observations are heavily impacted by visibility, notably Kinshasa with the strong aerosol influence, reducing effective horizontal probing distance. This contributes to lower MAX-DOAS VCDs in case 3. Reduced pixel count (Fig. 5) also diminishes statistical data points, adding to TROPOMI sampling noise.
We present NO2 and H2CO MAX-DOAS measurements from an instrument installed at the University of Kinshasa in November 2019. Measurements in Africa are scarce, and we use them in order to validate the TROPOMI tropospheric columns. This work complements the first DOAS NO2 observations made in this region between 2017 and 2019. The measurements obtained with the first instrument demonstrated a good agreement between TROPOMI and ground-based measurements, with a negative median bias of the order of −25 % (Yombo Phaka et al., 2021). The present work aims at understanding and reducing the comparison bias by using the additional information provided by the new MAX-DOAS instrument (line-of-sight and retrieval of the gas vertical profiles). Measurements from the MAX-DOAS instrument for the period from November 2019 to July 2021 were analyzed and inverted within the harmonized FRM4DOAS project facilities. The annual cycle of NO2 and H2CO presents the highest tropospheric column levels during the dry season (mid-May to mid-September). The MAX-DOAS columns of NO2 varied between 1.8 and 11.8 × 10¹⁵ molec. cm−2, while that of H2CO varied between 3.5 and 31 × 1015 molec. cm−2. These MAX-DOAS measurements are then compared to the TROPOMI observations.
The TROPOMI validation exercise was carried out following three steps: (1) a standard comparison involving an average of all pixels within a radius of 20 km around the observation site and an hourly average of VCDtropo MAX-DOAS at overpass S5P, (2) recalculating the TROPOMI product using the MAX-DOAS profile as an a priori profile, and (3) selecting only the TROPOMI pixels within the MAX-DOAS line of sight and recalculating their tropospheric vertical column density (VCDtropo) as in the second case. The result of case 1, complementing the previous exercise carried out at the same site for NO2, confirms that TROPOMI columns are underestimated with a median bias of around −38 %. When using the MAX-DOAS profile as an a priori profile in the TROPOMI calculation, a significant improvement in the agreement between the two datasets is observed. The differences between the two datasets are substantially reduced, about −2 % (s = 0.21, R = 0.30) for daily averages and −12 % (s = 0.64, R = 0.68) for monthly averages. For H2CO, based on case 1, we find a median bias of −39 % (s = 0.26, R = 0.43) for daily averages and −39 % (s = 0.68, R = 0.79) for monthly averages. In case 2, we find a strong bias reduction of around 0.05 % (s = 0.30, R = 0.20) for daily averages and 11 % (s = 1.00, R = 0.73) for monthly averages.
The third case, although potentially more realistic as it optimizes the spatial overlap of the comparison (by only selecting S5P pixels in the MAX-DOAS observation direction), shows less relevant statistical results than the other two due to the small sample size. Given the horizontal distribution of the two compounds, TROPOMI VCDs are very high in the direction of downtown Kinshasa, leading to strong biases in the comparison results.
Our study demonstrates and confirms the impact of using MAX-DOAS profiles as a priori profiles in the retrieval of TROPOMI columns. Indeed, due to the satellite's low sensitivity near the surface, biases can manifest significantly in the conditions of highly polluted large cities like Kinshasa, potentially resulting in an underestimation of satellite observations. However, this tendency is markedly mitigated when a correction is applied by considering profiles actually measured by the ground-based instrument.
Consequently, our recommendation is to implement this transformation, particularly in settings of highly polluted urban areas like Kinshasa. Nonetheless, caution should be exercised in the incorporation of the MAX-DOAS line of sight due to the introduced noise during downsampling, as observed in this study. This work also shows that the city of Kinshasa and its surroundings are very polluted in terms of NO2, H2CO and aerosols, thus requiring regular monitoring and control by the authorities.
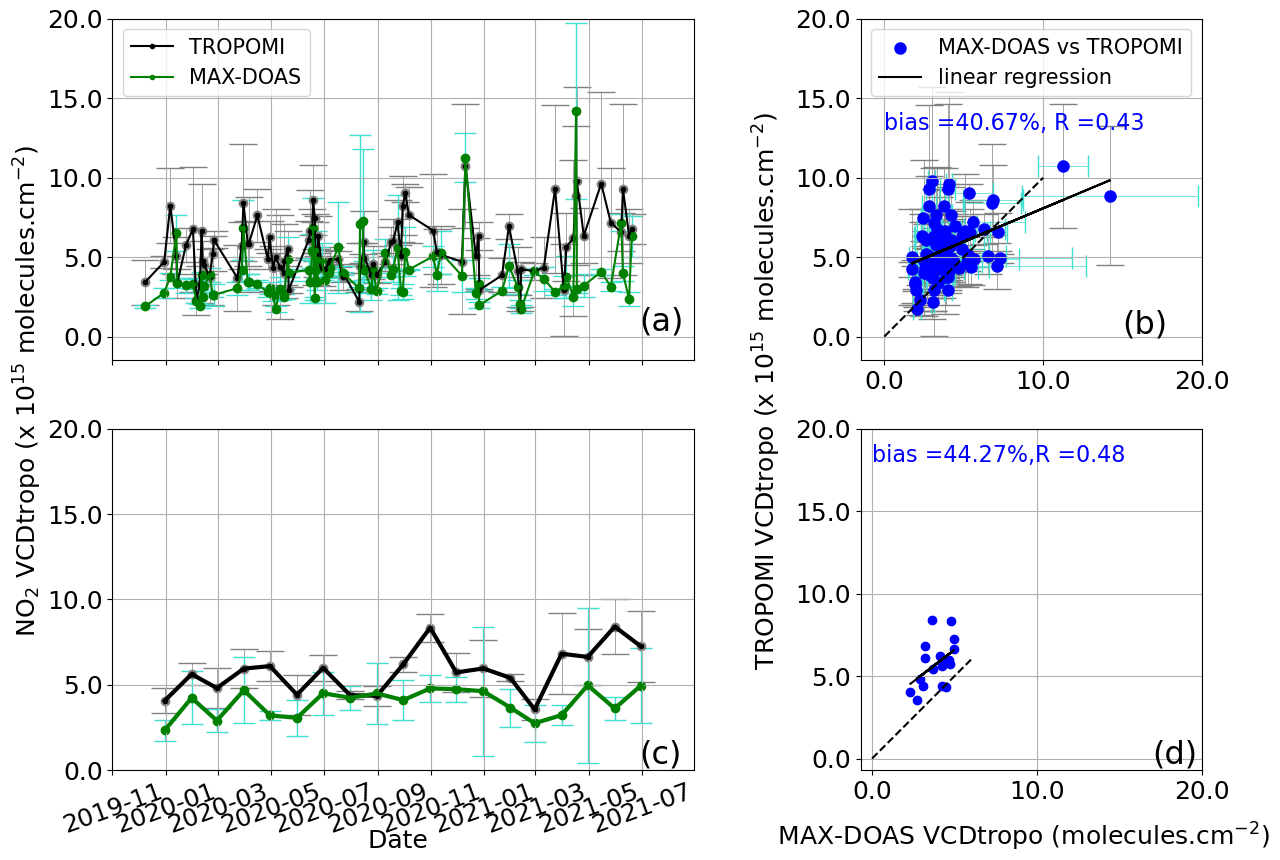
Figure A1Case 3 – NO2: comparison of daily (a) and monthly (c) tropospheric vertical column densities of MAX-DOAS (green dots) and TROPOMI (black dots) over Kinshasa from 1 November 2019 to 1 July 2021. The MAX-DOAS is the hourly average coincidence day of TROPOMI satellite overpass. The individual TROPOMI points are those obtained from Eqs. (1) and (2). Error bars are (1σ) standard deviations. (b, d) Results of least-squares linear regressions between the two datasets and the corresponding statistics.
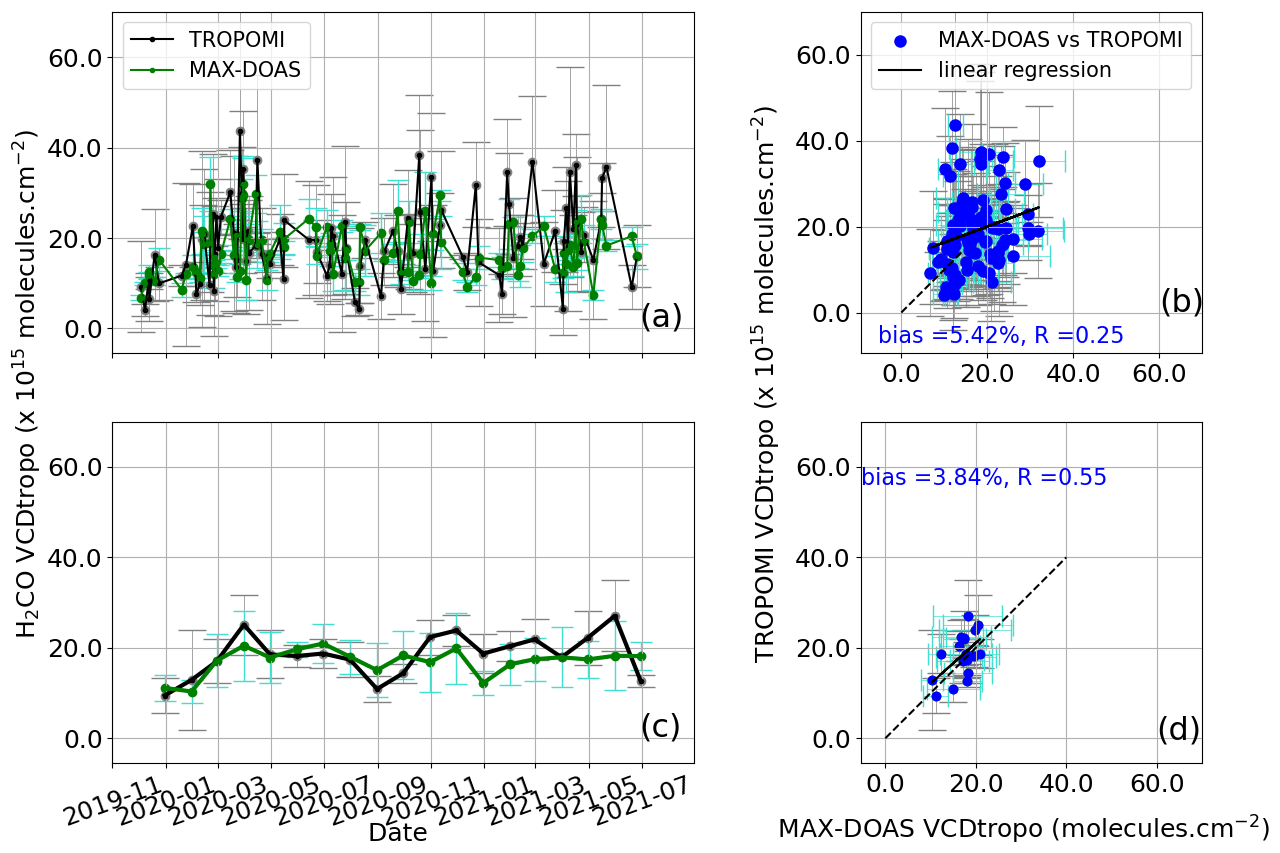
Figure B1Case 3 – H2CO: comparison of daily (a) and monthly (c) tropospheric vertical column densities of MAX-DOAS (green dots) and TROPOMI (black dots) over Kinshasa from 1 November 2019 to 1 July 2021. The MAX-DOAS is the hourly average coincidence day of TROPOMI satellite overpass. The individual TROPOMI points are those obtained from Eqs. (1) and (2). Error bars are (1σ) standard deviations. (b, d) Results of least-squares linear regressions between the two datasets.
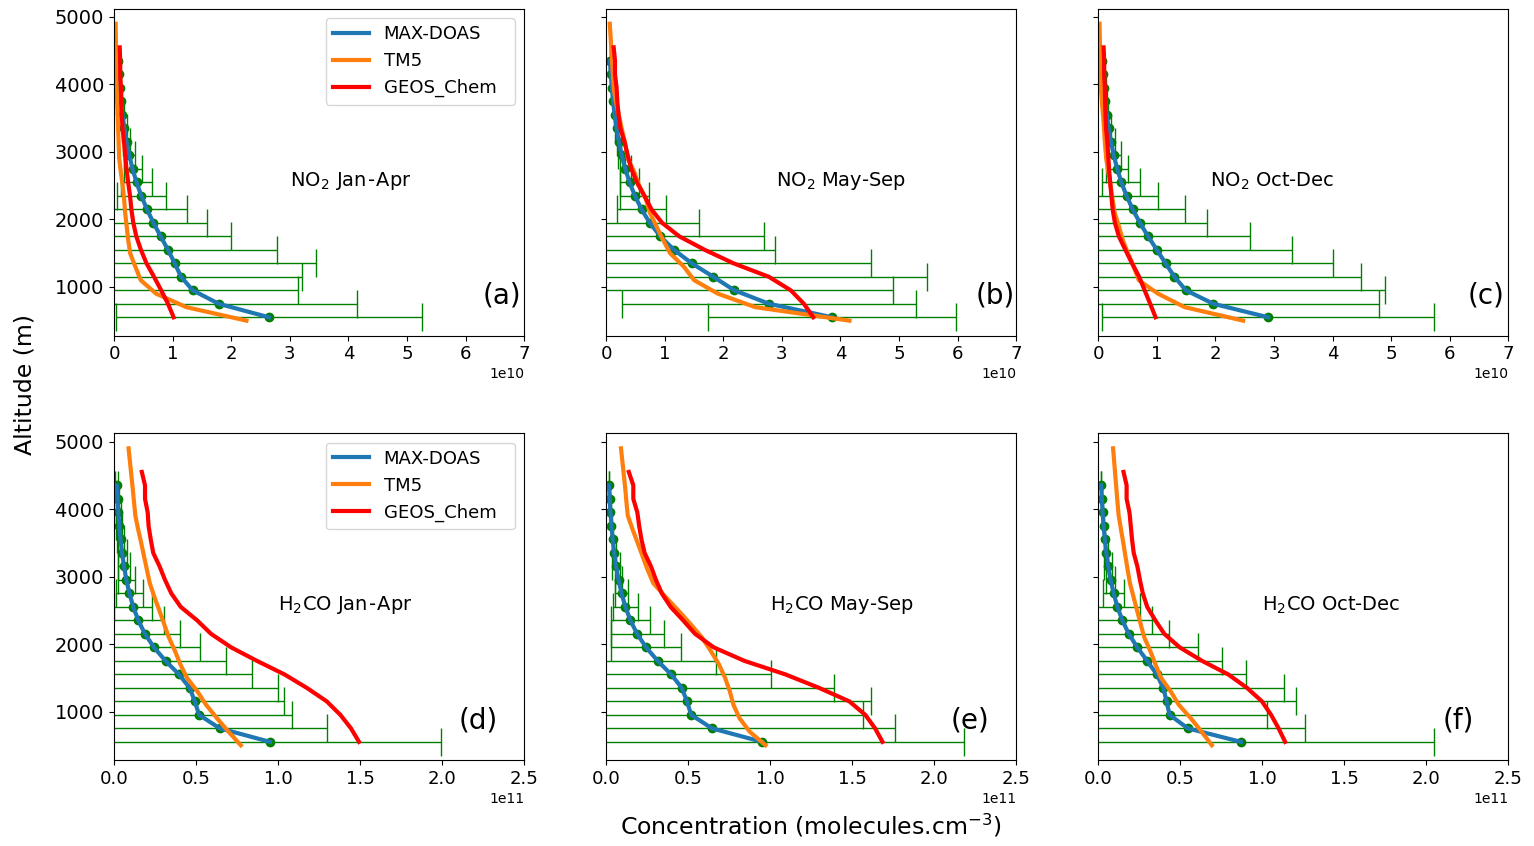
Figure C1MAX-DOAS, TM5 and GEOS-Chem median profiles of NO2 (a, b, c) and H2CO (d, e, f). The error bars represent the standard deviation.
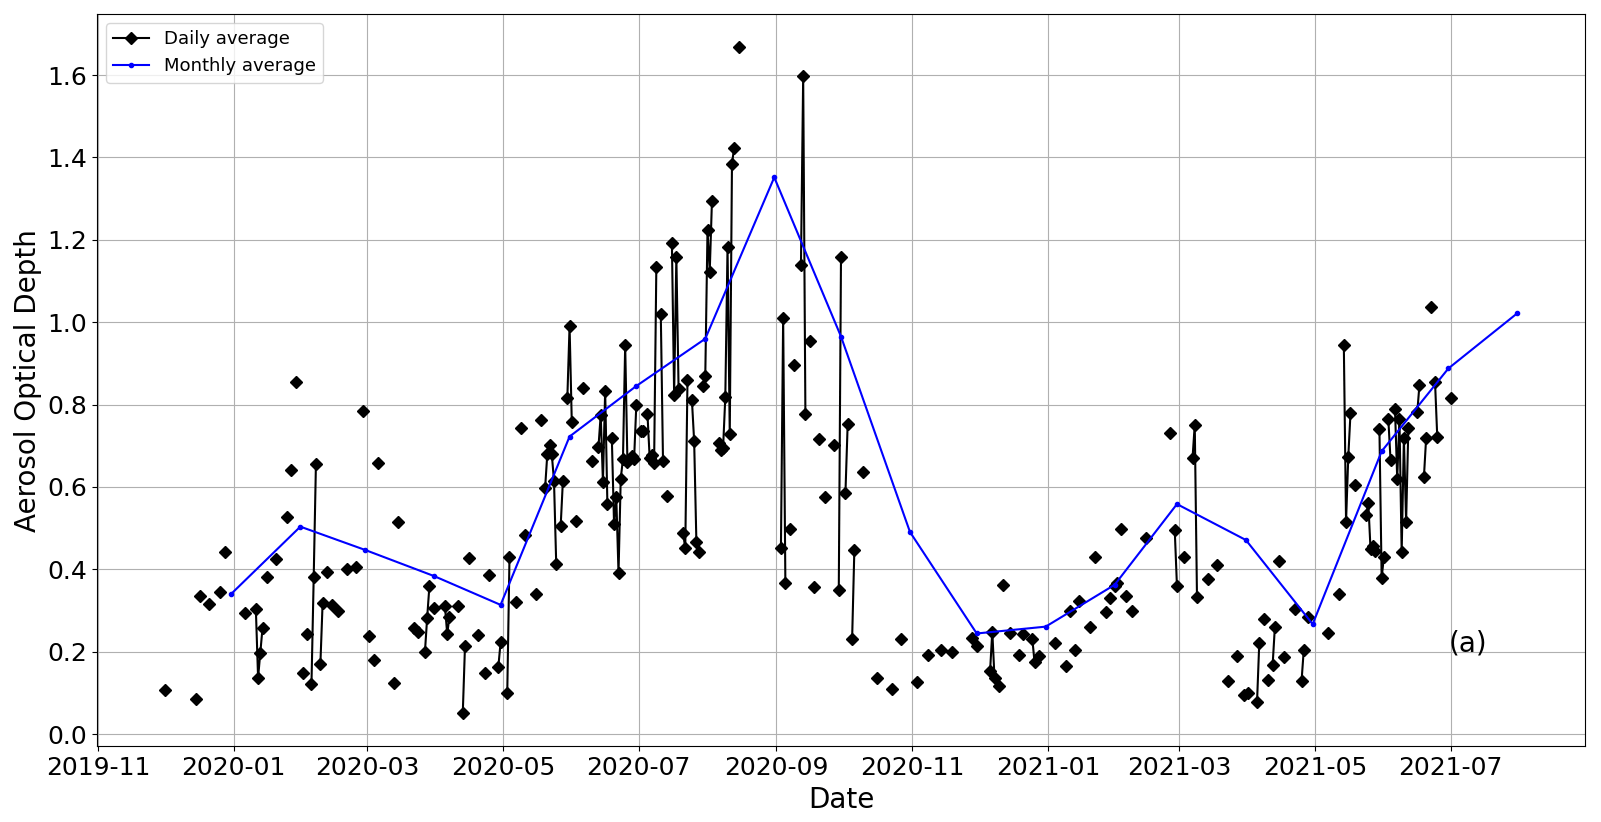
Figure D1Time series of the monthly aerosol optical depth (AOD) observed at 550 nm wavelength by the MODIS Terra instrument downloaded from https://giovanni.gsfc.nasa.gov/giovanni/ (last access: 2 June 2023) for an area covering the city of Kinshasa (3–5∘ S, 14–16∘ E).
This MMF algorithm code is available from the authors upon request (Martina Michaela Friedrich, martina.m.friedrich@aeronomie.be).
The spectra, dSCDs, profile and VCD supporting the conclusions of this study are available from BIRA-IASB. The GEOS-Chem data are available from the Université de Liège. All these data are available upon request. Please contact the authors.
The supplement related to this article is available online at: https://doi.org/10.5194/amt-16-5029-2023-supplement.
RYP participated in the installation of the instrument in Kinshasa, ran the simulations, processed the GEOS-Chem model data, developed the extraction algorithms and calculations for the comparison between TROPOMI versus MAX-DOAS and GEOS-Chem, and wrote the paper. AM and GP contributed to the design and installation of the MAX-DOAS instrument, extraction of FRM4DOAS products, provision of TROPOMI NO2 data, scientific discussions, and editing of the paper. MMF and FH provided the FRM4DOAS tool for inversion of the MAX-DOAS data used and guided RYP in understanding the concepts used. JFM and TS provided the TROPOMI oversampling figures, supported and guided RDY in interpreting the results, and participated actively in the scientific discussion. IDS provided the TROPOMI H2CO data and participated in the scientific discussion. RBML and EPP participated in the scientific discussion. ED provided NO2 data and took part in discussions and exchanges with RDY. BLD is in charge of the MAX-DOAS instrument in Kinshasa. LJ participated in the design of the optical head of the instrument. CF and MVR developed and made available to us QDOAS and participated actively in scientific discussions. EM and JPMT supervised the present work, provided general guidance and valuable comments throughout the process of preparing the paper, and reviewed and edited the paper. All authors reviewed, discussed and commented on the article.
At least one of the (co-)authors is a member of the editorial board of Atmospheric Measurement Techniques. The peer-review process was guided by an independent editor, and the authors also have no other competing interests to declare.
Publisher’s note: Copernicus Publications remains neutral with regard to jurisdictional claims made in the text, published maps, institutional affiliations, or any other geographical representation in this paper. While Copernicus Publications makes every effort to include appropriate place names, the final responsibility lies with the authors.
We thank Robert Spurr for the free deployment of VLIDORT. The MERRA-2 data used in this study have been provided by the Global Modeling and Assimilation Office (GMAO) at NASA Goddard Space Flight Center. We thank Jacob Sabkinu for his support of our project. Emmanuel Mahieu is a senior research associate with the F.R.S.–FNRS.
This research was partly funded by UR SPHERES of the Université de Liège and by the Belgian Federal Science Policy Office (BELSPO) through the EQUATOR (Emission QUantification of Atmospheric tracers in the Tropics using ObseRvations from satellites, 2021–2025) project. Rodriguez Yombo Phaka benefits from a scholarship funded by the Commission de la Coopération au Développement (ARES-CCD) of the Académie de Recherche et d'Enseignement Supérieur, managed at the Université de Liège by the Centre pour le Partenariat et la Coopération au Développement (PACODEL).
This paper was edited by Glenn Wolfe and reviewed by two anonymous referees.
Bauwens, M., Stavrakou, T., Müller, J.-F., De Smedt, I., Van Roozendael, M., van der Werf, G. R., Wiedinmyer, C., Kaiser, J. W., Sindelarova, K., and Guenther, A.: Nine years of global hydrocarbon emissions based on source inversion of OMI formaldehyde observations, Atmos. Chem. Phys., 16, 10133–10158, https://doi.org/10.5194/acp-16-10133-2016, 2016. a
Beirle, S., Dörner, S., Donner, S., Remmers, J., Wang, Y., and Wagner, T.: The Mainz profile algorithm (MAPA), Atmos. Meas. Tech., 12, 1785–1806, https://doi.org/10.5194/amt-12-1785-2019, 2019. a
Bockarie, A. S., Marais, E. A., and MacKenzie, A. R.: Air Pollution and Climate Forcing of the Charcoal Industry in Africa, Environ. Sci. Technol., 54, 13429–13438, https://doi.org/10.1021/acs.est.0c03754, 2020. a
Boersma, K. F., Eskes, H. J., and Brinksma, E. J.: Error analysis for tropospheric NO2 retrieval from space, J. Geophys. Res.-Atmos., 109, D04311, https://doi.org/10.1029/2003jd003962, 2004. a
Cai, K., Li, S., Lai, J., Xia, Y., Wang, Y., Hu, X., and Li, A.: Evaluation of TROPOMI and OMI Tropospheric NO2 Products Using Measurements from MAX-DOAS and State-Controlled Stations in the Jiangsu Province of China, Atmosphere, 13, 886, https://doi.org/10.3390/atmos13060886, 2022. a
Chan, K. L., Wiegner, M., van Geffen, J., De Smedt, I., Alberti, C., Cheng, Z., Ye, S., and Wenig, M.: MAX-DOAS measurements of tropospheric NO2 and HCHO in Munich and the comparison to OMI and TROPOMI satellite observations, Atmos. Meas. Tech., 13, 4499–4520, https://doi.org/10.5194/amt-13-4499-2020, 2020. a
Chance, K. and Kurucz, R. L.: An improved high-resolution solar reference spectrum for earth's atmosphere measurements in the ultraviolet, visible, and near infrared, J. Quant. Spectrosc. Ra. Transf., 111, 1289–1295, https://doi.org/10.1016/j.jqsrt.2010.01.036, 2010. a
Chance, K. V. and Spurr, R. J. D.: Ring effect studies: Rayleigh scattering, including molecular parameters for rotational Raman scattering, and the Fraunhofer spectrum, Appl. Opt., 36, 5224, https://doi.org/10.1364/ao.36.005224, 1997. a
Chen, D., Zhou, B., Beirle, S., Chen, L. M., and Wagner, T.: Tropospheric NO2 column densities deduced from zenith-sky DOAS measurements in Shanghai, China, and their application to satellite validation, Atmos. Chem. Phys., 9, 3641–3662, https://doi.org/10.5194/acp-9-3641-2009, 2009. a
Cheng, Y., Wang, Y., Zhang, Y., Crawford, J. H., Diskin, G. S., Weinheimer, A. J., and Fried, A.: Estimator of Surface Ozone Using Formaldehyde and Carbon Monoxide Concentrations Over the Eastern United States in Summer, J. Geophys. Res.-Atmos., 123, 7642–7655, https://doi.org/10.1029/2018JD028452, 2018. a
Cizungu, N. C., Tshibasu, E., Lutete, E., Mushagalusa, C. A., Mugumaarhahama, Y., Ganza, D., Karume, K., Michel, B., Lumbuenamo, R., and Bogaert, J.: Fire risk assessment, spatiotemporal clustering and hotspot analysis in the Luki biosphere reserve region, western DR Congo, Trees, Forests and People, 5, 100104, https://doi.org/10.1016/j.tfp.2021.100104, 2021. a
Crutzen, P. J.: The The role of NO and NO2 in the chemistry of the troposphere and stratosphere, Ann. Rev. Earth Planet. Sci, 7, 443–72, 1979. a
Danckaert, T. and Fayt, C.: QDOAS Software user manual, September, Royal Belgian Institute for Space Aeronomy (BIRA), Brussel, 123, http://uv-vis.aeronomie.be/software/QDOAS (last access: 27 May 2023), 2017. a
de Foy, B., Krotkov, N. A., Bei, N., Herndon, S. C., Huey, L. G., Martínez, A.-P., Ruiz-Suárez, L. G., Wood, E. C., Zavala, M., and Molina, L. T.: Hit from both sides: tracking industrial and volcanic plumes in Mexico City with surface measurements and OMI SO2 retrievals during the MILAGRO field campaign, Atmos. Chem. Phys., 9, 9599–9617, https://doi.org/10.5194/acp-9-9599-2009, 2009. a
De Smedt, I., Stavrakou, T., Hendrick, F., Danckaert, T., Vlemmix, T., Pinardi, G., Theys, N., Lerot, C., Gielen, C., Vigouroux, C., Hermans, C., Fayt, C., Veefkind, P., Müller, J.-F., and Van Roozendael, M.: Diurnal, seasonal and long-term variations of global formaldehyde columns inferred from combined OMI and GOME-2 observations, Atmos. Chem. Phys., 15, 12519–12545, https://doi.org/10.5194/acp-15-12519-2015, 2015. a
De Smedt, I., Pinardi, G., Vigouroux, C., Compernolle, S., Bais, A., Benavent, N., Boersma, F., Chan, K.-L., Donner, S., Eichmann, K.-U., Hedelt, P., Hendrick, F., Irie, H., Kumar, V., Lambert, J.-C., Langerock, B., Lerot, C., Liu, C., Loyola, D., Piters, A., Richter, A., Rivera Cárdenas, C., Romahn, F., Ryan, R. G., Sinha, V., Theys, N., Vlietinck, J., Wagner, T., Wang, T., Yu, H., and Van Roozendael, M.: Comparative assessment of TROPOMI and OMI formaldehyde observations and validation against MAX-DOAS network column measurements, Atmos. Chem. Phys., 21, 12561–12593, https://doi.org/10.5194/acp-21-12561-2021, 2021. a, b, c, d, e
Dimitropoulou, E., Hendrick, F., Pinardi, G., Friedrich, M. M., Merlaud, A., Tack, F., De Longueville, H., Fayt, C., Hermans, C., Laffineur, Q., Fierens, F., and Van Roozendael, M.: Validation of TROPOMI tropospheric NO2 columns using dual-scan multi-axis differential optical absorption spectroscopy (MAX-DOAS) measurements in Uccle, Brussels, Atmos. Meas. Tech., 13, 5165–5191, https://doi.org/10.5194/amt-13-5165-2020, 2020. a, b, c, d, e
Fortems-Cheiney, A., Chevallier, F., Pison, I., Bousquet, P., Saunois, M., Szopa, S., Cressot, C., Kurosu, T. P., Chance, K., and Fried, A.: The formaldehyde budget as seen by a global-scale multi-constraint and multi-species inversion system, Atmos. Chem. Phys., 12, 6699–6721, https://doi.org/10.5194/acp-12-6699-2012, 2012. a
Friedrich, M. M., Rivera, C., Stremme, W., Ojeda, Z., Arellano, J., Bezanilla, A., García-Reynoso, J. A., and Grutter, M.: NO2 vertical profiles and column densities from MAX-DOAS measurements in Mexico City, Atmos. Meas. Tech., 12, 2545–2565, https://doi.org/10.5194/amt-12-2545-2019, 2019. a
Frieß, U., Beirle, S., Alvarado Bonilla, L., Bösch, T., Friedrich, M. M., Hendrick, F., Piters, A., Richter, A., van Roozendael, M., Rozanov, V. V., Spinei, E., Tirpitz, J.-L., Vlemmix, T., Wagner, T., and Wang, Y.: Intercomparison of MAX-DOAS vertical profile retrieval algorithms: studies using synthetic data, Atmos. Meas. Tech., 12, 2155–2181, https://doi.org/10.5194/amt-12-2155-2019, 2019. a
FRM4DOAS ATBD, A.: Fiducial Reference Measurements for Ground-Based DOAS Air-Quality Observations Deliverable D3: MAXDOAS Instruments Review, Tech. Rep. 4000118181, 63 pp., http://frm4doas.aeronomie.be/index.php/documents (last access: 27 May 2023), 2017. a
Gielen, C., Roozendael, M. V., Hendrick, F., Pinardi, G., Vlemmix, T., Bock, V. D., Backer, H. D., Fayt, C., Hermans, C., Gillotay, D., and Wang, P.: A simple and versatile cloud-screening method for MAX-DOAS retrievals, Atmos. Meas. Tech., 7, 3509–3527, https://doi.org/10.5194/amt-7-3509-2014, 2014. a
Griffin, D., Zhao, X., McLinden, C. A., Boersma, F., Bourassa, A., Dammers, E., Degenstein, D., Eskes, H., Fehr, L., Fioletov, V., Hayden, K., Kharol, S. K., Li, S. M., Makar, P., Martin, R. V., Mihele, C., Mittermeier, R. L., Krotkov, N., Sneep, M., Lamsal, L. N., ter Linden, M., van Geffen, J., Veefkind, P., and Wolde, M.: High-Resolution Mapping of Nitrogen Dioxide With TROPOMI: First Results and Validation Over the Canadian Oil Sands, Geophys. Res. Lett., 46, 1049–1060, https://doi.org/10.1029/2018GL081095, 2019. a
Guenther, A., Karl, T., Harley, P., Wiedinmyer, C., Palmer, P. I., and Geron, C.: Estimates of global terrestrial isoprene emissions using MEGAN (Model of Emissions of Gases and Aerosols from Nature), Atmos. Chem. Phys., 6, 3181–3210, https://doi.org/10.5194/acp-6-3181-2006, 2006. a
Heckel, A., Kim, S.-W., Frost, G. J., Richter, A., Trainer, M., and Burrows, J. P.: Influence of low spatial resolution a priori data on tropospheric NO2 satellite retrievals, Atmos. Meas. Tech., 4, 1805–1820, https://doi.org/10.5194/amt-4-1805-2011, 2011. a
Ialongo, I., Virta, H., Eskes, H., Hovila, J., and Douros, J.: Comparison of TROPOMI/Sentinel-5 Precursor NO2 observations with ground-based measurements in Helsinki, Atmos. Meas. Tech., 13, 205–218, https://doi.org/10.5194/amt-13-205-2020, 2020. a
Irie, H., Kanaya, Y., Akimoto, H., Tanimoto, H., Wang, Z., Gleason, J. F., and Bucsela, E. J.: Validation of OMI tropospheric NO2 column data using MAX-DOAS measurements deep inside the North China Plain in June 2006: Mount Tai Experiment 2006, Atmos. Chem. Phys., 8, 6577–6586, https://doi.org/10.5194/acp-8-6577-2008, 2008. a, b
Karagkiozidis, D., Friedrich, M. M., Beirle, S., Bais, A., Hendrick, F., Voudouri, K. A., Fountoulakis, I., Karanikolas, A., Tzoumaka, P., Van Roozendael, M., Balis, D., and Wagner, T.: Retrieval of tropospheric aerosol, NO2, and HCHO vertical profiles from MAX-DOAS observations over Thessaloniki, Greece: intercomparison and validation of two inversion algorithms, Atmos. Meas. Tech., 15, 1269–1301, https://doi.org/10.5194/amt-15-1269-2022, 2022. a
Keller, C. A., Long, M. S., Yantosca, R. M., Da Silva, A. M., Pawson, S., and Jacob, D. J.: HEMCO v1.0: a versatile, ESMF-compliant component for calculating emissions in atmospheric models, Geosci. Model Dev., 7, 1409–1417, https://doi.org/10.5194/gmd-7-1409-2014, 2014. a
Koelemeijer, R. B., Stammes, P., Hovenier, J. W., and Haan, J. F. D.: A fast method for retrieval of cloud parameters using oxygen a band measurements from the Global Ozone Monitoring Experiment, J. Geophys. Res.-Atmos., 106, 3475–3490, https://doi.org/10.1029/2000JD900657, 2001. a
Leitão, J., Richter, A., Vrekoussis, M., Kokhanovsky, A., Zhang, Q. J., Beekmann, M., and Burrows, J. P.: On the improvement of NO2 satellite retrievals – aerosol impact on the airmass factors, Atmos. Meas. Tech., 3, 475–493, https://doi.org/10.5194/amt-3-475-2010, 2010. a
Liousse, C., Assamoi, E., Criqui, P., Granier, C., and Rosset, R.: Explosive growth in African combustion emissions from 2005 to 2030, Environ. Res. Lett, 9, 3, https://doi.org/10.1088/1748-9326/9/3/035003, 2014. a
Lorente, A., Folkert Boersma, K., Yu, H., Dörner, S., Hilboll, A., Richter, A., Liu, M., Lamsal, L. N., Barkley, M., De Smedt, I., Van Roozendael, M., Wang, Y., Wagner, T., Beirle, S., Lin, J.-T., Krotkov, N., Stammes, P., Wang, P., Eskes, H. J., and Krol, M.: Structural uncertainty in air mass factor calculation for NO2 and HCHO satellite retrievals, Atmos. Meas. Tech., 10, 759–782, https://doi.org/10.5194/amt-10-759-2017, 2017. a
Lunt, M. F., Palmer, P. I., Feng, L., Taylor, C. M., Boesch, H., and Parker, R. J.: An increase in methane emissions from tropical Africa between 2010 and 2016 inferred from satellite data, Atmos. Chem. Phys., 19, 14721–14740, https://doi.org/10.5194/acp-19-14721-2019, 2019. a
Ma, J. Z., Beirle, S., Jin, J. L., Shaiganfar, R., Yan, P., and Wagner, T.: Tropospheric NO2 vertical column densities over Beijing: results of the first three years of ground-based MAX-DOAS measurements (2008–2011) and satellite validation, Atmos. Chem. Phys., 13, 1547–1567, https://doi.org/10.5194/acp-13-1547-2013, 2013. a
Marais, E. A. and Wiedinmyer, C.: Air Quality Impact of Diffuse and Inefficient Combustion Emissions in Africa (DICE-Africa), Environ. Sci. Technol., 50, 10739–10745, https://doi.org/10.1021/acs.est.6b02602, 2016. a, b
Marais, E. A., Jacob, D. J., Kurosu, T. P., Chance, K., Murphy, J. G., Reeves, C., Mills, G., Casadio, S., Millet, D. B., Barkley, M. P., Paulot, F., and Mao, J.: Isoprene emissions in Africa inferred from OMI observations of formaldehyde columns, Atmos. Chem. Phys., 12, 6219–6235, https://doi.org/10.5194/acp-12-6219-2012, 2012. a
Marais, E. A., Silvern, R. F., Vodonos, A., Dupin, E., Bockarie, A. S., Mickley, L. J., and Schwartz, J.: Air Quality and Health Impact of Future Fossil Fuel Use for Electricity Generation and Transport in Africa, Environ. Sci. Technol., 53, 13524–13534, https://doi.org/10.1021/acs.est.9b04958, 2019. a
Marais, E. A., Roberts, J. F., Ryan, R. G., Eskes, H., Boersma, K. F., Choi, S., Joiner, J., Abuhassan, N., Redondas, A., Grutter, M., Cede, A., Gomez, L., and Navarro-Comas, M.: New observations of NO2 in the upper troposphere from TROPOMI, Atmos. Meas. Tech., 14, 2389–2408, https://doi.org/10.5194/amt-14-2389-2021, 2021. a
Mayaux, P., Pekel, J. F., Desclée, B., Donnay, F., Lupi, A., Achard, F., Clerici, M., Bodart, C., Brink, A., Nasi, R., and Belward, A.: State and evolution of the African rainforests between 1990 and 2010, Philos. Trans. Roy. Soc. B, 368, 7, https://doi.org/10.1098/rstb.2012.0300, 2013. a
McFarlane, C., Isevulambire, P. K., Lumbuenamo, R. S., Ndinga, A. M. E., Dhammapala, R., Jin, X., McNeill, V. F., Malings, C., Subramanian, R., and Westervelt, D. M.: First measurements of ambient pm2.5 in kinshasa, democratic republic of congo and brazzaville, republic of congo using field-calibrated low-cost sensors, Aerosol Air Qual. Res., 21, 7, https://doi.org/10.4209/aaqr.200619, 2021. a
McLinden, C. A., Fioletov, V., Boersma, K. F., Krotkov, N., Sioris, C. E., Veefkind, J. P., and Yang, K.: Air quality over the Canadian oil sands: A first assessment using satellite observations, Geophys. Res. Lett., 39, L04804, https://doi.org/10.1029/2011GL050273, 2012. a
McLinden, C. A., Fioletov, V., Boersma, K. F., Kharol, S. K., Krotkov, N., Lamsal, L., Makar, P. A., Martin, R. V., Veefkind, J. P., and Yang, K.: Improved satellite retrievals of NO2 and SO2 over the Canadian oil sands and comparisons with surface measurements, Atmos. Chem. Phys., 14, 3637–3656, https://doi.org/10.5194/acp-14-3637-2014, 2014. a
Meller, R. and Moortgat, G. K.: Temperature dependence of the absorption cross sections of formaldehyde between 223 and 323 K in the wavelength range 225–375 nm, J. Geophys. Res.-Atmos., 105, 7089–7101, https://doi.org/10.1029/1999JD901074, 2000. a
Pinardi, G., Van Roozendael, M., Abuhassan, N., Adams, C., Cede, A., Clémer, K., Fayt, C., Frieß, U., Gil, M., Herman, J., Hermans, C., Hendrick, F., Irie, H., Merlaud, A., Navarro Comas, M., Peters, E., Piters, A. J. M., Puentedura, O., Richter, A., Schönhardt, A., Shaiganfar, R., Spinei, E., Strong, K., Takashima, H., Vrekoussis, M., Wagner, T., Wittrock, F., and Yilmaz, S.: MAX-DOAS formaldehyde slant column measurements during CINDI: intercomparison and analysis improvement, Atmos. Meas. Tech., 6, 167–185, https://doi.org/10.5194/amt-6-167-2013, 2013. a
Pinardi, G., Van Roozendael, M., Hendrick, F., Theys, N., Abuhassan, N., Bais, A., Boersma, F., Cede, A., Chong, J., Donner, S., Drosoglou, T., Dzhola, A., Eskes, H., Frieß, U., Granville, J., Herman, J. R., Holla, R., Hovila, J., Irie, H., Kanaya, Y., Karagkiozidis, D., Kouremeti, N., Lambert, J.-C., Ma, J., Peters, E., Piters, A., Postylyakov, O., Richter, A., Remmers, J., Takashima, H., Tiefengraber, M., Valks, P., Vlemmix, T., Wagner, T., and Wittrock, F.: Validation of tropospheric NO2 column measurements of GOME-2A and OMI using MAX-DOAS and direct sun network observations, Atmos. Meas. Tech., 13, 6141–6174, https://doi.org/10.5194/amt-13-6141-2020, 2020. a
Poraicu, C., Müller, J.-F., Stavrakou, T., Fonteyn, D., Tack, F., Deutsch, F., Laffineur, Q., Van Malderen, R., and Veldeman, N.: Cross-evaluating WRF-Chem v4.1.2, TROPOMI, APEX, and in situ NO2 measurements over Antwerp, Belgium, Geosci. Model Dev., 16, 479–508, https://doi.org/10.5194/gmd-16-479-2023, 2023. a
Rothman, L., Gordon, I., Barber, R., Dothe, H., Gamache, R., Goldman, A., Perevalov, V., Tashkun, S., and Tennyson, J.: HITEMP, the high-temperature molecular spectroscopic database, J. Quant. Spectrosc. Ra. Transf., 111, 2139–2150, https://doi.org/10.1016/j.jqsrt.2010.05.001, 2010. a
Seinfeld, J. H. and Pandis, S. N.: From Air Pollution to Climate Change, Atmos. Chem. Phys., John Wiley and Sons, Inc, 978-1118947401, 1152 pp., 1998. a, b
Serdyuchenko, A., Gorshelev, V., Weber, M., Chehade, W., and Burrows, J. P.: High spectral resolution ozone absorption cross-sections – Part 2: Temperature dependence, Atmos. Meas. Tech., 7, 625–636, https://doi.org/10.5194/amt-7-625-2014, 2014. a
Spurr, R. J. D.: VLIDORT: A linearized pseudo-spherical vector discrete ordinate radiative transfer code for forward model and retrieval studies in multilayer multiple scattering media, J. Quant. Spectrosc. Ra., 102, 316–342, https://doi.org/10.1016/j.jqsrt.2006.05.005, 2006. a
Stavrakou, T., Müller, J.-F., De Smedt, I., Van Roozendael, M., van der Werf, G. R., Giglio, L., and Guenther, A.: Evaluating the performance of pyrogenic and biogenic emission inventories against one decade of space-based formaldehyde columns, Atmos. Chem. Phys., 9, 1037–1060, https://doi.org/10.5194/acp-9-1037-2009, 2009. a, b
Stavrakou, T., Müller, J.-F., Bauwens, M., De Smedt, I., Van Roozendael, M., De Mazière, M., Vigouroux, C., Hendrick, F., George, M., Clerbaux, C., Coheur, P.-F., and Guenther, A.: How consistent are top-down hydrocarbon emissions based on formaldehyde observations from GOME-2 and OMI?, Atmos. Chem. Phys., 15, 11861–11884, https://doi.org/10.5194/acp-15-11861-2015, 2015. a
Tack, F., Merlaud, A., Iordache, M.-D., Pinardi, G., Dimitropoulou, E., Eskes, H., Bomans, B., Veefkind, P., and Van Roozendael, M.: Assessment of the TROPOMI tropospheric NO2 product based on airborne APEX observations, Atmos. Meas. Tech., 14, 615–646, https://doi.org/10.5194/amt-14-615-2021, 2021. a
Thalman, R. and Volkamer, R.: Temperature dependent absorption cross-sections of O2–O2 collision pairs between 340 and 630 nm and at atmospherically relevant pressure, Phys. Chem. Chem. Phys., 15, 15371–15381, https://doi.org/10.1039/C3CP50968K, 2013. a
Tirpitz, J.-L., Frieß, U., Hendrick, F., Alberti, C., Allaart, M., Apituley, A., Bais, A., Beirle, S., Berkhout, S., Bognar, K., Bösch, T., Bruchkouski, I., Cede, A., Chan, K. L., den Hoed, M., Donner, S., Drosoglou, T., Fayt, C., Friedrich, M. M., Frumau, A., Gast, L., Gielen, C., Gomez-Martín, L., Hao, N., Hensen, A., Henzing, B., Hermans, C., Jin, J., Kreher, K., Kuhn, J., Lampel, J., Li, A., Liu, C., Liu, H., Ma, J., Merlaud, A., Peters, E., Pinardi, G., Piters, A., Platt, U., Puentedura, O., Richter, A., Schmitt, S., Spinei, E., Stein Zweers, D., Strong, K., Swart, D., Tack, F., Tiefengraber, M., van der Hoff, R., van Roozendael, M., Vlemmix, T., Vonk, J., Wagner, T., Wang, Y., Wang, Z., Wenig, M., Wiegner, M., Wittrock, F., Xie, P., Xing, C., Xu, J., Yela, M., Zhang, C., and Zhao, X.: Intercomparison of MAX-DOAS vertical profile retrieval algorithms: studies on field data from the CINDI-2 campaign, Atmos. Meas. Tech., 14, 1–35, https://doi.org/10.5194/amt-14-1-2021, 2021. a
UN: The World's cities in 2016: data booklet, United Nations, 9789211515497, 26 pp., 2016. a
Vandaele, A. C., Hermans, C., Simon, P. C., Roozendael, M. V., Guilmot, J. M., Carleer, M., and Colin, R.: Fourier transform measurement of NO2 absorption cross-section in the visible range at room temperature, J. Atmos. Chem., 25, 289–305, https://doi.org/10.1007/BF00053797, 1996. a
Vandaele, A. C., Hermans, C., Simon, P. C., Carleer, M., Colin, R., Fally, S., Mérienne, M. F., Jenouvrier, A., and Coquart, B.: Measurements of the NO2 absorption cross-section from 42 000 cm−1 to 10 000 cm−1 (238–1000 nm) at 220 K and 294 K, J. Quant. Spectrosc. Ra. Transf., 59, 171–184, https://doi.org/10.1016/S0022-4073(97)00168-4, 1998. a
van Geffen, J., Eskes, H., Compernolle, S., Pinardi, G., Verhoelst, T., Lambert, J.-C., Sneep, M., ter Linden, M., Ludewig, A., Boersma, K. F., and Veefkind, J. P.: Sentinel-5P TROPOMI NO2 retrieval: impact of version v2.2 improvements and comparisons with OMI and ground-based data, Atmos. Meas. Tech., 15, 2037–2060, https://doi.org/10.5194/amt-15-2037-2022, 2022. a
Veefkind, J. P., Aben, I., McMullan, K., Förster, H., de Vries, J., Otter, G., Claas, J., Eskes, H. J., de Haan, J. F., Kleipool, Q., van Weele, M., Hasekamp, O., Hoogeveen, R., Landgraf, J., Snel, R., Tol, P., Ingmann, P., Voors, R., Kruizinga, B., Vink, R., Visser, H., and Levelt, P. F.: TROPOMI on the ESA Sentinel-5 Precursor: A GMES mission for global observations of the atmospheric composition for climate, air quality and ozone layer applications, Remote Sens. Environ., 120, 70–83, https://doi.org/10.1016/j.rse.2011.09.027, 2012. a
Verhoelst, T., Compernolle, S., Pinardi, G., Lambert, J.-C., Eskes, H. J., Eichmann, K.-U., Fjæraa, A. M., Granville, J., Niemeijer, S., Cede, A., Tiefengraber, M., Hendrick, F., Pazmiño, A., Bais, A., Bazureau, A., Boersma, K. F., Bognar, K., Dehn, A., Donner, S., Elokhov, A., Gebetsberger, M., Goutail, F., Grutter de la Mora, M., Gruzdev, A., Gratsea, M., Hansen, G. H., Irie, H., Jepsen, N., Kanaya, Y., Karagkiozidis, D., Kivi, R., Kreher, K., Levelt, P. F., Liu, C., Müller, M., Navarro Comas, M., Piters, A. J. M., Pommereau, J.-P., Portafaix, T., Prados-Roman, C., Puentedura, O., Querel, R., Remmers, J., Richter, A., Rimmer, J., Rivera Cárdenas, C., Saavedra de Miguel, L., Sinyakov, V. P., Stremme, W., Strong, K., Van Roozendael, M., Veefkind, J. P., Wagner, T., Wittrock, F., Yela González, M., and Zehner, C.: Ground-based validation of the Copernicus Sentinel-5P TROPOMI NO2 measurements with the NDACC ZSL-DOAS, MAX-DOAS and Pandonia global networks, Atmos. Meas. Tech., 14, 481–510, https://doi.org/10.5194/amt-14-481-2021, 2021. a, b
Vigouroux, C., Langerock, B., Bauer Aquino, C. A., Blumenstock, T., Cheng, Z., De Mazière, M., De Smedt, I., Grutter, M., Hannigan, J. W., Jones, N., Kivi, R., Loyola, D., Lutsch, E., Mahieu, E., Makarova, M., Metzger, J.-M., Morino, I., Murata, I., Nagahama, T., Notholt, J., Ortega, I., Palm, M., Pinardi, G., Röhling, A., Smale, D., Stremme, W., Strong, K., Sussmann, R., Té, Y., van Roozendael, M., Wang, P., and Winkler, H.: TROPOMI–Sentinel-5 Precursor formaldehyde validation using an extensive network of ground-based Fourier-transform infrared stations, Atmos. Meas. Tech., 13, 3751–3767, https://doi.org/10.5194/amt-13-3751-2020, 2020. a, b, c
Vohra, K., Marais, E., Bloss, W. J., Schwartz, J., Mickley, L. J., Van Damme, M., Lieven, C., and Coheur, P.-F.: Rapid rise in premature mortality due to anthropogenic air pollution in fast-growing tropical cities from 2005 to 2018, Sci. Adv., 8, eabm4435, https://doi.org/10.1126/sciadv.abm4435, 2022. a
Wagner, T., Deutschmann, T., and Platt, U.: Determination of aerosol properties from MAX-DOAS observations of the Ring effect, Atmos. Meas. Tech., 2, 495–512, https://doi.org/10.5194/amt-2-495-2009, 2009. a
Williams, J. E., Boersma, K. F., Le Sager, P., and Verstraeten, W. W.: The high-resolution version of TM5-MP for optimized satellite retrievals: description and validation, Geosci. Model Dev., 10, 721–750, https://doi.org/10.5194/gmd-10-721-2017, 2017. a, b
Yombo Phaka, R., Merlaud, A., Pinardi, G., Mahieu, E., Hendrick, F., Friedrich, M. M., Fayt, C., Van Roozendael, M., Djibi, B. L., Bopili Mbotia Lepiba, R., Phuku Phuati, E., and Mbungu Tsumbu, J.-P.: First Ground−Based Doas Measurements of NO2 At Kinshasa and Comparisons With Satellite Observations, J. Atmos. Ocean. Technol., 38, 1291–1304, https://doi.org/10.1175/jtech-d-20-0195.1, 2021. a, b, c, d, e, f
Zhao, X., Griffin, D., Fioletov, V., McLinden, C., Cede, A., Tiefengraber, M., Müller, M., Bognar, K., Strong, K., Boersma, F., Eskes, H., Davies, J., Ogyu, A., and Lee, S. C.: Assessment of the quality of TROPOMI high-spatial-resolution NO2 data products in the Greater Toronto Area, Atmos. Meas. Tech., 13, 2131–2159, https://doi.org/10.5194/amt-13-2131-2020, 2020. a, b
Zhu, L., Jacob, D. J., Mickley, L. J., Marais, E. A., Cohan, D. S., Yoshida, Y., Duncan, B. N., Abad, G. G., and Chance, K. V.: Anthropogenic emissions of highly reactive volatile organic compounds in eastern Texas inferred from oversampling of satellite (OMI) measurements of HCHO columns, Environ. Res. Lett., 9, 114004, https://doi.org/10.1088/1748-9326/9/11/114004, 2014. a
https://www-air.larc.nasa.gov/missions/ndacc/data.html?RapidDelivery=rd-list, last access: 10 July 2023
- Abstract
- Introduction
- Observations and datasets
- Results
- Discussion
- Conclusions
- Appendix A: NO2 intercomparison of TROPOMI with MAX-DOAS: case 3
- Appendix B: H2CO intercomparison of TROPOMI with MAX-DOAS: case 3
- Appendix C: Median profiles
- Appendix D: AOD MODIS
- Code availability
- Data availability
- Author contributions
- Competing interests
- Disclaimer
- Acknowledgements
- Financial support
- Review statement
- References
- Supplement