the Creative Commons Attribution 4.0 License.
the Creative Commons Attribution 4.0 License.
 | 03 Nov 2023
Local comparisons of tropospheric ozone: vertical soundings at two neighbouring stations in southern Bavaria
Thomas Trickl
Martin Adelwart
Dina Khordakova
Ludwig Ries
Christian Rolf
Michael Sprenger
Wolfgang Steinbrecht
Hannes Vogelmann
In this study ozone profiles of the differential-absorption lidar at Garmisch-Partenkirchen are compared with those of ozone sondes of the Forschungszentrum Jülich and of the Meteorological Observatory Hohenpeißenberg (German Weather Service). The lidar measurements are quality assured by the highly accurate nearby in situ ozone measurements at the Wank (1780 m a.s.l.) and Zugspitze (2962 m a.s.l.) summits and at the Global Atmosphere Watch station Schneefernerhaus (UFS, 2670 m a.s.l.), at distances of 9 km or less from the lidar. The mixing ratios of the lidar agree with those of the monitoring stations, with a standard deviation (SD) of 1.5 ppb, and feature a slight positive offset of 0.6 ± 0.6 ppb (SD) conforming to the known −1.8 % calibration bias of the in situ instruments. Side-by-side soundings of the lidar and electrochemical (ECC) sonde measurements in February 2019 by a team of the Forschungszentrum Jülich shows small positive ozone offsets for the sonde with respect to the lidar and the mountain stations (0.5 to 3.4 ppb). After applying an altitude-independent bias correction to the sonde data an agreement to within just ±2.5 ppb in the troposphere was found, which we regard as the wintertime uncertainty of the lidar. We conclude that the recently published uncertainties of the lidar in the final configuration since 2012 are realistic and rather small for low to moderate ozone concentrations. Comparisons of the lidar with the Hohenpeißenberg routine measurements with Brewer-Mast sondes are more demanding because of the distance of 38 km between the two sites implying significant ozone differences in some layers, particularly in summer. Our comparisons cover the 3 years September 2000 to August 2001, 2009, and 2018. A slight negative average offset (−3.64 ± 3.72 ppb (SD)) of the sondes with respect to the lidar was found. We conclude that most Hohenpeißenberg sonde data could be improved in the troposphere by recalibration with the Zugspitze station data (1978 to 2011 summit, afterwards UFS). This would not only remove the average offset but also greatly reduce the variability of the individual offsets. The comparison for 2009 suggests a careful partial re-evaluation of the lidar measurements between 2007 and 2011 for altitudes above 6 km, where occasionally a negative bias occurred.
- Article
(7141 KB) - Full-text XML
- BibTeX
- EndNote


The development of tropospheric ozone has been studied over more than a century (e.g. Gaudel et al., 2018; Tarasick et al., 2019). For many decades, balloon-borne ozone sondes have been a primary work horse of ozone profiling. Their measurement principle is based on the oxidation of iodide (I−) to iodine (I2) by ozone in a wet-chemical potassium iodide (KI) cell. Between the cathode and the anode of the wet-chemical cell, the oxidation reaction drives an electrical current that can be measured (two electrons per ozone molecule). Recently, nearly all stations have used the so-called ECC (electro-chemical-cell) sonde type (Komhyr, 1969; Komhyr et al., 1995), featuring two cells with different potassium iodide concentrations (anode and cathode cell). Only the Hohenpeißenberg station, discussed here, still uses the older-type Brewer-Mast sondes (Brewer and Milford, 1960), which use one cell only (with a platinum cathode and a silver anode), and a less efficient pump design (Steinbrecht et al., 1998). Ozone sondes have been characterized in numerous studies, both in flight (e.g. Attmannspacher and Dütsch, 1981; De Muer and Malcorps, 1984; Beekmann et al., 1994; Kerr et al., 1994; Jeannet et al., 2007; in recent years: Gaudel et al., 2015; Van Malderen et al., 2016; Deshler et al., 2017; Tarasick et al., 2021; Ancellet et al., 2022; Stauffer et al., 2022), and in a laboratory simulation chamber (Smit et al., 2007; Smit and ASOPOS panel, 2014; Smit and Thompson, 2021). Generally, the relative uncertainty of individual ECC soundings for ozone in the mid-latitude troposphere is about 5 % to 10 % (Logan et al., 2012; Smit and ASOPOS panel, 2014; Tarasick et al., 2016, 2019). Following rigorous best practices, 5 % accuracy can be achieved (Vömel et al., 2020; Smit and Thompson, 2021; Tarasick et al., 2019, 2021). For Brewer-Mast soundings, the relative uncertainty in the troposphere is slightly higher, about 10 % to 15 % (Stübi et al., 2008; Smit and ASOPOS panel, 2014; Tarasick et al., 2016, 2019). For tropospheric ozone from Canadian Brewer-Mast soundings prior to 1980 Tarasick et al. (2002, 2016) found a negative bias of about 20 % compared with ECC soundings.
The ozone soundings at the Meteorological Observatory Hohenpeißenberg (MOHp) of the German Weather Service (Deutscher Wetterdienst, DWD) in southern Bavaria have been routinely carried out since November 1966, yielding one of the longest ozone-sonde time series. Brewer-Mast ozone sonde data tend to have a low bias above about 25 km altitude (Steinbrecht et al., 1998). European Brewer-Mast stations have generally used a much more extensive preparation procedure for their sondes (Claude et al., 1987), and no significant tropospheric bias has been reported for their routine Brewer-Mast soundings (de Backer et al., 1998; Stübi et al., 2008; Logan et al., 2012), as well as in chamber experiments (Smit and ASOPOS panel, 2014).
Routine measurements with ozone sondes yield time series free from a fair-weather sampling bias. However, the balloon ascents take place at intervals of several days. Ozone profiles at short intervals (less than 1 min to several minutes) can be provided by lidar sounding, but are limited to clear atmospheric conditions. Lidar measurements can generate altitude-time curtain plots and, thus, give much better insight into the impact of atmospheric transport (e.g. Browell et al., 1987; Ancellet et al., 1991; Langford et al., 1996).
At IFU (Fraunhofer-Institut für Atmosphärische Umweltforschung; now: Karlsruher Institut für Technologie, IMK-IFU) in Garmisch-Partenkirchen (Germany), a differential-absorption lidar (DIAL) with a particularly wide operating range from next to the ground up to the upper troposphere was completed in 1990 within the framework of the TESLAS (Tropospheric Environmental Studies by Laser Sounding) subproject of EUROTRAC (TESLAS, 1997; EUROTRAC, 1997; Kempfer et al., 1994). Subsequently, the system was applied for a full year (1991) within the TOR (Tropospheric Ozone Research; Kley et al., 1997) subproject of EUROTRAC (Carnuth et al., 2002). The operating range of this system was extended upwards to roughly 15 km in 1994 by introducing a three-wavelength operation (Eisele et al., 1999). Owing to its design, the IFU ozone DIAL features particularly low uncertainties (Trickl et al., 2020a).
Until 2003 the system was used for individual research projects. Between 2007 and 2018 routine measurements took place, parallel to lidar measurements of water vapour (Vogelmann and Trickl, 2008) and aerosol (Trickl et al., 2020b). The complementary information from these instruments has made possible a large number of investigations related to atmospheric transport. The IFU ozone DIAL was recently fully described by Trickl et al. (2020a).
The distance between MOHp and IFU is just 38 km, which offers a good chance for comparisons. However, such comparisons must be made with care as the atmospheric variability is high on a rather small temporal and spatial scale (Vogelmann et al., 2011, 2015), mostly caused by the advection of air masses from rather different source region and altitudes, with different concentrations (e.g. Stohl and Trickl, 1999; Trickl et al., 2003, 2011). The variability of the vertical distribution of ozone measurements rarely yields very strong concentration changes, but the concentration changes are extreme for water vapour. Our lidar measurements of water vapour exhibit a concentration span of more than two decades, with minima of the relative humidity (RH) clearly below 1 % in layers descending from the stratosphere (Trickl et al., 2014, 2015, 2016; Klanner et al., 2021).
Comparisons between the MOHp sonde and the IFU ozone lidar were made in the second half of the 1990s and in 2001, after the first upgrading of the lidar. A few of these comparisons in 1996 and 1997 were published by Eisele et al. (1997, 1999). For the six cases with supposedly sufficient air-mass matching a principal agreement in the free troposphere to within 5 % prevailed, with occasional departures of the order of 10 %. Several unpublished comparisons in 2001 showed principal agreement, but also some structural issues due to focussing on stratospheric air intrusions with the STACCATO project (Stohl et al., 2003).
Afterwards, just routine comparisons with the nearby summit stations were made. Until 2010 the lidar results were compared with the long-term measurements at Wank and Zugspitze. Apart from occasional orographically induced deviations, an agreement mostly to within ±2 ppb was found. After these in situ measurements ended (2011) the lidar measurements were compared with the ozone measurements at the Schneefernerhaus high-altitude station (Umweltforschungsstation Schneefernerhaus, UFS, 2671 m a.s.l.). UFS is located just below the Zugspitze summit. Mostly, a similar agreement was found.
However, the need for a validation of the lidar at higher altitudes has been obvious. Such an effort became more and more attractive with the growing technical performance of the system. In addition, hints on ozone differences between the Zugspitze (2962 m a.s.l.) in situ data and the MOHp values (Hans-Eckhart Scheel, personal communication, around 2010) for 3 km a.s.l. have led to a revived interest in a thorough comparison. There have been speculations about an influence of a different air composition outside the mountains at low altitudes up to a few kilometres.
In this paper we first characterize the lidar by side-by-side ascents of ozone sondes by a team of the Forschungszentrum Jülich (FZJ). This effort, also based on the measurements at UFS, demonstrates a high performance of the DIAL within the entire free troposphere, at least under winter-time conditions. Then, based on this performance, we give a statistical assessment of the measurements at IFU and MOHp for the year 2018. For that year we achieved the best coverage by DIAL measurements. This allows us to make an air mass-related data selection to improve the comparison. Finally, we also compare lidar and MOHp sonde for two earlier development phases of the lidar, for which ozone reference data at the local summit stations Wank (1780 m a.s.l.) and Zugspitze exist.
2.1 Brewer-Mast sonde system at Hohenpeißenberg
MOHp (975 m a.s.l., 47.80∘ N, 11.00∘ E) is located on an isolated mountain outside the Alps, 38 km to the north of IMK-IFU and 50 km to the south-west of Munich. Brewer-Mast ozone sondes have been launched on a regular basis since November 1966. The sondes undergo a rigorous preparation procedure (Claude et al., 1987), which has remained essentially unchanged since the early 1970s. From 1995 to 2005, Vaisala RS80 radiosondes and a Vaisala PC-CORA ground station have been used in combination with the ozone sondes. This was changed to Vaisala RS92 radiosondes and DigiCora III MW31 ground equipment in 2005, to an MW41 ground station in 2018, and to Vaisala RS41 radiosondes in 2019. The standard processing does not subtract a background current, but ozone sondes with non-negligible background current on the ground (corresponding to more than 2.5 ppb ozone) are not flown. The background of most sondes launched is well below this threshold. The pump temperature is assumed to be constant at 300 K, which compensates to some degree for too weak a pump correction in the stratosphere (Steinbrecht et al., 1998). The time lag is comparable with that of ECC sondes (about 20 s; see Vömel et al., 2020). A time-lag correction is not applied, but this is not critical outside regions with steep ozone gradients as the corresponding vertical shift is just of the order of 0.1 km. Each ozone profile is adjusted by multiplication with an altitude-independent correction factor (typically around 1.08, standard deviation 5 %), so that the total ozone column estimated from the sounding (including an extrapolation above approximately 30 km) matches the more accurate total ozone measurement from on-site Dobson or Brewer spectrometers, or from satellite instruments. This so-called “Dobson correction” generally improves the accuracy of the ozone sounding data in the stratosphere, but may introduce a small bias in the tropospheric data of some soundings (e.g. Stübi et al., 2008; Logan et al., 2012).
The MOHp ozone-sonde and radiosonde data are stored in the database of the Network for the Detection of Atmospheric Composition Change (NDACC), from which they were imported for the study presented here.
2.2 ECC sonde system of the Forschungszentrum Jülich
A mobile balloon-borne sonde system of the Forschungszentrum Jülich (FZJ) was operated at IMK-IFU (at 730 m a.s.l.), in close vicinity to the ozone DIAL (35 m), during the Far Infrared Radiation Mobile Observation System (FIRMOS) measurement campaign (Klanner et al., 2021; Palchetti et al., 2021; Di Natale et al., 2021; Belotti et al., 2023). Several balloons with cryogenic frostpoint hygrometers (CFHs; Vömel et al., 2007, 2016), standard Vaisala RS-41-SGP radiosondes, En-Sci ECC ozone sondes (Komhyr et al., 1995; Smit et al., 2007), and COBALD backscatter sondes (Brabec, 2011) were launched. The data were transmitted to a ground station installed for this campaign at the Zugspitze summit. The combined balloon payload is well tested and regularly also used by the GCOS Reference Upper Air Network (e.g. Dirksen et al., 2014).
We followed the standard operating procedures of Smit and ASOPOS panel (2014) for the sonde preparation using a solution composition of 1 % and (one-tenth) buffer for best results with sondes from the manufacturer En-Sci (Thompson et al., 2019).
For the analysis of the ECC data, the methods described by Vömel et al. (2020) are used, i.e. time lag correction and background current correction. The overall uncertainty of the ozone measurements of the ECC sondes is 5 %. Owing to the obstruction of the line of sight between the launch site at IMK-IFU and the ground station at the summit by the Waxenstein mountain allowed data recording only from approximately 1500 m altitude upwards. Therefore, we used the estimated ECC background current from the sonde preparation 1 d before a flight as the starting value for the background correction instead of the actual measured profile from the ground up to 1500 m. This results in an additional uncertainty in the lower part of the profile (2 to 3 km a.s.l.).
2.3 IFU ozone DIAL system
The ozone DIAL of IMK-IFU (Garmisch-Partenkirchen), located at 47.477∘ N, 11.064∘ E, and 740 m a.s.l., has been developed and optimized since 1988 (Kempfer et al., 1994; Trickl et al., 2020a). It is based on a krypton fluoride excimer laser, operated at 400 mJ per pulse (40 W) of narrowband radiation at 248.5 nm, two Newtonian receiving telescopes (diameter of the primary mirrors: 0.13 and 0.5 m), and 1.1 m grating spectrographs for wavelength separation. Efficient stimulated Raman shifting in hydrogen and deuterium yields emission at the three operating wavelengths 277.2, 291.8, and 313.2 nm. The shorter-wave spectral components are absorbed by ozone (“on” wavelengths), that at 313.2 nm (“off” or reference wavelength) is almost outside the absorption region of 3. The laser system is operated with a repetition rate of 99 Hz, which allows a short data-acquisition time of 41 s for the maximum number of 4096 laser shots accepted by the 24-bit memory of the electronics. More shots are advisable under noisy daytime conditions in summer, but a longer acquisition was prevented by laser issues.
The data evaluation is based on differentiating the backscatter signals, which is highly sensitive to the noise and imperfections of the raw data (stored in 7.5 m bins). Therefore, the generated ozone profiles are smoothed with a numerical filter. The noise fraction in the strongly decreasing backscatter signal grows with altitude. Thus, the smoothing interval must be dynamically enhanced towards the tropopause (yielding a vertical resolution 0.05 to 0.5 km). The entire procedure is described in detail by Trickl et al. (2020a).
The shortwave 277.2 nm emission yields particularly accurate measurements, but the strong extinction of this radiation by ozone limits the range to about 8 km. The performance in the two 277.2 nm channels is robust with respect to minor misalignment, with uncertainties of about 2 to 4 ppb up to 5 km (the estimated uncertainties are listed in Table 4 of Trickl et al., 2020a). This is not the case for 291.8 nm, where the optical alignment must be controlled with care because of less tight focussing into the entrance slit of the far-field spectrograph. In addition, the 291.2 nm backscatter signal is three times noisier than that for 277.2 nm, which necessitates stronger smoothing of the retrieved ozone profiles (Trickl et al., 2020a). For 5 to 8 km we specify uncertainties of 3 to 7 ppb. The noise of the 313.2 nm signal becomes important at large distances. As a consequence, the uncertainty of the ozone mixing ratio can be rather high in the upper troposphere and the tropopause region, in particular in summer owing to the stronger loss of signal caused by the higher levels of ozone. Sometimes the uncertainty just below the tropopause can even exceed 10 ppb.
The DIAL data processing is made for different wavelength combinations (Eisele and Trickl, 2005). By comparing the resulting ozone profiles, an internal quality control can be achieved. The optical alignment is optimized immediately after detecting an ozone mismatch in the first quicklook data evaluation. Just the laser beam overlap of the different wavelength components (Trickl et al., 2020a) and the beam pointing must be optimized.
The calibration of the ozone lidar measurements has been based from the very beginning (1991) on the accurate temperature-dependent ozone absorption cross sections of the University of Reims (Daumont et al., 1992; Malicet et al., 1995). These cross sections were verified for four wavelengths below 300 nm by Viallon et al. (2015) to within ±0.06 %. In the presence of aerosol an aerosol correction is made with the algorithms of Eisele and Trickl (2005). This correction is rather robust for the wavelength pair 277–292 nm because of the strong absorption at the short “on” wavelength and the moderate wavelength difference (Völger et al., 1996). Meteorological data for calculating density and temperature profiles are taken from the Munich radiosonde (station 10868). The retrieved 313 nm aerosol backscatter coefficients have been routinely stored in the database of the European Aerosol Lidar Network (EARLINET) since 2007.
After repeated system upgrading the final performance of the lidar was reached in late 2012. In the absence of aerosol the far-field ozone could be evaluated with high reliability from the 291.9 nm signal alone, after precisely modelling the air number density from radiosonde data (Trickl et al., 2020a). In this way the influence of the daytime noise caused by the high solar background in the 313 nm reference profiles in summer could frequently be avoided.
During the final decade of the lidar operation a fitting procedure was applied in noisy situations in the upper troposphere (i.e. under high-ozone conditions in summer). This procedure reduces unrealistic curvature of ozone structures caused by enhanced data smoothing, and, thus, abrupt concentration changes (in particular at the tropopause) visible in the raw data are reproduced in the mixing ratio.
From 1991 to 2003 the DIAL was operated for focussed research projects. Routine measurements took place from 2007 to 2018, until 2015, parallel to measurements with a water-vapour DIAL (Trickl et al., 2014, 2015, 2016, 2020b). In 2012 the highest data quality was finally reached, which included significant improvements for the near-field telescope (Trickl et al., 2020a). Thus, the conditions for a meaningful system validation were obtained. The operation was discontinued in February 2019, after the retirement of the first author of this paper.
2.4 High-elevation surface observations
Quality-assured ozone measurements at the summit stations Wank (1780 m a.s.l., 7.0 km to the north-east of IMK-IFU, 47.511∘ N, 11.141∘ E) and Zugspitze (2962 m a.s.l., 8.4 km to the south-west of IMK-IFU, 47.421∘ N, 10.986∘ E) were made from 1978 to 2012. Since the 1990s, two or three TE 49 ozone analysers (Thermo Environmental Instruments, USA) were operated simultaneously at each station. These instruments are based on ultraviolet (UV) absorption at 253.65 nm. Several comparisons using transfer standards (O3 calibrators TE 49 PS) were made with the World Meteorological Organization (WMO) Global Atmosphere Watch (GAW) reference instrument kept at the WMO/GAW calibration centre operated by EMPA, Switzerland (Klausen et al., 2003). The most recent comparison was conducted in June 2006 and confirmed that the Zugspitze O3 data are on the GAW scale.
Apart from the two mountain stations, measurements were also performed at IFU at about 740 m a.s.l. (47.477∘ N, 11.064∘ E). This laboratory was adjacent to that of the ozone DIAL.
At UFS (0.70 km to the south-east of Zugspitze, 47.417∘ N, 10.980∘ E) ozone has been continuously measured since 2002 by a team of the German Environment Agency (Umweltbundesamt, UBA) using TEI 49i instruments (Thermo Electron Corporation). The gas inlet is at 2671 m a.s.l. For weekly and monthly calibration of the ozone measurements a TEI 49C-PS station ozone calibrator was applied. This primary standard was annually adjusted to the German ozone standard operated by UBA (UBA 204 SRP#29) that was adjusted via the Bureau International des Poids et Mesures in Paris to the National Institute of Standards and Technology ozone reference standard of GAW. The measurements were supported by a second instrument (Horiba APOA-370), which is equivalent to the TEI-49i. GAW performance audits at the station for surface ozone took place in 2001, 2006, 2011, and 2020 (Zellweger et al., 2001, 2006, 2011, 2021).
The uncertainty of the in situ ozone measurements is ±0.5 ppb with respect to the WMO standard (Hearn, 1961). This fulfils the GAW requirement.
The ozone data for all sites are stored at half-hour intervals. The times are specified for the end of the averaging interval in Central European Time (CET, = UTC+1 h). One-hour averages for the Zugspitze stations were made available to the World Data Center and the TOAR database (Schultz et al., 2017). In the present study we use data at half-hour time resolution. The ozone series at the two Zugspitze sites have been discussed in two recent scientific studies (1970 to 2020; Parrish et al., 2020; Trickl et al., 2023a, b).
2.5 LAGRANTO Trajectories
Fifteen-day backward trajectories were calculated with the Lagrangian Analysis tool (LAGRANTO; Sprenger and Wernli, 2015; Wernli and Davies, 1997). The driving wind fields are obtained from the ERA5 reanalysis dataset (Hersbach et al., 2020), which we interpolated to a 0.5∘ latitude/longitude grid, and on 137 vertical hybrid levels. The input ERA5 data are available at a 1-h temporal resolution; the output positions of the trajectories are written at 15 min time intervals to allow for a more refined analysis. The start coordinates of the backward trajectories are 11.064∘ E, 47.477∘ N, and the start altitudes match the altitudes of interest in the soundings (see Sect. 4). The start times of the trajectories correspond to the sounding times within 5 min. Finally, the start times are also shifted by several hours relative to the sounding time to assess the sensitivity of the trajectory calculation in time.
The main problem in comparing vertical-sounding instruments is illustrated in Fig. 1, which shows several ozone measurements at Garmisch-Partenkirchen and Hohenpeißenberg on the morning of 2 October 2017. The vertical distributions during that period are characterized by a descending stratospheric intrusion layer (indicated by low relative humidity) of rapidly diminishing width and significant changes at all altitudes on a short time scale. This reveals a considerable spatial inhomogeneity of the air mass. The approximate agreement of lidar and Hohenpeißenberg ozone sonde before 06:00 CET is, thus, to some extent fortuitous, although a good matching of the peak ozone mixing ratio in intrusion layers at both sites is quite frequently found. Different air masses at different altitudes must be assumed, as indicated by matching of the sonde ozone with lidar measurements at different times. The spatial and temporal requirements for comparisons can be even of the order of 1 km and 15 min at times (see Introduction).
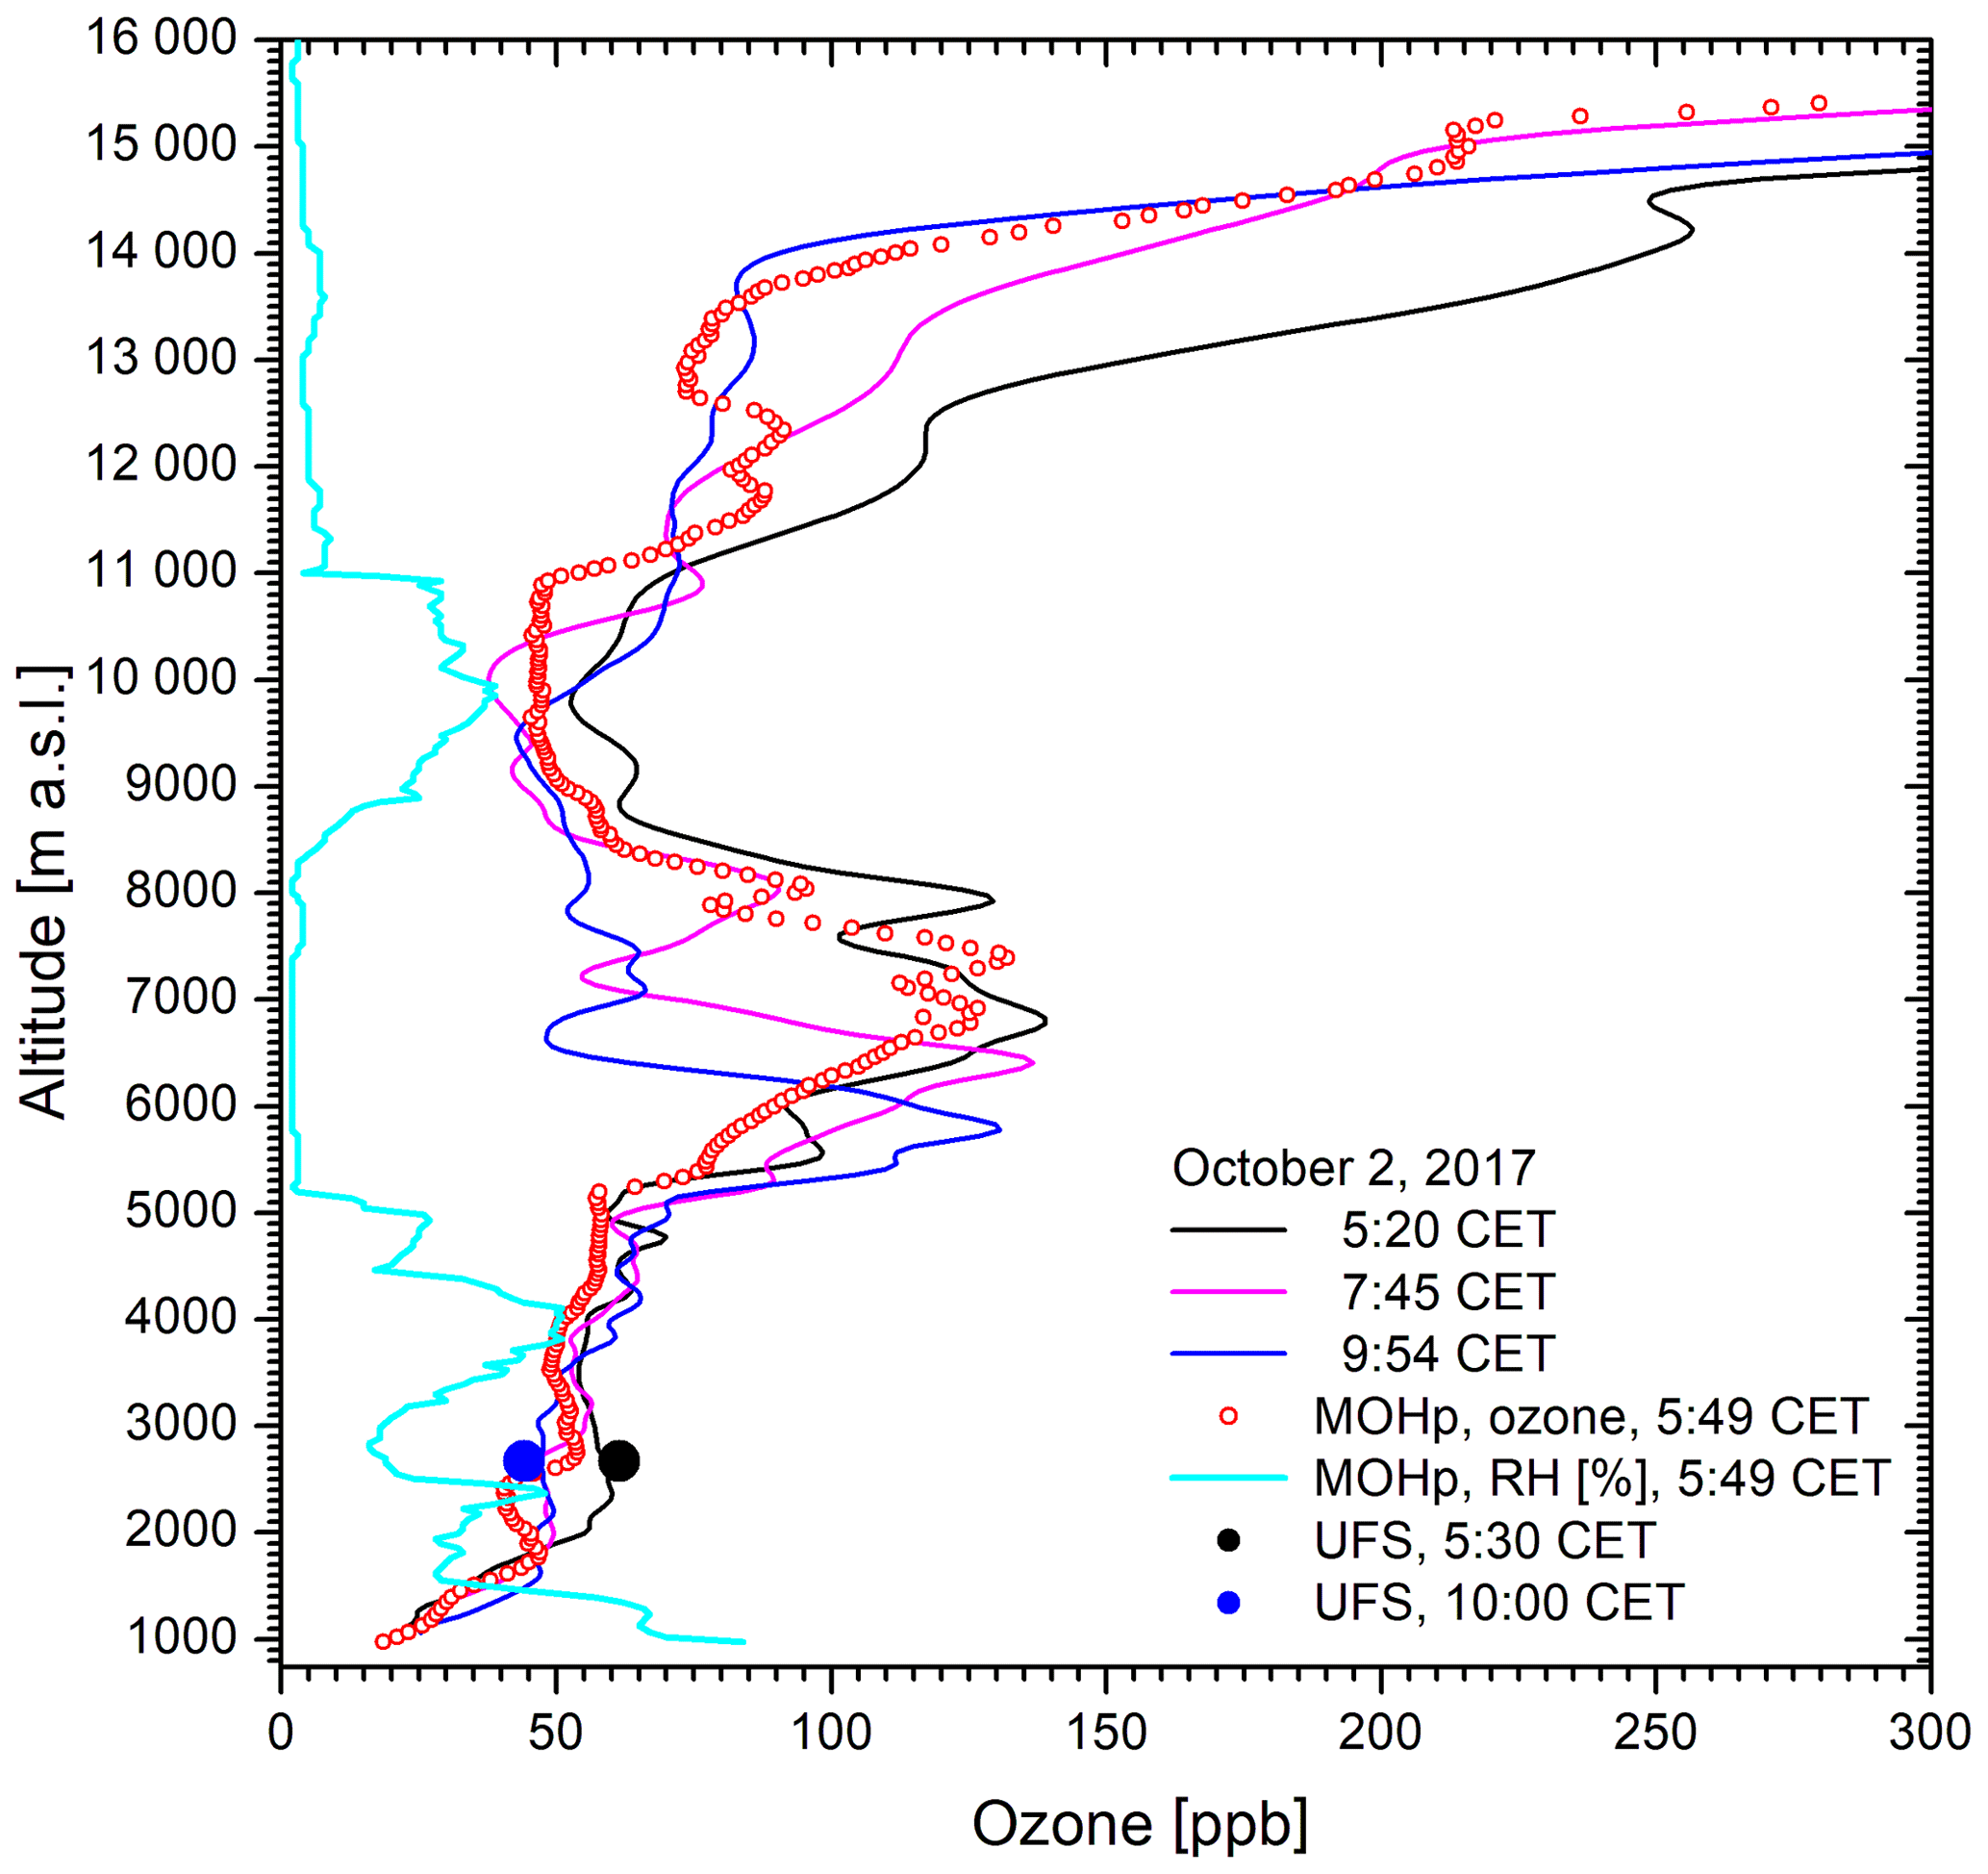
Figure 1Ozone measurements at Garmisch-Partenkirchen (IFU, UFS) and Hohenpeißenberg (MOHp) on 2 October 2017; the low relative humidity between 5.2 and 8.3 km (RH = 2 %) verifies the presence of a stratospheric air intrusion. The time for MOHp is the launch time of the sonde.
3.1 Comparisons of the IFU ozone lidar and the Jülich ECC sonde
An optimal lidar validation became possible in early 2019. On 5 and 6 February 2019 a side-by-side instrument comparison took place at Garmisch-Partenkirchen as a contribution to the FIRMOS validation project of the European Space Agency. Two of the three balloons launched on 5 February were equipped with ozone sondes, while both balloons on 6 February carried an ozone sonde. The ascents took place during night-time because of comparisons of the CFH sondes with the water-vapour channel of the UFS Raman lidar that provides humidity profiles up to at least 20 km (Klanner et al., 2021).
The first night of the campaign was clear. The conditions for the comparison were excellent: the sondes rose almost vertically up to 8.5 km and then slowly drifted to the south-east (Innsbruck), ideal for the tropospheric comparison. The balloons stayed within 20 km distance from IMK-IFU up to the tropopause (12.8 km a.s.l.) and remained within 30 up to 20 km a.s.l. The launch times of the balloons on 5 February were 18:03 CET (ascent to 16.147 km), 19:03 CET (29.475 km), and 23:00 CET (29.469 km). During the second night a cirrus layer occurred in the upper troposphere, which resulted in enhanced uncertainties of the DIAL data evaluation.
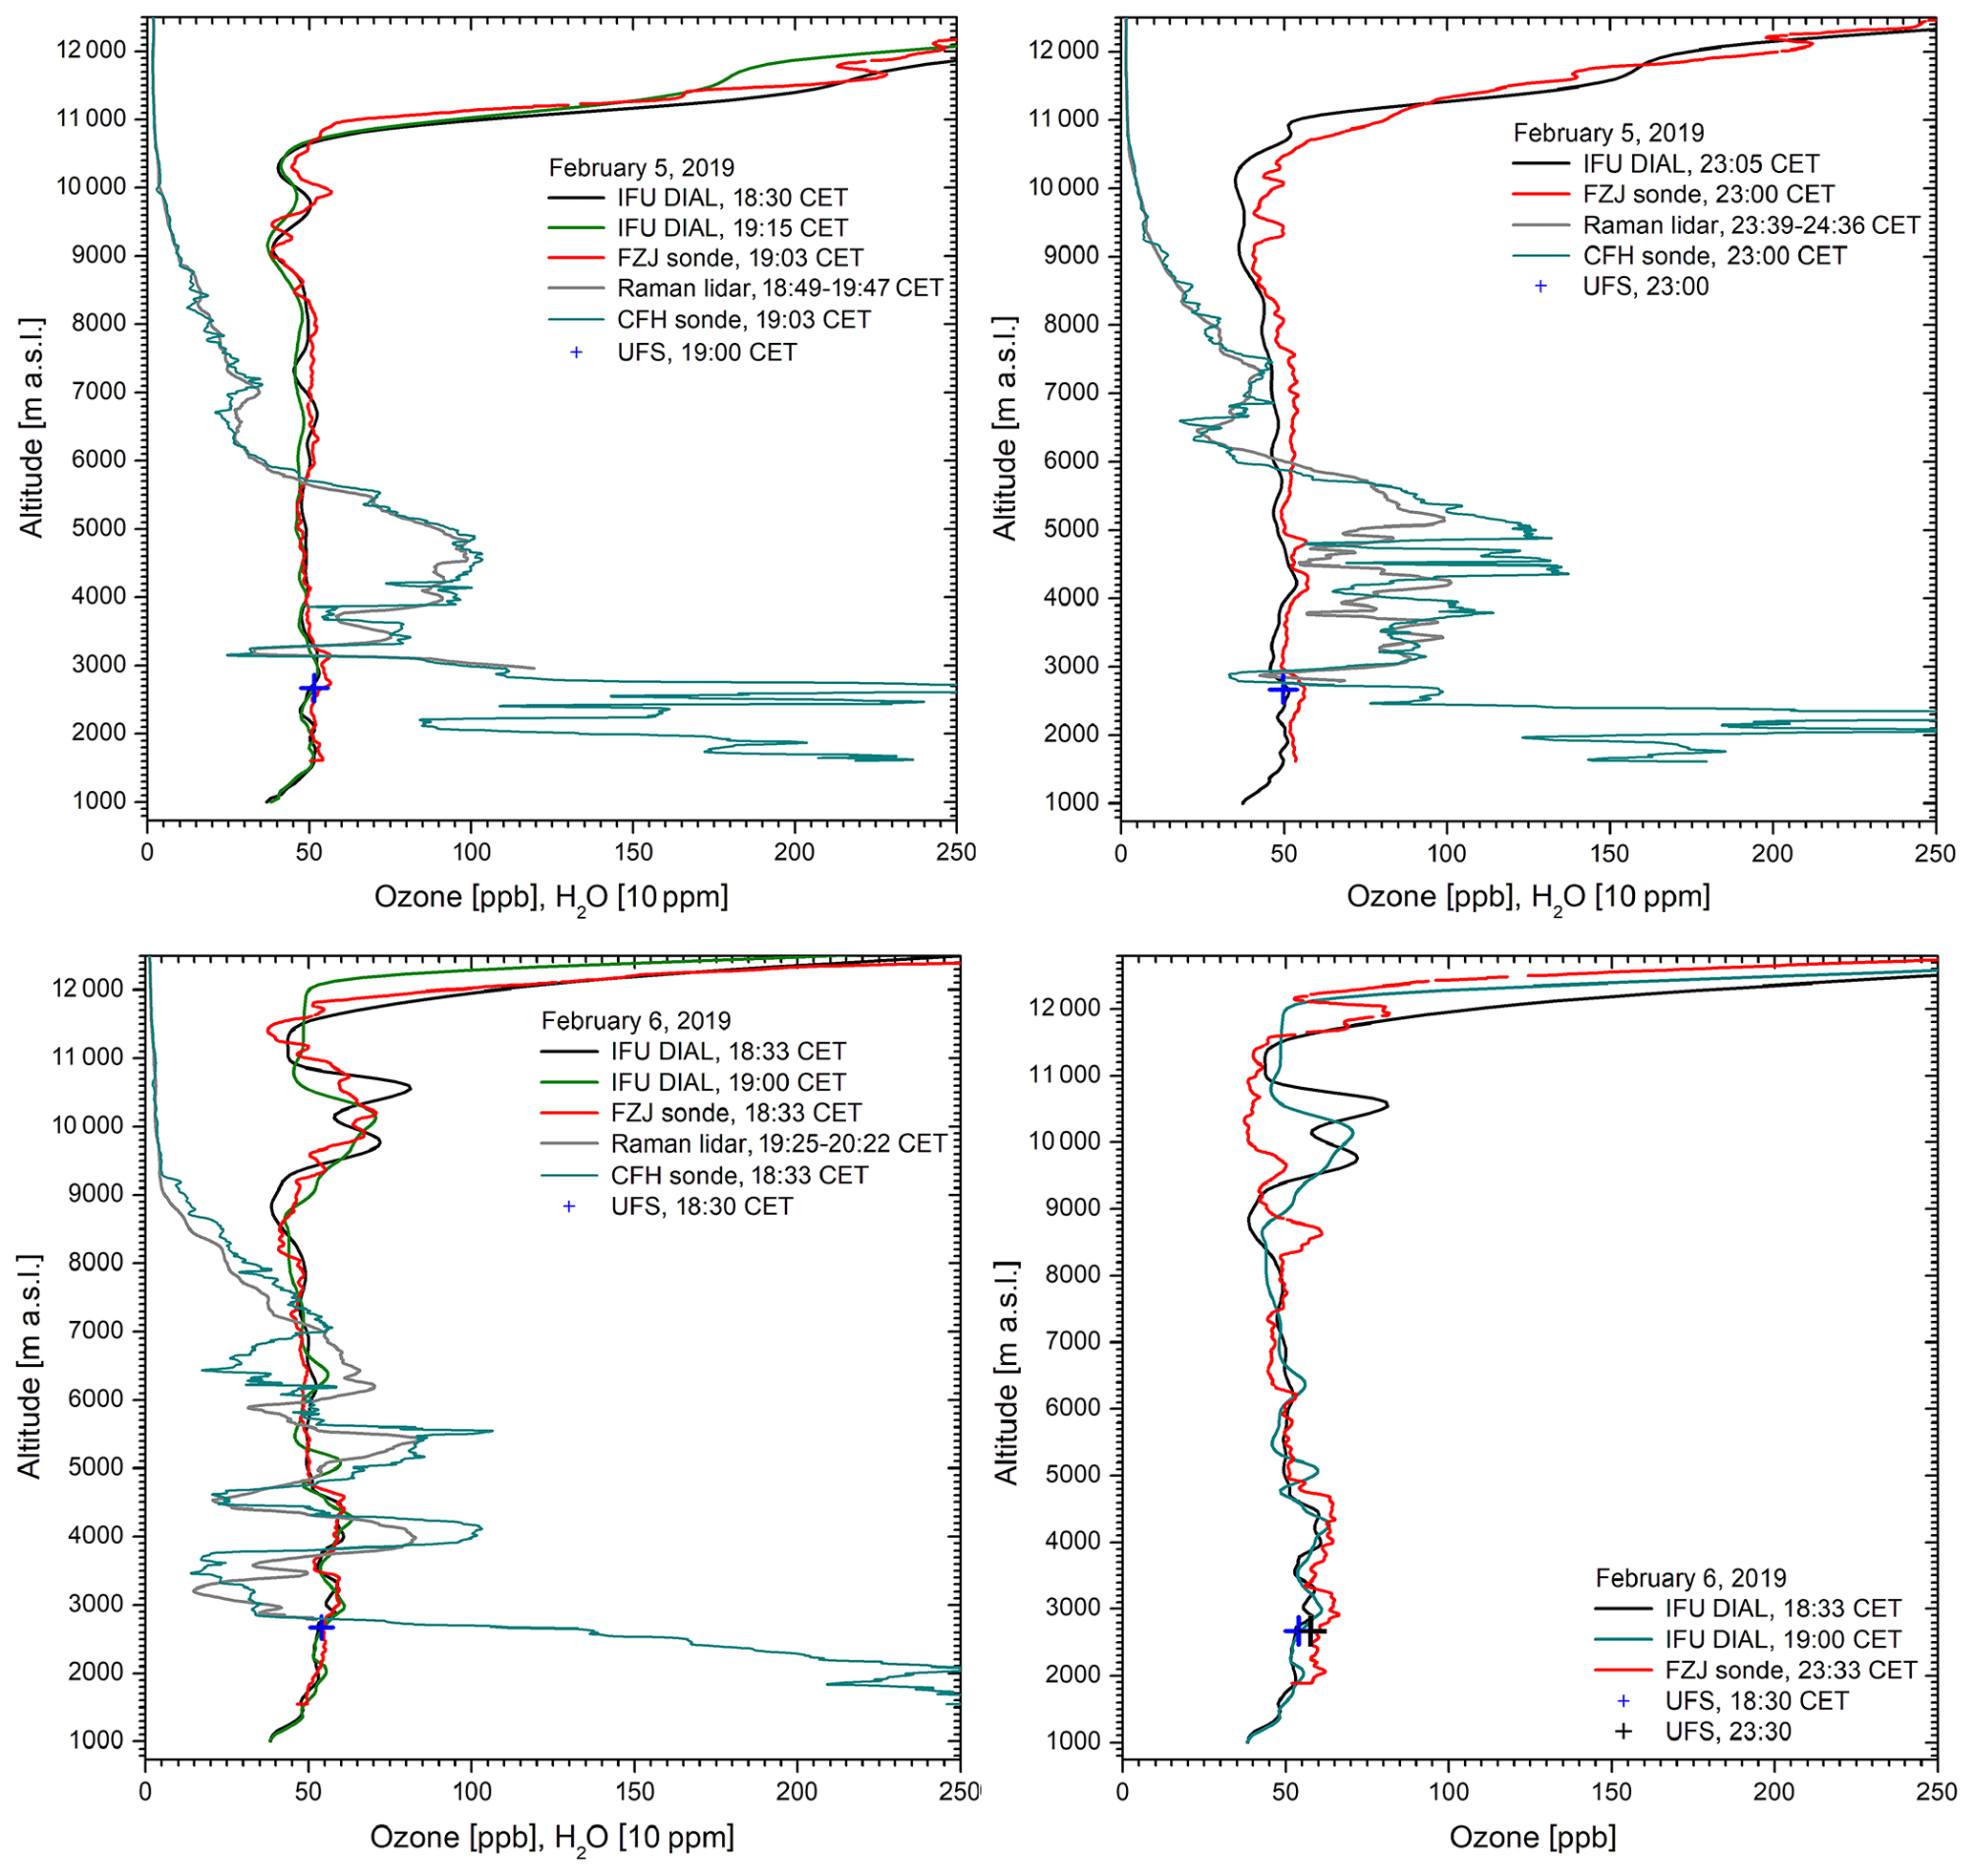
Figure 2Four ozone measurements on 5 and 6 February 2019 with lidar (IFU), ECC sonde (FZJ) and an in situ sensor at UFS; for two measurements the FZJ ozone mixing ratios are slightly higher than the lidar results. The fourth FZJ ozone measurement took place much later than the final lidar measurements, which resulted in slightly larger differences up to 4.8 km, confirmed by the 23:30 CET measurement at UFS. The lidar results around 10 km on 6 February are uncertain owing to a cirrus correction. In order to visualize more details on the complex layering we also show water-vapour mixing ratios for roughly coinciding measurements of the UFS Raman lidar and the FZJ CFH sonde. The tropospheric structures are strongly smoothed for the lidar owing to the 1 h data-acquisition time. At 3.3 km 250 ppm corresponds to roughly 5 % RH.
In Fig. 2 we present the results of the four comparisons made. The agreement between UFS and lidar is almost perfect, as known from the routine comparisons with the elevated sites between 2007 and 2018 and a number of separate comparisons (Trickl et al., 2020a). For the first three sonde ozone profiles, very small, almost altitude-independent offsets exist (0.5 to 3.4 ppb). For the fourth sonde ascent at 23:33 CET on 6 February no simultaneous lidar measurement was made. Up to 4.8 km a pronounced positive offset of the sonde ozone profile with respect to the two earlier lidar measurements (at 18:33 and 19:00 CET) is seen, but the deviation at 2.67 km is just 2 ppb if one takes the 23:30 CET measurement at UFS as the reference. We are highly content that the difference in ozone between sonde and lidar does not significantly change in the upper troposphere considering the low differential absorption for the wavelength pair 292–313 nm typically used above 6 km, which implies high sensitivity to potential technical imperfection.
In addition, we show in Fig. 2 the results of three humidity measurements with the UFS Raman lidar slightly revised with respect to Klanner et al. (2021). For comparison, we added the water-vapour mixing ratios (MRs) for the corresponding CFH sonde ascents of FZJ. The MRs indicate a high variability of the air composition on both days, up to 7 km, with several rapidly changing dry layers. The variability grows with time, as can also be concluded from the differences in the Raman lidar and CFH sonde caused by the 1 h measurement duration of the lidar needed for good stratospheric data quality. Although the vertical concentration change is much less pronounced in the ozone profiles, it is obvious that a good air-mass matching by the side-by-side ozone soundings at IMK-IFU is crucial for the quality of the comparison achieved.
As mentioned, on 6 February the quality of the lidar retrievals was deteriorated above 9 km by a layer of cirrus clouds, which required an aerosol correction. The increased level of ozone in this layer is remarkable, but is verified by the sonde. By contrast, Reichardt et al. (1996) reported full ozone depletion in a cirrus layer that we traced back to the surface of the Pacific Ocean, where ozone destruction can be assumed to prevail (Kley et al., 1996). The fourth comparison shows less perfect agreement because the lidar measurements ended at 19:00 CET, hours before the last sonde ascent. This was the final measurement of the DIAL before its operation was terminated after almost three decades.
Ozone profiles are also available for the descent of the balloons. The descents took place over Northern Italy and intersected different air masses. As a consequence, strong discrepancies are seen, and we do not include these data.
From the comparison of the vertical soundings with the in situ measurements at UFS we conclude that the ozone profiles of the lidar are slightly more quantitative than those of the sonde. The differences are rather constant as a function of the altitude. This allows us to derive uncertainties of the ozone from the DIAL measurements after subtracting the offsets of the individual sonde ascents. To quantify the quality of the lidar measurements we took just the first three comparisons. We averaged the offset-corrected differences (Fig. 3; altitude grid 52.5 m). The averages up to 9.2 km stay within ±2.5 ppb (about ±5 %). This approximately matches the performance of the lidar at the station altitudes and now also characterizes the winter-time specifications of the lidar in the entire free troposphere after 2011. This result justifies use of the lidar as a quality standard in the comparisons with the MOHp Brewer-Mast sondes described in the following section.
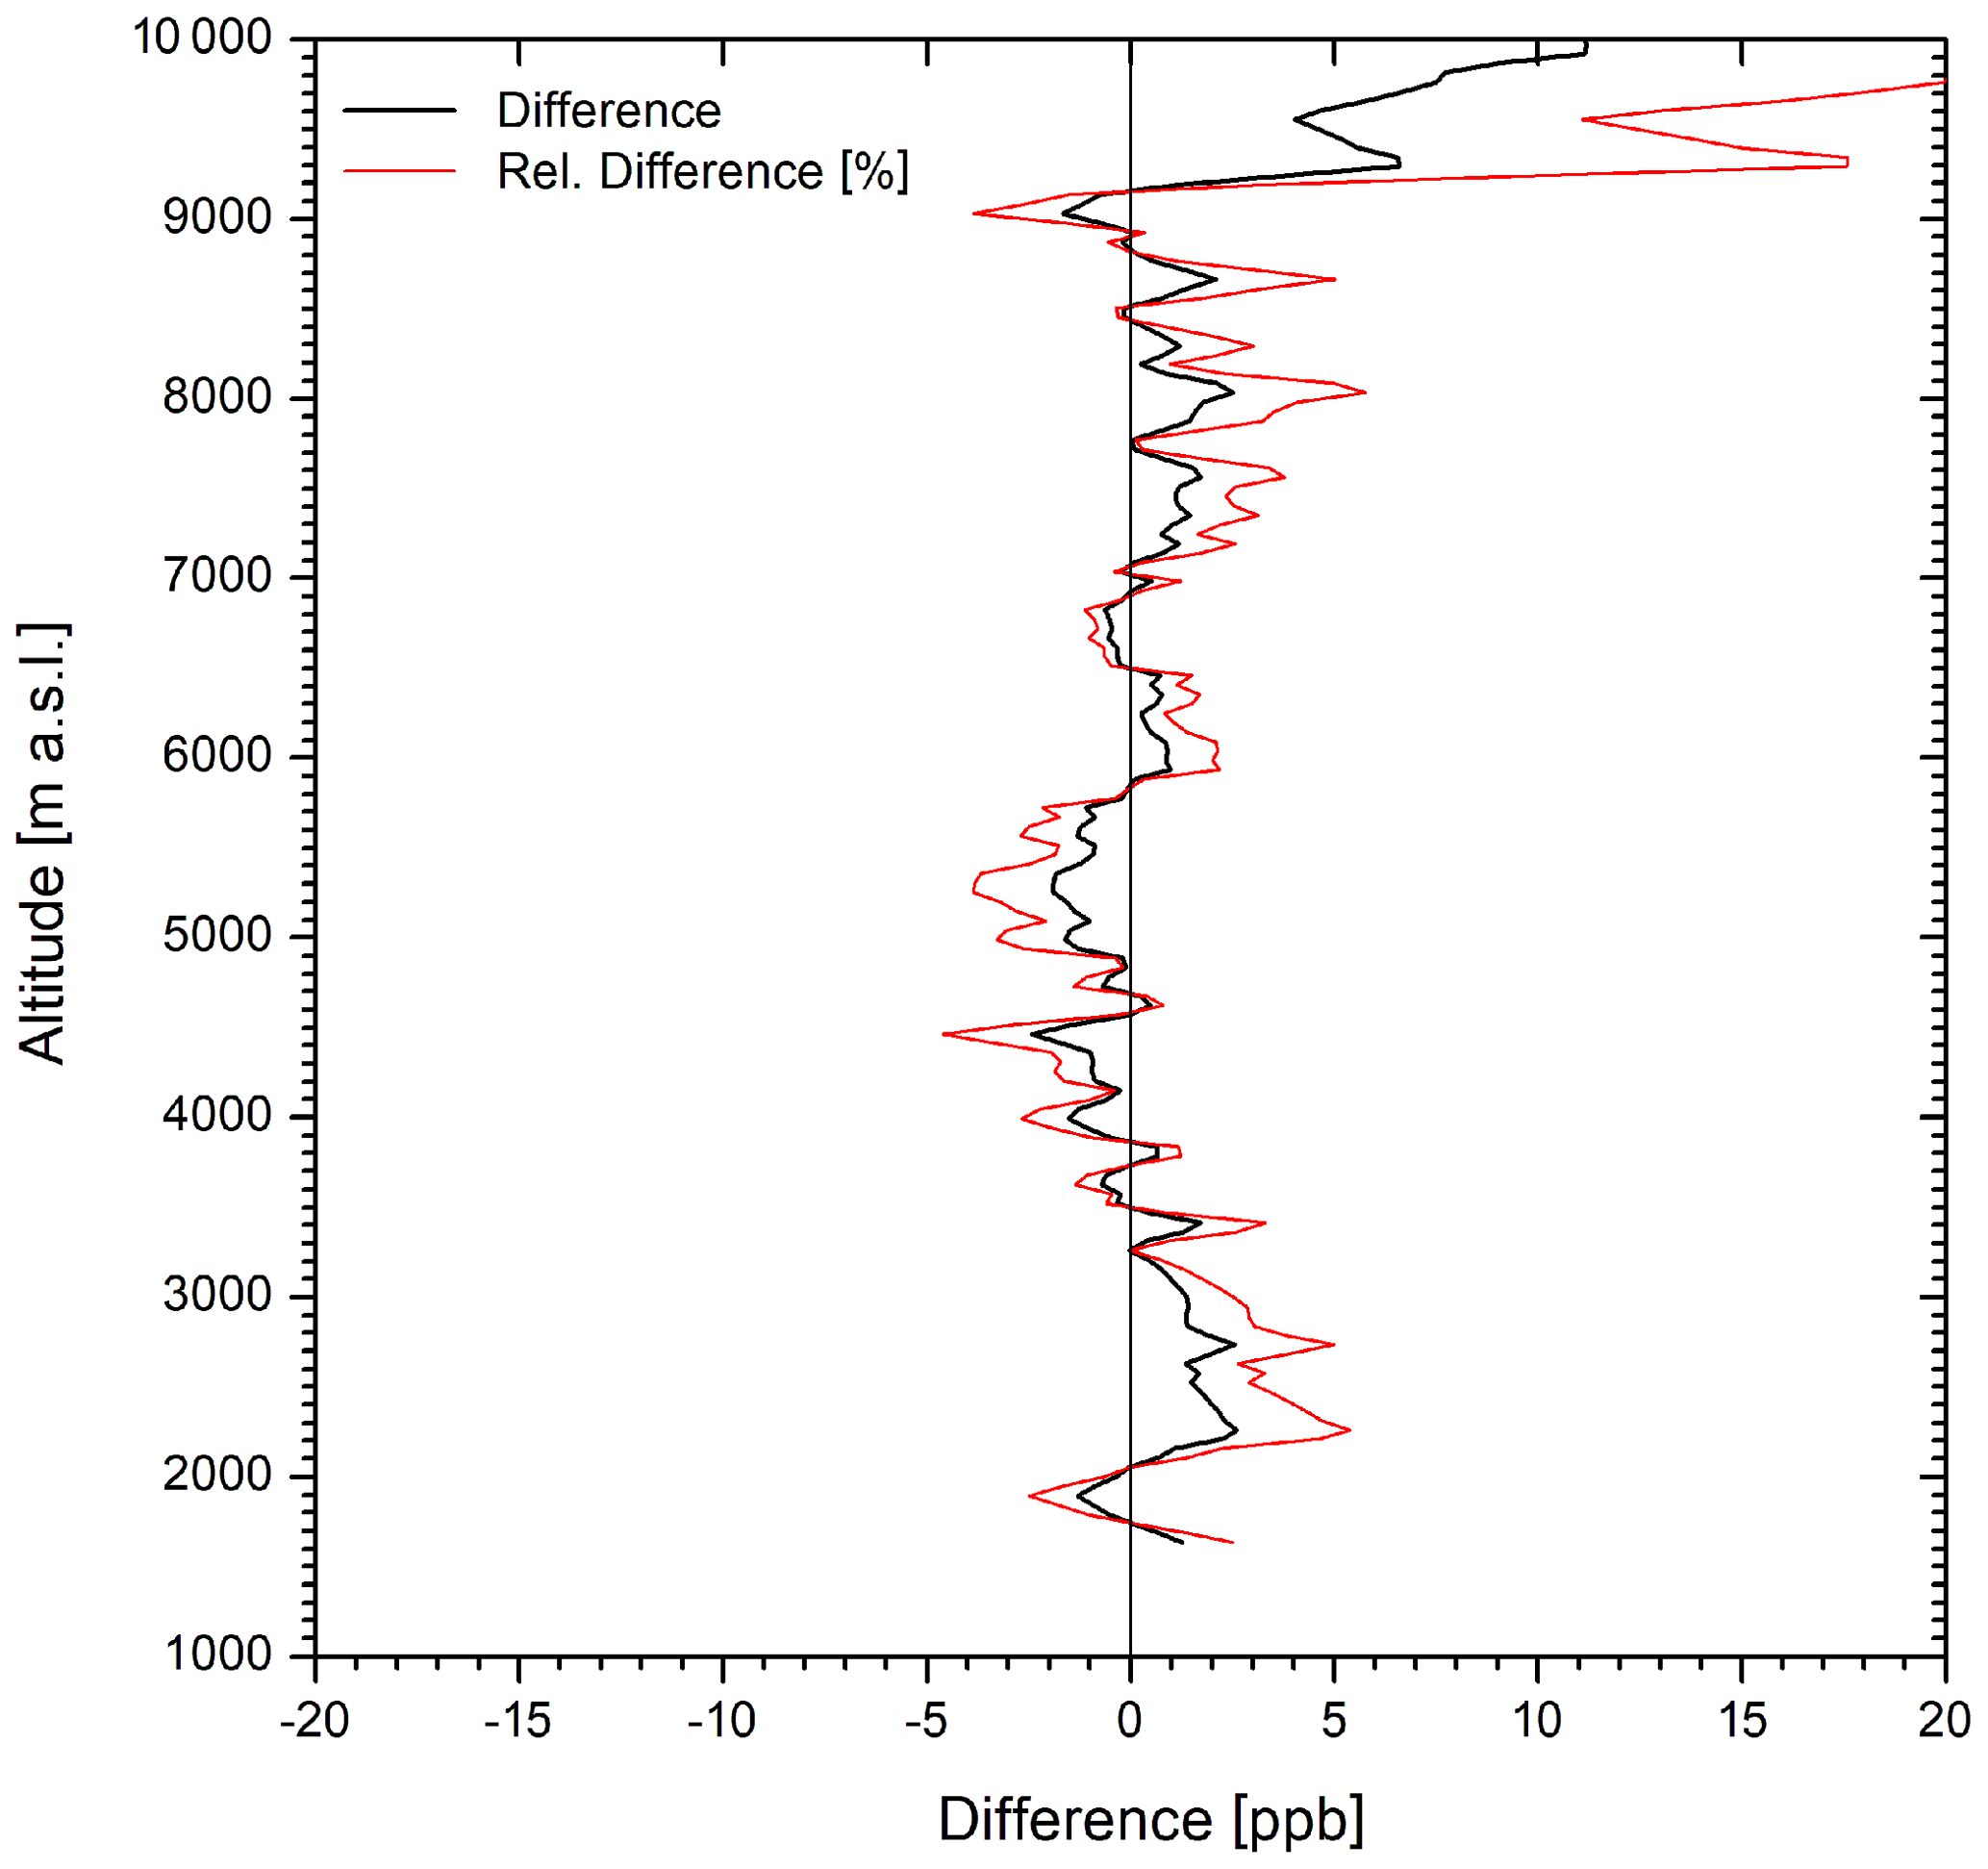
Figure 3Averaged differences between FZJ ozone sonde and IMK-IFU lidar for the first three comparisons after a slight offset correction of the sonde profiles (see text).
The quality of the comparison shown in this section benefits from low to moderate ozone densities during the cold season, which ensures limited absorption of the laser radiation within the troposphere. In Sect. 3.2 we assess the performance for all seasons.
3.2 Comparison of MOHp ozone soundings with IFU lidar and in situ measurements for 2018
The routine measurements with the IFU ozone DIAL since 2007 exhibit rather different annual coverages, with gaps due to system damage or upgrading periods. Starting in late 2012, the final technical performance was reached. Retrieval strategies have been further improved. The best coverage of a single year was achieved in 2018, with a total of 587 measurements and 16 (March) to 79 (September) measurements per month. Therefore, we use this year for a thorough comparison with the MOHp ozone sonde. Because of the excellent performance of the lidar verified in Sect. 3.1 we use the lidar as the reference in this comparison, together with the ozone mixing ratios from UFS.
The sonde ascents at MOHp usually take place around 06:00 CET on Monday, Wednesday, and Friday, in summer just on Monday and Wednesday. We found a total of 46 of these days on which early-morning lidar measurements exist, not later than around 10:00 CET. On 36 of these days MOHp soundings are available. Thirteen of the days provided particularly good conditions, with favourable temporal proximity. In the figures shown in this paper we eliminated ozone profiles for times later than 10:00 CET during a given day.
Similar to the comparisons of lidar and ECC sondes the comparisons of the lidar with the MOHp Brewer-Mast sondes reveal altitude-independent offsets of the mixing ratios. The sonde-to-sonde variations of the offsets are larger than those of the ECC sondes, consistent with the considerable uncertainties of the Brewer-Mast sondes specified by the literature (see Introduction). There is clearly an influence of layers with different ozone concentrations at both sites, but also good agreement in wide altitude ranges up to the upper troposphere after subtracting the offset. Because of this agreement it is hard to believe that the offsets are caused by systematic atmospheric differences. It is more reasonable to assume an instrumental issue as an explanation for these shifts. Furthermore, the frequently good matching of the high peak ozone in some of the stratospheric intrusion layers demonstrates the absence of concentration-dependent artefacts.
3.2.1 Winter
During the cold parts of the year the comparisons between the MOHp sondes and the lidar usually exhibit better quality. This is explained by less structure in the ozone vertical distributions and a wider operating range of the lidar owing to the low ozone level allowing for a higher, less noisy far-field signal. We found just one example with some deviating structures of the order of ±10 ppb (10 January 2018). For the 2018 comparison we give one example in Fig. 4 (15 January). The lidar mixing ratio is of the order of 45 ppb, verified by the measurements at UFS (2660 m a.s.l.). The Brewer-Mast ozone sonde shows a negative bias of 5.8 ppb relative to the lidar above 2.1 km. After removing this bias (cyan curve) the sonde ozone matches the lidar and the UFS values well for altitudes above 2.1 km. This performance almost reaches that in the examples of Sect. 3.1. Just below the tropopause there is a minor discrepancy that could be either due to the higher uncertainty of the lidar measurement at these altitudes or an air-mass difference.
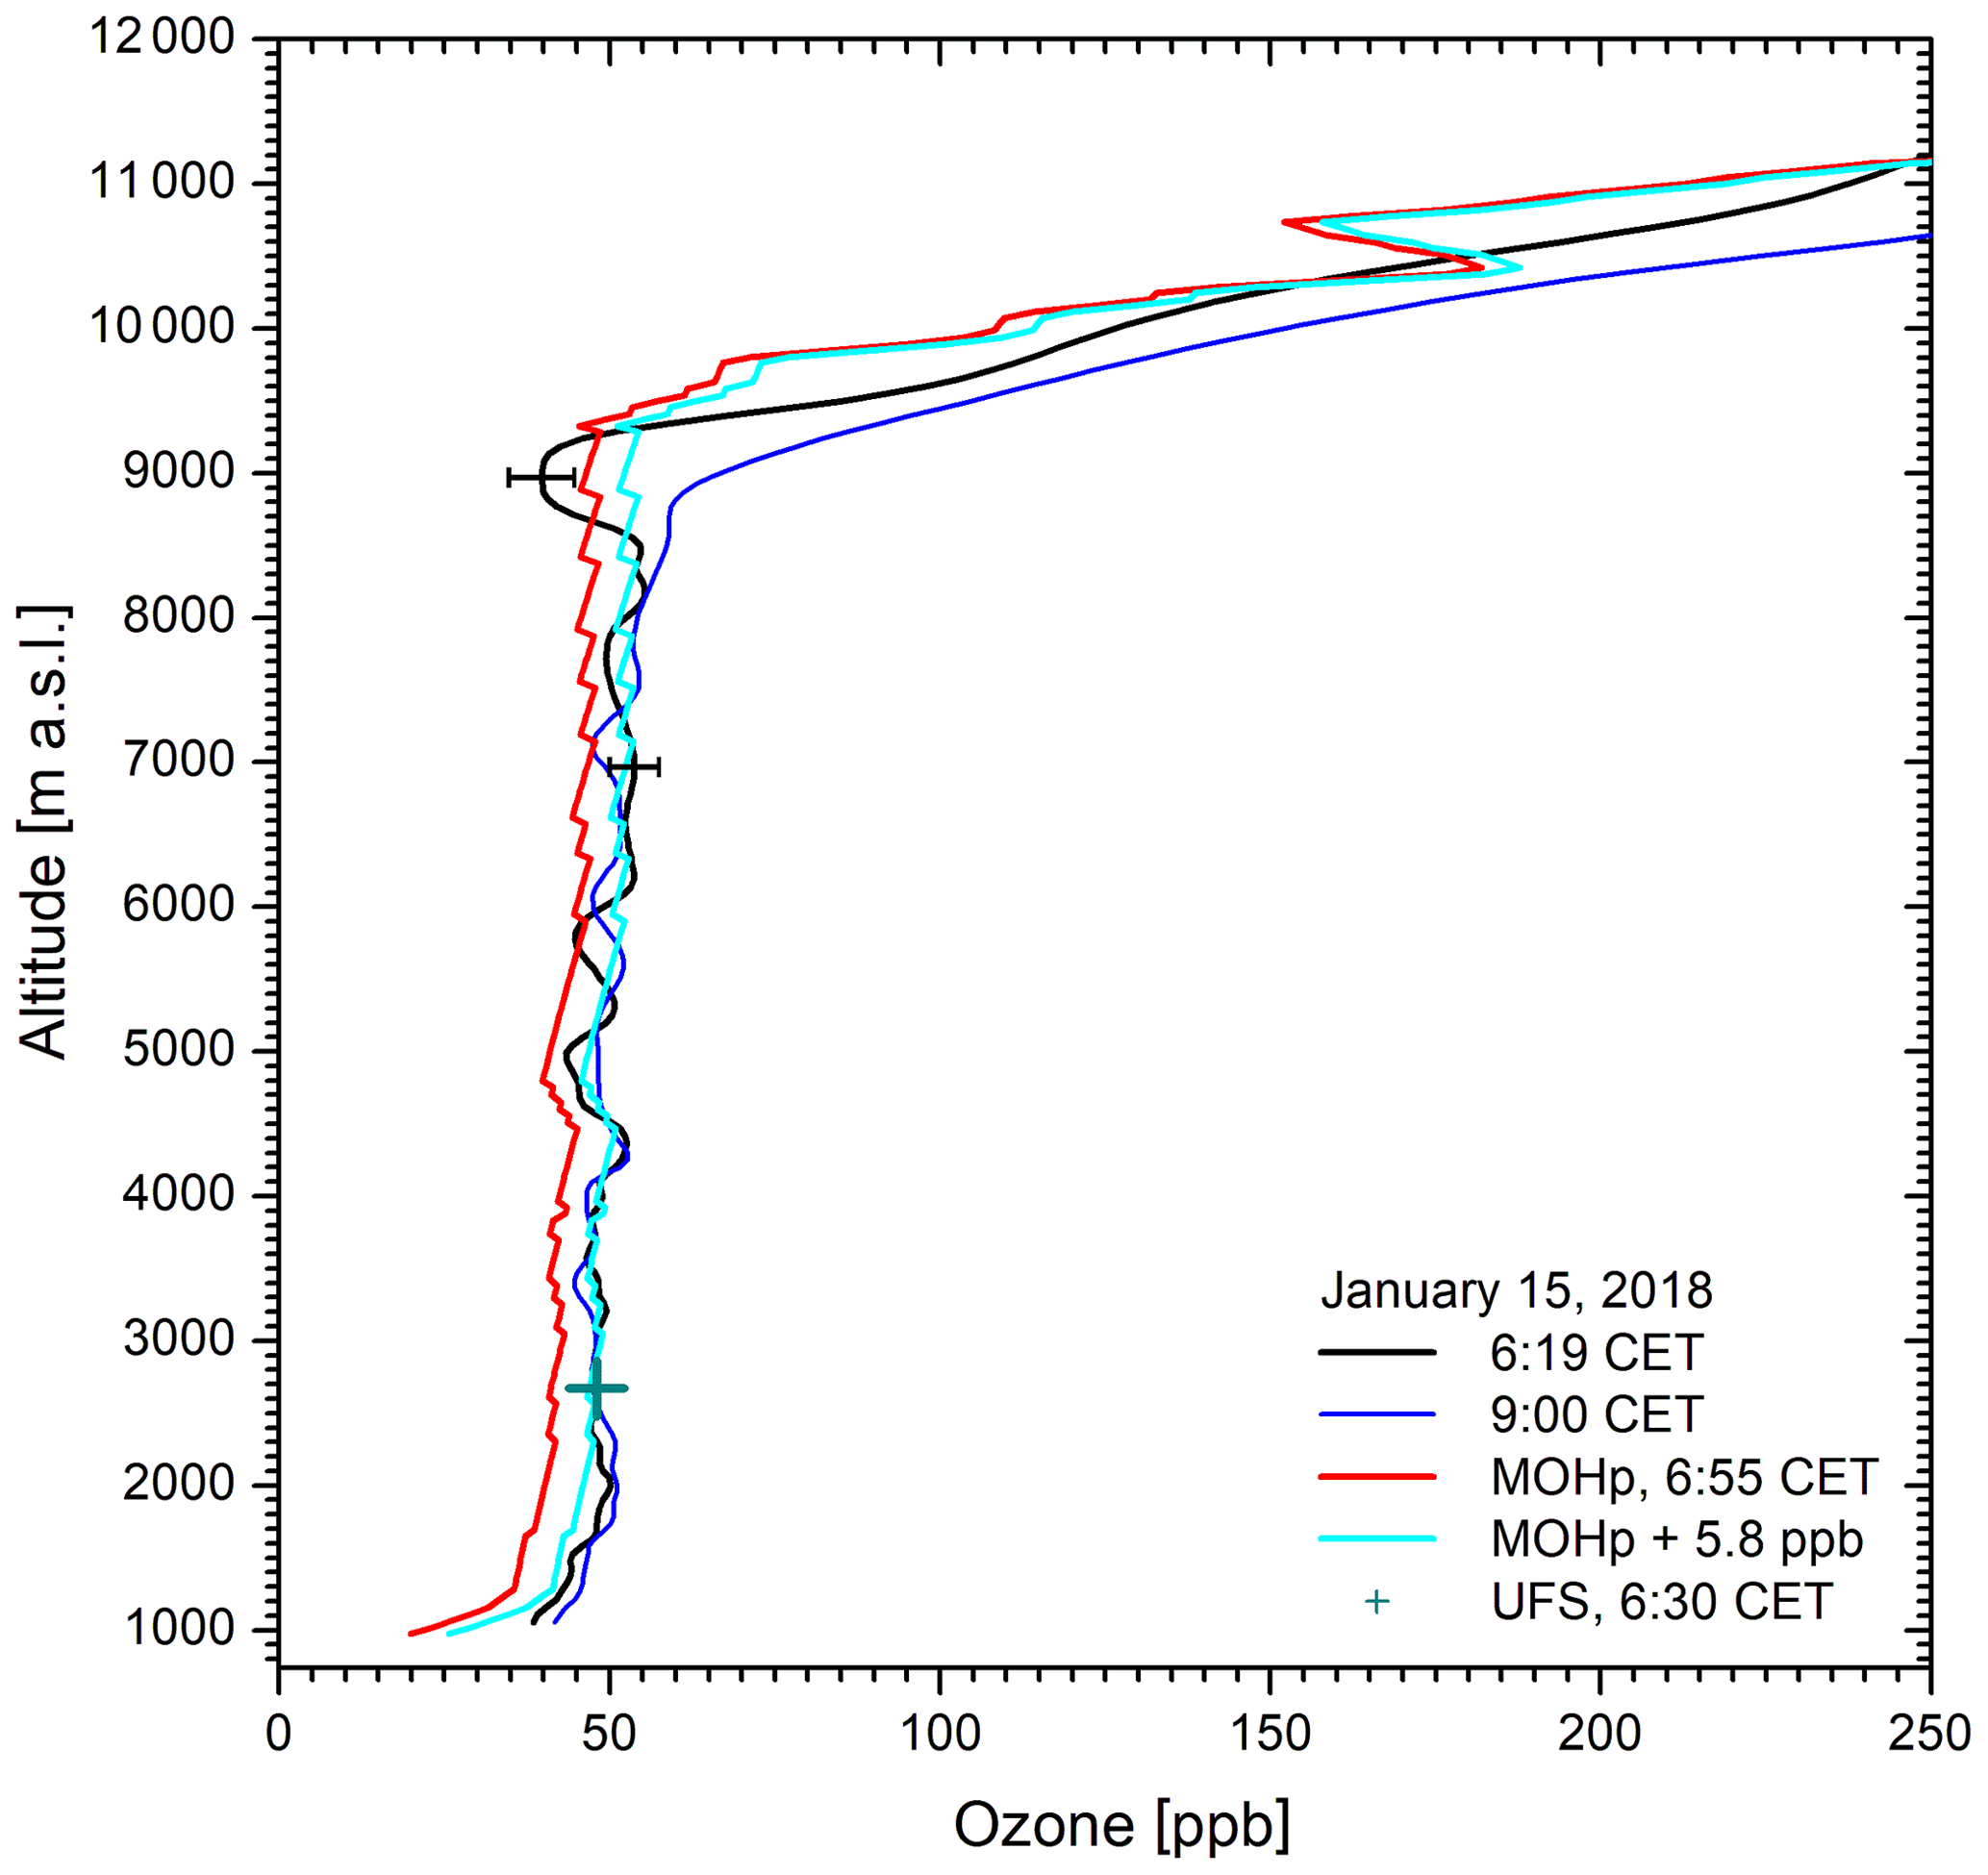
Figure 4Ozone measurements on 15 January 2018: the MOHp ozone (red) is also shifted (cyan) by 5.8 ppb to match the lidar ozone and the UFS value (cyan), in part the black, in part the blue curve. Differences exist in the tropopause region, which is frequently the case. The sawtooth structure in the MOHp data is due to insufficient digital resolution in the NDACC database.
For the other 2018 winter-time comparisons the constant offsets of the sondes with respect to the lidar and UFS are just +1.5 to −3.0 ppb.
3.2.2 Summer
During the warm season the ozone distribution in the middle and upper troposphere shows structured maxima caused by long-range transport, in particular stratosphere-to-tropopause transport (STT) layers (Trickl et al., 2020b). In this altitude range a summer maximum of STT exists. Usually, these structures do not perfectly match for both sites. An example for 9 July 2018 is shown in Fig. 5.
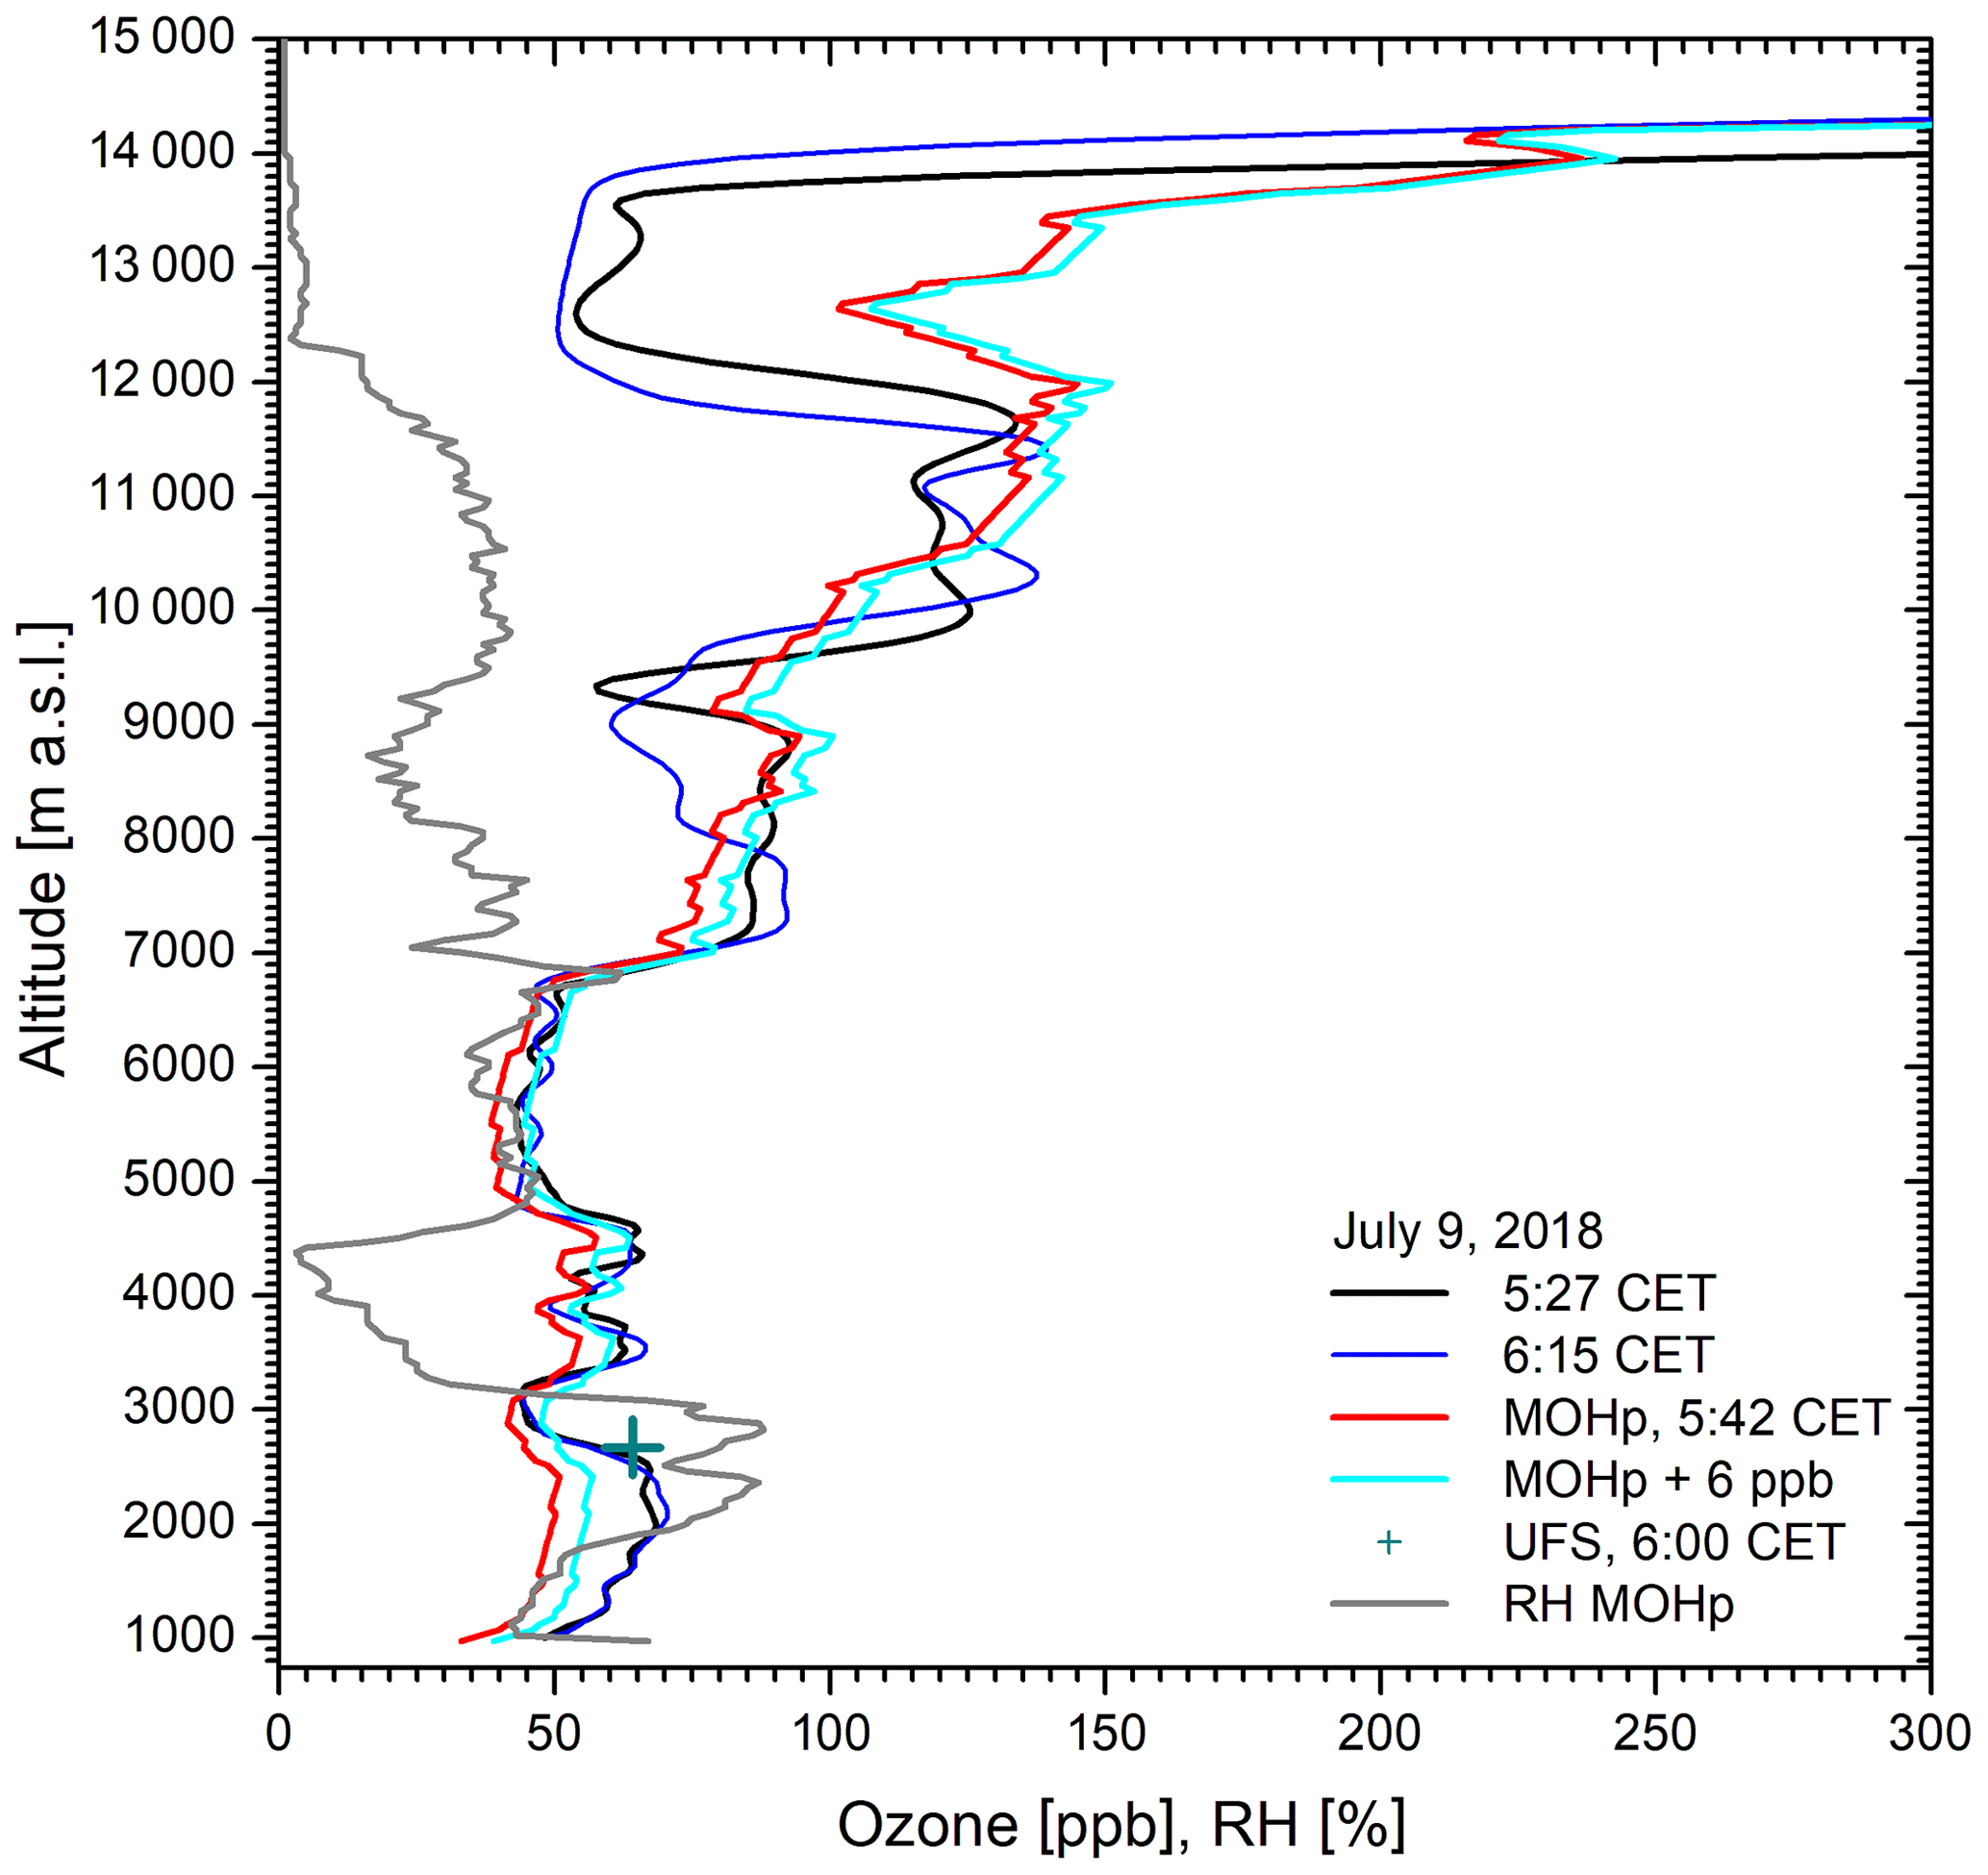
Figure 5Summertime ozone measurements (9 July 2018) with pronounced layering; the sonde ozone (red) is brought to reasonable agreement with the lidar (black curve) above 2.7 km by adding 6 ppb (cyan curve). Above 9 km the air masses are no longer comparable. The particularly strong discrepancy of the UFS in situ ozone can be explained by orographic lifting of the ozone edge at 2.7 km. The low to moderate RH (grey) in parts of the free troposphere indicates that the elevated ozone values could be due to a stratospheric air component.
Figure 5 shows good agreement in structure between the soundings at both sites up to 9 km. Again, despite the pronounced ozone layering, the agreement was improved on the absolute scale by adding an altitude-independent correction to the sonde values (6 ppb). The offset is usually determined up to 6 km owing to the reliable performance of the 277–313 nm DIAL measurements, but the agreement is mostly reasonable also to higher altitudes. After shifting the sonde mixing ratio we can estimate the uncertainty of the lidar measurements.
The elevated ozone in Fig. 5 between 3.3 and 4.7 km can be explained by a stratospheric air intrusion, as is verified by the low RH. In the upper troposphere the agreement deteriorates, but at least the increase of ozone with altitude is seen in all profiles up to about 12 km. The ozone minimum around 13 km is just seen in the lidar data, with just a small ozone dip in the sonde profile. It is unreasonable to ascribe this considerable discrepancy to a temporary technical problem in such a limited altitude range. This example documents the difficulty of quantitative comparisons of tropospheric ozone, even on a horizontal scale of just 38 km.
In order to clarify the origin of the difference of the ozone mixing ratio in the upper troposphere we calculated backward trajectories with the HYSPLIT model (http://ready.arl.noaa.gov/HYSPLIT.php, last access: 29 October 2023; Draxler and Hess, 1998; Stein et al., 2015). These trajectories reveal northerly advection which implies a southward drift of the sonde towards the lidar during the ascent. In the upper troposphere they did not fully explain the observations within the limited maximum backward time span of 315 h for the few start altitudes selected.
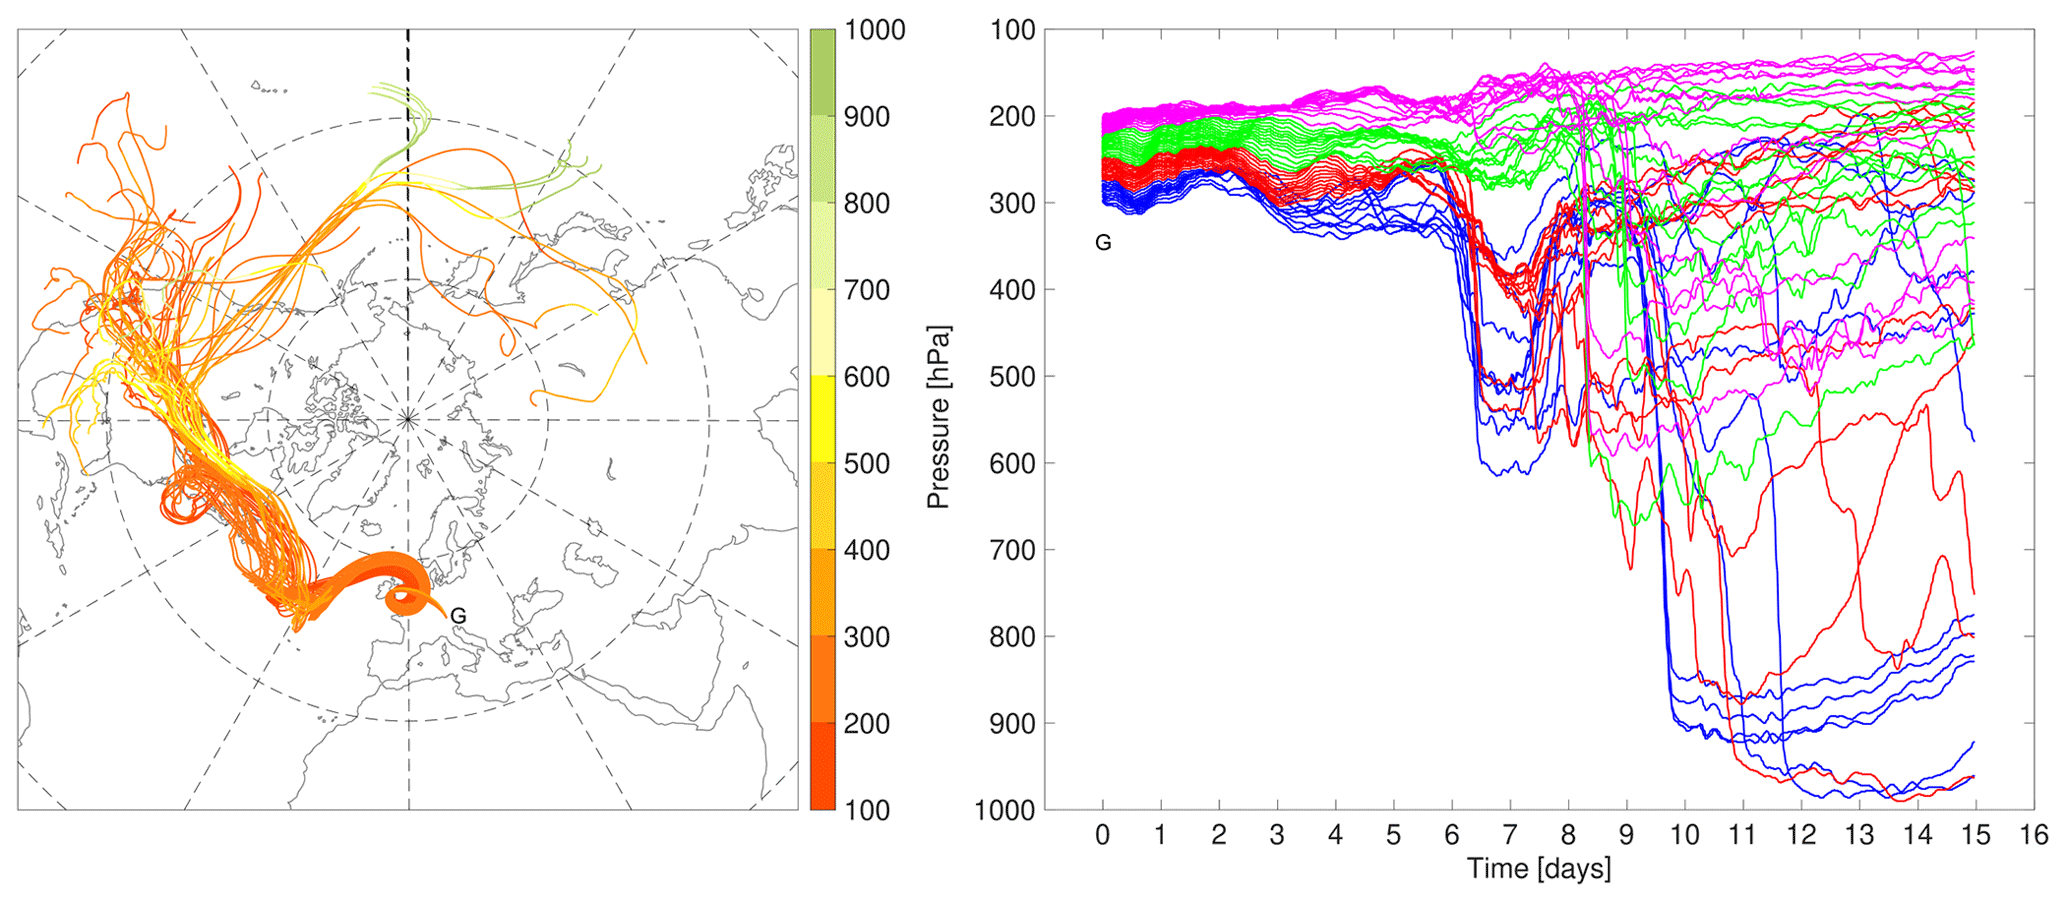
Figure 6350 h LAGRANTO backward trajectories, started above Garmisch-Partenkirchen (G) on 9 July 2018 at 07:00 CET.
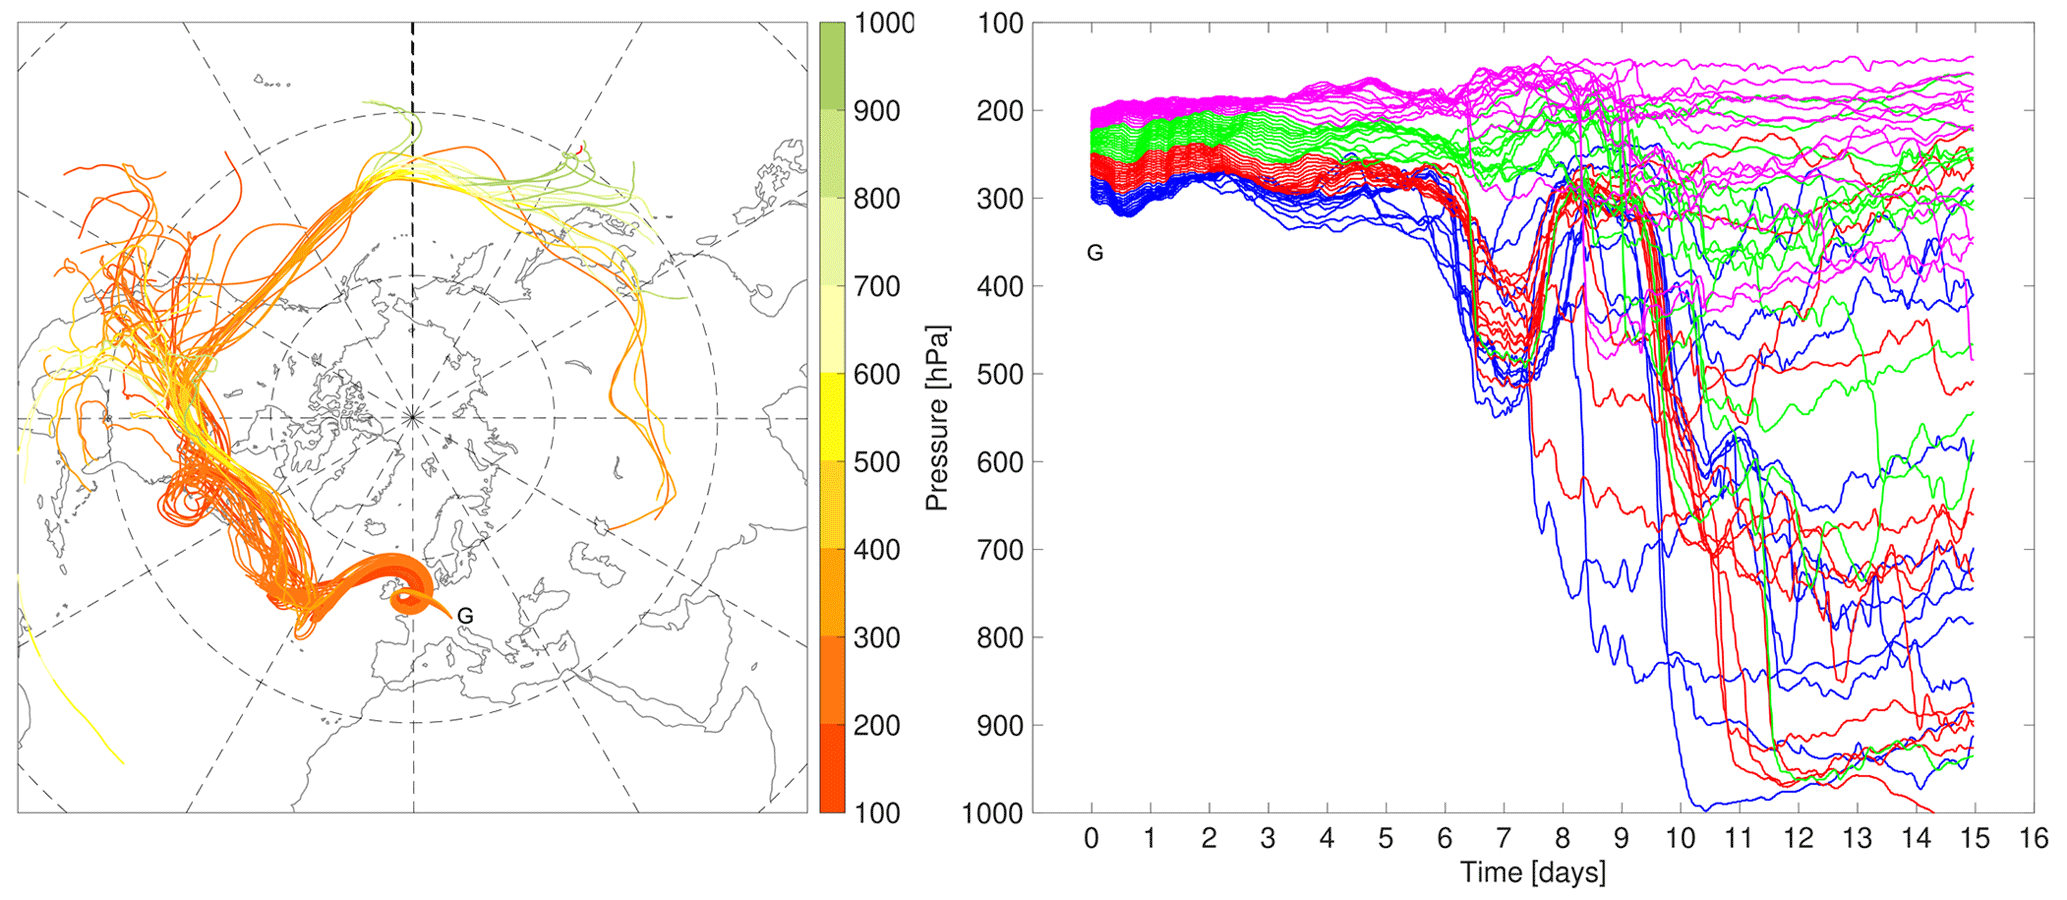
Figure 7350 h LAGRANTO backward trajectories, started above Garmisch-Partenkirchen (G) on 9 July 2018 at 08:00 CET.
Therefore, the trajectory calculations were extended to 350 h by using the LAGRANTO model for full-hour start times between 03:00 and 08:00 CET, initiated at a large number of altitudes in the low-ozone range in the upper troposphere. Results for start times of 07:00 and 08:00 CET are shown in Figs. 6 and 7. Up to a start time of 04:00 CET the trajectories stayed almost completely at high altitudes. At 05:00 CET three of the trajectories ended in the lower troposphere above the subtropical Pacific near a longitude of 180∘, the first sign of an air-mass change. Later (Figs. 6 and 7), we see a clear influence of a Pacific source.
The low ozone level in the boundary layer above (sub)tropical oceans is well known (Eisele et al., 1999; Grant et al., 2000; Trickl et al., 2003, 2010), in particular over the Pacific (Kley et al., 1996; Davies et al., 1998). In this way, the lidar observations on 9 July 2018 can be understood. The launch time of the MOHp ozone sonde, 05:42 CET, is between the two lidar measurements. However, a delay is caused during the ascent, which makes a quantitative understanding difficult.
The moderate sonde RH above 12.3 km indicates a potential admixture of aged stratospheric air in this altitude range above MOHp, which would explain the high ozone mixing ratios of more than 120 ppb.
Figures 5 and 8 show a rather constant negative ozone offset of the sonde profiles. The ozone profiles can be brought into much better agreement with the lidar and UFS by upward shifts of 6 and 10 ppb respectively. In Fig. 9 one sees one of the very rare cases of an ozone mismatch between sonde and lidar up to elevations clearly above the mountain sites (1 km above the Zugspitze summit). We did not shift the MOHp profile (e.g. by 3 ppb) to reduce the mismatch, as this would cause the agreement to deteriorate above 4 km.
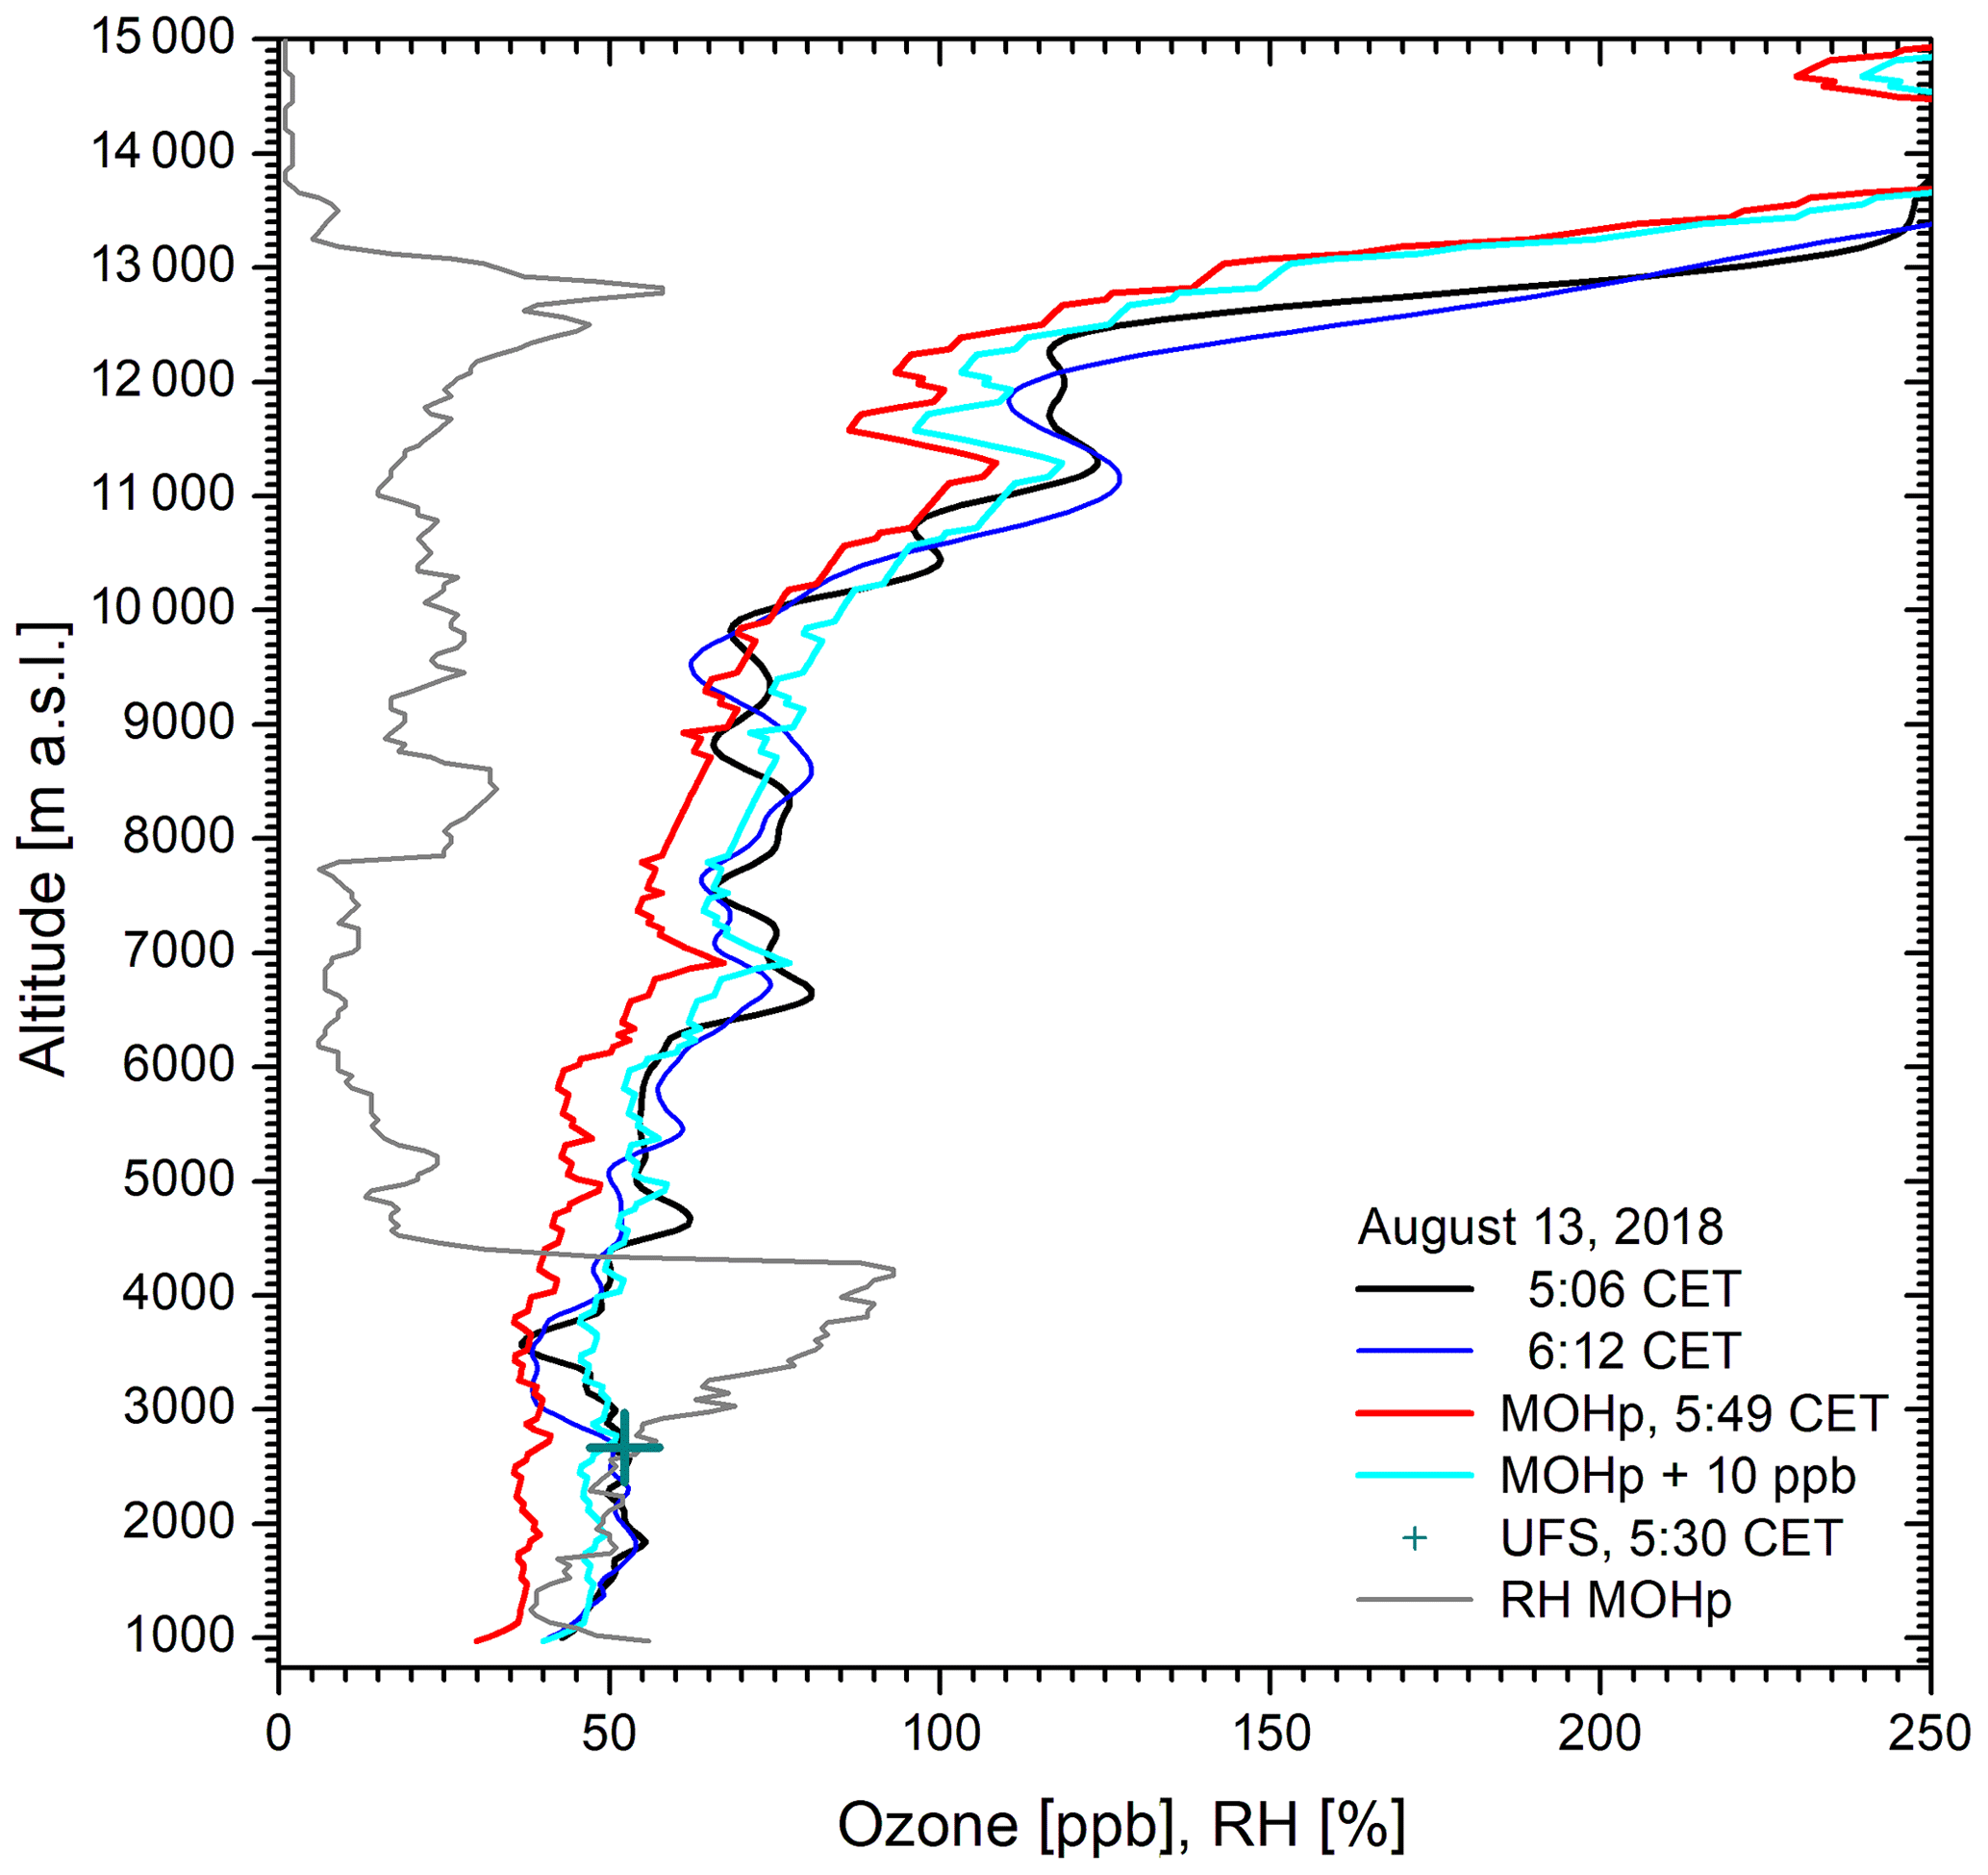
Figure 8Ozone measurements on 13 August 2018: the agreement of the shifted MOHp ozone profile (cyan) with the lidar curves is rather good up to 12 km given the high summertime variability. The low to moderate RH above 4.4 km (grey) indicates that the elevated ozone is partially caused by stratospheric air.
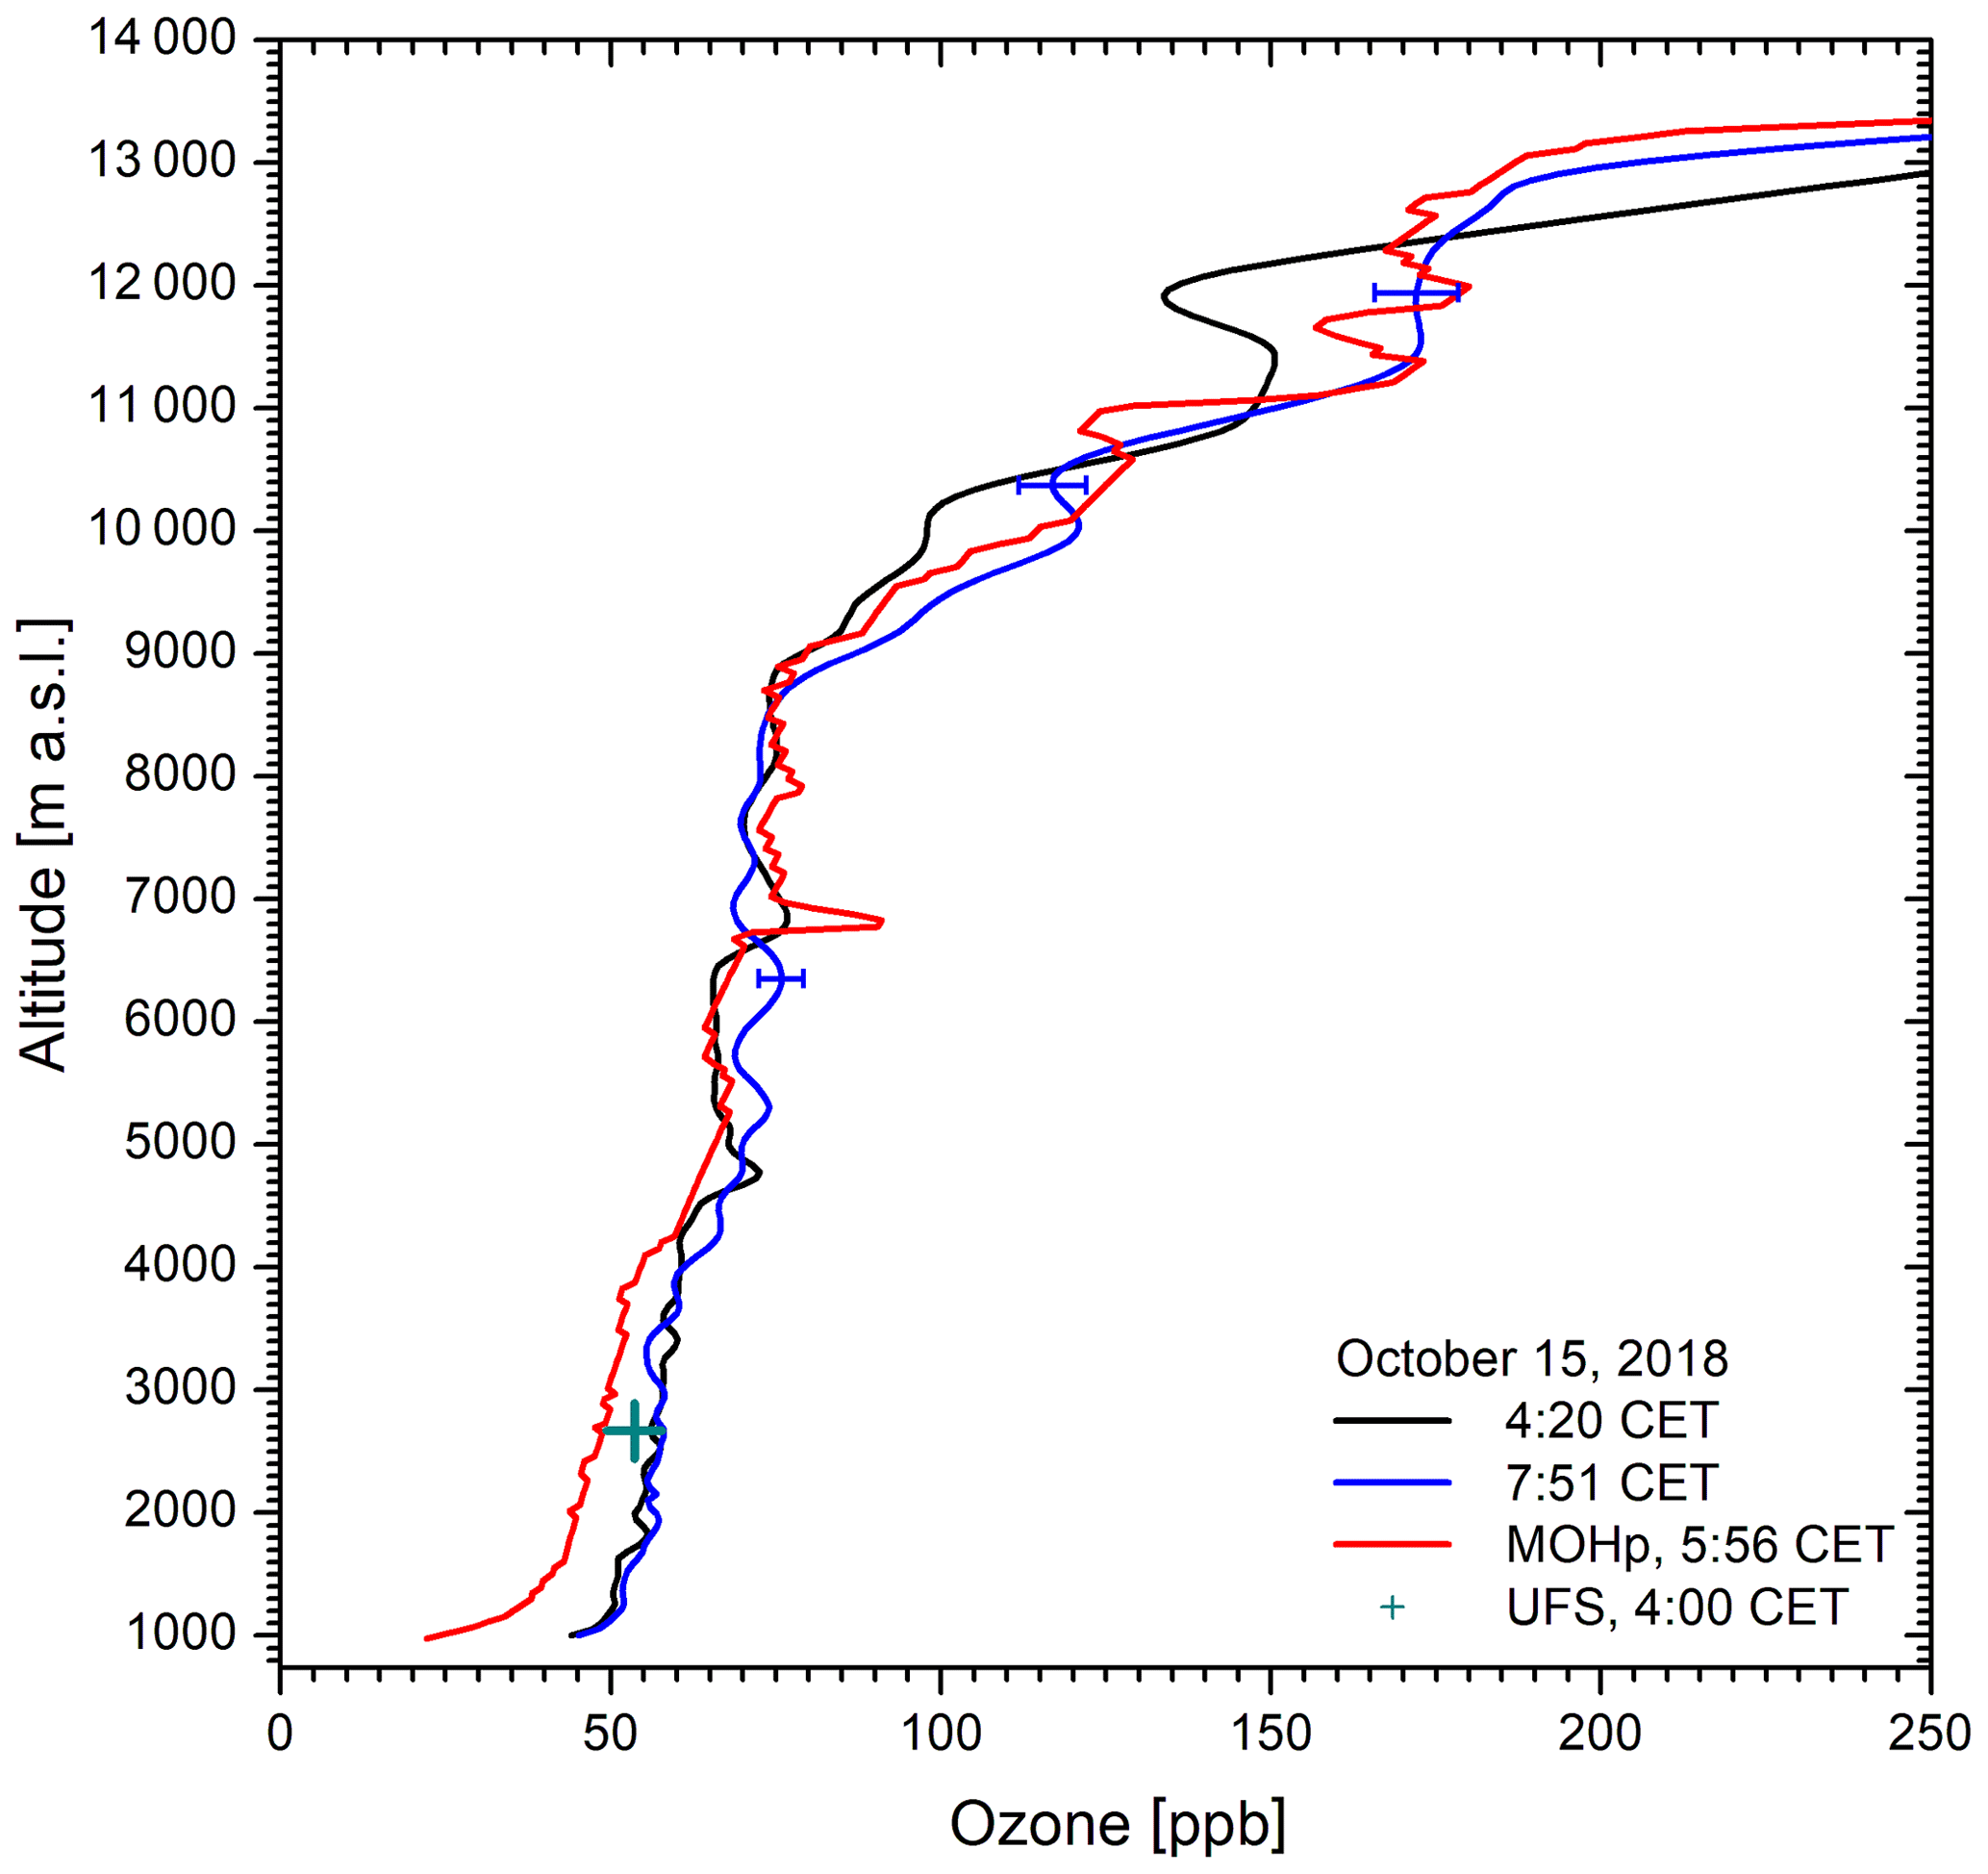
Figure 9Ozone measurements on 15 October 2018: the MOHp ozone (red) is not shifted. The agreement above 4.3 km is better with the earlier lidar measurement (black); above 7 km it is better with the blue curve. The lidar data are strongly smoothed in the stratosphere, as can be seen from the more detailed ozone structure in the sonde data. This example is one of the two examples with a pronounced low-altitude discrepancy between lidar and sonde extending to more than 3 km.
3.2.3 Offsets
The offsets of the MOHp data from the DIAL profiles were evaluated for all 36 comparison days. The result of the statistical assessment is displayed in Fig. 10, where also the differences between the lidar results for 2671 m a.s.l. and the GAW measurements at UFS are shown. Just one case was eliminated in the comparison of lidar and UFS: a strong negative shift of −7 ppb can be seen in Fig. 5, where UFS is located in the falling edge of a high-ozone range.
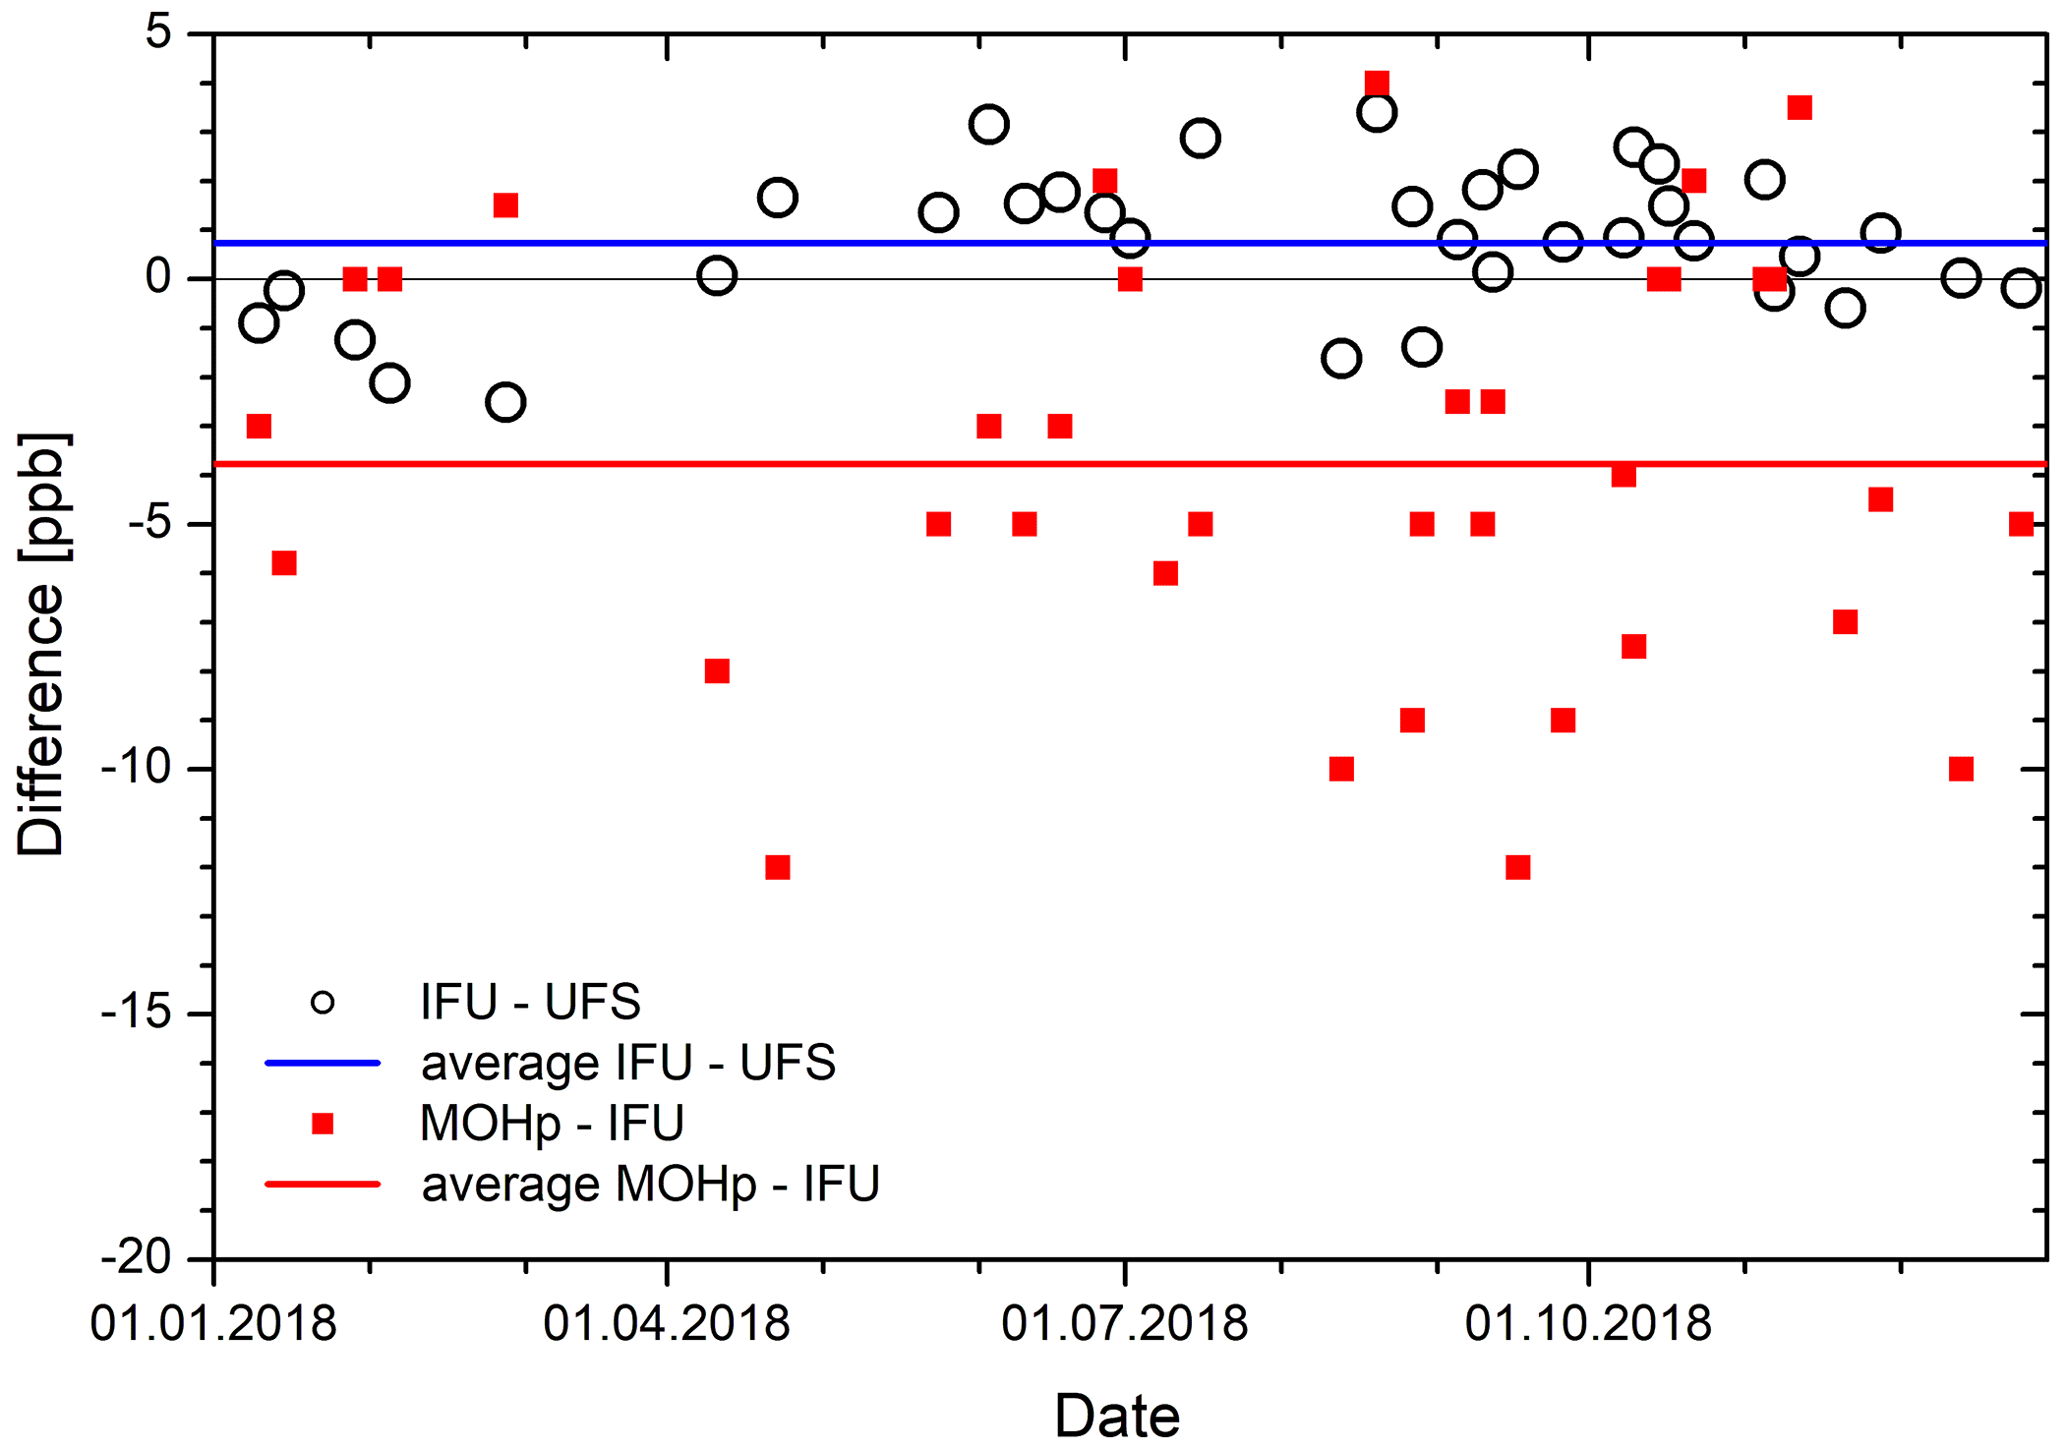
Figure 10Differences between the ozone values of the IFU DIAL at 2670 m and the UFS routine measurements as well as the offsets of the MOHp profiles with respect to the DIAL for 35 of the 36 measurement days of the 2018 comparison. The blue and red horizontal lines are the arithmetic averages for the full year (for the values see the text).
As found for the lidar measurements over many years (examples: Trickl et al., 2014, 2015, 2016, 2020b) the lidar ozone agrees with that at UFS to within ±3 ppb (mostly ±2 ppb). The agreement would perhaps be better if orographic vertical displacements and air flows on the ozone profiles were considered (Carnuth and Trickl, 2000; Carnuth et al., 2002; Yuan et al., 2019; Trickl et al., 2020a). The average difference between lidar and UFS for 2018 (blue horizontal line in Fig. 10) is 0.736 ± 1.46 ppb (standard deviation). A positive offset had also been found for an earlier 4 d comparison with the Zugspitze summit, but with even greater uncertainty (Trickl et al., 2020a). A positive offset of this size could be expected from the highly accurate cross-section measurements of Viallon et al. (2015), who determined a negative bias of 1.8 % of in situ ozone data calibrated with the WMO standard. This relative difference becomes more important on the absolute scale in summer than in winter because of the higher ozone values. However, the statistical noise of the differences is too high to allow such an effect to be resolved.
The offsets between the MOHp sonde and the lidar, again preferentially determined within the range up to 6 km, are substantially higher than those between the lidar and UFS (red filled squares in Fig. 10). The offsets of the ozone sondes range from −12 to +4 ppb, with an average of −3.77 ppb (red horizontal line in Fig. 10) and a standard deviation of 4.22 ppb.
We exclude the lowest altitudes from the comparison where obvious differences in ozone exist, e.g. owing to local night-time ozone depletion effects. It is important to note that in just seven cases of the 36 comparisons for 2018 lower ozone in the sonde profiles reached up to more than 2.67 km (UFS), in three cases to more than 3 km (Zugspitze summit). We conclude that differences between the Zugspitze sites and the MOHp sonde are mostly related to sonde calibration issues and not to differences in air composition as suspected earlier.
3.2.4 Differences
In order to determine the quality of the lidar measurements within the free troposphere we show in the three panels of Fig. 11 average differences between lidar and offset-corrected MOHp sonde data as a function of altitude and for three different ozone conditions, roughly below 50 ppb (low ozone; top panel), between 50 and 70 ppb (moderate ozone; second panel), and more than 70 ppb (high ozone; bottom panel), respectively. On a given day, the lidar ozone profiles agreeing best with the MOHp profile were taken. We also give the percentages of the averages with respect to the offset-corrected sonde ozone. At high altitudes the sonde ozone is a more useful reference than the lidar in the case of high ozone because of the considerable absolute uncertainty caused by the loss of laser radiation by absorption in ozone.
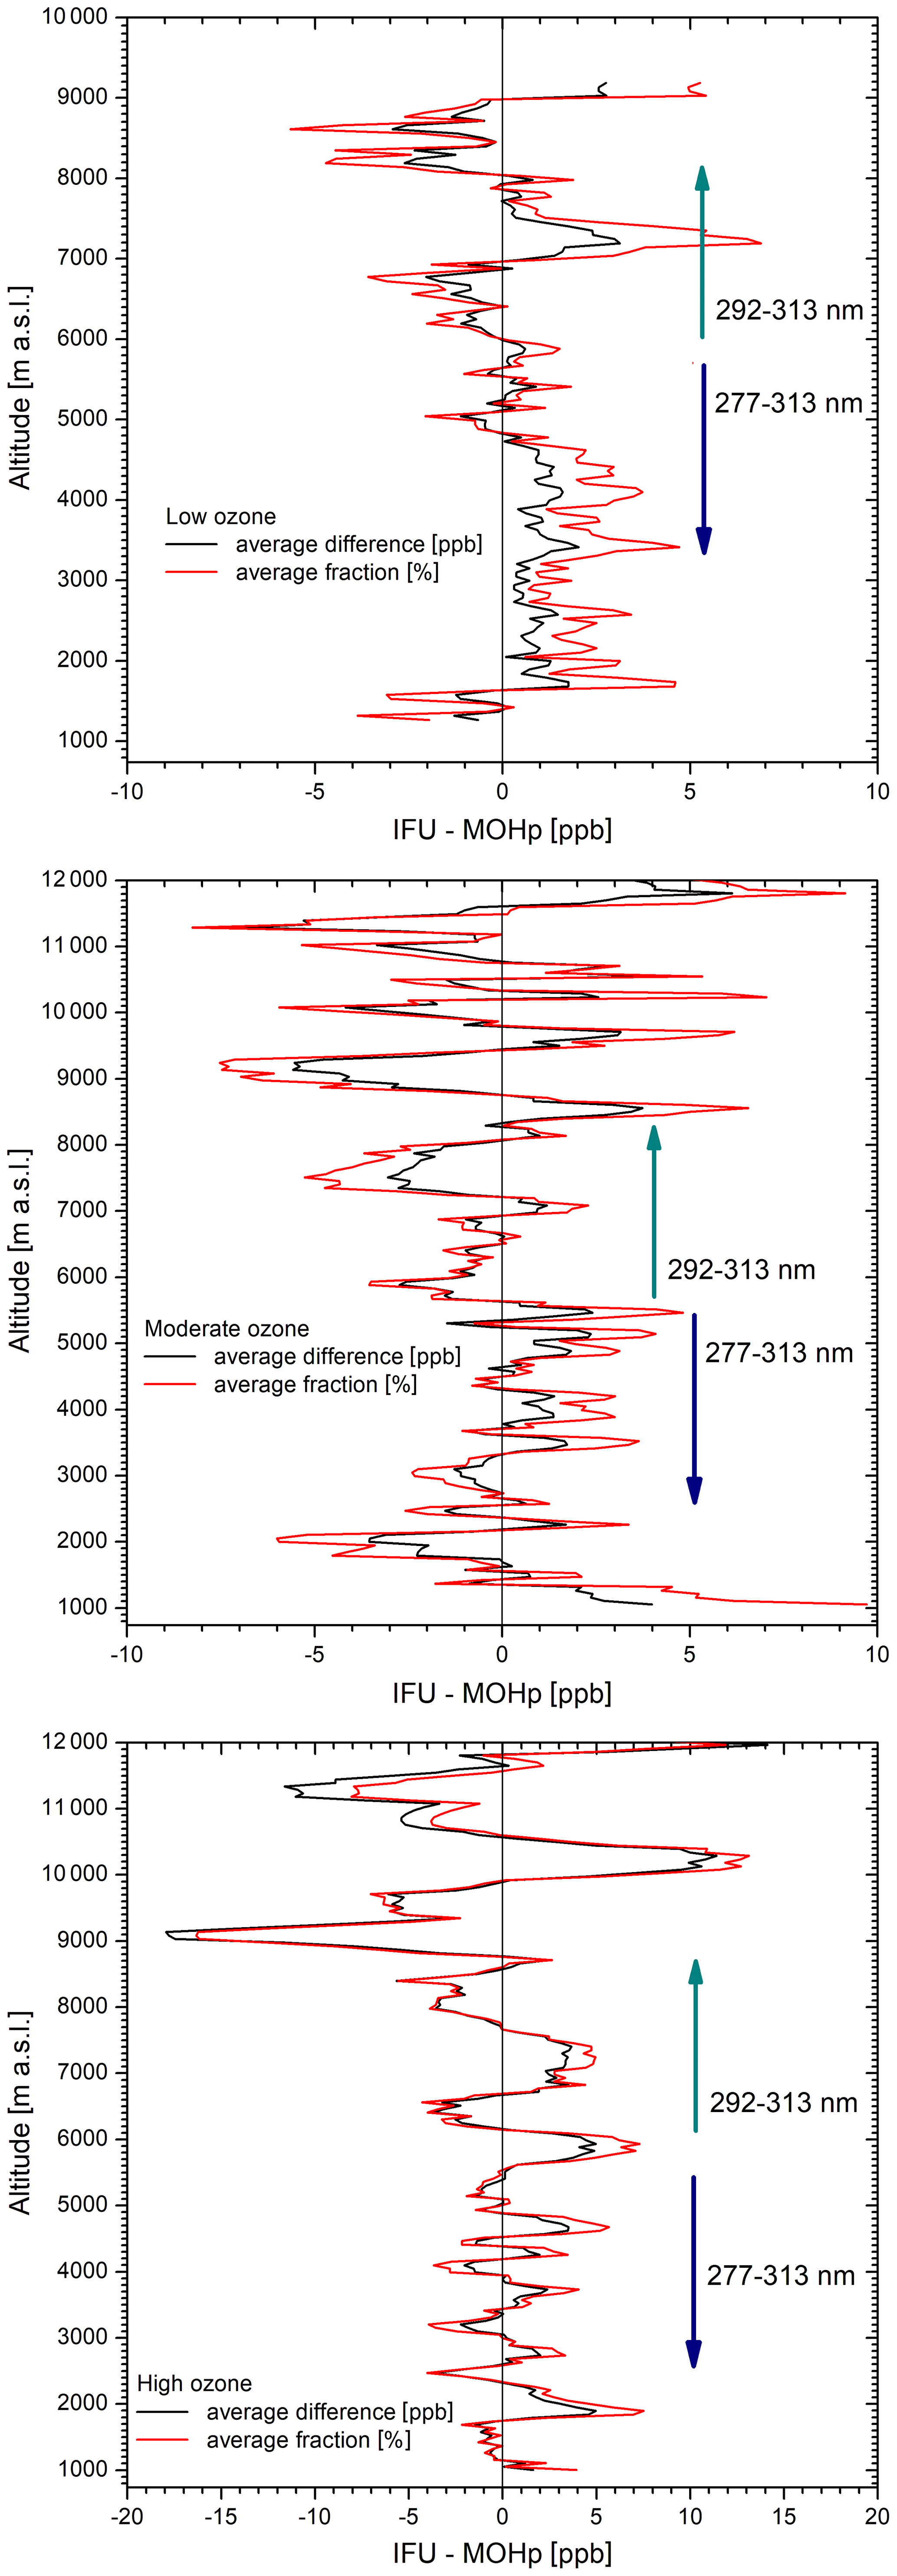
Figure 11Average differences between IFU lidar and offset-corrected MOHp sonde in 2018 for low, moderate, and high conditions (based on six, seven, and six comparisons respectively); the uncertainties may be estimated from the maximum differences around the respective altitudes. We also indicate the approximate altitude ranges of the two wavelength pairs used for the lidar data evaluation.
For winter-type conditions (top panel) the six examples averaged do not exhibit a significant vertical ozone structure, which made the analysis straightforward and yields small average differences between ±1 and ±3 ppb, in agreement with the conclusions in Sect. 3.1. For moderate ozone (second panel) and high ozone (bottom panel), mostly during the warm season, the vertical distributions are more complex, with changes on a time scale of even less than 1 h. Here, we eliminated the data for a few pronounced ozone peaks and dips that differed at both stations. The six high-ozone cases were restricted to July and August.
The averaged distributions of the differences exhibit oscillations. These oscillations were analysed for coherency (not shown), but no systematic behaviour was identified. Thus, we ascribe the structure to noise. The noise contains both an atmospheric and an instrumental component.
Beyond the days and years of the comparison there are occasionally extreme cases with 100 to 150 ppb in the middle and upper troposphere. This can lead to lidar uncertainties even up to more than 20 ppb during daytime, also because the raw signal becomes comparable with the additional solar background noise. In the most severe cases the stratospheric ozone rise cannot be seen in the lidar data during daytime, and the ozone profile is cut off in the upper troposphere for archiving.
The analyses for 2018 do not reveal significant systematic differences between the lidar values and the offset-corrected sonde data in the entire free troposphere (based on the numbers underlying Fig. 10). This confirms the conclusion in Sect. 3.1 for the quality of the lidar, now for all seasons. The maximum noise excursions can be interpreted as maximum combined uncertainties of lidar and corrected sonde within a given altitude range (slightly overestimated owing to atmospheric differences in ozone between the two sites). The results of this analysis confirm the estimates in Table 4 of Trickl et al. (2020a).
3.3 Comparisons of MOHp sonde, IFU lidar, and in situ measurements at summits in 2009
The results in Sect. 3.2 suggested also looking at a few earlier years. We select 2009 from the period of routine measurements as another year of comparison. The lidar raw data were noisier than for the period after 2012 and a tiny electronic ringing effect had to be removed mathematically. Thus, the uncertainties of the ozone profiles above 6 km are higher than after the final system upgrading in 2012, particularly in summer. As a consequence, a lidar validation is desirable at least for the upper troposphere. More importantly, in 2009, high-quality ozone data still exist for the summit stations Wank (1780 m a.s.l.) and Zugspitze (2962 m a.s.l). These stations benefit from more frequent direct advection than UFS.
In 2009, the lidar was operated just until October, which, nevertheless, allows us to make a reasonable number of comparisons with MOHp. The lidar operation was stopped afterwards as there were more and more cases of single-bit errors in channel 5 of the transient digitizer system, which had to be sent for repair. These errors induced unrealistic data in the upper troposphere.
We identified a total of 23 d suitable for comparisons. On just 8 of these days lidar measurements were made in optimal temporal proximity. We find more deviations in the profiles than for 2018. In part, this can be explained by atmospheric variability and insufficient air-mass matching. In addition, as mentioned, the raw data of the lidar are noisier and some weak ringing had to be removed. This caused elevated uncertainties above 6 km. Nevertheless, the data allowed us to determine offsets for the MOHp ozone profiles, after verifying the data quality of the lidar with the Zugspitze and Wank in situ ozone.
In Fig. 12 we show the results of the analysis for 2009. The difference between IFU DIAL and Zugspitze is −0.165 ± 1.36 ppb (standard deviation), between DIAL and Wank +0.714 ± 1.20 ppb. The DIAL ozone below the Wank altitude is increasingly uncertain because of alignment issues of the near-field telescope.
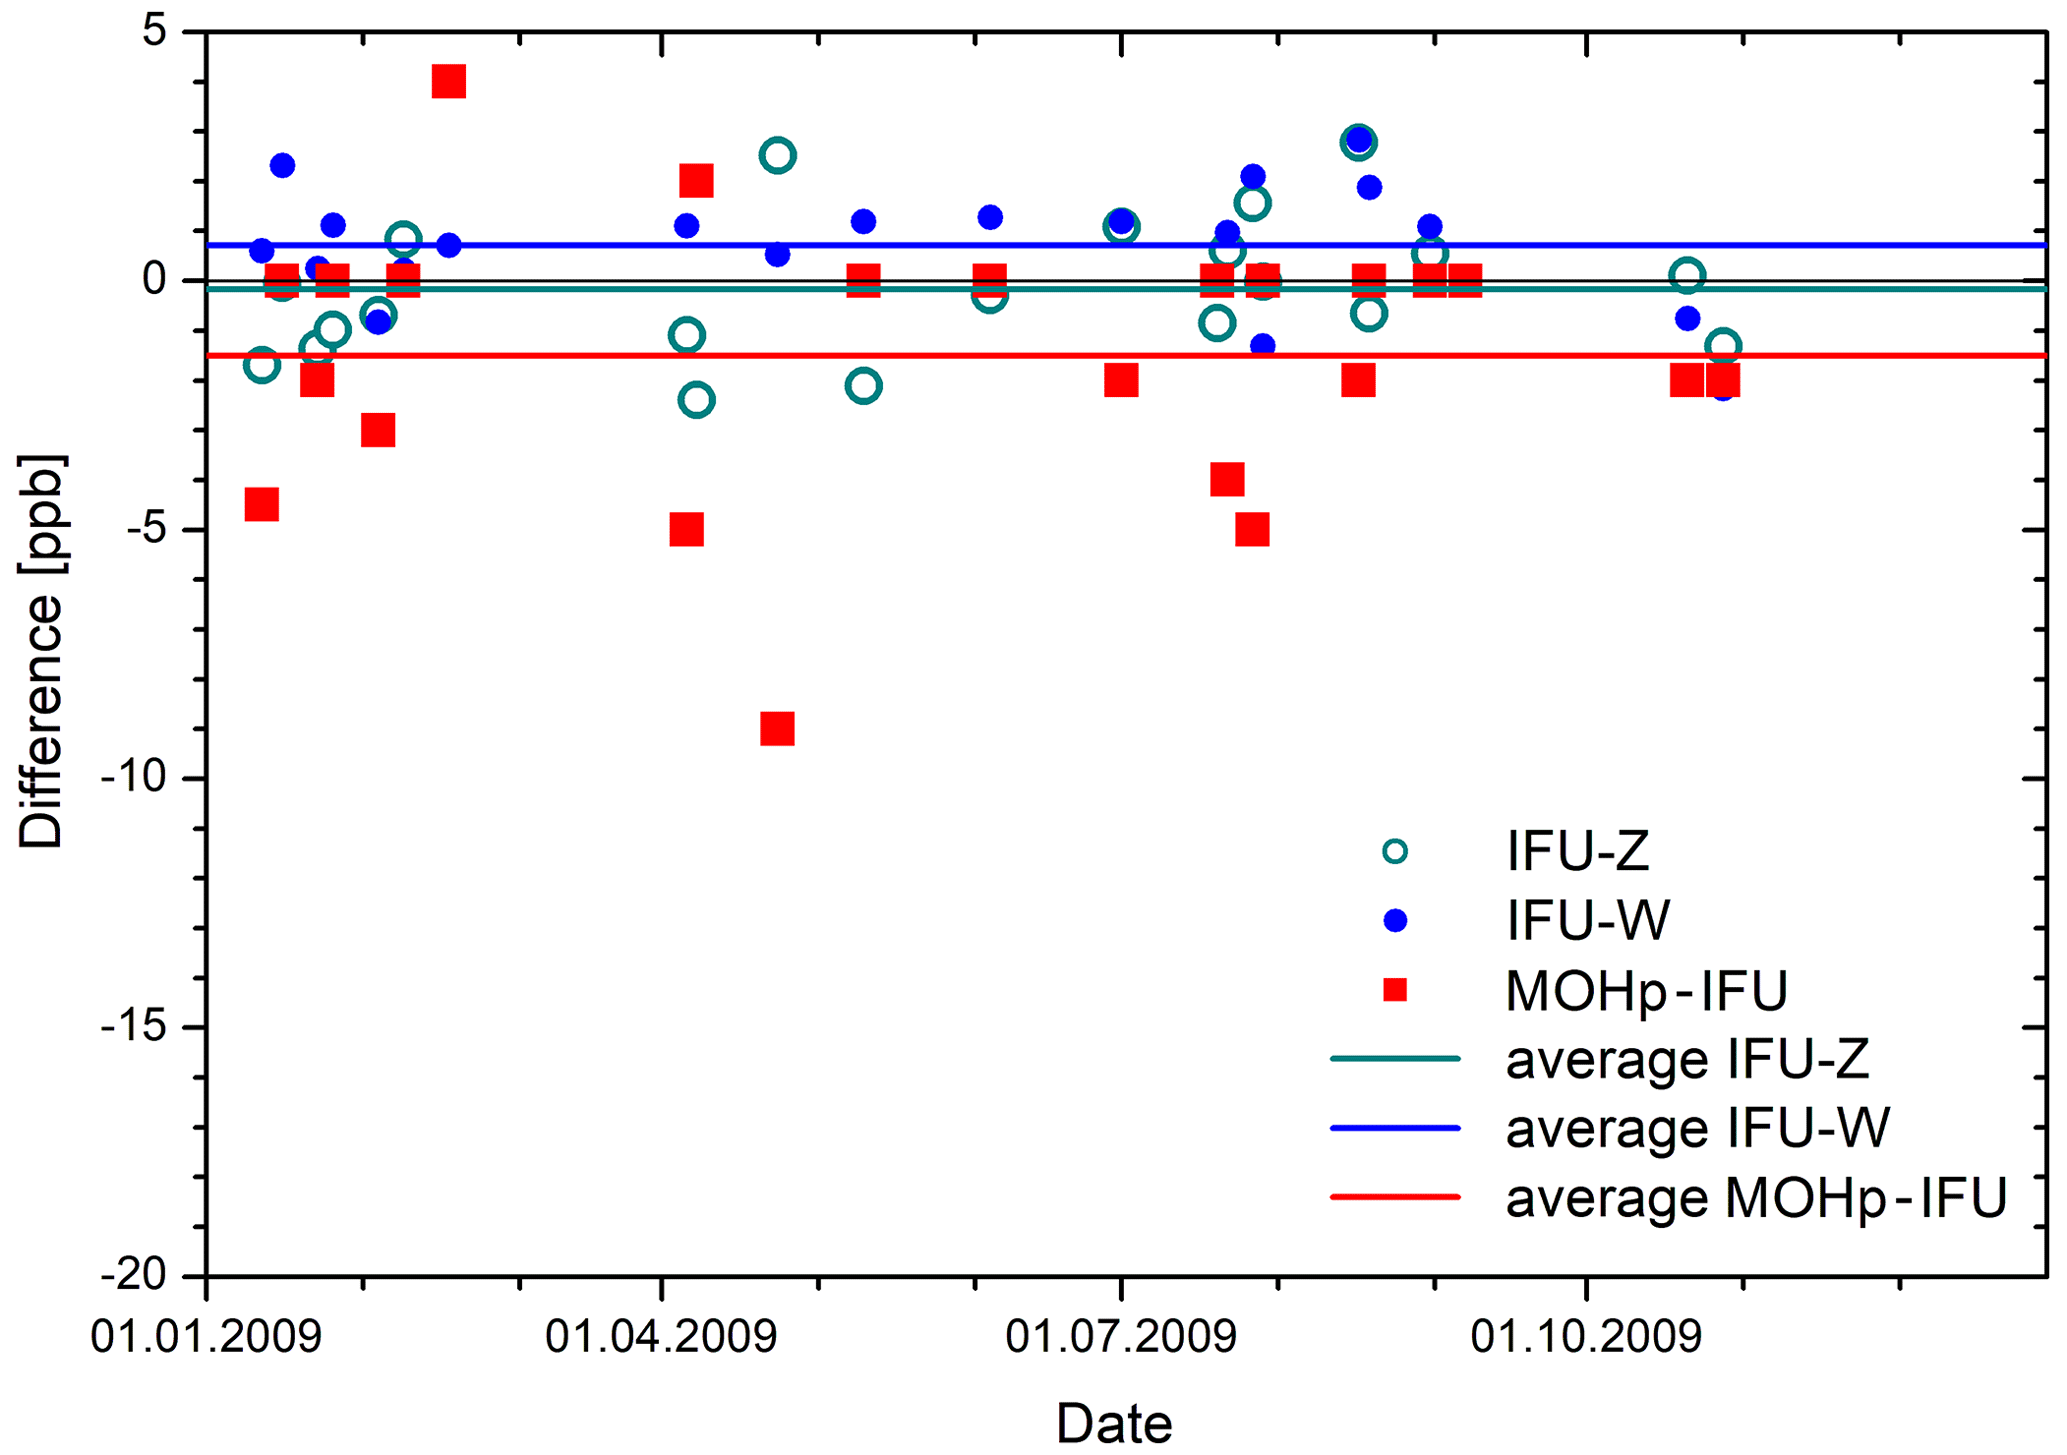
Figure 12Differences between the ozone mixing ratios of the lidar (IFU) and the stations Zugspitze (Z), Wank (W) at the summit altitudes, and offsets between lidar and MOHp sonde for 2009.
In an earlier comparison for May 1999 (Trickl et al., 2020a) we selected a lower altitude in the DIAL data (2786 m) and found better agreement with the Zugspitze data, but, still, a slight positive offset with respect to the station. This is not attempted here, although we can see the effect of orographic lifting in some examples.
For 2009 the offsets between DIAL and MOHp sondes were determined primarily by between 2 and 5 km. The sonde offset obtained in this way is, again, negative on average (−1.500 ppb), with a standard deviation of 2.67 ppb, both being less pronounced than in 2018.
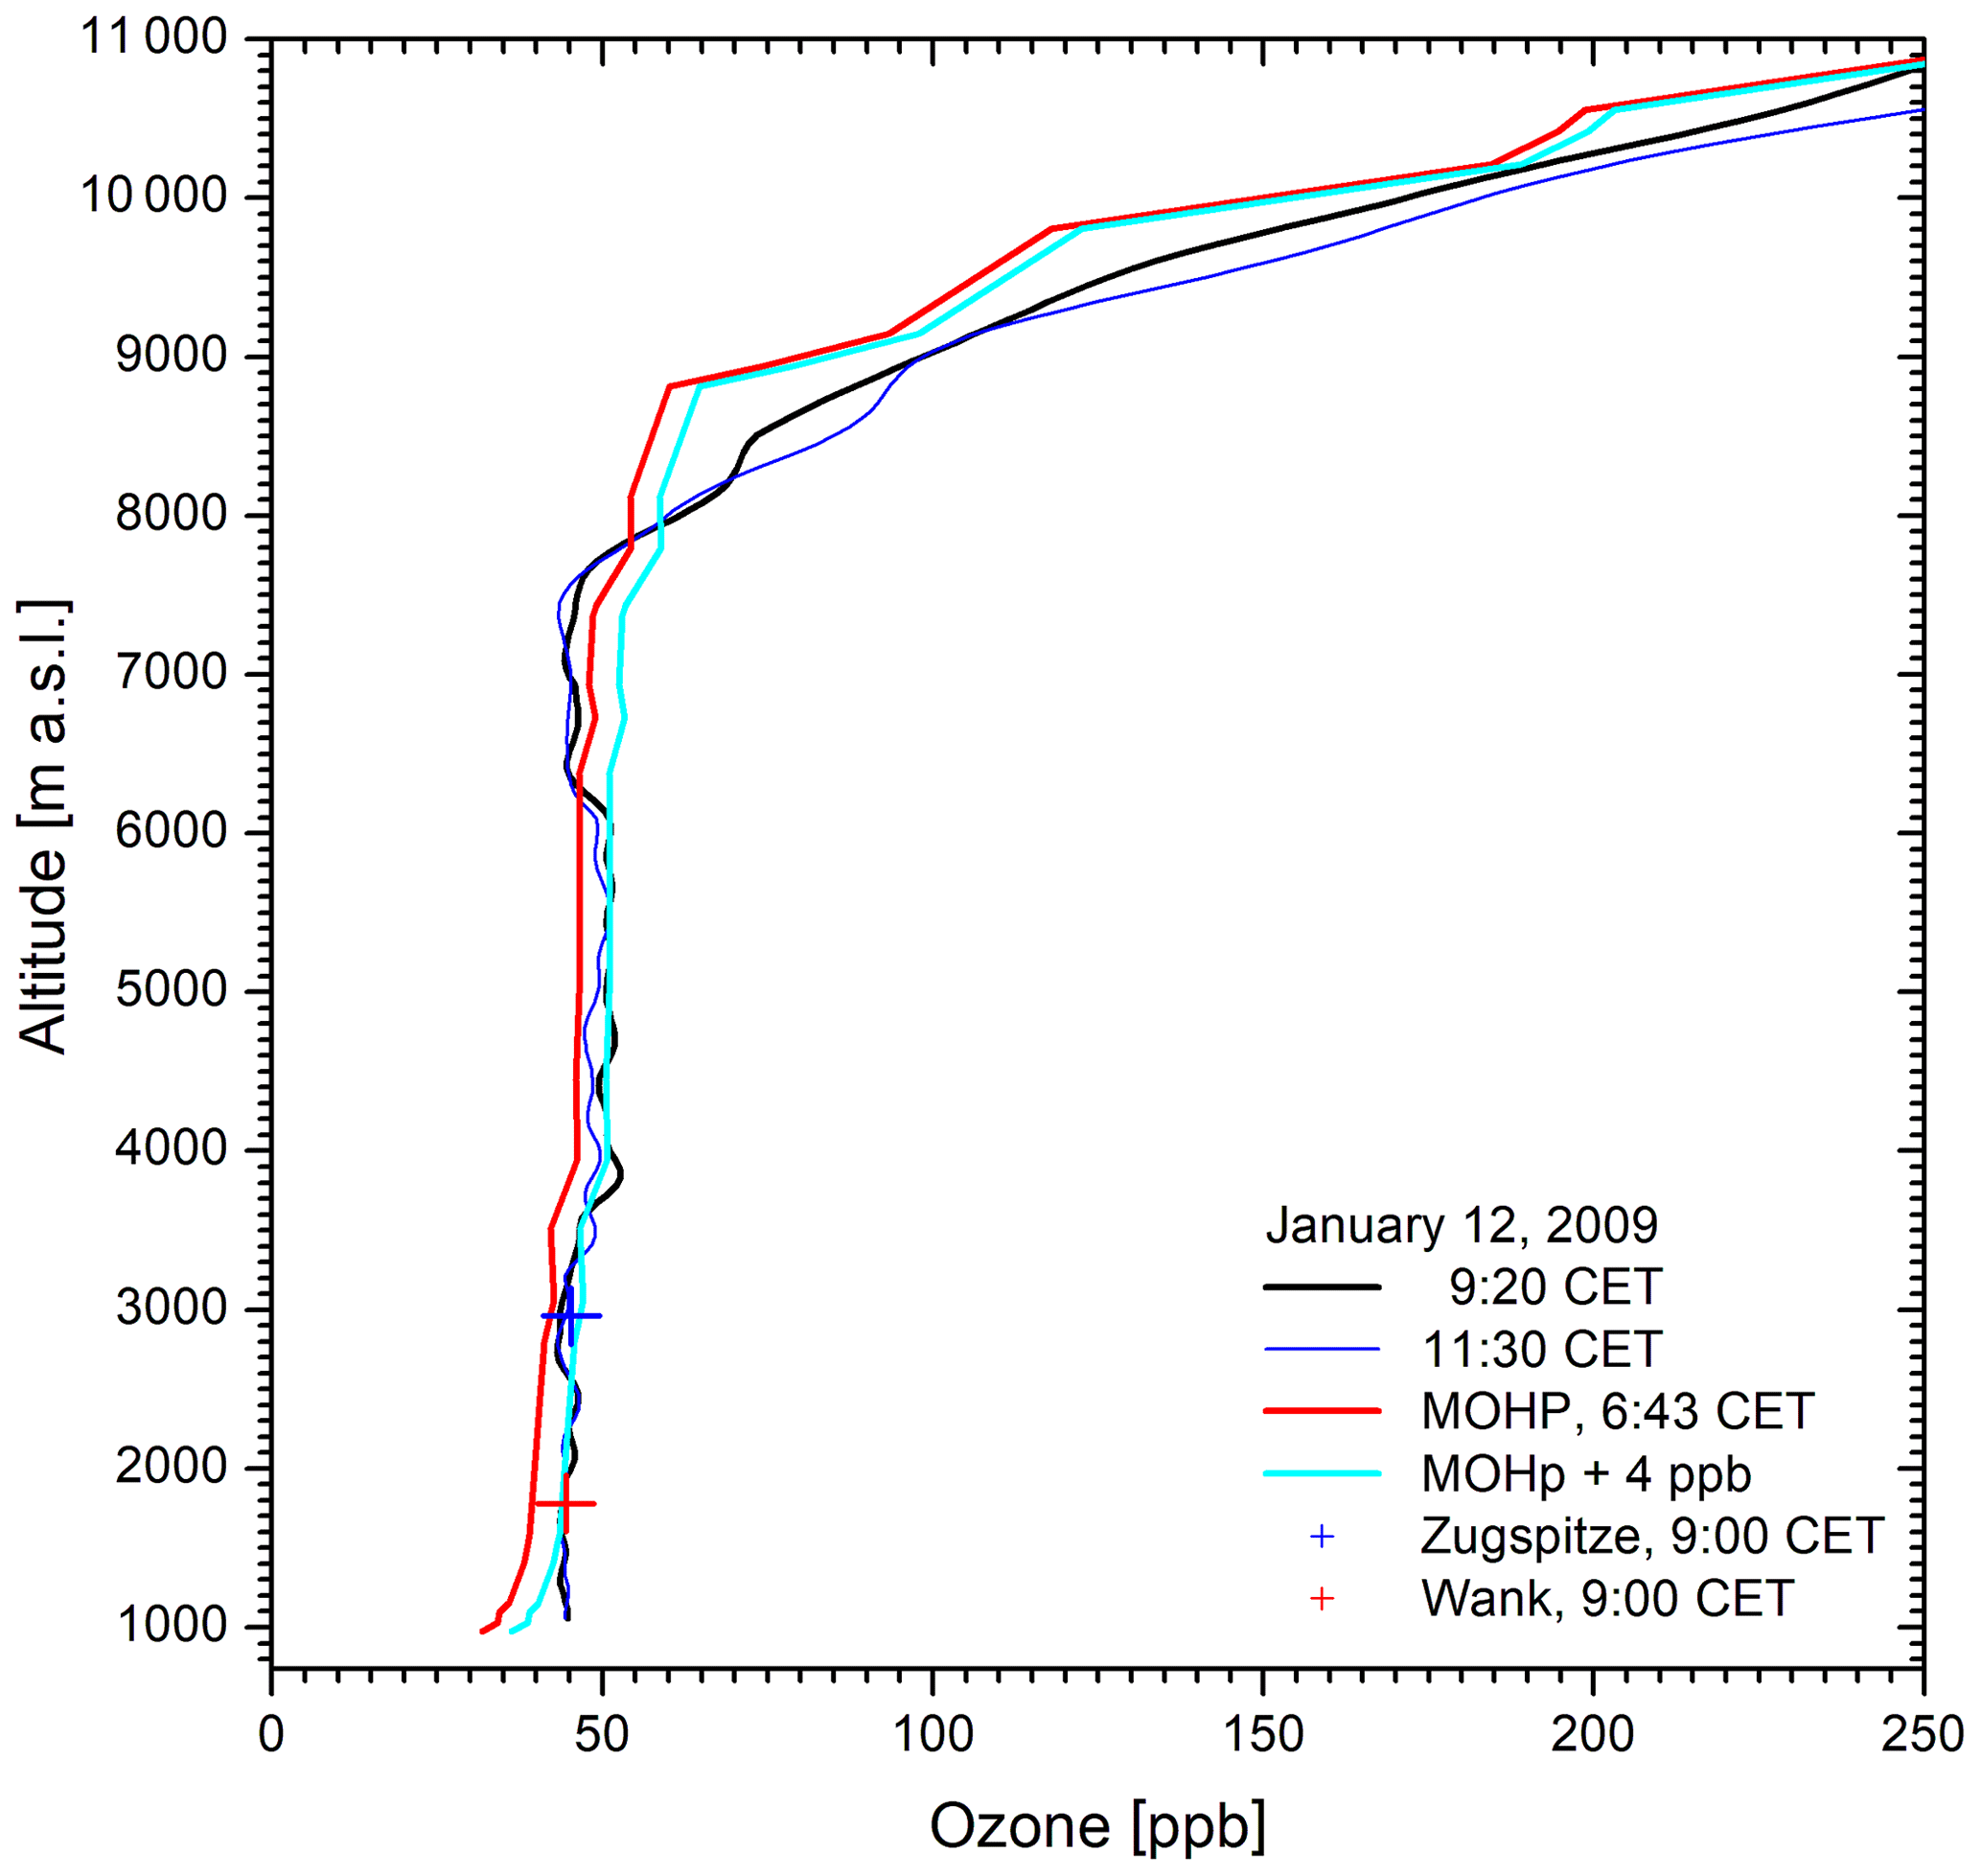
Figure 13 shows a comparison on 12 January 2009, demonstrating excellent agreement between the two systems after offset correction, except for the upper troposphere and lower stratosphere. In this case, the first lidar measurement took place at 09:20 CET, i.e. substantially later than the sonde ascent. Thus, the comparison has its limits. In the morning of 12 January westerly advection was revealed by HYSPLIT backward trajectories above at 7 km a.s.l. This air mass originated below 2 km over the subtropical Atlantic. This could explain the slightly lower ozone level around this altitude in the lidar results.
Another interesting example is 17 August (Fig. 14). The agreement between lidar and ozone sonde is highly satisfactory up to 5.4 km and quite reasonable up to 10 km. However, between 10 and 14.5 km the lidar ozone is extremely low, in contrast to the sonde data. The pronounced ozone increase in the sonde data above 10 km is difficult to explain as the elevated RH values suggest neither a low tropopause nor the presence of a stratospheric intrusion that typically features RH values of a few per cent at most (Trickl et al., 2014, 2015, 2016). On the other hand, the ozone peak above IMK-IFU descending roughly from 10 to 8 km is attributed by HYSPLIT calculations to subsiding air, indicating the presence of an intrusion layer. It is interesting that the rather short delay of the lidar measurements (07:00 to 09:15 CET) with respect to the sonde ascent (launch time 05:57 CET) can result in such a considerable difference.
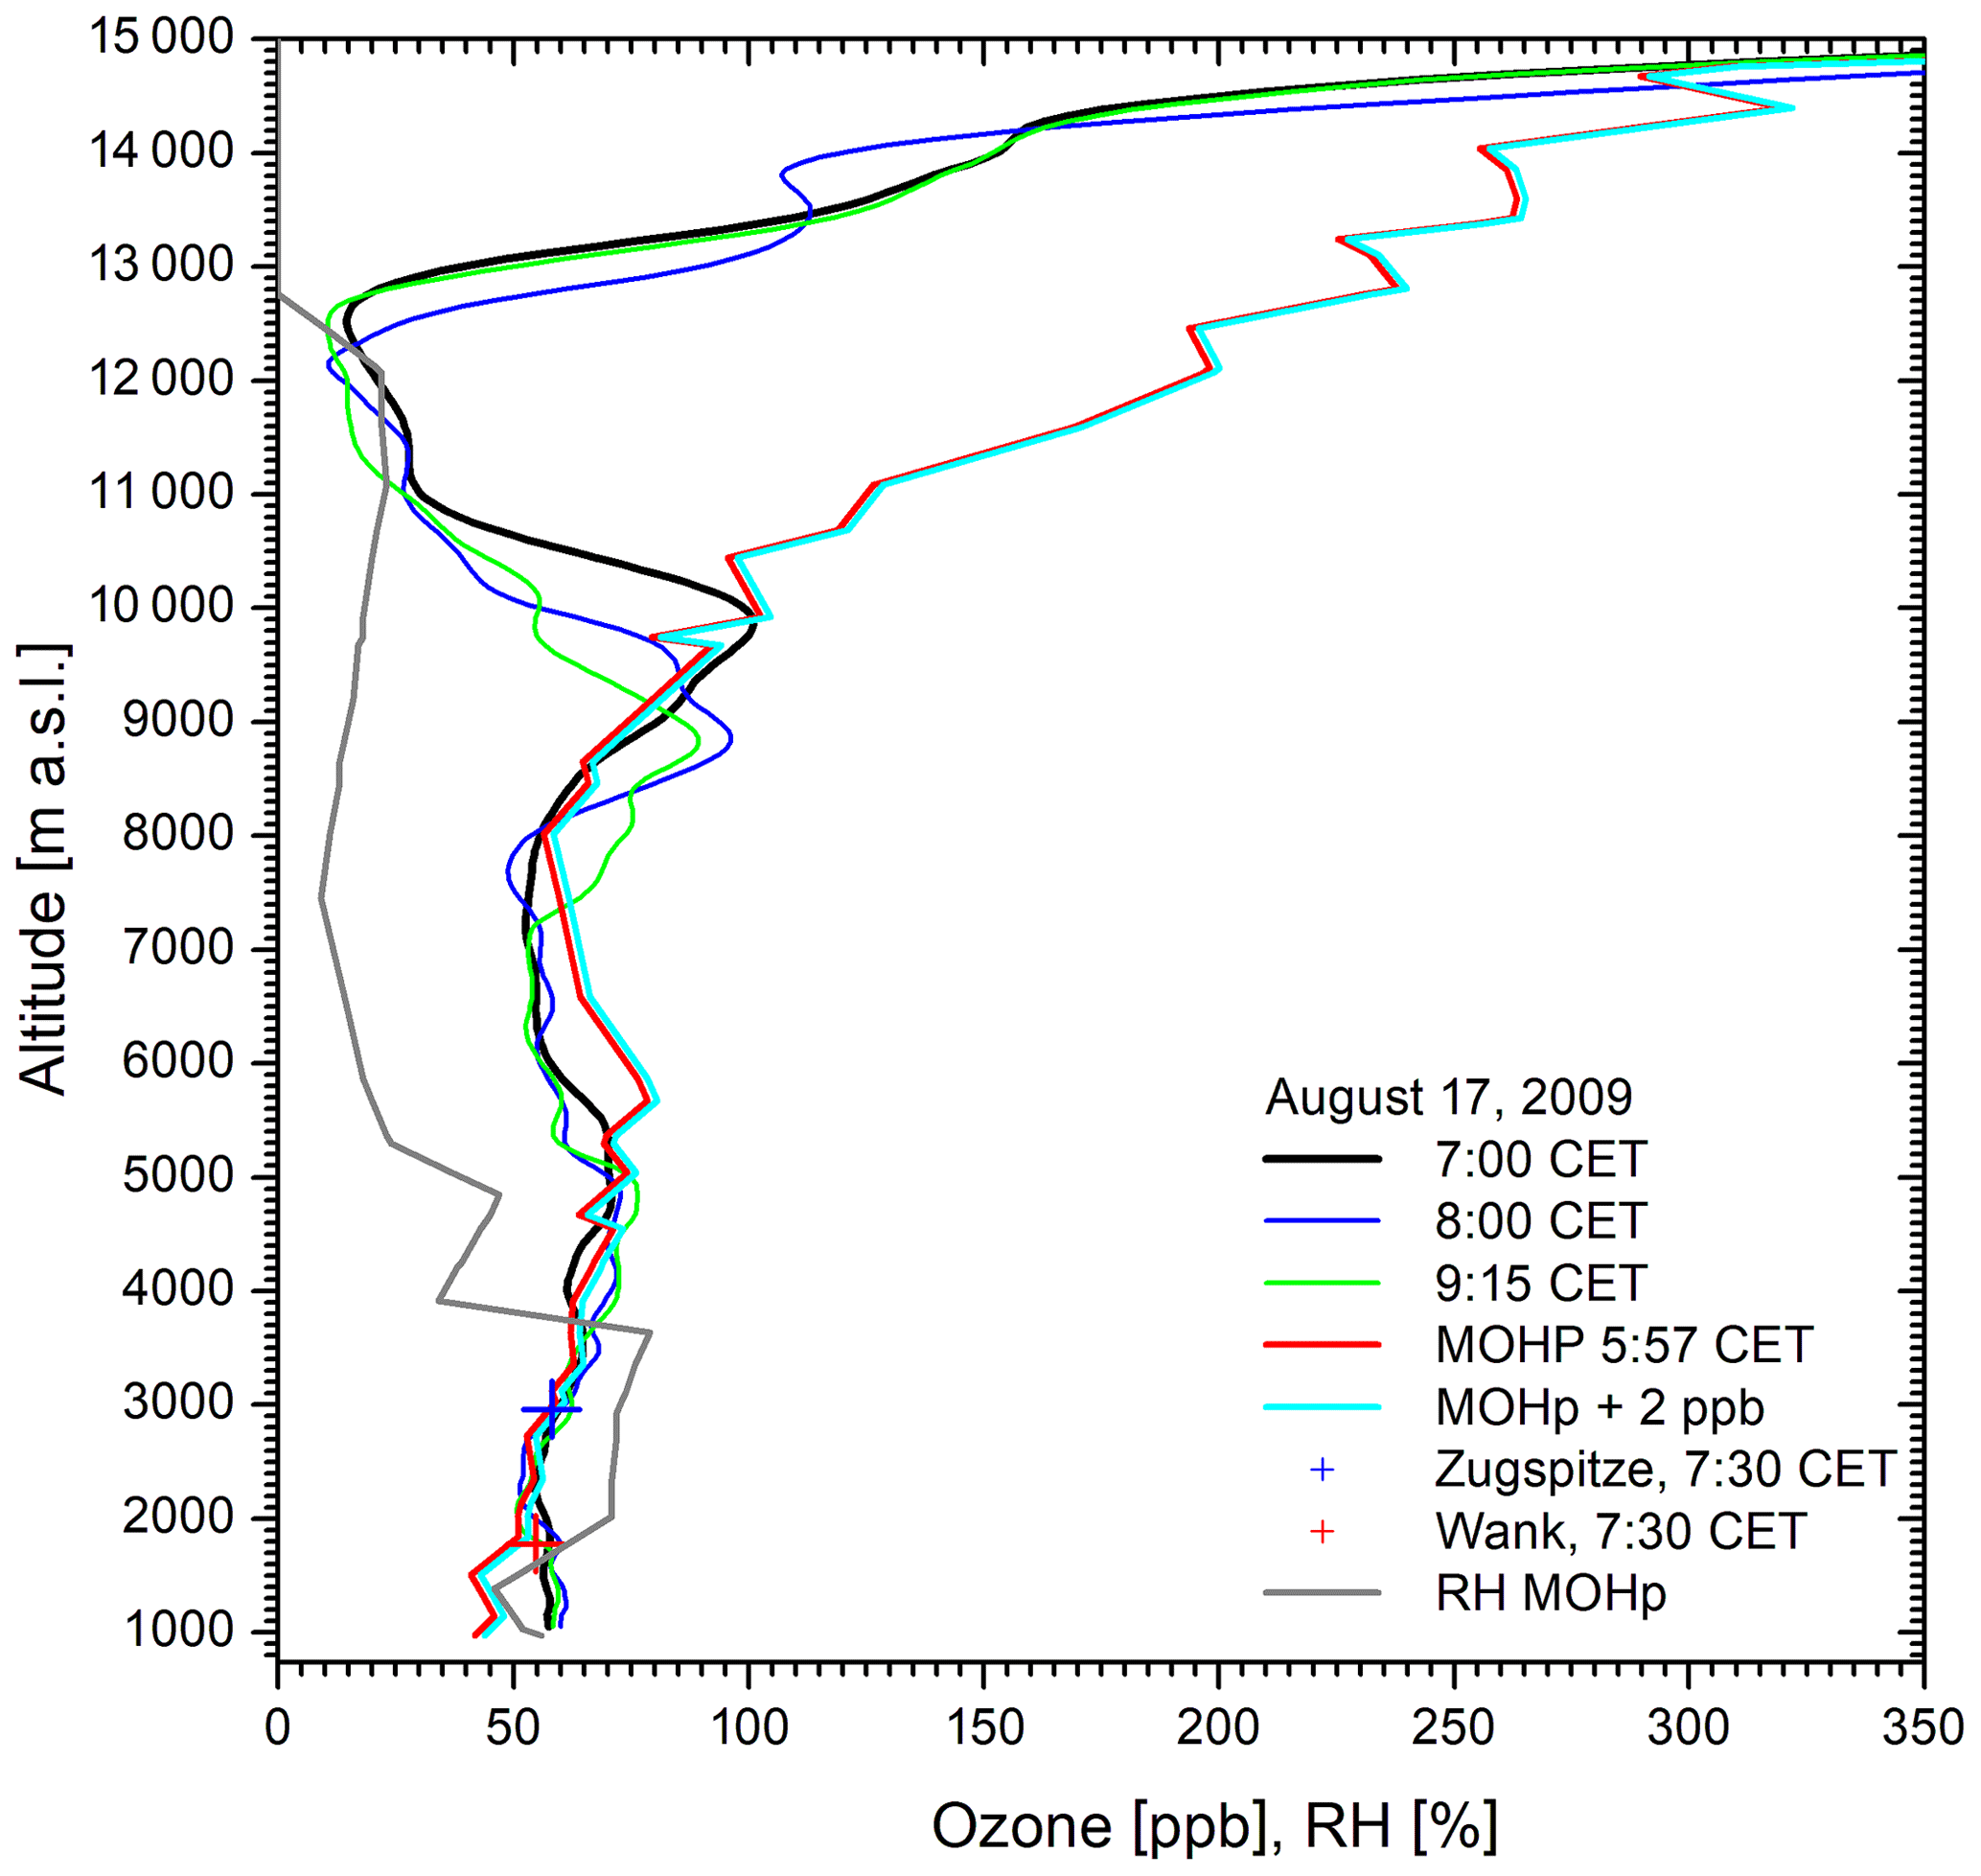
Figure 14Ozone measurements on 17 August 2009; the structure in the upper troposphere is strongly influenced by smoothing. The bias between 5.5 and 8 km has not been explained.
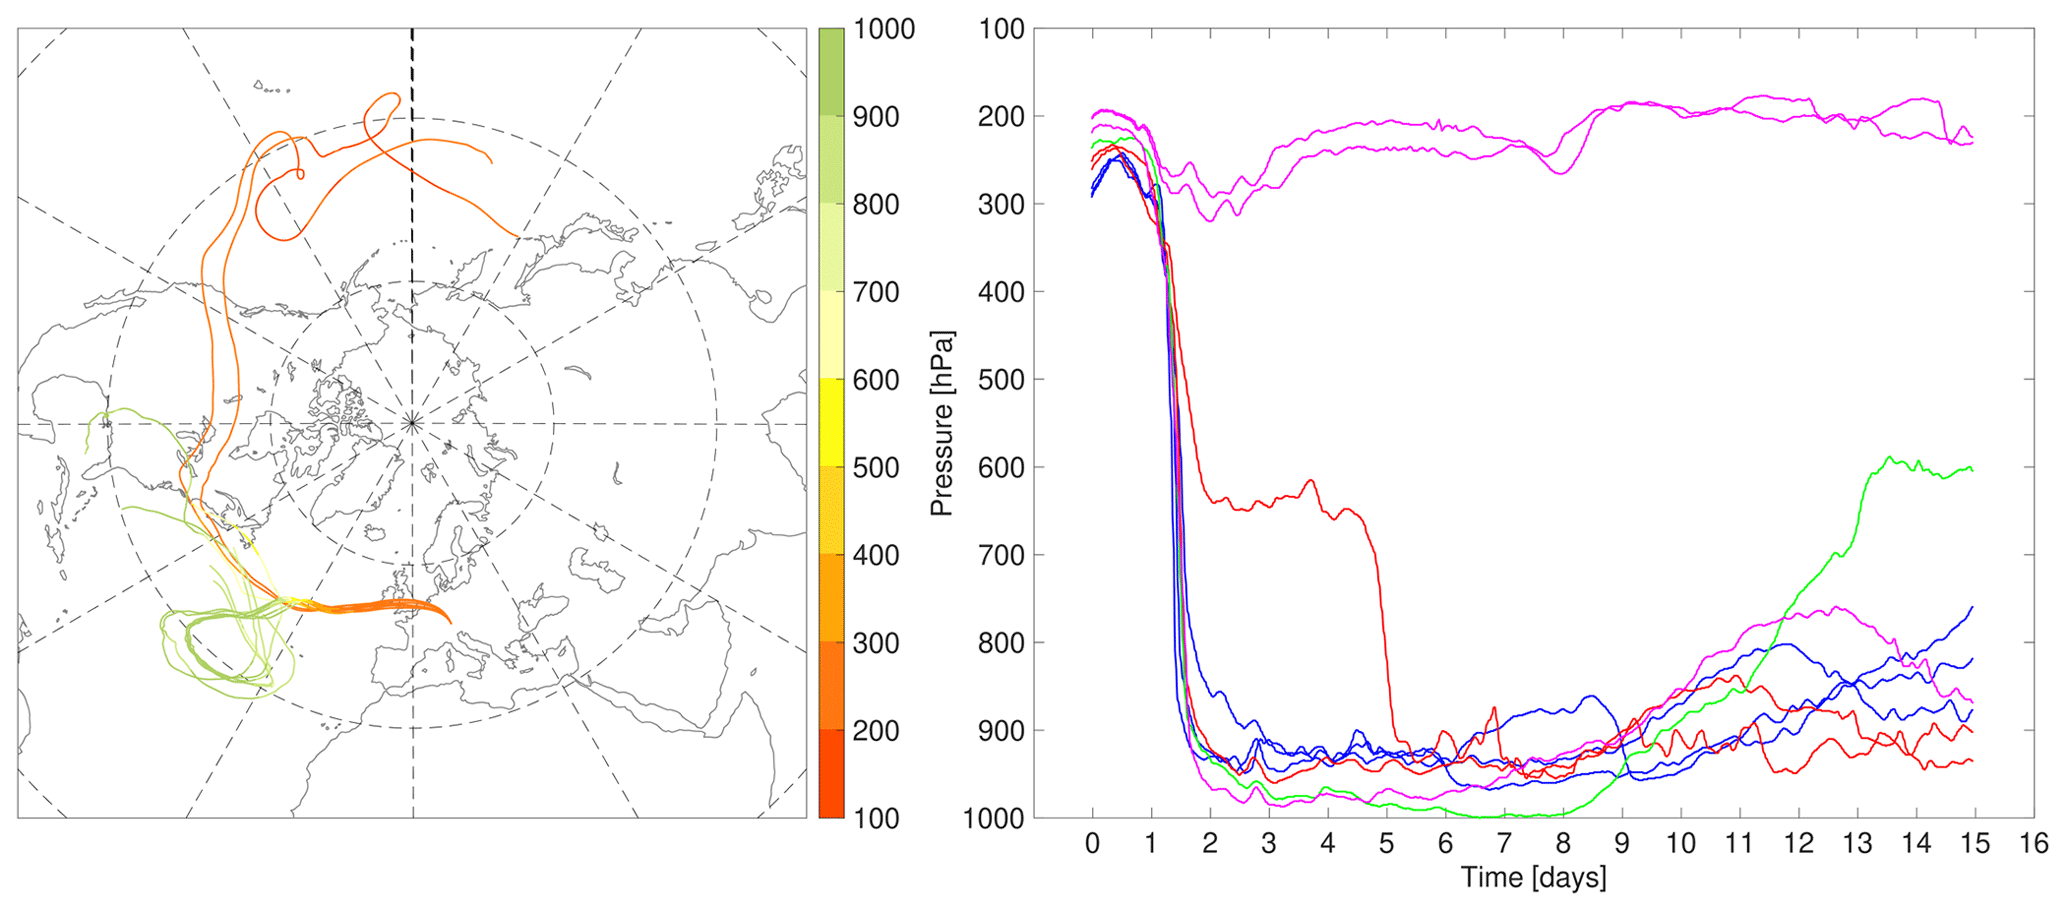
Figure 15350 h LAGRANTO backward trajectories, started above Garmisch-Partenkirchen (G) on 9 July 2018 at 07:00 CET.
Again, 350 h LAGRANTO trajectories were calculated for start times above IMK-IFU between 03:00 and 08:00 CET (interval: 1 h) and start altitudes within the low-ozone layer. Until 06:00 CET the influence of marine boundary layers is almost absent. Afterwards, the trajectories reveal a growing import from the first 600 m above the subtropical Atlantic Ocean. In Fig. 15 the LAGRANTO results for 08:00 CET are shown.
In some cases the lidar seems to exhibit a negative bias with respect to the sondes in the upper troposphere. It is advisable to re-examine a major part of the data between 2007 and 2011, also including strategies developed later. For example, an exponential decay of the analogue signal was identified with the much lower noise of the final setup (Trickl et al., 2020a), which must be addressed.
3.4 Comparisons of MOHp sonde, IFU lidar, and in situ measurements of summits in 2000 and 2001
The period September 2000 to August 2001 is suitable for another comparison when a large number of STT-related measurement series were made as a contribution to the STACCATO project (Stohl et al., 2003; examples: Trickl et al., 2003, 2010, 2011; Zanis et al., 2003). These measurements were made with the noisier detection electronics of Eisele et al. (1999), but had the advantage that single-photon counting was used for the “solar blind” “on” detection channels, which added linearity above 5 km (starting in spring 1997). The counting system could no longer be computer controlled after 2006. A new one was installed after highly positive results in other IFU lidar systems (Klanner et al., 2021) in autumn 2018, too late for this comparison effort.
The focus on STT during the STACCATO period made the comparisons a challenge because of the pronounced layering. However, on 11 of the useful 20 d of comparison there was reasonable temporal proximity, owing to running long time series. The agreement between the lidar and the MOHp sonde was much better than expected in the entire free troposphere. The agreement (after offset-correcting the MOHp profiles) is almost perfect during the cold season. But also under high-ozone conditions the comparisons do not reveal systematic differences beyond the sonde offsets.
Two examples for elevated ozone are shown in Figs. 16 and 17. The good comparisons support our earlier work (Trickl et al., 2003, 2010), and we tend to ascribe this to the satisfactory performance of the single-photon counting system.
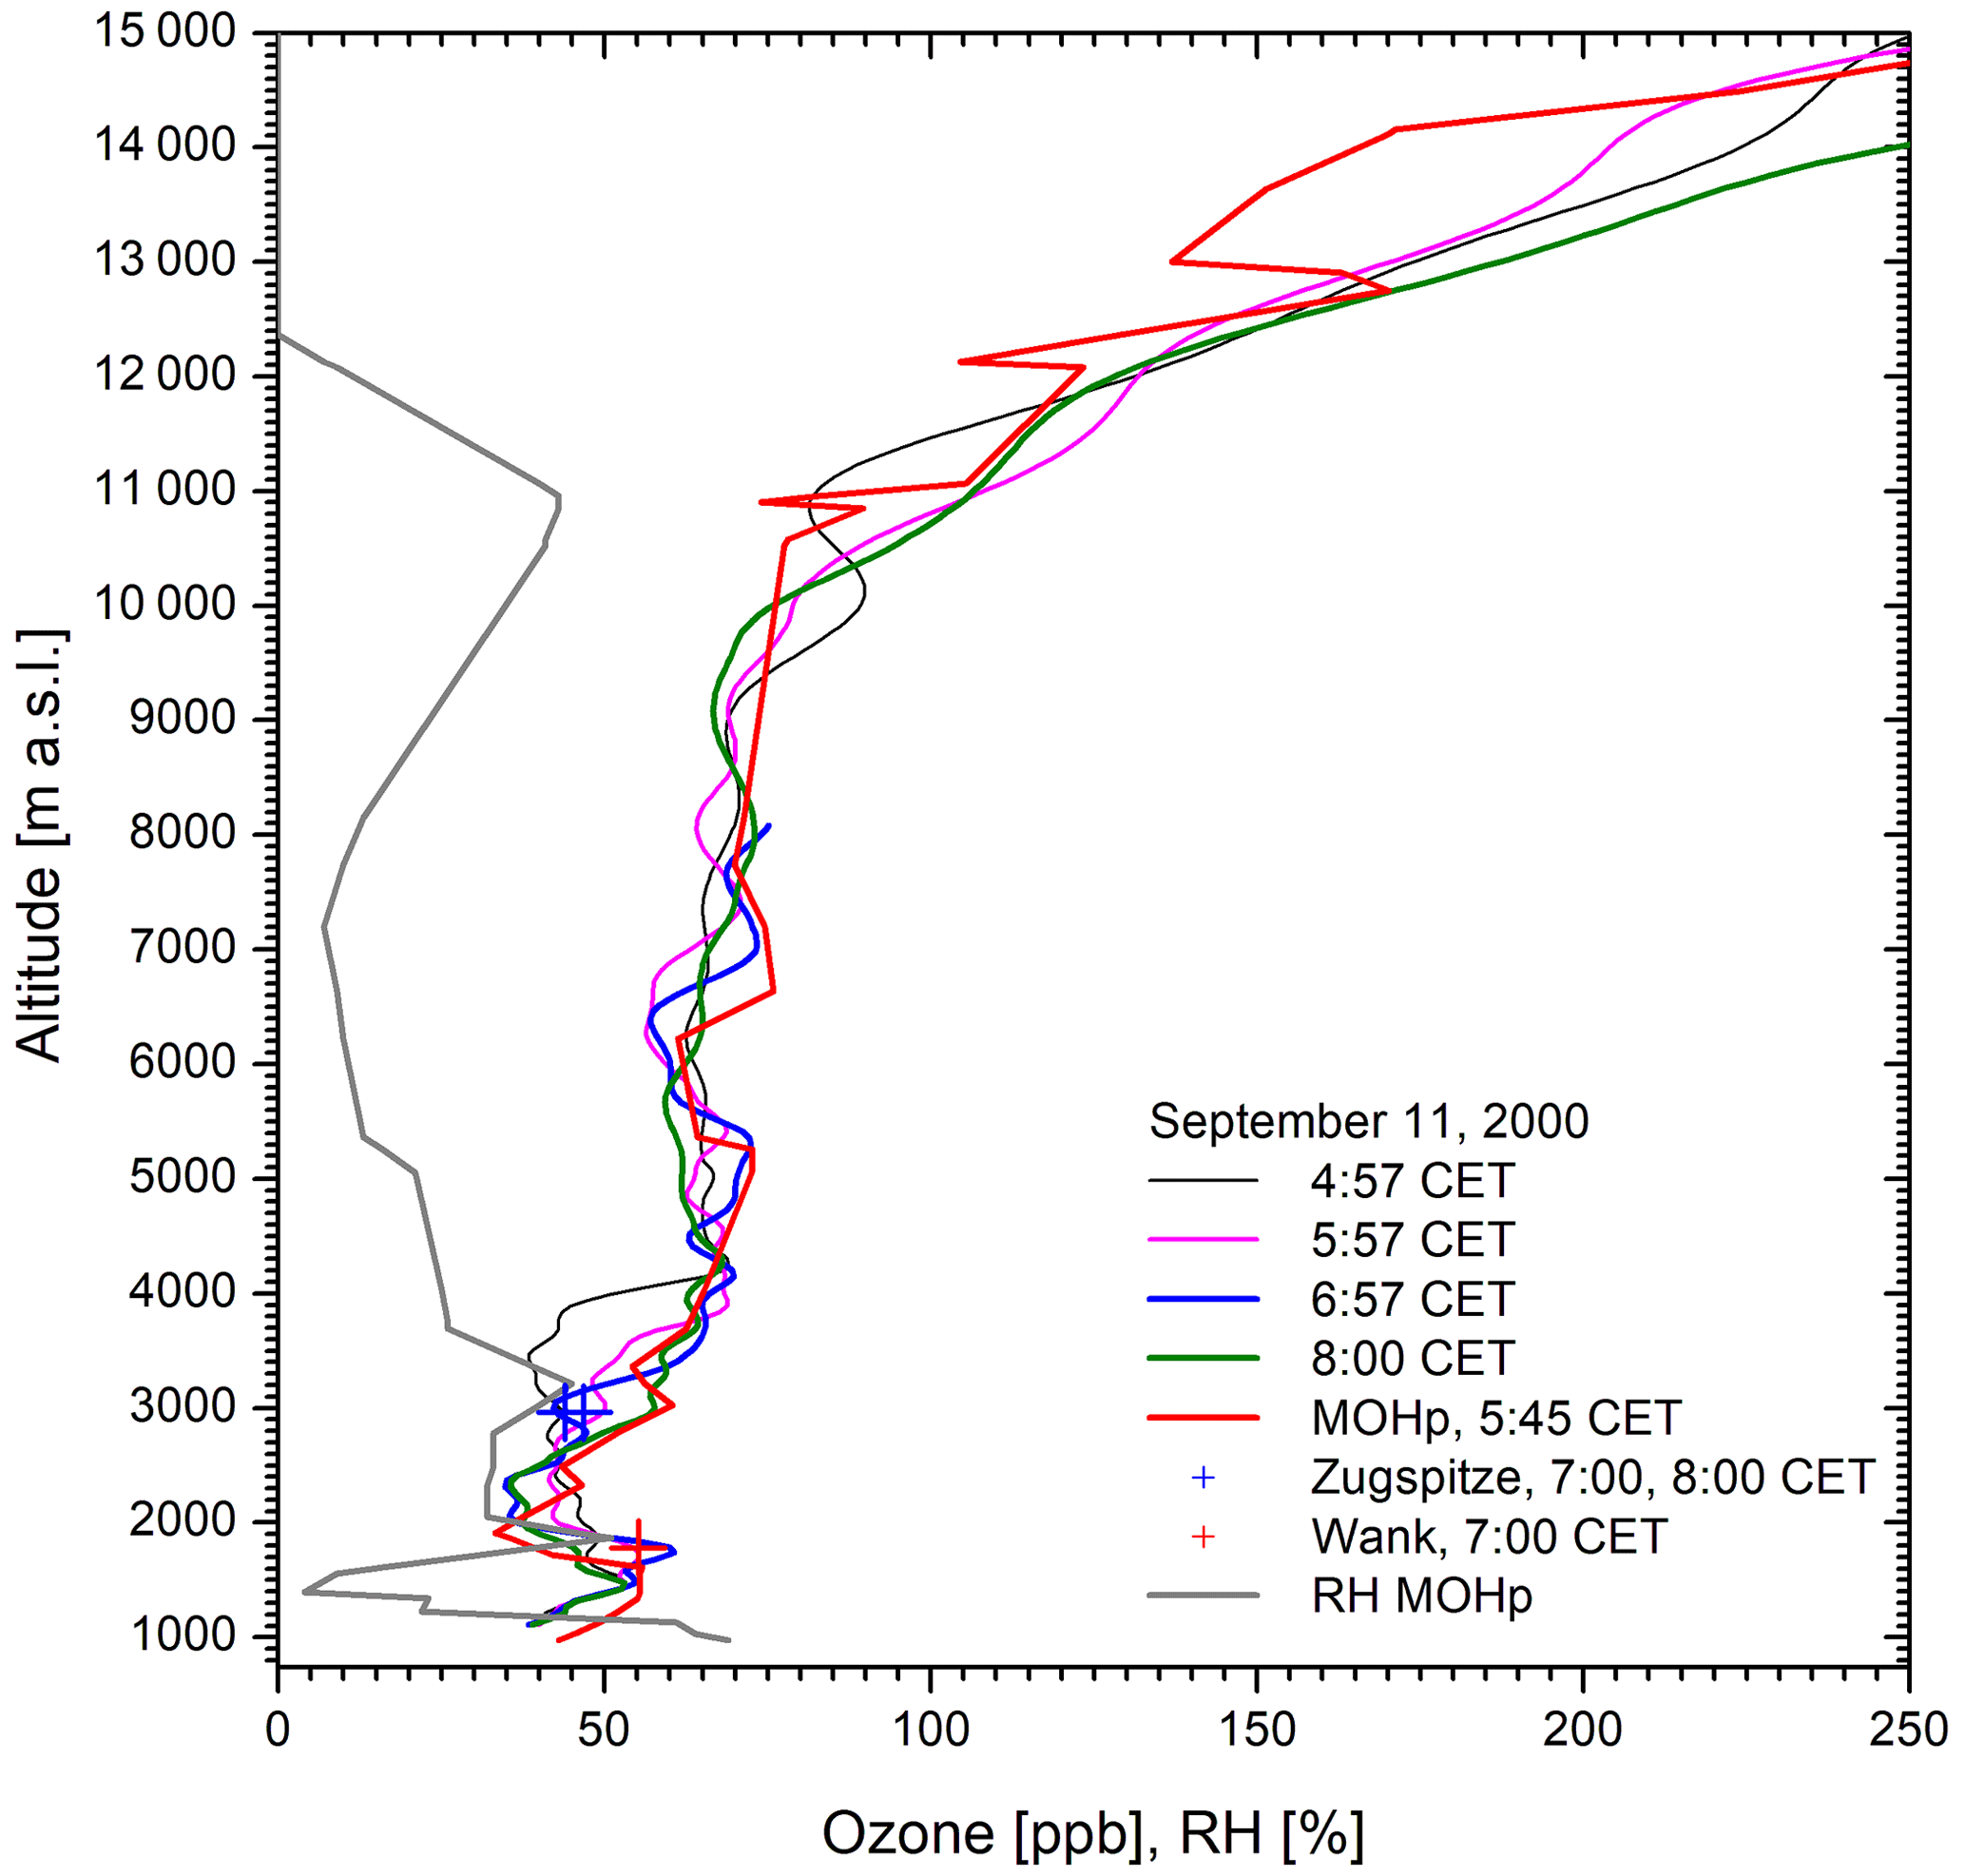
Figure 16Ozone measurements on 11 September 2000 (see Fig. 13 of Trickl et al., 2003); in this case no offset was determined.
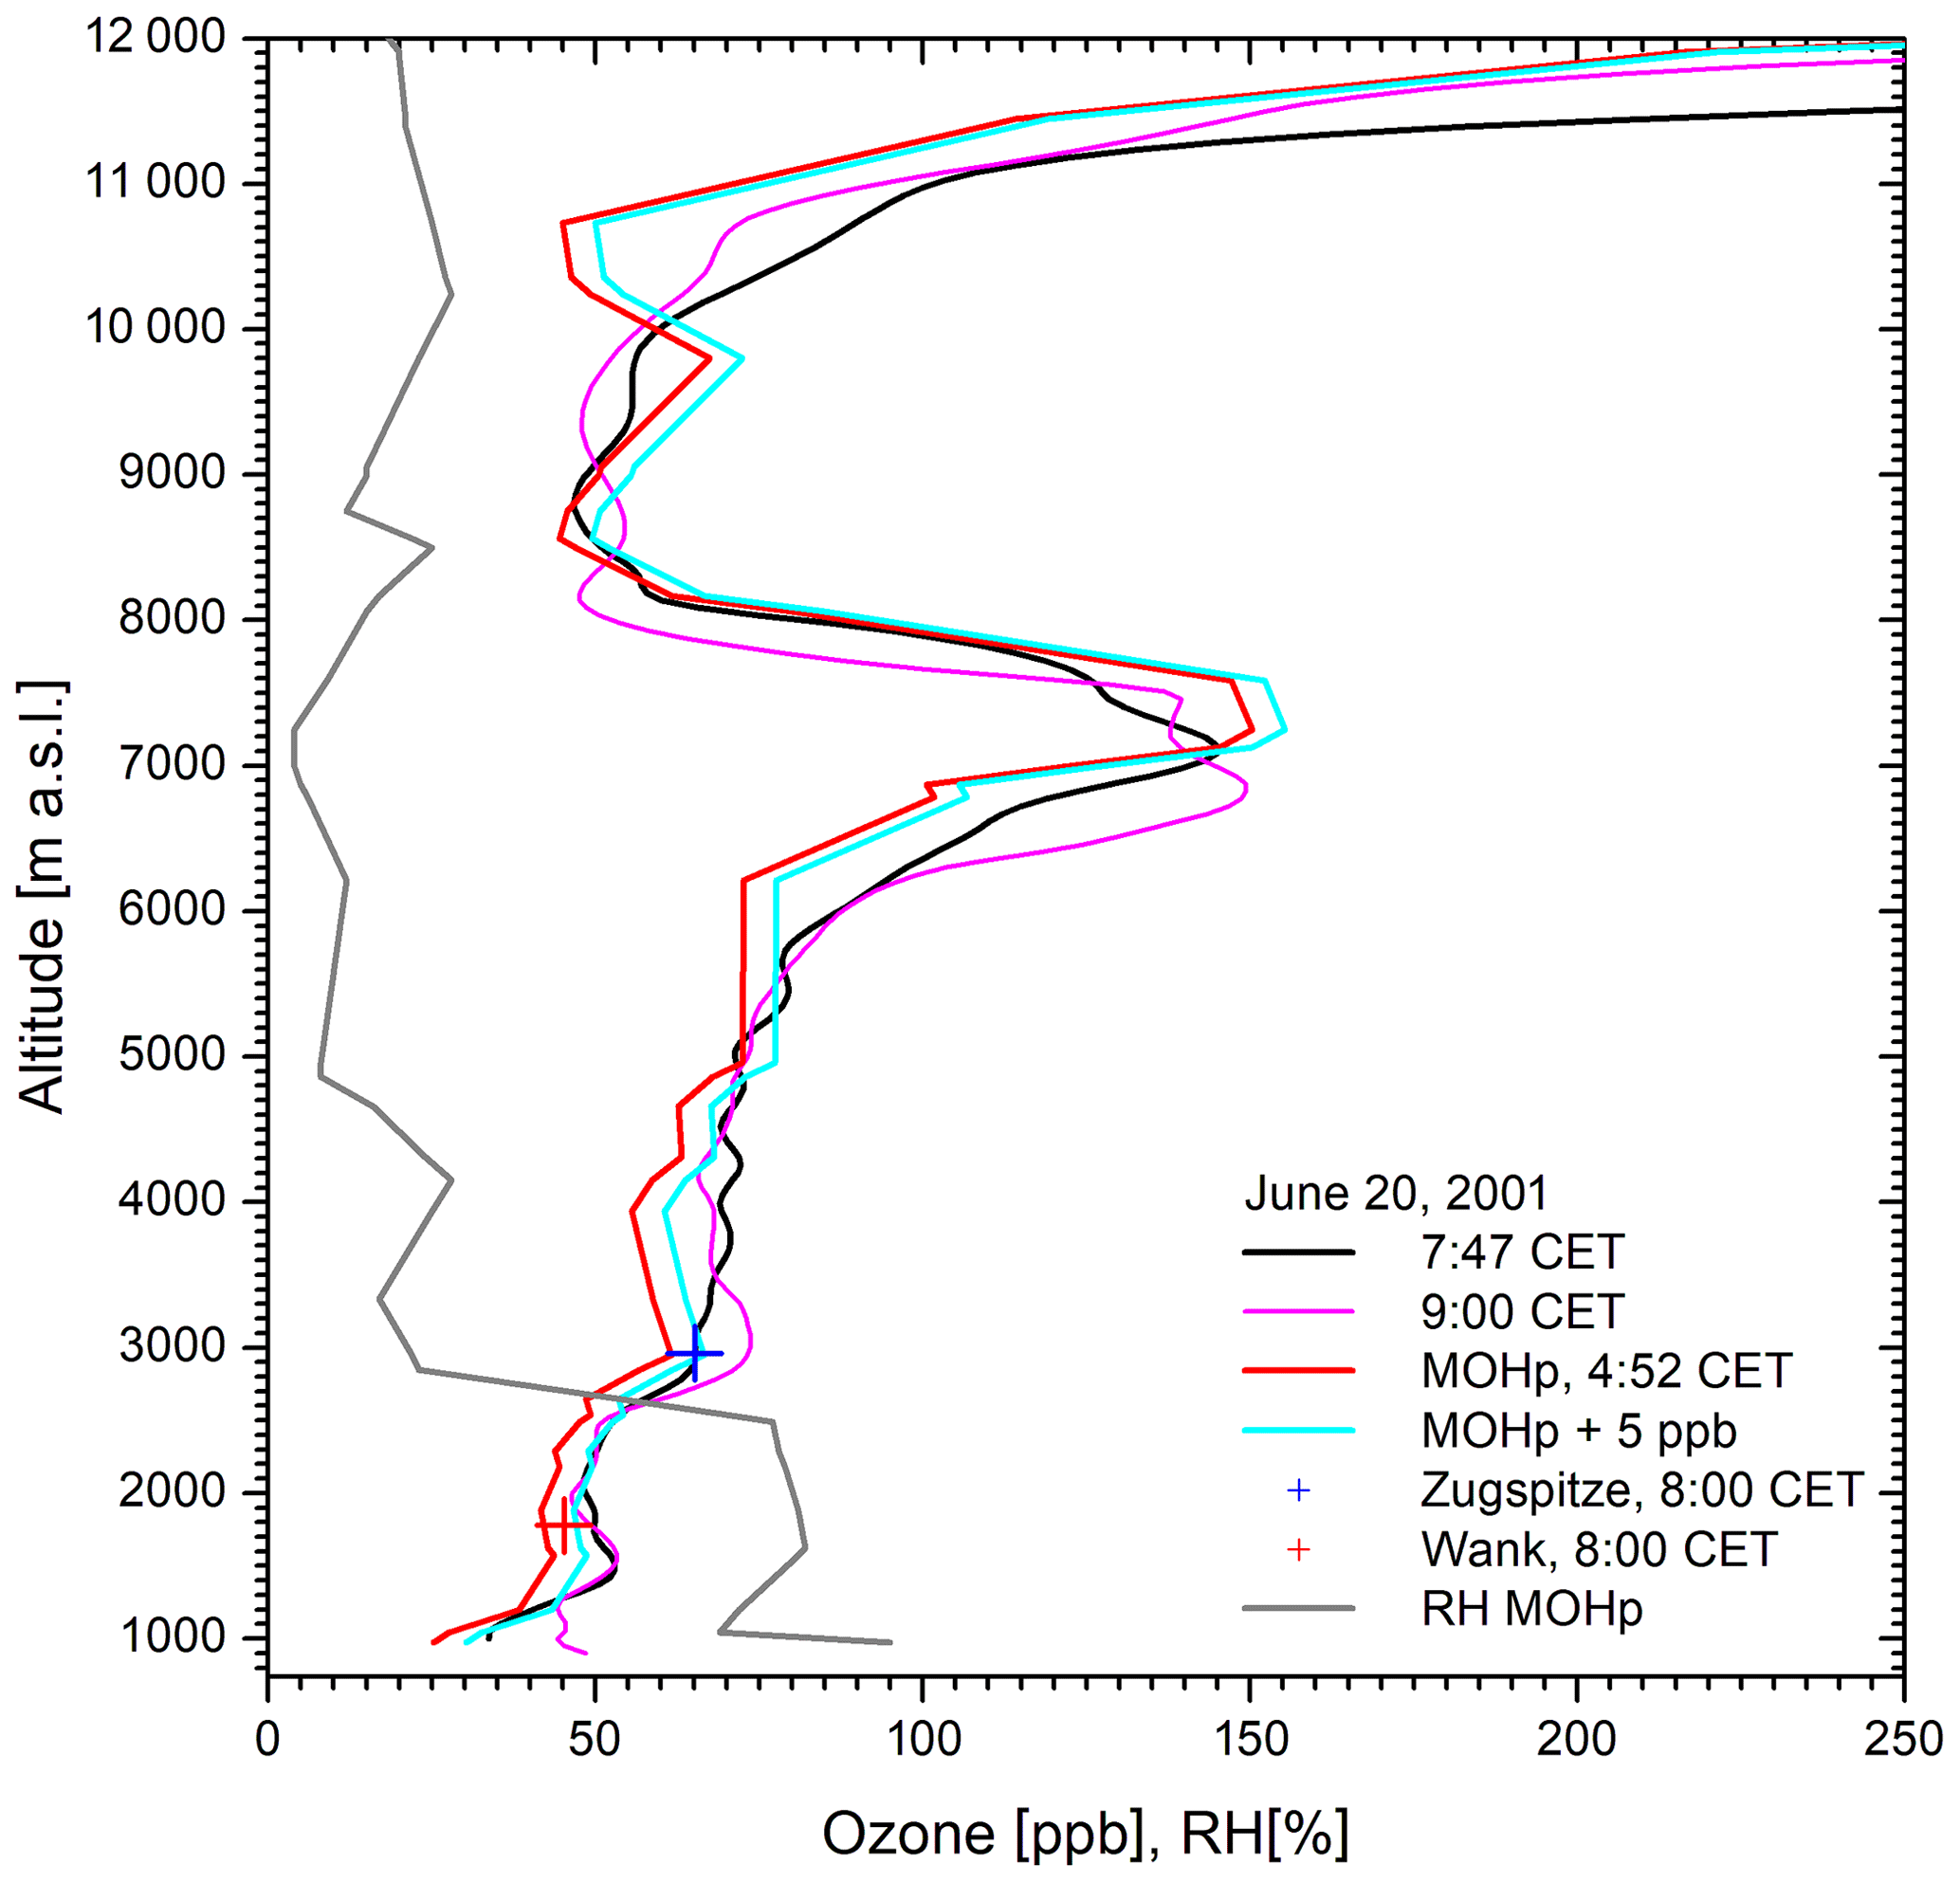
Figure 17Ozone measurements on 20 June, 2001; the entire temporal development of the stratospheric air intrusion around 7.3 km is depicted in Fig. 6 of Zanis et al. (2003), and Fig. 3 of Trickl et al. (2010).
For several weeks a strange ozone rise towards the ground was observed in the lidar data below 1.5 km. This effect disappeared after realigning the near-field telescope and the normal early-morning ozone drop returned.
However, the offsets of the MOHp mixing ratios necessary to achieve good agreement are, again, quite substantial (Fig. 18). Owing to the larger system noise during that period the differences between lidar and the stations are also higher than those in the preceding sections, and comparable with those of the mentioned 4 d comparison for May 1999 (Trickl et al., 2020a). The statistical analysis yields the following average differences and standard deviations:
| IFU DIAL – Zugspitze | 1.22 ± 1.81 ppb |
| IFU DIAL – Wank | −0.15 ± 2.26 ppb |
| MOHp – IFU DIAL | −5.88 ± 3.35 ppb |
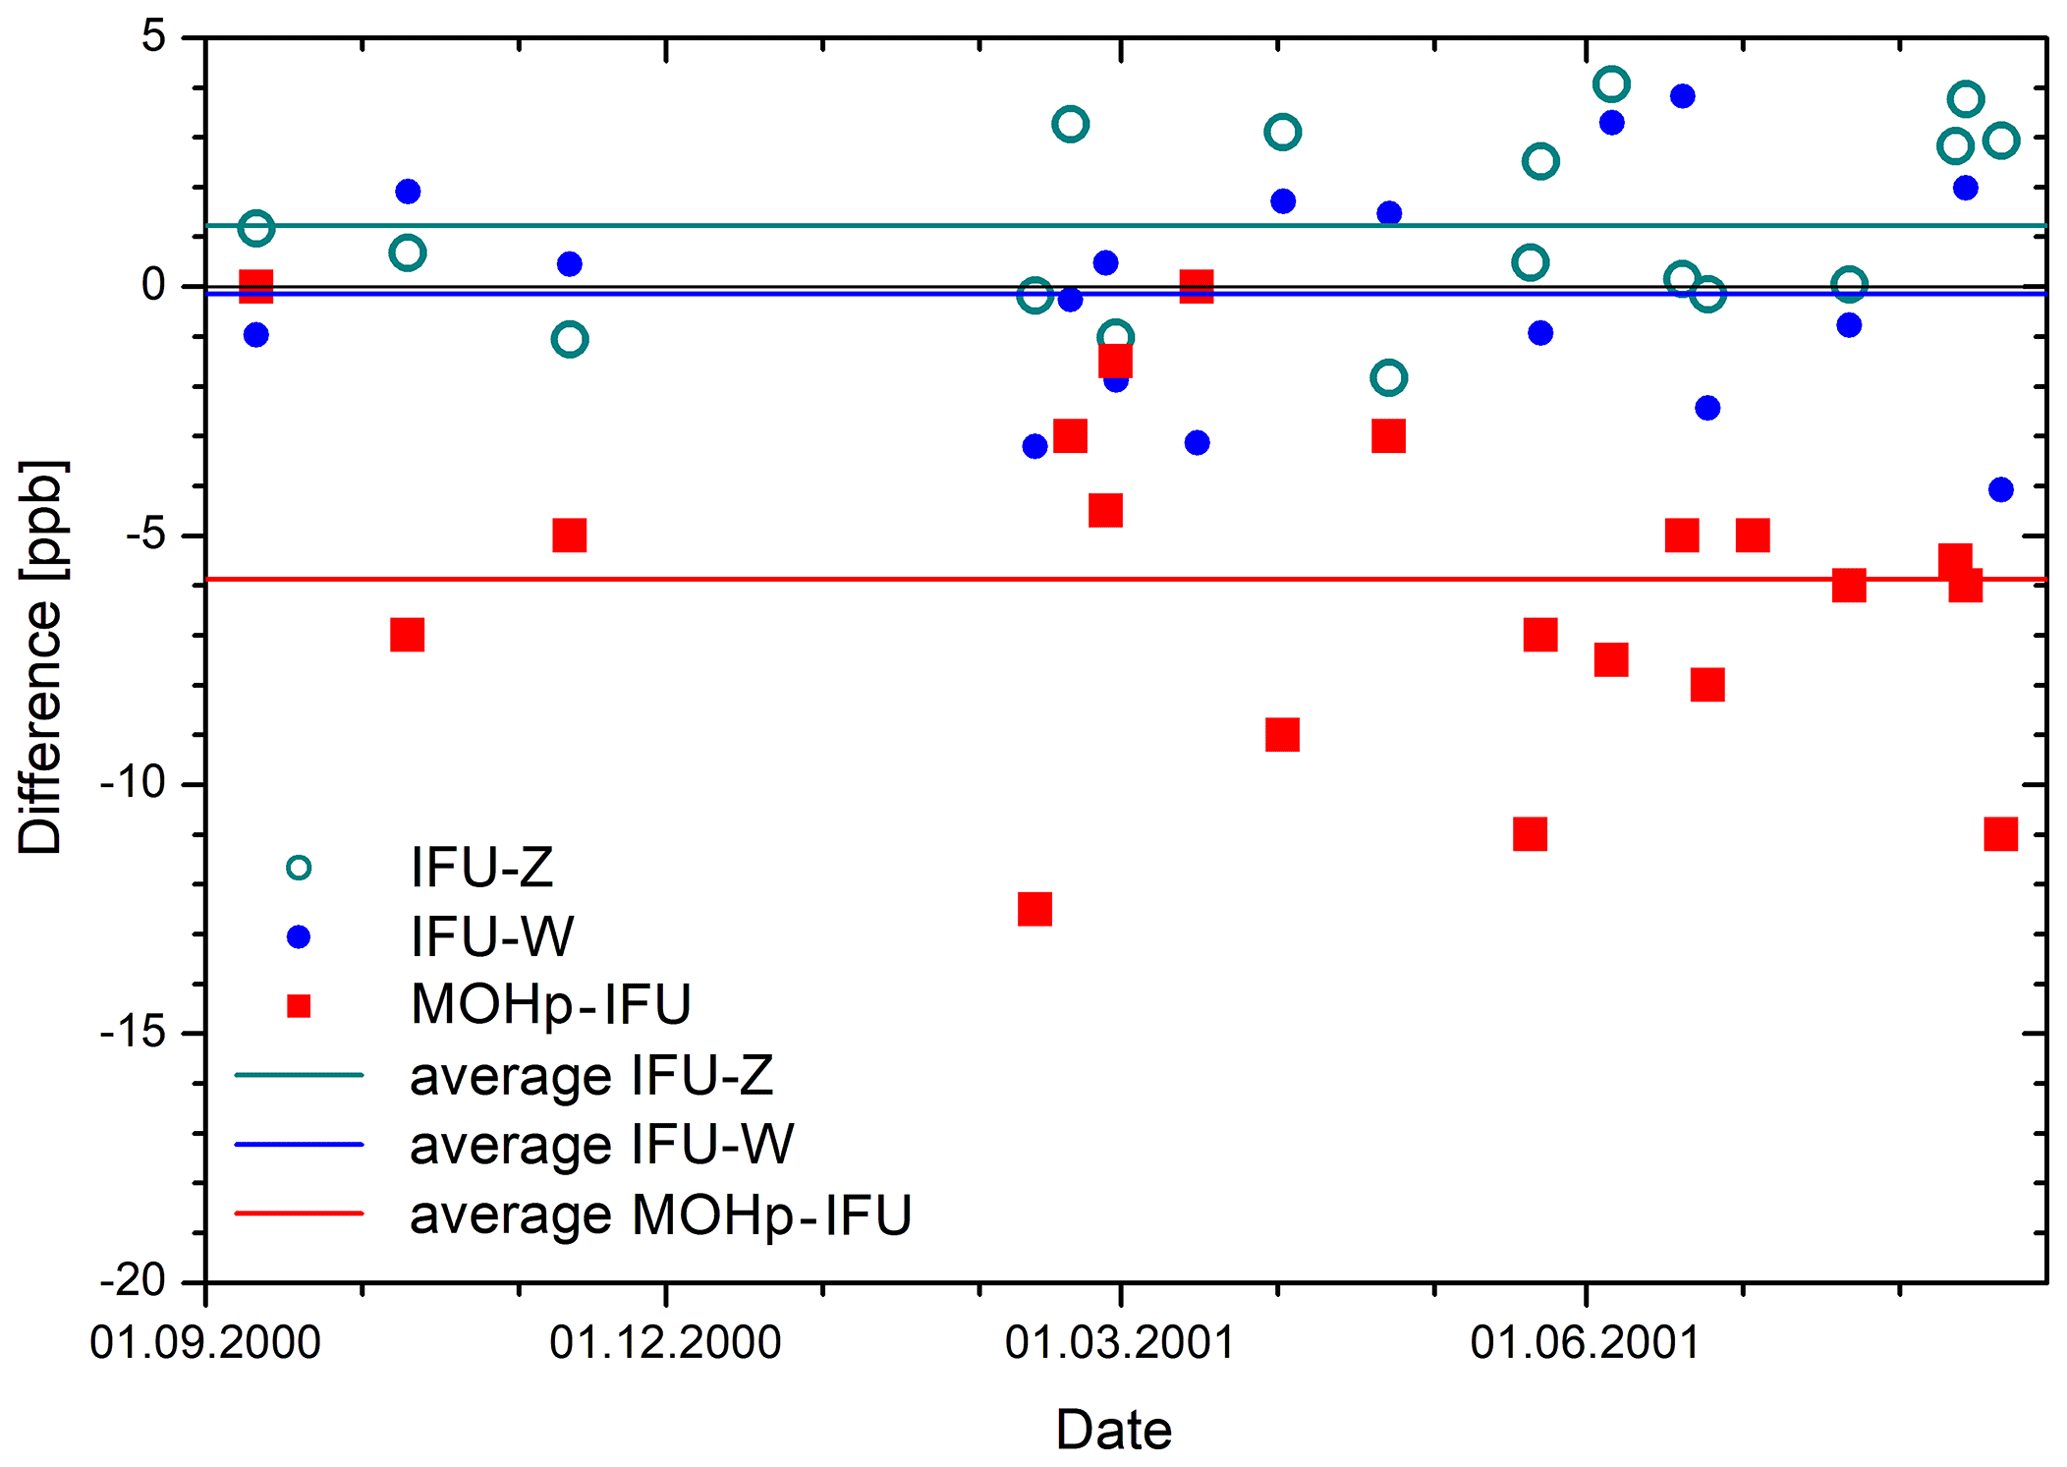
Figure 18Differences between the ozone mixing ratios of the lidar (IFU) and the stations Zugspitze (Z), Wank (W) at the summit altitudes, and between lidar and MOHp sonde, determined by shifting the sonde profile, for the period September 2000 to August 2001.
For some time tropospheric differential-absorption ozone lidar systems had a bad reputation: The method is highly sensitive to imperfections in the signal acquisition as the ozone number density is obtained by differentiating the backscatter signals (Trickl et al., 2020a). In addition, a lidar covering the entire troposphere and the lowermost stratosphere features a dynamic range of the backscatter signal of about eight decades, which means an extreme challenge for the detection electronics.
Based on continual improvements, starting with the 1994 system upgrading, the IFU ozone DIAL gradually approached a high performance until 2012, but minor potential for improvements remains. Comparison with the nearby mountain stations quite early demonstrated an uncertainty level of ±3 ppb in the lower troposphere. Occasional comparisons with ozone sondes launched at the Hohenpeißenberg (1996 to 2001, distance 38 km) were rather satisfactory up to the tropopause region.
Here, we analyse the lidar performance in three periods during its technical development in a more comprehensive manner. The best agreement was found for the side-by-side comparison with balloon ascents of ECC ozone sondes performed by the FZJ team at IMK-IFU in February 2019. Just small, altitude-independent offsets had to be subtracted from the sonde data to achieve agreement. The lidar itself agreed with the three local summit stations. For all 3 years and all stations we determined a positive bias of the lidar of just 0.6 ± 0.6 ppb (standard deviation). This value seems to reflect the −1.8 % calibration deficit of the WMO calibration of the in situ ozone data. Thus, the lidar could be even free of bias in the lower free troposphere, reflecting the high quality of the calibration source (Sect. 2.4).
For the more distant MOHp sonde the comparisons are more complex because of the high atmospheric variability (Vogelmann et al., 2011, 2015). This variability is particularly severe in summer when the atmospheric layering is more pronounced. Nevertheless, there was enough agreement in certain altitude ranges to examine the reliability of the ozone profiles obtained from the DIAL, also before the final modifications in 2012. Between 2007 and 2011 we suspect an occasional slight negative summertime bias of the lidar of the order of 5 ppb above 6 km. This could be due to interfering structures on the 292 nm analogue signal (requiring mathematical correction) that could not be compensated for by photon counting (available until 2003) and the removal of daylight-induced signal distortions at 313 nm (Trickl et al., 2020a). In principle, this calls for a re-evaluation of the ozone profiles for the wavelength pair 292–313 nm over the period 2007 to 2011, based on more recent experience in the signal inversion and the performance of the electronic equipment.
Vice versa, the lidar measurements helped us to validate the quality of the sonde measurements. Quite good agreement could be achieved by applying an altitude-independent offset correction to the ozone values that strongly varies from sonde to sonde. Most of the ozone differences between the two sites are limited to altitudes below 2 km. Thus, the differences between Zugspitze and MOHp (at 3 km), reported earlier by Scheel (see Introduction), are not caused by systematic differences in air composition at both sites. As can be seen from the figures presented in this paper the shifted ozone mixing ratios for the sonde and the Zugspitze ozone mostly agree to within ±3 ppb. Given the frequently substantially higher ozone offsets of the MOHp sondes, a recalibration of the archived sonde data based on comparisons with the Zugspitze or UFS in situ data is advisable, despite the considerable distance between the sites. Such a recalibration should be avoided in the presence of pronounced ozone structure around the station altitudes that could result in elevated uncertainties.
The comparisons for the 3 years 2000–2001, 2009, and 2018 reveal just minor performance change of the MOHp sonde over the years, with a variation of the annual average offset by about ±2 ppb. We found a negative average offset of −3.64 ± 3.72 ppb (standard deviation) with respect to the IFU ozone DIAL over all 3 years. It is reasonable to assume that this offset is applicable to the entire tropospheric time series of the MOHp sondes. This performance is within the uncertainty range of the literature cited in the Introduction.
Remaining tasks for the lidar are a substantial reduction of the solar background at 313.2 nm in summer and enhancement of the moderate 291.8 nm backscatter signal in the upper troposphere. Further reduction of the residual solar background is difficult as the spectral filtering is already quite narrow. However, replacement of the rather aged (and partly contaminated) primary mirror of the far-field receiver could help by reducing the background radiation reflected into the detection system. As mentioned, longer averaging is advisable. By longer averaging, the performance under low-aerosol conditions could almost reach that of in situ measurements in a major part of the troposphere. Single-photon counting can also be helpful for longer averaging times, as demonstrated for our Raman lidar (Klanner et al., 2021). The noise level for counting is still lower than that of the meanwhile outstanding transient digitizers (Trickl et al., 2020a).
Lidar data and information on the lidar systems can be obtained on request from the IMK-IFU authors of this paper (thomas@trickl.de, hannes.vogelmann@kit.edu). The 313 nm aerosol backscatter coefficients are archived in the EARLINET database, accessible through EARLINET data base (https://www.earlinet.org/index.php?id=125, EARLINET, 2023). The Hohenpeißenberg ozone and humidity data are stored in the NDACC data archive (https://www-air.larc.nasa.gov/missions/ndacc/data.html, NDACC, 2023). The data of the FIRMOS campaign is available via the ESA campaign dataset website https://doi.org/10.5270/ESA-38034ee (ESA, 2020). The hourly Zugspitze and UFS ozone data are available at the World Data Center for Reactive Gases (https://gaw.kishou.go.jp/search, WDCRG, 2018) and the TOAR data base (https://toar-data.org/surface-data/) (Schultz et al., 2017).
TT carried out most lidar measurements after spring 1997. He led the technical development of two ozone DIAL systems since 1990. HV was involved in the system upgrading since 2007 and was responsible for the lidar operation during FIRMOS. DK and CR launched several ECC sondes at IMK-IFU in February 2019. MA and WS carried out the MOHp ozone sonde measurements. LR performed ozone in situ measurements at UFS. MS provided LAGRANTO backward trajectories.
The contact authors have declared that none of the authors has any competing interests.
Publisher’s note: Copernicus Publications remains neutral with regard to jurisdictional claims made in the text, published maps, institutional affiliations, or any other geographical representation in this paper. While Copernicus Publications makes every effort to include appropriate place names, the final responsibility lies with the authors.
The authors thank Wolfgang Seiler and Hans Peter Schmid for their support over so many years. The late Hans-Eckhart Scheel provided reference ozone data for the Wank and Zugspitze mountain stations in the vicinity of IMK-IFU. The lidar measurements also contributed to the projects Vertical Ozone Transport 1 and 2 (e.g. Wotava and Kromp-Kolb, 2000; VOTALP II, 2000) and STACCATO (Stohl et al., 2003) and ATMOFAST (2005).
The different steps of lidar development have been funded by the German Ministry of Research and Technology (BMFT) in numerous projects, the German Foundation for the Environment (DBU, two projects), and the Bavarian Ministry of Economics. Since 2007 the 313 nm aerosol results have contributed to EARLINET (European Aerosol Research Lidar Network), which is currently a part of the European Research Infrastructure ACTRIS (Aerosol, Clouds and Trace Gases Research Infrastructure). The lidar measurements were also funded by the European Union within Vertical Ozone Transport 1 and 2 and STACCATO and by the German Ministry for Research and Education (BMBF) within ATMOFAST. KIT is supported by the European Space Agency (ESA) under Contract 4000123691/18/NL/NF (FIRMOS validation campaign). Balloon profiles utilized in this paper have been provided within the same ESA project by the Forschungszentrum Jülich via subcontract with KIT. The balloon activities were also partly supported by the Helmholtz Association within the framework of MOSES (Modular Observation Solutions for Earth Systems).
The article processing charges for this open-access publication were covered by the Karlsruhe Institute of Technology (KIT).
This paper was edited by Sandip Dhomse and reviewed by four anonymous referees.
Ancellet, G., Pelon, J., Beekmann, M., Papayannis, A., and Mégie, G.: Ground-Based Lidar Studies of Ozone Exchanges Between the Stratosphere and the Troposphere, J. Geophys. Res., 96, 22401–22421, 1991.
Ancellet, G., Godin-Beekmann, S., Smit, H. G. J., Stauffer, R. M., Van Malderen, R., Bodichon, R., and Pazmiño, A.: Homogenization of the Observatoire de Haute Provence electrochemical concentration cell (ECC) ozonesonde data record: comparison with lidar and satellite observations, Atmos. Meas. Tech., 15, 3105–3120, https://doi.org/10.5194/amt-15-3105-2022, 2022.
ATMOFAST: Atmosphärischer Ferntransport und seine Auswirkungen auf die Spurengaskonzentrationen in der freien Troposphäre über Mitteleuropa (Atmospheric Long-range Transport and its Impact on the Trace-gas Composition of the Free Troposphere over Central Europe), Project Final Report, co-ordinator: Trickl, T., subproject co-ordinators: Kerschgens, M., Stohl, A., and Trickl, T., funded by: the German Ministry of Education and Research within the programme “Atmosphärenforschung 2000”, 130 pp., http://www.trickl.de/ATMOFAST.htm (last access: 2 November 2023), 2005 (in German, with revised publication list of 2012).
Attmannspacher, W. and Dütsch, H.: 2nd International Ozone Sonde Intercomparison at the Observatory of Hohenpeissenberg, Berichte des Deutschen Wetterdienstes 157, Deutscher Wetterdienst, ISBN 978-3-88148-192-2, http://nbn-resolving.de/urn:nbn:de:101:1-201601273960 (last access: 29 October 2023), 1981.
Beekmann, M., Ancellet, G., Mégie, G., Snit, H. G. J., and Kley, D.: Intercomparison Campaign of Vertical Ozone Profiles Including Electrochemical Sondes of ECC and Brewer-Mast Type and a Ground Based UV-Differential Absorption Lidar, J. Atmos. Chem., 19, 259–288, 1994.
Belotti, C., Barbara, F., Barucci, M., Bianchini, G., D'Amato, F., Del Bianco, S., Di Natale, G., Gai, M., Montori, A., Pratesi, F., Rettinger, M., Rolf, C., Sussmann, R., Trickl, T., Viciani, S., Vogelmann, H., and Palchetti, L.: The Far-Infrared Radiation Mobile Observation System (FIRMOS) for spectral characterization of the atmospheric emission, Atmos. Meas. Tech., 16, 2511–2529, https://doi.org/10.5194/amt-16-2511-2023, 2023.
Brabec, M.: Backscatter and Humidity Measurements in Cirrus and Dust Clouds using Balloon Sondes, PhD thesis, Eidgenössische Technische Hochschule, Zürich, Switzerland, PhD thesis ETH No. 19825, 96 pp., https://www.research-collection.ethz.ch/bitstream/handle/20.500.11850/43811/eth-5071-02.pdf (last access: 29 October 2023), 2011.
Brewer, A. W. and Milford, J. R.: The Oxford-Kew ozone sonde, Proc. R. Soc. Lond. A, 256, 470–495, https://doi.org/10.1098/rspa.1960.0120, 1960.
Browell, E. V., Danielsen, E. F., Ismail, S., Gregory, G. L., and Beck, S. M.: Tropopause Fold Structure Determined From Airborne Lidar and in Situ Measurements, J. Geophys. Res., 92, 2112–2120, 1987.
Carnuth, W. and Trickl, T.: Transport studies with the IFU three-wavelength aerosol lidar during the VOTALP Mesolcina experiment, Atmos. Environ., 34, 1425–1434, 2000.
Carnuth, W., Kempfer, U., and Trickl, T.: Highlights of the tropospheric lidar studies at IFU within the TOR project, Tellus B, 54, 163–185, 2002.
Claude, H., Hartmannsgruber, R., and Köhler, U.: Measurement of atmospheric profiles using the Brewer-Mast sonde, World Meteorological Organization, Global Ozone Res. and Monit. Proj. Report No. 17, WMO/TD No. 179, Geneva, Switzerland, 51 pp., https://library.wmo.int/index.php?lvl=notice_display&id=11215 (last access: 29 October 2023), 1987.
Daumont, D., Brion, J., Charbonnier, J., and Malicet, J.: Ozone UV Spectroscopy I: Absorption Cross-Sections at Room Temperature, J. Atmos. Chem., 15, 145–155, 1992.
Davies, W. E., Vaughan, G., and O'Connor, F. M.: Observation of near-zero ozone concentrations in the upper troposphere at mid-latitudes, Geophys. Res. Lett., 25, 1173–1176, 1998.
De Backer, H., De Muer, D., and De Sadelaer G.: Comparison of ozone profiles obtained with Brewer-Mast and Z-ECC sensors during simultaneous ascents, J. Geophys. Res., 103, 19641–19648, https://doi.org/10.1029/98JD01711, 1998.
De Muer, D. and Malcorps, H.: The frequency response of an electrochemical ozone sonde and its application to the deconvolution of ozone profiles, J. Geophys. Res., 89, 1361–1372, 1984.
Deshler, T., Stübi, R., Schmidlin, F. J., Mercer, J. L., Smit, H. G. J., Johnson, B. J., Kivi, R., and Nardi, B.: Methods to homogenize electrochemical concentration cell (ECC) ozonesonde measurements across changes in sensing solution concentration or ozonesonde manufacturer, Atmos. Meas. Tech., 10, 2021–2043, https://doi.org/10.5194/amt-10-2021-2017, 2017.
Di Natale, G., Barucci, M., Belotti, C., Bianchini, G., D'Amato, F., Del Bianco, S., Gai, M., Montori, A., Sussmann, R., Viciani, S., Vogelmann, H., and Palchetti, L.: Comparison of mid-latitude single- and mixed-phase cloud optical depth from co-located infrared spectrometer and backscatter lidar measurements, Atmos. Meas. Tech., 14, 6749–6758, https://doi.org/10.5194/amt-14-6749-2021, 2021.
Dirksen, R. J., Sommer, M., Immler, F. J., Hurst, D. F., Kivi, R., and Vömel, H.: Reference quality upper-air measurements: GRUAN data processing for the Vaisala RS92 radiosonde, Atmos. Meas. Tech., 7, 4463–4490, https://doi.org/10.5194/amt-7-4463-2014, 2014.
Draxler, R. and Hess, G.: An overview of the HYSPLIT_4 modelling system for trajectories, dispersion, and deposition, Aust. Meteorol. Mag., 47, 295–308, 1998.
EARLINET: EARLINET Database, EARLINET [data set], https://www.earlinet.org/index.php?id=125 (last access: 2 November 2023), 2023.
Eisele, H. and Trickl, T.: Improvements of the aerosol algorithm in ozone-lidar data processing by use of evolutionary strategies, Appl. Opt., 44, 2638–2651, 2005.
Eisele, H., Trickl, T., and Claude, H.: Lidar als wichtige Ergänzung zur Messung troposphärischen Ozons, Ozonbulletin des Deutsches Wetterdiensts, 44, 2 pp., https://www.dwd.de/DE/forschung/atmosphaerenbeob/zusammensetzung_atmosphaere/hohenpeissenberg/inh_nav/ozon_bulletins_neu.htm (last access: 29 October 2023), 1997 (in German).
Eisele, H., Scheel, H. E., Sladkovic, R., and Trickl, T.: High-Resolution Lidar Measurements of Stratosphere-Troposphere Exchange, J. Atmos. Sci., 56, 319–330, 1999.
ESA: FIRMOS, Overview, earth online, ESA [data set], https://doi.org/10.5270/ESA-38034ee, 2020.
EUROTRAC: Transport and Chemical Transformation of Pollutants in the Troposphere, Vol. 1, An Overview of the Work of EUROTRAC, edited by: Borrell, P. and Borrell, P. M., Springer, Berlin, Heidelberg, New York, 474 pp., ISBN 3-540-66775-X, 1997.
Gaudel, A., Ancellet G., and Godin-Beekmann S.: Analysis of 20 years of tropospheric ozone vertical profiles by lidar and ECC at Observatoire de Haute Provence (OHP) at 44∘ N, 6.7∘ E, Atmos. Environ., 113, 78–89, 2015.
Gaudel, A., Cooper, O. R., Ancellet, G., Barret, B., Boynard, A., Burrows, J. P., Clerbaux, J. P., Coheur, P.-F., Cuesta, J., Cuevas, E., Doniki, S., Dufour, G., Ebojie, F., Foret, G., Garcia, O., Granados-Muñoz, M. J., Hannigan, J., Hase, F., Hassler, B., Huang, G., Hurtmans, D., Jaffe, D., Jones, N., Kalabokas, P., Kerridge, B., Kulawik, S., Latter, B., Leblanc, T., Le Flochmoën, E., Lin, W., Liu, J., Liu, X., Mahieu, E., McClure-Begley, A., Neu, J., Osman, M., Palm, M., Petetin, H., Petropavlovskikh, I., Querel, R., Rahpoe, N., Rozanov, A., Schultz, M. G., Schwab, J., Siddans, R., Smale, D., Steinbacher, M., Tanimoto, H., Tarasick, D., Thouret, V., Thompson, A., M., Trickl, T., Weatherhead, E., Wespes, C., Worden, H., Vigouroux, C., Xu, X., Zeng, G., and Ziemke, J.: Tropospheric Ozone Assessment Report: Present-day distribution and trends of tropospheric ozone relevant to climate and global atmospheric chemistry model evaluation, Elem. Sci. Anth., 6, 39, https://doi.org/10.1525/elementa.291, 2018.
Grant, W. B., Browell, E. V., Butler, C. F., Fenn, M. A., Clayton, M. B., Hannan, J. R., Fuelberg, H. E., Blake, D. R., Blake, N. J., Gregory, G. L., Heikes, B. G., Sachse, G. W., Singh, H. B., Snow, J., and Talbot, R. W.: A case study of transport of tropical marine boundary layer and lower tropospheric air masses to the northern midlatitude upper troposphere, J. Geophys. Res., 105, 3757–3769, 2000.
Hearn, A. G.: The Absorption of Ozone in the Ultra-violet and Visible Regions of the Spectrum, Proc. Phys. Soc., 78, 932–940, 1961.
Hersbach, H., Bell, B., Berrisford, P., Simmons, A., Berrisford, P., Dahlgren, P., Horanyi, A., Munoz-Sabater, J., Nicolas, J., Radu, R., Schepers, D., Soci, C., Villaume, S., Bidlot, J. R., Haimberger, L., Woollen, J., Buontempo, C., and Thepaut, J. N.: The ERA5 global reanalysis, Q. J. Roy. Meteor. Soc., 146, 1999–2049, https://doi.org/10.1002/qj.3803, 2020.
Jeannet, P., Stübi, R., Levrat, G., Viatte, P., and Staehelin, J.: Ozone balloon soundings at Payerne (Switzerland): Reevaluation of the time series 1967–2002 and trend analysis, J. Geophys. Res., 112, D11302, https://doi.org/10.1029/2005JD006862, 2007.
Kempfer, U., Carnuth, W., Lotz, R., and Trickl, T.: A wide range ultraviolet lidar system for tropospheric ozone measurements: development and application, Rev. Sci. Instrum., 65, 3145–3164, 1994.
Kerr, J. B., Fast, H., McElroy, C. T., Oltmans, S. J., Lathrop, J. A., Kyro, E., Paukkunen, A., Claude, H., Köhler, U., Sreedharan, C. R., Akao, T., and Tsukagoshi, Y.: The 1991 WMO International Ozonesonde Intercomparison at Vanskoy, Can. Atmos.–Ocean, 32, 685–716, https://doi.org/10.1080/07055900.1994.9649518, 1994.
Klanner, L., Höveler, K., Khordakova, D., Perfahl, M., Rolf, C., Trickl, T., and Vogelmann, H.: A powerful lidar system capable of 1 h measurements of water vapour in the troposphere and the lower stratosphere as well as the temperature in the upper stratosphere and mesosphere, Atmos. Meas. Tech., 14, 531–555, https://doi.org/10.5194/amt-14-531-2021, 2021.
Klausen, J., Zellweger, C., Buchmann, B., and Hofer, P.: Uncertainty and bias of surface ozone measurements at selected Global Atmospheric Watch sites, J. Geophys. Res., 108, 4622, https://doi.org/10.1029/2003JD003710, 2003.
Kley, D., Crutzen, P. J., Smit, H. G. J., Vömel, H., Oltmans, S., Grassl, H., and Ramanathan, V.: Observations of Near-Zero Ozone Concentrations Over the Convective Pacific: Effects on Air Chemistry, Science, 274, 230–233, 1996.
Kley, D., Beck, J., Grennfelt, P. I., Hov, O., and Penkett, S. A.: Tropospheric Ozone Research (TOR) A Sub-Project of EUROTRAC, J. Atmos. Chem., 28, 1–9, 1997.
Komhyr, W. D.: Electrochemical concentration cells for gas analysis, Ann. Geoph., 25, 203–210, 1969.
Komhyr, W. D., Barnes, R. A., Brothers, G. B., Lathrop, J. A., and Opperman, D. P.: Electrochemical concentration cell ozonesonde performance evaluation during STOIC 1989, J. Geophys. Res., 100, 9231–9244, https://doi.org/10.1029/94JD02175, 1995.
Langford, A. O., Masters, C. D., Proffitt, M. H., Hsie, E.-Y., and Tuck, A. F.: Ozone measurements in a tropopause fold associated with a cut-off low system, Geophys. Res. Lett., 23, 2501–2504, 1996.
Logan, J. A., Staehelin, J., Megretskaia, I. A., Cammas, J.-P., Thouret, V., Claude, H., De Backer, H., Steinbacher, M., Scheel, H.-E., Stübi, R., Fröhlich, M., and Derwent, R.: Changes in ozone over Europe: Analysis of ozone measurements from sondes, regular aircraft (MOZAIC) and alpine surface sites, J. Geophys. Res., 117, D09301, https://doi.org/10.1029/2011JD016952, 2012.
Malicet, J., Daumont, D., Charbonnier, J., Parisse, C., Chakir, A., and Brion, J.: Ozone UV Spectroscopy I: Absorption Cross-Sections and Temperature Dependence, J. Atmos. Chem., 21, 263–273, 1995.
NDACC: Network for the Detection of Atmospheric Composition Change, NDACC Public Data Access, NASA [data set], https://www-air.larc.nasa.gov/missions/ndacc/data.html (last access: 2 November 2023), 2023.
Palchetti, L., Barucci, M., Belotti, C., Bianchini, G., Cluzet, B., D'Amato, F., Del Bianco, S., Di Natale, G., Gai, M., Khordakova, D., Montori, A., Oetjen, H., Rettinger, M., Rolf, C., Schuettemeyer, D., Sussmann, R., Viciani, S., Vogelmann, H., and Wienhold, F. G.: Observations of the downwelling far-infrared atmospheric emission at the Zugspitze observatory, Earth Syst. Sci. Data, 13, 4303–4312, https://doi.org/10.5194/essd-13-4303-2021, 2021.
Parrish, D. D., Derwent, R. G., Steinbrecht, W., Stübi, R., Van Malderen, R., Steinbacher, M., Trickl, T., Ries, L., and Xu, X.: Zonal Similarity of Long-term Changes and Seasonal Cycles of Baseline Ozone at Northern Mid-latitudes, J. Geophys. Res., 125, e2019JD031908, https://doi.org/10.1029/2019JD031908, 2020.
Reichardt, J., Ansmann, A., Serwazi, M., Weitkamp, C., and Michaelis, W.: Unexpectedly low ozone concentration in midlatitude tropospheric ice clouds: A case study, Geophys. Res. Lett., 23, 1929–1932, 1996.
Schultz, M. G., Schröder, S., Lyapina, O., Cooper, O., Galbally, I., Petropavlovskikh, I., von Schneidemesser, E., Tanimoto, H., Elshorbany, Y., Naja, M., Seguel, R. J., Dauert, U., Eckhardt, P., Feigenspan, S., Fiebig, M., Hjellbrekke, A.-G., Hong, Y.-D., Kjeld, P. C., Koide, H., Lear, G., Tarasick, D., Ueno, M., Wallasch, M., Baumgardner, D., Chuang, M.-T., Gillett, R., Lee, M., Molloy, S., Moolla, R., Wang, T., Sharps, K., Adame, J. A., Ancellet, G., Apadula, F., Artaxo, P., Barlasina, M. E., Bogucka, M., Bonasoni, P., Chang, L., Colomb, A., Cuevas-Agulló, E., Cupeiro, M., Degorska, A., Ding, A., Fröhlich, M., Frolova, M., Gadhavi, H., Gheusi, F., Gilge, S., Gonzalez, M. Y., Gros, V., Hamad, S. H., Helmig, D., Henriques, D., Hermansen, O., Holla, R., Hueber, J., Im, U., Jaffe, D. A., Komala, N., Kubistin, D., Lam, K.-S., Laurila, T., Lee, H., Levy, I., Mazzoleni, C., Mazzoleni, L. R., McClure-Begley, A., Mohamad, M., Murovec, M., Navarro-Comas, M., Nicodim, F., Parrish, D., Read, K. A., Reid, N., Ries, L., Saxena, P., Schwab, J. J., Scorgie, Y., Senik, I., Simmonds, P., Sinha, V., Skorokhod, A. I., Spain, G., Spangl, W., Spoor, R., Springston, S. R., Steer, K., Steinbacher, M., Suharguniyawan, E., Torre, P., Trickl, T., Weili, L., Weller, R., Xiaobin, X., Xue, L., and Zhiqiang, M.: Tropospheric Ozone Assessment Report: Database and Metrics Data of Global Surface Ozone Observations, Elem. Sci. Anth., 5, 58, https://doi.org/10.1525/elementa.244, 2017.
Smit, H. G. J. and ASOPOS panel: Quality assurance and quality control for ozonesonde measurements in GAW, World Meteorological Organization, GAW Report No. 201, Geneva, Switzerland, 100 pp., https://tropo.gsfc.nasa.gov/shadoz/index/archive/nletter/GAW_201.pdf (last access: 29 October 2023), 2014.
Smit, H. G. J. and Thompson, A. M.: Ozonesonde Measurement Principles and Best Operational Practices: ASOPOS 2.0 (Assessment of Standard Operating Procedures for Ozonesondes), World Meteorological Organization, GAW Report No. 268, Geneva, Switzerland, 172 pp., https://library.wmo.int/records/item/57720-ozonesonde- measurement-principles-and-best-operational-practices (last access: 29 October 2023), 2021.
Smit, H. G. J., Straeter, W., Johnson, B. J., Oltmans, S. J., Davies, J., Tarasick, D. W., Hoegger, B., Stubi, R., Schmidlin, F. J., Northam, T., Thompson, A. M., Witte, J. C., Boyd, I., and Posny, F.: Assessment of the Performance of ECC-ozonesondes under Quasi-flight Conditions in the Environmental Simulation Chamber: Insights from the Jülich Ozone Sonde Intercomparison Experiment (JOSIE), J. Geophys. Res., 112, D19306, https://doi.org/10.1029/2006JD007308, 2007.
Sprenger, M. and Wernli, H.: The LAGRANTO Lagrangian analysis tool – version 2.0, Geosci. Model Dev., 8, 2569–2586, https://doi.org/10.5194/gmd-8-2569-2015, 2015.
Stauffer, R. M., Thompson, A. M., Kollonige, D. E., Tarasick, D. W., Van Malderen, R., Smit, H. G. J., Vömel, H., Morris, G. A., Johnson, B. J., Cullis, P. D., Stübi, R., Davies, J., and Yan.: An Examination of the Recent Stability of Ozonesonde Global Network Data, Earth Space Sci., 9, e2022EA002459, https://doi.org/10.1029/2022EA002459, 2022.
Stein, A. F., Draxler, R. R, Rolph, G. D., Stunder, B. J. B., Cohen, M. D., and Ngan, F.: NOAA's HYSPLIT atmospheric transport and dispersion modeling system, B. Am. Meteorol. Soc., 96, 2059–2077, 2015.
Steinbrecht, W., Schwarz, R., and Claude, H.: New pump correction for the Brewer-Mast ozone sonde: determination from experiment and instrument intercomparisons, J. Atmos. Ocean. Tech., 15, 144–156, 1998.
Stohl, A. and Trickl, T.: A textbook example of long-range transport: Simultaneous observation of ozone maxima of stratospheric and North American origin in the free troposphere over Europe, J. Geophys. Res., 104, 30445–30462, 1999.
Stohl, A., Bonasoni, P., Cristofanelli, P., Collins, W., Feichter, J., Frank, A., Forster, C., Gerasopoulos, E., Gäggeler, H., James, P., Kentarchos, T., Kromp-Kolb, H., Krüger, B., Land, C., Meloen, J., Papayannis, A., Priller, A., Seibert, P., Sprenger, M., Roelofs, G. J., Scheel, H. E., Schnabel, C., Siegmund, P., Tobler, L., Trickl, T., Wernli, H., Wirth, V., Zanis, P., and Zerefos, C.: Stratosphere-troposphere exchange – a review, and what we have learned from STACCATO, J. Geophys. Res., 108, 8516, https://doi.org/10.1029/2002JD002490, 2003.
Stübi, R., Levrat, G., Hoegger, B., Pierre Viatte, P., Staehelin, J., and Schmidlin, F. J.: In-flight comparison of Brewer-Mast and electrochemical concentration cell ozonesondes, J. Geophys. Res., 113, D13302, https://doi.org/10.1029/2007JD009091, 2008.
Tarasick, D. W., Davies, J., Anlauf, K., Watt, M., Steinbrecht, W., and Claude, H.-J.: Laboratory investigations of the response of Brewer-Mast ozonesondes to tropospheric ozone, J. Geophys. Res., 107, ACH 14-1–ACH 14-10, https://doi.org/10.1029/2001JD001167, 2002.
Tarasick, D. W., Davies, J., Smit, H. G. J., and Oltmans, S. J.: A re-evaluated Canadian ozonesonde record: measurements of the vertical distribution of ozone over Canada from 1966 to 2013, Atmos. Meas. Tech., 9, 195–214, https://doi.org/10.5194/amt-9-195-2016, 2016.
Tarasick, D., Galbally, I. E., Cooper, O. R., Schultz, G. M., Ancellet, G., Leblanc, T., Wallington, T. J., Ziemke, J., Liu, X., Steinbacher, M., Staehelin, J., Vigouroux, C., Hannigan, J., García, O., Foret, G., Zanis, P., Weatherhead, E., Petropavlovskikh, I., Worden, H., Osman, M., Liu, J., Chang, K.-L., Gaudel, A., Lin, M., Granados-Muñoz, M., Thompson, A. M., Oltmans, S. J., Cuesta, J., Dufour, G., Thouret, V., Hassler, B., Trickl, T., and Neu, J. L.: Tropospheric Ozone Assessment Report: Tropospheric ozone from 1877 to 2016, observed levels, trends and uncertainties, Elem. Sci. Anth., 7, 39, https://doi.org/10.1525/elementa.376, 2019.
Tarasick, D. W., Smit, H. G. J., Thompson, A. M., Morris, G. A., Witte, J. C., Davies, J., Davies, J., Nakano, T., Van Malderen, R., Stauffer, R. M., Johnson, B. J., Stubi1, R., Oltmans, S. J., and Vömel, H.: Improving ECC ozonesonde data quality: Assessment of current methods and outstanding issues, Earth Space Sci., 8, e2019EA000914, https://doi.org/10.1029/2019EA000914, 2021.
TESLAS: Tropospheric Environmental Studies by Laser Sounding (TESLAS), in: Transport and Chemical Transformation of Pollutants in the Troposphere, Vol. 8, Instrument Development for Atmospheric Research and Monitoring, edited by: Bösenberg, J., Brassington, D., and Simon, P. C., Springer, Berlin, Heidelberg, New York, 1–203, ISBN 3-540-62516-X, 1997.
Thompson, A. M., Smit, H. G. J., Witte, J. C., Stauffer, R. M., Johnson, B. J., Morris, G., von der Gathen, P., Van Malderen, R., Davies, J., Piters, A., Allaart, M., Posny, F., Kivi, R., Cullis, P., Hoang Anh, N. T., Corrales, E., Machinini, T., da Silva, F. R., Paiman, G., Thiong'o, K., Zainal, Z., Brothers, G. B., Wolff, K. R., Nakano, T., Stübi, R., Romanens, G., Coetzee, G. J. R., Diaz, J. A., Mitro, S., Mohamad, M., and Ogino, S.: Ozonesonde Quality Assurance: The JOSIE–SHADOZ (2017) Experience, B. Am. Meteorol. Soc., 100, 155–171, 2019.
Trickl, T., Cooper, O. R., Eisele, H., James, P., Mücke, R., and Stohl, A.: Intercontinental transport and its influence on the ozone concentrations over central Europe: Three case studies, J. Geophys. Res., 108, 8530, 10.1029/2002JD002735, 2003.
Trickl, T., Feldmann, H., Kanter, H.-J., Scheel, H.-E., Sprenger, M., Stohl, A., and Wernli, H.: Forecasted deep stratospheric intrusions over Central Europe: case studies and climatologies, Atmos. Chem. Phys., 10, 499–524, https://doi.org/10.5194/acp-10-499-2010, 2010.
Trickl, T., Bärtsch-Ritter, N., Eisele, H., Furger, M., Mücke, R., Sprenger, M., and Stohl, A.: High-ozone layers in the middle and upper troposphere above Central Europe: potential import from the stratosphere along the subtropical jet stream, Atmos. Chem. Phys., 11, 9343–9366, https://doi.org/10.5194/acp-11-9343-2011, 2011.
Trickl, T., Vogelmann, H., Giehl, H., Scheel, H.-E., Sprenger, M., and Stohl, A.: How stratospheric are deep stratospheric intrusions?, Atmos. Chem. Phys., 14, 9941–9961, https://doi.org/10.5194/acp-14-9941-2014, 2014.
Trickl, T., Vogelmann, H., Flentje, H., and Ries, L.: Stratospheric ozone in boreal fire plumes – the 2013 smoke season over central Europe, Atmos. Chem. Phys., 15, 9631–9649, https://doi.org/10.5194/acp-15-9631-2015, 2015.
Trickl, T., Vogelmann, H., Fix, A., Schäfler, A., Wirth, M., Calpini, B., Levrat, G., Romanens, G., Apituley, A., Wilson, K. M., Begbie, R., Reichardt, J., Vömel, H., and Sprenger, M.: How stratospheric are deep stratospheric intrusions? LUAMI 2008, Atmos. Chem. Phys., 16, 8791–8815, https://doi.org/10.5194/acp-16-8791-2016, 2016.
Trickl, T., Giehl, H., Neidl, F., Perfahl, M., and Vogelmann, H.: Three decades of tropospheric ozone lidar development at Garmisch-Partenkirchen, Germany, Atmos. Meas. Tech., 13, 6357–6390, https://doi.org/10.5194/amt-13-6357-2020, 2020a.
Trickl, T., Vogelmann, H., Ries, L., and Sprenger, M.: Very high stratospheric influence observed in the free troposphere over the northern Alps – just a local phenomenon?, Atmos. Chem. Phys., 20, 243–266, https://doi.org/10.5194/acp-20-243-2020, 2020b.
Trickl, T., Couret, C., Ries, L., and Vogelmann, H.: Zugspitze ozone 1970–2020: the role of stratosphere–troposphere transport, Atmos. Chem. Phys., 23, 8403–8427, https://doi.org/10.5194/acp-23-8403-2023, 2023a.
Trickl, T., Couret, C., Ries, L., and Vogelmann, H.: Corrigendum to “Zugspitze ozone 1970–2020: the role of stratosphere–troposphere transport” published in Atmos. Chem. Phys., 23, 8403–8427, 2023, https://doi.org/10.5194/acp-23-8403-2023-corrigendum, 2023b.
Van Malderen, R., Allaart, M. A. F., De Backer, H., Smit, H. G. J., and De Muer, D.: On instrumental errors and related correction strategies of ozonesondes: possible effect on calculated ozone trends for the nearby sites Uccle and De Bilt, Atmos. Meas. Tech., 9, 3793–3816, https://doi.org/10.5194/amt-9-3793-2016, 2016.
Viallon, J., Lee, S., Moussay, P., Tworek, K., Petersen, M., and Wielgosz, R. I.: Accurate measurements of ozone absorption cross-sections in the Hartley band, Atmos. Meas. Tech., 8, 1245–1257, https://doi.org/10.5194/amt-8-1245-2015, 2015.
Vogelmann, H. and Trickl, T.: Wide-Range Sounding of Free-Tropospheric Water Vapor with a Differential-Absorption Lidar (DIAL) at a High-Altitude Station, Appl. Opt., 47, 2116–2132, 2008.
Vogelmann, H., Sussmann, R., Trickl, T., and Borsdorff, T.: Intercomparison of atmospheric water vapor soundings from the differential absorption lidar (DIAL) and the solar FTIR system on Mt. Zugspitze, Atmos. Meas. Tech., 4, 835–841, https://doi.org/10.5194/amt-4-835-2011, 2011.
Vogelmann, H., Sussmann, R., Trickl, T., and Reichert, A.: Spatiotemporal variability of water vapor investigated using lidar and FTIR vertical soundings above the Zugspitze, Atmos. Chem. Phys., 15, 3135–3148, https://doi.org/10.5194/acp-15-3135-2015, 2015.
Völger, P., Bösenberg, J., and Schult, I.: Scattering Properties of Selected Model Aerosols Calculated at UV-Wavelengths: Implications for DIAL Measurements of Tropospheric Ozone, Beitr. Phys. Atmosph., 69, 177–187, 1996.
Vömel, H., David, D. E., and Smith, K.: Accuracy of tropospheric and stratospheric water vapor measurements by the cryogenic frost point hygrometer: Instrumental details and observations, J. Geophys. Res., 112, D08305, https://doi.org/10.1029/2006JD007224, 2007.
Vömel, H., Naebert, T., Dirksen, R., and Sommer, M.: An update on the uncertainties of water vapor measurements using cryogenic frost point hygrometers, Atmos. Meas. Tech., 9, 3755–3768, https://doi.org/10.5194/amt-9-3755-2016, 2016.
Vömel, H., Smit, H. G. J., Tarasick, D., Johnson, B., Oltmans, S. J., Selkirk, H., Thompson, A. M., Stauffer, R. M., Witte, J. C., Davies, J., van Malderen, R., Morris, G. A., Nakano, T., and Stübi, R.: A new method to correct the electrochemical concentration cell (ECC) ozonesonde time response and its implications for “background current” and pump efficiency, Atmos. Meas. Tech., 13, 5667–5680, https://doi.org/10.5194/amt-13-5667-2020, 2020.
VOTALP II: Vertical Ozone Transport in the Alps II, Final Report for the European Union, Contract No. ENV4 CT970413, Reporting Period 1/3/1998-29/2/2000, Co-ordinator: Kromp-Kolb, H., Institut für Meteorologie und Physik, Universität für Bodenkultur Wien, Austria, 96 pp., 2000.
WDCRG: GAW Global (32), WDCRG [data set], https://gaw.kishou.go.jp/search (last access: 2 November 2023), 2018.
Wernli, H. and Davies, H. C.: A Lagrangian-based analysis of extratropical cyclones. I: The method and some applications, Q. J. Roy. Meteor. Soc., 123, 467–489, https://doi.org/10.1002/qj.49712353811, 1997.
Wotava, G. and Kromp-Kolb, H.: The research project VOTALP – general objectives and main results, Atmos. Environ., 34, 1319–1322, 2000.
Yuan, Y., Ries, L., Petermeier, H., Trickl, T., Leuchner, M., Couret, C., Sohmer, R., Meinhardt, F., and Menzel, A.: On the diurnal, weekly, and seasonal cycles and annual trends in atmospheric CO2 at Mount Zugspitze, Germany, during 1981–2016, Atmos. Chem. Phys., 19, 999–1012, https://doi.org/10.5194/acp-19-999-2019, 2019.
Zanis, P., Trickl, T., Stohl, A., Wernli, H., Cooper, O., Zerefos, C., Gaeggeler, H., Schnabel, C., Tobler, L., Kubik, P. W., Priller, A., Scheel, H. E., Kanter, H. J., Cristofanelli, P., Forster, C., James, P., Gerasopoulos, E., Delcloo, A., Papayannis, A., and Claude, H.: Forecast, observation and modelling of a deep stratospheric intrusion event over Europe, Atmos. Chem. Phys., 3, 763–777, https://doi.org/10.5194/acp-3-763-2003, 2003.
Zellweger, C., Buchmann, B., Klausen, J., and Hofer, P.: System and Performance Audit of Surface Ozone, Carbon Monoxide and Methane at the Global GAW Station Zugspitze/Hohenpeißenberg, Platform Zugspitze, Germany, Empa-WCC Report 01/1, submitted to the World Meteorological Organization, 49 pp., https://www.empa.ch/documents/56101/250799/Zugspitze_Schneefernhaus01.pdf/8abd8c8a-75f7-40d4-b2bc-afd506dc2742 (last access: 24 July 2023), 2001.
Zellweger, C., Klausen, J., and Buchmann, B.: System and Performance Audit of Surface Ozone, Carbon Monoxide and Methane at the Global GAW Station Zugspitze/Schneefernerhaus, Germany, Empa-WCC Report 06/2, submitted to the World Meteorological Organization, 51 pp., https://www.empa.ch/documents/56101/250799/Zugspitze_Schneefernhaus06.pdf/941aa2cf-9aa0-497d-9681-3a4a153bc43e (last access: 24 July 2023), 2006.
Zellweger, C., Steinbacher, M., Buchmann, B., and Steinbrecher, R.: System and Performance Audit of Surface Ozone, Methane, Carbon Dioxide, Nitrous Oxide and Carbon Monoxide at the Global GAW Station Zugspitze-Schneefernerhaus, Germany, WCC-Empa Report 11/2, submitted to WMO by WMO World Calibration Centre WCC-Empa Empa Dübendorf, Switzerland, 46 pp., https://www.empa.ch/documents/56101/250799/Zugspitze_Schneefernhaus11.pdf/f22a4616-5bd2-4d38-b74b-ca724da48be8 (last access: 24 July 2023), 2011.
Zellweger, C., Steinbacher, M., Buchmann, B., and Steinbrecher, R.: System and Performance Audit of Surface Ozone, Methane, Carbon Dioxide, Nitrous Oxide and Carbon Monoxide at the Global GAW Station Zugspitze-Schneefernerhaus, Germany, submitted to WMO, WCC-Empa Report 20/3, September 2020, GAW report 266, WMO World Calibration Centre WCC-Empa, Empa, Dübendorf, Switzerland, 54 pp., https://community.wmo.int/en/gaw-reports (last access: 24 July 2023), 2021.