the Creative Commons Attribution 4.0 License.
the Creative Commons Attribution 4.0 License.
 | 20 Dec 2023
A searchable database and mass spectral comparison tool for the Aerosol Mass Spectrometer (AMS) and the Aerosol Chemical Speciation Monitor (ACSM)
Sohyeon Jeon
Michael J. Walker
Donna T. Sueper
Douglas A. Day
Anne V. Handschy
Jose L. Jimenez
Brent J. Williams
The Aerodyne Aerosol Mass Spectrometer (AMS) and Aerosol Chemical Speciation Monitor (ACSM) are the most widely applied tools for in situ chemical analysis of the non-refractory bulk composition of fine atmospheric particles. The mass spectra (MS) of many AMS and ACSM observations from field and laboratory studies have been reported in peer-reviewed literature and many of these MS have been submitted to an open-access website. With the increased reporting of such datasets, the database interface requires revisions to meet new demands and applications. One major limitation of the web-based database is the inability to automatically search the database and compare previous MS with the researcher's own data. In this study, a searchable database tool for the AMS and ACSM mass spectral dataset was built to improve the efficiency of data analysis using Igor Pro, consistent with existing AMS and ACSM software. The database tool incorporates the published MS and sample information uploaded on the website. This tool allows the comparison of a target mass spectrum with the reference MS in the database, calculating cosine similarity, and provides a range of MS comparison plots, reweighting, and mass spectrum filtering options. The aim of this work is to help AMS and ACSM users efficiently analyze their own data for possible source or atmospheric processing features by comparison to previous studies, enhancing information gained from past and current global research on atmospheric aerosol.
- Article
(3165 KB) - Full-text XML
-
Supplement
(1480 KB) - BibTeX
- EndNote


Atmospheric aerosol particles have adverse effects on human health and impact visibility, the hydrological cycle, and climate changes through direct and indirect radiative properties (Ramanathan et al., 2001; Bäumer et al., 2008; Kampa and Castanas, 2008; Masson-Delmotte et al., 2021). Globally, the dominant constituent of dry fine-mode respirable aerosol particles is organic matter (OM), commonly referred to as organic aerosol (OA). Understanding the characteristics, sources, and processes of OA is key in developing aerosol-related control policies and air quality and climate models. However, OA is chemically complex, with thousands of different compounds detected in single samples (Goldstein and Galbally, 2007). The compositional complexity of OA arises from diverse primary sources and reactions of organic species in the atmosphere that produce secondary OA (SOA) material from gas-to-particle conversion or chemically aged OA (De Gouw and Jimenez, 2009).
The Aerosol Mass Spectrometer (AMS) has widely been applied to atmospheric science research for analysis of the bulk chemical composition of fine particles. It allows one to measure the non-refractory components of the particles with high time resolution, most typically reporting mass concentrations of total fine OA, sulfate, nitrate, ammonium, and chloride (e.g., Jayne et al., 2000; Jimenez et al., 2003; Allan et al., 2004; DeCarlo et al., 2006; Canagaratna et al., 2007; Baltensperger et al., 2010). The AMS has frequently been used in both field and laboratory studies. In field studies, the AMS has characterized atmospheric particles in environments such as urban, rural, remote, forested, ocean, and agricultural regions (e.g., Allan et al., 2004, 2006; Phinney et al., 2006; Aiken et al., 2009; He et al., 2011; Bates et al., 2012; Cleveland et al., 2012; Dall'Osto et al., 2013; Hao et al., 2014; Xu et al., 2014, 2015; Lee et al., 2015; Modini et al., 2015; Young et al., 2016; Kim et al., 2017). In addition, AMS has been used on many platforms such as mobile labs, aircraft, and ships, as well as stationary sites (e.g., Bahreini et al., 2003; Zorn et al., 2008; Mohr et al., 2011; Coggon et al., 2012; Drewnick et al., 2012; Claeys et al., 2017; Pirjola et al., 2017; Robinson et al., 2018; Shilling et al., 2018). For laboratory studies, particles generated from a variety of sources, including wood burning, cooking, trash burning, coal and fuel combustion, etc., have been characterized using AMS (e.g., Canagaratna et al., 2004; Schneider et al., 2006; Aiken et al., 2008; Weimer et al., 2008; Mohr et al., 2009; Chirico et al., 2010; He et al., 2010; Adam et al., 2011; Heringa et al., 2011; Wang et al., 2013; Collier et al., 2015; Fortenberry et al., 2018). Furthermore, AMS has been employed to analyze SOA formed from different oxidation experiments using environmental chambers or flow tube reactors with varying oxidants, aging processes, concentrations, humidity levels, temperatures, precursors, etc. (e.g., Bahreini et al., 2005; Kroll et al., 2005, 2006; Murphy et al., 2007; Ng et al., 2007, 2008; Chhabra et al., 2010; Lambe et al., 2011, 2012; Loza et al., 2014; Riva et al., 2016; Boyd et al., 2017; Lim et al., 2019).
The Aerosol Chemical Speciation Monitor (ACSM) also has been used to analyze the bulk chemical composition of non-refractory components with a very similar sampling and detection technology as the AMS. The key difference is that the ACSM was developed with reduced complexity (e.g., no particle size measurement) and performance (Ng et al., 2011). A major advantage of ACSM over AMS is that it provides a smaller size, lower cost, simpler operation, and less attention from site managers than AMS. In addition, ACSM data are analyzed with the same techniques that are used for the AMS. Therefore, the ACSM has been deployed for long-term monitoring at locations including urban (e.g., Ng et al., 2011; Sun et al., 2011, 2018; Budisulistiorini et al., 2013, 2014, 2016; Carbone et al., 2013; Aurela et al., 2015; Petit et al., 2015; Reyes-Villegas et al., 2016; Rattanavaraha et al., 2017; Kommula et al., 2021), suburban (Zhang et al., 2018), rural (e.g., Tiitta et al., 2014; Canonaco et al., 2015; Fröhlich et al., 2015a; Parworth et al., 2015; Bressi et al., 2016; Budisulistiorini et al., 2016; Schlag et al., 2016; Zhao et al., 2020), remote (e.g., Budisulistiorini et al., 2015; Fröhlich et al., 2015b; Ripoll et al., 2015; Michoud et al., 2017), and forested areas (e.g., Fröhlich et al., 2013; Minguillón et al., 2015; Heikkinen et al., 2020).
According to the broad and diverse application of the AMS and ACSM, data analysis procedures have also been advanced to improve efficiency and accuracy to interpret the data. These advances have made it possible to divide the quantified OA mass concentrations obtained from AMS and ACSM into hydrocarbon-like OA (HOA, a surrogate for primary OA (POA) directly emitted from fossil fuel combustion) and oxygenated OA (OOA, a surrogate for SOA generated from a chemical reaction or phase partitioning). Furthermore, OOA can be subdivided into low-volatility OOA (LV-OOA or more-oxidized OOA, MO-OOA) and semi-volatile OOA (SV-OOA or less-oxidized OOA, LO-OOA) when combined with methods such as thermal-denuding inlets and positive matrix factorization (PMF) analysis (Paatero and Tapper, 1994; Zhang et al., 2005, 2011; Lanz et al., 2007; Ulbrich et al., 2009). In addition, these deconvolved OAs have been specifically characterized depending on source types such as biomass burning (BBOA) and cooking (COA), increasing the utility of source apportionment of atmospheric aerosols (Paatero and Tapper, 1994; Ulbrich et al., 2009; Mohr et al., 2009). This improvement in data analysis, in addition to the higher performance and mass spectral resolution of modern time-of-flight (ToF) MS detectors often deployed with the AMS and ACSM, has led to a growing number of reported measurements under various sample configurations and conditions.
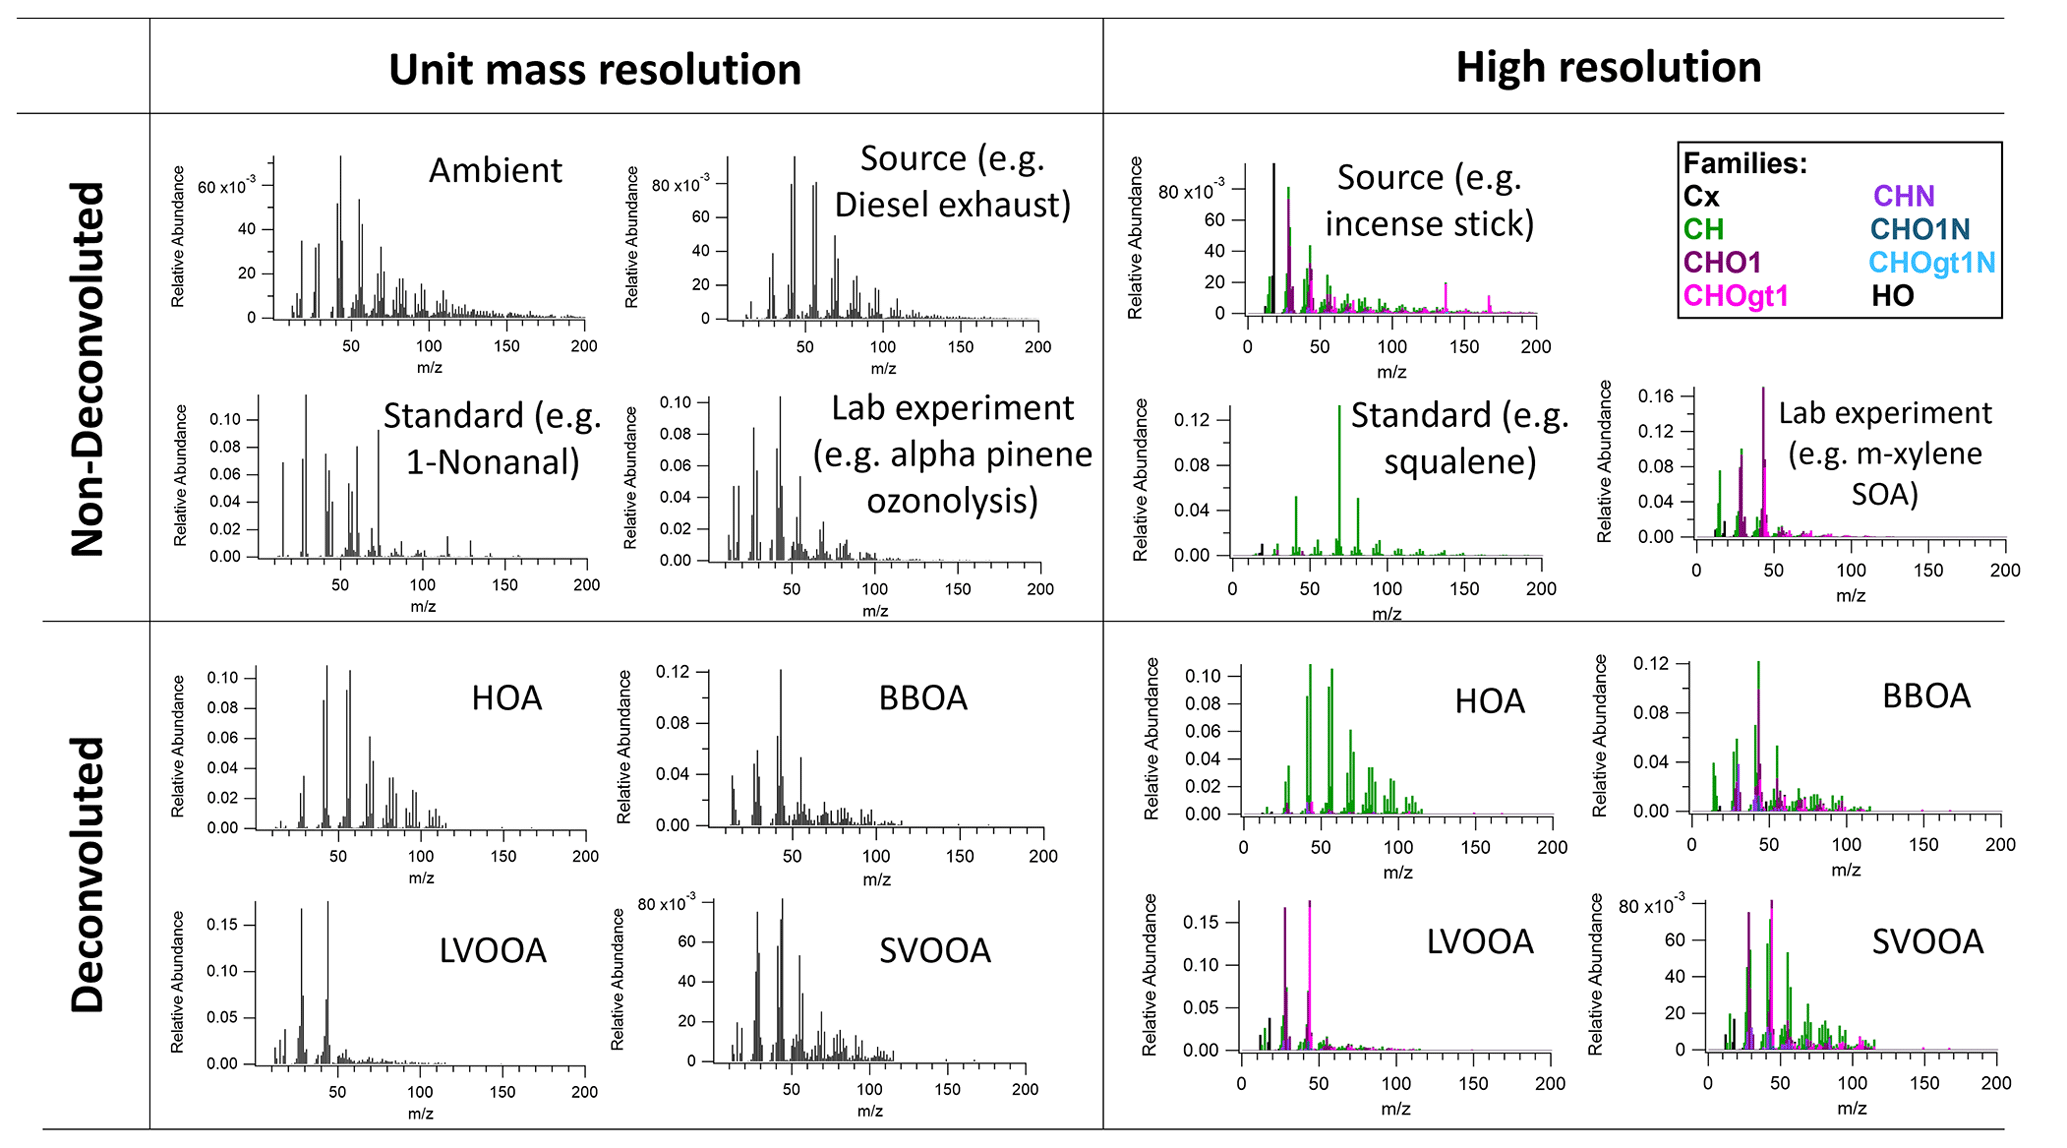
Figure 1Various examples of AMS OA mass spectral data divided by resolution and deconvolution. Each mass spectrum was plotted via the developed AMS MS comparison panel here, and original data were from Alfarra et al. (2004), Canagaratna et al. (2004), Katrib et al. (2004), Bahreini et al. (2005), Li et al. (2012), and Loza et al. (2012) for non-deconvoluted MS and Mohr et al. (2012) for deconvoluted MS.
Mass spectra (MS) from the AMS and ACSM provide powerful information to interpret the OA data. A mass spectrum with specific marker ions, or specific ratios of ions, can often be related to a source or chemical process. Here we broadly classify MS types by mass resolution (unit mass resolution or UMR vs. high mass resolution or HR) and extent of MS separation through data processing (non-deconvoluted/deconvoluted). UMR indicates that the signal at each mass is separated from the next “integer” . In contrast, HR is able to quantify multiple HR ion fragments at a nominal , which enables more detailed characterization than UMR. DeCarlo et al. (2006) have demonstrated the ability to characterize HR ion fragments below a nominal mass, typically 120. These HR ion fragment signals can be grouped into different ion classes such as Cx, CxHy, CxHyOz, etc., which are called “HR families”. A HR mass spectrum is often plotted in a color-coded stacked bar chart of these HR families. Deconvolution indicates whether or not the MS are generated from an additional analysis step like PMF. If the mass spectrum is obtained from PMF, it is called a “deconvoluted” mass spectrum and is identified as HOA, SV-OOA, LV-OOA, etc. If not separated, the mass spectrum is referred to as “non-deconvoluted”. A non-deconvoluted MS may be representative of multiple contributing sources or aging processes if an ambient sample or can be a single source or standard observed in a lab study. Figure 1 presents various examples of AMS OA MS classified by resolution and extent of MS processing.
With existing datasets growing in complexity and number according to the advancement and accessibility of technology in the aerosol science field, it is increasingly important to develop customizable databases that store previous observations and act as a reference for future studies. Previous AMS and ACSM data have often been provided in text and graphical form, such as peer-reviewed journal publications. However, as the amount of data grows, finding the appropriate data in a usable format is increasingly challenging. Previous efforts to build a database for AMS and ACSM have been made by Ulbrich et al. (2009). They collected published AMS and ACSM spectral data and metadata (e.g., instrument operating conditions, sample, and experiment details) and posted them on an open-access website (https://cires1.colorado.edu/jimenez-group/AMSsd/, last access: 9 September 2023). The digital data were uploaded as an Igor Pro software (Wavemetrics, Portland, OR) text file format, with an .itx file name extension. This allows users to upload or export the data in the Igor Pro software commonly used for AMS and ACSM data analysis. This is a useful repository to advertise and distribute AMS and ACSM data. However, this repository is not programmed or formatted to systematically search for appropriate results and compare them with the researcher's own data. Beyond the need to program a search method, formatting needs to be standardized compared to the current method where each spectral datum is individually uploaded on the web page with some variability in format (e.g., variable mass-to-charge () ranges).
In this study, we introduce a searchable database tool for the AMS and ACSM mass spectral dataset. Our aim is to improve the efficiency and utility of the AMS and ACSM data analysis process, building on the existing database from Ulbrich et al. (2009). We converted the web-based database to a software-based database format using Igor Pro and developed the Igor Pro visualization interface. The interface is called “AMS MS comparison panel” or simply “panel” in the following sections. To demonstrate the practical application of this tool, we compared our AMS MS with reference MS in the database. This comparison demonstrates how our tool can be useful in practical applications. We believe that incorporating this comparison tool will enhance the ability of AMS and ACSM users to conveniently compare their data with previously reported studies.
The developed database is based on the existing open-access website by Ulbrich et al. (2009), providing published AMS and ACSM mass spectral datasets. The website mainly consists of three separate web pages such as unit mass resolution (UMR, standard vaporizer), high resolution (HR, standard vaporizer), and capture vaporizer (CV, both UMR, and HR). Capture vaporizer indicates that a more recently developed particle vaporizer was installed, which can lead to different spectra primarily from increased thermal decomposition (Hu et al., 2018a). For each sample, the website provides metadata in a table format including spectra identification, sources, research groups, AMS instruments used, electron ionization (EI) energy, and vaporizer temperature. It also provides citation information and the original figure number in the publication, sometimes with additional comments. The mass spectrum is uploaded in a digital form for analysis as an .itx file, a plain text file that can be directly loaded into the data analysis software Igor Pro (Wavemetrics, Portland, OR).
Here, to convert this web-based information and individual mass spectrum files to the software-based database in Igor Pro, the given information was fetched from HTML using the “fetchURL” function in Igor Pro to convert the contents of the HTML to strings. Metadata were extracted from these HTML strings and saved in Igor Pro. Each mass spectrum was automatically downloaded to the computer first and then saved in the Igor Pro database. When saving the mass spectrum, it was aligned and normalized in a uniform format with a consistent range from 1 to 600 and a sum of the spectrum summing to a value of 1. In the case of high-resolution MS, they were converted to a UMR mass spectrum to make the HR mass spectrum directly comparable to the UMR mass spectrum and then also saved into the Igor Pro database. HR ion family data were also converted to UMR form and saved using the same method. For example, if the HR mass spectrum has three ions as ( 43.9898), C2H4O+ ( 44.0262), and ( 44.0626), all these three ions are considered 44 on the database panel in both UMR and HR. However, for HR ion families, these ions are respectively saved to corresponding HR ion families such as CHOgt1, CHO1, and CH (a detailed description of HR families is presented in Table S1 in the Supplement). After creating the software-based database, the visualization interface (i.e., AMS MS comparison panel) was constructed in Igor Pro to analyze the correlation between MS.
2.1 Mass spectrum correlation calculation
The main goal of this comparison panel is to provide a convenient function to analyze similarities between the mass spectrum of interest and the reference MS in the database. In this comparison tool, we chose cosine similarity to estimate mass spectrum similarity. Cosine similarity has been proved to show better performance in calculating correlations between MS compared to other methods (Stein and Scott, 1994; Ulbrich et al., 2009). Therefore, it is commonly used to analyze the similarity between MS in analyses of AMS spectra, referring to them as the dot product with normalized spectra input or uncentered correlation coefficient (e.g., Marcolli et al., 2006; Lambe et al., 2015; Day et al., 2022). On the panel here, cosine similarity is referred to as the “cosine score”. It measures the cosine of the angle between two vectors and is calculated by using the equation below.
where each vector A and B are corresponding to the mass spectrum of interest and each reference mass spectrum in the database, respectively. and denote the magnitudes of vectors A and B, and A⋅B indicate the dot product of A and B. The possible range of cosine similarity (score) is from 0 to 1, and the higher the score value, the higher the similarity between the MS.
In addition, the panel supplies the option to reweight the mass spectrum using Eq. (2) below. Regarding the comparison of MS, instrument operation parameters can cause -dependent differences in the number or detection of ions, and preprocessing spectral intensities by reweighting can have a beneficial effect on improving correlations between acquisition methods (Stein and Scott, 1994). The score can be adjusted by varying their mass weighting and intensity scaling factors. Increasing the relative significance of the lower-abundance high values can enhance the match-weighting of these more distinctive ions (i.e., molecular fragments). This is achieved by increasing the mass exponent (mass weighting) or decreasing the peak intensity exponent (intensity scaling factors) that corresponds to the m and n in Eq. (2), respectively.
The weighted exponents default to m=0 and n=1 on the panel. After reweighting, the mass spectrum is normalized by dividing each value by the sum of the reweighted mass spectrum (thus summing to unity again). Finally, the panel calculates the score using the scaled mass spectrum.
For HR mass spectral data, the score can be calculated with only the selected HR families on the panel. For example, if one selects 3 HR families out of 17, then it combines these 3 HR family MS of interest into 1 mass spectrum and sums to unity for normalization. It then calculates the score with a normalized mass spectrum utilizing the same method described above. Detailed HR family information will be described in the next section. This score is referred to as “score with HR family” on the HR data comparison tab of the panel.
2.2 Igor AMS mass spectral comparison panel
2.2.1 Data comparison tab
Figure 2 shows a screenshot of the AMS MS comparison panel. The panel is divided into four tabs (dashed line in orange of Fig. 2): (i) UMR Data Comparison, (ii) UMR Database, (iii) HR Data Comparison, and (iv) HR Database. Both data comparison tabs for UMR and HR data consist of three regions. Figure 2a (highlighted in blue) is where a new or existing mass spectrum is selected for comparison against database MS. Figure 2b (highlighted in red) is where the user will set search parameters and view results, and Fig. 2c (highlighted in black) is where metadata of selected database components can be viewed. Screenshots of other tabs are shown in the Supplement (Figs. S1–S3).
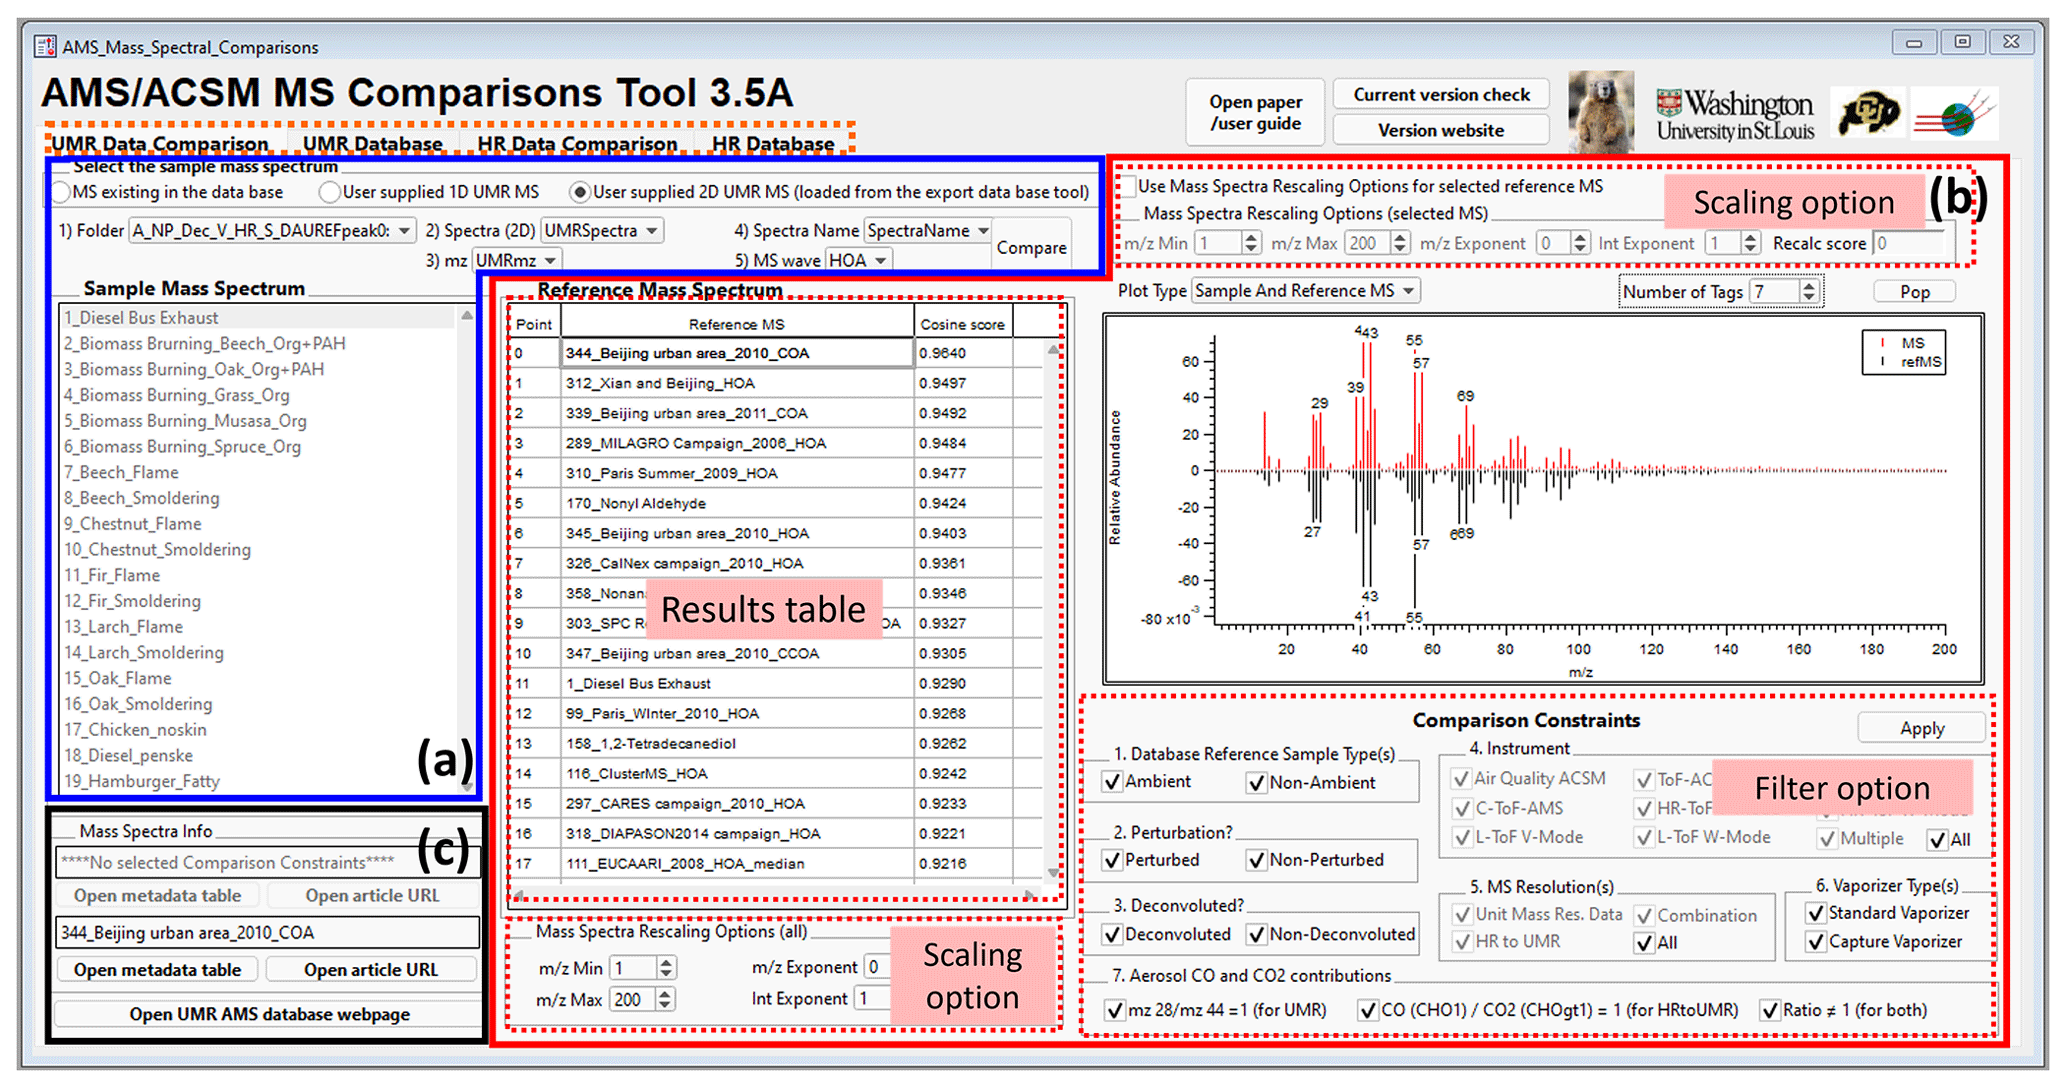
Figure 2A screenshot of the UMR data comparison tab in the “AMS MS Comparison Panel”. In box (a), the user selects their sample mass spectrum of interest. In box (b) the user views a comparison result of the sample with the database reference mass spectrum and sets the scaling option and filter option. Box (c) provides the citation information.
In Fig. 2a, users are able to select MS to be compared. There are two options for users to choose a mass spectrum of interest. One is to choose their own mass spectrum (“User supplied 1D/2D UMR MS”), and the other is to select an existing mass spectrum in the database (“MS existing in the data base”). In the case of selecting their own mass spectrum, the mass spectrum has to be in UMR with a standard range. The current panel and database use a mass range of 1–600. Detailed information on how to upload the user's own data to the database panel is described in the user guide section (Chap. 2 for UMR and Chap. 3 for HR) of the Supplement.
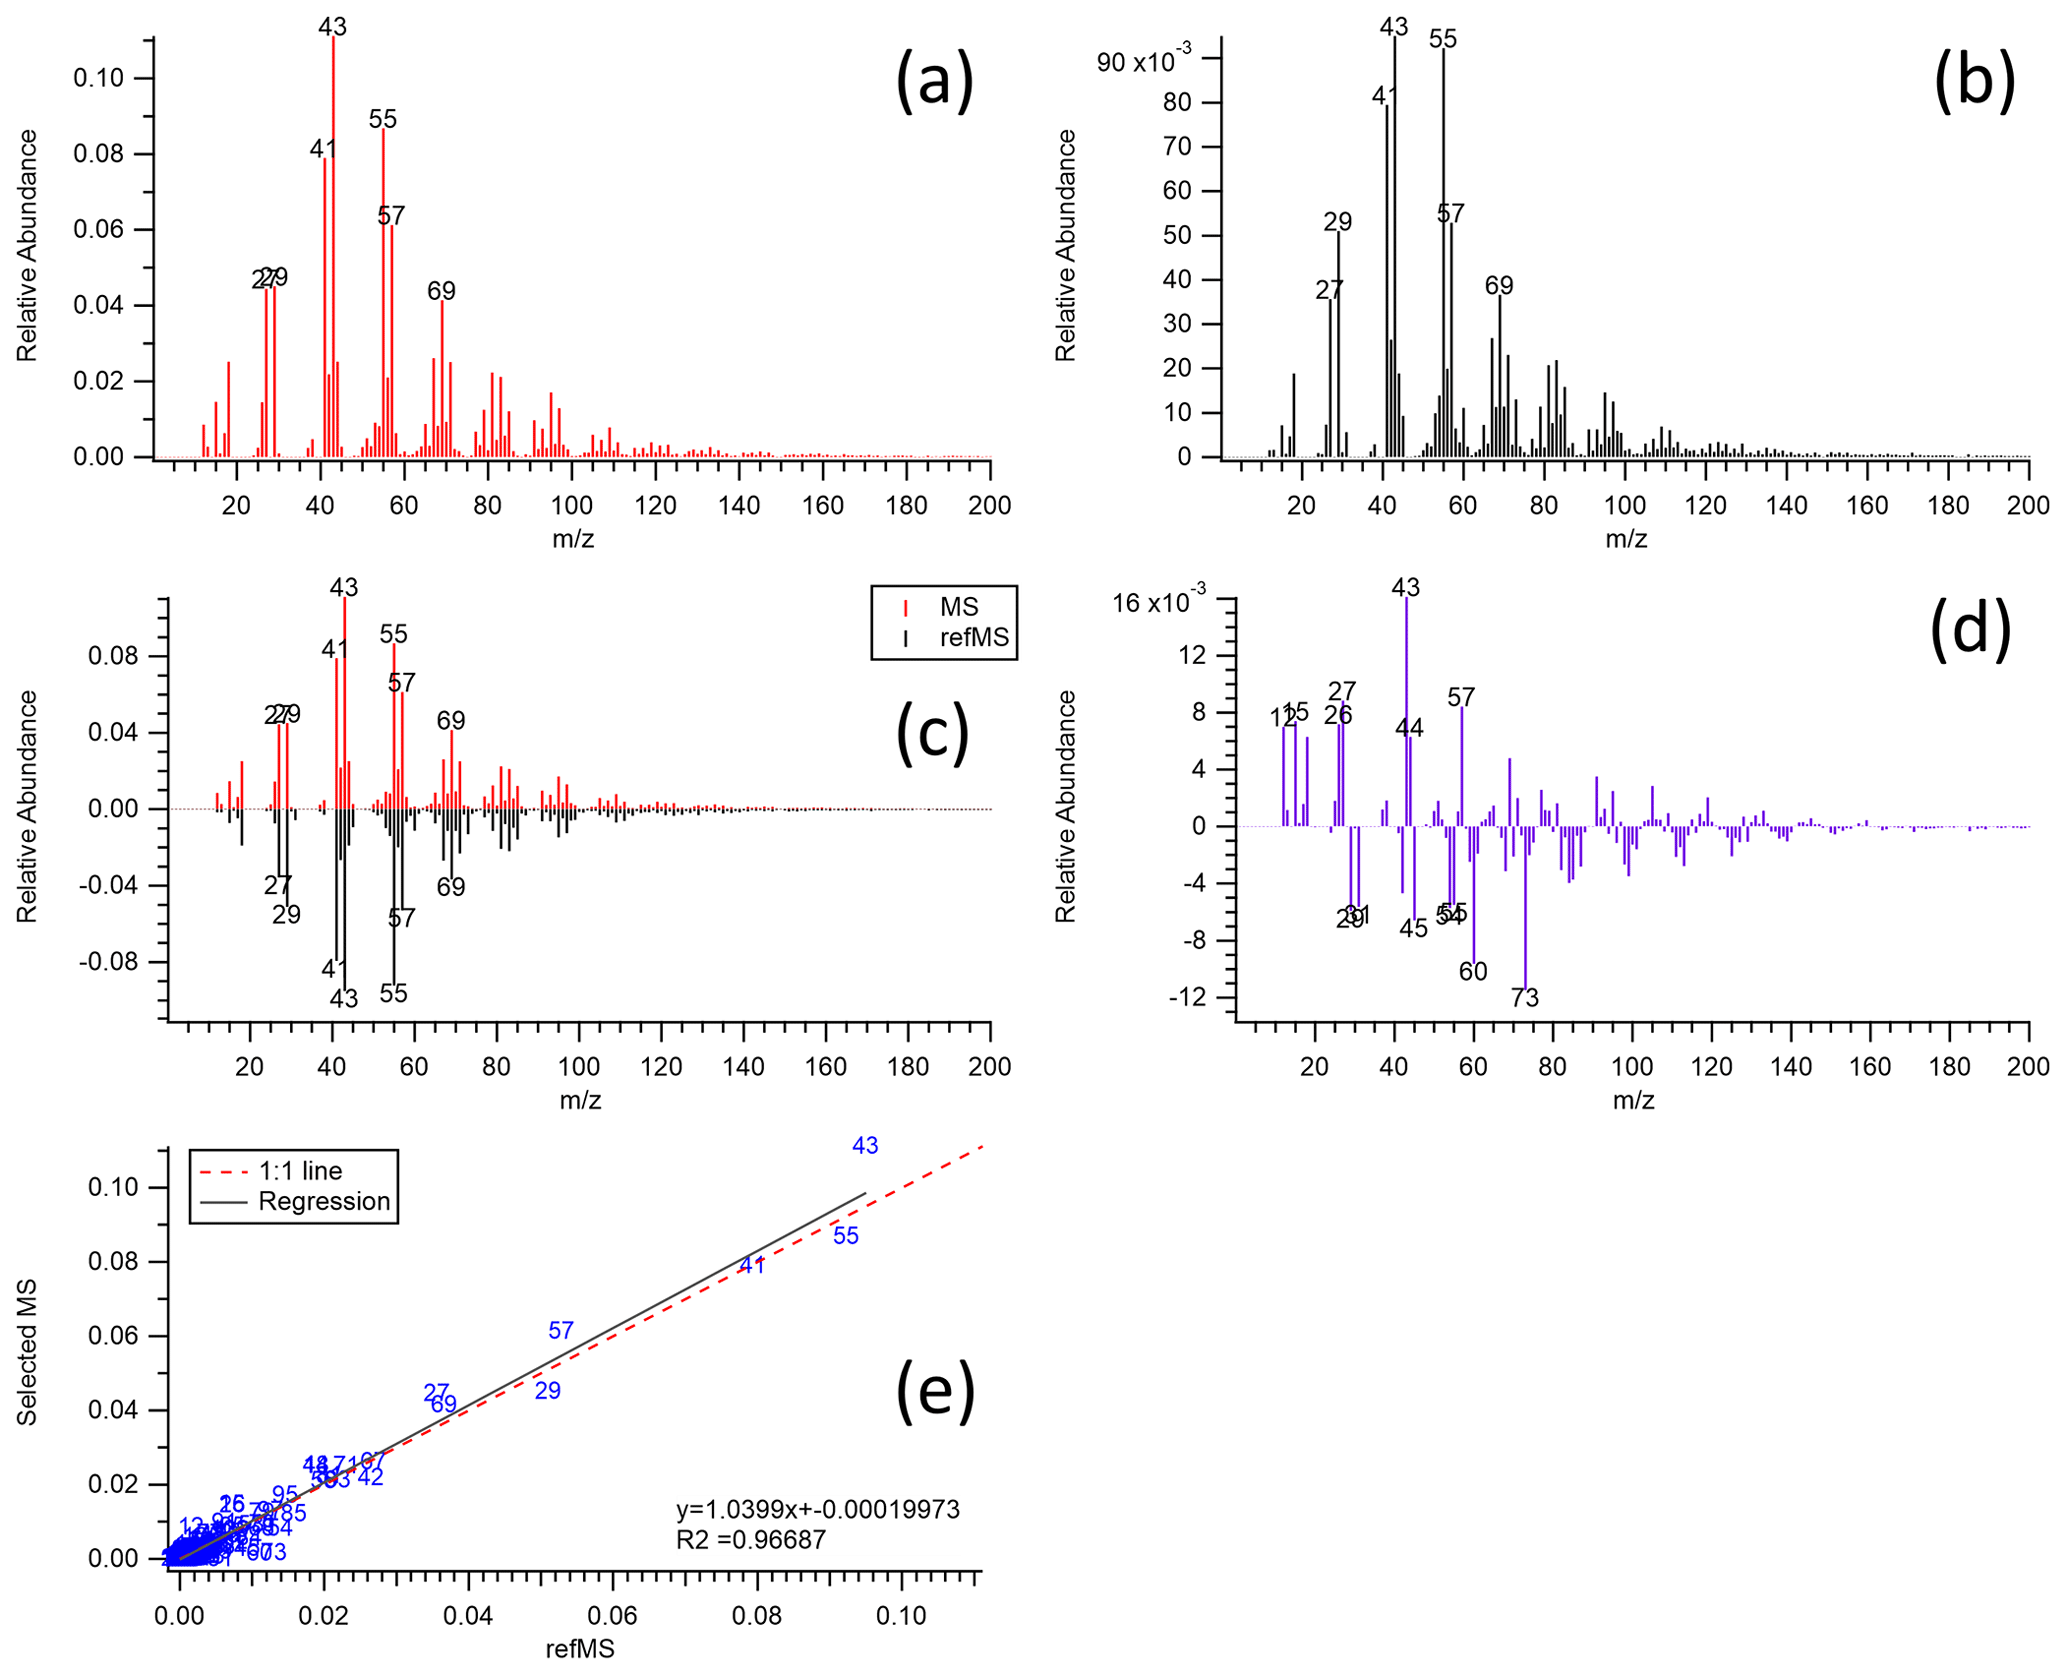
Figure 3Five types of plots provided by the panel to inform mass spectral comparisons: (a) sample mass spectrum of interest, (b) reference mass spectrum selected, (c) mirrored-image sample and reference MS, (d) subtraction (difference) of sample and reference MS, and (e) scatter plot between the sample and reference mass spectrum with the markers corresponding to the specific values with regression information. Original data were from Ulbrich et al. (2009) and Mohr et al. (2009). In this example (as observed in panel d) the sample MS (HOA) contains additional 43 and 57 (both of which have primary or secondary contributions and would need to further explore the HR results to distinguish), and the reference MS (laboratory, chicken cooking without skin) contains additional 60 and 73 (common biomass markers or carboxylic acids).
Figure 2b contains the result table, mass spectrum plot window, scaling mass spectrum options, and comparison filter options. The result table shows the list of reference spectra sorted by the calculated score (cosine similarity) in descending order. Users are able to see the reference spectrum of interest on the mass spectrum plot window by clicking on the result table. For the UMR data comparison tab, the mass spectrum plot window provides five types of mass spectrum plots (selectable with the “Plot Type” drop-down above the plot shown in Fig. 2): sample mass spectrum of interest, reference mass spectrum selected, mirror-image sample and reference MS, subtraction of sample and reference MS, and the scatter plot between the sample and reference with the markers corresponding to the specific value with regression information (Fig. 3). For the HR data comparison tab, the panel plots a stacked mass spectrum with HR ion families such as Cx, CH, CHO1, CHOgt1, etc (Fig. S2b). These HR ion families are the same names generated by PIKA v1.23B, which is an AMS data analysis tool for HR (DeCarlo et al., 2006; Sueper, 2021). The chemical formula for each HR ion family is described in Table S1. Users can select the HR ion family to be viewed on the window and can calculate a “score with HR family” with these selected HR families to compare the mass spectrum specifically. These various types of plots will help users visually observe the similarities and differences between the MS. The scaling mass spectrum option can reset the mass range and reweight the mass spectrum. Users are able to choose whether to apply the scaling options to all reference MS in the database (below the result table in Fig. 2b) or to only one selected reference mass spectrum on the list (top right of the panel in Fig. 2b) in UMR data comparison tab. For HR data, it only provides the scaling option for all reference MS. Furthermore, the panel supplies comparison constraints to filter the reference MS in the database depending on the metadata. Comparison constraint categories include sample type, perturbation, deconvolution, instrument, MS resolution, and CO and CO2 contribution sections. Detailed descriptions of these constraints are provided in the Supplement (Sect. S1).
Finally, in Fig. 2c, users can find detailed information on the sample mass spectrum of interest and selected reference MS in the result table. The “Open metadata table” button in Fig. 2c enables a new window to pop up for users to obtain information. The new window shows sample type, perturbed type, analysis, instrument type, resolution, vaporizer type, EI energy value, vaporizer temperature, experimenter's name, group, citations, citation URLs, figure numbers in the citation, and related comments (Fig. S4 in the Supplement). In addition, users can directly open the relevant published paper in a web browser via the panel (“Open article URL” button in Fig. 2c) if the URL address of the paper is saved in the database.
2.2.2 Database tab
Both database tabs of UMR and HR (Figs. S1 and S3) display reference MS in the database. Users can simply observe the reference mass spectrum in the database with metadata without correlation calculation. Users can scan the MS stored in the database through this tab and easily obtain the corresponding reference metadata.
Here, we used PMF factor mass spectral data from the DAURE campaign (Determination of the sources of atmospheric Aerosols in Urban and Rural Environments) to display the utility of the developed database and comparison panel. Data for this study were acquired in high resolution during the intensive DAURE field campaign in Montseny, Spain, during February–March 2009. An 8-factor solution (FPEAK=0) was chosen since this was the lowest number of factors at which the HOA and BBOA factors showed a clear separation from each other and OOA. Six factors were recombined to make up the OOA factor. The BBOA and HOA factors used here are those from the 8-factor solution. More details about an overview of the DAURE campaign and a summary of the results can be found in Minguillón et al. (2011), Pandolfi et al. (2014), and Zhang et al. (2023). For comparison, the acquired PMF factor mass spectral data in HR were converted to a UMR mass spectrum. Figure 4 shows the converted PMF factor MS of HOA, BBOA, and combined OOA in UMR and stacked HR ion families, respectively. In this section, we will introduce examples of ways to utilize the new comparison panel by applying functions via the UMR data comparison tab and present a potential for the HR data comparison tab based on HR families and “score with HR family” to obtain more information to interpret the data depending on our factor MS.
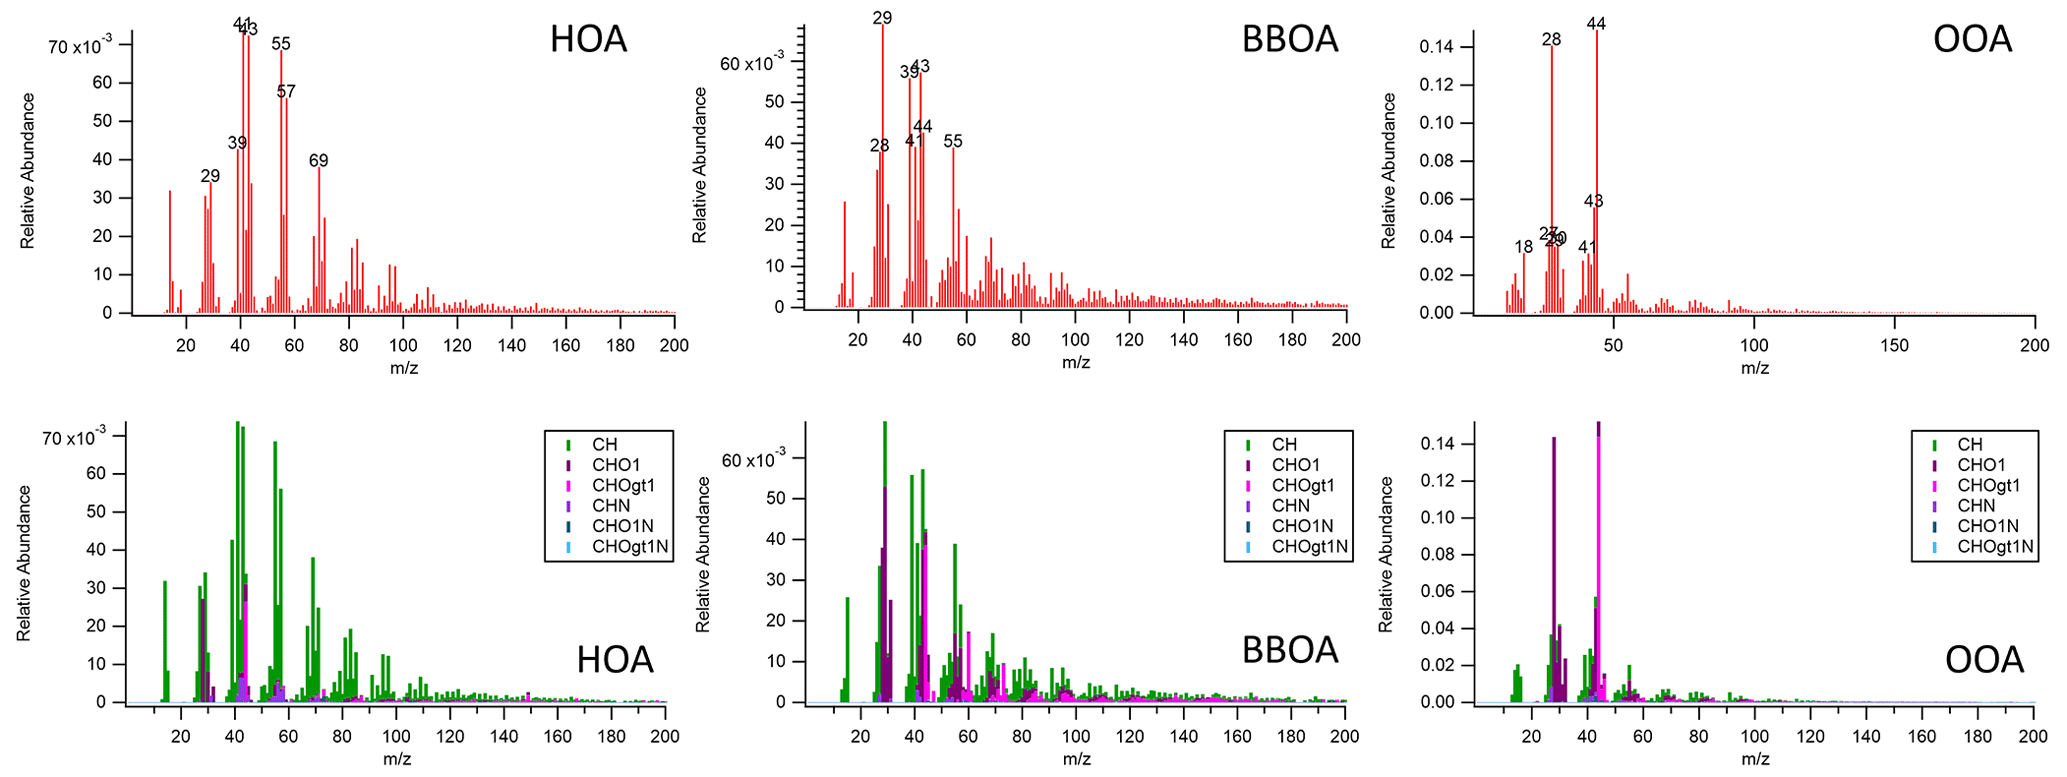
Figure 4PMF factor MS from Montseny, Spain, during the DAURE campaign (Minguillón et al., 2011) in UMR and stacked HR ion families. The acquired PMF factor MS in high resolution were converted to a UMR mass spectrum and plotted by the AMS MS comparison panel here.
As introduced above, the developed database panel provides different ways to compare the MS with filtering or scaling options. Among these options, the “sample type” category in the filtering option (Fig. 2b) enables researchers to select “ambient” or “non-ambient” samples in the database. The “ambient” option indicates direct measurement of ambient air, and the “non-ambient” option includes analysis of chamber studies, source emission studies, standards, etc. The scaling option is used to scale the mass spectrum using the mass range, mass exponent, and intensity exponent based on Eq. (2). The default setting of the scaling option on the panel is m=0 and n=1 on Eq. (2). The comparison process and results for each method will be described in this section with the DAURE campaign PMF factor MS as an example.
Table 1Top matches from “ambient” sample UMR comparison results with HOA factor from the DAURE campaign ( 1–200).
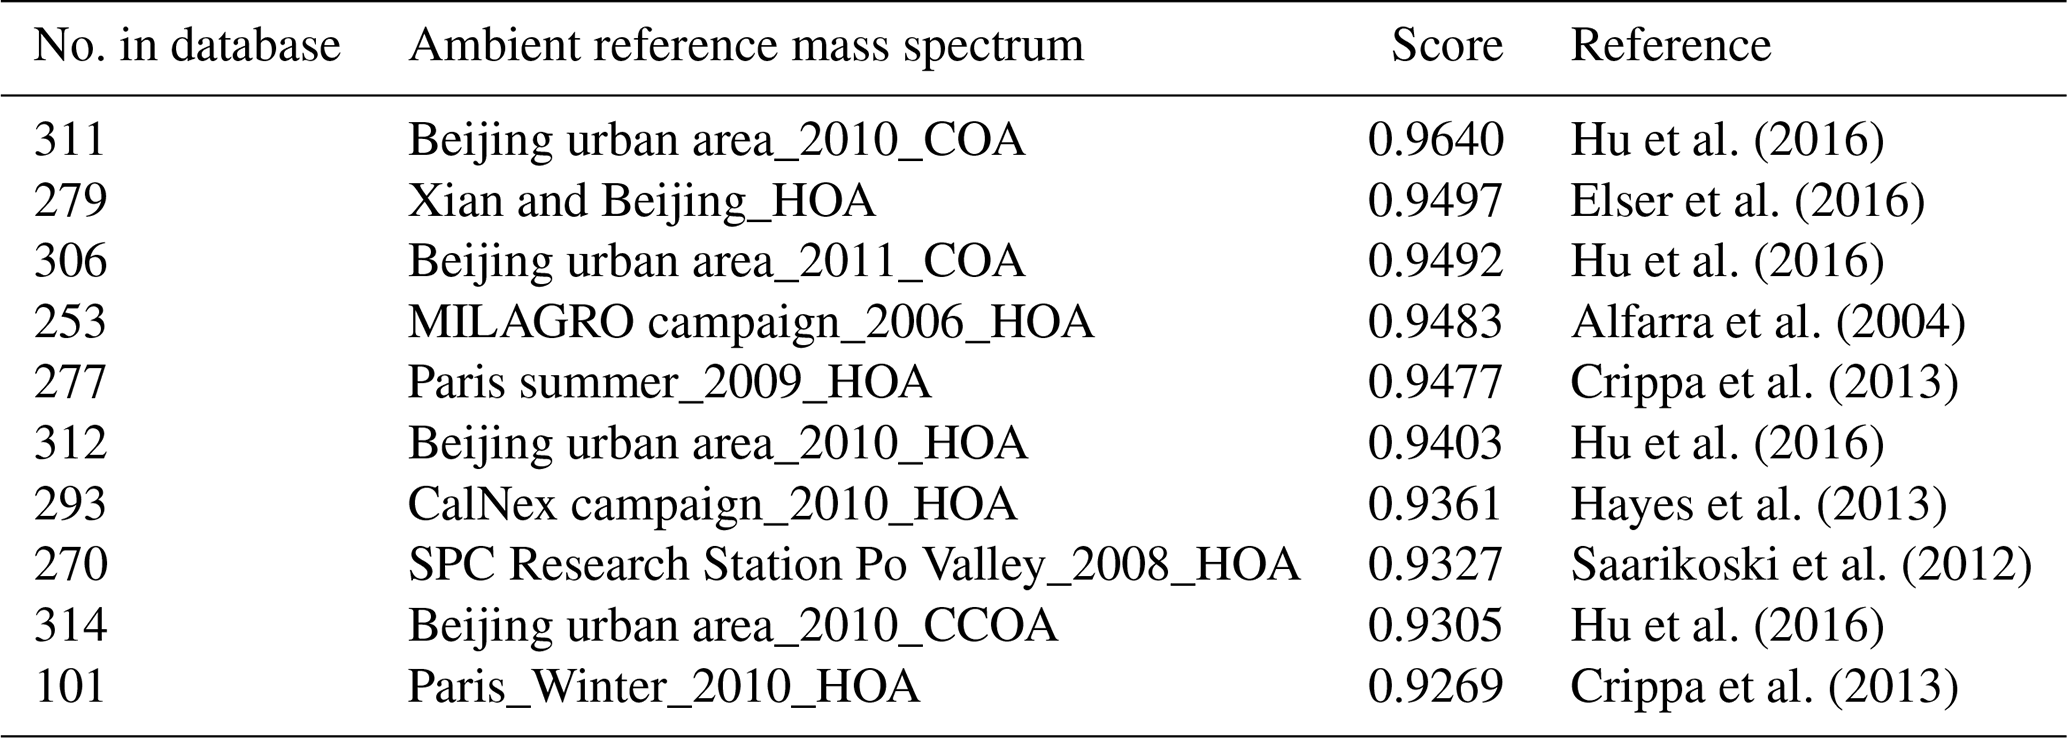
Selecting the “ambient” option is useful when the user wants to compare their mass spectrum only with previous ambient measurements. For example, after the final PMF factors are identified, we may want to confirm whether the identified PMF factors have a similar MS compared with previous studies. In this case, users can apply the “ambient” sample filter to compare. Table 1 shows the comparison results with the cosine similarity when we executed a UMR comparison of the HOA factor identified from the DAURE campaign (Montseny, Spain) with the database as an example. In the result table, most of the samples in the database with a score greater than 0.9 are shown as “HOA”. An interesting observation that appears is that some cooking organic aerosol (COA) factors also showed a high correlation with our HOA factor. The COA factor is often identified by its characteristic mass fragment of 55, and it also has the same hydrocarbon ion series ( 29, 43, 57, 71, for and 41, 55, 69, for ) as the HOA (Mohr et al., 2009). The HOA factor we compared has a large 55 in the spectrum and that may be the main cause for some COA factors to score a high match. Therefore, we would conclude that our HOA factor might be mixed with cooking sources. However, in this case, if the user has HR family information of the mass spectrum, as we do here, one could have more information to interpret the result.
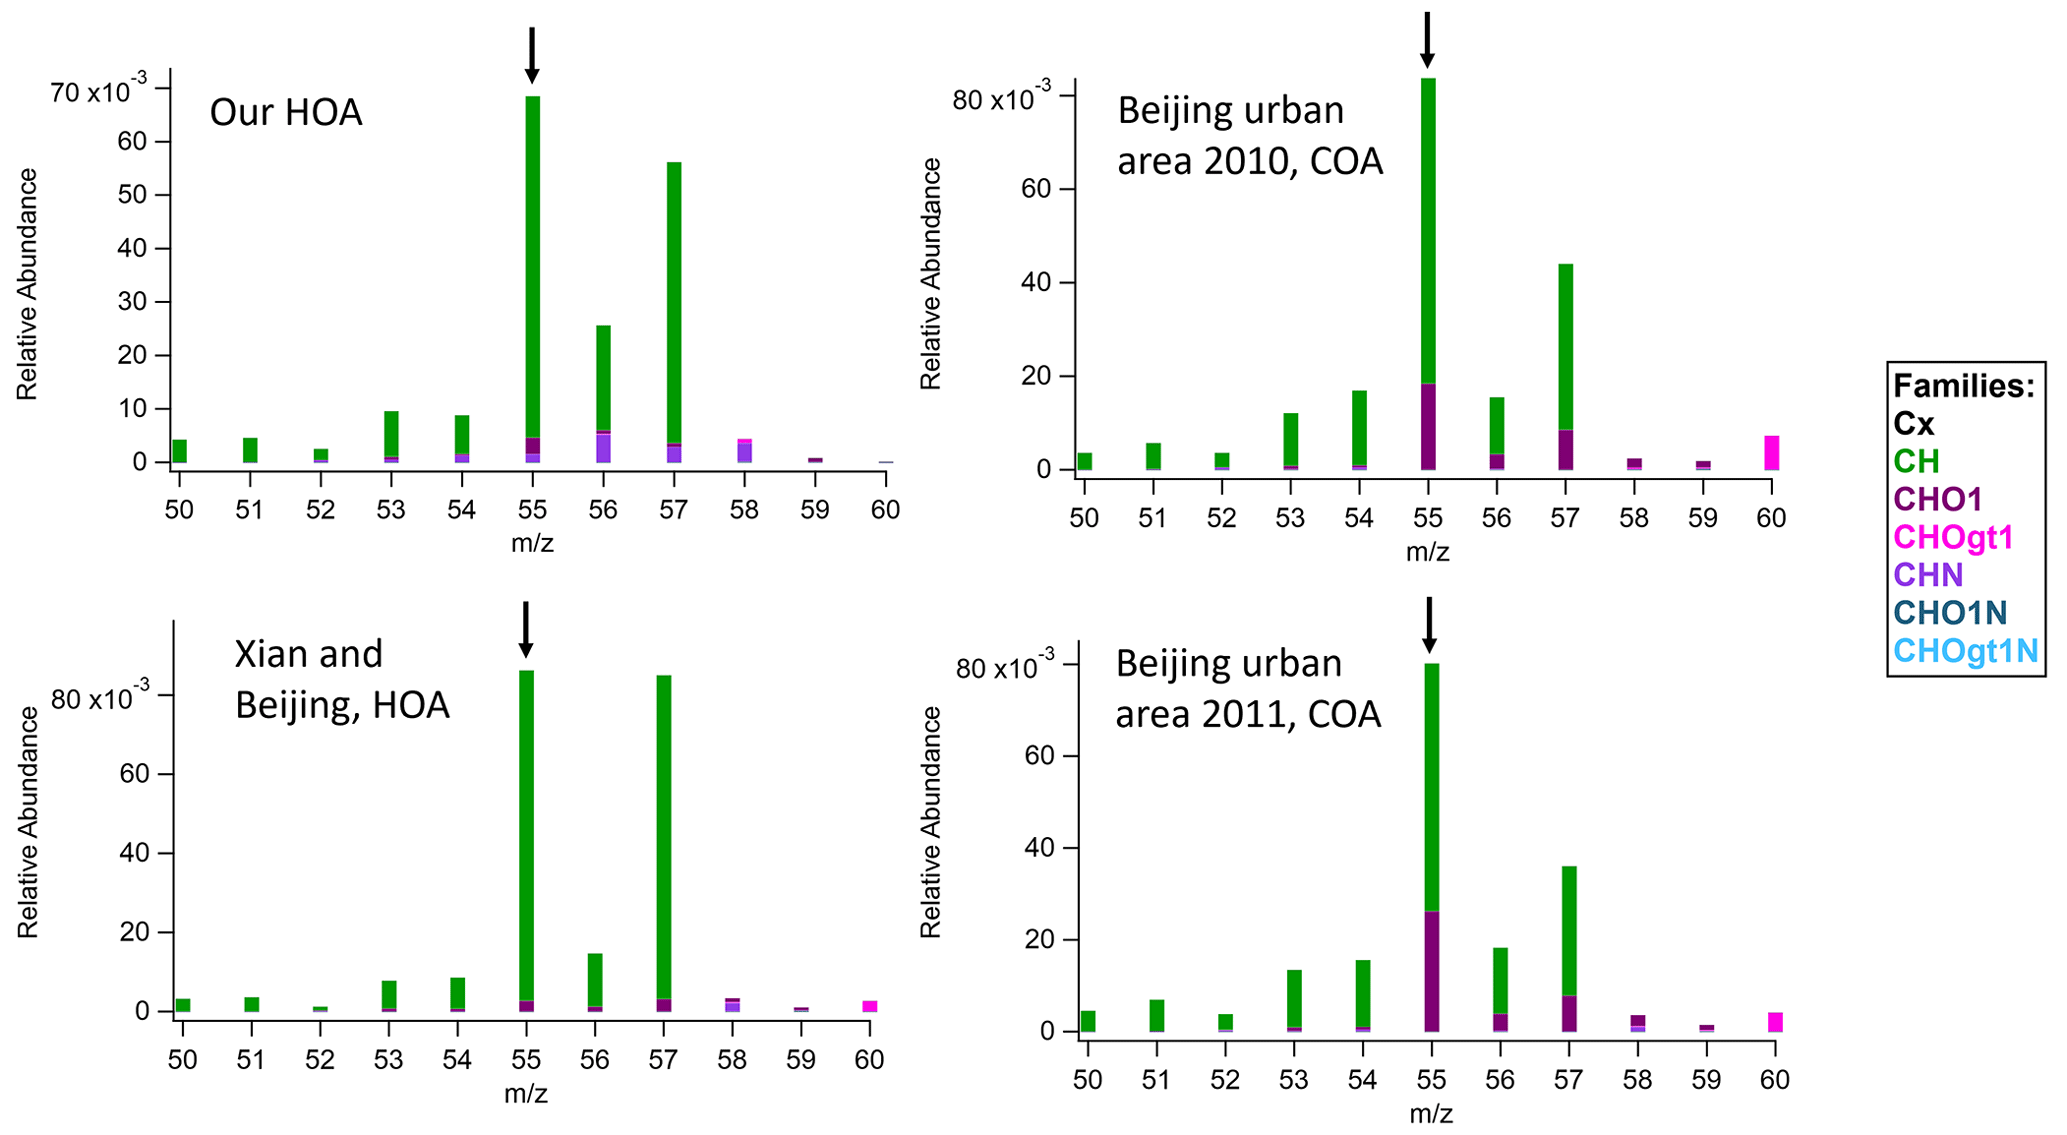
Figure 5Segments of the MS ( 50–60) for our HOA and top three reference samples that correlated highly with our HOA in the “ambient” comparison for 55 HR ion families.
COA factor MS usually have a relatively high portion of CHO1 family in 55 compared to HOA, which would be from the C3H3O+ ion (Mohr et al., 2009, 2012). Figure 5 shows the comparisons of 55 in stacked HR families with the top three reference samples in Table 1. The 55 in our HOA and Xian and Beijing HOA factor MS mainly consists of CH family, specifically , and this contribution is clearly distinguished from the COA reference MS such as Beijing urban area 2010 and 2011 having larger 55 contributions from CHO1 family, specifically C3H3O+. These trends are also shown in Mohr et al. (2012) where AMS data acquired during the field campaign DAURE in Barcelona, Spain, were analyzed, and HOA and COA were both separated as a result. The HOA factor mass spectrum in Mohr et al. (2012) also had the 55 only slightly smaller than 57. However, the 55 in their HOA factor mass spectrum is also predominantly contributed from the CH family as we observed here. Likewise, in their COA factor mass spectrum, 55 is much larger than 57, and nearly half of 55 was from the CHO1 family. Therefore, we may conclude that our HOA factor is most similar to previous “HOA” MS even if it has a high abundance of 55. However, it also suggested that additional PMF analysis with more factors could find some contribution of COA mixed in our HOA that could perhaps be separated. This comparison shows the strength of incorporating the HR families available from HR-AMS datasets as well as simple UMR ambient comparison via the panel.
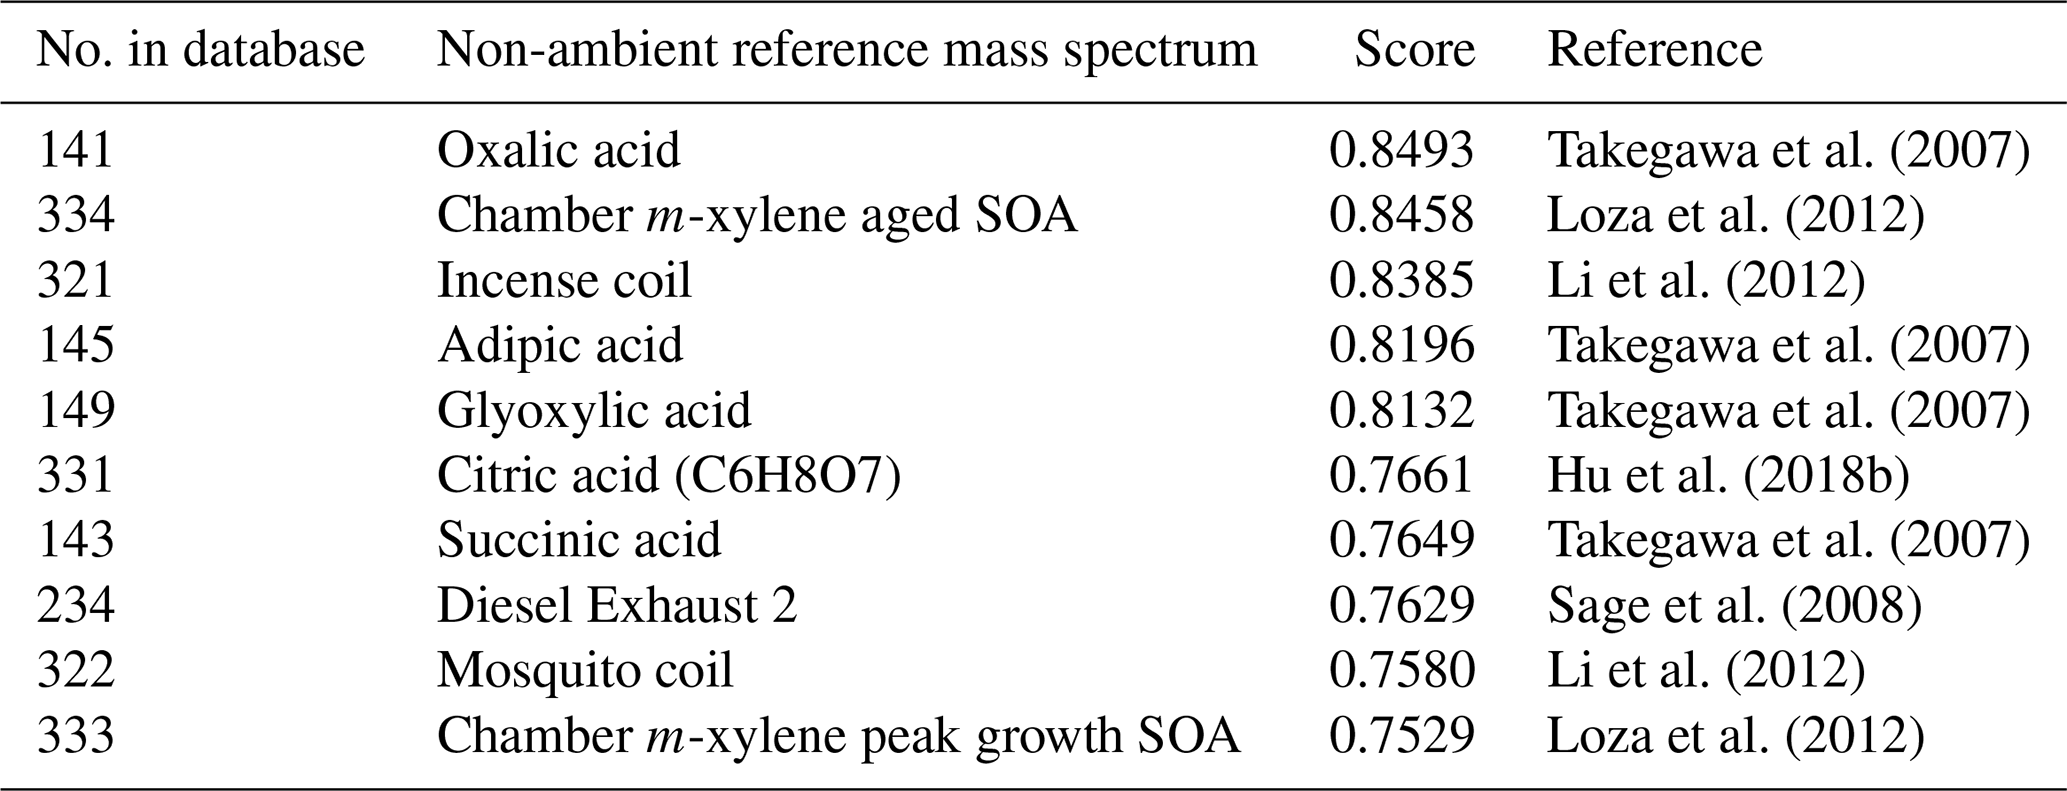
Table 2Top matches from “non-ambient” sample UMR comparison results with the BBOA factor from the DAURE campaign ( 1–200).
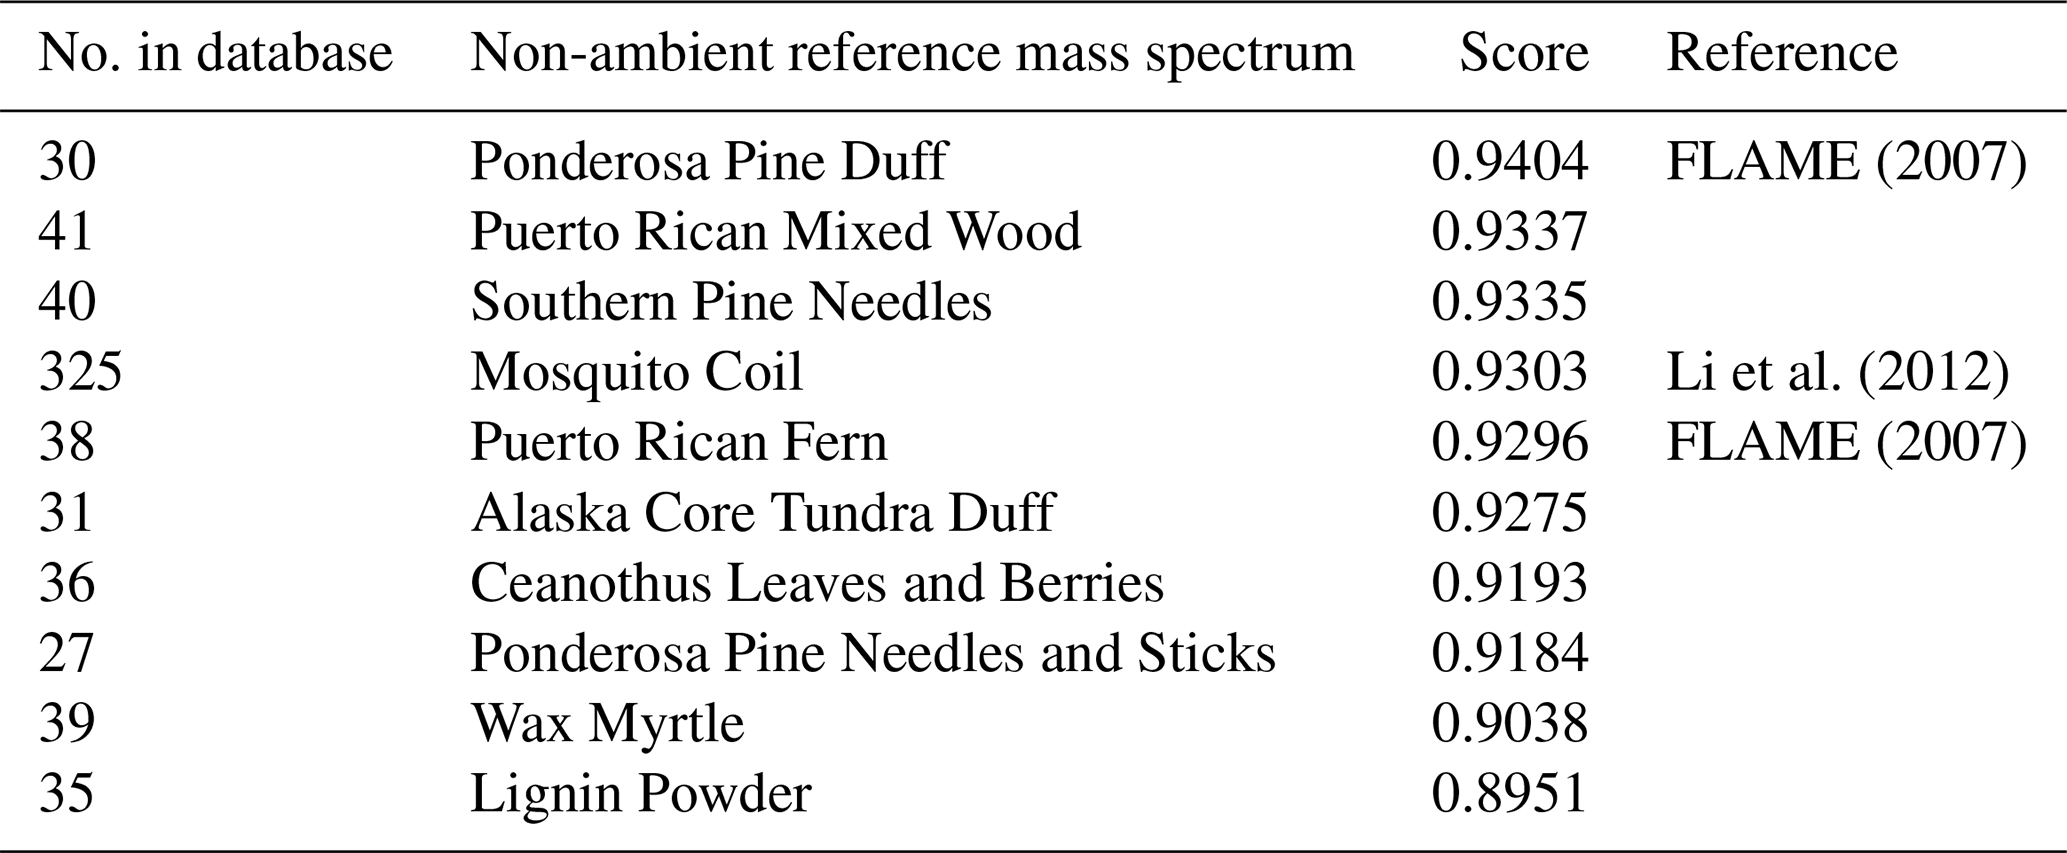
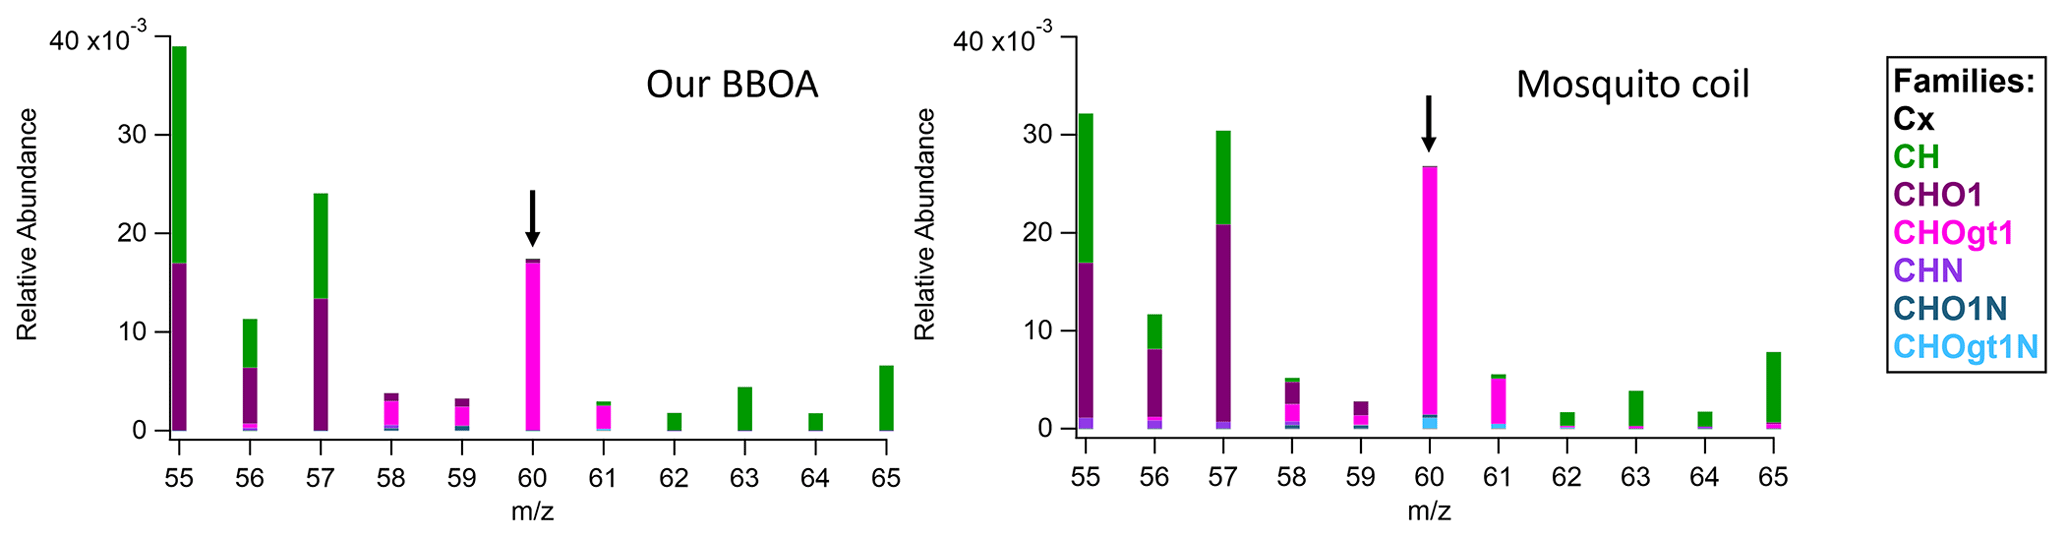
“Non-ambient” option is convenient to compare the mass spectrum of interest with laboratory samples in the database. For example, this option is helpful when comparing a mass spectrum derived from a specific source such as BBOA. When applying the non-ambient filtering option, several non-ambient reference MS were highly correlated with our BBOA MS (Table 2). The characteristic mass fragment of BBOA is 60 attributed to (from anhydrous sugars such as levoglucosan), and this specific ion was observed in most of the MS in the list of high score matches. On the HR data comparison tab, we are able to confirm whether the 60 is from the oxygenated HR family (CHOgt1). In Table 2, only the mosquito coil sample included HR ion family data, and we confirmed the 60 was mostly from CHOgt1 ion family, which is pink (Fig. 6). Since the main component of mosquito coil is biomass such as sawdust, coconut shell flour, pyrethrum, potato starch, etc, it seems to show a high correlation with our BBOA and similar HR ion family contribution in 60.
Table 3Top matches from HR “ambient” sample comparison results with the BBOA factor from the DAURE campaign ( 1–200) depending on UMR score and score with HR family (CHOgt1).
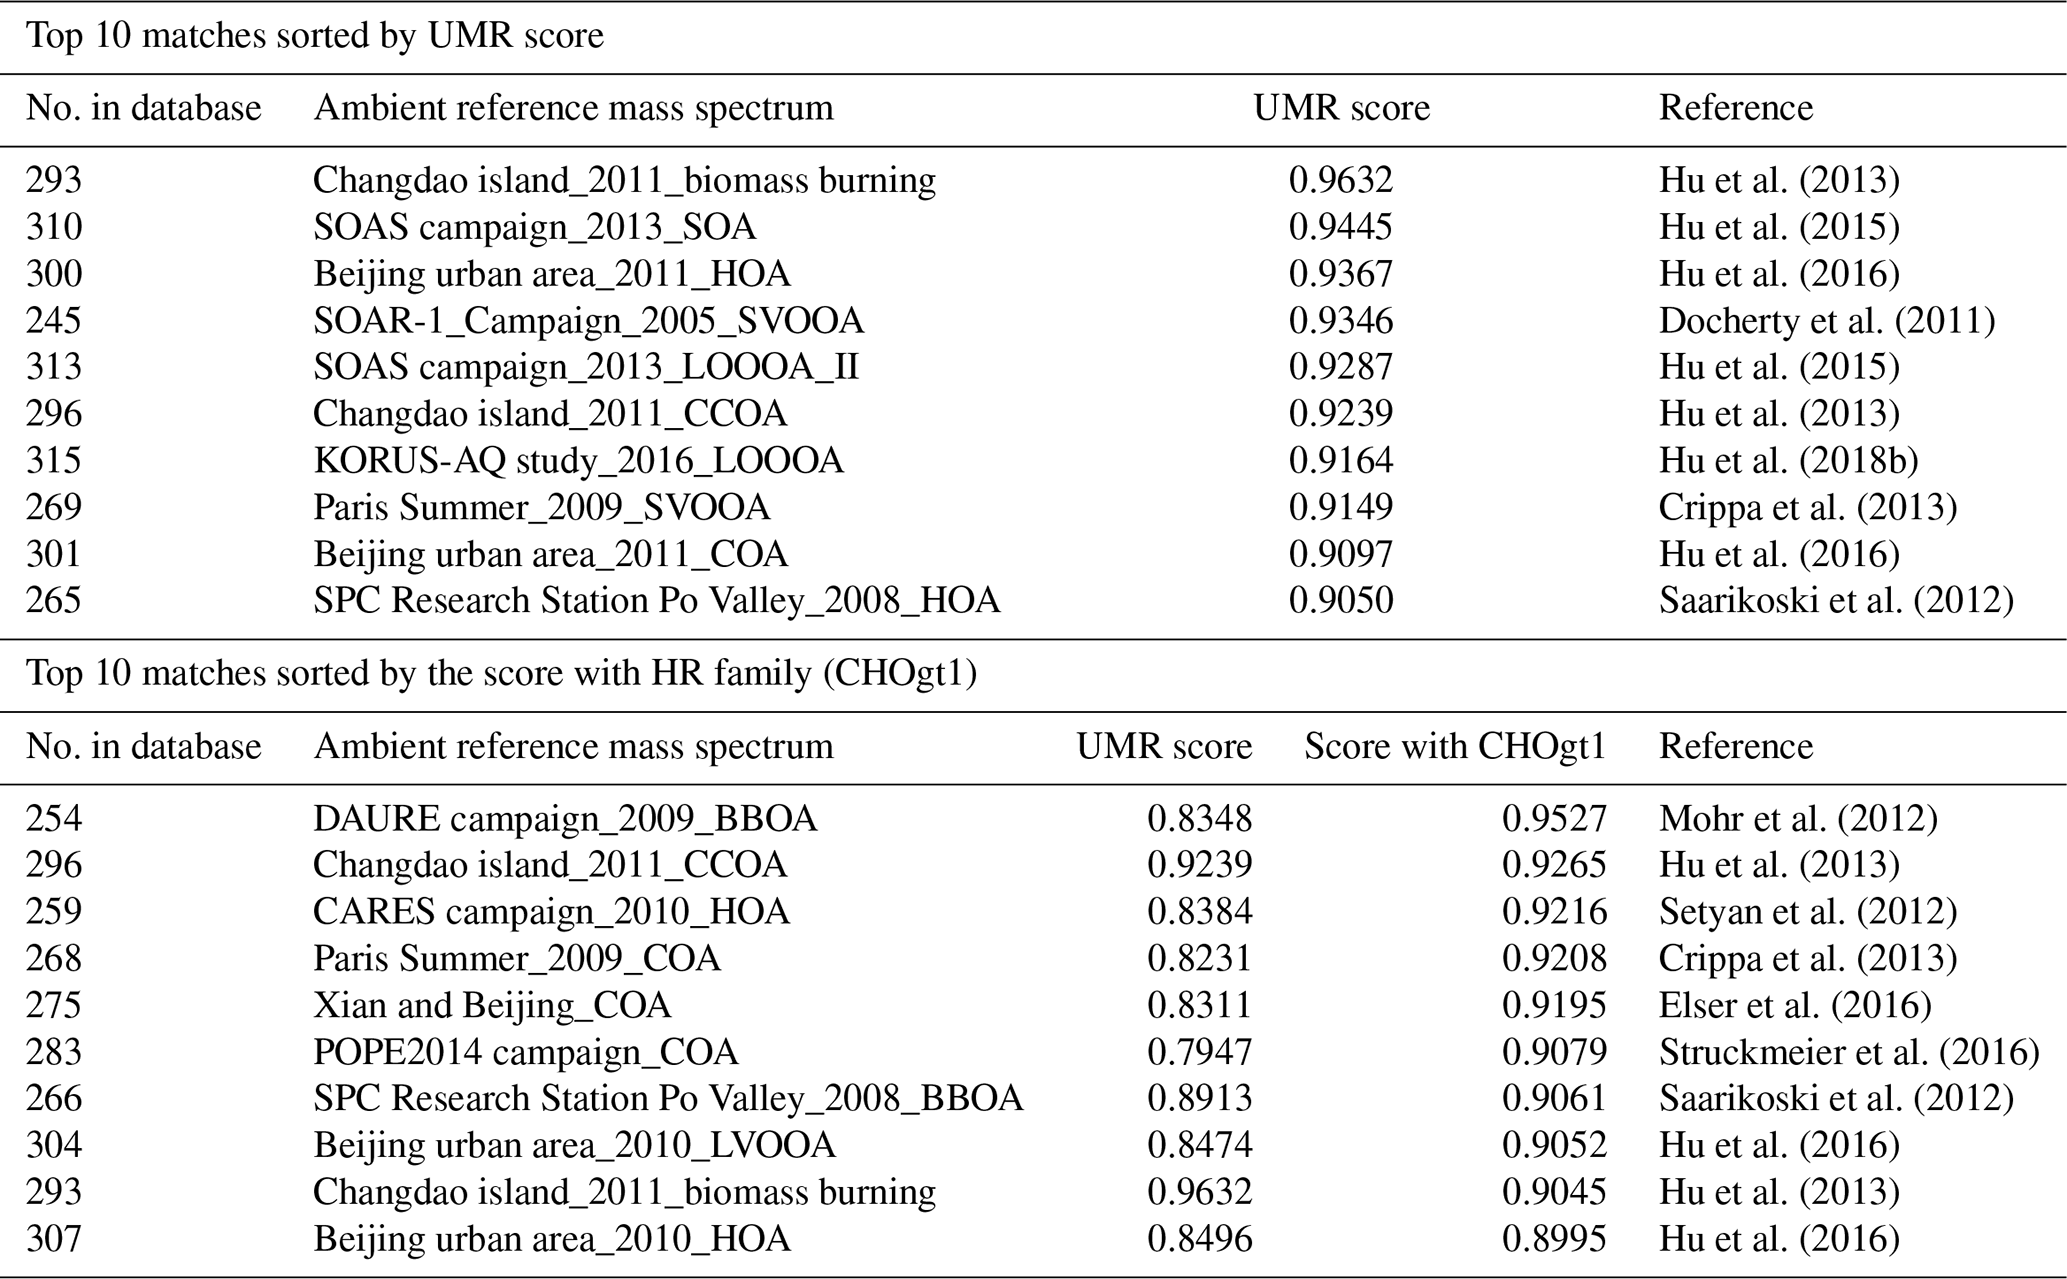
An interesting observation from BBOA example is that when carrying out the ambient sample comparison with the BBOA factor, other identifications such as HOA, SV-OOA, LO-OOA, COA, etc were observed as well as BBOA (Table 3) even though our BBOA mass spectrum was highly correlated with biomass burning laboratory references. Since ion separation of AMS mass spectrum via PMF is largely impacted by the mix of sources present at a given time, users do not always obtain a “perfectly separated” mass spectrum identifying the mass spectrum as HOA, BBOA, COA, etc, but a possibly mixed mass spectrum. It indicates that even if the UMR score on the panel is lower, it could be possible that there is a good match with a single HR family or some families, and vice versa. For this case, “score with HR family” can be a useful function to gain more information on similarities. When users select the HR families of interest next to the HR plot window and click the calculate button below HR family selection, it combines only the selected HR families into one MS, calculates a cosine similarity in the same way, and displays the results named “score with HR family” on the result table. Table 3 shows top 10 matches from ambient sample comparison results sorted by the UMR score and top 10 matches from “score with HR family”. For BBOA, the separation of the oxygenated ions provides a lot of information and is a key signature of BBOA spectra. On Table 3, we were able to observe more BBOA factor mass spectrum on the list when sorting the results by the score with CHOgt1 family including 60. Most of the new matches showed BBOA, CCOA (coal combustion OA), HOA, and COA, not OOA like when sorting the list by UMR score. UMR match scores for these reference MS are included alongside the HR family match score for comparison. We also carried out a score comparison utilizing additional HR families and family combinations (CH, CHO1, and combined), but it did not provide additional insight beyond what was observed with CHOgt1 alone (Table S2).
Table 4Top matches from UMR “non-ambient” sample comparison results with the OOA factor from the DAURE campaign (default setting, 1–200).
Lastly, users can use the “scaling mass spectrum” feature, which is especially helpful for upweighting signal intensity of larger and more unique ions by increasing the mass exponent value or decreasing the intensity exponent value. When we compared the OOA factor MS with ambient samples, we observed that our OOA factor MS was highly correlated with LV-OOA (or MO-OOA) MS from previous studies (Table S3) showing a score of more than 0.97. We also explored cosine scores of the OOA factor with non-ambient spectra within the database. However, when we compared the OOA factor MS with non-ambient samples, top scores in the list were shown as less than 0.9 (Table 4). For OOA, the abundances of fragment ions 28 (CO+) and 44 () are extremely dominant compared to other ions in the mass spectrum (typically, the 28 signal is constrained to be equal to the 44 signal). These prominent abundances of a few spectral peaks may affect score calculation. In the case of “ambient” comparison with deconvoluted MS dominated by 28 and 44, signals from other ions may not highly influence the results as shown in Table S3. On the other hand, in the case of “non-ambient” comparison with non-deconvoluted MS dominated by 28 and 44 signals of laboratory samples, signals from other ions are more unique to the specific laboratory conditions and may reflect the lower scores as shown in Table 4. In this case, we have two options to reduce these impacts on score results: (i) increase the exponent value, (ii) decrease the intensity exponent value, or (iii) both (i) and (ii) in Eq. (2).
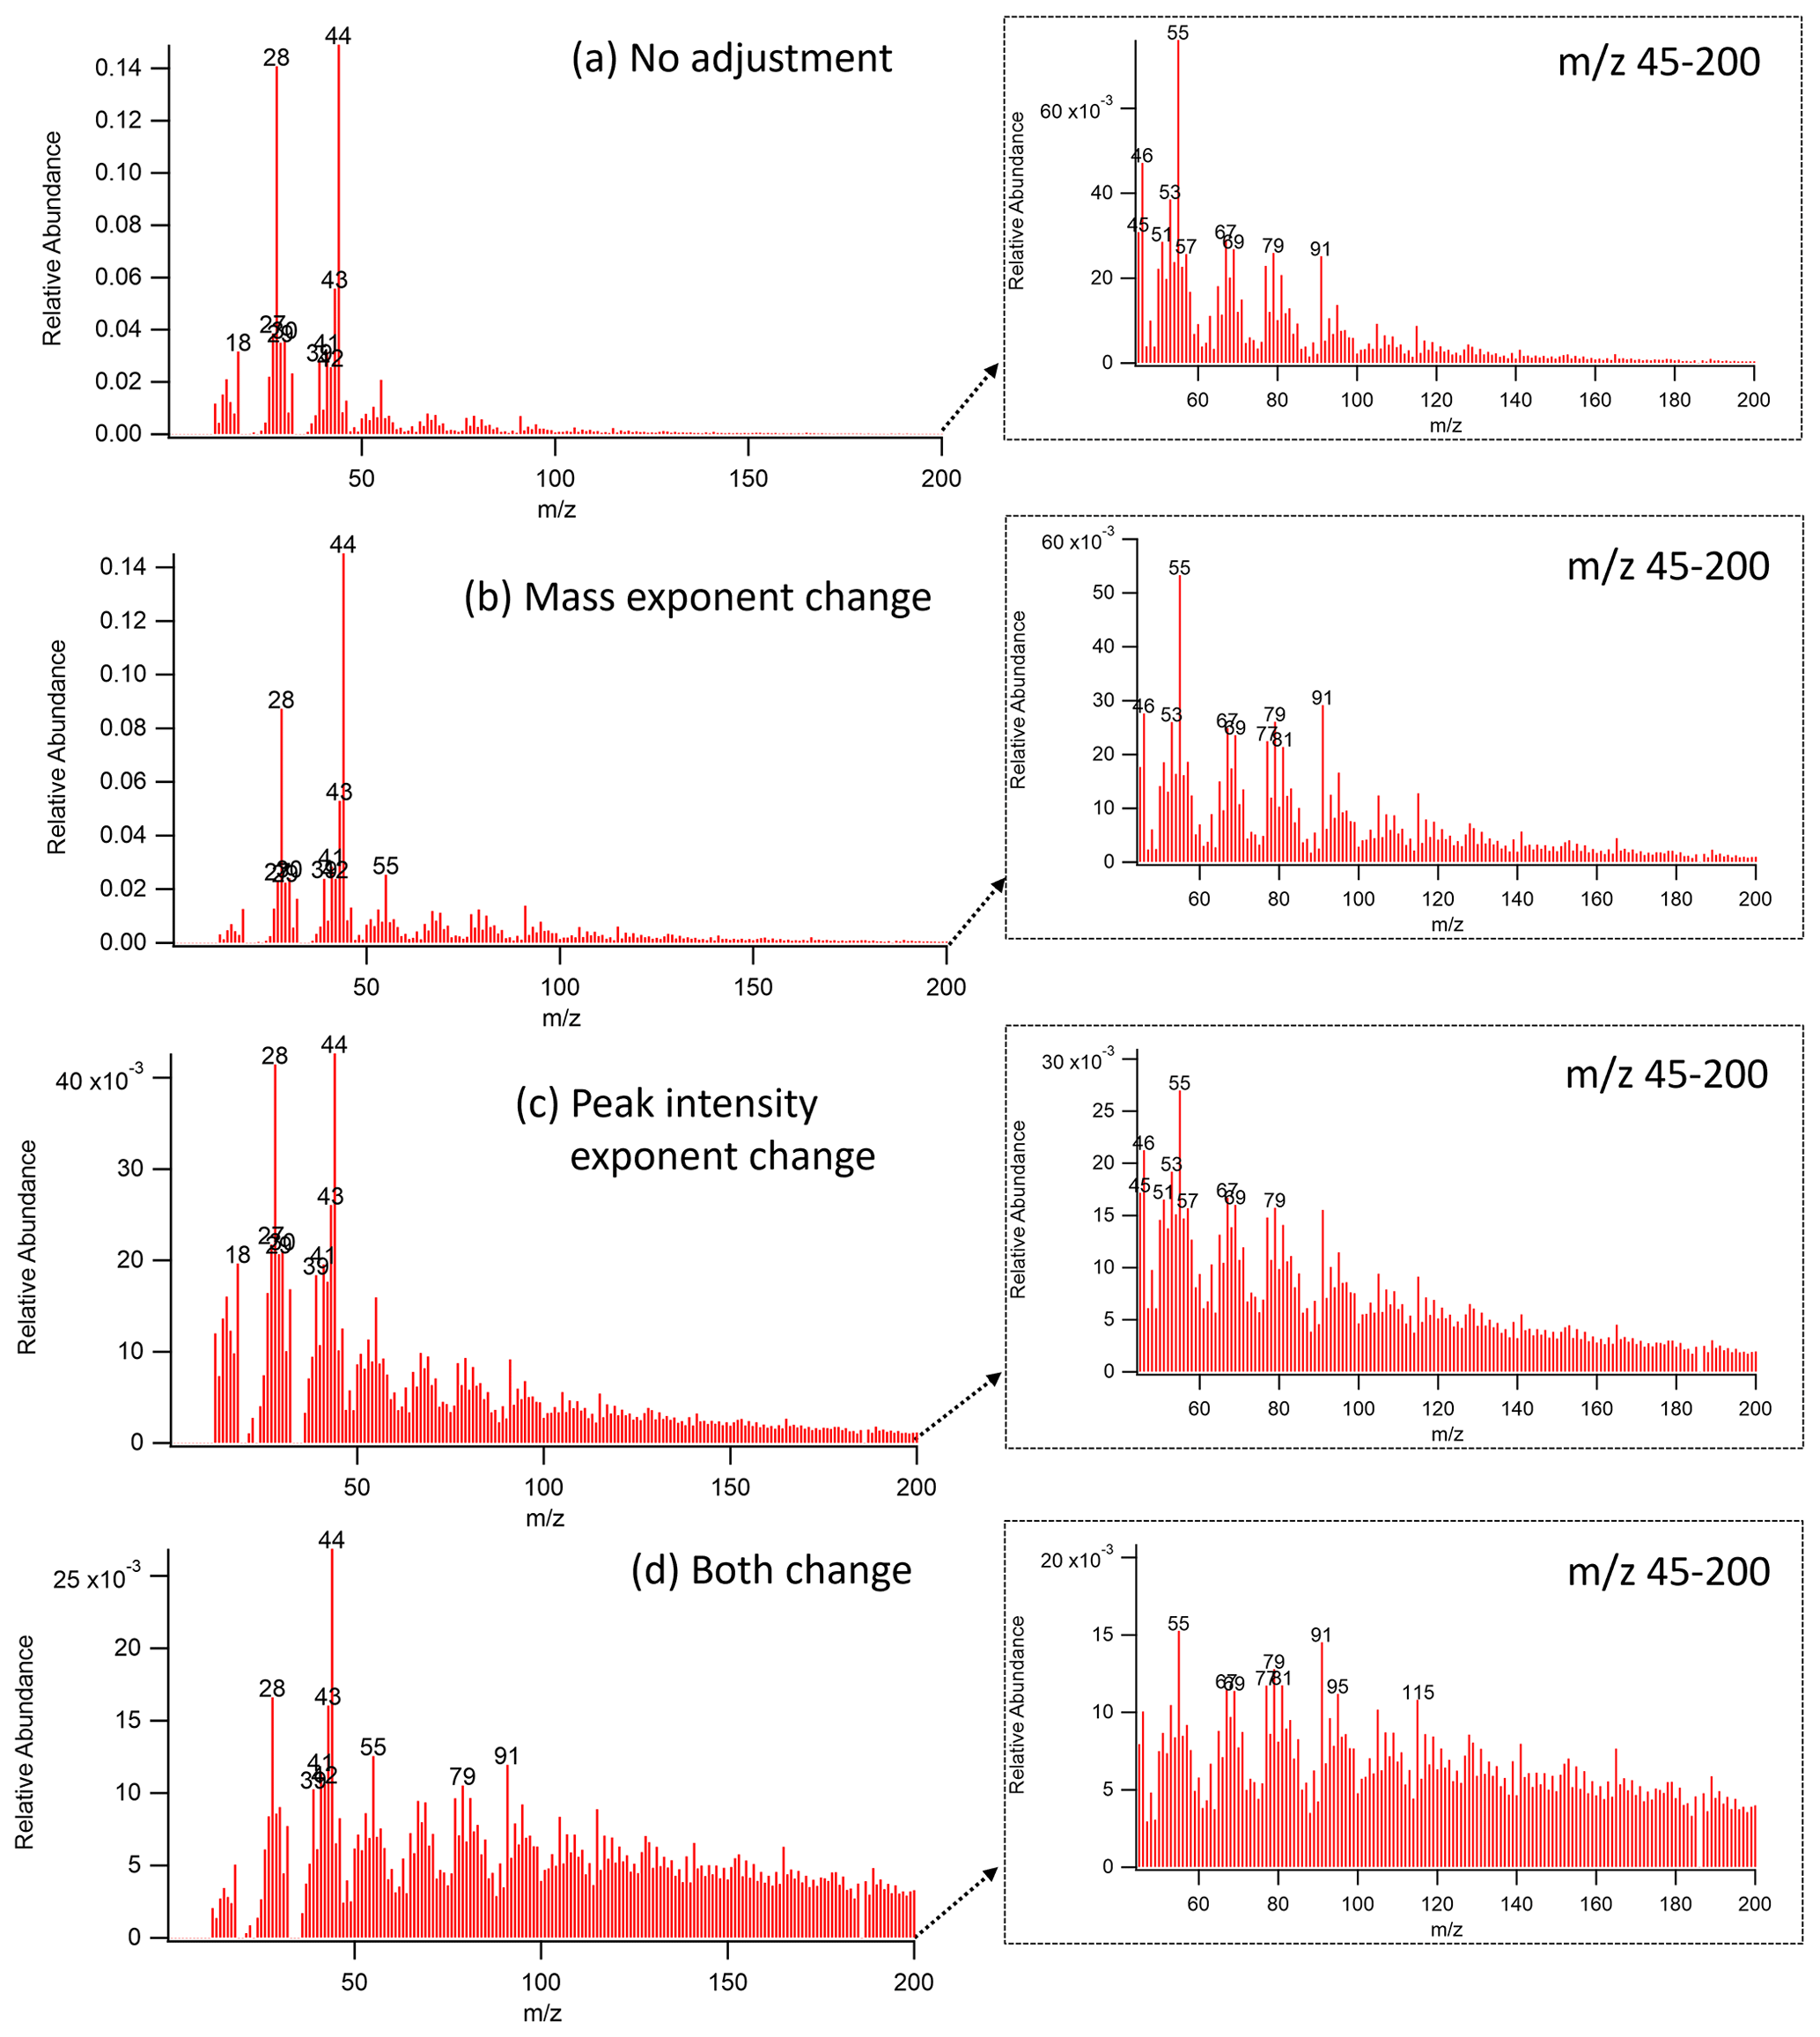
Figure 7The reweighted mass spectrum of DAURE OOA factor ((a) no adjustment, (b) increase exponent from 0 to 1, (c) decrease intensity exponent from 1 to 0.5, and (d) apply (b) and (c) simultaneously). Enlarged mass spectrum with a restricted mass range ( 45–200) shown in the dashed line box.
Table 5Top matches from “non-ambient” UMR sample comparison results with the OOA factor from the DAURE campaign depending on decreasing peak intensity exponent and increasing mass exponent. The highest score is shown in bold.
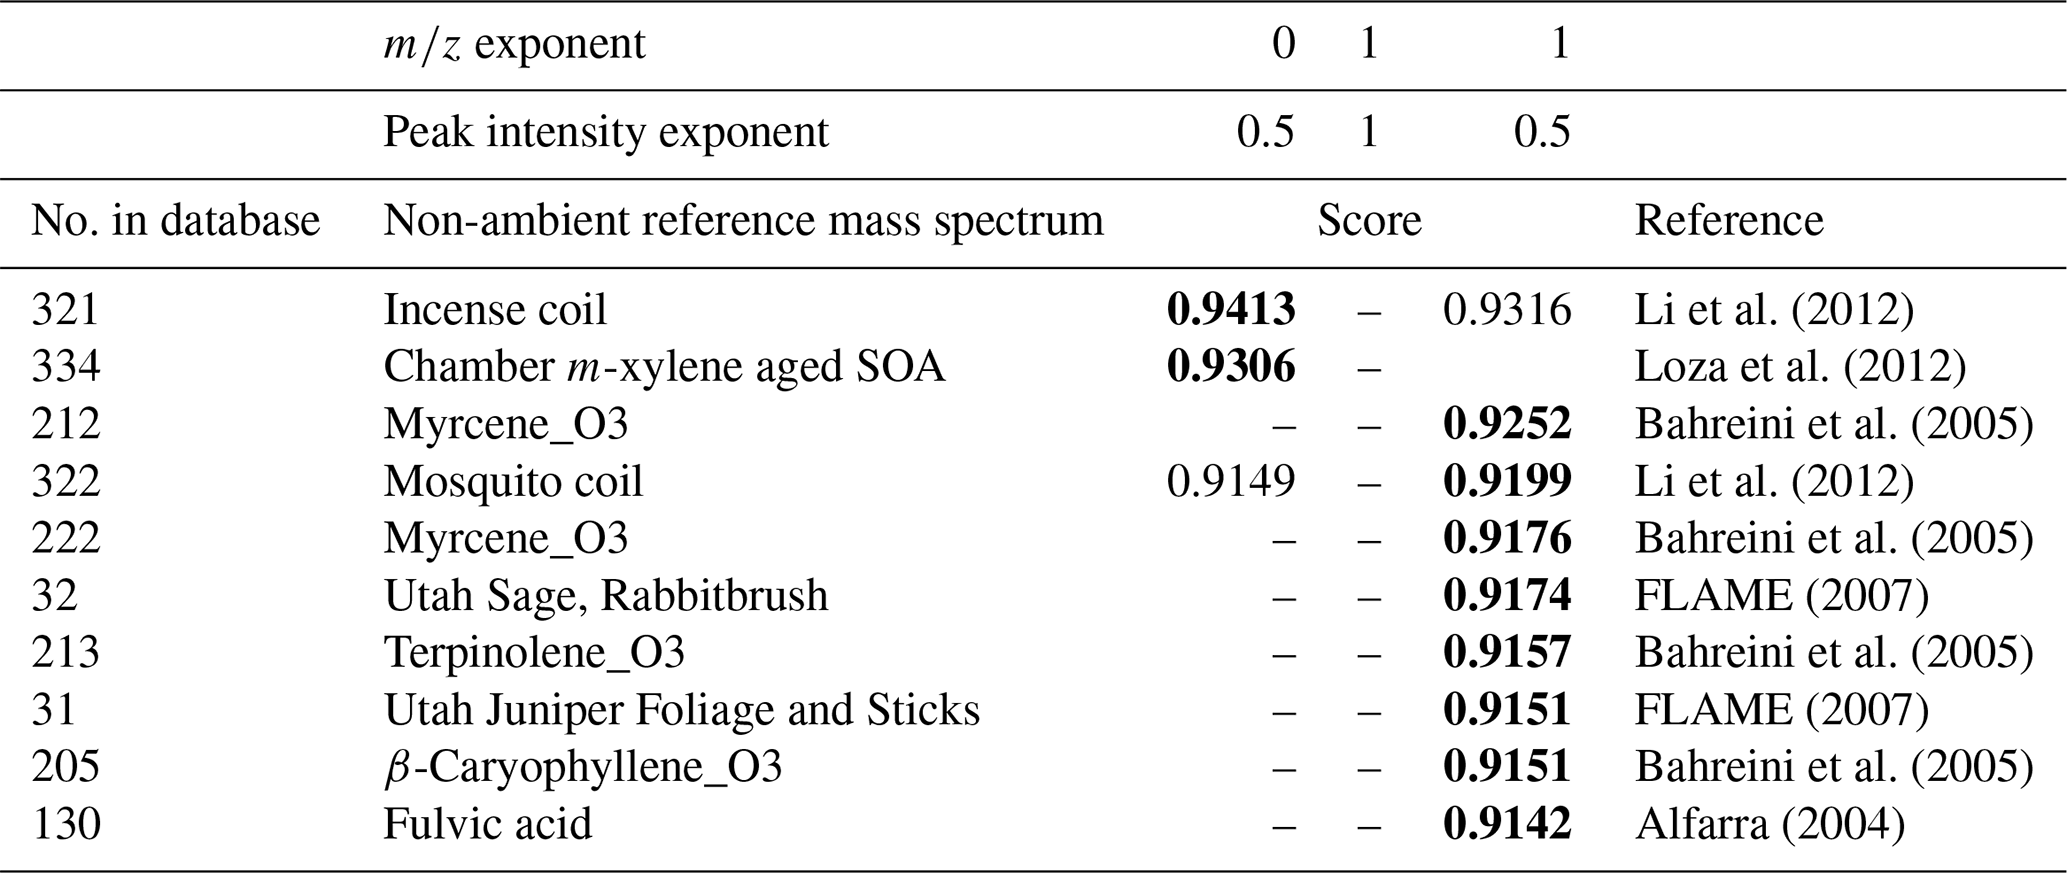
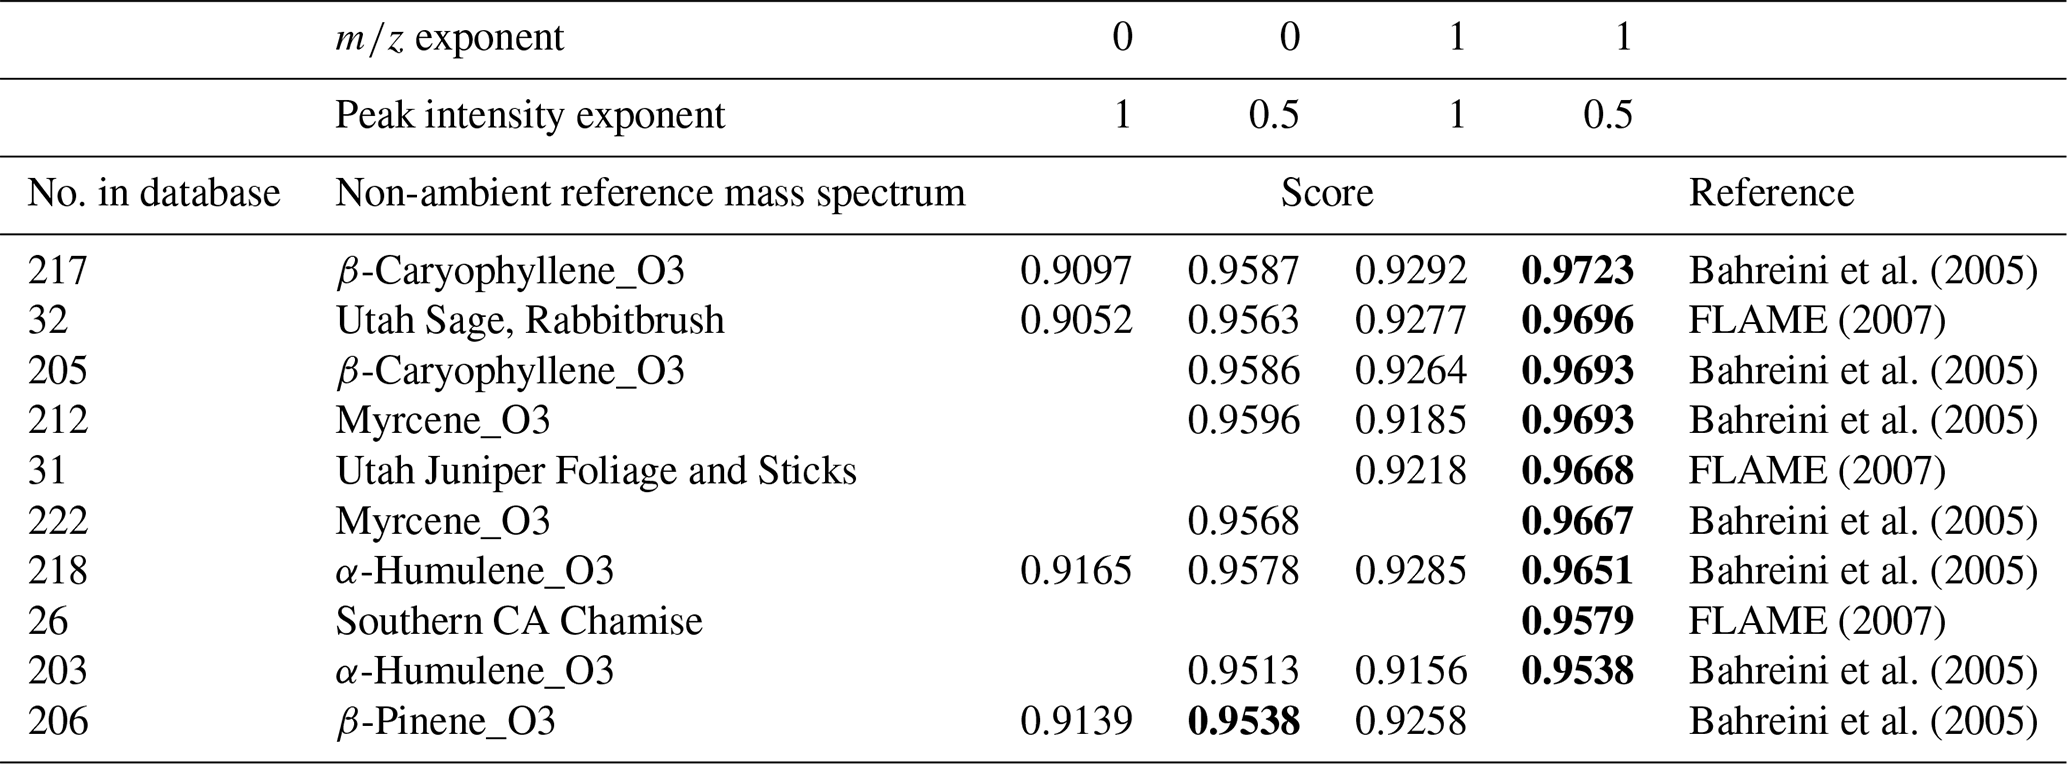
Figure 7 shows the reweighted OOA mass spectrum generated by two exponent options. When we increased the exponent from 0 to 1 (Fig. 7b), we observed that the relative abundance of lower mass fragments decreased and that of larger mass fragments in a similar scale of relative abundance as the original MS (Fig. 7a). When we decreased the peak intensity exponent from 1 to 0.5 (Fig. 7c), the maximum value of relative abundance was decreased. Signal intensities other than the dominant fragments ( 28 and 44) were more balanced than in Fig. 7a. Figure 7d is the case where we applied both mass and peak intensity exponent options. It shows the reweighted spectra with relatively smaller contributions from lower masses and higher contributions from larger masses. Table 5 shows the list of reference MS with a high correlation with our reweighted OOA factor MS with various pairs of and peak intensity exponent. The scores less than 0.9 are not shown in the table, and the reference samples are sorted by the maximum score among the values from each scenario. It shows that for our OOA factor MS, decreasing the intensity exponent option resulted in more scores greater than 0.9 compared to increasing the exponent. Also, we observed that the reweighted OOA factor mass spectrum is mostly correlated with coils, terpene ozonolysis, aged SOA, etc. Correlations to the coils may be because both incense coil and mosquito coil have fragrances that contain aromatic compounds that can produce oxygenated aromatics during combustion.
Table 6Top matches from “non-ambient” sample UMR comparison results with the reweighted OOA factor from the DAURE campaign depending on the pairs of mass and intensity exponent value with restricted mass range ( 45–200). The highest score is shown in bold.
Setting a restricted mass range is another way to modify the score. Table 6 shows the scores of our reweighted OOA MS when setting a new mass range from 45 to 200 and changing the mass and the peak intensity exponent, respectively. Increasing the mass range parameter was generally helpful to explore comparisons beyond the dominant 28 and 44 signals. Decreasing the peak intensity exponent showed higher scores in the list compared to the case of increasing the mass exponent. However, for our OOA, the mass exponent change was more useful to emphasize specific larger ions such as 55, 91, and 115 shown in the enlarged mass spectrum in a dashed box of Fig. 7b. We observed that the higher range in the reweighted OOA mass spectrum is highly correlated with terpene ozonolysis and biomass burning (Table 6).
In addition to the comparison of the combined OOA mass spectrum, we used these scaling options to check whether each of the original 6 OOA-related factors had potential characteristics to be identified before they were combined. As a result of the application of a variety of paired scalings of mass range, mass exponent value, and intensity exponent value, we observed potential characteristics between factors when using the mass range 45–200 and default exponent value (m=0, n=1) (Table S4 in the Supplement). In this case, factor 1 and factor 4 were highly correlated with the oxidation of m-xylene (an anthropogenic volatile organic compound, VOC, common in fossil fuels) and other potential ozonolysis products, and factor 5 and factor 6 were mostly correlated with terpene ozonolysis. Factor 2 and factor 3 showed relatively lower scores, but nitrogen-related MS are shown in the result table in both factors. These results suggest that we could combine factors 1 and 4, factors 2 and 3, and factors 5 and 6 as potential OOA subcategories. When we calculated cosine similarities between these pairs of factors, it showed a high correlation with the score of 0.9576, 0.9469, and 0.9838, respectively, which supports their similarities in composition. Factors 5 and 6, in particular, had characteristic fragment ion 91, which can be indicative of monoterpene oxidation matching the results we obtained. Therefore, based on a new combination of factors, we may conclude that our OOA may be mainly derived from m-xylene (anthropogenic VOC) oxidation, terpene ozonolysis, and nitrogen-related reactions. For HR data comparison, unfortunately, all non-ambient samples in this match list were originally submitted only in UMR, so HR family comparison was not available in this case. Importantly, future MS submissions from the user community should include HR MS when available.
The existing AMS and ACSM mass spectral database in web-based form has been converted into a searchable, filterable software library coupled with a comparison panel in Igor Pro, the main analysis program currently used for AMS and ACSM data. The comparison panel provides the functionality to compare the mass spectrum of interest with MS in the database statistically and visually by cosine similarity and several types of mass spectral plots as UMR or stacked HR ion families. Furthermore, the option to exponentially reweight the mass spectrum and filter the samples depending on their measurement information (e.g., lab vs. field data) can help users understand and analyze their data relative to a growing list of past observations. We believe this new database can be used to improve the efficiency of data interpretation and provide new insights for AMS and ACSM studies. However, we highlight considerations that users should keep in mind when using this tool for more accurate AMS and ACSM data interpretation. Initially, when users set a new mass range, users should take into account the maximum value of their target mass spectrum for comparison. As the maximum values (having none-zero value) of reference mass spectra in the database may vary, adjusting the mass range can impact the cosine score. In cases where there are significant signals and distinctive peaks at the higher range for the target spectrum, including the higher range may help identify spectra in the database that may be similar if they also contain the higher range. In addition, while MS are one of the AMS and ACSM data to be used for data interpretation, users should continue to consider all supporting chemical and meteorological measurements together with the AMS and ACSM MS in determining factor identities. For especially AMS users, it is important to consider the instrumental conditions of reference mass spectra in the database, such as the instrument analysis mode (e.g., W or V mode) and particle size range, as these factors can impact the mass spectrum during AMS data processing. For instrument analysis mode, in this paper, we had a limited number of V-mode spectra, which was the mode of our target spectra, so we conducted comparisons using the entire database to demonstrate the tool's functionality. However, since W-mode analysis may result in being able to more confidently fit ions due to its higher resolution than V-mode, the correlation may be different when comparing to W-mode vs. V-mode. To address this, our tool offers an instrument filtering option, which we recommend to use for more precise AMS data interpretation. Particle size range (due to different aerodynamic lens use), although not provided by this tool, can also influence the mass spectrum. To access this information, users can utilize the metadata and reference paper available online via the panel. We encourage users to carefully review the reference paper for particle size details and, if needed, additional information such as a fragmentation table for their data interpretation.
Lastly, the AMS and ACSM user network should further populate this digital mass spectral database in order to fully realize the potential strength of such a tool. Users can download the latest version of the database as a .h5 file and the procedure file for this tool through the GitHub link on the existing AMS database web page (https://cires1.colorado.edu/jimenez-group/AMSsd/, last access: 9 September 2023). Users can confirm the version of the database and procedure file they are using on the panel and update them by downloading files at the link. Users can also follow the listed procedures for submitting new MS to the database and refer to the user manual (see user guide section in the Supplement) to use this tool. As a variety of databases and tools (e.g., SoFi, SPECIEUROPE, and ICARUS) have been developed to enhance data analysis efficiency in the atmospheric field (Canonaco et al., 2013; Pernigotti et al., 2016; Nguyen et al., 2023), we anticipate providing a valuable database and tool for users as well. Our intention is that this database continues to grow and develop with the various types of AMS and ACSM systems in operation and can serve as a useful tool to help AMS users frame their observations against a wealth of previous observations obtained globally.
The code of AMS mass spectral database in this study was developed in the Igor Pro environment. The codes are available at https://doi.org/10.5281/zenodo.10236207 (ActlabW, 2023).
AMS mass spectra data used in this study are available at https://cires1.colorado.edu/jimenez-group/AMSsd/ (Ulbrich et al., 2009).
The supplement related to this article is available online at: https://doi.org/10.5194/amt-16-6075-2023-supplement.
SJ developed the software code and prepared the manuscript with constructive feedback from DTS and DAD. MJW conceptualized the project and framed the initial code. DTS and DAD contributed to inspecting the tool and the database. DTS, DAD, AVH, and JLJ supplied AMS mass spectral data. BJW supervised the project. All authors participated in reviewing and editing the manuscript.
The contact author has declared that none of the authors has any competing interests.
Publisher's note: Copernicus Publications remains neutral with regard to jurisdictional claims made in the text, published maps, institutional affiliations, or any other geographical representation in this paper. While Copernicus Publications makes every effort to include appropriate place names, the final responsibility lies with the authors.
Sohyeon Jeon, Michael J. Walker, and Brent J. Williams acknowledge NSF CBET for supporting this study. Donna T. Sueper, Anne V. Handschy, Douglas A. Day, and Jose L. Jimenez acknowledge support from NASA and National Science Foundation (NSF) Division of Atmospheric and Geospace Sciences (AGS).
This research has been supported by the NSF CBET (award no. 1554061), NASA (grant no. 80NSSC21K1451), and NSF AGS (grant nos. 2131914 and 2206655).
This paper was edited by Mingjin Tang and reviewed by four anonymous referees.
ActlabW: ActlabW/AMS_MS_DB: MARMOT v3.5A, Version MARMOT_v3.5A, Zenodo [code], https://doi.org/10.5281/zenodo.10236207, 2023.
Adam, T. W., Chirico, R., Clairotte, M., Elsasser, M., Manfredi, U., Martini, G., Sklorz, M., Streibel, T., Heringa, M. F., DeCarlo, P. F., Baltensperger, U., De Santi, G., Krasenbrink, A., Zimmermann, R., Prevot, A. S. H., and Astorga, C.: Application of Modern Online Instrumentation for Chemical Analysis of Gas and Particulate Phases of Exhaust at the European Commission Heavy-Duty Vehicle Emission Laboratory, Anal. Chem., 83, 67–76, https://doi.org/10.1021/ac101859u, 2011.
Aiken, A. C., DeCarlo, P. F., Kroll, J. H., Worsnop, D. R., Huffman, J. A., Docherty, K. S., Ulbrich, I. M., Mohr, C., Kimmel, J. R., Sueper, D., Sun, Y., Zhang, Q., Trimborn, A., Northway, M., Ziemann, P. J., Canagaratna, M. R., Onasch, T. B., Alfarra, M. R., Prevot, A. S. H., Dommen, J., Duplissy, J., Metzger, A., Baltensperger, U., and Jimenez, J. L.: OC and OMOC Ratios of Primary, Secondary, and Ambient Organic Aerosols with High-Resolution Time-of-Flight Aerosol Mass Spectrometry, Environ. Sci. Technol., 42, 4478–4485, https://doi.org/10.1021/es703009q, 2008.
Aiken, A. C., Salcedo, D., Cubison, M. J., Huffman, J. A., DeCarlo, P. F., Ulbrich, I. M., Docherty, K. S., Sueper, D., Kimmel, J. R., Worsnop, D. R., Trimborn, A., Northway, M., Stone, E. A., Schauer, J. J., Volkamer, R. M., Fortner, E., de Foy, B., Wang, J., Laskin, A., Shutthanandan, V., Zheng, J., Zhang, R., Gaffney, J., Marley, N. A., Paredes-Miranda, G., Arnott, W. P., Molina, L. T., Sosa, G., and Jimenez, J. L.: Mexico City aerosol analysis during MILAGRO using high resolution aerosol mass spectrometry at the urban supersite (T0) – Part 1: Fine particle composition and organic source apportionment, Atmos. Chem. Phys., 9, 6633–6653, https://doi.org/10.5194/acp-9-6633-2009, 2009.
Alfarra, M. R.: Insights into atmospheric organic aerosols using an aerosol mass spectrometer, PhD thesis, University of Manchester, 2004.
Alfarra, M. R., Coe, H., Allan, J. D., Bower, K. N., Boudries, H., Canagaratna, M. R., Jimenez, J. L., Jayne, J. T., Garforth, A. A., Li, S.-M., and Worsnop, D. R.: Characterization of urban and rural organic particulate in the Lower Fraser Valley using two Aerodyne Aerosol Mass Spectrometers, Atmos. Environ., 38, 5745–5758, https://doi.org/10.1016/j.atmosenv.2004.01.054, 2004.
Allan, J. D., Delia, A. E., Coe, H., Bower, K. N., Alfarra, M. R., Jimenez, J. L., Middlebrook, A. M., Drewnick, F., Onasch, T. B., Canagaratna, M. R., Jayne, J. T., and Worsnop, D. R.: A generalised method for the extraction of chemically resolved mass spectra from Aerodyne aerosol mass spectrometer data, J. Aerosol Sci., 35, 909–922, https://doi.org/10.1016/j.jaerosci.2004.02.007, 2004.
Allan, J. D., Alfarra, M. R., Bower, K. N., Coe, H., Jayne, J. T., Worsnop, D. R., Aalto, P. P., Kulmala, M., Hyötyläinen, T., Cavalli, F., and Laaksonen, A.: Size and composition measurements of background aerosol and new particle growth in a Finnish forest during QUEST 2 using an Aerodyne Aerosol Mass Spectrometer, Atmos. Chem. Phys., 6, 315–327, https://doi.org/10.5194/acp-6-315-2006, 2006.
Aurela, M., Saarikoski, S., Niemi, J. V., Canonaco, F., Prevot, A. S. H., Frey, A., Carbone, S., Kousa, A., and Hillamo, R.: Chemical and Source Characterization of Submicron Particles at Residential and Traffic Sites in the Helsinki Metropolitan Area, Finland, Aerosol Air Qual. Res., 15, 1213–1226, https://doi.org/10.4209/aaqr.2014.11.0279, 2015.
Bahreini, R., Jimenez, J. L., Wang, J., Flagan, R. C., Seinfeld, J. H., Jayne, J. T., and Worsnop, D. R.: Aircraft-based aerosol size and composition measurements during ACE-Asia using an Aerodyne aerosol mass spectrometer, J. Geophys. Res.-Atmos., 108, 8645, https://doi.org/10.1029/2002JD003226, 2003.
Bahreini, R., Keywood, M. D., Ng, N. L., Varutbangkul, V., Gao, S., Flagan, R. C., Seinfeld, J. H., Worsnop, D. R., and Jimenez, J. L.: Measurements of Secondary Organic Aerosol from Oxidation of Cycloalkenes, Terpenes, and m-Xylene Using an Aerodyne Aerosol Mass Spectrometer, Environ. Sci. Technol., 39, 5674–5688, https://doi.org/10.1021/es048061a, 2005.
Baltensperger, U., Chirico, R., DeCarlo, P. F., Dommen, J., Gaeggeler, K., Heringa, M. F., Li, M., Prévôt, A. S. H., Alfarra, M. R., Gross, D. S., and Kalberer, M.: Recent Developments in the Mass Spectrometry of Atmospheric Aerosols, Eur. J. Mass Spectrom., 16, 389–395, https://doi.org/10.1255/ejms.1084, 2010.
Bates, T. S., Quinn, P. K., Frossard, A. A., Russell, L. M., Hakala, J., Petäjä, T., Kulmala, M., Covert, D. S., Cappa, C. D., Li, S.-M., Hayden, K. L., Nuaaman, I., McLaren, R., Massoli, P., Canagaratna, M. R., Onasch, T. B., Sueper, D., Worsnop, D. R., and Keene, W. C.: Measurements of ocean derived aerosol off the coast of California, J. Geophys. Res.-Atmos., 117, D00V15, https://doi.org/10.1029/2012JD017588, 2012.
Bäumer, D., Vogel, B., Versick, S., Rinke, R., Möhler, O., and Schnaiter, M.: Relationship of visibility, aerosol optical thickness and aerosol size distribution in an ageing air mass over South-West Germany, Atmos. Environ., 42, 989–998, https://doi.org/10.1016/j.atmosenv.2007.10.017, 2008.
Boyd, C. M., Nah, T., Xu, L., Berkemeier, T., and Ng, N. L.: Secondary Organic Aerosol (SOA) from Nitrate Radical Oxidation of Monoterpenes: Effects of Temperature, Dilution, and Humidity on Aerosol Formation, Mixing, and Evaporation, Environ. Sci. Technol., 51, 7831–7841, https://doi.org/10.1021/acs.est.7b01460, 2017.
Bressi, M., Cavalli, F., Belis, C. A., Putaud, J.-P., Fröhlich, R., Martins dos Santos, S., Petralia, E., Prévôt, A. S. H., Berico, M., Malaguti, A., and Canonaco, F.: Variations in the chemical composition of the submicron aerosol and in the sources of the organic fraction at a regional background site of the Po Valley (Italy), Atmos. Chem. Phys., 16, 12875–12896, https://doi.org/10.5194/acp-16-12875-2016, 2016.
Budisulistiorini, S. H., Canagaratna, M. R., Croteau, P. L., Marth, W. J., Baumann, K., Edgerton, E. S., Shaw, S. L., Knipping, E. M., Worsnop, D. R., Jayne, J. T., Gold, A., and Surratt, J. D.: Real-Time Continuous Characterization of Secondary Organic Aerosol Derived from Isoprene Epoxydiols in Downtown Atlanta, Georgia, Using the Aerodyne Aerosol Chemical Speciation Monitor, Environ. Sci. Technol., 47, 5686–5694, https://doi.org/10.1021/es400023n, 2013.
Budisulistiorini, S. H., Canagaratna, M. R., Croteau, P. L., Baumann, K., Edgerton, E. S., Kollman, M. S., Ng, N. L., Verma, V., Shaw, S. L., Knipping, E. M., Worsnop, D. R., Jayne, J. T., Weber, R. J., and Surratt, J. D.: Intercomparison of an Aerosol Chemical Speciation Monitor (ACSM) with ambient fine aerosol measurements in downtown Atlanta, Georgia, Atmos. Meas. Tech., 7, 1929–1941, https://doi.org/10.5194/amt-7-1929-2014, 2014.
Budisulistiorini, S. H., Li, X., Bairai, S. T., Renfro, J., Liu, Y., Liu, Y. J., McKinney, K. A., Martin, S. T., McNeill, V. F., Pye, H. O. T., Nenes, A., Neff, M. E., Stone, E. A., Mueller, S., Knote, C., Shaw, S. L., Zhang, Z., Gold, A., and Surratt, J. D.: Examining the effects of anthropogenic emissions on isoprene-derived secondary organic aerosol formation during the 2013 Southern Oxidant and Aerosol Study (SOAS) at the Look Rock, Tennessee ground site, Atmos. Chem. Phys., 15, 8871–8888, https://doi.org/10.5194/acp-15-8871-2015, 2015.
Budisulistiorini, S. H., Baumann, K., Edgerton, E. S., Bairai, S. T., Mueller, S., Shaw, S. L., Knipping, E. M., Gold, A., and Surratt, J. D.: Seasonal characterization of submicron aerosol chemical composition and organic aerosol sources in the southeastern United States: Atlanta, Georgia,and Look Rock, Tennessee, Atmos. Chem. Phys., 16, 5171–5189, https://doi.org/10.5194/acp-16-5171-2016, 2016.
Canagaratna, M. R., Jayne, J. T., Ghertner, D. A., Herndon, S., Shi, Q., Jimenez, J. L., Silva, P. J., Williams, P., Lanni, T., Drewnick, F., Demerjian, K. L., Kolb, C. E., and Worsnop, D. R.: Chase Studies of Particulate Emissions from in-use New York City Vehicles, Aerosol Sci. Tech., 38, 555–573, https://doi.org/10.1080/02786820490465504, 2004.
Canagaratna, M. R., Jayne, J. T., Jimenez, J. L., Allan, J. D., Alfarra, M. R., Zhang, Q., Onasch, T. B., Drewnick, F., Coe, H., Middlebrook, A., Delia, A., Williams, L. R., Trimborn, A. M., Northway, M. J., DeCarlo, P. F., Kolb, C. E., Davidovits, P., and Worsnop, D. R.: Chemical and microphysical characterization of ambient aerosols with the aerodyne aerosol mass spectrometer, Mass Spectrom. Rev., 26, 185–222, https://doi.org/10.1002/mas.20115, 2007.
Canonaco, F., Crippa, M., Slowik, J. G., Baltensperger, U., and Prévôt, A. S. H.: SoFi, an IGOR-based interface for the efficient use of the generalized multilinear engine (ME-2) for the source apportionment: ME-2 application to aerosol mass spectrometer data, Atmos. Meas. Tech., 6, 3649–3661, https://doi.org/10.5194/amt-6-3649-2013, 2013.
Canonaco, F., Slowik, J. G., Baltensperger, U., and Prévôt, A. S. H.: Seasonal differences in oxygenated organic aerosol composition: implications for emissions sources and factor analysis, Atmos. Chem. Phys., 15, 6993–7002, https://doi.org/10.5194/acp-15-6993-2015, 2015.
Carbone, S., Saarikoski, S., Frey, A., Reyes, F., Reyes, P., Castillo, M., Gramsch, E., Oyola, P., Jayne, J., Worsnop, D. R., and Hillamo, R.: Chemical Characterization of Submicron Aerosol Particles in Santiago de Chile, Aerosol Air Qual. Res., 13, 462–473, https://doi.org/10.4209/aaqr.2012.10.0261, 2013.
Chhabra, P. S., Flagan, R. C., and Seinfeld, J. H.: Elemental analysis of chamber organic aerosol using an aerodyne high-resolution aerosol mass spectrometer, Atmos. Chem. Phys., 10, 4111–4131, https://doi.org/10.5194/acp-10-4111-2010, 2010.
Chirico, R., DeCarlo, P. F., Heringa, M. F., Tritscher, T., Richter, R., Prévôt, A. S. H., Dommen, J., Weingartner, E., Wehrle, G., Gysel, M., Laborde, M., and Baltensperger, U.: Impact of aftertreatment devices on primary emissions and secondary organic aerosol formation potential from in-use diesel vehicles: results from smog chamber experiments, Atmos. Chem. Phys., 10, 11545–11563, https://doi.org/10.5194/acp-10-11545-2010, 2010.
Claeys, M., Roberts, G., Mallet, M., Arndt, J., Sellegri, K., Sciare, J., Wenger, J., and Sauvage, B.: Optical, physical and chemical properties of aerosols transported to a coastal site in the western Mediterranean: a focus on primary marine aerosols, Atmos. Chem. Phys., 17, 7891–7915, https://doi.org/10.5194/acp-17-7891-2017, 2017.
Cleveland, M. J., Ziemba, L. D., Griffin, R. J., Dibb, J. E., Anderson, C. H., Lefer, B., and Rappenglück, B.: Characterization of urban aerosol using aerosol mass spectrometry and proton nuclear magnetic resonance spectroscopy, Atmos. Environ., 54, 511–518, https://doi.org/10.1016/j.atmosenv.2012.02.074, 2012.
Coggon, M. M., Sorooshian, A., Wang, Z., Metcalf, A. R., Frossard, A. A., Lin, J. J., Craven, J. S., Nenes, A., Jonsson, H. H., Russell, L. M., Flagan, R. C., and Seinfeld, J. H.: Ship impacts on the marine atmosphere: insights into the contribution of shipping emissions to the properties of marine aerosol and clouds, Atmos. Chem. Phys., 12, 8439–8458, https://doi.org/10.5194/acp-12-8439-2012, 2012.
Collier, S., Zhou, S., Kuwayama, T., Forestieri, S., Brady, J., Zhang, M., Kleeman, M., Cappa, C., Bertram, T., and Zhang, Q.: Organic PM Emissions from Vehicles: Composition, OC Ratio, and Dependence on PM Concentration, Aerosol Sci. Tech., 49, 86–97, https://doi.org/10.1080/02786826.2014.1003364, 2015.
Crippa, M., El Haddad, I., Slowik, J. G., DeCarlo, P. F., Mohr, C., Heringa, M. F., Chirico, R., Marchand, N., Sciare, J., Baltensperger, U., and Prévôt, A. S. H.: Identification of marine and continental aerosol sources in Paris using high resolution aerosol mass spectrometry, J. Geophys. Res.-Atmos., 118, 1950–1963, https://doi.org/10.1002/jgrd.50151, 2013.
Dall'Osto, M., Ovadnevaite, J., Ceburnis, D., Martin, D., Healy, R. M., O'Connor, I. P., Kourtchev, I., Sodeau, J. R., Wenger, J. C., and O'Dowd, C.: Characterization of urban aerosol in Cork city (Ireland) using aerosol mass spectrometry, Atmos. Chem. Phys., 13, 4997–5015, https://doi.org/10.5194/acp-13-4997-2013, 2013.
Day, D. A., Fry, J. L., Kang, H. G., Krechmer, J. E., Ayres, B. R., Keehan, N. I., Thompson, S. L., Hu, W., Campuzano-Jost, P., Schroder, J. C., Stark, H., DeVault, M. P., Ziemann, P. J., Zarzana, K. J., Wild, R. J., Dubè, W. P., Brown, S. S., and Jimenez, J. L.: Secondary Organic Aerosol Mass Yields from NO3 Oxidation of α-Pinene and Δ-Carene: Effect of RO2 Radical Fate, J. Phys. Chem. A, 126, 7309–7330, https://doi.org/10.1021/acs.jpca.2c04419, 2022.
De Gouw, J. and Jimenez, J. L.: Organic Aerosols in the Earth's Atmosphere, Environ. Sci. Technol., 43, 7614–7618, https://doi.org/10.1021/es9006004, 2009.
DeCarlo, P. F., Kimmel, J. R., Trimborn, A., Northway, M. J., Jayne, J. T., Aiken, A. C., Gonin, M., Fuhrer, K., Horvath, T., Docherty, K. S., Worsnop, D. R., and Jimenez, J. L.: Field-Deployable, High-Resolution, Time-of-Flight Aerosol Mass Spectrometer, Anal. Chem., 78, 8281–8289, https://doi.org/10.1021/ac061249n, 2006.
Docherty, K. S., Aiken, A. C., Huffman, J. A., Ulbrich, I. M., DeCarlo, P. F., Sueper, D., Worsnop, D. R., Snyder, D. C., Peltier, R. E., Weber, R. J., Grover, B. D., Eatough, D. J., Williams, B. J., Goldstein, A. H., Ziemann, P. J., and Jimenez, J. L.: The 2005 Study of Organic Aerosols at Riverside (SOAR-1): instrumental intercomparisons and fine particle composition, Atmos. Chem. Phys., 11, 12387–12420, https://doi.org/10.5194/acp-11-12387-2011, 2011.
Drewnick, F., Böttger, T., von der Weiden-Reinmüller, S.-L., Zorn, S. R., Klimach, T., Schneider, J., and Borrmann, S.: Design of a mobile aerosol research laboratory and data processing tools for effective stationary and mobile field measurements, Atmos. Meas. Tech., 5, 1443–1457, https://doi.org/10.5194/amt-5-1443-2012, 2012.
Elser, M., Huang, R.-J., Wolf, R., Slowik, J. G., Wang, Q., Canonaco, F., Li, G., Bozzetti, C., Daellenbach, K. R., Huang, Y., Zhang, R., Li, Z., Cao, J., Baltensperger, U., El-Haddad, I., and Prévôt, A. S. H.: New insights into PM2.5 chemical composition and sources in two major cities in China during extreme haze events using aerosol mass spectrometry, Atmos. Chem. Phys., 16, 3207–3225, https://doi.org/10.5194/acp-16-3207-2016, 2016.
FLAME: http://chem.atmos.colostate.edu/FLAME/ (last access: 9 September 2023), 2007.
Fortenberry, C. F., Walker, M. J., Zhang, Y., Mitroo, D., Brune, W. H., and Williams, B. J.: Bulk and molecular-level characterization of laboratory-aged biomass burning organic aerosol from oak leaf and heartwood fuels, Atmos. Chem. Phys., 18, 2199–2224, https://doi.org/10.5194/acp-18-2199-2018, 2018.
Fröhlich, R., Cubison, M. J., Slowik, J. G., Bukowiecki, N., Prévôt, A. S. H., Baltensperger, U., Schneider, J., Kimmel, J. R., Gonin, M., Rohner, U., Worsnop, D. R., and Jayne, J. T.: The ToF-ACSM: a portable aerosol chemical speciation monitor with TOFMS detection, Atmos. Meas. Tech., 6, 3225–3241, https://doi.org/10.5194/amt-6-3225-2013, 2013.
Fröhlich, R., Crenn, V., Setyan, A., Belis, C. A., Canonaco, F., Favez, O., Riffault, V., Slowik, J. G., Aas, W., Aijälä, M., Alastuey, A., Artiñano, B., Bonnaire, N., Bozzetti, C., Bressi, M., Carbone, C., Coz, E., Croteau, P. L., Cubison, M. J., Esser-Gietl, J. K., Green, D. C., Gros, V., Heikkinen, L., Herrmann, H., Jayne, J. T., Lunder, C. R., Minguillón, M. C., Močnik, G., O'Dowd, C. D., Ovadnevaite, J., Petralia, E., Poulain, L., Priestman, M., Ripoll, A., Sarda-Estève, R., Wiedensohler, A., Baltensperger, U., Sciare, J., and Prévôt, A. S. H.: ACTRIS ACSM intercomparison – Part 2: Intercomparison of ME-2 organic source apportionment results from 15 individual, co-located aerosol mass spectrometers, Atmos. Meas. Tech., 8, 2555–2576, https://doi.org/10.5194/amt-8-2555-2015, 2015a.
Fröhlich, R., Cubison, M. J., Slowik, J. G., Bukowiecki, N., Canonaco, F., Croteau, P. L., Gysel, M., Henne, S., Herrmann, E., Jayne, J. T., Steinbacher, M., Worsnop, D. R., Baltensperger, U., and Prévôt, A. S. H.: Fourteen months of on-line measurements of the non-refractory submicron aerosol at the Jungfraujoch (3580 m a.s.l.) – chemical composition, origins and organic aerosol sources, Atmos. Chem. Phys., 15, 11373–11398, https://doi.org/10.5194/acp-15-11373-2015, 2015b.
Goldstein, A. H. and Galbally, I. E.: Known and unexplored organic constituents in the earth's atmosphere, Environ. Sci. Technol., 41, 1514–1521, 2007.
Hao, L. Q., Kortelainen, A., Romakkaniemi, S., Portin, H., Jaatinen, A., Leskinen, A., Komppula, M., Miettinen, P., Sueper, D., Pajunoja, A., Smith, J. N., Lehtinen, K. E. J., Worsnop, D. R., Laaksonen, A., and Virtanen, A.: Atmospheric submicron aerosol composition and particulate organic nitrate formation in a boreal forestland–urban mixed region, Atmos. Chem. Phys., 14, 13483–13495, https://doi.org/10.5194/acp-14-13483-2014, 2014.
Hayes, P. L., Ortega, A. M., Cubison, M. J., Froyd, K. D., Zhao, Y., Cliff, S. S., Hu, W. W., Toohey, D. W., Flynn, J. H., Lefer, B. L., Grossberg, N., Alvarez, S., Rappenglück, B., Taylor, J. W., Allan, J. D., Holloway, J. S., Gilman, J. B., Kuster, W. C., de Gouw, J. A., Massoli, P., Zhang, X., Liu, J., Weber, R. J., Corrigan, A. L., Russell, L. M., Isaacman, G., Worton, D. R., Kreisberg, N. M., Goldstein, A. H., Thalman, R., Waxman, E. M., Volkamer, R., Lin, Y. H., Surratt, J. D., Kleindienst, T. E., Offenberg, J. H., Dusanter, S., Griffith, S., Stevens, P. S., Brioude, J., Angevine, W. M., and Jimenez, J. L.: Organic aerosol composition and sources in Pasadena, California, during the 2010 CalNex campaign, J. Geophys. Res.-Atmos., 118, 9233–9257, https://doi.org/10.1002/jgrd.50530, 2013.
He, L.-Y., Lin, Y., Huang, X.-F., Guo, S., Xue, L., Su, Q., Hu, M., Luan, S.-J., and Zhang, Y.-H.: Characterization of high-resolution aerosol mass spectra of primary organic aerosol emissions from Chinese cooking and biomass burning, Atmos. Chem. Phys., 10, 11535–11543, https://doi.org/10.5194/acp-10-11535-2010, 2010.
He, L.-Y., Huang, X.-F., Xue, L., Hu, M., Lin, Y., Zheng, J., Zhang, R., and Zhang, Y.-H.: Submicron aerosol analysis and organic source apportionment in an urban atmosphere in Pearl River Delta of China using high-resolution aerosol mass spectrometry, J. Geophys. Res.-Atmos., 116, D12304, https://doi.org/10.1029/2010JD014566, 2011.
Heikkinen, L., Äijälä, M., Riva, M., Luoma, K., Dällenbach, K., Aalto, J., Aalto, P., Aliaga, D., Aurela, M., Keskinen, H., Makkonen, U., Rantala, P., Kulmala, M., Petäjä, T., Worsnop, D., and Ehn, M.: Long-term sub-micrometer aerosol chemical composition in the boreal forest: inter- and intra-annual variability, Atmos. Chem. Phys., 20, 3151–3180, https://doi.org/10.5194/acp-20-3151-2020, 2020.
Heringa, M. F., DeCarlo, P. F., Chirico, R., Tritscher, T., Dommen, J., Weingartner, E., Richter, R., Wehrle, G., Prévôt, A. S. H., and Baltensperger, U.: Investigations of primary and secondary particulate matter of different wood combustion appliances with a high-resolution time-of-flight aerosol mass spectrometer, Atmos. Chem. Phys., 11, 5945–5957, https://doi.org/10.5194/acp-11-5945-2011, 2011.
Hu, W., Hu, M., Hu, W., Jimenez, J. L., Yuan, B., Chen, W., Wang, M., Wu, Y., Chen, C., Wang, Z., Peng, J., Zeng, L., and Shao, M.: Chemical composition, sources, and aging process of submicron aerosols in Beijing: Contrast between summer and winter, J. Geophys. Res.-Atmos., 121, 1955–1977, https://doi.org/10.1002/2015JD024020, 2016.
Hu, W., Day, D. A., Campuzano-Jost, P., Nault, B. A., Park, T., Lee, T., Croteau, P., Canagaratna, M. R., Jayne, J. T., Worsnop, D. R., and Jimenez, J. L.: Evaluation of the New Capture Vaporizer for Aerosol Mass Spectrometers (AMS): Elemental Composition and Source Apportionment of Organic Aerosols (OA), ACS Earth Space Chem., 2, 410–421, https://doi.org/10.1021/acsearthspacechem.8b00002, 2018a.
Hu, W., Day, D. A., Campuzano-Jost, P., Nault, B. A., Park, T., Lee, T., Croteau, P., Canagaratna, M. R., Jayne, J. T., Worsnop, D. R., and Jimenez, J. L.: Evaluation of the new capture vaporizer for aerosol mass spectrometers: Characterization of organic aerosol mass spectra, Aerosol Sci. Tech., 52, 725–739, https://doi.org/10.1080/02786826.2018.1454584, 2018b.
Hu, W. W., Hu, M., Yuan, B., Jimenez, J. L., Tang, Q., Peng, J. F., Hu, W., Shao, M., Wang, M., Zeng, L. M., Wu, Y. S., Gong, Z. H., Huang, X. F., and He, L. Y.: Insights on organic aerosol aging and the influence of coal combustion at a regional receptor site of central eastern China, Atmos. Chem. Phys., 13, 10095–10112, https://doi.org/10.5194/acp-13-10095-2013, 2013.
Hu, W. W., Campuzano-Jost, P., Palm, B. B., Day, D. A., Ortega, A. M., Hayes, P. L., Krechmer, J. E., Chen, Q., Kuwata, M., Liu, Y. J., de Sá, S. S., McKinney, K., Martin, S. T., Hu, M., Budisulistiorini, S. H., Riva, M., Surratt, J. D., St. Clair, J. M., Isaacman-Van Wertz, G., Yee, L. D., Goldstein, A. H., Carbone, S., Brito, J., Artaxo, P., de Gouw, J. A., Koss, A., Wisthaler, A., Mikoviny, T., Karl, T., Kaser, L., Jud, W., Hansel, A., Docherty, K. S., Alexander, M. L., Robinson, N. H., Coe, H., Allan, J. D., Canagaratna, M. R., Paulot, F., and Jimenez, J. L.: Characterization of a real-time tracer for isoprene epoxydiols-derived secondary organic aerosol (IEPOX-SOA) from aerosol mass spectrometer measurements, Atmos. Chem. Phys., 15, 11807–11833, https://doi.org/10.5194/acp-15-11807-2015, 2015.
Jayne, J. T., Leard, D. C., Zhang, X., Davidovits, P., Smith, K. A., Kolb, C. E., and Worsnop, D. R.: Development of an Aerosol Mass Spectrometer for Size and Composition Analysis of Submicron Particles, Aerosol Sci. Tech., 33, 49–70, https://doi.org/10.1080/027868200410840, 2000.
Jimenez, J. L., Jayne, J. T., Shi, Q., Kolb, C. E., Worsnop, D. R., Yourshaw, I., Seinfeld, J. H., Flagan, R. C., Zhang, X., Smith, K. A., Morris, J. W., and Davidovits, P.: Ambient aerosol sampling using the Aerodyne Aerosol Mass Spectrometer, J. Geophys. Res.-Atmos., 108, 8425, https://doi.org/10.1029/2001JD001213, 2003.
Kampa, M. and Castanas, E.: Human health effects of air pollution, Environ. Pollut., 151, 362–367, https://doi.org/10.1016/j.envpol.2007.06.012, 2008.
Katrib, Y., Martin, S. T., Hung, H.-M., Rudich, Y., Zhang, H., Slowik, J. G., Davidovits, P., Jayne, J. T., and Worsnop, D. R.: Products and Mechanisms of Ozone Reactions with Oleic Acid for Aerosol Particles Having Core-Shell Morphologies, J. Phys. Chem. A, 108, 6686–6695, https://doi.org/10.1021/jp049759d, 2004.
Kim, H., Zhang, Q., Bae, G.-N., Kim, J. Y., and Lee, S. B.: Sources and atmospheric processing of winter aerosols in Seoul, Korea: insights from real-time measurements using a high-resolution aerosol mass spectrometer, Atmos. Chem. Phys., 17, 2009–2033, https://doi.org/10.5194/acp-17-2009-2017, 2017.
Kommula, S. M., Upasana, P., Sharma, A., Raj, S. S., Reyes-Villegas, E., Liu, T., Allan, J. D., Jose, C., Pöhlker, M. L., Ravikrishna, R., Liu, P., Su, H., Martin, S. T., Pöschl, U., Mcfiggans, G., Coe, H., and Gunthe, S. S.: Chemical Characterization and Source Apportionment of Organic Aerosols in the Coastal City of Chennai, India: Impact of Marine Air Masses on Aerosol Chemical Composition and Potential for Secondary Organic Aerosol Formation, ACS Earth Space Chem., 5, 3197–3209, https://doi.org/10.1021/acsearthspacechem.1c00276, 2021.
Kroll, J. H., Ng, N. L., Murphy, S. M., Flagan, R. C., and Seinfeld, J. H.: Secondary organic aerosol formation from isoprene photooxidation under high-NOx conditions, Geophys. Res. Lett., 32, L18808, https://doi.org/10.1029/2005GL023637, 2005.
Kroll, J. H., Ng, N. L., Murphy, S. M., Flagan, R. C., and Seinfeld, J. H.: Secondary Organic Aerosol Formation from Isoprene Photooxidation, Environ. Sci. Technol., 40, 1869–1877, https://doi.org/10.1021/es0524301, 2006.
Lambe, A. T., Onasch, T. B., Massoli, P., Croasdale, D. R., Wright, J. P., Ahern, A. T., Williams, L. R., Worsnop, D. R., Brune, W. H., and Davidovits, P.: Laboratory studies of the chemical composition and cloud condensation nuclei (CCN) activity of secondary organic aerosol (SOA) and oxidized primary organic aerosol (OPOA), Atmos. Chem. Phys., 11, 8913–8928, https://doi.org/10.5194/acp-11-8913-2011, 2011.
Lambe, A. T., Onasch, T. B., Croasdale, D. R., Wright, J. P., Martin, A. T., Franklin, J. P., Massoli, P., Kroll, J. H., Canagaratna, M. R., Brune, W. H., Worsnop, D. R., and Davidovits, P.: Transitions from Functionalization to Fragmentation Reactions of Laboratory Secondary Organic Aerosol (SOA) Generated from the OH Oxidation of Alkane Precursors, Environ. Sci. Technol., 46, 5430–5437, https://doi.org/10.1021/es300274t, 2012.
Lambe, A. T., Chhabra, P. S., Onasch, T. B., Brune, W. H., Hunter, J. F., Kroll, J. H., Cummings, M. J., Brogan, J. F., Parmar, Y., Worsnop, D. R., Kolb, C. E., and Davidovits, P.: Effect of oxidant concentration, exposure time, and seed particles on secondary organic aerosol chemical composition and yield, Atmos. Chem. Phys., 15, 3063–3075, https://doi.org/10.5194/acp-15-3063-2015, 2015.
Lanz, V. A., Alfarra, M. R., Baltensperger, U., Buchmann, B., Hueglin, C., and Prévôt, A. S. H.: Source apportionment of submicron organic aerosols at an urban site by factor analytical modelling of aerosol mass spectra, Atmos. Chem. Phys., 7, 1503–1522, https://doi.org/10.5194/acp-7-1503-2007, 2007.
Lee, T., Choi, J., Lee, G., Ahn, J., Park, J. S., Atwood, S. A., Schurman, M., Choi, Y., Chung, Y., and Collett, J. L.: Characterization of aerosol composition, concentrations, and sources at Baengnyeong Island, Korea using an aerosol mass spectrometer, Atmos. Environ., 120, 297–306, https://doi.org/10.1016/j.atmosenv.2015.08.038, 2015.
Li, Y. J., Yeung, J. W. T., Leung, T. P. I., Lau, A. P. S., and Chan, C. K.: Characterization of Organic Particles from Incense Burning Using an Aerodyne High-Resolution Time-of-Flight Aerosol Mass Spectrometer, Aerosol Sci. Tech., 46, 654–665, https://doi.org/10.1080/02786826.2011.653017, 2012.
Lim, C. Y., Hagan, D. H., Coggon, M. M., Koss, A. R., Sekimoto, K., de Gouw, J., Warneke, C., Cappa, C. D., and Kroll, J. H.: Secondary organic aerosol formation from the laboratory oxidation of biomass burning emissions, Atmos. Chem. Phys., 19, 12797–12809, https://doi.org/10.5194/acp-19-12797-2019, 2019.
Loza, C. L., Chhabra, P. S., Yee, L. D., Craven, J. S., Flagan, R. C., and Seinfeld, J. H.: Chemical aging of m-xylene secondary organic aerosol: laboratory chamber study, Atmos. Chem. Phys., 12, 151–167, https://doi.org/10.5194/acp-12-151-2012, 2012.
Loza, C. L., Craven, J. S., Yee, L. D., Coggon, M. M., Schwantes, R. H., Shiraiwa, M., Zhang, X., Schilling, K. A., Ng, N. L., Canagaratna, M. R., Ziemann, P. J., Flagan, R. C., and Seinfeld, J. H.: Secondary organic aerosol yields of 12-carbon alkanes, Atmos. Chem. Phys., 14, 1423–1439, https://doi.org/10.5194/acp-14-1423-2014, 2014.
Marcolli, C., Canagaratna, M. R., Worsnop, D. R., Bahreini, R., de Gouw, J. A., Warneke, C., Goldan, P. D., Kuster, W. C., Williams, E. J., Lerner, B. M., Roberts, J. M., Meagher, J. F., Fehsenfeld, F. C., Marchewka, M., Bertman, S. B., and Middlebrook, A. M.: Cluster Analysis of the Organic Peaks in Bulk Mass Spectra Obtained During the 2002 New England Air Quality Study with an Aerodyne Aerosol Mass Spectrometer, Atmos. Chem. Phys., 6, 5649–5666, https://doi.org/10.5194/acp-6-5649-2006, 2006.
Masson-Delmotte, V., Zhai, P., Pirani, A., Connors, S. L., Péan, C., Berger, S., Caud, N., Chen, Y., Goldfarb, L., and Gomis, M. I.: Climate Change 2021: The Physical Science Basis. Contribution of Working Group I to the Sixth Assessment Report of the Intergovernmental Panel on Climate Change, IPCC Geneva, Switzerland, https://www.ipcc.ch/report/ar6/wg1/ (last access: 9 September 2023), 2021.
Michoud, V., Sciare, J., Sauvage, S., Dusanter, S., Léonardis, T., Gros, V., Kalogridis, C., Zannoni, N., Féron, A., Petit, J.-E., Crenn, V., Baisnée, D., Sarda-Estève, R., Bonnaire, N., Marchand, N., DeWitt, H. L., Pey, J., Colomb, A., Gheusi, F., Szidat, S., Stavroulas, I., Borbon, A., and Locoge, N.: Organic carbon at a remote site of the western Mediterranean Basin: sources and chemistry during the ChArMEx SOP2 field experiment, Atmos. Chem. Phys., 17, 8837–8865, https://doi.org/10.5194/acp-17-8837-2017, 2017.
Minguillón, M. C., Perron, N., Querol, X., Szidat, S., Fahrni, S. M., Alastuey, A., Jimenez, J. L., Mohr, C., Ortega, A. M., Day, D. A., Lanz, V. A., Wacker, L., Reche, C., Cusack, M., Amato, F., Kiss, G., Hoffer, A., Decesari, S., Moretti, F., Hillamo, R., Teinilä, K., Seco, R., Peñuelas, J., Metzger, A., Schallhart, S., Müller, M., Hansel, A., Burkhart, J. F., Baltensperger, U., and Prévôt, A. S. H.: Fossil versus contemporary sources of fine elemental and organic carbonaceous particulate matter during the DAURE campaign in Northeast Spain, Atmos. Chem. Phys., 11, 12067–12084, https://doi.org/10.5194/acp-11-12067-2011, 2011.
Minguillón, M. C., Ripoll, A., Pérez, N., Prévôt, A. S. H., Canonaco, F., Querol, X., and Alastuey, A.: Chemical characterization of submicron regional background aerosols in the western Mediterranean using an Aerosol Chemical Speciation Monitor, Atmos. Chem. Phys., 15, 6379–6391, https://doi.org/10.5194/acp-15-6379-2015, 2015.
Modini, R. L., Frossard, A. A., Ahlm, L., Russell, L. M., Corrigan, C. E., Roberts, G. C., Hawkins, L. N., Schroder, J. C., Bertram, A. K., Zhao, R., Lee, A. K. Y., Abbatt, J. P. D., Lin, J., Nenes, A., Wang, Z., Wonaschütz, A., Sorooshian, A., Noone, K. J., Jonsson, H., Seinfeld, J. H., Toom-Sauntry, D., Macdonald, A. M., and Leaitch, W. R.: Primary marine aerosol-cloud interactions off the coast of California, J. Geophys. Res.-Atmos., 120, 4282–4303, https://doi.org/10.1002/2014JD022963, 2015.
Mohr, C., Huffman, J. A., Cubison, M. J., Aiken, A. C., Docherty, K. S., Kimmel, J. R., Ulbrich, I. M., Hannigan, M., and Jimenez, J. L.: Characterization of Primary Organic Aerosol Emissions from Meat Cooking, Trash Burning, and Motor Vehicles with High-Resolution Aerosol Mass Spectrometry and Comparison with Ambient and Chamber Observations, Environ. Sci. Technol., 43, 2443–2449, https://doi.org/10.1021/es8011518, 2009.
Mohr, C., Richter, R., DeCarlo, P. F., Prévôt, A. S. H., and Baltensperger, U.: Spatial variation of chemical composition and sources of submicron aerosol in Zurich during wintertime using mobile aerosol mass spectrometer data, Atmos. Chem. Phys., 11, 7465–7482, https://doi.org/10.5194/acp-11-7465-2011, 2011.
Mohr, C., DeCarlo, P. F., Heringa, M. F., Chirico, R., Slowik, J. G., Richter, R., Reche, C., Alastuey, A., Querol, X., Seco, R., Peñuelas, J., Jiménez, J. L., Crippa, M., Zimmermann, R., Baltensperger, U., and Prévôt, A. S. H.: Identification and quantification of organic aerosol from cooking and other sources in Barcelona using aerosol mass spectrometer data, Atmos. Chem. Phys., 12, 1649–1665, https://doi.org/10.5194/acp-12-1649-2012, 2012.
Murphy, S. M., Sorooshian, A., Kroll, J. H., Ng, N. L., Chhabra, P., Tong, C., Surratt, J. D., Knipping, E., Flagan, R. C., and Seinfeld, J. H.: Secondary aerosol formation from atmospheric reactions of aliphatic amines, Atmos. Chem. Phys., 7, 2313–2337, https://doi.org/10.5194/acp-7-2313-2007, 2007.
Ng, N. L., Chhabra, P. S., Chan, A. W. H., Surratt, J. D., Kroll, J. H., Kwan, A. J., McCabe, D. C., Wennberg, P. O., Sorooshian, A., Murphy, S. M., Dalleska, N. F., Flagan, R. C., and Seinfeld, J. H.: Effect of NOx level on secondary organic aerosol (SOA) formation from the photooxidation of terpenes, Atmos. Chem. Phys., 7, 5159–5174, https://doi.org/10.5194/acp-7-5159-2007, 2007.
Ng, N. L., Kwan, A. J., Surratt, J. D., Chan, A. W. H., Chhabra, P. S., Sorooshian, A., Pye, H. O. T., Crounse, J. D., Wennberg, P. O., Flagan, R. C., and Seinfeld, J. H.: Secondary organic aerosol (SOA) formation from reaction of isoprene with nitrate radicals (NO3), Atmos. Chem. Phys., 8, 4117–4140, https://doi.org/10.5194/acp-8-4117-2008, 2008.
Ng, N. L., Herndon, S. C., Trimborn, A., Canagaratna, M. R., Croteau, P. L., Onasch, T. B., Sueper, D., Worsnop, D. R., Zhang, Q., Sun, Y. L., and Jayne, J. T.: An Aerosol Chemical Speciation Monitor (ACSM) for Routine Monitoring of the Composition and Mass Concentrations of Ambient Aerosol, Aerosol Sci. Tech., 45, 780–794, https://doi.org/10.1080/02786826.2011.560211, 2011.
Nguyen, T. B., Bates, K. H., Buenconsejo, R. S., Charan, S. M., Cavanna, E. E., Cocker, D. R. I., Day, D. A., DeVault, M. P., Donahue, N. M., Finewax, Z., Habib, L. F., Handschy, A. V., Hildebrandt Ruiz, L., Hou, C.-Y. S., Jimenez, J. L., Joo, T., Klodt, A. L., Kong, W., Le, C., Masoud, C. G., Mayernik, M. S., Ng, N. L., Nienhouse, E. J., Nizkorodov, S. A., Orlando, J. J., Post, J. J., Sturm, P. O., Thrasher, B. L., Tyndall, G. S., Seinfeld, J. H., Worley, S. J., Zhang, X., and Ziemann, P. J.: Overview of ICARUS-A Curated, Open Access, Online Repository for Atmospheric Simulation Chamber Data, ACS Earth Space Chem., 7, 1235–1246, https://doi.org/10.1021/acsearthspacechem.3c00043, 2023.
Paatero, P. and Tapper, U.: Positive matrix factorization: A non-negative factor model with optimal utilization of error estimates of data values, Environmetrics, 5, 111–126, https://doi.org/10.1002/env.3170050203, 1994.
Pandolfi, M., Querol, X., Alastuey, A., Jimenez, J. L., Jorba, O., Day, D., Ortega, A., Cubison, M. J., Comerón, A., Sicard, M., Mohr, C., Prévôt, A. S. H., Minguillón, M. C., Pey, J., Baldasano, J. M., Burkhart, J. F., Seco, R., Peñuelas, J., van Drooge, B. L., Artiñano, B., Di Marco, C., Nemitz, E., Schallhart, S., Metzger, A., Hansel, A., Lorente, J., Ng, S., Jayne, J., and Szidat, S.: Effects of sources and meteorology on particulate matter in the Western Mediterranean Basin: An overview of the DAURE campaign, J. Geophys. Res.-Atmos., 119, 4978–5010, https://doi.org/10.1002/2013JD021079, 2014.
Parworth, C., Fast, J., Mei, F., Shippert, T., Sivaraman, C., Tilp, A., Watson, T., and Zhang, Q.: Long-term measurements of submicrometer aerosol chemistry at the Southern Great Plains (SGP) using an Aerosol Chemical Speciation Monitor (ACSM), Atmos. Environ., 106, 43–55, https://doi.org/10.1016/j.atmosenv.2015.01.060, 2015.
Pernigotti, D., Belis, C. A., and Spanò, L.: SPECIEUROPE: The European data base for PM source profiles, Atmos. Pollut. Res., 7, 307–314, https://doi.org/10.1016/j.apr.2015.10.007, 2016.
Petit, J.-E., Favez, O., Sciare, J., Crenn, V., Sarda-Estève, R., Bonnaire, N., Močnik, G., Dupont, J.-C., Haeffelin, M., and Leoz-Garziandia, E.: Two years of near real-time chemical composition of submicron aerosols in the region of Paris using an Aerosol Chemical Speciation Monitor (ACSM) and a multi-wavelength Aethalometer, Atmos. Chem. Phys., 15, 2985–3005, https://doi.org/10.5194/acp-15-2985-2015, 2015.
Phinney, L., Richard Leaitch, W., Lohmann, U., Boudries, H., Worsnop, D. R., Jayne, J. T., Toom-Sauntry, D., Wadleigh, M., Sharma, S., and Shantz, N.: Characterization of the aerosol over the sub-arctic north east Pacific Ocean, Deep-Sea Res. Pt. II, 53, 2410–2433, https://doi.org/10.1016/j.dsr2.2006.05.044, 2006.
Pirjola, L., Niemi, J. V., Saarikoski, S., Aurela, M., Enroth, J., Carbone, S., Saarnio, K., Kuuluvainen, H., Kousa, A., Rönkkö, T., and Hillamo, R.: Physical and chemical characterization of urban winter-time aerosols by mobile measurements in Helsinki, Finland, Atmos. Environ., 158, 60–75, https://doi.org/10.1016/j.atmosenv.2017.03.028, 2017.
Ramanathan, V., Crutzen, P. J., Kiehl, J. T., and Rosenfeld, D.: Aerosols, Climate, and the Hydrological Cycle, Science, 294, 2119–2124, https://doi.org/10.1126/science.1064034, 2001.
Rattanavaraha, W., Canagaratna, M. R., Budisulistiorini, S. H., Croteau, P. L., Baumann, K., Canonaco, F., Prevot, A. S. H., Edgerton, E. S., Zhang, Z., Jayne, J. T., Worsnop, D. R., Gold, A., Shaw, S. L., and Surratt, J. D.: Source apportionment of submicron organic aerosol collected from Atlanta, Georgia, during 2014–2015 using the aerosol chemical speciation monitor (ACSM), Atmos. Environ., 167, 389–402, https://doi.org/10.1016/j.atmosenv.2017.07.055, 2017.
Reyes-Villegas, E., Green, D. C., Priestman, M., Canonaco, F., Coe, H., Prévôt, A. S. H., and Allan, J. D.: Organic aerosol source apportionment in London 2013 with ME-2: exploring the solution space with annual and seasonal analysis, Atmos. Chem. Phys., 16, 15545–15559, https://doi.org/10.5194/acp-16-15545-2016, 2016.
Ripoll, A., Minguillón, M. C., Pey, J., Jimenez, J. L., Day, D. A., Sosedova, Y., Canonaco, F., Prévôt, A. S. H., Querol, X., and Alastuey, A.: Long-term real-time chemical characterization of submicron aerosols at Montsec (southern Pyrenees, 1570 m a.s.l.), Atmos. Chem. Phys., 15, 2935–2951, https://doi.org/10.5194/acp-15-2935-2015, 2015.
Riva, M., Budisulistiorini, S. H., Chen, Y., Zhang, Z., D'Ambro, E. L., Zhang, X., Gold, A., Turpin, B. J., Thornton, J. A., Canagaratna, M. R., and Surratt, J. D.: Chemical Characterization of Secondary Organic Aerosol from Oxidation of Isoprene Hydroxyhydroperoxides, Environ. Sci. Technol., 50, 9889–9899, https://doi.org/10.1021/acs.est.6b02511, 2016.
Robinson, E. S., Gu, P., Ye, Q., Li, H. Z., Shah, R. U., Apte, J. S., Robinson, A. L., and Presto, A. A.: Restaurant Impacts on Outdoor Air Quality: Elevated Organic Aerosol Mass from Restaurant Cooking with Neighborhood-Scale Plume Extents, Environ. Sci. Technol., 52, 9285–9294, https://doi.org/10.1021/acs.est.8b02654, 2018.
Saarikoski, S., Carbone, S., Decesari, S., Giulianelli, L., Angelini, F., Canagaratna, M., Ng, N. L., Trimborn, A., Facchini, M. C., Fuzzi, S., Hillamo, R., and Worsnop, D.: Chemical characterization of springtime submicrometer aerosol in Po Valley, Italy, Atmos. Chem. Phys., 12, 8401–8421, https://doi.org/10.5194/acp-12-8401-2012, 2012.
Sage, A. M., Weitkamp, E. A., Robinson, A. L., and Donahue, N. M.: Evolving mass spectra of the oxidized component of organic aerosol: results from aerosol mass spectrometer analyses of aged diesel emissions, Atmos. Chem. Phys., 8, 1139–1152, https://doi.org/10.5194/acp-8-1139-2008, 2008.
Schlag, P., Kiendler-Scharr, A., Blom, M. J., Canonaco, F., Henzing, J. S., Moerman, M., Prévôt, A. S. H., and Holzinger, R.: Aerosol source apportionment from 1 year measurements at the CESAR tower in Cabauw, the Netherlands, Atmos. Chem. Phys., 16, 8831–8847, https://doi.org/10.5194/acp-16-8831-2016, 2016.
Schneider, J., Weimer, S., Drewnick, F., Borrmann, S., Helas, G., Gwaze, P., Schmid, O., Andreae, M. O., and Kirchner, U.: Mass spectrometric analysis and aerodynamic properties of various types of combustion-related aerosol particles, Int. J. Mass Spectrom., 258, 37–49, https://doi.org/10.1016/j.ijms.2006.07.008, 2006.
Setyan, A., Zhang, Q., Merkel, M., Knighton, W. B., Sun, Y., Song, C., Shilling, J. E., Onasch, T. B., Herndon, S. C., Worsnop, D. R., Fast, J. D., Zaveri, R. A., Berg, L. K., Wiedensohler, A., Flowers, B. A., Dubey, M. K., and Subramanian, R.: Characterization of submicron particles influenced by mixed biogenic and anthropogenic emissions using high-resolution aerosol mass spectrometry: results from CARES, Atmos. Chem. Phys., 12, 8131–8156, https://doi.org/10.5194/acp-12-8131-2012, 2012.
Shilling, J. E., Pekour, M. S., Fortner, E. C., Artaxo, P., de Sá, S., Hubbe, J. M., Longo, K. M., Machado, L. A. T., Martin, S. T., Springston, S. R., Tomlinson, J., and Wang, J.: Aircraft observations of the chemical composition and aging of aerosol in the Manaus urban plume during GoAmazon 2014/5, Atmos. Chem. Phys., 18, 10773–10797, https://doi.org/10.5194/acp-18-10773-2018, 2018.
Stein, S. E. and Scott, D. R.: Optimization and testing of mass spectral library search algorithms for compound identification, J. Am. Soc. Spectrom., 5, 859–866, https://doi.org/10.1016/1044-0305(94)87009-8, 1994.
Struckmeier, C., Drewnick, F., Fachinger, F., Gobbi, G. P., and Borrmann, S.: Atmospheric aerosols in Rome, Italy: sources, dynamics and spatial variations during two seasons, Atmos. Chem. Phys., 16, 15277–15299, https://doi.org/10.5194/acp-16-15277-2016, 2016.
Sueper, D.: TOF-AMS software, https://cires1.colorado.edu/jimenez-group/ToFAMSResources/ToFSoftware/ (last access: 9 September 2023), 2021.
Sun, Y., Xu, W., Zhang, Q., Jiang, Q., Canonaco, F., Prévôt, A. S. H., Fu, P., Li, J., Jayne, J., Worsnop, D. R., and Wang, Z.: Source apportionment of organic aerosol from 2 year highly time-resolved measurements by an aerosol chemical speciation monitor in Beijing, China, Atmos. Chem. Phys., 18, 8469–8489, https://doi.org/10.5194/acp-18-8469-2018, 2018.
Sun, Y.-L., Zhang, Q., Schwab, J. J., Demerjian, K. L., Chen, W.-N., Bae, M.-S., Hung, H.-M., Hogrefe, O., Frank, B., Rattigan, O. V., and Lin, Y.-C.: Characterization of the sources and processes of organic and inorganic aerosols in New York city with a high-resolution time-of-flight aerosol mass apectrometer, Atmos. Chem. Phys., 11, 1581–1602, https://doi.org/10.5194/acp-11-1581-2011, 2011.
Takegawa, N., Miyakawa, T., Kawamura, K., and Kondo, Y.: Contribution of Selected Dicarboxylic and ω-Oxocarboxylic Acids in Ambient Aerosol to the 44 Signal of an Aerodyne Aerosol Mass Spectrometer, Aerosol Sci. Tech., 41, 418–437, https://doi.org/10.1080/02786820701203215, 2007.
Tiitta, P., Vakkari, V., Croteau, P., Beukes, J. P., van Zyl, P. G., Josipovic, M., Venter, A. D., Jaars, K., Pienaar, J. J., Ng, N. L., Canagaratna, M. R., Jayne, J. T., Kerminen, V.-M., Kokkola, H., Kulmala, M., Laaksonen, A., Worsnop, D. R., and Laakso, L.: Chemical composition, main sources and temporal variability of PM1 aerosols in southern African grassland, Atmos. Chem. Phys., 14, 1909–1927, https://doi.org/10.5194/acp-14-1909-2014, 2014.
Ulbrich, I. M., Canagaratna, M. R., Zhang, Q., Worsnop, D. R., and Jimenez, J. L.: Interpretation of organic components from Positive Matrix Factorization of aerosol mass spectrometric data, Atmos. Chem. Phys., 9, 2891–2918, https://doi.org/10.5194/acp-9-2891-2009, 2009.
Ulbrich, I. M., Handschy, A., Lechner, M., and Jimenez, J. L.: AMS Spectral Database, http://cires.colorado.edu/jimenez-group/AMSsd/ (last access: 9 September 2023), 2009.
Wang, X., Williams, B. J., Wang, X., Tang, Y., Huang, Y., Kong, L., Yang, X., and Biswas, P.: Characterization of organic aerosol produced during pulverized coal combustion in a drop tube furnace, Atmos. Chem. Phys., 13, 10919–10932, https://doi.org/10.5194/acp-13-10919-2013, 2013.
Weimer, S., Alfarra, M. R., Schreiber, D., Mohr, M., Prévôt, A. S. H., and Baltensperger, U.: Organic aerosol mass spectral signatures from wood-burning emissions: Influence of burning conditions and wood type, J. Geophys. Res.-Atmos., 113, D10304, https://doi.org/10.1029/2007JD009309, 2008.
Xu, J., Zhang, Q., Chen, M., Ge, X., Ren, J., and Qin, D.: Chemical composition, sources, and processes of urban aerosols during summertime in northwest China: insights from high-resolution aerosol mass spectrometry, Atmos. Chem. Phys., 14, 12593–12611, https://doi.org/10.5194/acp-14-12593-2014, 2014.
Xu, L., Suresh, S., Guo, H., Weber, R. J., and Ng, N. L.: Aerosol characterization over the southeastern United States using high-resolution aerosol mass spectrometry: spatial and seasonal variation of aerosol composition and sources with a focus on organic nitrates, Atmos. Chem. Phys., 15, 7307–7336, https://doi.org/10.5194/acp-15-7307-2015, 2015.
Young, D. E., Kim, H., Parworth, C., Zhou, S., Zhang, X., Cappa, C. D., Seco, R., Kim, S., and Zhang, Q.: Influences of emission sources and meteorology on aerosol chemistry in a polluted urban environment: results from DISCOVER-AQ California, Atmos. Chem. Phys., 16, 5427–5451, https://doi.org/10.5194/acp-16-5427-2016, 2016.
Zhang, Q., Alfarra, M. R., Worsnop, D. R., Allan, J. D., Coe, H., Canagaratna, M. R., and Jimenez, J. L.: Deconvolution and Quantification of Hydrocarbon-like and Oxygenated Organic Aerosols Based on Aerosol Mass Spectrometry, Environ. Sci. Technol., 39, 4938–4952, https://doi.org/10.1021/es048568l, 2005.
Zhang, Q., Jimenez, J. L., Canagaratna, M. R., Ulbrich, I. M., Ng, N. L., Worsnop, D. R., and Sun, Y.: Understanding atmospheric organic aerosols via factor analysis of aerosol mass spectrometry: a review, Anal. Bioanal. Chem., 401, 3045–3067, https://doi.org/10.1007/s00216-011-5355-y, 2011.
Zhang, Q., Parworth. C., Lechner, M., and Jimenez, J. L. : Aerosol Mass Spectrometer Global Database. https://sites.google.com/site/amsglobaldatabase, last access: 30 November 2023.
Zhang, Y., Du, W., Wang, Y., Wang, Q., Wang, H., Zheng, H., Zhang, F., Shi, H., Bian, Y., Han, Y., Fu, P., Canonaco, F., Prévôt, A. S. H., Zhu, T., Wang, P., Li, Z., and Sun, Y.: Aerosol chemistry and particle growth events at an urban downwind site in North China Plain, Atmos. Chem. Phys., 18, 14637–14651, https://doi.org/10.5194/acp-18-14637-2018, 2018.
Zhao, Q., Huo, J., Yang, X., Fu, Q., Duan, Y., Liu, Y., Lin, Y., and Zhang, Q.: Chemical characterization and source identification of submicron aerosols from a year-long real-time observation at a rural site of Shanghai using an Aerosol Chemical Speciation Monitor, Atmos. Res., 246, 105154, https://doi.org/10.1016/j.atmosres.2020.105154, 2020.
Zorn, S. R., Drewnick, F., Schott, M., Hoffmann, T., and Borrmann, S.: Characterization of the South Atlantic marine boundary layer aerosol using an aerodyne aerosol mass spectrometer, Atmos. Chem. Phys., 8, 4711–4728, https://doi.org/10.5194/acp-8-4711-2008, 2008.