the Creative Commons Attribution 4.0 License.
the Creative Commons Attribution 4.0 License.
 | 10 Jan 2023
Solar occultation measurement of mesospheric ozone by SAGE III/ISS: impact of variations along the line of sight caused by photochemistry
Murali Natarajan
Robert Damadeo
David Flittner
Twilight gradients in the concentration of atmospheric species with short photochemical lifetimes influence the transmission data obtained in a solar occultation instrument, such as the Stratospheric Aerosol and Gas Experiment III aboard the International Space Station (SAGE III/ISS). These photochemically induced changes result in nonlinear asymmetries in the species distribution near the tangent altitude along the line of sight (LOS). The bias introduced by neglecting the effects of twilight variations in the retrieval of mesospheric ozone is the focus of this study. Ozone (O3) in the mesosphere exhibits large variations near the terminator during sunrise and sunset based on current understanding of the photochemistry of this altitude region. The algorithm used in the SAGE III/ISS standard retrieval procedure for mesospheric ozone does not include the effects of these gradients. This study illustrates a method for implementing a correction scheme to account for the twilight variations in mesospheric O3 and gives an estimate of the bias in the standard retrieval. We use the results from a diurnal photochemical model conducted at different altitudes to develop a database of ratios of mesospheric O3 at different solar zenith angles (SZA) around 90∘ to O3 at a SZA of 90∘ for both sunrise and sunset conditions. These ratios are used to scale the O3 at levels above the tangent altitude for appropriate SZA in the calculation of the optical depth along the LOS. In general, the impact of the corrections due to twilight variations is to increase the contribution of the overlying layers to the optical depth thereby reducing the retrieved O3 concentration at the tangent altitude. We find that at sunrise the retrieved mesospheric O3 including the diurnal corrections is lower by more than 30 % compared to the archived O3. We show the results obtained for different latitudes and seasons. In addition, for nearly collocated sunrise and sunset scans, we note that these corrections lead to better qualitative agreement in the sunrise to sunset O3 ratio with the photochemical model prediction.
- Article
(3246 KB) - Full-text XML
- BibTeX
- EndNote


The solar occultation measurement technique has been the workhorse among various methods used for monitoring the composition of the Earth's atmosphere for over 4 decades. This is evidenced by many successful experiments such as Stratospheric Aerosol and Gas Experiment (SAGE), SAGE II, Halogen Occultation Experiment (HALOE), Atmospheric Trace Molecule Spectroscopy (ATMOS), Atmospheric Chemistry Experiment-Fourier Transform Spectrometer (ACE-FTS), Polar Ozone and Aerosol Measurement (POAM), SAGE III/M3M and SAGE III/International Space Station (ISS). Major advantages of this technique include high signal to noise ratio, high vertical resolution, and long-term accuracy provided by the “self-calibrating” nature of the instrument operation. Limited global coverage ranks high among the disadvantages of this method. In the occultation experiments, the absorption of solar radiance measured by the instrument as a function of tangent height altitude or pressure is related to the optical depth and hence the abundance of the species along the line of sight (LOS). The bulk of the absorption, in general, occurs around the tangent point because of the exponential decrease in atmospheric density with altitude and due to the slant path determined by the spherical geometry. Algorithms used in standard retrievals assume that the species distribution in atmospheric layers is homogeneous and, therefore, the variation along the LOS is symmetrical around the tangent point location. The column along the LOS is then made up of species concentrations at the tangent altitude and the layers above corresponding to a solar zenith angle (SZA) of 90∘. This assumption is valid for species such as CH4, H2O, and stratospheric O3 because of their long photochemical lifetimes and the absence of chemically induced diurnal variations. In the case of species with short lifetimes, the sudden changes in the photolysis rates near day/night terminator trigger rapid variations in the concentration as a function of SZA. These variations result in nonlinear asymmetry along the LOS. In this case, the column along the LOS is made up of species concentration at an SZA of 90∘ at the tangent altitude and those from the layers above at SZA different from 90∘ on either side of the tangent point.
The influence of twilight variations in NO and ClO on the interpretation of solar occultation measurements was described by Boughner et al. (1980). Correction factors based on photochemical models, as discussed in the above study, have been routinely applied in the retrieval of stratospheric NO and NO2 profiles in HALOE (Gordley et al., 1996; Russell et al., 1988) and in ATMOS (Newchurch et al., 1996). Brohede et al. (2007) described the role of diurnal variations in the retrieval of NO2 from OSIRIS measurements. The algorithm used in the retrieval of NO2 in SAGE, SAGE II, SAGE III/M3M, and SAGE III/ISS neglects the twilight variations. A recent study of the NO2 retrieval from SAGE III/ISS by Dubé et al. (2021) described the importance of considering the diurnal variations along the LOS.
Mesospheric O3 is also characterized by a short photochemical lifetime and steep twilight gradients and, therefore, it is a potential candidate species requiring appropriate corrections in a retrieval from solar occultation instruments. Natarajan et al. (2005) noted that the diurnal correction factors used in the retrieval of mesospheric ozone from HALOE (version 19) needed to be updated. They derived new factors from a diurnal photochemical model of mesospheric ozone and illustrated the impact of the corrections using a small subset of retrieved HALOE mesospheric O3 profiles. In the present study, we describe the application of similar corrections to the SAGE III/ISS retrieval of mesospheric O3. Table 1 of the Data Product User's Guide for SAGE III/ISS (NASA Langley Research Center, 2021) lists the release status of mesospheric O3 data as a beta version that is yet to be validated, because it is still potentially impacted by spectral stray light within the instrument. Our goal is to quantify the impact of the corrections on the archived data and to see whether the changes can support other known criteria. A description of the mesospheric O3 variations under twilight conditions as calculated with a diurnal photochemical model is given in Sect. 2. The occultation geometry and the diurnal correction factors for mesospheric O3 are described in Sect. 3. Results from the application of the factors to correct the archived data are discussed in Sect. 4. We also include the results from an approximate retrieval using the archived transmission data with and without diurnal corrections. A comparison of zonally averaged O3 profiles with scaled data for the same period from the Microwave Limb Sounder (MLS) instrument on Aura satellite is described in the next section. This is followed by a discussion of sunrise to sunset mesospheric O3 ratios using appropriate collocated scans and a comparison to theoretical values. The final summary section reiterates the importance of corrections for photochemically induced twilight mesospheric O3 variations in solar occultation retrievals.
We use a time-dependent, one-dimensional photochemical model to obtain the diurnal variation in mesospheric O3. A detailed description of the model used in this study is given in Natarajan et al. (2005). This version of the model extends from 56 km to 100 km at 1 km intervals. The photochemical reaction scheme shown in Appendix A, includes reactions involving species from the oxygen, hydrogen, and nitrogen families. Chlorine and bromine reactions do not play a significant role in this region of the atmosphere. The adopted chemical rate constant data are from the JPL Publication 19-5 (NASA Jet Propulsion Laboratory, 2020). The diurnal model does not use a family approximation and reactive species O, O3, N, NO, NO2, H, OH, HO2, and H2O2 are considered as independent variables. The concentrations of long-lived species are constrained by the results from a two-dimensional chemical transport model (CTM) (Callis et al., 1997). Diffusion coefficients from the CTM are used to parameterize the vertical transport. The diurnal model uses a variable time step and variable order stiff equation solver (Byrne and Hindmarsh, 1975) to integrate the system of species continuity equations. The maximum time step is 600 s, and the algorithm automatically reduces the time step to very low values if needed. The model is run for 4 diurnal cycles so that the reactive species reach a steady diurnal behavior, and the results from the fifth cycle are used in the analysis. The model is run for every month at 11 latitudes, corresponding to the latitude nodes of the CTM, from 56.25∘ N to 56.25∘ S at intervals of 11.25∘.
The calculated O3 diurnal variations in June at the latitude of 11.25∘ S and at different altitudes of interest to this work are illustrated in Fig. 1. We restrict our attention to altitudes below 74 km because the SAGE III/ISS O3 data are noisy in the region above and the quoted uncertainty is also large. The O3 concentration is shown as a function of time starting at midnight. Nighttime O3 has a constant value representing the total odd oxygen in the lower mesosphere. A sharp decrease at sunrise is mainly caused by photolysis of O3 forming atomic oxygen. The recombination of atomic oxygen and O2 quickly balances the loss of O3 from photolysis. This reaction is pressure dependent and becomes slower at higher altitudes. The photolysis of O2 generates additional odd oxygen (OX= O+ O3) and in the morning hours this leads to an increase in both OX and O3. The formation of odd hydrogen species from the reaction of O(1D) with H2O during the day triggers the catalytic destruction of odd oxygen through reactions involving OH. It is noted that between 50 and 80 km the chemical time constant of OX is of the order of few hours and OX exhibits a diurnal variation caused by the competing production and destruction reactions. In the early morning there is a net gain of OX and in the evening, there is net loss of OX, which continues even after sunset until atomic oxygen is depleted. The partitioning of OX into O and O3 is mainly controlled by the photolysis of O3 and the production of O3 through the recombination of O and O2. The large increase in O3 seen around sunset is mainly due to the decrease in the photolysis of O3 and the continuation of the recombination of O and O2. The O3 reaches a steady value within 1 h or so after sunset. The diurnal model extends to 100 km; however, as the quoted uncertainty above 70 km in the archived SAGE III/ISS O3 is large, we will focus on the region below.
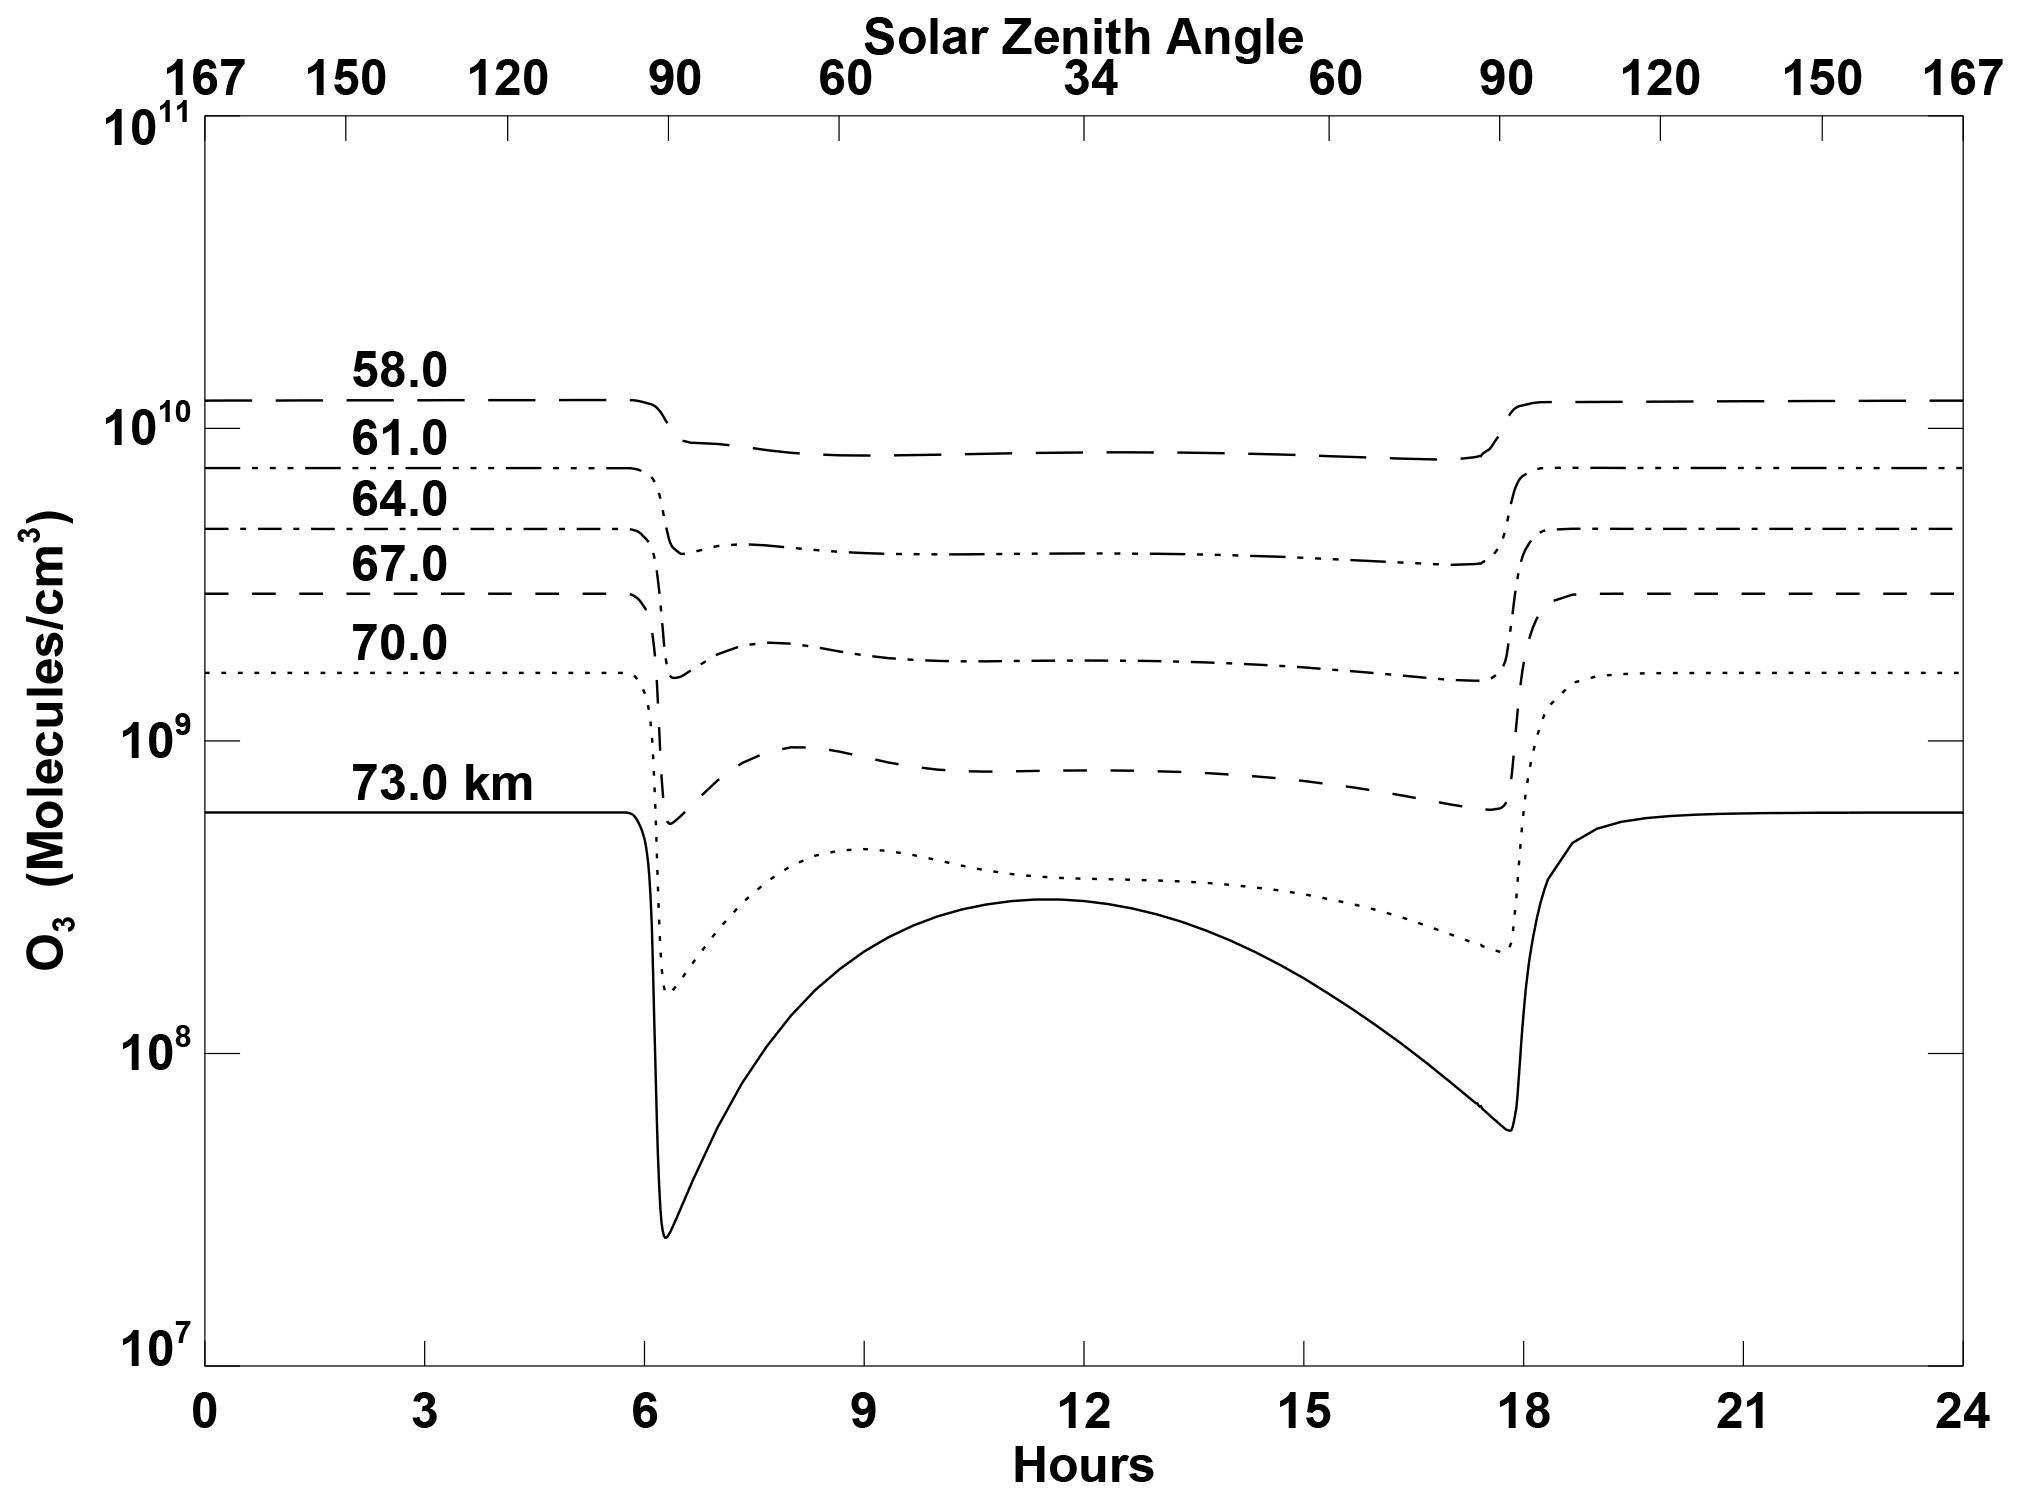
Figure 1Diurnal variation in O3 at 11.25∘ S in June at altitudes from 58 to 73 km. 0 h denotes midnight. The upper x-axis shows the variation of SZA.
The results of the full diurnal cycle are of general interest about the model simulation but with reference to solar occultation measurements, the sharp gradients seen in the O3 concentration near SZA of 90∘ are more critical. The significance of the twilight variations for the retrieval of mesospheric O3 under sunrise/sunset conditions can be understood with the help of the schematic shown in Fig. 2. This illustrates the occultation geometry in the plane containing the LOS. The red line denotes the LOS at a tangent altitude of ZT. Points F and N represent the intersection of the LOS with an atmospheric layer at an altitude of Z shown in green. For a species with little or no twilight variations, the concentrations at the locations F and N are nearly equal to that at the location U, the tangent point at an altitude of Z. In this case, the concentrations at tangent height ZT can be derived in a straightforward manner from the measured transmission using a retrieval algorithm. However, if the photochemistry causes significant gradients near an SZA of 90∘, as in the case of mesospheric O3, the distribution around the tangent point becomes nonlinearly asymmetric because the concentrations at F and N depend on the respective local SZA. This variation must be incorporated into the evaluation of O3-specific optical depth along the LOS.
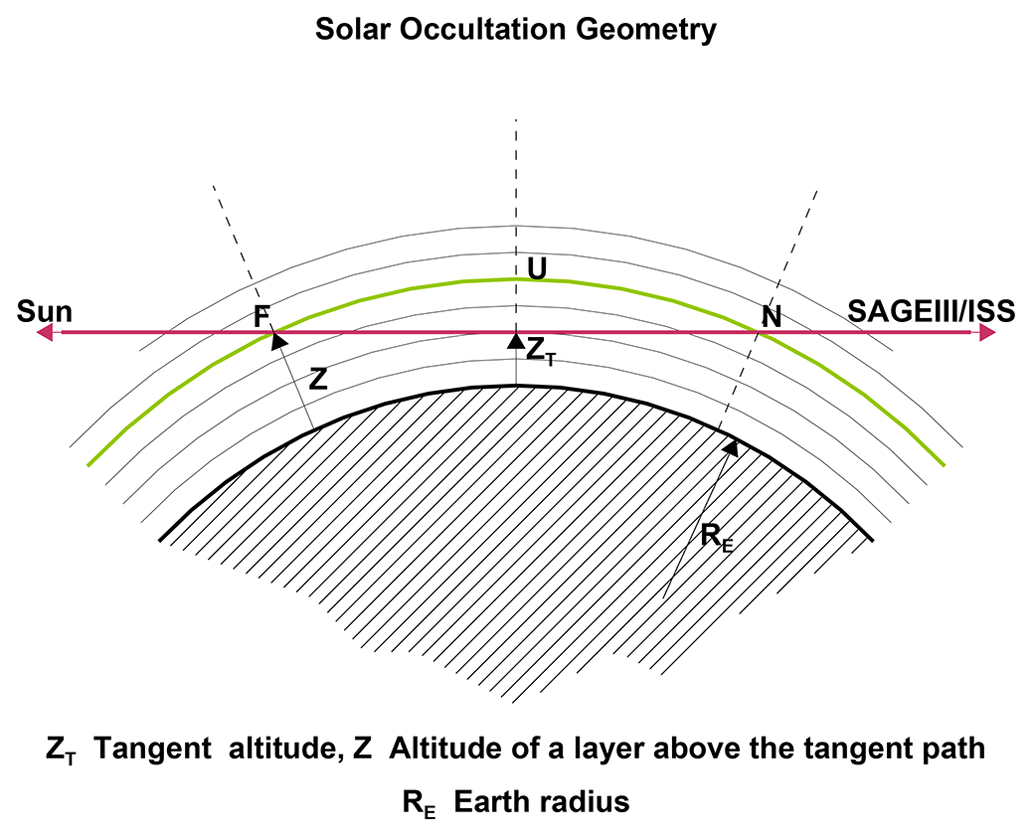
Figure 2Schematic representation of the solar occultation measurement. ZT is the tangent altitude, red line is the LOS, Z is the altitude of a layer above the tangent altitude, F (towards sun) and N (towards SAGE III/ISS) are the points of intersection of layer at Z with the LOS, and RE is the Earth radius.
To illustrate the impact of diurnal variations on slant-path column of O3, we selected a typical event from the SAGE III/ISS data and applied the calculated O3 variations in the slant-path column evaluation. The required parameters include month, date, event type (sunrise or sunset), tangent altitude, latitude, longitude, spacecraft latitude and longitude. These data are taken from the current Version 5.2 SAGE III/ISS data available from the Atmospheric Sciences Data Center (ASDC) at NASA Langley Research Center. We used the model results for June at 11.25∘ S latitude to get the O3 variation at sunrise along the LOS corresponding to different tangent altitudes from 56 to 76 km. The latitude of the chosen SAGE III/ISS measurement is 11.35∘ S. The O3 concentration along the LOS for a tangent altitude of 64 km is shown as a function of distance along the LOS relative to the tangent point in the left panel of Fig. 3. The dotted line corresponds to the O3 concentration along the LOS when the diurnal variations are neglected and only the values corresponding to 90∘ SZA from the layers above the tangent altitude are used. The solid line represents the O3 concentration including the diurnal variations at the respective altitudes. The increased O3 concentrations on the instrument side of the LOS are readily seen. The ratio of the O3 column along the LOS with diurnal variations to the column without the diurnal variations is shown as a function of tangent altitude in the panel on the right side. The peak difference of the order of 30 % occurs in the altitude range from 61 to 72 km. Underestimation of the partial O3 slant-path column from layers above the tangent altitude in the standard retrieval translates to overestimation of the retrieved O3 at the tangent altitude. The bias introduced by the neglect of twilight variations can be evaluated with the help of the diurnal model results.

Figure 3(a) O3 concentration along the LOS for a tangent altitude of 64 km at sunrise at 11.25∘ S latitude in June. Solid line shows O3 with diurnal variations and the dotted line represents O3 without diurnal variations. The x-axis represents the distance along the LOS relative to the tangent point with positive direction towards the instrument and negative direction towards the Sun. The upper x-axis shows the corresponding SZA. (b) Ratio of the O3 column along the LOS with appropriate diurnal variations to the O3 column without diurnal variations, plotted as a function of altitude at 11.25∘ S in June.
The technique is to express the O3 variation as a function of SZA in terms of concentration normalized to O3 at an SZA of 90∘. Figure 4 shows the distribution of the ratio O O3(θ=90∘) near sunrise as a function of SZA and altitude obtained from the model results for 11.25∘ S latitude in June. For a given tangent height, the total slant-path O3 column comprises partial slant-path columns corresponding to the layers at and above the tangent height. Spherical geometry dictates that the partial path length along the LOS is maximum for the layer immediately above the tangent height (i.e., the lowest layer) and decreases dramatically for higher layers. This, combined with decreasing O3 concentrations with height in the lower mesosphere, results in a total slant-path column dominated by contributions from a few layers right above the tangent point. Therefore, only a small range of SZA, say between 86 and 94∘, centered at 90∘ are important. At 62 km the O3 ratio is less than 1.0 for SZA less than 90∘ and it increases gradually for SZA greater than 90∘. At higher altitudes, the ratio shows a much steeper increase for SZA greater than 92∘. The ratio, in some cases is even slightly larger than 1.0 at SZA less than 90∘. From the occultation geometry shown in Fig. 2, it is seen that as one moves away from a SZA of 90∘ along the LOS at any tangent altitude, the corresponding altitude layer of interest moves upwards. Figure 5 illustrates the O3 twilight ratio as a function of SZA and altitude for sunset conditions for the same latitude and month. The changes in the ratio for sunset condition are smaller and more gradual especially for SZA greater than 90∘ compared to the sunrise case. It should be recalled that the daytime variation in the odd oxygen concentration in the lower mesosphere impacts the O3 concentration differently at sunrise and sunset. The differences between the O3 variations for sunrise and sunset conditions suggest that the effects on the retrievals are different for sunrise and sunset occultations. The twilight O3 ratios for altitude layers above the tangent altitude can be used to obtain the O3 concentration and hence the optical depth along the LOS more accurately.
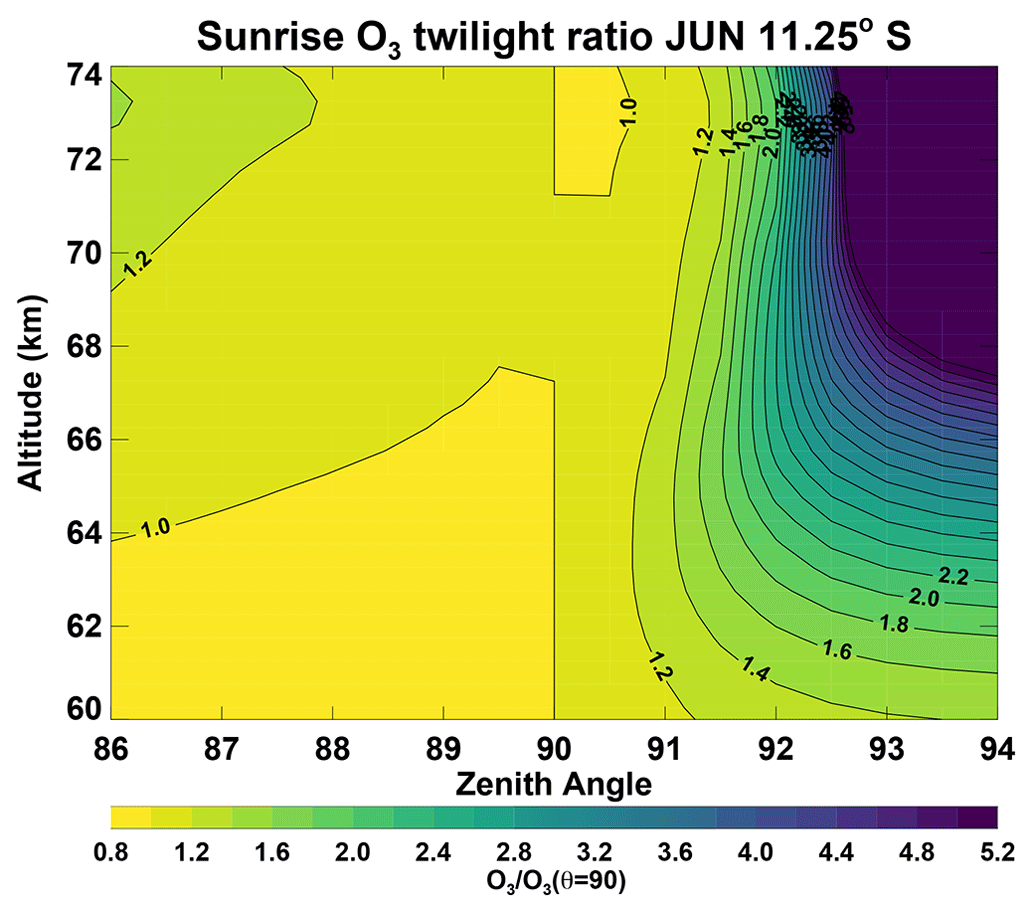
Figure 4Ozone twilight ratio, defined as O3 at solar zenith angle at θ=90∘, as a function of SZA and altitude for sunrise in June and 11.25∘ S latitude.
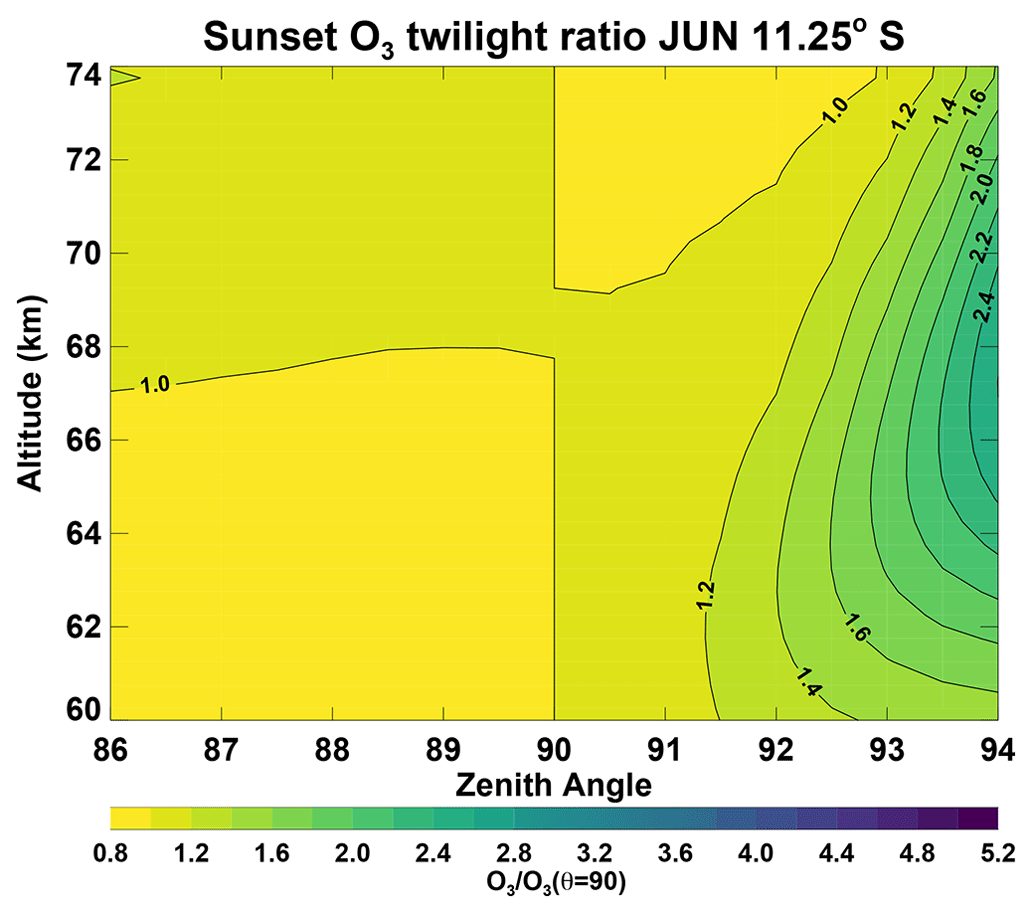
Figure 5Ozone twilight ratio, defined as O3 at solar zenith angle at θ=90∘, as a function of SZA and altitude for sunset in June and 11.25∘ S latitude.
Mesospheric O3 concentrations are influenced by reactions involving HOx species and therefore the distribution of H2O used in the model is an important factor. An earlier study with HALOE mesospheric O3 data (Natarajan et al., 2005) using the results from the same CTM showed that the monthly, zonal mean H2O distribution from the CTM was in good agreement with the data taken from the UARS reference atmosphere project. Linear trend in mesospheric H2O and solar cycle response have been addressed in the literature (Remsberg et al., 2018; Yue et al., 2019). Yue et al. (2019) reported a trend in mesospheric H2O of the order of 4 % per decade to 6 % per decade based on the data from the Sounding of the Atmosphere using Broadband Emission Radiometry (SABER) and MLS instruments. Long-term variability in H2O certainly impacts the absolute level of mesospheric O3; however, for the present study, the factor of importance is the relative variation of O3 very close to SZA of 90∘ during sunrise and sunset in the mesosphere. We have done a sensitivity study at 11.25∘ S in June using the diurnal model with a 25 % increase in the H2O concentration. Figure 6 displays the percent change in the twilight O3 ratios for sunrise shown in Fig. 4. The maximum impact below 74 km is less than 20 % and it is very small in the lower regions. The twilight ratio in O3 is quite robust and small changes in the atmospheric parameters such as temperature and H2O do not impact this ratio much. The use of this ratio is a valid approximation in correcting the retrieval scheme.
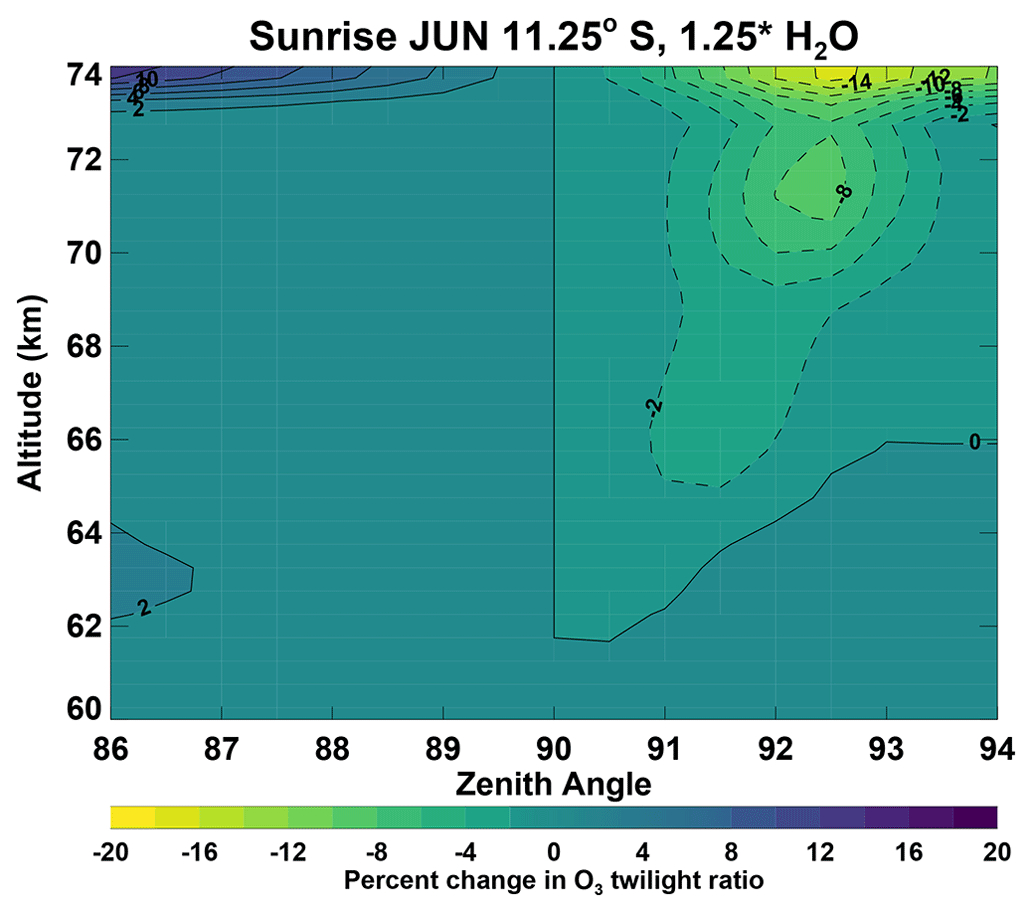
Figure 6Percent change in the O3 twilight ratio shown in Fig. 4 when the H2O in the diurnal model is increased by 25 % at all altitudes. This figure corresponds to sunrise at 11.25∘ S in June.
The SAGE III/ISS instrument payload was launched in February 2017 and successfully attached to the ISS. The ISS occupies a low earth orbit at an inclination of 51.64∘ that provides occultation coverage of low-latitude and mid-latitude regions. Descriptions of the experiment and early validation of the O3 measurements are given in McCormick et al. (2020) and Wang et al. (2020). More detailed information on the various wavelength channels and data used for retrieving a suite of atmospheric species including mesospheric O3 are given in SAGE III Algorithm Theoretical Basis Document (SAGE III ATBD Team, 2002) and in the SAGE III/ISS Data Products User's Guide(DPUG) Version 3.0 (NASA Langley Research Center, 2021). Among the three different O3 profile measurements made by the instrument, the one based on short wavelengths in the Hartley-Huggins bands refers exclusively to mesospheric O3. There are three charge-coupled device (CCD) pixel groups (PGs 0–2) assigned to the short wavelengths in the 280–293 nm range, although only one (PG 1 centered at 286 nm) is currently used for the retrieval. According to the DPUG, mesospheric O3 data have not been fully validated. We also note that the uncertainty in the archived O3 concentration becomes larger than 10 % above 70 km and there are some spurious negative data pointing to uncertainties in the transmission. The present study focuses only on SAGE III/ISS O3 in the lower mesosphere up to an altitude of 70 km even though the retrieval itself starts at 90 km. The diurnal model described in the previous section extends up to 100 km. We use the Version 5.2 transmission and species data obtained from ASDC at NASA Langley Research Center. For each year and month, we have categorized the scans according to event type, sunrise, or sunset. The input data for our analysis include the tangent point latitude and longitude, spacecraft latitude and longitude, vertical profiles of neutral density, mesospheric O3, and transmission. We use only the transmission data from the science pixel group 1 (PG 1), which has a center wavelength of 286.124 nm, since the predominant species active in this wavelength region is O3.
We have generated a database of O3 twilight ratios for sunrise and sunset conditions from the diurnal model results. These ratios cover for each month the latitude range from 56.25∘ N to 56.25∘ S at intervals of 11.25∘, SZA from 84∘ to 96∘ at 0.5∘ intervals, and altitudes from 56 km to 90 km at 0.5 km intervals. Using the input data from each of the SAGE III/ISS occultations and spherical geometry relations, for every tangent altitude we compute the SZA as well as partial path lengths corresponding to overlying layers. This generates a path length matrix like the one used in the standard retrieval. Appropriate O3 twilight ratios are then obtained by interpolation using the SZA and layer altitude. Multiplication of the standard path length matrix by the O3 ratios yields the modified path length matrix including the effects of diurnal variations.
The twilight ratios can either be used to modify the O3 profiles from the standard retrieval or be incorporated into a new retrieval from measured transmission profiles. The first method is like the procedure described by Dubé et al. (2021) for making diurnal corrections to stratospheric NO2 data from SAGE III/ISS. The archived SAGE III/ISS O3 profile and the standard path length matrix are used to recreate the O3 specific slant optical depth, as shown by the equation
where τ is the O3 slant optical depth profile, σ is the O3 cross-section corresponding to the center wavelength of PG1, and n is the O3 profile from the standard retrieval. S represents the path length matrix with each row corresponding to a tangent point altitude. This can be written as a triangular matrix because of the geometric symmetry on opposite sides of the tangent point as can be seen from Fig. 2. The slant optical depth can then be converted to an O3 vertical profile corrected for diurnal variations using the modified path length matrix described earlier, as shown by the equation
where Swd is the modified path length matrix with diurnal correction and nwd is the corrected O3 profile. Here it is assumed that the O3 absorption coefficient remains constant along the LOS. This procedure gives a quantitative estimate of the overprediction by the standard retrieval. The results for a sunrise event on 14 June 2021 (Event ID = 2021061438SR) are shown in Fig. 7. The left panel displays the O3 concentration profiles, the solid red line is the archived data from standard retrieval and the solid black line represents the profile after applying the diurnal correction ratios to the path length matrix. The percent difference between the standard and the modified profiles is shown by the solid line on the right panel. For this occultation, the difference exceeds 40 % above 64 km. This is consistent with the change in O3 slant column due to the diurnal correction shown in Fig. 3. We also note that the retrieval becomes noisy in the upper altitudes as O3 concentrations nearly reach detection limits. In the second method, instead of evaluating the slant optical depth using Eq. (1), the archived slant-path transmission data, which correspond to PG1, are used along with the standard and modified path length matrices to retrieve the vertical O3 profiles. The change in the slant-path transmission corresponding to the science CCD channel PG1 for each tangent altitude below an upper boundary of 90 km, is related to the total slant optical depth made up mainly of O3 absorption and Rayleigh scattering contributions. After removing the Rayleigh scattering part corresponding to the center wavelength of 286.124 nm, the slant-path O3 column can be estimated using the O3 absorption coefficient at this wavelength taken from Bogumil et al. (2003), which is the same database used in the SAGE retrieval algorithm. The standard and modified path length matrices are then used to get the vertical O3 profiles without and with corrections for diurnal variations. The retrieved O3 profiles for the sunrise event mentioned earlier are given by the dashed lines on the left panel of Fig. 7, the red color denoting the standard retrieval without diurnal corrections and the black color the modified retrieval with diurnal corrections. We have used a very simple algorithm and assumed that the transmission data correspond to a single wavelength to simplify the calculation. The actual retrieval procedure used for the archived products may have included more refinements. The agreement between results of the two different methods is very good, both for the vertical O3 profiles and for the percent differences. Results for a sunset event, closer to the above sunrise event in location and within 1 day (Sunset event ID = 2021061515SS) are shown in Fig. 8. The impact of the diurnal correction is much smaller for sunset conditions. The maximum difference between the standard and modified profiles is less than 10 %. The two different procedures for incorporating diurnal effects yield very nearly the same results.
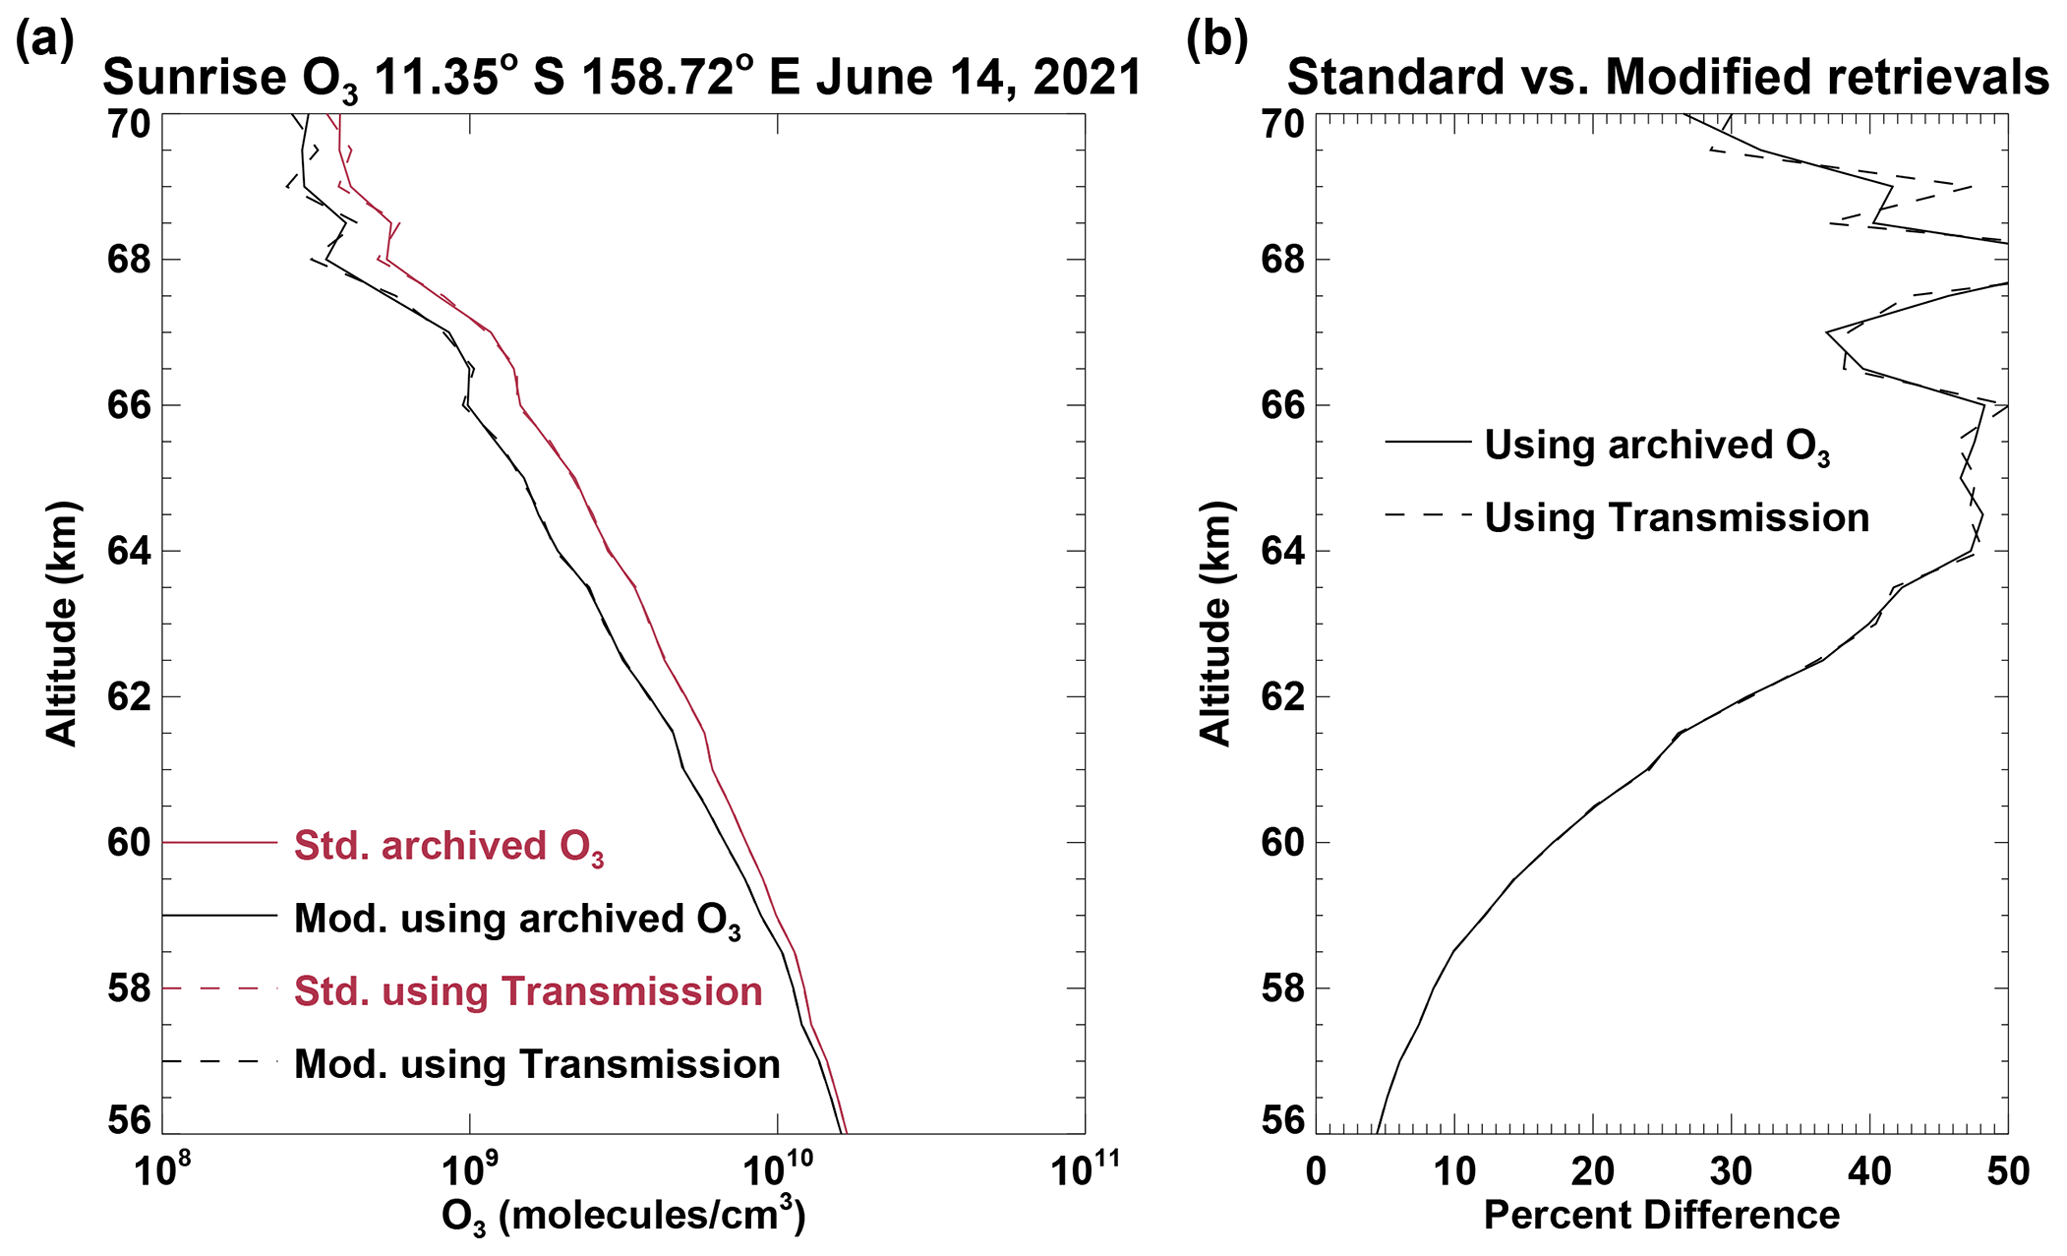
Figure 7SAGE III/ISS O3 for a sunrise event at 11.35∘ S and 158.72∘ E on 14 June 2021 (Event ID 2021061438SR). (a) Red solid line shows the standard SAGE III retrieval, and the black solid line represents the retrieval including the diurnal variations along LOS. The dashed lines represent the retrievals using the transmission data, the red color for the standard retrieval and the black denoting the retrieval with diurnal corrections. (b) Percent difference between the standard retrieval and the one with diurnal corrections; solid line using the archived standard retrieval of O3 concentration, and the dashed line based on the approximate retrieval using the transmission data.
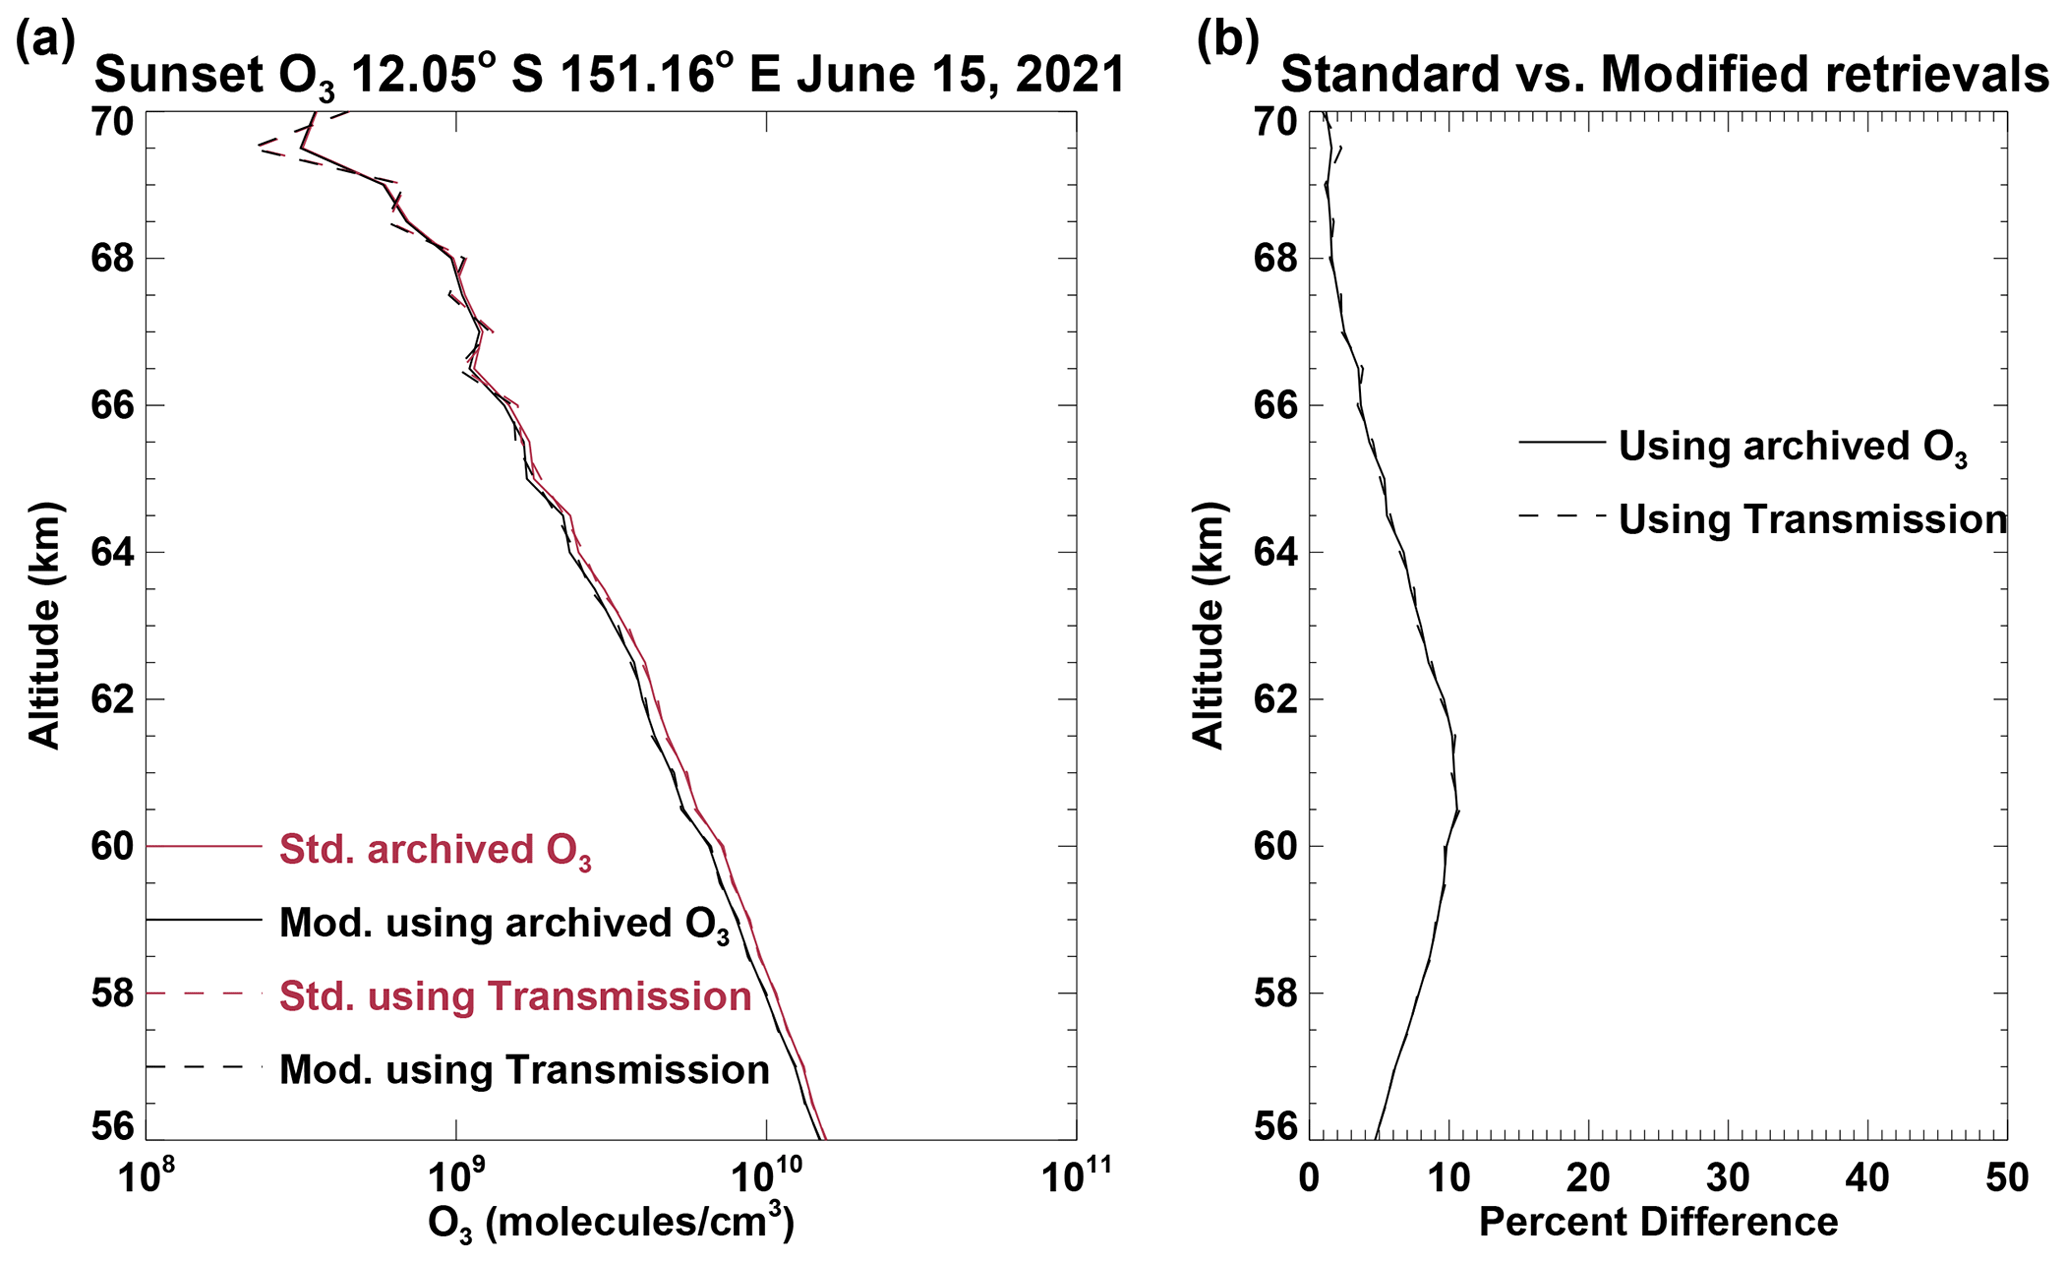
Figure 8SAGE III/ISS O3 for a sunset event at 12.05∘ S and 151.16∘ E on 15 June 2021 (Event ID 2021061515SS). (a) Red solid line shows the standard SAGE III retrieval, and the black solid line represents the retrieval including the diurnal variations along LOS. The dashed lines represent the retrievals using the transmission data, the red color for the standard retrieval and the black denoting the retrieval with diurnal corrections. (b) Percent difference between the standard retrieval and the one with diurnal corrections; solid line using the archived standard retrieval of O3 concentration, and the dashed line based on the approximate retrieval using the transmission data.
We have applied the diurnal corrections following the procedure described above to all the SAGE III/ISS measurements from June 2021, categorized by the event type of sunrise or sunset. Individual O3 profiles were grouped together in 11 latitude bands, 11.25∘ wide between 56.25∘ N and 56.25∘ S. The percent difference between the standard retrieval profile and the corresponding modified profile, defined as , was calculated and the mean for each latitude band was evaluated. The subscript WD refers to the retrieval including the diurnal corrections. Figure 9 shows the resulting distribution of the mean, which represents the overestimation by the standard retrieval, as a function of latitude and altitude. There is a latitudinal dependence with peak values occurring near 64 km and the summer hemisphere showing smaller difference. Values higher than 100 % (dark violet region) are seen in the upper altitudes of the winter hemisphere. The O3 profile has a sharp gradient reaching a very low minimum in winter between and 70 and 80 km. The retrieved data in this region are very noisy and thus sometimes include negative concentrations. The percent difference between the two retrievals also displays a very noisy distribution with large values of both signs. At altitudes above 85 km, the day-night terminator occurs at SZA greater than 96∘ and O3 variation around 90∘ is small. The bias in the standard retrieval (not shown) is also small and there is no need for diurnal correction. The distribution of percent differences for sunset measurements is shown in Fig. 10. The values are much smaller as discussed earlier, as the diurnal corrections are not significant for sunset. To look at the seasonal dependence of the impact of diurnal corrections on the retrieved O3, we have repeated the procedure with SAGE III/ISS data from January 2021. Figure 11 displays the results for sunrise conditions. The differences between the standard and modified retrievals are larger again in the winter hemisphere with peak values occurring near 64 km. This agrees qualitatively with Fig. 11 of Natarajan et al. (2005), which showed the percent difference in retrieved HALOE sunrise O3 for January 1995 with updated diurnal correction factors compared to the retrieval with HALOE version 19 correction factors. The archived HALOE version 19 retrieval used correction factors from a diurnal calculation at 61 km for all mesospheric tangent altitudes. As a partially corrected (version 19) retrieval was used as the basis, the contour levels are negative and smaller in magnitude.
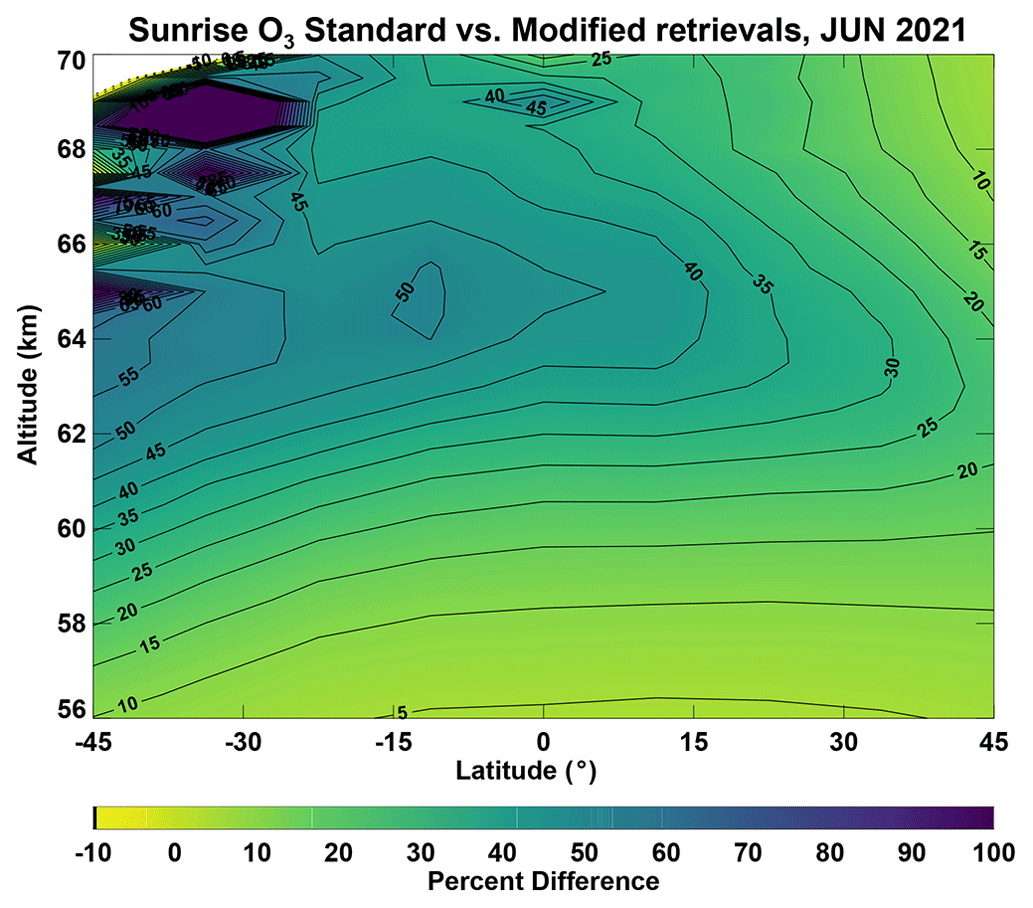
Figure 9Latitudinal average of the percent difference in sunrise O3 between the standard (archived) retrieval and a retrieval including diurnal variations along the LOS, as a function of latitude and altitude for June 2021.
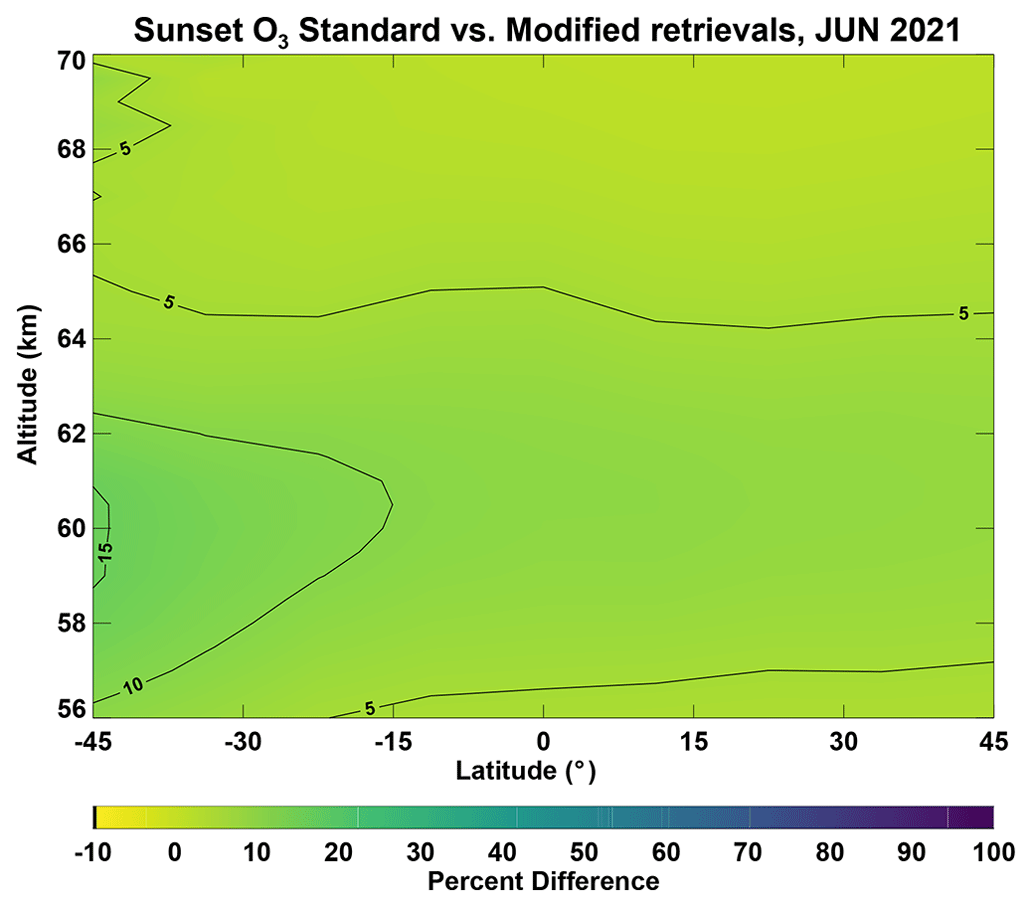
Figure 10Latitudinal average of the percent difference in sunset O3 between the standard (archived) retrieval and a retrieval including diurnal variations along the LOS, as a function of latitude and altitude for June 2021.
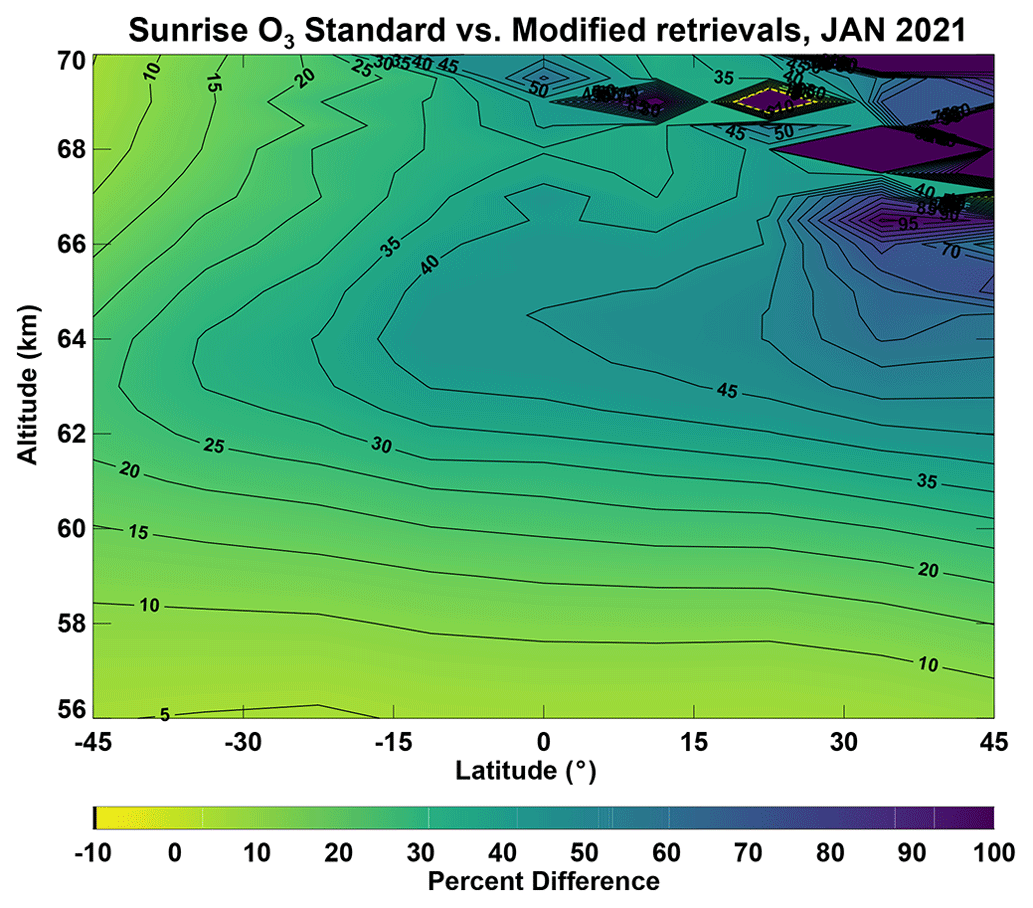
Figure 11Latitudinal average of the percent difference in sunrise O3 between the standard (archived) retrieval and a retrieval including diurnal variations along the LOS, as a function of latitude and altitude for January 2021.
It is of interest to see whether the correction to the retrieval of mesospheric ozone described above can be validated by comparisons with other independent measurements. Mesospheric ozone mixing ratios at SZA of 90∘ during sunrise and sunset have been measured by other solar occultation experiments like HALOE and ACE-FTS. HALOE version 19 retrievals use correction factors based on diurnal model calculation near the stratopause. An update to these correction factors was discussed in Natarajan et al. (2005) but a modified version of the full ozone dataset was not generated. As far as we know, the retrieval scheme of ACE-FTS does not use any correction for twilight variations of mesospheric ozone. It should be emphasized that comparisons with data from other solar occultation experiments do not necessarily provide a robust independent validation of the need to make such corrections to reduce the bias in the measurements.
The MLS aboard the Aura satellite also provides vertical profiles of O3 extending into the mesosphere. The MLS measurements occur twice a day, once in the early afternoon and the other past midnight. Strode et al. (2022) have used the MLS data scaled with factors derived from the Goddard Earth Observing System (GEOS) model coupled with the Global Modeling Initiative (GMI) chemistry mechanism for comparisons with SAGE III/ISS O3 in the stratosphere. We have done similar comparisons for a selected subset of the data in the lower mesosphere using the results from the mesospheric diurnal model described earlier. We limited our attention to the data in altitude range from 56 km to 70 km. We used the information provided in the MLS-V5 data quality document (Livesey et al., 2022) to properly screen the O3 data. The vertical resolution for MLS O3 varies from 3 km to 5.5 km in the lower mesosphere. The reported accuracy varies from 8 % at 0.21 hPa to 40 % at 0.02 hPa. We used the MLS V-5 O3 profiles from a 11.25∘ latitude band centered at 11.25∘ S from 13 to 15 June 2021. The native units of MLS measurements are mixing ratios on pressure levels. We used the MLS temperature and geopotential height data to get O3 concentrations on an altitude grid. We derived the mean and the standard deviation profiles for both day and night MLS measurements. Results from diurnal model calculations were used to convert MLS day and night measurements to SZA of 90∘ during sunrise and sunset conditions. Figure 12 shows the O3 concentration at sunrise based on MLS night data by asterisks and that based on MLS day data by diamonds. The horizontal lines represent the standard deviations at different altitudes. We also obtained the mean and standard deviation profiles using SAGE III/ISS data from the same latitude band and period in June 2021 like the selected MLS data. The solid black line in Fig. 12 shows the mean sunrise profile from standard retrieval and the standard deviation is represented by the yellow colored band. The dashed black line is the modified retrieval with the green band showing the standard deviation. The twilight corrections to the mesospheric O3 retrieval bring the profile in better agreement with that derived from MLS day and night data. Above 68 km the MLS day measurements have large variability, and the standard deviation is larger than the mean. Figure 13 shows the comparison of the profiles for sunset conditions. The difference between the modified and the standard retrievals is much smaller for the sunset conditions compared to the sunrise conditions. Overall SAGEIII/ISS mesospheric O3 has a positive bias. The vertical resolution of SAGE III/ISS data is about 0.7 km, which is finer than the MLS vertical resolution. We found that the application of the MLS O3 averaging kernel to smooth the SAGE III/ISS data has a minimum impact on the comparison.

Figure 12Comparison of sunrise SAGE III/ISS and MLS mesospheric O3 zonal mean at 11.25∘ S in June 2021. Solid line – mean of SAGE III/ISS standard retrieval with the standard deviation shown by the yellow shade; dashed line – mean of SAGE III/ISS modified retrieval with the standard deviation shown by the green shade; asterisks – mean MLS night data scaled to sunrise; diamonds – mean MLS day data scaled to sunrise; horizontal lines represent the standard deviations.

Figure 13Comparison of sunset SAGE III/ISS and MLS mesospheric O3 zonal mean at 11.25∘ S in June 2021. Solid line – mean of SAGE III/ISS standard retrieval with the standard deviation shown by the yellow shade; dashed line – mean of SAGE III/ISS modified retrieval with the standard deviation shown by the green shade; asterisks – mean MLS night data scaled to sunset; diamonds – mean MLS day data scaled to sunset; horizontal lines represent the standard deviations.
There have been several ground-based microwave measurements of atmospheric O3 and its diurnal variations (Connor et al., 1994; Parrish et al., 2014; Sauvageat et al., 2022). The microwave radiometry (MWR) in Switzerland (Sauvageat et al., 2022) provides data temporally overlapping the SAGE III/ISS data. These data are from measurements made at 2 ground stations and they extend into the mesosphere. The vertical resolution of ground-based MWR is very coarse in the lower mesosphere, about 17 km (Connor et al., 1994). Therefore, SAGE III/ISS O3 data should be convolved with the averaging kernels of MWR prior to comparisons. In addition, MWR provides hourly data and, unless the local measurement time coincides with SZA of 90∘ during sunrise and sunset, the data must be converted using factors based on diurnal model. We feel that comparison with MWR data is outside the scope of this paper.
Brühl et al. (1996), in their paper on HALOE O3 channel validation, discussed the sunrise to sunset differences in O3 around 0.1 hPa (about 64 km). Mesospheric layers are under sunlit conditions even at SZA slightly greater than 90∘ at dawn and dusk. As explained earlier, the viewing geometry in solar occultation observations leads to an increase in the contribution of overlying layers to the O3 optical depth because O3 concentrations corresponding to varying SZA greater than 90∘ are seen along the LOS. We have noted that the impact is larger during sunrise than sunset measurements. The sunrise to sunset O3 concentration ratio becomes larger if the diurnal variations along the LOS are not considered in the retrieval. Solar occultation experiments occasionally offer the opportunity to approximately check this ratio as a test of consistency of measurement and agreement with theory. This is possible when sunrise and sunset orbits cross over each other within a reasonably short interval of time and physical proximity. Such near coincidences are quite rare. We selected sunrise and sunset pairs of measurements by SAGE III/ISS having tangent locations within 1.5∘ latitude, and 15∘ longitude of each other and separated by a maximum of 36 h. The effect of advection by the prevailing westerly wind requires that the time and longitude differences are in the correct direction. There are just 10 pairs of sunrise and sunset measurements in June 2021 that satisfy the above criteria, all of them in low latitudes with a mean latitude of 10.46∘ S at sunrise and 10.27∘ S at sunset. The mean of the sunrise to sunset ratios of O3 concentrations from these scans is shown in Fig. 14. The solid line corresponding to the standard retrieval shows ratios greater than 1.1 above 60 km. The green colored shade represents the standard deviation. The modified retrieval yields a ratio shown by the dashed line decreasing from 1.01 at 60 km to lower values above. The horizontal lines are the standard deviations. The asterisk symbols represent the ratio from the diurnal model. The model value is in good agreement with the ratios from both the standard and modified retrievals near 58 km but above this altitude there are some differences. The variation with altitude in the model ratio is more like that shown by the modified retrieval. The modified retrieval qualitatively reflects the pattern that the photochemistry of O3 suggests in this altitude region. This comparison serves as an independent criterion to highlight the importance of including the LOS twilight variations in the retrieval of mesospheric O3 in solar occultation measurements. We noticed that very few such pairs of measurements, which satisfied the criteria we have chosen, occurred during other months in SAGE III/ISS data. We have also looked at the latitudinally averaged sunrise and sunset data for June 2021 obtained for generating Figs. 9 and 10. For the latitude band centered at 11.25∘ S, the sunrise to sunset ratio as a function of altitude (not shown) is like Fig. 14, which used only collocated data. The small sampling size of the collocated pairs of data and regions of overlapping standard deviations seen in the Fig. 14 make this at best an approximate comparison. Other independent measurements are needed to verify the altitude variation of the ratio of sunrise to sunset O3 concentrations.
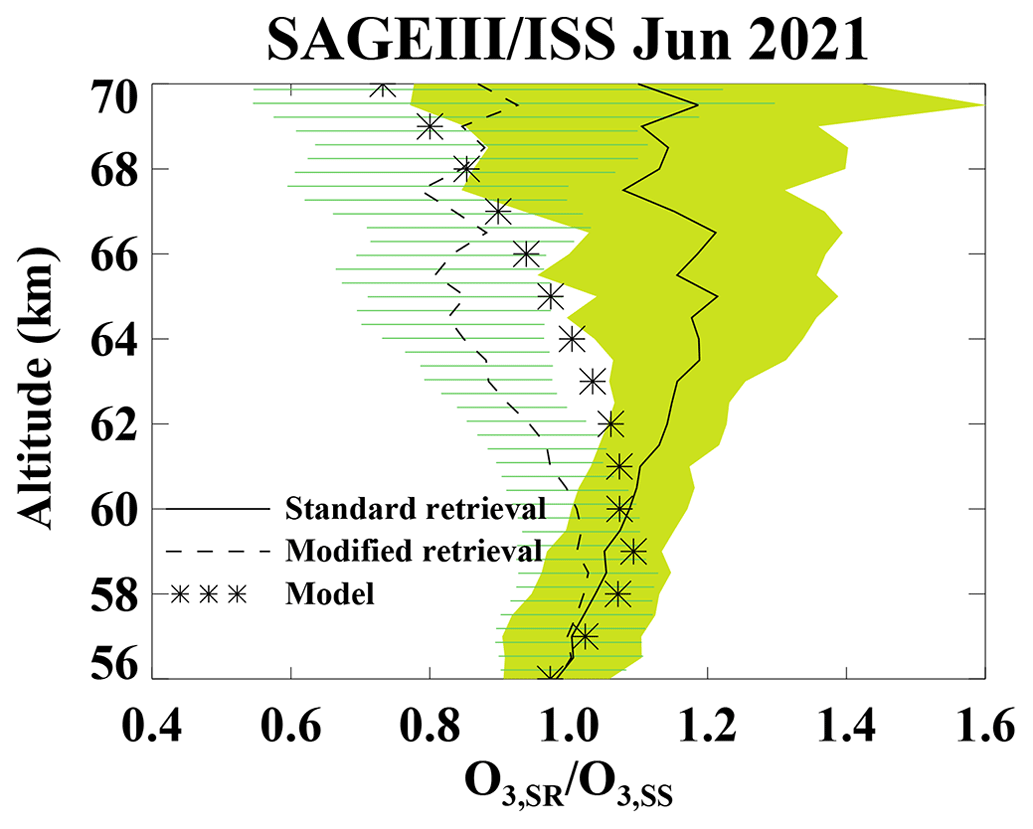
Figure 14Vertical profile of O3 sunrise to sunset ratio in June 2021. Nearly collocated 10 pairs of sunrise (mean latitude 10.46∘ S) and sunset (mean latitude 10.27∘ S) data are used for this plot. Solid line shows the mean ratio from standard (archived) retrieval and the green shade represents the standard deviation; dashed line shows the mean ratio from the retrieval including diurnal variations along the LOS and the horizontal lines represent the standard deviation. The asterisk symbols are the ratios from diurnal photochemical calculations at 11.25∘ S for June.
Photochemically induced changes in species concentration at twilight can cause asymmetries in the distribution along the LOS of a solar occultation observation, variations that must be considered in the retrieval algorithm. Prominent among the species that need corrections for twilight variations are NO and NO2 in the stratosphere and O3 in the mesosphere. The SAGE III/ISS instrument uses the measurements in the shortwave Hartley-Huggins band to obtain mesospheric O3 profiles. The standard retrieval procedure does not consider the LOS variations in O3 caused by photochemistry. This study describes a procedure to use results from diurnal photochemical model simulations to develop correction factors for different altitudes, latitudes, and months. These factors were used along with the archived SAGE III/ISS mesospheric O3 data for selected time periods to obtain modified O3 profiles. For the month of June 2021, it is shown that neglecting the diurnal variations can result in nearly 50 % overestimation of O3 at 64 km at lower latitudes. An approximate retrieval using the transmission data from SAGE III/ISS also indicates similar behavior in the profiles obtained with and without diurnal corrections. The retrievals were repeated for January 2021 to study the seasonal impact. Larger differences are generally seen near 70 km in the high latitude during winter, and this is most likely due to a combination of very low O3 concentrations, large twilight correction factors, and large uncertainties in the data. The results from this study are in good agreement with those obtained for the retrieval of HALOE mesospheric O3 data.
SAGE III/ISS data include a few nearly collocated sunrise and sunset measurements, mostly in the low latitudes and about 1 day apart. There are 10 pairs of such sunrise and sunset measurements in June 2021. An analysis of the sunrise to sunset ratio profiles from these data indicates that the retrievals that include the diurnal variations show qualitatively better agreement with theoretical prediction.
| (1) | O O + O |
| (2) | O O + O2 |
| (3) | O O(1D) + O2 |
| (4) | NO O + NO |
| (5) | H2O OH + H |
| (6) | H2O OH + OH |
| (7) | NO + hυ→ N + O |
| (8) | H2O + hυ→ H2+ O |
| (9) | O(1D) + O2→ O + O2 |
| (10) | O(1D) + N2→ O + N2 |
| (11) | O(1D) + H2O → OH + OH |
| (12) | O + O O2+M |
| (13) | O + O O3+M |
| (14) | O + O3→ O2+ O2 |
| (15) | O + OH → H + O2 |
| (16) | O + HO2→ OH + O2 |
| (17) | NO2+ O → NO + O2 |
| (18) | H + O HO2+M |
| (19) | O3+ OH → HO2+ O2 |
| (20) | O3+ NO → NO2+ O2 |
| (21) | O3+ H → OH + O2 |
| (22) | OH + HO2→ H2O + O2 |
| (23) | HO2+ NO → OH + NO2 |
| (24) | OH + H2O2→ H2O + HO2 |
| (25) | HO2+ HO2→ H2O2+ O2 |
| (26) | HO2+ O3→ OH + 2 O2 |
| (27) | O(1D) + H2→ OH + H |
| (28) | N + O2→ NO + O |
| (29) | N + NO → N2+ O |
| (30) | N + NO2→ N2O + O |
| (31) | H + HO2→ OH + OH |
| (32) | H + HO2→ H2O + O |
| (33) | H + HO2→ H2+ O2 |
| (34) | OH + H2→ H2O + H |
SAGE III/ISS version 5.2 data are available from https://doi.org/10.5067/ISS/SAGEIII/SOLAR_HDF5_L2-V5.2 (NASA/LARC/SD/ASDC, 2017). MLS O3 data are available from https://disc.gsfc.nasa.gov/datasets?page=1&keywords=ML2O3_005 (EOS MLS Science Team, 2022). O3 twilight ratios used in this study are available from the author. They can also be obtained from any diurnal photochemical model of the mesosphere.
MN conducted the photochemical model calculations, SAGE III/ISS O3 retrievals, the analyses described in the study, and wrote the manuscript. RD and DF provided information and guidance on the use of SAGE III/ISS mesospheric O3 data as well as comments on the manuscript.
The contact author has declared that none of the authors has any competing interests.
Publisher’s note: Copernicus Publications remains neutral with regard to jurisdictional claims in published maps and institutional affiliations.
SAGE III/ISS data used in this study were obtained from the NASA Langley Research Center Atmospheric Science Data Center. Murali Natarajan carried out this work while serving as a Distinguished Research Associate of the Science Directorate at NASA Langley Research Center. Murali Natarajan thanks Ellis Remsberg for reading and commenting on the draft version of this manuscript.
This paper was edited by Sandip Dhomse and reviewed by two anonymous referees.
EOS MLS Science Team: SAGE III/ISS L2 Solar Event Species Profiles (HDF5) V052, Earth Data [data set], https://disc.gsfc.nasa.gov/datasets?page=1&keywords=ML2O3_005, last access: 29 June 2022.
Bogumil, K., Orphal, J., Homann, S., Voigt, P., Spietz, O., Fleischmann, A., Vogel, M., Hartmann, H., Bovensmann, J., Frerick, J., and Burrows, J.: Measurements of molecular absorption spectra with the SCIAMACHY pre-flight model: instrument characterization and reference data for atmospheric remote sensing in the 230–2380 nm region, J. Photoch. Photobio. A, 157, 167–184, 2003.
Boughner, R. E., Larsen, J. E., and Natarajan, M.: The influence of NO and ClO variations at twilight on the interpretation of solar occultation measurements, Geophys. Res. Lett., 7, 231–234, 1980.
Brohede, S. M., Haley, C. S., McLinden, C. A., Sioris, C. E., Murtagh, D. P., Petelina, S. V., Llewellyn, E. J., Bazureau, A., Goutail, F., Randall, C. E., Lumpe, J. D., Taha, G., Thomasson, L. W., and Gordley, L. L.: Validation of Odin/OSIRIS stratospheric NO2 profiles, J. Geophys. Res.-Atmos., 112, D07310, https://doi.org/10.1029/2006JD007586, 2007.
Brühl, C., Drayson, S. R., Russell III, J. M., Crutzen, P. J., McInerney, J. M., Purcell, P. N., Claude, H., Gernandt, H., McGee, T. J., McDermid, I. S., and Gunson, M. R.: Halogen Occultation Experiment ozone channel validation, J. Geophys. Res., 101, 10217–10240, 1996.
Byrne, G. D. and Hindmarsh, A. C.: A polyalgorithm for the numerical solution of ordinary differential equations, ACM T. Math. Software, 1, 71–96, 1975.
Callis, L. B., Natarajan, M., Lambeth, J. D., and Boughner, R. E.: On the origin of midlatitude ozone changes: Data analysis and simulations for 1979–1993, J. Geophys. Res., 102, 1215–1228, 1997.
Connor, B. J., Siskind, D. E., Tsou, J. J., Parrish, A., and Remsberg, E. E.: Ground-based microwave observations of ozone in the upper stratosphere and mesosphere, J. Geophys. Res., 99, 16757–16770, 1994.
Dubé, K., Bourassa, A., Zawada, D., Degenstein, D., Damadeo, R., Flittner, D., and Randel, W.: Accounting for the photochemical variation in stratospheric NO2 in the SAGE III/ISS solar occultation retrieval, Atmos. Meas. Tech., 14, 557–566, https://doi.org/10.5194/amt-14-557-2021, 2021.
EOS MLS Science Team: Data Collections, Earth Data [data set], https://disc.gsfc.nasa.gov/datasets?page=1&keywords=ML2O3_005, last access: 29 June 2022.
Gordley, L. L., Russell III, J. M., Mickley, L. J., Frederick, J. E., Park, J. H., Stone, K. A., Beavee, G. M., McInerney, J. M., Deaver, L. E., Toon, G. C., Murcray, F. J.,Blatherwick, R. D., Gunson, M. R., Abbatt, J. P. D., Mauldin III, R. L., Mount, G. H., Sen, B., and Blavier, J. F.: Validation of nitric oxide and nitrogen dioxide measurements made by the Halogen Occultation Experiment for UARS platform, J. Geophys. Res.-Atmos., 101, 10241–10266, 1996.
Livesey, N. J., Read, W. G., Wagner, P. A., Froidevaux, L., Santee, M. L., Schwartz, M. J., Lambert, A., Millan Valle, L. F., Pumphrey, H. C., Manney, G. L., Fuller, R. A., Jarnot, R. F., Knosp, B. W., and Lay, R. R.: Earth Observing System (EOS) Aura Microwave Limb Sounder (MLS), Version 5.0x Level 2 and 3 data quality and description document, JPL D-105336 Rev B, https://mls.jpl.nasa.gov/data/v5-0_data_quality_document.pdf, last access: 9 November 2022.
McCormick, M. P., Lei, L., Hill, M. T., Anderson, J., Querel, R., and Steinbrecht, W.: Early results and validation of SAGE III-ISS ozone profile measurements from onboard the International Space Station, Atmos. Meas. Tech., 13, 1287–1297, https://doi.org/10.5194/amt-13-1287-2020, 2020.
NASA Jet Propulsion Laboratory (JPL): Chemical Kinetics and Photochemical Data for Use in Atmospheric Studies, JPL Publication 19-5, Evaluation Number 19, https://jpldataeval.jpl.nasa.gov/pdf/NASA-JPL_Evaluation_19-5.pdf (last access: 22 April 2022), 2020.
NASA Langley Research Center (LaRC): Stratospheric Aerosol and Gas Experiment on the International Space Station (SAGE III/ISS), Data Products User's Guide, Version 3.0, NASA LaRC, https://asdc.larc.nasa.gov/documents/sageiii-iss/guide/DPUG-G3B-2-0.pdf (last access: 9 March 2022), 2021.
NASA/LARC/SD/ASDC: SAGE III/ISS L2 Solar Event Species Profiles (HDF5) V052, Earth Data [data set], https://doi.org/10.5067/ISS/SAGEIII/SOLAR_HDF5_L2-V5.2, 2017.
Natarajan, M., Deaver, L. E., Thompson, E., and Magill, B.: Impact of twilight gradients on the retrieval of mesospheric ozone from HALOE, J. Geophys. Res., 110, D13305, https://doi.org/10.1029/2004JD005719, 2005.
Newchurch, M. J., Allen, M., Gunson, M. R., Salawitch, R. J., Collins, G. B., Huston, K. H., Abbas, M. M., Abrams, M. C., Chang, A. Y., Fahey, D. W., Gao, R. S., Irion, F. W., Loewenstein, M., Manney, G. L., Michelson, H. A., Podolske, J. R., Rinsland, C. P., and Zander, R.: Stratospheric NO and NO2 abundances from ATMOS Solar-Occultation Measurements, Geophys. Res. Lett., 23, 2373–2376, https://doi.org/10.1029/96GL01196, 1996.
Parrish, A., Boyd, I. S., Nedoluha, G. E., Bhartia, P. K., Frith, S. M., Kramarova, N. A., Connor, B. J., Bodeker, G. E., Froidevaux, L., Shiotani, M., and Sakazaki, T.: Diurnal variations of stratospheric ozone measured by ground-based microwave remote sensing at the Mauna Loa NDACC site: measurement validation and GEOSCCM model comparison, Atmos. Chem. Phys., 14, 7255–7272, https://doi.org/10.5194/acp-14-7255-2014, 2014.
Remsberg, E., Damadeo, R., Natarajan, M., and Bhatt, P.: Observed responses of mesospheric water vapor to solar cycle and dynamical forcings, J. Geophys. Res., 123, 3830–3843, https://doi.org/10.1002/2017JD028029, 2018.
Russell III, J. M., Farmer, C. B., Rinsland, C. P., Zander, R., Froidevaux, L., Toon, G. C., Gai, B., Shaw, J., and Gunson, M.: Measurements of Odd Nitrogen Compounds in the Stratosphere by the ATMOS Experiment on Spacelab 3, J. Geophys. Res., 3, 1718–1736, 1988.
SAGE III ATBD Team: SAGE III Algorithm Theoretical Basis Document (ATBD) Solar and Lunar Algorithm, LaRC 475-00-109, Version 2.1, https://eospso.gsfc.nasa.gov/sites/default/files/atbd/atbd-sage-solar-lunar.pdf (last access: 8 March 2022), 2002.
Sauvageat, E., Maillard Barras, E., Hocke, K., Haefele, A., and Murk, A.: Harmonized retrieval of middle atmospheric ozone from two microwave radiometers in Switzerland, Atmos. Meas. Tech., 15, 6395–6417, https://doi.org/10.5194/amt-15-6395-2022, 2022.
Strode, S. A., Taha, G., Oman, L. D., Damadeo, R., Flittner, D., Schoeberl, M., Sioris, C. E., and Stauffer, R.: SAGE III/ISS ozone and NO2 validation using diurnal scaling factors, Atmos. Meas. Tech., 15, 6145–6161, https://doi.org/10.5194/amt-15-6145-2022, 2022.
Wang, H. J. R., Damadeo, R., Flittner, D., Kramarova, N., Taha, G., Davis, S., Thompson, A. M., Strahan, S., Wang, Y., Froidevaux, L., Degenstein, D., Bourassa, A., Steinbrecht, W., Walker, K. A., Querel, R., Leblanc, T., Godin-Beekmann, S., Hurst, D., and Hall, E.: Validation of SAGE III/ISS solar occultation ozone products with correlative satellite and ground-based measurements, J. Geophys. Res., 125, e2020JD032430, https://doi.org/10.1029/2020JD032430, 2020.
Yue, J., Russell III, J., Gan, Q., Wang, T., Rong, P., Garcia, R., and Mlynczak, M. :Increasing water vapor in the stratosphere and mesosphere after 2002, Geophys. Res. Lett., 46, 13452–13460, https://doi.org/10.1029/2019GL084973, 2019.
- Abstract
- Introduction
- Mesospheric O3 variations at sunrise and sunset
- SAGE III/ISS mesospheric ozone
- Comparisons with other measurements
- Sunrise to sunset ratio
- Summary
- Appendix A: Photochemical reactions considered in the mesospheric diurnal model
- Data availability
- Author contributions
- Competing interests
- Disclaimer
- Acknowledgements
- Review statement
- References