the Creative Commons Attribution 4.0 License.
the Creative Commons Attribution 4.0 License.
 | 20 Feb 2023
Retrieval of microphysical parameters of monsoonal rain using X-band dual-polarization radar: their seasonal dependence and evaluation
Kumar Abhijeet
Nidamanuri Rama Rao
Kasimahanthi Amar Jyothi
Multiyear measurements from a Joss–Waldvogel disdrometer (5 years) and X-band dual-polarization radar (2 years) made at Gadanki (13.5∘ N, 79.18∘ E), a low-latitude station, are used to (i) retrieve appropriate raindrop size distribution (DSD) relations for monsoonal rain, (ii) understand their dependency on temperature, the raindrop size shape model and season and (iii) assess polarimetric radar DSD retrievals by various popular techniques (the exponential (Exp), constrained Gamma (CG), normalized Gamma (N-Gamma) and β methods). The coefficients obtained for different DSD relations for monsoonal rain are found to be different from those of existing relations elsewhere. The seasonal variation in DSD is quite large and significant, and as a result, the coefficients also vary considerably between the seasons. The slope of the drop size–shape relation, assumed to be constant in several studies, varies considerably between the seasons, with warmer seasons showing a smaller slope value than the cold season. It is found that the constant (0.062) used in linear drop shape models is valid only for the cold season. The derived coefficients for the CG method for different seasons coupled with those available in the literature reveal that the warm seasons/regions typically have larger curvature and slope values than in the cold seasons/regions. The coefficients of the mass-weighted mean diameter (Dm) and differential reflectivity (ZDR) exhibit a strong dependency on the drop shape model, while those for the derivation intercept parameter exhibit a strong seasonal dependency. Using the retrieved relations and X-band polarimetric radar at Gadanki, four popular DSD methods are evaluated against disdrometer measurements collected over 12 events. All the methods estimated Dm reasonably well with the small root mean square error but failed to estimate the intercept parameter accurately. Only the N-gamma method estimated the normalized intercept parameter reasonably. Problems associated with specific differential-phase (KDP)-based estimates close to the radar location, particularly during overhead convection, are also discussed.
- Article
(4582 KB) - Full-text XML
- BibTeX
- EndNote


Raindrop size distribution (DSD) is the fundamental property of precipitation, and its space–time variability depends on a variety of microphysical and dynamical processes inside and below clouds (Radhakrishna and Rao, 2009; Rao et al., 2009; Rosenfeld and Ulbrich, 2003). Such information is crucial even for numerical weather prediction models as these microphysical processes are fundamental blocks in microphysical schemes (Gao et al., 2011). Knowledge of DSD is not only required for fundamental understanding of microphysical processes, but also for a variety of operational applications in the fields of the hydrology, meteorology, agriculture, and road transportation sectors (Rosenfeld and Ulbrich, 2003; Serio et al., 2019; Uijlenhoet, 2001, and references therein). Disdrometers provide this crucial information continuously but only at the Earth's surface. Radars, on the other hand, provide DSD in both space and time and therefore play a major role in improving our understanding of microphysical processes in a variety of precipitating systems (Ryzhkov and Zrnic, 2019).
Remarkable progress has been made in polarimetric (dual-polarization) radar technology and its utilization for research and operational applications in the recent past (Bringi and Chandrasekar, 2001; Rauber and Nesbitt, 2018; Ryzhkov et al., 2022; Ryzhkov and Zrnic, 2019). Besides improving the rain rate estimation, the polarimetric radars offer unique information on microphysical properties of precipitation, like the DSD (Anagnostou et al., 2008a; Cao and Zhang, 2009; Gorgucci et al., 2001; Koffi et al., 2014; Maki et al., 2005; Moisseev and Chandrasekar, 2007; Penide et al., 2013; Seliga and Bringi, 1976; Zhang et al., 2001). They also provide information on the shape, orientation and phase state of hydrometeors by employing sophisticated hydrometeor classification algorithms like fuzzy logic and Bayesian classification (Liu and Chandrasekar, 2000; Marzano et al., 2007; Vivekanandan et al., 1999; Zrnic et al., 2001). Several earlier studies demonstrated that the DSD parameters can be used not only to understand the microphysics of precipitation and clouds, but also to improve rain rate estimation (Zhang et al., 2001; Gorgucci et al., 2001; Vivekanandan et al., 2003; Vulpiani et al., 2006; Brandes et al., 2004a; Cao et al., 2010, 2008; Gosset et al., 2010; Anagnostou et al., 2013; Koffi et al., 2014; Ryzhkov and Zrnic, 2019). They have shown that DSD-based rain rate estimation outperforms the fixed power law rainfall estimation from reflectivity fields and is equivalent to those derived with multi-parameter retrievals of rainfall with polarimetric radars (Anagnostou et al., 2010; Brandes et al., 2003; Vivekanandan et al., 2003).
Earlier studies followed various approaches to retrieve the DSD from polarimetric radars: statistical techniques and physics-based empirical relations between DSD model parameters and polarimetric products. Statistical methods, including neural networks (Vulpiani et al., 2006), Bayesian (Cao et al., 2010) and different variants of Bayesian, like variational methods (Cao et al., 2013; Yoshikawa et al., 2016), find the nonlinear relationships between DSD and polarimetric parameters by making use of mathematical techniques. These methods either train the chosen model or build an a priori database using existing information, which will then be used to retrieve DSD parameters. Physics-based methods assume that the DSD follows some functional form (exponential, gamma or normalized gamma) and derive a relation between DSD model parameters and polarimetric radar parameters empirically. Different methods have evolved over the years since: the Seliga and Bringi (1976) exponential method (Exp.), including constrained gamma (CG) (Zhang et al., 2001), Beta (β) (Gorgucci et al., 2000), normalized gamma (N-Gamma) (Bringi et al., 2002; Anagnostou et al., 2008a; Tokay et al., 2020a), the generalized gamma model (Thurai and Bringi, 2018), the double-moment model (Raupach and Berne, 2017), self-consistent with optical parameterization attenuation correction and microphysics estimation (SCOPE-ME) (Anagnostou et al., 2009), and the inverse model (Alcoba et al., 2022; Wen et al., 2018).
Among the above methods, the Exp., CG, N-Gamma and β methods are extensively used by researchers. The two-parameter exponential model assumes that the distribution of raindrops follows an exponential form, and its parameters can be retrieved from two polarimetric measurements, namely, the horizontal reflectivity factor (ZH) and differential reflectivity (ZDR) (Seliga and Bringi, 1976). The CG method assumes that the DSD follows a gamma distribution (Ulbrich, 1983), and the retrieval of the three gamma parameters is achieved using two independent polarimetric measurements and an empirically derived constrained relation between shape (μ) and slope (Λ) parameters of the gamma distribution (Brandes et al., 2004a; Zhang et al., 2001). The β method follows the normalized DSD concept, described in Willis (1984), Illingworth and Blackman (2002) and Testud et al. (2001). Here, the DSD is normalized with respect to liquid water content, which allows the study of variations in DSD shape by accounting for variations of water content. In addition, this method considers the raindrop shape–diameter relation to be a variable (Gorgucci et al., 2001) instead of a fixed relation for the equilibrium shape of a raindrop (Pruppacher and Beard, 1970). The ZH, ZDR and specific differential phase (KDP) are used to obtain the slope (β) of the above relation, which intrinsically considers changes in drop oblateness that increase with the size of a raindrop.
Earlier studies derived/generated several empirical relations relating to polarimetric variables at different frequencies to obtain the DSD parameters. Some of these relations are obtained from simulations or parameterizations, and the others from observations (Adirosi et al., 2020; Anagnostou et al., 2008a, b; Brandes et al., 2004a, b; Gorgucci et al., 2001; Maki et al., 2005; Rao et al., 2006; Seliga and Bringi, 1976; Tang et al., 2014; Tokay et al., 2020b; Zhang et al., 2001, and references therein). Unfortunately, the above relations are found to be quite different at different locations due to large DSD variations (Brandes et al., 2004b; Chen et al., 2017; Chu and Su, 2008; Kim et al., 2020; Kumar et al., 2011; Rao et al., 2006; Seela et al., 2018; Tang et al., 2014; Zhang et al., 2001; Zheng et al., 2020). Not only between regions, the DSD and μ-Λ relations are also found to vary between different regimes (i.e., eye wall and rain bands) of a cyclone (Bao et al., 2020). These variations are caused primarily by different prevailing atmospheric conditions (in different geographical regions), in which the drop forms and the DSD evolves (Lee and Zawadzki, 2005). The above-reported relations are based on the data from America, Japan, Taiwan, Singapore, Italy and China and therefore are more appropriate for the above regions, while such relations do not exist for India (barring one study by Rao et al. (2006) using a limited dataset). The first objective of this paper is to derive suitable DSD retrieval relations at the X-band for monsoonal rainfall over the Indian region, where several X-band polarimetric radars are either installed or being installed. An X-band dual-polarization radar (DROP-X – Dual polarization Radar for Observing Precipitation at X-band), developed indigenously, recently became operational at Gadanki (13.5∘ N, 79.18∘ E) (Rao et al., 2023).
It is also known from earlier studies that the DSD varies not only with the climatic regime, but also with the season at the same location. For example, the DSD at a single station can be influenced by both the oceanic and continental systems, depending on the wind and circulation patterns (Kozu et al., 2006; Radhakrishna and Rao, 2009; Rao et al., 2009, 2001; Tokay et al., 2002; Lavanya et al., 2019). Recently, Rao et al. (2018) noted large differences in the coefficients of attenuation correction relations in different seasons. Given such large variability in DSD from one season to the other in southeastern peninsular India, one should also examine the impact of the observed seasonal variation on the DSD retrieval methods. This forms the second objective of this paper.
There have been differences of opinion about the validity of the retrieval of the above relations (μ–Λ relation and β method), the usage of the DSD models (exponential vs. gamma vs. normalized gamma) and the drop shape–size relations (linear and constant vs. linear but variable vs. polynomial). Earlier, a few studies compared different DSD retrieval techniques (Anagnostou et al., 2008b, a; Brandes et al., 2006, 2004a; Tokay et al., 2020b; Zhang et al., 2006). Such efforts were not made for monsoonal rain. Given the large seasonal variability in DSD, it is important to evaluate such schemes using observations from polarimetric radars. The present study, therefore, evaluates the retrieved mass-weighted mean diameter (Dm) and intercept parameter (N0) or normalized intercept parameter (NW) of DSD from DROP-X measurements and the derived relations.
The remainder of this paper is organized as follows. Section 2 describes the instruments, data and methodology (scattering simulations, deriving polarimetric products and DSD models) used in the present study. Relations between polarimetric products and exponential/gamma model parameters are empirically derived in Sect. 3. Seasonal dependence of the coefficients of the above relations and their variation with temperature are also discussed in Sect. 3. The retrieved DSD parameters from radar measurements are evaluated against the independent reference dataset in Sect. 4. Section 5 summarizes important findings from the present study.
2.1 Data and instrumentation
Measurements from DROP-X and the collocated Joss–Waldvogel disdrometer (JWD) at the National Atmospheric Research Laboratory (NARL), Gadanki, are used in the present study. Gadanki is located in a complex hilly terrain of varying heights in the range of 200–500 m above ground level. It is located in southeastern India and experiences rain in three seasons. The southwestern monsoon (SWM – June through September) is the main monsoon season, in which it receives ∼ 53 % of its annual rainfall. This region also receives considerable rainfall (35 % of annual rainfall) during the northeastern monsoon (NEM – October through December), and the remaining annual rainfall occurs during the pre-monsoon season (PRE – March through May) (Rao et al., 2009; Radhakrishna and Rao, 2021). The rainfall is predominantly convective in nature (53.3 % of the total rainfall), while stratiform rain (30.2 %) and shallow rain (16.6 %) contribute considerably (Rao et al., 2008; Saikranthi et al., 2014).
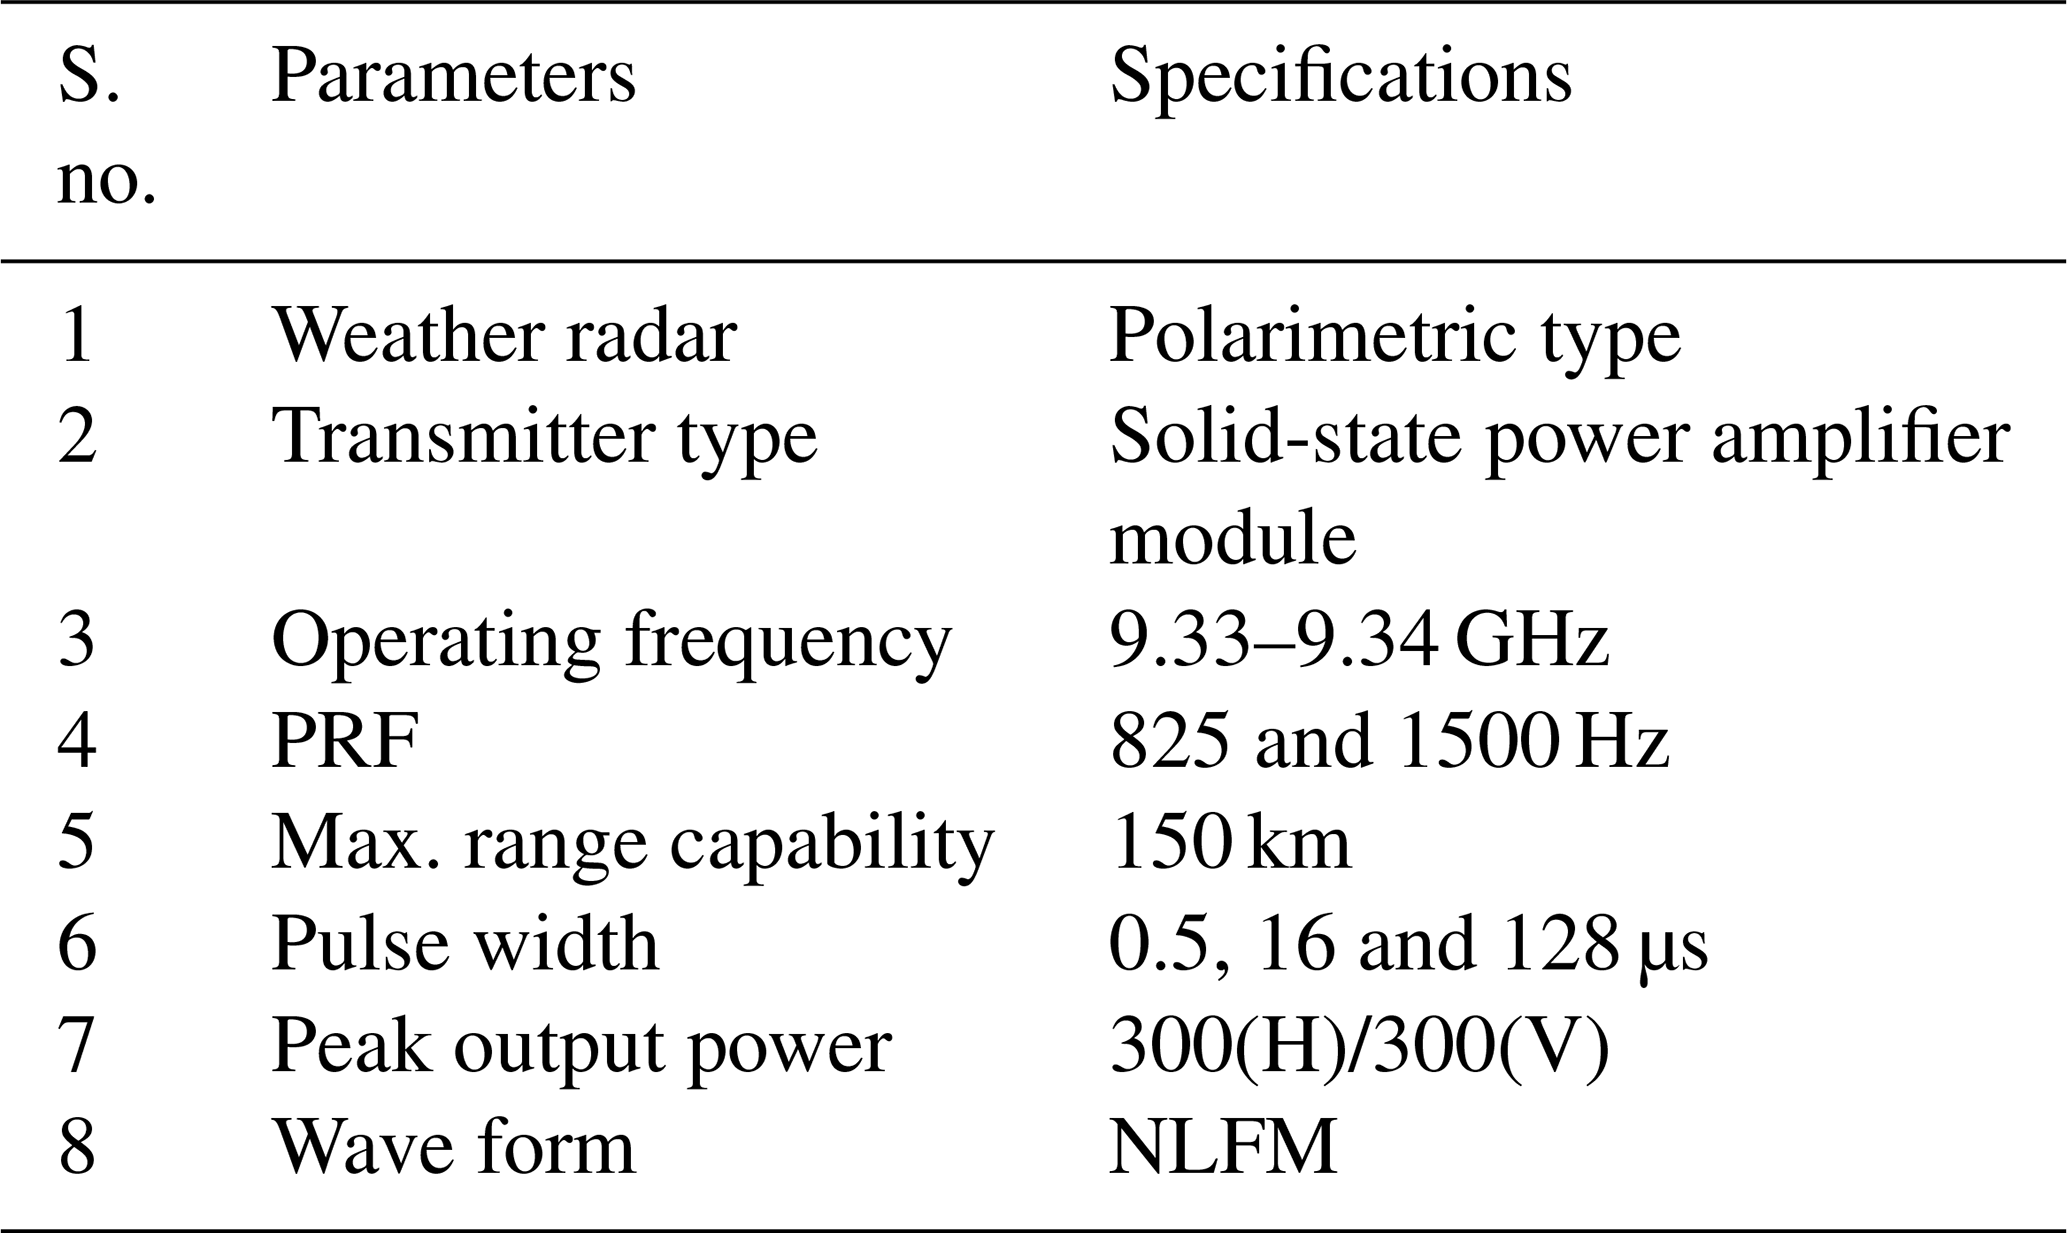
DROP-X was developed in-house by the Radar Development Area (RDA) of the ISRO Telemetry, Tracking and Command Network (ISTRAC) and NARL. The radar is placed on top of a building of 13 m height constructed on a small hillock to minimize blockages due to the local canopy. DROP-X operates in the frequency range of 9.33–9.34 GHz and has two independent channels for transmission and reception for horizontal and vertical polarized signals. It is equipped with two solid-state transmitters with a peak power of 300 W, one each for each polarization. Other important specifications of the radar are given in Table 1. For the present study, measurements made during 2019 and 2020 are utilized. During the above period, DROP-X was operated in regular plan position indicator (PPI) mode with a revolution speed of two revolutions per minute (rpm) and at 10 elevations (1–10∘ with an interval of 1∘). Each volume scan takes ∼ 6 min.
The JWD (RD-80) at Gadanki, used in the present study, is an impact-type disdrometer that records the number of raindrops hitting the 50 cm2 surface of the sensor. It can identify 128 sizes of raindrops with diameters ranging from 0.3 to 5.4 mm and later arranges the data collected in 1 min into 20 drop-sized channels. All rain integral parameters like reflectivity (Z), rainfall rate (R) and Dm are estimated directly from the measured DSD using standard formulae (Rao et al., 2001). The measurements were corrected for the dead time of the instrument (Sheppard and Joe, 1994). Five years (2016–2020) of JWD measurements were used in the present study. First, 3 years of data are used to obtain coefficients of the relations between polarimetric radar measurements and geophysical parameters. Few quality checks have been performed to retain good-quality data. The data are considered to be valid only when R is greater than 0.5 mm h−1 and available in at least four continuous drop-sized channels of the disdrometer. A total of 26 449 min of DSD data satisfied the above quality checks and are used in the present study. The latter 2 years of data are also subjected to the above quality checks and then are used to evaluate the performance of DSD retrievals with DROP-X. The disdrometer is located ∼ 200 m away from the radar location and at an azimuth angle of 77.5∘. To match the radar temporal resolution (i.e., ∼ 6 min for the completion of one volume scan), disdrometer data are averaged over 6 min. The radar measurements around the disdrometer are also averaged to obtain the statistically robust estimate. For averaging, data of three range bins each in three azimuthal directions centered around the disdrometer location and at three elevation angles (4, 5 and 6∘) are utilized (i.e., a volume averaging of 450 m × 10.5 m × 10.5 m at a height of 17 m above the disdrometer). The elevation angles are chosen in such a way that the targeted volume is as close as possible to the reference disdrometer but not contaminated by the ground clutter.
2.2 Methodology to retrieve polarimetric parameters
The scattering and extinction amplitudes are calculated using T-matrix scattering simulations (Mishchenko et al., 1996), following raindrop size shape models and parameters used for these simulations. Scattering amplitudes are computed at 9.34 GHz frequency with four standard raindrop size–shape models (Pruppacher and Beard, 1970; Beard and Chuang, 1987; Andsager et al., 1999; Brandes et al., 2002). Though simulations with the Andsager et al. (1999) model are finally used in our analysis, simulations with the other raindrop size shape models mentioned above are also performed to check the dependency of scattering amplitudes and retrieved polarimetric radar parameters on the drop shape model. The axis ratio is assumed to be the same as that given by the above drop shape models. Since the Brandes et al. (2002) model has accounted for the effect of raindrop oscillations in their axis ratio, no additional canting angle distribution is considered when it is used in simulations. For simulations with other drop shape models, the Gaussian canting angle distribution with a mean of 0∘ and a standard deviation of 10∘ is considered. Simulations are performed at different environmental temperatures, from 0 to 30 ∘C with an interval of 5 ∘C, to understand the dependency of scattering amplitudes on temperature, as performed by Rao et al. (2018).
The polarimetric radar parameters ZHH, ZDR and KDP can be written as follows.
D (mm) is the equivalent diameter of raindrops, λ (mm) is the radar wavelength and is the complex scattering amplitude at horizontal or vertical polarization for raindrops of diameter D, with the parameter α being the angle between the incident and scattering direction (in radian, 0 for forward scattering and π for back scattering). Re means the real part of a complex number (Bringi and Chandrasekar, 2001; Doviak and Zrnić, 1993; Ryzhkov and Zrnic, 2019). A1, A2, A3 and A4, are angular moments for the orientation of the raindrop, and Forient is the orientation factor which depends on the width of the canting angle distribution (Ryzhkov and Zrnic, 2019). ZHH and ZVV (dBZ) are the reflectivity factors in the horizontal (both transmission and reception) and vertical (both transmission and reception) polarizations, respectively.
3.1 Seasonal variation in DSD
Earlier studies have shown large seasonal variations in DSD in southeastern India and studied their impact on Z–R relations and attenuation correction algorithms (Kozu et al., 2006; Radhakrishna et al., 2009; Rao et al., 2018, 2009, 2001; Sulochana et al., 2016). Since the present dataset is different from that used in earlier studies (Radhakrishna et al., 2009; Rao et al., 2009, 2001), the seasonal means of N(D) at different R and variation of Z and Dm with R are examined to check whether the present dataset is able to reproduce earlier results on the seasonal behavior of DSD. Figure 1a and b show the variation of the seasonal mean N(D) with D for different seasons in two rain rate class intervals (5–10 and 15–20 mm h−1), respectively. The DSD exhibits clear seasonal variation at both rain rates, with smaller drops predominantly occurring during the NEM and a considerable number of bigger drops during the warm seasons (PRE and SWM). The observed seasonal variation corroborates earlier studies and also reaffirms that these variations are robust and characteristic features of this region. The reduction of smaller drops during the warm seasons is attributed to the dominance of some microphysical processes, like evaporation and drop sorting, during those seasons (Radhakrishna et al., 2009).
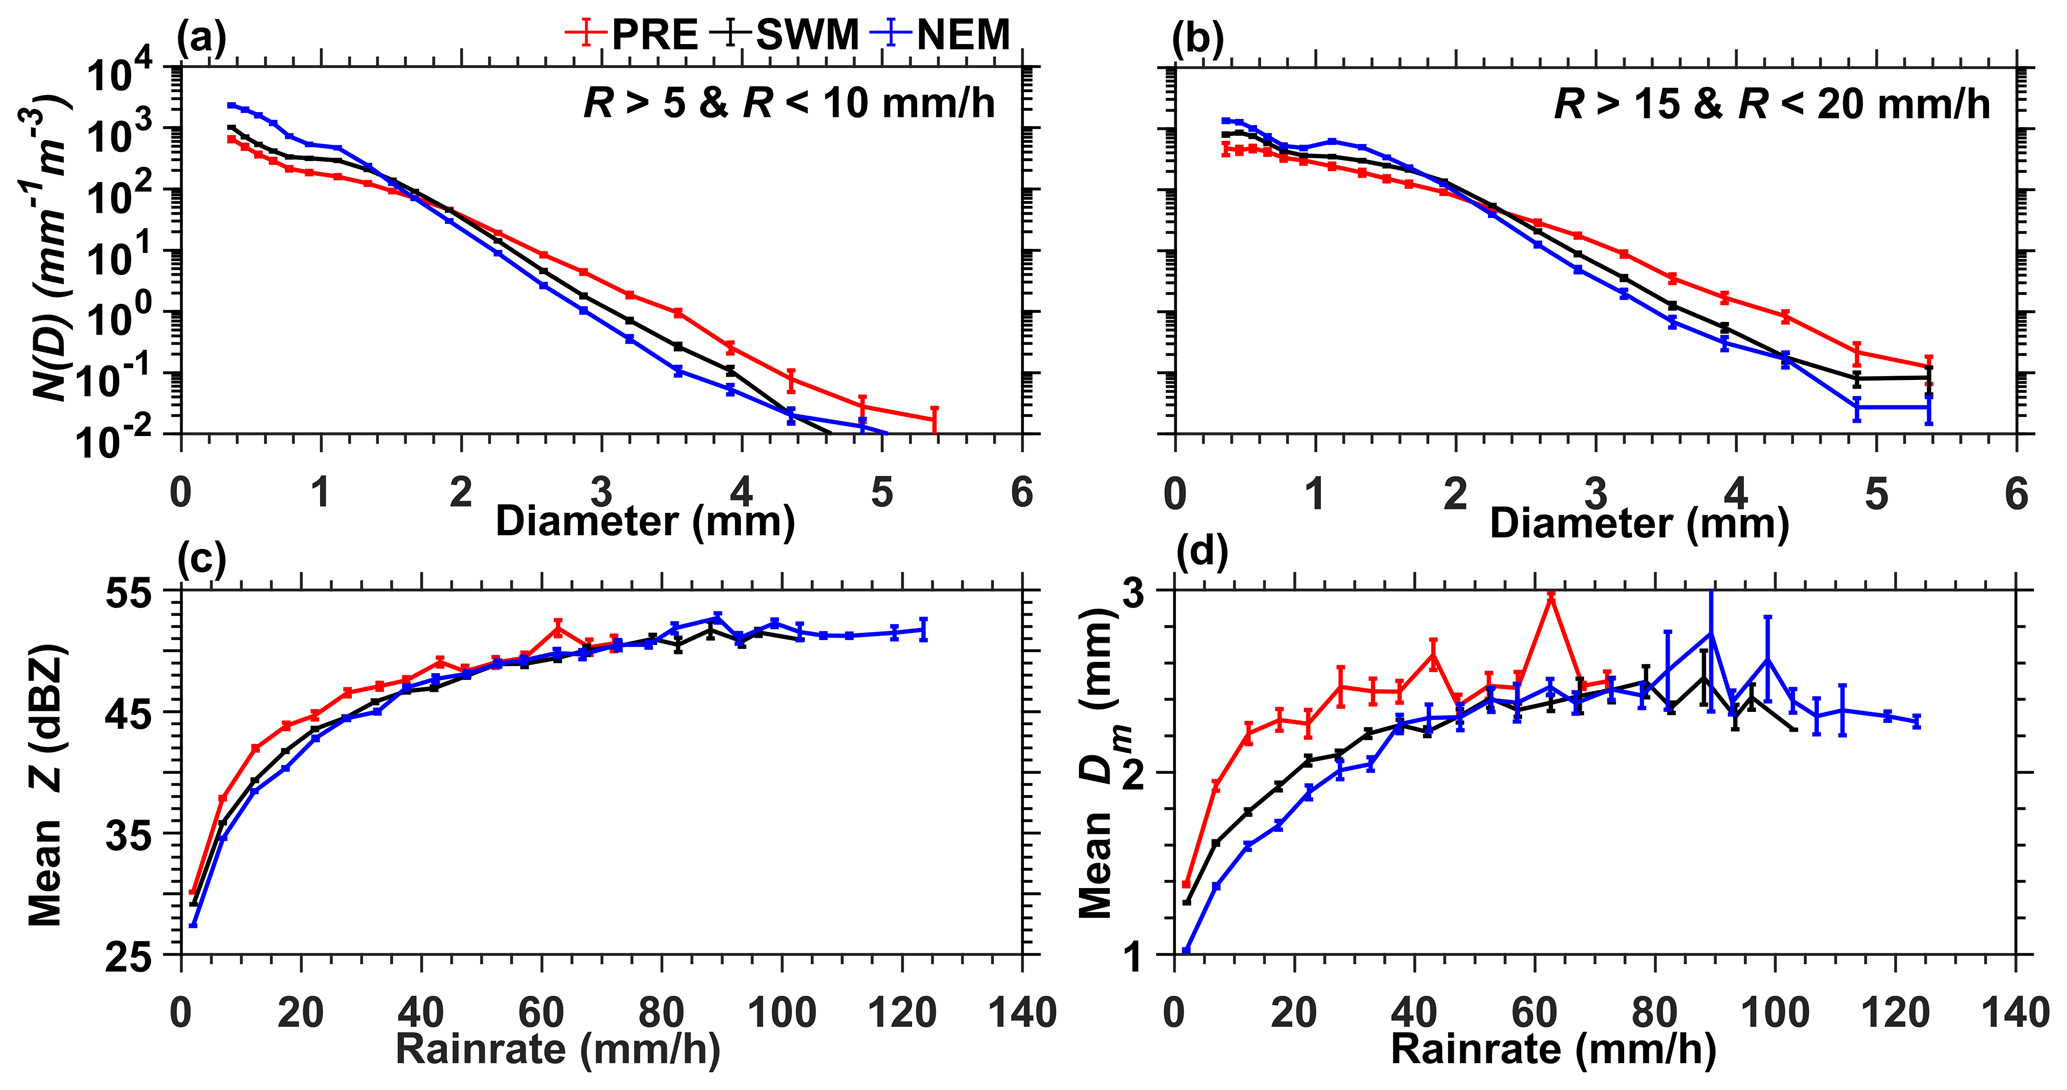
Figure 1Seasonal mean DSD variation between the three seasons for two rain rate intervals, i.e., (a) 5–10 and (b) 15–20 mm h−1. Variation of (c) mean Z and (d) mean Dm with R during different seasons. The data within each rain rate interval are averaged to obtain mean values. The error bar represents the standard deviation of the mean in each rain rate interval.
Due to the observed large seasonal variations in DSD, the bulk rainfall parameters like Z, R and Dm may also vary. Figure 1c and d, respectively, show the variation of mean values of Dm and Z (along with standard errors) with R in different seasons. The means are taken over the entire data in the respective R class intervals (5 mm h−1). As expected, clear seasonal differences are apparent in bulk rain parameters also. Both Dm and Z are larger during the PRE, the hottest and convection-dominant season (Saikranthi et al., 2014), than in the other seasons, when R is less than 60 mm h−1. These values are small during the NEM among all the seasons, mainly due to the presence of more (fewer) smaller (bigger) drops than in the other seasons, as can be evidenced from Fig. 1. The seasonal differences in bulk parameters are somewhat ambiguous at very high R (> 70 mm h−1).
3.2 Retrieval of DSD relations for different seasons with various DSD models
3.2.1 Exponential method
The two-parameter exponential distribution with an intercept parameter (N0) and slope parameter (Λ) is the most widely used model to represent DSD in microphysical parameterization schemes and is mathematically represented as follows:
To obtain the intercept and slope parameters of the exponential distribution, first, the Dm is derived from the polarimetric measurement of ZDR using an empirically derived relation. As Dm and Λ of the exponential distribution are related by a simple equation, , the Λ can be estimated from Dm. The other parameter N0 is derived from ZH and the retrieved Dm using another empirical relation between them (Seliga and Bringi, 1976). The most important step in this process is to derive appropriate empirical relations between Dm and ZDR and and Dm: both vary with DSD and therefore are region-dependent.
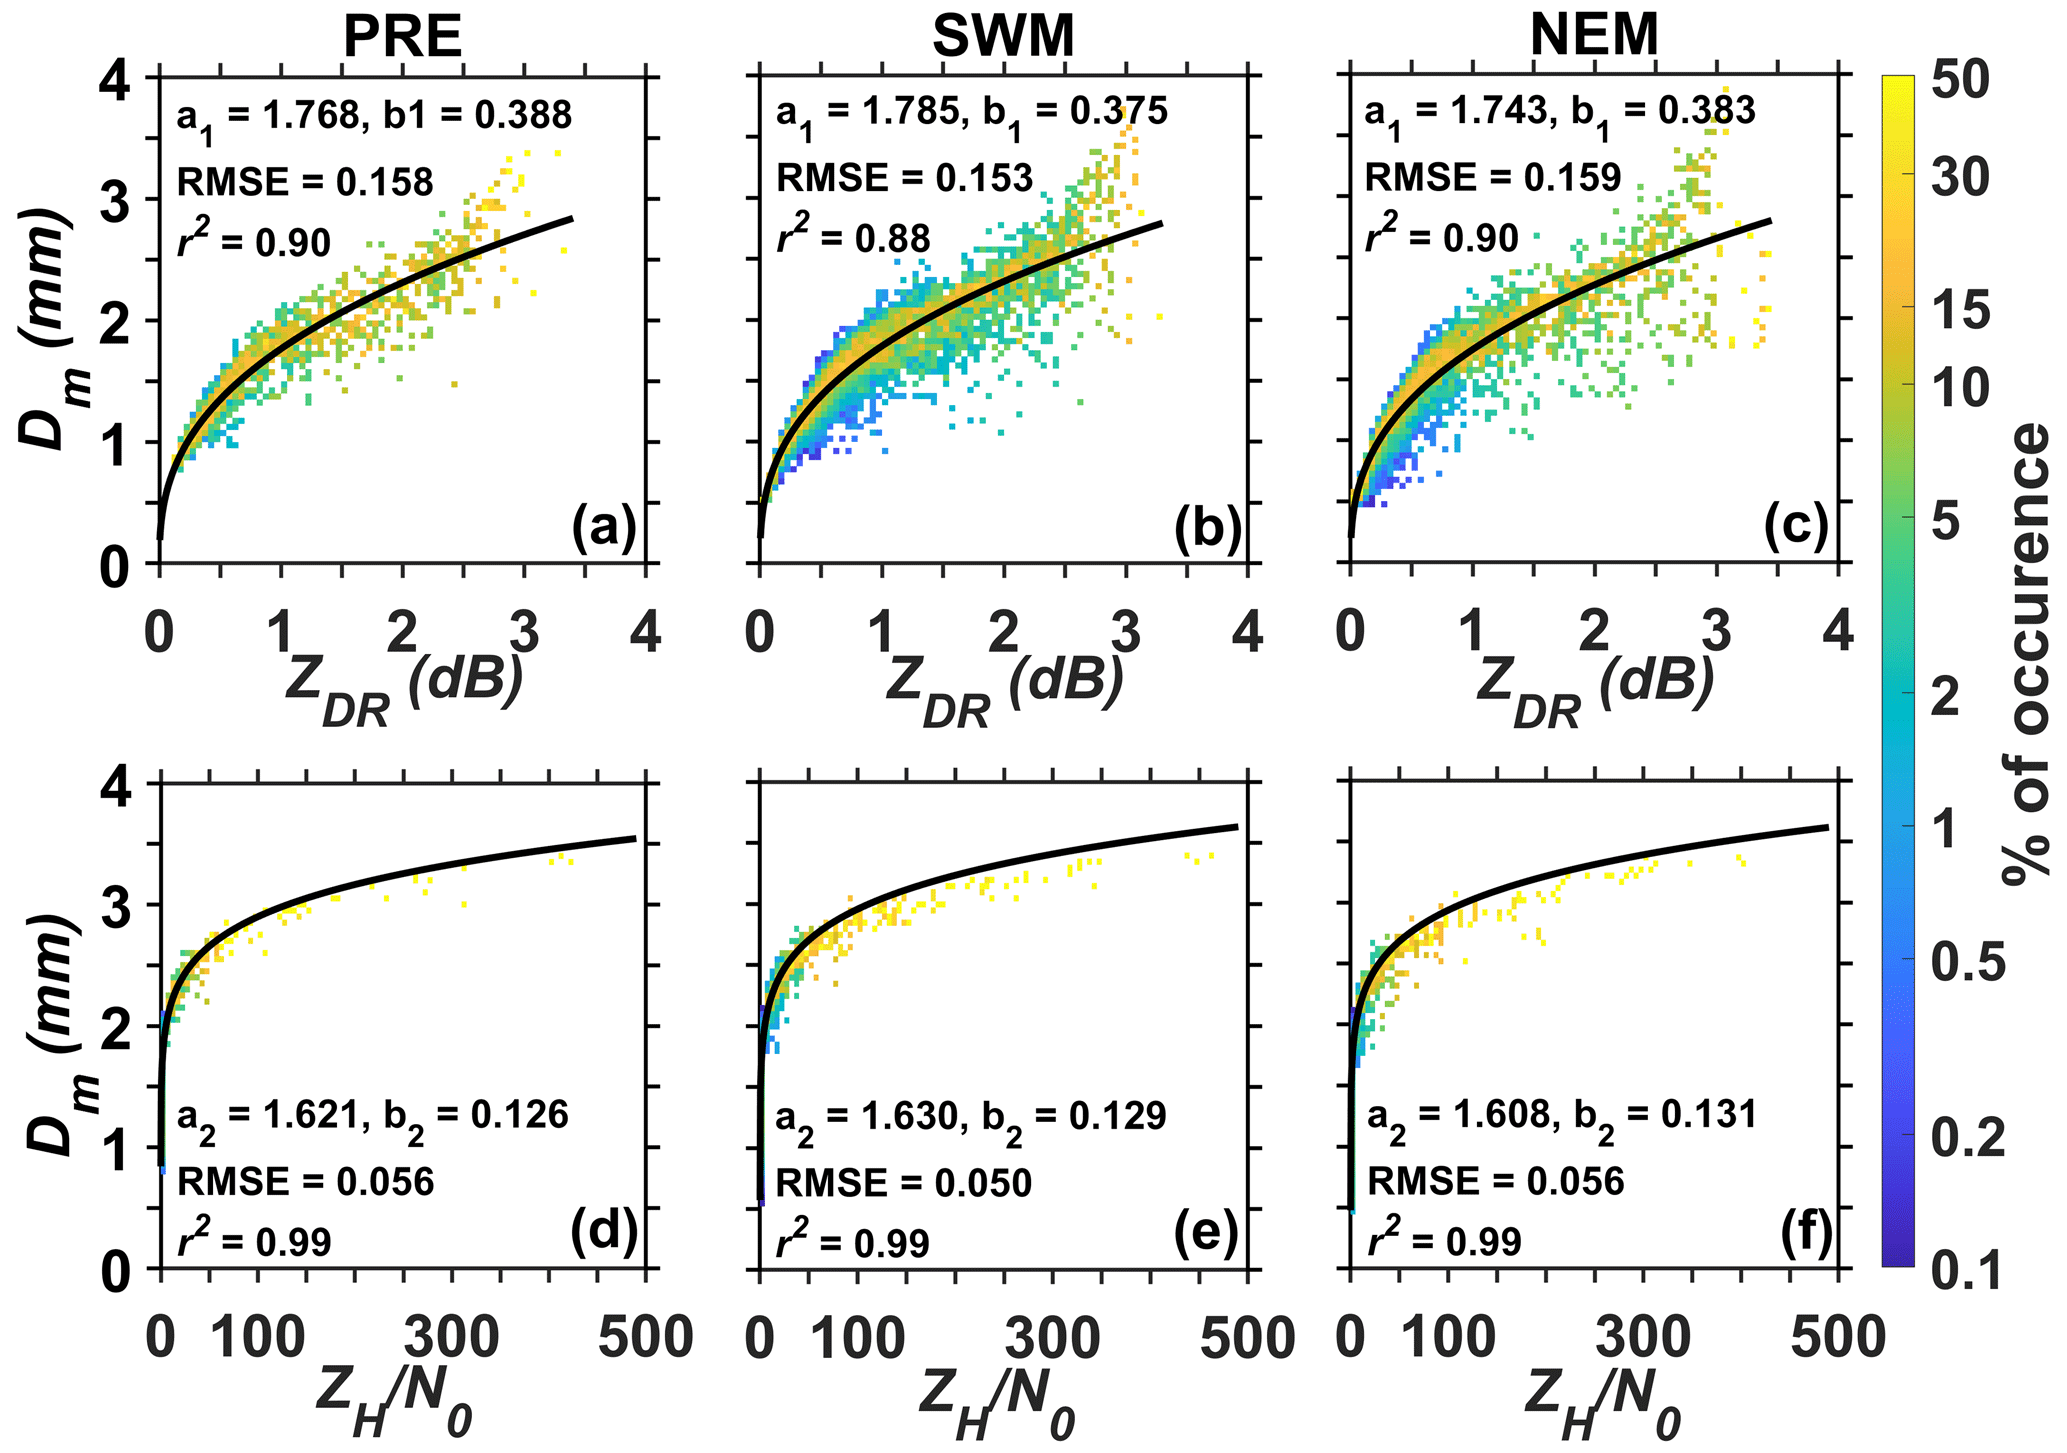
Figure 2Scatter plots between ZDR and Dm for the (a) PRE, (b) SWM and (c) NEM seasons. (d–f) Same as (a)–(c) but for and Dm. The color indicates the percentage occurrence of data in each cell. The power law regression fit is overlain (solid line) on the data.
These empirical relations are retrieved from the scatter plots between ZDR, Dm, and Dm (Fig. 2). Some of these parameters required for the scatter plots are computed directly from disdrometer measurements (R, Z and Dm), while other polarimetric products are estimated from T-matrix scattering simulations (Eqs. 1–4). The exponential parameters are estimated using the method of moments following Smith (2003). A power law fit, of the form given below, is applied to the data in Fig. 2 to obtain the coefficients in different seasons.
ZDR is represented in normal units.
Power law regression fits of the form shown in Eq. (6) are fitted to the data, and the coefficients (prefactor and exponent) are also shown in the figure. Good correlation is found between ZDR and Dm in all the seasons, with correlation coefficients (r2) of 0.9, 0.88 and 0.9 for PRE, SWM and NEM, respectively. The correlation and root mean square error (RMSE) values during SWM indicate that the correlation is relatively weak during that season. Although some scatter exists around the regression fits, the majority of the points (as can be seen from the color bar) are close to the fit. The variance due to the scatter provides the theoretical limit on the retrieval of DSD parameters. The coefficients of the relation change with season in accordance with the seasonal variations in DSD. From the retrieved coefficients it is clear that the Dm values will be larger for the same ZDR during PRE and NEM than in SWM. Also, the errors due to the usage of a single relation compared to seasonal relations are estimated in different seasons (not shown here). It is found that the usage of a single relation will produce considerable error during SWM (mean error of 6 % ± 4.2 %), the main rainy season for the study region. The correlation between and Dm (Fig. 2d–f) is excellent in all seasons, with an r2 of 0.99. The data also closely follow the regression fits, indicating the goodness of the fit. Though the prefactor is nearly equal in all the seasons, the variation in the exponent makes a difference of ∼ 20 %–30 % in the N0 value between the seasons for the same and Dm. In other words, separate relations are required for different seasons to reduce the uncertainty in DSD retrievals.
Only a few studies exist (Gosset et al., 2010; Matrosov et al., 2005) on the exponential method for the retrieval of microphysical information with X-band radars. Most of the existing studies were done at longer wavelengths, at the S and C bands. Gosset et al. (2010) obtained these power law coefficients using 11 600 DSD samples collected during the AMMA field campaign in Africa. They also noted large differences in coefficients, when they retrieved different raindrop size shape models. The coefficients with the Pruppacher and Beard (1970) model, in particular, are quite different from those obtained with other models in Africa, as seen at Gadanki. The coefficients derived at Gadanki are nearly equal to those obtained in Africa, when they are retrieved with the Andsagar et al. (1999) and Goddard et al. (1995) models. On the other hand, Matrosov et al. (2005) noted a weak dependency of coefficients on drop shape models (< 6 %) based on disdrometric measurements made along the western coast of the United States of America, which is considered to be negligible compared to the scatter in the data used to derive the above relation.
3.2.2 Constrained gamma method
Ulbrich (1983) noted that the exponential model may not adequately represent all variations in DSD, particularly in the lower drop regime in tropical precipitation. A three-parameter gamma model is then proposed to represent all types of raindrop spectra (Ulbrich, 1983), which are expressed in the form of
where μ is the shape factor of the DSD.
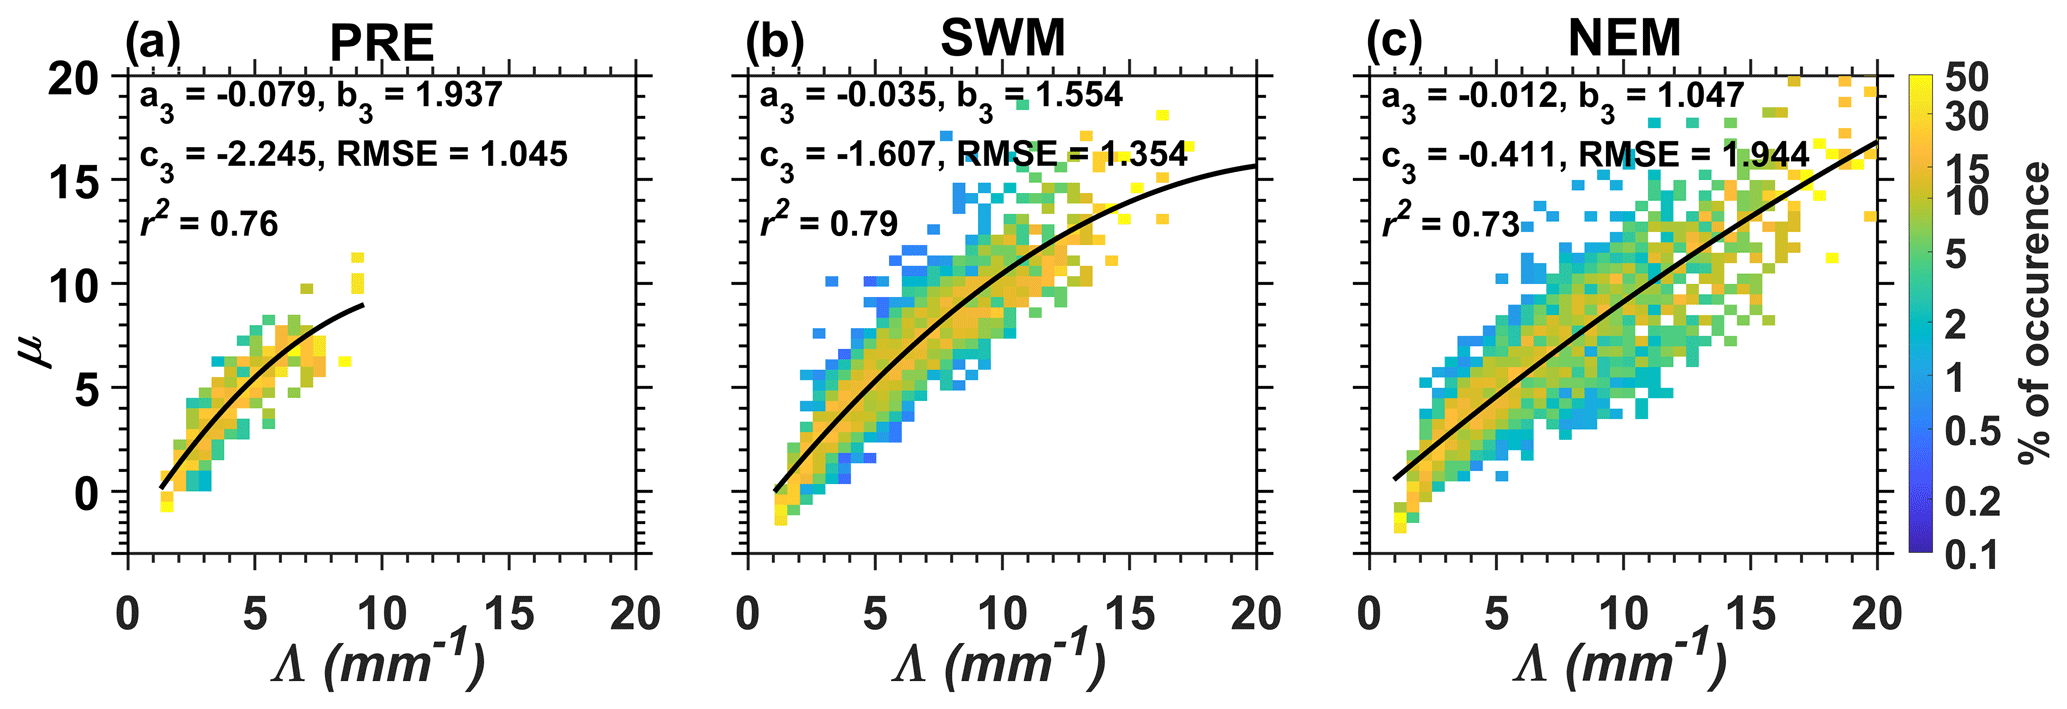
Figure 3Scatter plots between μ and Λ during the (a) PRE, (b) SWM and (c) NEM seasons. The color indicates the percentage occurrence of data in each cell. The power law regression fit is overlain (solid line) on the data. The statistics of regression fits are also depicted in each panel of the figure.
To estimate three parameters of the gamma distribution, three independent polarimetric variables are required. Earlier studies have shown that the three parameters of the gamma DSD model are not completely independent (Chandrasekar and Bringi, 1987; Haddad et al., 1997; Kozu and Nakamura, 1991; Ulbrich, 1983). This can be of great significance because it reduces the three parameters of the gamma DSD to two parameters by constraining any two parameters, which provides us with the retrieval of DSD parameters from a pair of independent radar measurements. Zhang et al. (2001) found a high correlation between μ and Λ and proposed an empirical μ–Λ relation. To improve the retrieval of smaller values of μ and Λ associated with higher rain rates, the relation was re-derived based on the truncated moment method in Brandes et al. (2003). Subsequently, several μ–Λ relations were retrieved in different regions with varying coefficients, indicating that the μ–Λ relation indeed varies with the climatic regime. A new μ–Λ relation has been derived for monsoonal rain at Gadanki by using 3 years (2016–2018) of disdrometer data. The data are considered for further processing only when the drop count exceeds 1500 m−3 and the rain rate is > 5 mm h−1 to better retrieve values of μ and Λ associated with higher rain rates and a larger number of drop counts. The functional form of the relationship is
Figure 3 shows retrieved μ–Λ relations for the PRE, SWM and NEM seasons for monsoonal rain. The r2 is nearly equal among all seasons; however, the coefficients for the μ–Λ relation are found to be different for different seasons. The correlation is somewhat weaker during NEM, with a smaller r2 and larger RMSE than in the other seasons. Some scatter is also seen at higher μ and Λ values, but their occurrence is very low. It indicates that the μ–Λ relation is not only region-dependent but also varies with season at the same location. The coefficients of the μ–Λ relation appear to be temperature-dependent, as we see a gradual change in coefficients from the warmest PRE to the coldest NEM. Also, the warmest seasons of PRE and SWM have higher slope and curvature values compared to those in NEM. This means μ will be higher during PRE and SWM than in NEM for the same Λ for the majority of the data (i.e., when Λ and μ values are less than 8). The NEM with an abundance of smaller drops with fewer bigger drops (compared to PRE and SWM) typically has a smaller μ, even for a larger Λ.
Table 2Comparison of μ–Λ relations obtained at Gadanki with those reported elsewhere.
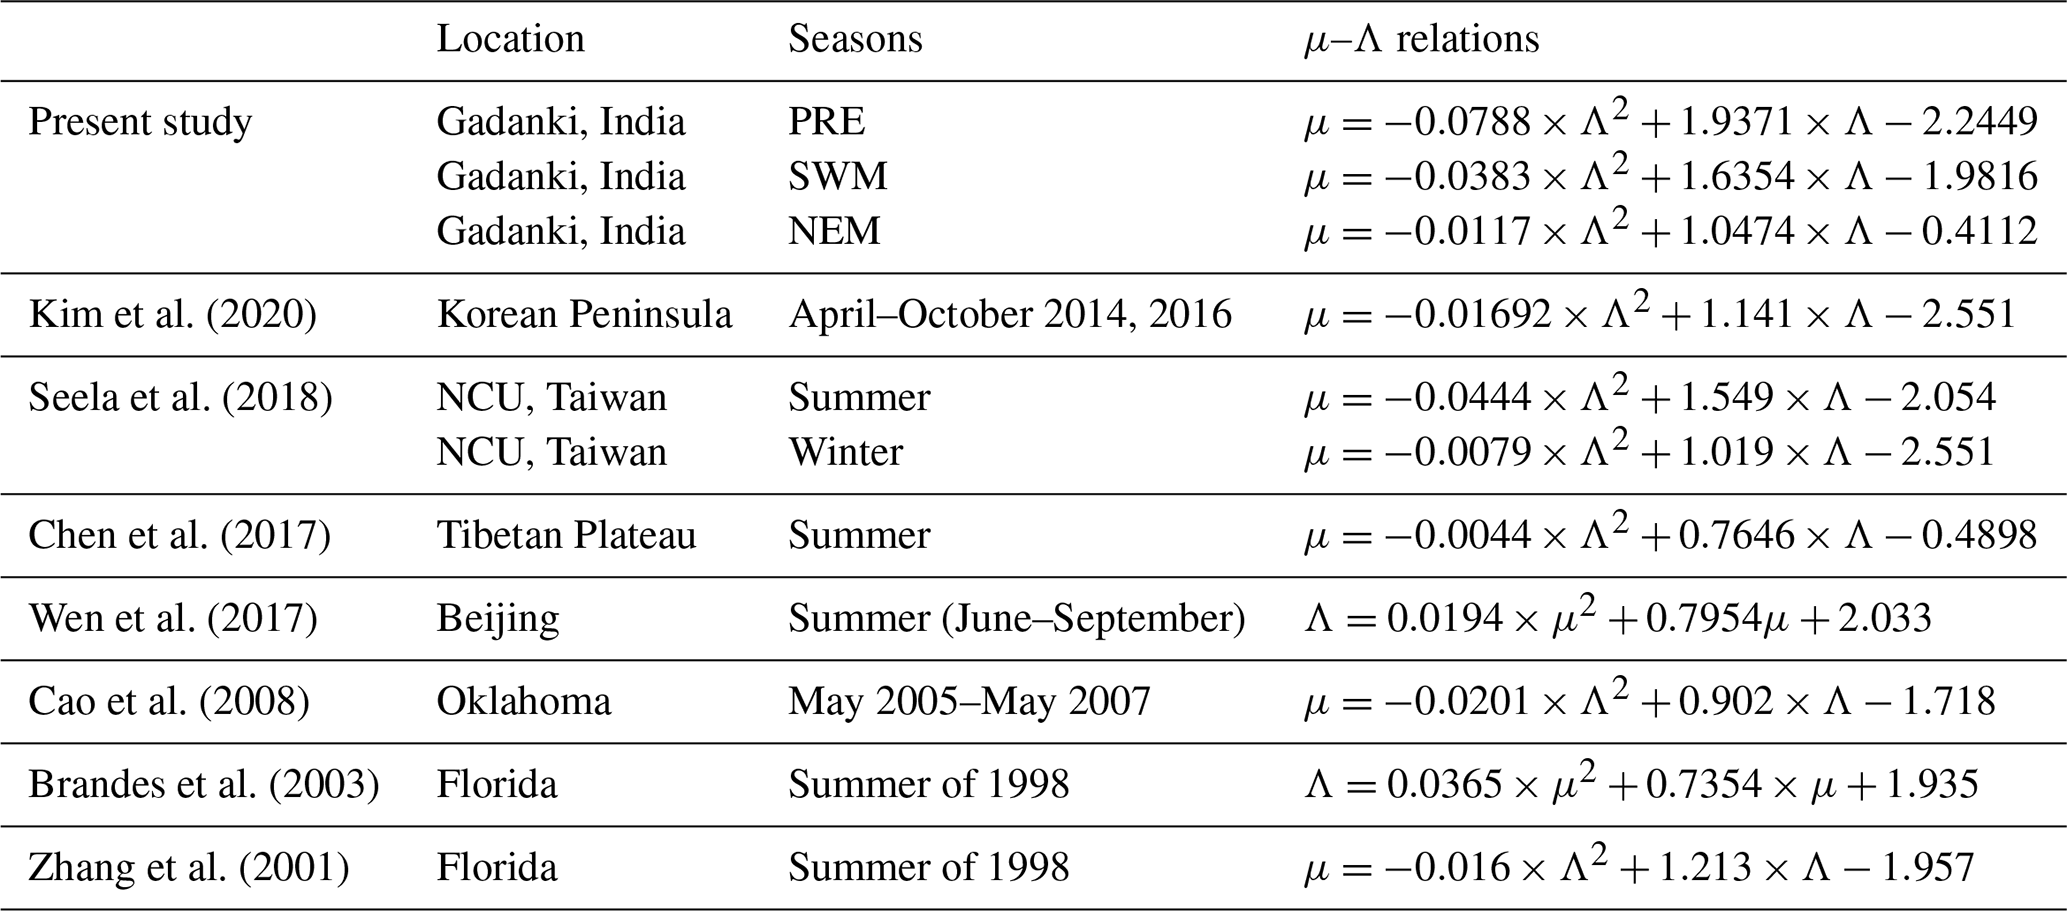
As such relations are available at different locations, a comparison with them will be intuitive, which may also allow us to draw some generalized conclusions. The range of the curvature parameter from the published literature (Table 2) varies from 0.004 to 0.078, while the slopes and intercepts are in the ranges of 0.7–1.9 and 0.4–2.5, respectively. One can see that the curvature values vary by an order of magnitude between the regions. The differences in curvature and slope values are strikingly apparent between the warm/cold seasons/regions. The warm seasons/regions typically have larger curvature and slope values than in cold seasons/regions. In fact, the smallest value of the curvature (and also slope) is reported from the Tibetan Plateau. Smaller values of curvature and slope are also noted during the winter monsoon season at Gadanki and in Taiwan (Seela et al., 2018). It is very clear from these comparisons that the μ–Λ relation is region-dependent, corroborating earlier studies, but it can be broadly categorized into warm and cold seasons/regions.
Using the μ–Λ relations retrieved above, the gamma parameters are computed as follows. Similarly to the exponential method, the Dm is obtained from the ZDR measurement. Dm is related to μ and Λ according to the following relationship:
From Eqs. (9) and (10), the following quadratic equation for Λ is obtained:
Solving the above quadratic equation yields two solutions for Λ: one is positive, and the other is negative, from which the only physically possible positive Λ value is considered. The shape parameter can be computed from the retrieved Λ using Eq. (9). The intercept parameter N0 is retrieved from radar reflectivity using the following equation (Zhang, 2017):
3.2.3 Normalized gamma method
Testud et al. (2001) proposed the normalized gamma distribution model of the form shown below to represent the DSD, which was used later in several studies (Anagnostou et al., 2008a; Tokay et al., 2020a):
where D0 is the median volume diameter and NW is the normalized form of the intercept parameter, which is related to Dm and liquid water content (LWC) as
Dm and NW can also be estimated empirically from radar parameters of ZH and ZDR and as follows (Tokay et al., 2020a).
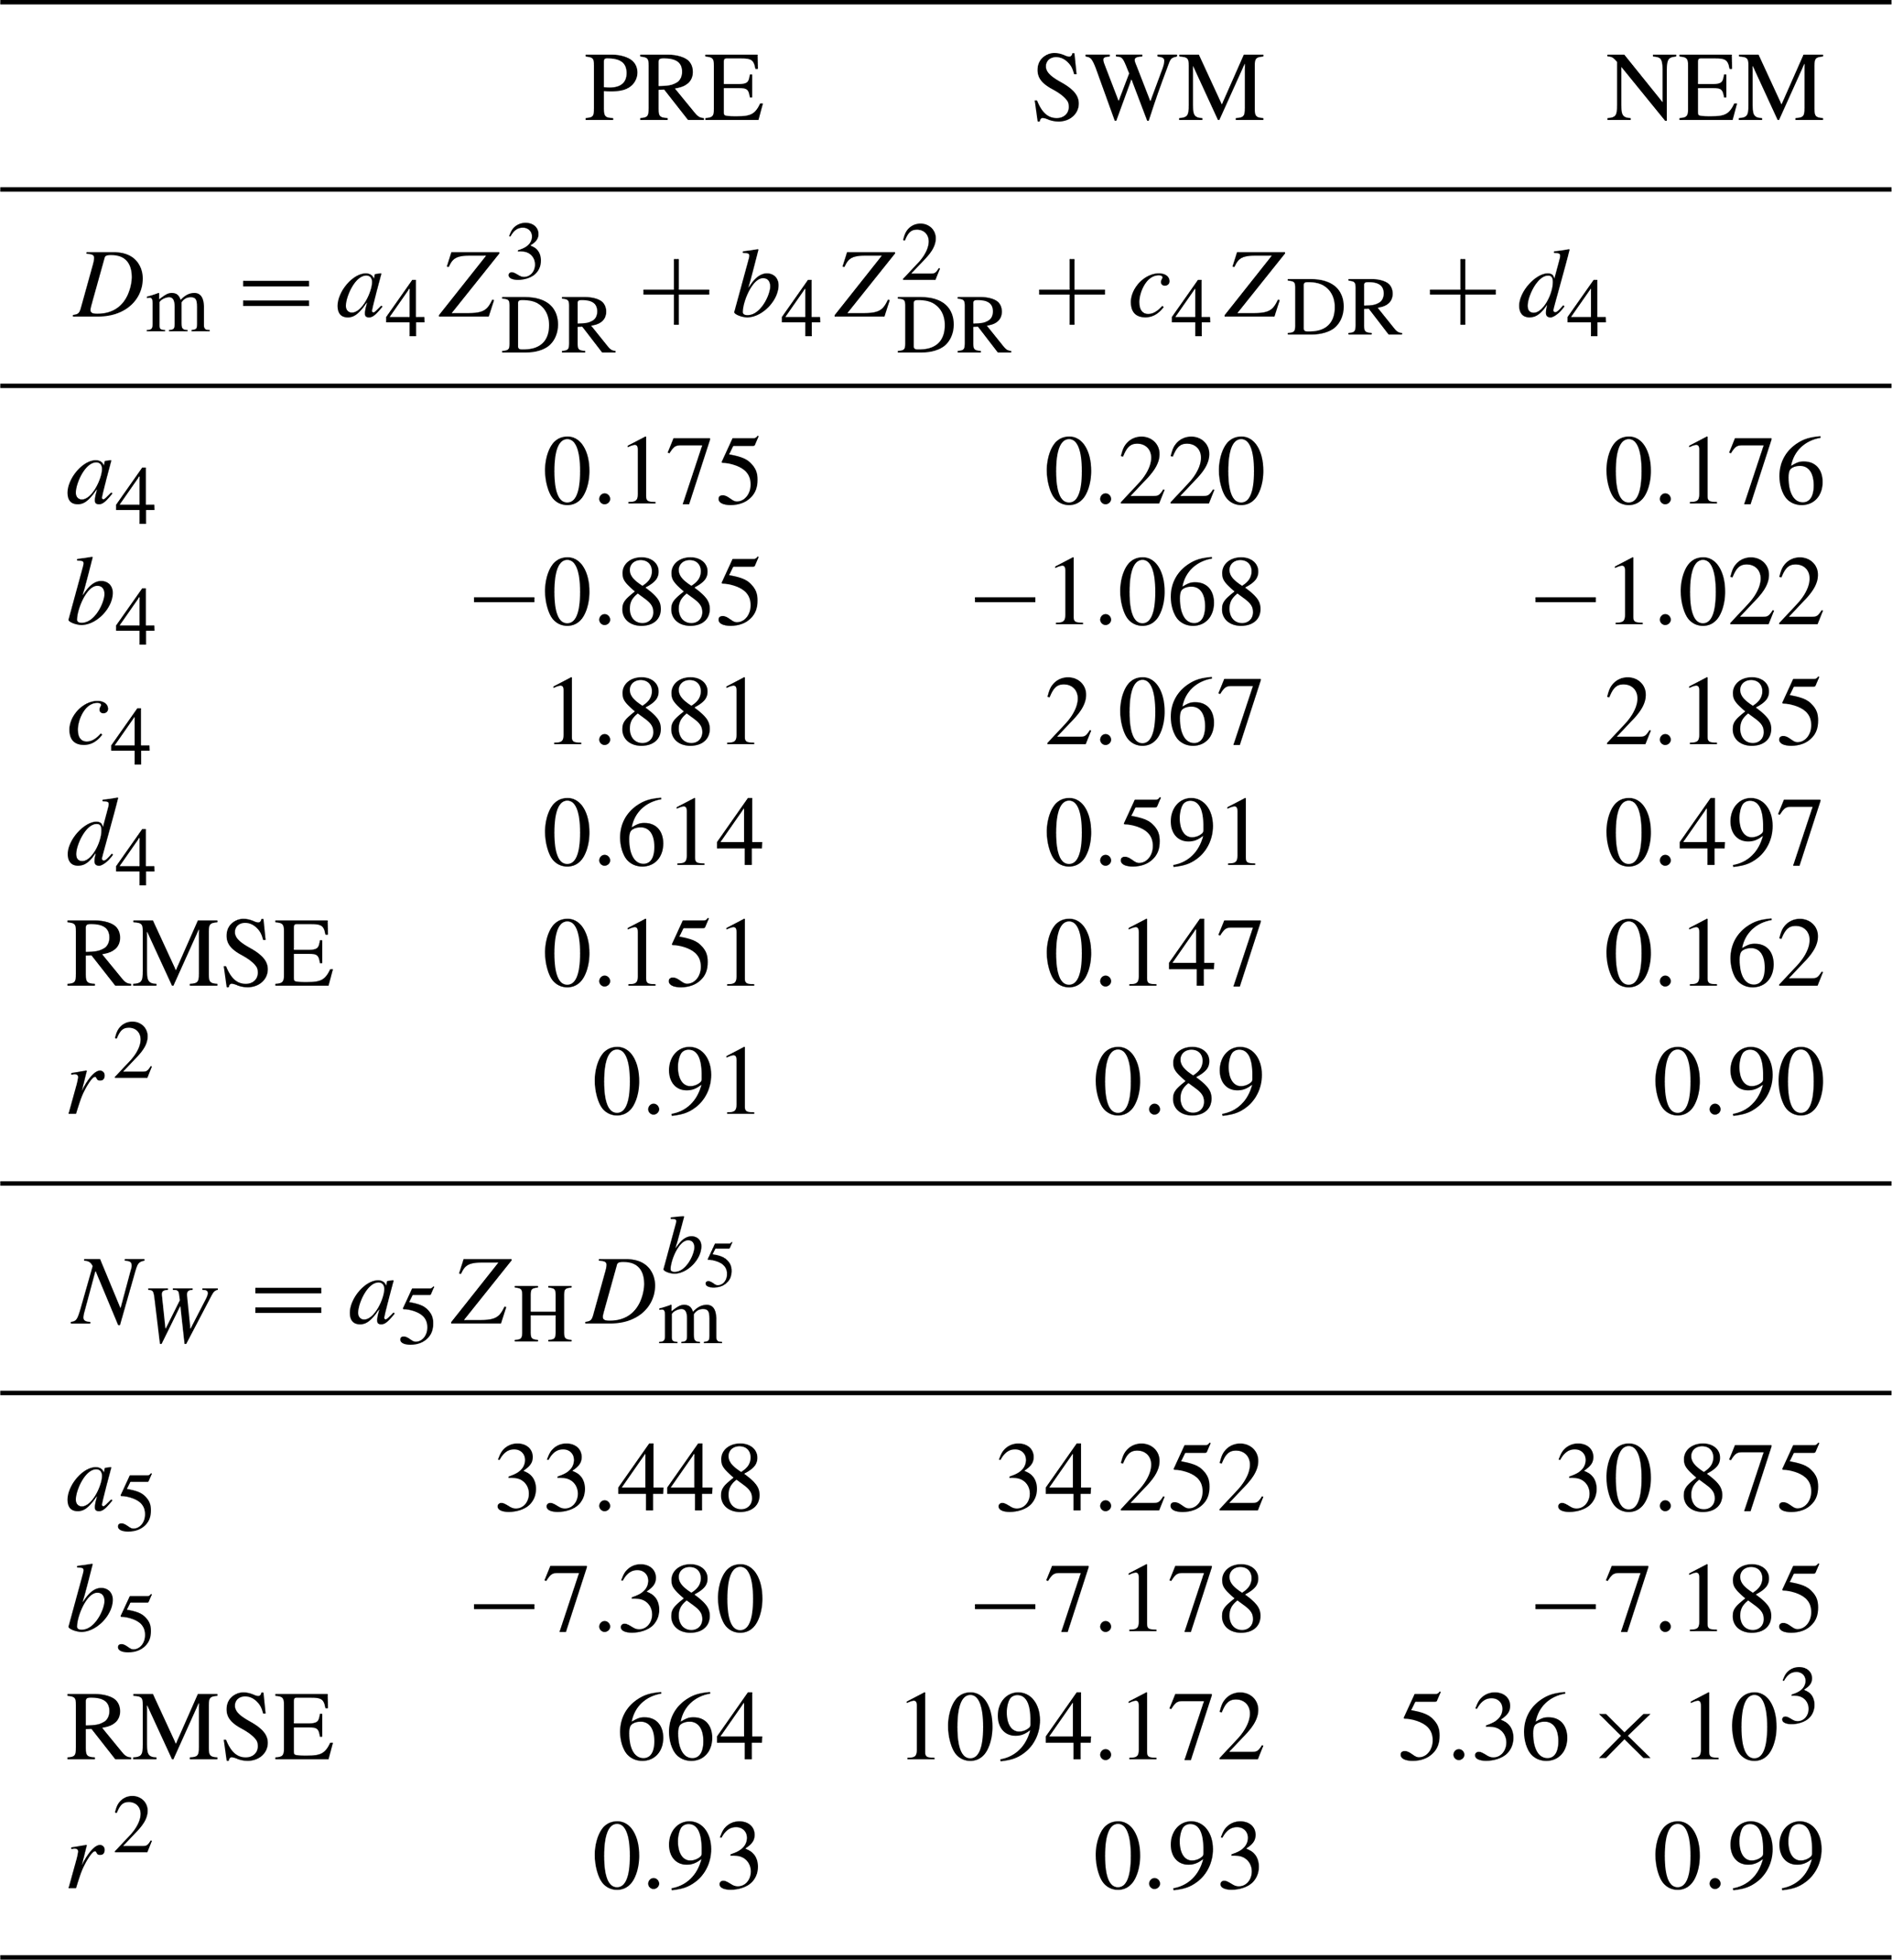
Figure 4a–c show the variation of Dm with ZDR in the PRE, SWM and NEM seasons, respectively. A third-order polynomial fit of the form given in Eq. (15) has been adopted to obtain the coefficients separately for each season. Table 3 provides coefficients and fitting statistics (r2 and RMSE) for each season. The variation in coefficients between the seasons is as large as 25 %, indicating the strong seasonal dependency exhibited by these relations. The coefficients obtained for monsoonal rain are also different from that reported by Tokay et al. (2020b) from different field campaigns (IFloodS, IPHEx and OLYMPEx). Figure 4d–f show variation of log (NW) with Dm for the PRE, SWM and NEM seasons, respectively. Coefficients for the retrieval of NW are obtained from the regression fit using Eq. (16). The color in the figure represents ZH, and the solid curves are obtained with retrieved coefficients for different ZH values. One can clearly see the differences in data distribution, here also with a considerable population at smaller Dm (and larger NW) during the NEM, mainly due to the preponderance of smaller drops. One can also see the near absence of smaller Dm values (< 1 mm) during the premonsoon, mainly due to strong evaporation and drop sorting. These differences cause considerable seasonal variation in the retrieved coefficients (Table 3). The prefactor is found to be larger during the warmer seasons (PRE and SWM) than in the colder seasons. The prefactor values are comparable to those reported by Tokay et al. (2020a) from six field campaigns.

Figure 4Scatter plots between ZDR and Dm for the (a) PRE, (b) SWM and (c) NEM seasons. The solid line is the third-order polynomial fit (Eq. 15). (d–f) Scatter plots between log (NW) and Dm as a function of ZH for PRE, SWM and NEM, respectively. The solid lines indicate the variation of log (NW) with Dm for different ZH values, estimated using appropriate coefficients obtained with Eq. (16).
Table 3Empirically derived coefficients of the Dm–ZDR and NW–(ZH,Dm) relations for the PRE, SWM and NEM seasons and statistics of curve fittings.
3.2.4 Beta (β) method
Most of the studies that retrieve relations between polarimetric radar products and geophysical parameters (like DSD or rain rate) assume an equilibrium drop shape model, proposed by Pruppacher and Beard (1970), which predicts an almost linear decrease in the spheroidal raindrop aspect ratio r as a function of D,
where is the axis ratio and b and a are the semi-minor and major axes of the raindrop, respectively (Pruppacher and Beard, 1970). The above equation gives aspect ratios close to those reported by Pruppacher and Pitter (1971). Drops less than about 0.5 mm were usually assumed to be spherical in shape. A number of later studies (e.g., Andsager et al., 1999; Gorgucci et al., 2001, 2000; Keenan et al., 2001) indicate that the equilibrium drop shape is not unique, and the variability in drop aspect ratio–diameter relations can be significant. The generalized form of the relation is, therefore, given as (Matrosov et al., 2002)
where β is the shape factor (mm), which is considered to be a variable rather than a fixed value by Pruppacher and Bread (1970). It is clear that the mean shape-sized relation of raindrops plays an important role in the interpretation of polarimetric radar measurements. In order to obtain the estimator β, the ZH, ZDR and KDP are used as follows.
Here, the ZH is in mm−6 m−3, ξDR is ZDR is on a linear scale and KDP is in ∘ km−1.

The Dm and NW are estimated from polarimetric variables using the following equations.
The coefficients a6–8, b6,7, and c6–8 of Eqs. (19)–(21) are derived by computing the nonlinear regression analysis between each beta and the corresponding polarimetric measurements. Here, the computation has been carried out by considering the raindrop distribution to follow a normalized gamma DSD. The intrinsic shape of the DSD is obtained by normalizing the number density by N0 (Testud et al., 2001). The retrieved coefficients in equations for β,Dm and NW are given in Table 4. The mean value of β estimated using the retrieved coefficients and Eq. (19) is between 0.054 and 0.056 for warm seasons and ∼ 0.065 for NEM. The value obtained during NEM is closer to the default value (0.062) given by Pruppacher and Beard (1970), whereas the values obtained for PRE and SWM are much smaller, indicating that the slope of the drop-shape-sized relation is seasonally dependent. Like other DSD relations, the coefficients in the beta method also exhibit a large seasonal dependency, with some of the coefficients varying by as large as a factor of ∼ 2.
3.3 Dependence of DSD relations on temperature and drop shape models
A temperature of 20 ∘C is used in the above T-matrix scattering simulations for computing radar parameters. To understand the dependency of retrieved coefficients on temperature, the exercise is repeated by varying temperatures from 0 to 30 ∘C in increments of 5 ∘C, and each time, coefficients of the above relations (Eqs. 6 and 7) are retrieved. Figure 5 shows the variation of prefactors and exponents in Eqs. (6) and (7) with temperature for different seasons. Except for a2 (the prefactor in Eq. 7), all coefficients decrease monotonically with increasing temperature, albeit with different slopes. Clearly, the variation of the exponent in all relations with temperature is considerable in all seasons and is up to 6.7 %, while the prefactor does not vary much with temperature, and its variation is less than 2 %. Among seasons, the variation in coefficients of DSD relations with temperature is larger in hot seasons than in cold seasons (i.e., NEM) by a factor of 2 to 6. Therefore, the variation in Dm or N0, for a given ZDR and ZH, due to temperature variation is within 5 % in any season and is much less in NEM (< 2 %). However, the impact of the seasonal variation of coefficients on derived DSD parameters is relatively larger and is up to 20 %, as discussed above.
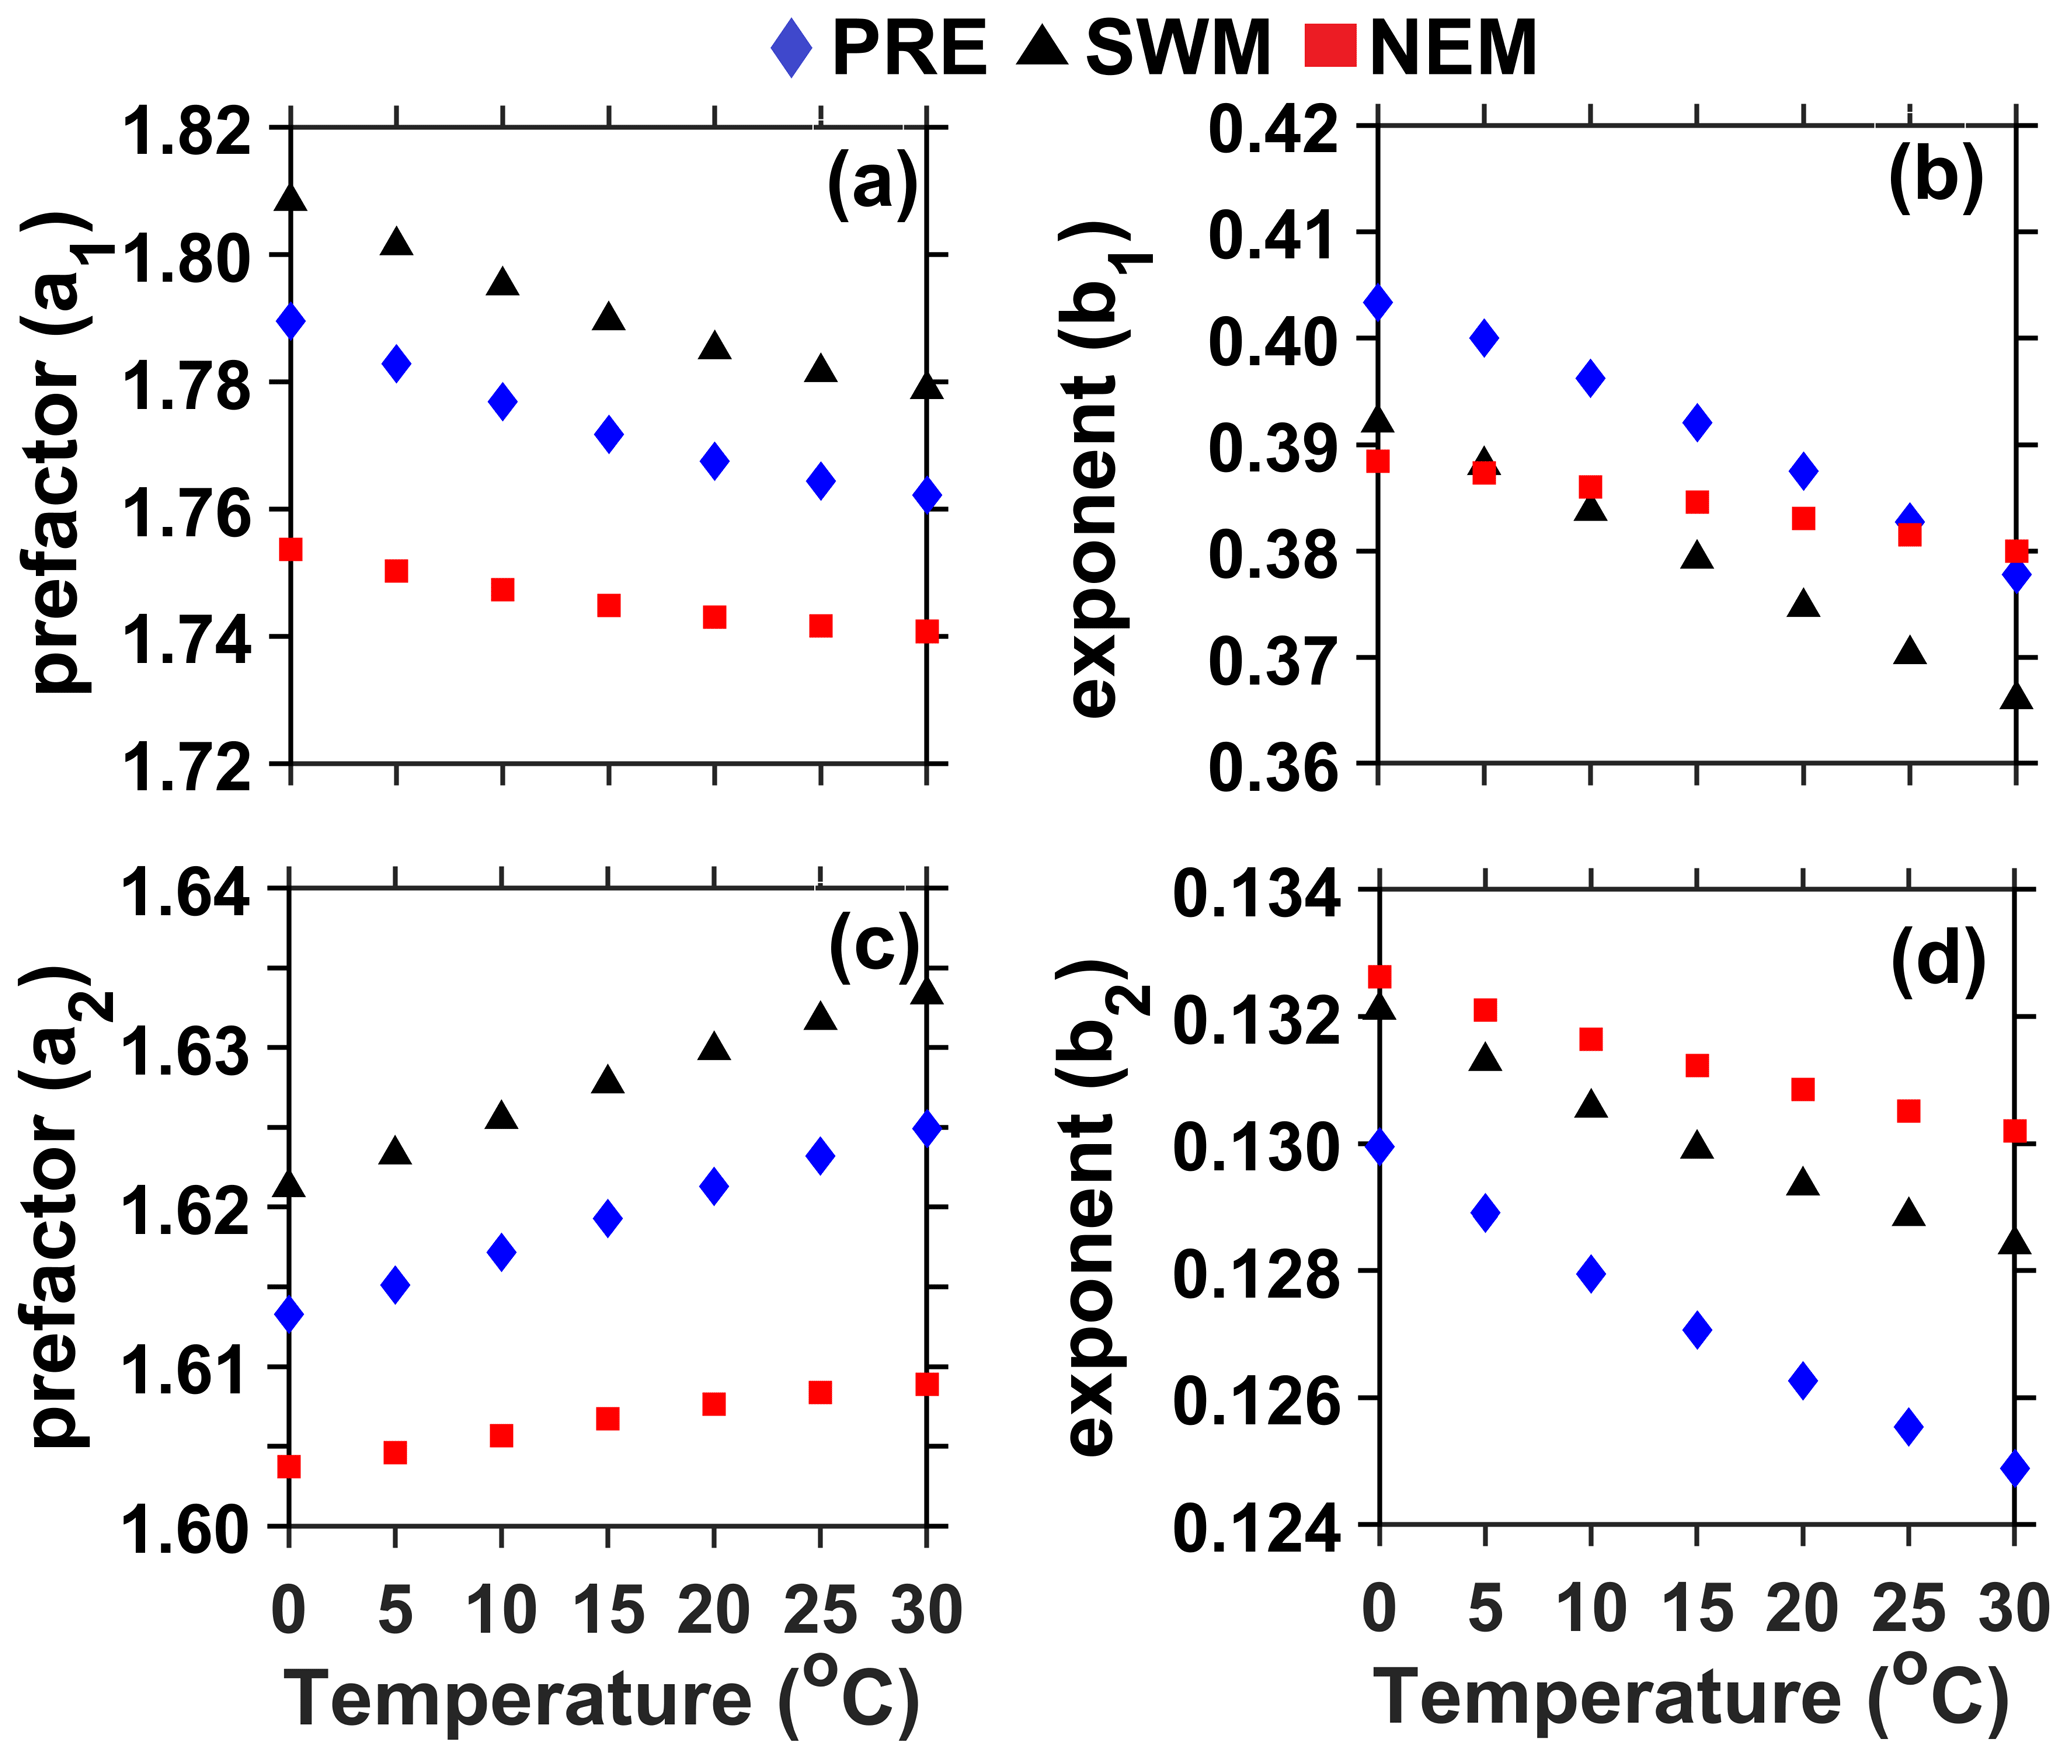
Figure 5Temperature dependency of coefficients of DSD parameter relations in different seasons. (a, b) Variation of a1 and b1 in Eq. (6) with temperature in different seasons. (c, d) Same as (a) and (b) but for Eq. (7).
To examine the dependency of these coefficients on drop shape models, they are retrieved by using different drop shape models (Andsager et al., 1999; Beard and Chuang, 1987; Brandes et al., 2002; Pruppacher and Beard, 1970). The difference in coefficients in Eq. (6) derived with different drop shape models is quite large (7 %–15 % in the prefactor and up to 28 % in the exponent) and in fact larger than the seasonal difference. The prefactor (exponent) is found to be smaller (larger) with the Pruppacher and Beard drop shape model than with other models. On the other hand, the dependency of coefficients in Eq. (7) on the drop shape model is weak, and all the models yield nearly equal coefficients. The seasonal dependency of coefficients in Eq. (7) is quite high compared to their dependency on drop shape models.
The degree of agreement of radar-derived DSD parameters with disdrometer-derived parameters depends on several factors: (1) the differences in sampling volumes of the radar and disdrometer, (2) the vertical variability of DSD from the radar-measured volume to the surface (or disdrometer measurement height) and (3) the accuracy of the empirical relations between polarimetric parameters (ZDR, ZH and KDP) and DSD model parameters (Dm, N0, μ and Λ). The radar sampling volume depends on the range, beam width and pulse length. For the given radar beam width of 1∘, range resolution of 150 m and range of 450 m, the estimated sampling volume of the radar is 7264 m3. To match the radar temporal resolution, the disdrometer data are averaged over 6 min (360 s). The sampling volume of the disdrometer for a given surface area of 50 cm2 (for the JW disdrometer) and a characteristic drop size, represented by a Dm (or terminal velocity) of 2 mm (6.5 m s−1), is less than 12 m3. Thus, the sampling volumes differ by a factor greater than 600, which is much less than the similar comparisons made elsewhere, wherein the sampling volumes differ by a factor of 105 to 107 (Cao et al., 2008; Tokay et al., 2020a). This is mainly due to the fact that the comparisons were made at a longer range in earlier studies. Another advantage of using a shorter range for comparison studies, as is done in the present study, is the proximity of the radar-measuring volume to the surface. In the present study, the sampling volume is at a height of ∼ 20 m above the disdrometer location. This reduces the bias caused by the time–height ambiguity due to the vertical variability of DSD. The retrieval accuracy also depends on empirical relations between the radar and DSD parameters, as these relations vary with season (as shown in Sect. 3). However, appropriate relations have been used for comparison in the present study to reduce such ambiguity.
Evaluation of DROP-X derived DSD parameters, using retrieved coefficients in the different DSD formulations discussed above, is carried out by comparing them with those derived with disdrometer observations. For this purpose, the disdrometric dataset during 2019–2020, which has not been used for the retrieval of coefficients, is used for comparison. Long-duration events (longer than 2 h) are selected for the evaluation of DSD retrieval techniques. A total of six events each from SWM and NEM are selected for this purpose (Table 5). These events include a variety of precipitating systems, including thunderstorms and mesoscale convective systems.
Table 5Details of rain events (date, duration, number of radar samples within the event and type of event) used for the assessment of four DSD retrievals.

4.1 Case studies
Figure 6 shows variation of rainfall bulk parameters and spatial maps of DROP-X-derived ZH during two precipitation events, one each from SWM (on 12 September 2019) and NEM (on 15 November 2020) chosen as case studies. On 12 September 2019, a convective cell originated southwest of the study region at 16:00 IST and has grown quickly into a mesoscale storm with a leading convective and trailing stratiform region. It propagated eastward and passed the radar location around 22:00 IST as an intense storm stretched in the north–south direction. DROP-X has tracked this storm when it passed over the radar site. The DROP-X-measured ZH is in the range of 50–52 dBZ during the storm's passage across the radar site at 22:00 IST. The collocated disdrometer also shows Z as large as 52 dBZ and a rain rate of 38 mm h−1 at the time of passage of the core of the storm. The disdrometer-estimated Dm is also found to be large (2.7 mm) at that time (Fig. 6). Light to moderate rain with Z, R and Dm in the range of 23–38 dBZ, 0.5–5 mm h−1 and 1–2 mm, respectively, continued for about 3 h after the passage of this intense convective cell over the radar site.
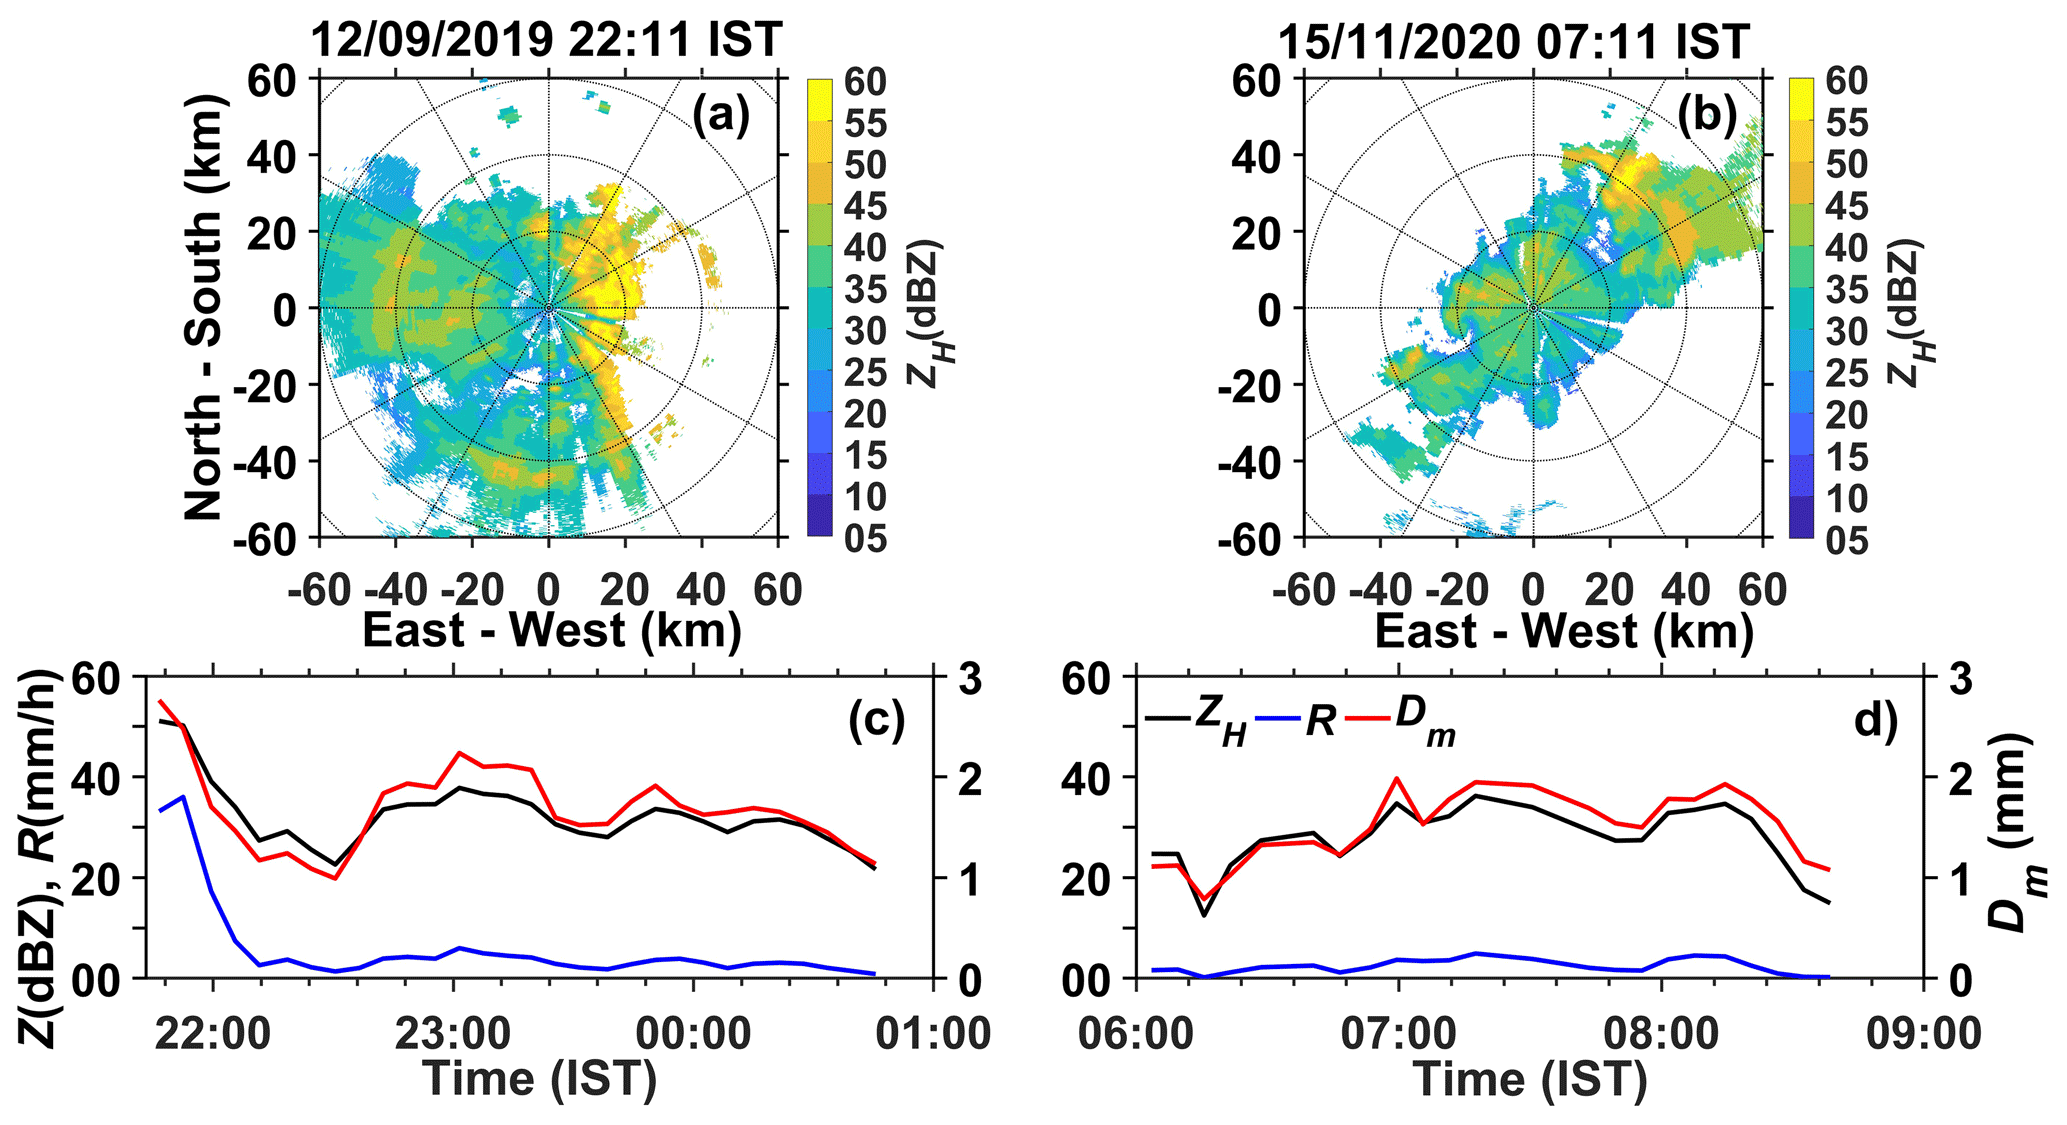
Figure 6Spatial variation of ZH measured by DROP-X on (a) 12 September 2019 and (b) 15 November 2020. (c, d) Temporal variation of rainfall bulk parameters (ZH, R and Dm) measured by the disdrometer on the above dates, respectively.
The second case study is from the NEM that occurred on 15 November 2020. The NEM was active on the day with a wide spread clouds over southeastern peninsular India. A rain band of width ∼ 40 km stretching in the southwest–northeast direction moved northwestward and produced widespread rainfall over the study region for about 2.5 h. Rain intensity is light to moderate during the above period, with R always less than 5 mm h−1 and ZH varying in the range of 10–40 dBZ. The disdrometer-derived Dm is also found to be small (1–2 mm) during the above period.
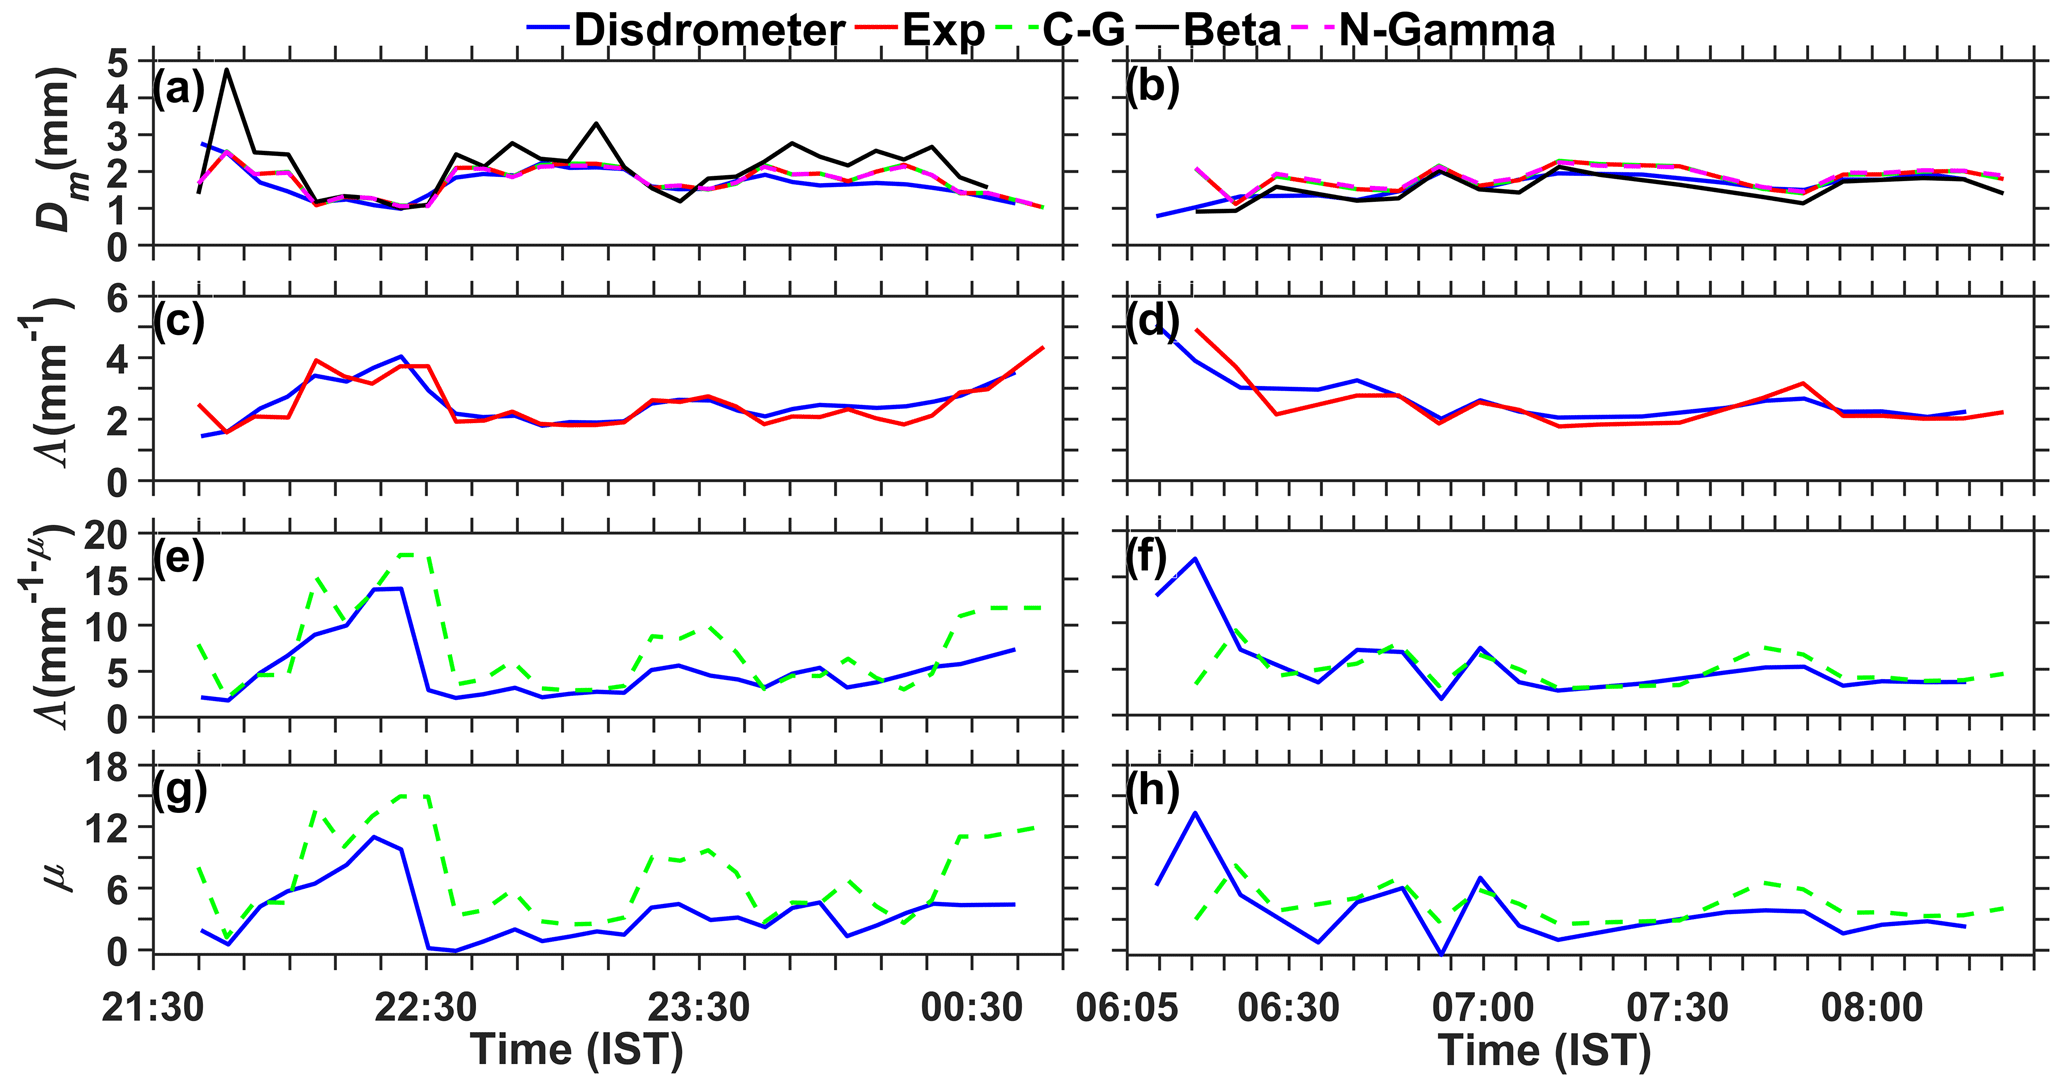
Figure 7Comparison of (a, b) Dm, (c, d) Λ by assuming an exponential distribution, (e, f) Λ by assuming a gamma distribution, and (g, h) μ by assuming a gamma distribution on 12 September 2019 and 15 November 2020, respectively, with disdrometer-derived values.
The Dm, shape and slope parameters of different DSD models estimated from DROP-X measurements using retrieved coefficients (Sect. 3) are compared with those obtained with the disdrometer in Fig. 7. In general, Dm values obtained by all methods show good correspondence to those derived by the disdrometer. However, the temporal variation of Dm by β method shows more and larger spikes relative to the reference, in particular on 12 September 2019 (Fig. 7a). It is expected that the noisy KDP and ZDR at lower rain rates will lead to large errors in the estimation of β (Gorgucci et al., 2002). However, Figs. 6 and 7 show that the disagreement between the β method and disdrometer- and other radar-derived Dm is significant even at a moderate to high rain rate (R > 5 mm h−1). Anagnostou et al. (2008a) also noted such large differences by the β method during convective regimes and attributed them to inadequate attenuation correction. The disdrometer location in the present study is very near to the radar (∼ 200 m), and, therefore, attenuation (and correction) is negligible. On the other hand, the observed differential phase, supposed to represent the differential propagation phase, is contaminated with the differential backscattered phase in the presence of strong convection (Trömel et al., 2013). Adaptive Kalman filtering is used in the present study to smooth out the fluctuations and differential backscattered phase, which is found to be very effective in removing the above affects. However, some uncertainty remained in the removal of the differential backscattered phase when strong convection occurs close to the radar location. It could be the reason for the small bias in Dm by techniques based on KDP.
As expected (given that there is a good agreement in Dm by radar and disdrometer and the relation ), the temporal variation of radar-derived Λ by the exponential method matches well with that of the disdrometer in both cases (Fig. 7c and d). Though the temporal variation of Λ and μ by the CG method matches reasonably well with those obtained with the disdrometer, their magnitudes differ from the reference data, and in particular, overestimation of both parameters is noted in the 12 September 2019 case.
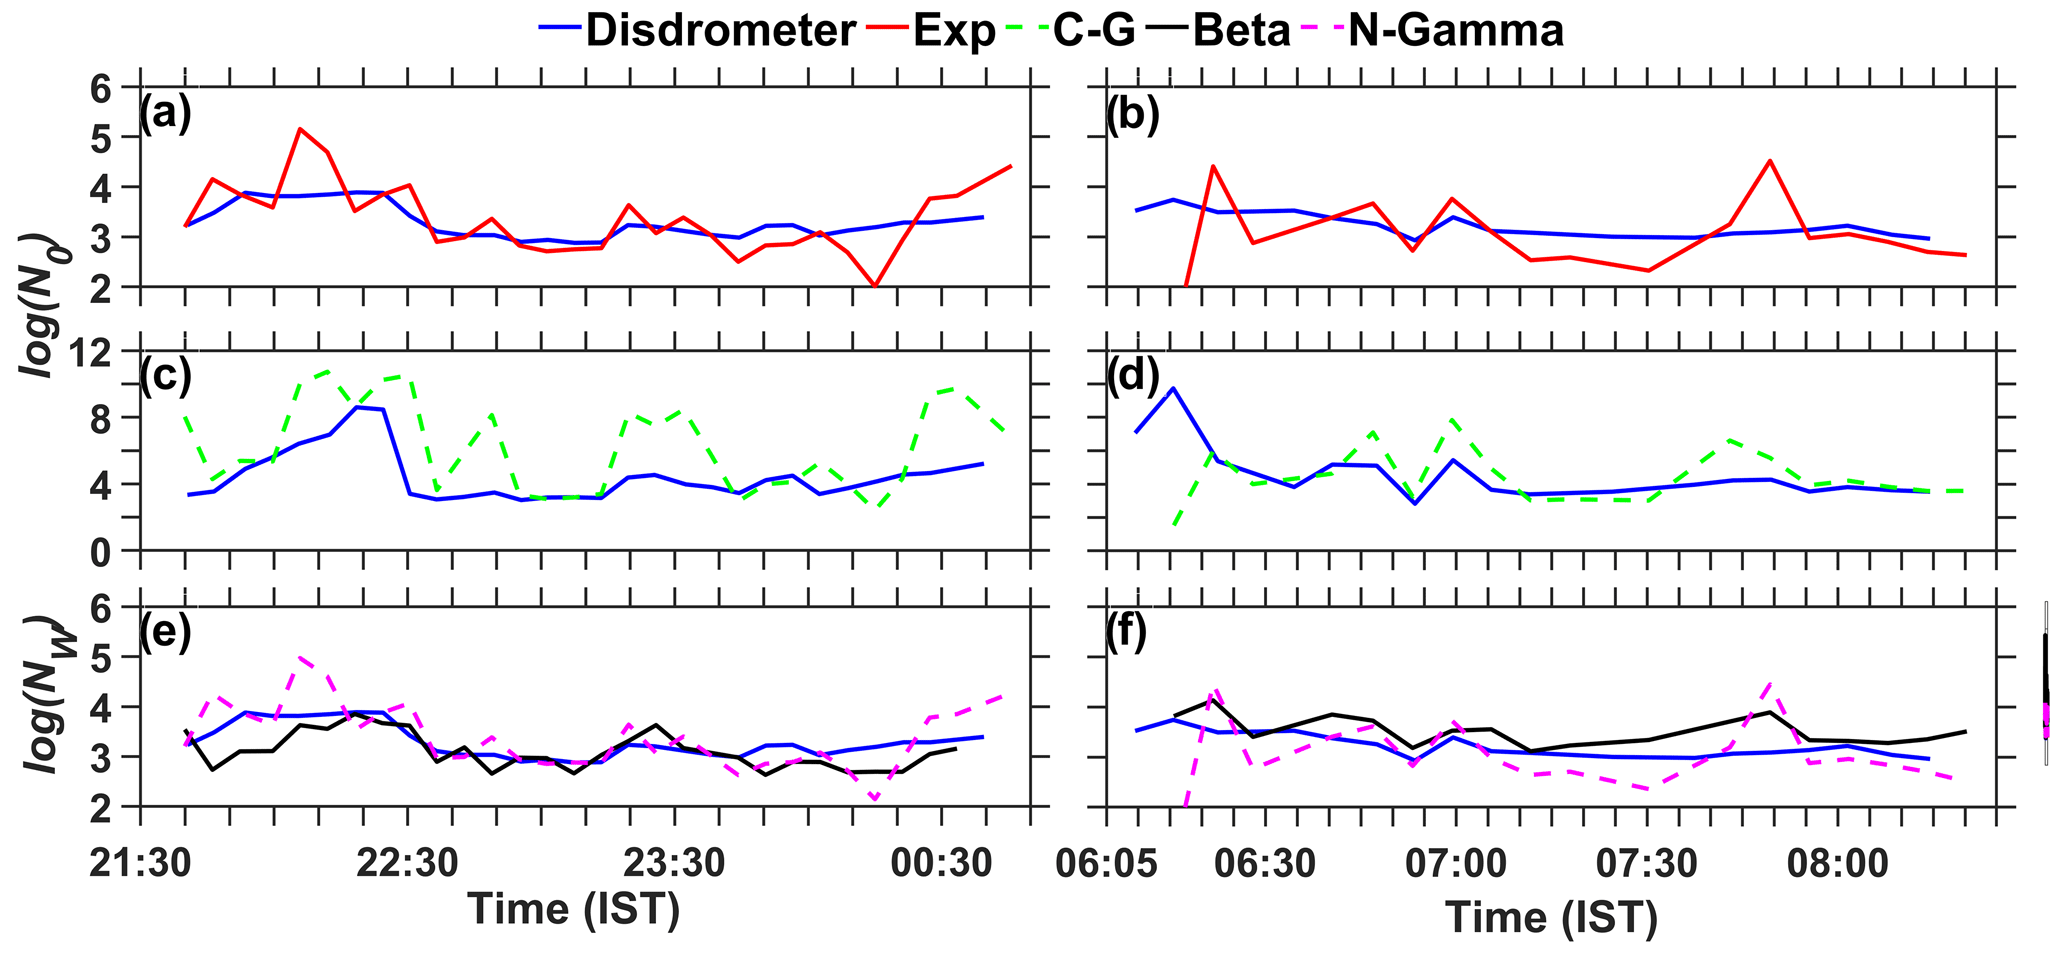
Figure 8Comparison of log N0 (a, b) by assuming an exponential distribution and (c, d) by assuming gamma distributions on 12 September 2019 and 15 November 2020, respectively, with a disdrometer-derived log N0. (e, f) Comparison of the log NW by N-Gamma and β methods with the disdrometer-derived log NW on the above days.
The temporal variations of log N0 with the Exp. and CG methods and log NW with the N-Gamma and β methods along with those of the disdrometer are shown in Fig. 8. The agreement with the reference is generally good for the log NW by the β and N-Gamma methods. The N0 values obtained with the Exp. method also agree reasonably well with those obtained by the disdrometer. However, the agreement is poor with the CG method, and it generally overestimates log N0 values relative to disdrometer values, mainly due to the overestimation of μ. Except for the CG method, all RMSEs between the retrieved and reference are ≤ 1.
4.2 Statistical assessment
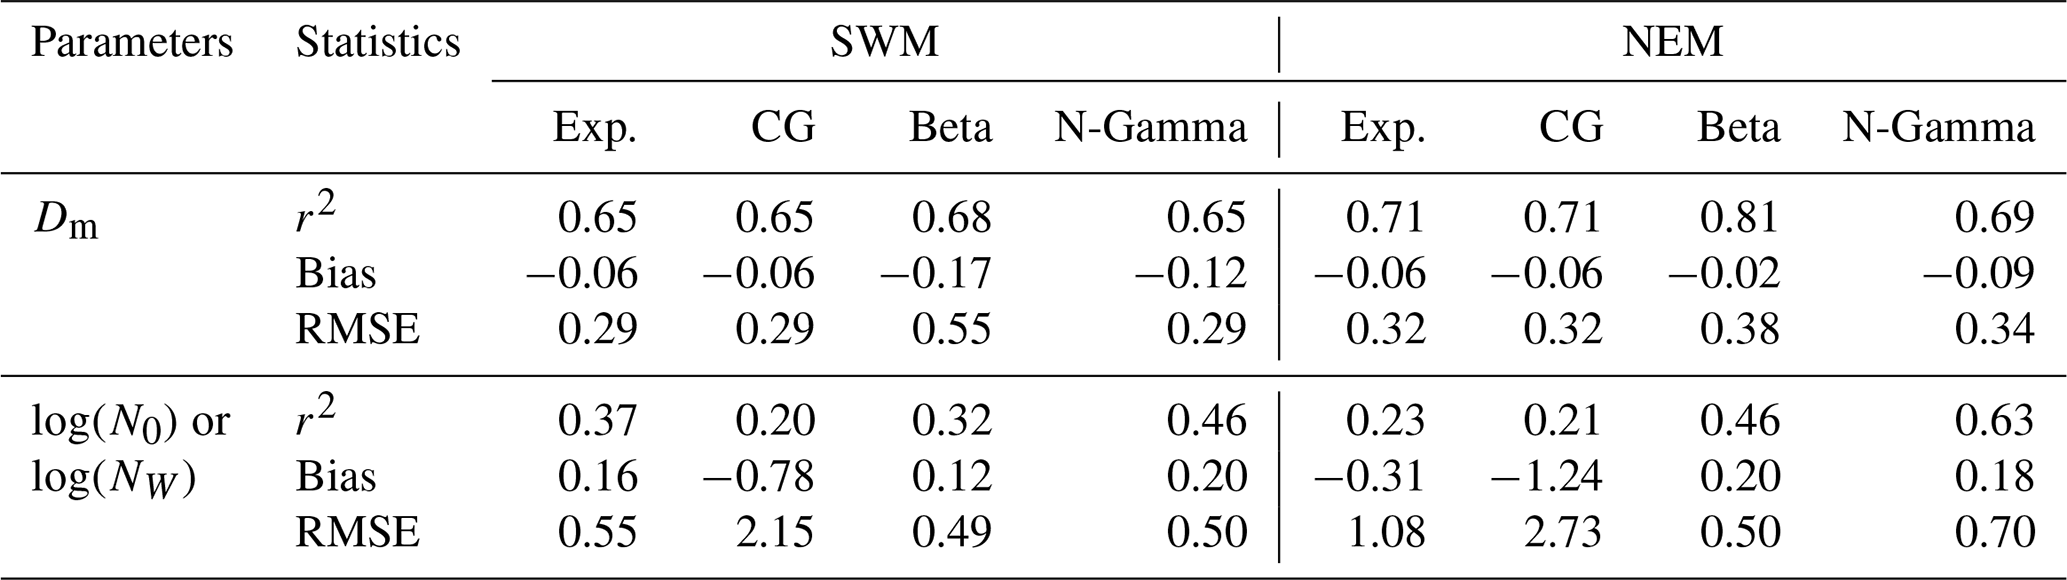
As shown in Table 4, data from six long events, each from the SWM and the NEM, are used to assess the radar-derived Dm and against those obtained with the disdrometer. These events include a variety of precipitation systems from isolated thunderstorms to mesoscale-scale convective systems. Figure 9 shows the statistical comparison of Dm and derived by the radar (four methods) and the disdrometer for all the events given in Table 6. The colored symbols in each scatter diagram represent the data from the different seasons (green solid triangle – SWM – and red open square – NEM). Table 2 summarizes different comparison statistics of the four retrieval methods under testing for the SWM and NEM seasons. Clearly, the statistical comparison also shows that the comparison is better for the retrieval of Dm than by all the methods. All the methods show a correlation of better than 0.65 (r2) and an RMSE of less than 0.55. Among Dm retrievals by the different methods, the β method shows a better correlation than the others in both seasons but suffers with large RMSE values. The distribution of data is also wider in the case of the β method. The agreement between radar retrievals and the disdrometer-derived Dm is relatively better during the NEM than in the SWM. On the other hand, the retrieval of NW by the N-Gamma method is much better in both seasons compared to the other methods. The CG method shows weaker correlations and larger RMSE values than the other methods, mainly because of the problems related to KDP and μ.
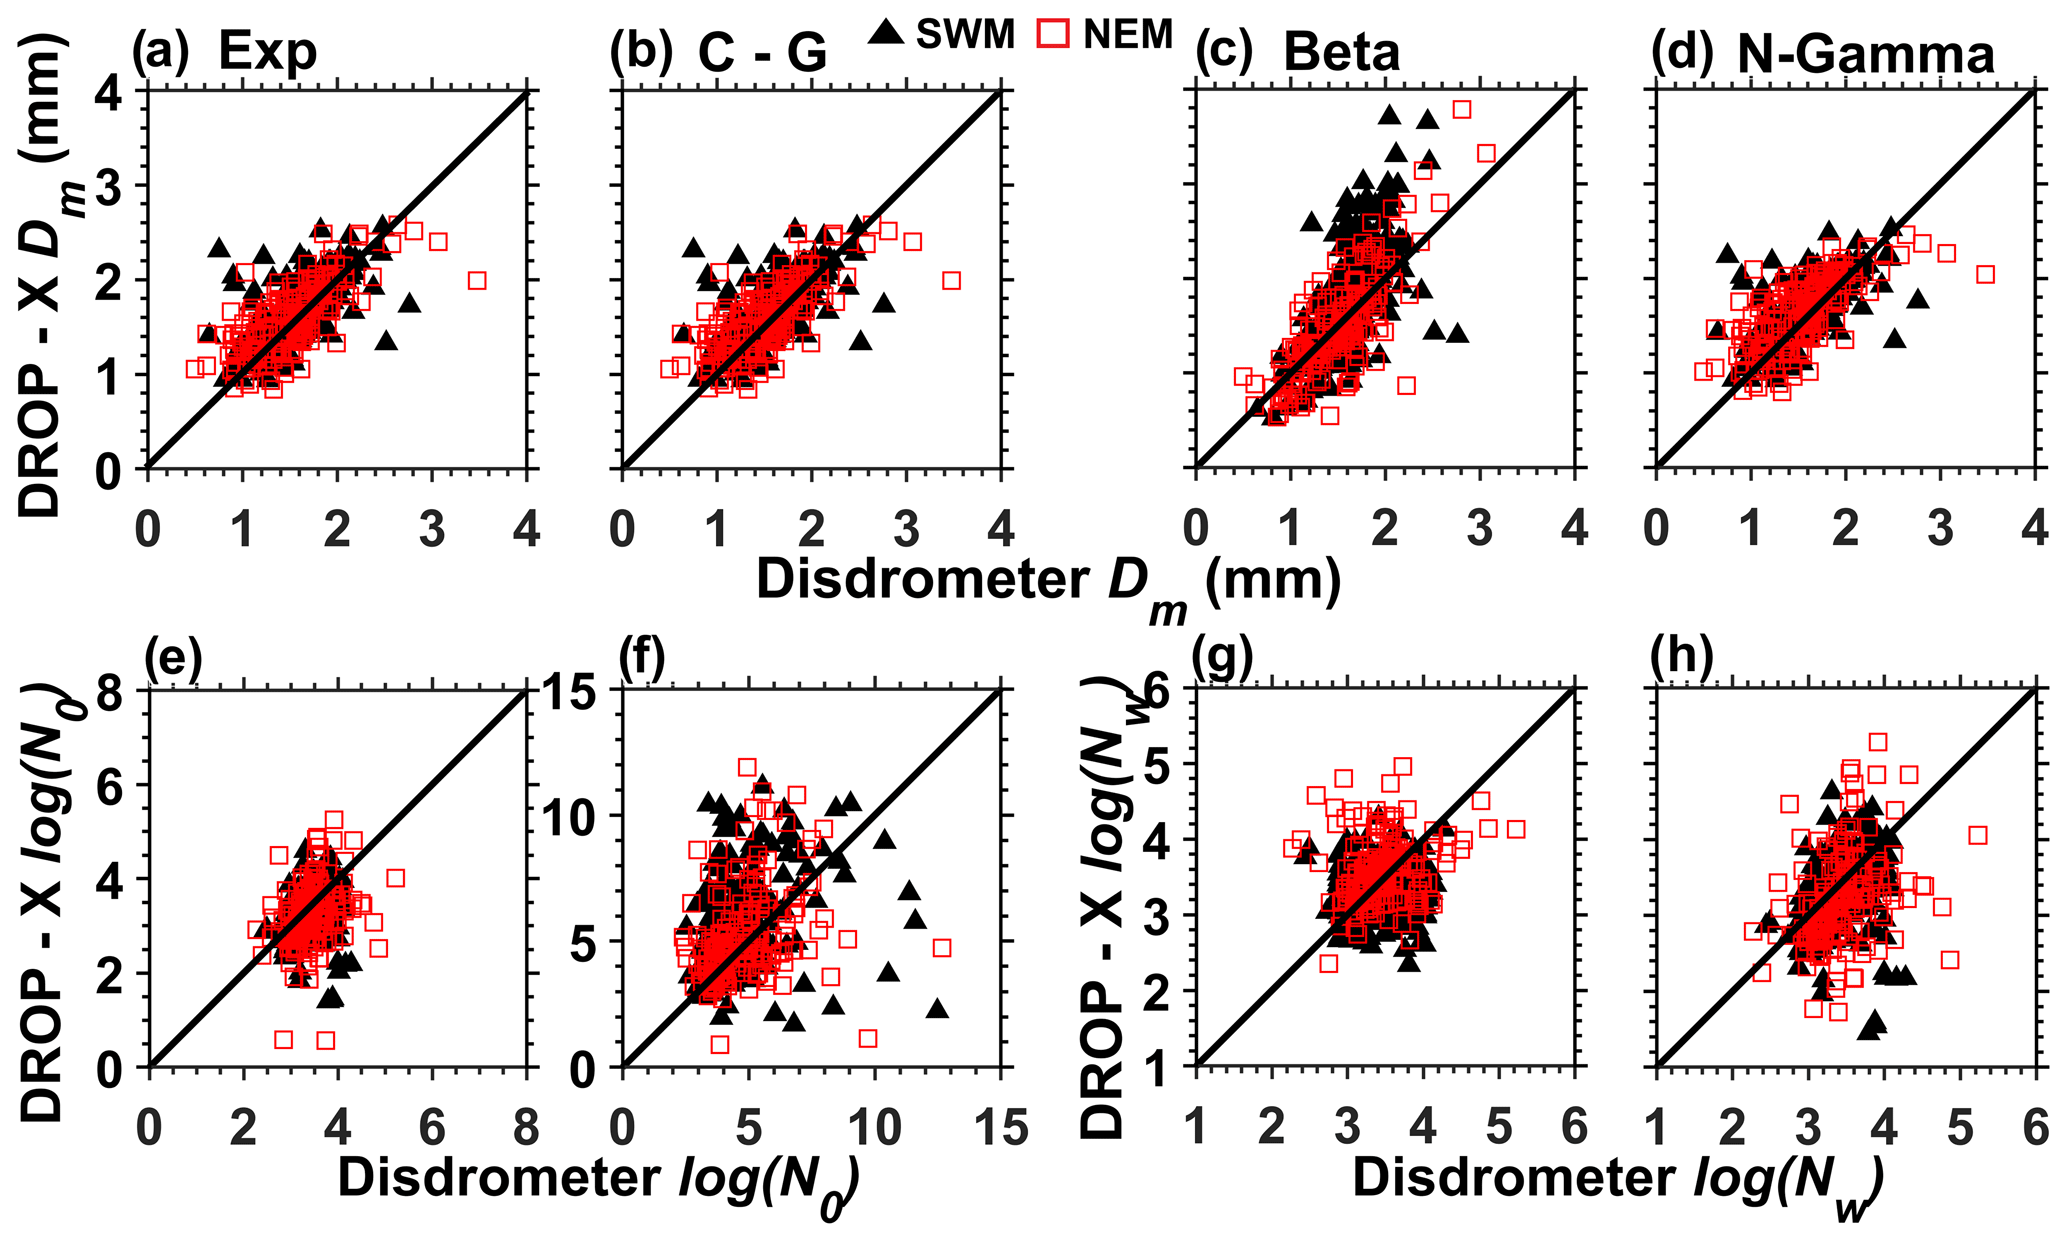
Figure 9Scatter plots of Dm obtained by the disdrometer and DROP-X with the (a) exponential, (b) constrained gamma, (c) β and (d) normalized gamma methods for the SWM (solid green triangle) and NEM (open red square) seasons. (e–h) Same as (a)–(d) but for .
Table 6Evaluation statistics of Dm and log by the Exp., CG and N-Gamma β methods for SWM and NEM.
Five years of disdrometric measurements and 2 years of DROP-X measurements have been used, for the first time, to (i) obtain relations for the retrieval of DSD parameters appropriate for monsoonal rain and to study their dependency on temperature and drop size–shape relations, (ii) understand the seasonal variation of coefficients and (iii) assess the DROP-X-derived DSD by various DSD retrieval methods. Using 3 years of disdrometer-measured DSD, various polarimetric parameters have been computed using T-matrix simulations. Coefficients of four commonly used DSD relations are retrieved empirically from simulated data. Important results coming from the study are summarized as follows.
The coefficients for obtaining DSD parameters by the exponential, CG, N-Gamma and β methods for monsoonal rain are found to be different from other regions, indicating that they are region-dependent. The mean value of β estimated at Gadanki is closer to the default value (0.062) given by Pruppacher and Beard (1970) during the NEM, whereas the values obtained for PRE and SWM are much smaller, indicating that the slope of the drop-shape-sized relation is season-dependent and 0.062 is more applicable for the colder season. To understand the dependency of the coefficients of these relations on temperature and drop shape models, the coefficients of the Exp. method are retrieved for different temperatures and drop shape models. It is found that the variation in Dm or N0, for a given ZDR and ZH, due to temperature variation is within 5 % in any season and is much less in NEM (< 2 %). However, the dependency of coefficients in the Dm–ZDR equation on the drop shape model is high (7 %–15 % in the prefactor and 28 %–28 % in the exponent) and in fact is higher than on seasons. The dependency of coefficients on drop shape models is found to be different in different geographical regions. While the dependency is found to be high at Gadanki and in Africa, it is found to be weak along the western coast of the United States of America.
The present study corroborates some of the earlier studies that showed that the μ–Λ relation is region-dependent. It clearly shows that this relation is also season- and temperature-dependent, as we see a gradual change in coefficients from the warmest PRE to the coldest NEM. Also, the warmest seasons of PRE and SWM have higher slope and curvature values compared to those in NEM. This means that μ will be higher during PRE and SWM than in NEM for the same Λ for the majority of data (i.e., when Λ and μ values are less than 8). A comparison of μ–Λ relations obtained in different seasons at Gadanki with those available in the literature elsewhere clearly reveals that warm seasons/regions typically have larger curvature and slope values than cold seasons/regions.
The disdrometer data clearly show large seasonal variation with a preponderance of smaller drops during NEM compared to the warm seasons, corroborating earlier findings (Rao et al., 2001, 2009; Radhakrishna et al., 2009). As a result, the obtained coefficients also show large seasonal variation. From the retrieved coefficients it is clear that the Dm values will be larger for the same ZDR during PRE and SEM than in NEM. Though the prefactor is nearly equal in all seasons, the variation in the exponent makes a difference of ∼ 20 %–30 % in the N0 value between the seasons for the same and Dm. Among seasons, the variation in coefficients of DSD relations with temperature is larger in hot seasons than in the cold season (i.e., NEM) by a factor of 2 to 6. However, the impact of seasonal variations of coefficients on derived DSD parameters is relatively larger and is up to 20 %. Therefore, appropriate coefficients need to be used while retrieving DSD from polarimetric measurements.
The four commonly used radar retrieval methods of DSD are evaluated with the help of two case studies (one each from SWM and NEM) and data from 12 events. All the methods retrieve Dm reasonably well and produce a high correlation and small RMSE against the reference. The β method alone produced a wide range of Dm values similar to that of the disdrometer. However, the scatter is large, particularly in convection, mainly due to the fact that the comparison is made close to the radar site, where the differential phase is often contaminated by a differential backscattering phase. As a result, the RMSE exhibited by the β method is also found to be large. Comparison of retrievals of with those of the disdrometer shows the superiority of the N-Gamma method over other methods. All other methods compare poorly with disdrometer-derived , with small r2 and large RMSE values. Considering all the factors (Table 4), the N-Gamma method is found to be better in retrieving the DSD parameters. However, such assessment studies are also planned at longer ranges (10 and 35 km) with DROP-X to understand the strengths and limitations of the above methods in retrieving DSD accurately.
The data used in the present study belong to the National Atmospheric Research Laboratory and can be obtained on request.
KA: data curation, writing of original draft preparation, data analysis, and software. TNR: conceptualization, supervision, and manuscript editing. NRR: supervision and editing. KAJ: software and editing.
The contact author has declared that none of the authors has any competing interests.
Publisher’s note: Copernicus Publications remains neutral with regard to jurisdictional claims in published maps and institutional affiliations.
The authors acknowledge the scientists and engineers of NARL and ISTRAC for establishing DROP-X at NARL.
This paper was edited by Gianfranco Vulpiani and reviewed by two anonymous referees.
Adirosi, E., Baldini, L., and Tokay, A.: Rainfall and DSD Parameters Comparison between Micro Rain Radar, Two-Dimensional Video and Parsivel2 Disdrometers, and S-Band Dual-Polarization Radar, J. Atmos. Ocean. Technol., 37, 621–640, https://doi.org/10.1175/JTECH-D-19-0085.1, 2020.
Alcoba, M., Andrieu, H., and Gosset, M.: An Inverse Method for Drop Size Distribution Retrieval from Polarimetric Radar at Attenuating Frequency, Remote Sens., 14, 1116, https://doi.org/10.3390/rs14051116, 2022.
Anagnostou, M. N., Anagnostou, E. N., Vivekanandan, J., and Ogden, F. L.: Comparison of Two Raindrop Size Distribution Retrieval Algorithms for X-Band Dual Polarization Observations, J. Hydrometeorol., 9, 589–600, https://doi.org/10.1175/2007JHM904.1, 2008a.
Anagnostou, M. N., Anagnostou, E. N., Vulpiani, G., Montopoli, M., Marzano, F. S., and Vivekanandan, J.: Evaluation of X-Band Polarimetric-Radar Estimates of Drop-Size Distributions from Coincident S-Band Polarimetric Estimates and Measured Raindrop Spectra, IEEE Trans. Geosci. Remote Sens., 46, 3067–3075, https://doi.org/10.1109/TGRS.2008.2000757, 2008b.
Anagnostou, M. N., Kalogiros, J., Anagnostou, E. N., and Papadopoulos, A.: Experimental results on rainfall estimation in complex terrain with a mobile X-band polarimetric weather radar, Atmos. Res., 94, 579–595, https://doi.org/10.1016/j.atmosres.2009.07.009, 2009.
Anagnostou, M. N., Kalogiros, J., Anagnostou, E. N., Tarolli, M., Papadopoulos, A., and Borga, M.: Performance evaluation of high-resolution rainfall estimation by X-band dual-polarization radar for flash flood applications in mountainous basins, J. Hydrol., 394, 4–16, https://doi.org/10.1016/j.jhydrol.2010.06.026, 2010.
Anagnostou, M. N., Kalogiros, J., Marzano, F. S., Anagnostou, E. N., Montopoli, M., and Piccioti, E.: Performance Evaluation of a New Dual-Polarization Microphysical Algorithm Based on Long-Term X-Band Radar and Disdrometer Observations, J. Hydrometeorol., 14, 560–576, https://doi.org/10.1175/JHM-D-12-057.1, 2013.
Andsager, K., Beard, K. V., and Laird, N. F.: Laboratory Measurements of Axis Ratios for Large Raindrops, J. Atmos. Sci., 56, 2673–2683, https://doi.org/10.1175/1520-0469(1999)056<2673:LMOARF>2.0.CO;2, 1999.
Bao, X., Wu, L., Zhang, S., Li, Q., Lin, L., Zhao, B., Wu, D., Xia, W., and Xu, B.: Distinct Raindrop Size Distributions of Convective Inner- and Outer-Rainband Rain in Typhoon Maria (2018), J. Geophys. Res.-Atmos., 125, 1–14, https://doi.org/10.1029/2020JD032482, 2020.
Beard, K. V. and Chuang, C.: A New Model for the Equilibrium Shape of Raindrops, J. Atmos. Sci., 44, 1509–1524, 1987.
Brandes, E. A., Zhang, G., and Vivekanandan, J.: Experiments in Rainfall Estimation with a Polarimetric Radar in a Subtropical Environment, J. Appl. Meteorol., 41, 674–685, https://doi.org/10.1175/1520-0450(2002)041<0674:EIREWA>2.0.CO;2, 2002.
Brandes, E. A., Zhang, G., and Vivekanandan, J.: An Evaluation of a Drop Distribution–Based Polarimetric Radar Rainfall Estimator, J. Appl. Meteorol., 42, 652–660, https://doi.org/10.1175/1520-0450(2003)042<0652:AEOADD>2.0.CO;2, 2003.
Brandes, E. A., Zhang, G., and Vivekanandan, J.: Comparison of Polarimetric Radar Drop Size Distribution Retrieval Algorithms, J. Atmos. Ocean. Technol., 21, 584–598, https://doi.org/10.1175/1520-0426(2004)021<0584:COPRDS>2.0.CO;2, 2004a.
Brandes, E. A., Zhang, G., and Vivekanandan, J.: Drop Size Distribution Retrieval with Polarimetric Radar: Model and Application, J. Appl. Meteorol., 43, 461–475, https://doi.org/10.1175/1520-0450(2004)043<0461:DSDRWP>2.0.CO;2, 2004b.
Brandes, E. A., Zhang, G., and Sun, J.: On the Influence of Assumed Drop Size Distribution Form on Radar-Retrieved Thunderstorm Microphysics, J. Appl. Meteorol. Climatol., 45, 259–268, https://doi.org/10.1175/JAM2335.1, 2006.
Bringi, V. N. and Chandrasekar, V.: Polarimetric Doppler Weather Radar: Principles and applications, Cambridge University Press, 636 pp., ISBN: 9780511541094, 2001.
Bringi, V. N., Huang, G.-J., Chandrasekar, V., and Gorgucci, E.: A Methodology for Estimating the Parameters of a Gamma Raindrop Size Distribution Model from Polarimetric Radar Data: Application to a Squall-Line Event from the TRMM/Brazil Campaign, J. Atmos. Ocean. Tech., 19, 633–645, 2002.
Cao, Q. and Zhang, G.: Errors in Estimating Raindrop Size Distribution Parameters Employing Disdrometer and Simulated Raindrop Spectra, J. Appl. Meteorol. Climatol., 48, 406–425, https://doi.org/10.1175/2008JAMC2026.1, 2009.
Cao, Q., Zhang, G., Brandes, E., Schuur, T., Ryzhkov, A., and Ikeda, K.: Analysis of Video Disdrometer and Polarimetric Radar Data to Characterize Rain Microphysics in Oklahoma, J. Appl. Meteorol. Climatol., 47, 2238–2255, https://doi.org/10.1175/2008JAMC1732.1, 2008.
Cao, Q., Zhang, G., Brandes, E. A., and Schuur, T. J.: Polarimetric Radar Rain Estimation through Retrieval of Drop Size Distribution Using a Bayesian Approach, J. Appl. Meteorol. Climatol., 49, 973–990, https://doi.org/10.1175/2009JAMC2227.1, 2010.
Cao, Q., Zhang, G., and Xue, M.: A Variational Approach for Retrieving Raindrop Size Distribution from Polarimetric Radar Measurements in the Presence of Attenuation, J. Appl. Meteorol. Climatol., 52, 169–185, https://doi.org/10.1175/JAMC-D-12-0101.1, 2013.
Chandrasekar, V. and Bringi, V. N.: Simulation of Radar Reflectivity and Surface Measurements of rainfall, J. Atmos. Ocean. Technol., 4, 464–478, 1987.
Chen, G., Zhao, K., Zhang, G., Huang, H., Liu, S., Wen, L., Yang, Z., Yang, Z., Xu, L., and Zhu, W.: Improving Polarimetric C-Band Radar Rainfall Estimation with Two-Dimensional Video Disdrometer Observations in Eastern China, J. Hydrometeorol., 18, 1375–1391, https://doi.org/10.1175/JHM-D-16-0215.1, 2017.
Chu, Y.-H. and Su, C.-L.: An Investigation of the Slope–Shape Relation for Gamma Raindrop Size Distribution, J. Appl. Meteorol. Climatol., 47, 2531–2544, https://doi.org/10.1175/2008JAMC1755.1, 2008.
Doviak, R. J. and Zrnić, D. S.: Doppler radar and weather observations, 2nd edn., Academic Press, San Diego, 562 pp., ISBN: 9780122214226, https://doi.org/10.1016/C2009-0-22358-0, 1993.
Gao, W., Sui, C.-H., Chen Wang, T.-C., and Chang, W.-Y.: An evaluation and improvement of microphysical parameterization from a two-moment cloud microphysics scheme and the Southwest Monsoon Experiment (SoWMEX)/Terrain-influenced Monsoon Rainfall Experiment (TiMREX) observations, J. Geophys. Res., 116, D19101, https://doi.org/10.1029/2011JD015718, 2011.
Goddard, J. W. F., Morgan, K. L., Illingworth, A. J., and Sauvageot, H., Dual-wavelength polarization measurements in precipitation using the CAMRa and Rabelais radar, 27th conf. Radar Meteorol., Colorado, USA, 9–13 October 1995, Amer. Meteorol. Soc., 196–198, 1995.
Gorgucci, E., Scarchilli, G., Chandrasekar, V., and Bringi, V. N.: Measurement of Mean Raindrop Shape from Polarimetric Radar Observations, J. Atmos. Sci., 57, 3406–3413, https://doi.org/10.1175/1520-0469(2000)057<3406:MOMRSF>2.0.CO;2, 2000.
Gorgucci, E., Scarchilli, G., Chandrasekar, V., and Bringi, V. N.: Rainfall Estimation from Polarimetric Radar Measurements: Composite Algorithms Immune to Variability in Raindrop Shape–Size Relation, J. Atmos. Ocean. Technol., 18, 1773–1786, https://doi.org/10.1175/1520-0426(2001)018<1773:REFPRM>2.0.CO;2, 2001.
Gorgucci, E., Chandrasekar, V., Bringi, V. N., and Scarchilli, G.: Estimation of Raindrop Size Distribution Parameters from Polarimetric Radar Measurements, J. Atmos. Sci., 59, 2373–2384, https://doi.org/10.1175/1520-0469(2002)059<2373:EORSDP>2.0.CO;2, 2002.
Gosset, M., Zahiri, E.-P., and Moumouni, S.: Rain drop size distribution variability and impact on X-band polarimetric radar retrieval: Results from the AMMA campaign in Benin, Q. J. Roy. Meteor. Soc., 136, 243–256, https://doi.org/10.1002/qj.556, 2010.
Haddad, Z. S., Short, D. A., Durden, S. L., Im, E., Hensley, S., Grable, M. B., and Black, R. A.: A new parametrization of the rain dropsize distribution, IEEE Trans. Geosci. Remote Sens., 35, 532–539, https://doi.org/10.1109/36.581961, 1997.
Illingworth, A. J. and Blackman, T. M.: The Need to Represent Raindrop Size Spectra as Normalized Gamma Distributions for the Interpretation of Polarization Radar Observations, J. Appl. Meteorol., 41, 286–297, https://doi.org/10.1175/1520-0450(2002)041<0286:TNTRRS>2.0.CO;2, 2002.
Keenan, T. D., Carey, L. D., Zrnic, S. D., and May, P. T., Sensitivity of 5-cm wavelength polarimetric radar variables to raindrop axial ratio and drop size distribution, J. Appl. Meteorol., 40, 526–545, 2001.
Kim, H.-L., Jung, S.-H., and Jang, K.-I.: Estimating Rain Microphysical Characteristics Using S-Band Dual-Polarization Radar in South Korea, J. Atmos. Ocean. Technol., 37, 1067–1084, https://doi.org/10.1175/JTECH-D-19-0068.1, 2020.
Koffi, A. K., Gosset, M., Zahiri, E.-P., Ochou, A. D., Kacou, M., Cazenave, F., and Assamoi, P.: Evaluation of X-band polarimetric radar estimation of rainfall and rain drop size distribution parameters in West Africa, Atmos. Res., 143, 438–461, https://doi.org/10.1016/j.atmosres.2014.03.009, 2014.
Kozu, T. and Nakamura, K.: Rainfall Parameter Estimation from Dual-Radar Measurement Combining Reflectivity Profile and Path-integrated Attenuation, J. Atmos. Ocean. Technol., 8, 259–270, 1991.
Kozu, T., Reddy, K. K., Mori, S., Thurai, M., Ong, J. T., Rao, D. N., and Shimomai, T.: Seasonal and Diurnal Variations of Raindrop Size Distribution in Asian Monsoon Region, J. Meteorol. Soc. Jpn. Ser II, 84A, 195–209, https://doi.org/10.2151/jmsj.84A.195, 2006.
Kumar, L. S., Lee, Y. H., and Ong, J. T.: Two-Parameter Gamma Drop Size Distribution Models for Singapore, IEEE Trans. Geosci. Remote Sens., 49, 3371–3380, https://doi.org/10.1109/TGRS.2011.2124464, 2011.
Lavanya, S., Kirankumar, N. V. P., Aneesh, S., Subrahmanyam, K. V., and Sijikumar, S.: Seasonal variation of raindrop size distribution over a coastal station Thumba: A quantitative analysis, Atmos. Res., 229, 86–99, https://doi.org/10.1016/j.atmosres.2019.06.004, 2019.
Lee, G. W. and Zawadzki, I.: Variability of Drop Size Distributions: Time-Scale Dependence of the Variability and Its Effects on Rain Estimation, J. Appl. Meteorol. Climatol., 44, 241–255, https://doi.org/10.1175/JAM2183.1, 2005.
Liu, H. and Chandrasekar, V.: Classification of Hydrometeors Based on Polarimetric Radar Measurements: Development of Fuzzy Logic and Neuro-Fuzzy Systems, and In-Situ Verification, J. Atmos. Ocean. Technol., 17, 140–164, https://doi.org/10.1175/1520-0426(2000)017<0140:COHBOP>2.0.CO;2, 2000.
Maki, M., Park, S.-G., and Bringi, V. N.: Effect of Natural Variations in Rain Drop Size Distributions on Rain Rate Estimators of 3 cm Wavelength Polarimetric Radar, J. Meteorol. Soc. Jpn., 83, 871–893, https://doi.org/10.2151/jmsj.83.871, 2005.
Marzano, F. S., Scaranari, D., and Vulpiani, G.: Supervised Fuzzy-Logic Classification of Hydrometeors Using C-Band Weather Radars, IEEE Trans. Geosci. Remote Sens., 45, 3784–3799, https://doi.org/10.1109/TGRS.2007.903399, 2007.
Matrosov, S. Y., Clark, K. A., Martner, B. E., and Tokay, A.: X-Band Polarimetric Radar Measurements of Rainfall, J. Appl. Meteorol., 41, 941–952, https://doi.org/10.1175/1520-0450(2002)041<0941:XBPRMO>2.0.CO;2, 2002.
Matrosov, S. Y., Kingsmill, D. E., Martner, B. E., and Ralph, F. M.: The Utility of X-Band Polarimetric Radar for Quantitative Estimates of Rainfall Parameters, J. Hydrometeorol., 6, 248–262, https://doi.org/10.1175/JHM424.1, 2005.
Mishchenko, M. I., Travis, L. D., and Macke, A.: Scattering of light by polydisperse, randomly oriented, finite circular cylinders, Appl. Optics, 35, 4927, https://doi.org/10.1364/AO.35.004927, 1996.
Moisseev, D. and Chandrasekar, V.: Examination of the mu – lambda Relation Suggested for Drop Size Distribution Parameters, J. Atmos. Ocean. Technol., 24, 847–855, https://doi.org/10.1175/JTECH2010.1, 2007.
Penide, G., Protat, A., Kumar, V. V., and May, P. T.: Comparison of Two Convective/Stratiform Precipitation Classification Techniques: Radar Reflectivity Texture versus Drop Size Distribution–Based Approach, J. Atmos. Ocean. Technol., 30, 2788–2797, https://doi.org/10.1175/JTECH-D-13-00019.1, 2013.
Pruppacher, H. R. and Beard, K. V.: A wind tunnel investigation of the internal circulation and shape of water drops falling at terminal velocity in air, Q. J. Roy. Meteor. Soc., 96, 247–256, https://doi.org/10.1002/qj.49709640807, 1970.
Pruppacher, H. R. and Pitter, R. L.: A Semi-Emprical Determination of the Shape of Cloud and Rain Drops, J. Atmos. Sci., 28, 86–94, 1971.
Radhakrishna, B. and Rao, T. N.: Statistical Characteristics of Multipeak Raindrop Size Distributions at the Surface and Aloft in Different Rain Regimes, Mon. Weather Rev., 137, 3501–3518, https://doi.org/10.1175/2009MWR2967.1, 2009.
Radhakrishna, B. and Rao, T. N.: Diurnal Variation of Rainfall in the Presence of Large- and Small-Scale Precipitating Systems during Different Monsoon Seasons over a Complex Terrain (Gadanki) Region, J. Appl. Meteorol. Climatol., 60, 857–872, https://doi.org/10.1175/JAMC-D-20-0269.1, 2021.
Radhakrishna, B., Rao, T. N., Rao, D. N., Rao, N. P., Nakamura, K., and Sharma, A. K.: Spatial and seasonal variability of raindrop size distributions in southeast India, J. Geophys. Res., 114, D04203, https://doi.org/10.1029/2008JD011226, 2009.
Rao, T. N., Rao, D. N., Mohan, K., and Raghavan, S.: Classification of tropical precipitating systems and associated Z–R relationships, J. Geophys. Res.-Atmos., 106, 17699–17711, https://doi.org/10.1029/2000JD900836, 2001.
Rao, T. N., Kirankumar, N. V. P., Radhakrishna, B., and Narayana Rao, D.: On the variability of the shape-slope parameter relations of the gamma raindrop size distribution model, Geophys. Res. Lett., 33, L22809, https://doi.org/10.1029/2006GL028440, 2006.
Rao, T. N., Kirankumar, N. V. P., Radhakrishna, B., Rao, D. N., and Nakamura, K.: Classification of Tropical Precipitating Systems Using Wind Profiler Spectral Moments. Part II: Statistical Characteristics of Rainfall Systems and Sensitivity Analysis, J. Atmos. Ocean. Technol., 25, 898–908, https://doi.org/10.1175/2007JTECHA1032.1, 2008.
Rao, T. N., Radhakrishna, B., Nakamura, K., and Prabhakara Rao, N.: Differences in raindrop size distribution from southwest monsoon to northeast monsoon at Gadanki, Q. J. Roy. Meteor. Soc., 135, 1630–1637, https://doi.org/10.1002/qj.432, 2009.
Rao, T. N., Amarjyothi, K., and Rao, S. V. B.: Attenuation relations for monsoonal rain at the X band from disdrometric measurements: Dependency on temperature, raindrop size distribution and drop shape models, Q. J. Roy. Meteor. Soc., 144, 64–76, https://doi.org/10.1002/qj.3291, 2018.
Rao, T. N., Anandan, V. K., Abhijeet, K., Pradeep Kumar, C., and Radhakrishna, B.: Dual-polarization Radar for Observing Precipitation at X band (DROP-X) – System description and validation, J. Atmos. Ocean. Technol., in preparation, 2023.
Rauber, R. M. and Nesbitt, S. W.: Radar Meteorology – A First Course, John Wiley & Sons Ltd, 443 pp., ISBN: 978-1-118-43262-4, 2018.
Raupach, T. H. and Berne, A.: Retrieval of the raindrop size distribution from polarimetric radar data using double-moment normalisation, Atmos. Meas. Tech., 10, 2573–2594, https://doi.org/10.5194/amt-10-2573-2017, 2017.
Rosenfeld, D. and Ulbrich, C. W.: Cloud Microphysical Properties, Processes, and Rainfall Estimation Opportunities, Meteorol. Monogr., 30, 237–237, https://doi.org/10.1175/0065-9401(2003)030<0237:CMPPAR>2.0.CO;2, 2003.
Ryzhkov, A., Zhang, P., Bukovčić, P., Zhang, J., and Cocks, S.: Polarimetric Radar Quantitative Precipitation Estimation, Remote Sens., 14, 1695, https://doi.org/10.3390/rs14071695, 2022.
Ryzhkov, A. V. and Zrnic, D. S.: Radar Polarimetry for Weather Observations, Springer International Publishing, Cham, https://doi.org/10.1007/978-3-030-05093-1, 2019.
Saikranthi, K., Narayana Rao, T., Radhakrishna, B., and Rao, S. V. B.: Morphology of the vertical structure of precipitation over India and adjoining oceans based on long-term measurements of TRMM PR, J. Geophys. Res.-Atmos., 119, 8433–8449, https://doi.org/10.1002/2014JD021774, 2014.
Seela, B. K., Janapati, J., Lin, P.-L., Wang, P. K., and Lee, M.-T.: Raindrop Size Distribution Characteristics of Summer and Winter Season Rainfall Over North Taiwan, J. Geophys. Res.-Atmos., 123, 11602–11624, https://doi.org/10.1029/2018JD028307, 2018.
Seliga, T. A. and Bringi, V. N.: Potential Use of Radar Differential Reflectivity Measurement at Orthogonal Polarization for Measuring precipitation, J. Appl. Meteorol., 15, 69–76, 1976.
Serio, M. A., Carollo, F. G., and Ferro, V.: Raindrop size distribution and terminal velocity for rainfall erosivity studies. A review, J. Hydrol., 576, 210–228, https://doi.org/10.1016/j.jhydrol.2019.06.040, 2019.
Sheppard, B. E. and Joe, P. I.: Comparison of Raindrop Size Distribution Measurements by a Joss-Waldvogel Disdrometer, a PMS 2DG Spectrometer, and a POSS Doppler Radar, J. Atmos. Ocean. Technol., 11, 874–887, 1994.
Smith, P. L.: Raindrop Size Distributions: Exponential or Gamma-Does the Difference Matter?, J. Appl. Meteorol., 42, 1031–1034, https://doi.org/10.1175/1520-0450(2003)042<1031:RSDEOG>2.0.CO;2, 2003.
Sulochana, Y., Rao, T. N., Sunilkumar, K., Chandrika, P., Raman, M. R., and Rao, S. V. B.: On the seasonal variability of raindrop size distribution and associated variations in reflectivity – Rainrate relations at Tirupati, a tropical station, J. Atmos. Sol.-Terr. Phys., 147, 98–105, https://doi.org/10.1016/j.jastp.2016.07.011, 2016.
Tang, Q., Xiao, H., Guo, C., and Feng, L.: Characteristics of the raindrop size distributions and their retrieved polarimetric radar parameters in northern and southern China, Atmos. Res., 135–136, 59–75, https://doi.org/10.1016/j.atmosres.2013.08.003, 2014.
Testud, J., Oury, S., Black, R. A., Amayenc, P., and Dou, X.: The Concept of “Normalized” Distribution to Describe Raindrop Spectra: A Tool for Cloud Physics and Cloud Remote Sensing, J. Appl. Meteorol., 40, 1118–1140, https://doi.org/10.1175/1520-0450(2001)040<1118:TCONDT>2.0.CO;2, 2001.
Thurai, M. and Bringi, V. N.: Application of the generalized gamma model to represent the full rain drop size distribution spectra, J. Appl. Meteorol. Climatol., 57, 1197–1210, https://doi.org/10.1175/jamc-d-17-0235.1, 2018.
Tokay, A., Kruger, A., Krajewski, W. F., Kucera, P. A., and Filho, A. J. P.: Measurements of drop size distribution in the southwestern Amazon basin, J. Geophys. Res., 107, 8052, https://doi.org/10.1029/2001JD000355, 2002.
Tokay, A., D'Adderio, L. P., Marks, D. A., Pippitt, J. L., Wolff, D. B., and Petersen, W. A.: Comparison of Raindrop Size Distribution between NASA's S-Band Polarimetric Radar and Two-Dimensional Video Disdrometers, J. Appl. Meteorol. Climatol., 59, 517–533, https://doi.org/10.1175/JAMC-D-18-0339.1, 2020a.
Tokay, A., D'Adderio, L. P., Wolff, D. B., and Petersen, W. A.: Development and Evaluation of the Raindrop Size Distribution Parameters for the NASA Global Precipitation Measurement Mission Ground Validation Program, J. Atmos, Ocean. Technol., 37, 115–128, https://doi.org/10.1175/JTECH-D-18-0071.1, 2020b.
Trömel, S., Kumjian, M. R., Ryzhkov, A. V., Simmer, C., and Diederich, M.: Backscatter Differential Phase – Estimation and Variability, J. Appl. Meteorol. Climatol., 52, 2529–2548, https://doi.org/10.1175/JAMC-D-13-0124.1, 2013.
Uijlenhoet, R.: Raindrop size distributions and radar reflectivity–rain rate relationships for radar hydrology, Hydrol. Earth Syst. Sci., 5, 615–628, https://doi.org/10.5194/hess-5-615-2001, 2001.
Ulbrich, C. W.: Natural Variation in the Analytical form of Raindrop Size distribution, J. Clim. Appl. Meteorol., 22, 1764–1775, 1983.
Vivekanandan, J., Zrnic, D. S., Ellis, S. M., Oye, R., Ryzhkov, A. V., and Straka, J.: Cloud Microphysics Retrieval Using S-Band Dual-Polarization Radar Measurements, B. Am. Meteorol. Soc., 80, 381–388, 1999.
Vivekanandan, J., Zhang, G., Ellis, S. M., Rajopadhyaya, D., and Avery, S. K.: Radar reflectivity calibration using differential propagation phase measurement, Radio Sci., 38, 8049, https://doi.org/10.1029/2002RS002676, 2003.
Vulpiani, G., Marzano, F. S., Chandrasekar, V., Berne, A., and Uijlenhoet, R.: Polarimetric Weather Radar Retrieval of Raindrop Size Distribution by Means of a Regularized Artificial Neural Network, IEEE Trans. Geosci. Remote Sens., 44, 3262–3275, https://doi.org/10.1109/TGRS.2006.878438, 2006.
Wen, G., Xiao, H., Yang, H., Bi, Y., and Xu, W.: Characteristics of summer and winter precipitation over northern China, Atmos. Res., 197, 390–406, https://doi.org/10.1016/j.atmosres.2017.07.023, 2017.
Wen, L., Zhao, K., Chen, G., Wang, M., Zhou, B., Huang, H., Hu, D., Lee, W.-C., and Hu, H.: Drop Size Distribution Characteristics of Seven Typhoons in China, J. Geophys. Res.-Atmos., 123, 6529–6548, https://doi.org/10.1029/2017JD027950, 2018.
Willis, P. T.: Functional Fits to Some Observed Drop Size Distributions and Parameterization of Rain, J. Atmos. Sci., 41, 1648–1661, 1984.
Yoshikawa, E., Chandrasekar, V., Ushio, T., and Matsuda, T.: A Bayesian Approach for Integrated Raindrop Size Distribution (DSD) Retrieval on an X-Band Dual-Polarization Radar Network, J. Atmos. Ocean. Technol., 33, 377–389, https://doi.org/10.1175/JTECH-D-15-0060.1, 2016.
Zhang, G.: Weather radar polarimetry, CRC Press, Taylor & Francis Group, Boca Raton London New York, 304 pp., ISBN: 978-1-4398-6958-1, 2017.
Zhang, G., Vivekanandan, J., and Brandes, E.: A Method for Estimating Rain Rate and Drop Size Distribution from Polarimetric Radar Measurements, IEEE Trans. Geosci. Remote Sens., 39, 830–841, https://doi.org/10.1109/36.917906, 2001.
Zhang, G., Sun, J., and Brandes, E. A.: Improving Parameterization of Rain Microphysics with Disdrometer and Radar Observations, J. Atmos. Sci., 63, 1273–1290, https://doi.org/10.1175/JAS3680.1, 2006.
Zheng, H., Wu, Z., Zhang, L., Xie, Y., and Lei, H.: Improving Radar Rainfall Estimations with Scaled Raindrop Size Spectra in Mei-Yu Frontal Rainstorms, Sensors, 20, 5257, https://doi.org/10.3390/s20185257, 2020.
Zrnic, D. S., Ryzhkov, A., Straka, J., Liu, Y., and Vivekanandan, J.: Testing a Procedure for Automatic Classification of Hydrometeor Types, J. Atmos. Ocean. Technol., 18, 892–913, https://doi.org/10.1175/1520-0426(2001)018<0892:TAPFAC>2.0.CO;2, 2001.