the Creative Commons Attribution 4.0 License.
the Creative Commons Attribution 4.0 License.
 | 29 Feb 2024
A new software toolkit for optical apportionment of carbonaceous aerosol
Tommaso Isolabella
Vera Bernardoni
Alessandro Bigi
Marco Brunoldi
Federico Mazzei
Franco Parodi
Paolo Prati
Virginia Vernocchi
Dario Massabò
Instruments measuring aerosol light absorption, such as the Aethalometer and the Multi-Wavelength Absorbance Analyzer (MWAA), have been extensively used to characterize optical absorption of atmospheric particulate matter. Data retrieved with such instruments can be analysed with mathematical models to apportion different aerosol sources (Aethalometer model) and components (MWAA model). In this work we present an upgrade to the MWAA optical apportionment model. In addition to the apportionment of the absorption coefficient babs in its components (black carbon and brown carbon) and sources (fossil fuels and wood burning), the extended model allows for the retrieval of the absorption Ångström exponent of each component and source, thereby avoiding initial assumptions regarding these parameters. We also present a new open-source software toolkit, the MWAA model toolkit (MWAA_MT), written in both Python and R, that performs the entire apportionment procedure.
- Article
(2061 KB) - Full-text XML
-
Supplement
(648 KB) - BibTeX
- EndNote


Atmospheric particulate matter (PM) plays an important role in environmental issues such as human health, air quality, and climate change (Seinfeld and Pandis, 2016). Several chemical species and aggregates, present in the atmosphere, affect the energy balance of the Earth system by absorbing and scattering solar radiation (Laj et al., 2020). A variety of sources contribute to the emission of light-absorbing or light-scattering PM: their identification and quantification are necessary to mitigate the harmful effects of PM, especially in the climate change issue.
Among other constituents, black carbon (BC) and brown carbon (BrC) are the most light-absorbing components of PM (Bond et al., 2013). BC consists of fractal-like chains of submicron particles, and it is formed by incomplete combustion processes. Due to the wavelength independence of the imaginary part of its refractive index, it is a strong light absorber across the entire visible range. BrC represents a more elusive class of organic carbonaceous compounds whose defining characteristic is to absorb radiation more efficiently at shorter visible bands than at longer wavelengths, where its absorption is considered negligible (Pöschl, 2003; Andreae and Gelencser, 2006). The composition of BrC is still poorly understood, due to its chemical complexity and spatiotemporal variability; it consists of a number of molecular weight compounds, generally prone to oxidation and chemically unstable (Forrister et al., 2015). BrC is emitted directly through combustion of biomass but can also be formed as a product of secondary processes in the atmosphere (Liu et al., 2015; Tang et al., 2016).
Other aerosol compounds exhibit strong, albeit more selective, light-interaction properties. One such example is mineral dust, which is the most widespread aerosol type in terms of total mass, with a consequent important impact on the Earth's energy balance due to its light absorption properties (Alfaro et al., 2004; Caponi et al., 2017; Schepanski, 2018; Di Biagio et al., 2019). However, in this work, we restrict our attention to carbonaceous aerosol and its sources.
In general, the spectral dependence of light absorption by small particles can be parameterized with a power-law function. In particular, the aerosol absorption coefficient babs can be written as a function of the wavelength of the incoming radiation as , where c is a proportionality factor and α, the absorption Ångström exponent (AAE), defines the spectral dependence of the absorption. Different aerosol types correspond to different values of α, which has been shown to depend on particle size, morphology, chemical composition, and mixing/ageing state (Moosmüller et al., 2011; Utry et al., 2014). For BC in its ideal form (spherical particles with no wavelength dependence of the imaginary part of the refractive index), the literature is consistent in indicating an α value of 1, both for real-world aerosol (Bond and Bergstrom, 2006) and for that produced in samples under controlled conditions (Vernocchi et al., 2022), whereas much more variation is encountered in the value of α for BrC, with reported values ranging up to 9.5 (Hoffer et al., 2006; Harrison et al., 2013; Lack and Langridge, 2013). This is likely due to the broader range of chemical composition and effects of ageing. Intermediate values of α are observed for aerosols containing both BC and BrC (Massabò et al., 2019). This significant difference in the wavelength-dependent behaviour of light-absorbing components can be used as an efficient tool for the source and component apportionment of light-absorbing aerosol.
Source apportionment models exploiting the power-law behaviour of babs have been successfully applied to multi-λ measurements of absorption. The Aethalometer model (Sandradewi et al., 2008) allows for the apportionment of the absorption coefficient to two different sources, namely fossil fuels (FF) and wood burning (WB), exploiting the different α that characterizes the aerosol produced by the two sources. The MWAA (Multi-Wavelength Absorbance Analyzer) model extends the Aethalometer model by explicitly including the apportionment of optical absorption due to BC and BrC, resulting in an algorithm that allows for the differentiation of both aerosol sources and components, based on at least 5−λ absorption measurements (Massabò et al., 2015; Bernardoni et al., 2017). Both the Aethalometer model and the MWAA model are effective in apportioning aerosol absorption, but they have a conceptual drawback: the values of some physical parameters must be fixed prior to the analysis in order to run the algorithm. These parameters are α for FF and WB (αFF and αWB for the Aethalometer model and αFF, αWB, and αBC for the MWAA model). Since α depends on a variety of factors, as mentioned above, fixing these exponents for the analysis, according to the literature, can lead to errors, since the actual value of these exponents may be different for the specific aerosol analysed. The only way to avoid this problem is to retrieve these crucial parameters by using information obtained by independent techniques/methods (e.g. levoglucosan, 14C, receptor models, others), as stated in several recent publications in the literature (Massabò et al., 2015; Martinsson et al., 2017; Titos et al., 2017; Helin et al., 2018; Ivančič et al., 2022).
In this work we propose (1) a toolkit that implements a revised version of the original MWAA model, as published in Massabò et al. (2015). This toolkit has been rewritten and optimized in Python and R and is available for use by the scientific community. It has been also extended with the option to use an arbitrary number of spectrally resolved absorption coefficients, as long as at least five wavelengths are available. This model is self-consistent and can be applied to purely optical data without the need of any other information. We also propose (2) an upgrade to the original MWAA model that directly allows for source and component apportionment of absorption data without the need to set any parameters before running the model. This is achieved by performing the apportionment analysis along with a correlation study with independent measurements such as chemical speciation or elemental composition. The parameters are then automatically set by the algorithm, based on the values that give the best correlation with the independent measurements. The new software toolkit presented here is written in two of the most widely used scientific programming languages, Python and R, to perform this analysis automatically. The presented MWAA model toolkit (MWAA_MT) has the following output: αFF, αWB, αBC, αBrC, and the carbonaceous masses for fossil fuels and wood burning: EC OCFF, and EC OCWB respectively, where EC (OC) stands for elemental carbon (organic carbon). Finally, to demonstrate the capability of the upgraded model, we provide an example application to data published elsewhere (Bernardoni et al., 2017).
The MWAA model has been extensively described elsewhere (Massabò et al., 2015). Here we will only report the main points to establish the notation and describe the upgrades.
The measured aerosol absorption coefficient babs at different wavelengths is decomposed in two different ways:
and
Equation (1) represents the decomposition of the measured aerosol absorption coefficient, at each wavelength, into its contributions due to carbonaceous components, BC and BrC. Both species are assumed to absorb radiation according to a negative power law , with a different absorption exponent for BC (αBC) and BrC (αBrC).
Equation (2) has the same structure as the Aethalometer apportionment model (Sandradewi et al., 2008), whereby the absorption coefficient is decomposed into contributions from different sources, FF and WB. As in Eq. (1), these terms are also assumed to contribute to the total optical absorption following negative power law whose exponents are different for FF (αFF) and WB (αWB).
The parameters A, B, A′, and B′ are scaling factors proportional to the mass absorption cross-section (MAC) of each component. In the original MWAA model, all but one of the exponents (αBrC) are fixed to appropriate values according to the literature (Sandradewi et al., 2008; Favez et al., 2010; Herich et al., 2011; Harrison et al., 2013; Massabò et al., 2015; Zotter et al., 2017; Forello et al., 2019), most commonly and αWB=1.8 or 2. Then, the multi-λ measurements of babs are fitted using Eqs. (1) and (2), obtaining A, B, A′, B′, and αBrC. The contribution of the different sources and species to the optical absorption is obtained as follows.
The upgraded model we present eliminates the need to arbitrarily specify αBC, αFF, and αWB by instead adjusting their values so that the apportioned contributions found in Eq. (3) have the best correlation with independent measurements. Figure 1 shows a streamlined version of the upgraded MWAA model in which the independent measurement for the adjustment of the exponents is the levoglucosan content in the sample, as determined by chromatography. Levoglucosan is a strong tracer for biomass burning (Simoneit et al., 1999) and should therefore correlate well with and .
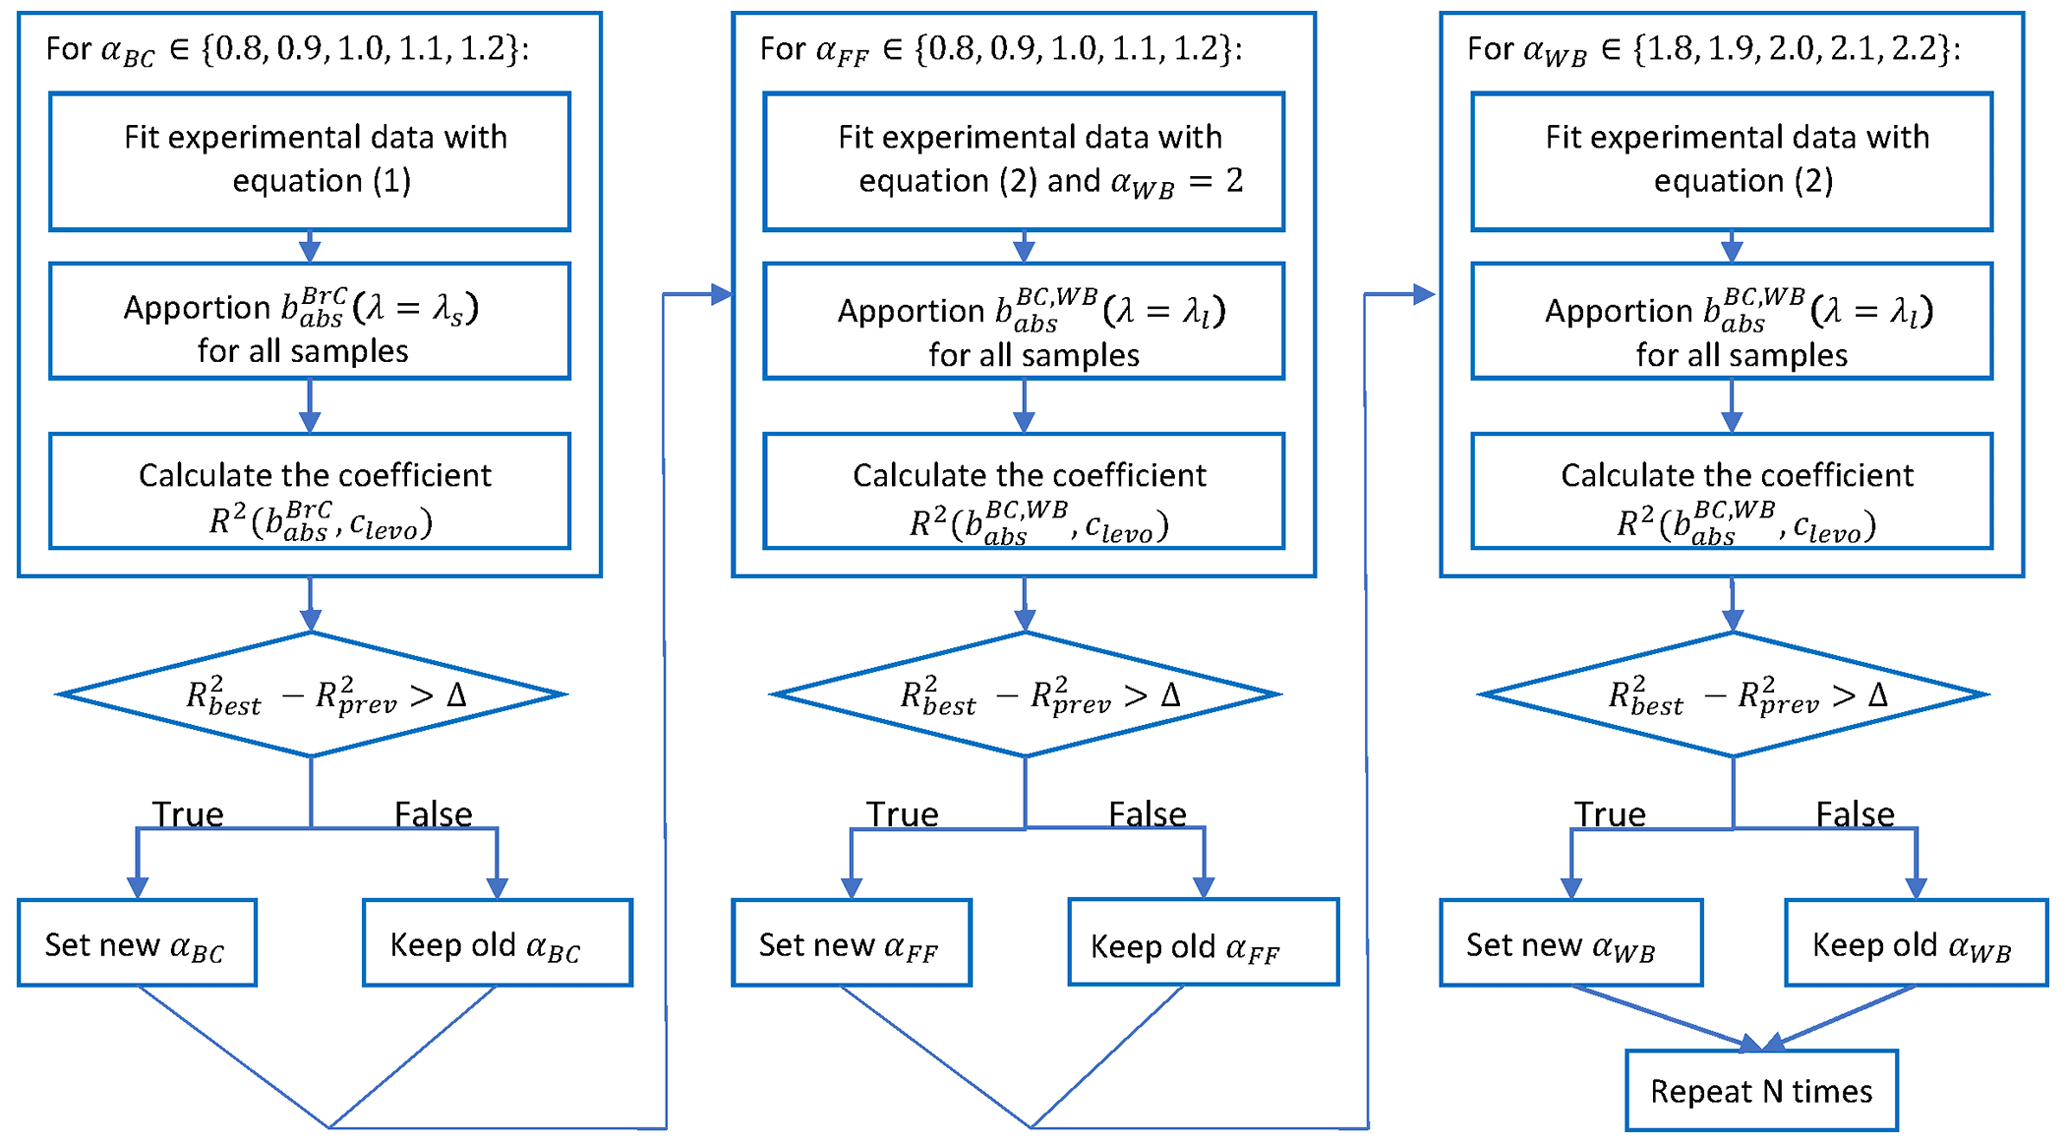
Figure 1Flowchart illustrating the pre-processing step in the improved MWAA model. clevo is the levoglucosan concentration in the samples, R2 is the coefficient of determination in the linear regression, and the subscripts best and prev respectively refer to the best correlation in the present iteration and the best correlation in the previous iteration relative to the same α; Δ is a tuneable tolerance that prevents statistically insignificant fluctuations from assuming a physical meaning.
The three parameters αBC, αFF, and αWB are each varied within their range, while the others are held constant. In the first step, αBC is varied in the set . For each αBC value, Eq. (1) is used to fit the data and is calculated for the shortest available wavelength using Eq. (3). The coefficient of determination R2 for a linear regression between and the levoglucosan concentration for all samples is calculated, and the αBC value that maximizes R2 is selected. In the second step, αWB is set to 2 and a similar procedure as described for the first step is performed for on αFF. Finally, in the third step, the procedure is repeated to find a best value for αWB It is worth noting that the permutation of the steps to minimize αFF and αWB leads to the same preprocessing results. These three steps are repeated N=3 times, restricting the range of variability for the parameters in each iteration to increase the accuracy of the search for the best values. To avoid statistically insignificant results, and to obtain a more robust result, a tolerance parameter Δ is introduced. If the increase in R2 in each minimization routine is less than the tolerance, the previous value of the relevant α is retained.
In addition to the component and source apportionment of the optical absorption coefficient, the MWAA model provides a method to perform the apportionment of EC and OC masses to the fossil fuel and wood burning contributions.
In the above equations, λl and λs represent the longest and shortest wavelengths for which a measurement is available respectively; OCNC is the organic carbon produced by biogenic sources which is considered optically inactive; k1 and k2 are coefficients, in g m−2, obtained by a linear regression of Eqs. (4d) and (4e), in subsets of samples in which the OC concentration is low (for k1) and high (for k2). The coefficients k1 and k2 are related to the mass absorption cross-sections (MACs) of BC and BrC respectively and to the ratios and . For more details on the mass apportionment procedure, see Massabò et al. (2015).
The software toolkit that performs the above-mentioned analysis has been released in the public domain (tisolabella and Bigi, 2024). Currently, it can only be run in a Linux distribution (for example, Ubuntu or Linux Mint).
MWAA_MT can perform optical and mass apportionment of data obtained with instruments measuring light absorption at least at five wavelengths, such as a multi-λ Aethalometer.
The toolkit works in four separate steps.
-
Step I. It retrieves the best values for the three parameters αBC, αFF, and αWB following the method detailed in Sect. 2.
-
Step II. The values of A, B, A′, B′, and αBrC are obtained from fitting Eqs. (1) and (2) with the remaining exponents fixed to the best values found in the previous step.
-
Step III. Equation (3) is employed to apportion the absorption coefficient at every wavelength.
-
Step IV. Following Eq. (4), the mass apportionment is performed for each sample.
The first step of the analysis is the most innovative aspect of the tool we introduce here, since the three values of αBC, αFF, and αWB are directly retrieved by the toolkit itself. However, if data from at least one independent analysis (e.g. levoglucosan, 14C, positive matrix factorization, PMF) are not available, the user can still set these three parameters manually. In addition, the mass apportionment step is optional depending on the availability of carbonaceous mass measurements: if EC and OC are not available for the samples, the user can decide to skip the fourth step. More details on the toolkit and the analysis procedure are contained in the Supplement to this article.
Similarly, the user can set many of the analysis hyperparameters. To perform the first step of the analysis, the current version of the toolkit allows comparison of the optical apportionment with levoglucosan measurements, as described above. Future versions of MWAA_MT will likely allow the user to choose between different types of preprocessing analysis, considering different types of data such as 14C measurements or source apportionment results obtained with independent techniques such as PMF or multilinear engine (ME-2) receptor models. Another possibility could be to constrain the model to maximize the correlation with tracers of traffic emission such as NOx.
Any number of samples can be provided for an analysis run; for the main optical apportionment procedure, steps II and III, each sample is processed independently, whereas for steps I and IV the entire dataset is considered for the regression analyses. Therefore, extra care must be taken to avoid entering obvious outliers as input to the software, and the analysis may need to be run twice, with the first run serving to weed out potential outliers and adjust the range of parameter variation.
As an example application of MWAA_MT, we examine the results of the apportionment of two datasets previously published (Bernardoni et al., 2017). The first dataset is from a sampling campaign conducted in fall/winter 2014 in Propata, a rural site in northern Italy, while the second dataset is from a campaign conducted in winter 2016 at an urban background site in Milan, one of the largest cities in Italy. In these campaigns, PM10 samples were collected on quartz fibre filters, with each filter sampled (for 48 h in Propata, for 12 h in Milan) and then analysed with the MWAA instrument to obtain the wavelength-resolved absorption coefficients of the aerosol. All samples were analysed by high-performance liquid chromatography (HPLC) with pulsed amperometric detection (PAD) to determine the levoglucosan concentration (Piazzalunga et al., 2010). No information on chemical speciation (except levoglucosan) was available at the two sites; the average PM10 concentration measured at Propata and Milan was 8.3±6.0 and 68.3±25.6 µg m−3 respectively. Further details on the measurements can be found in Bernardoni et al. (2017). In the current study, we apply the updated MWAA model toolkit (MWAA_MT) to 28 samples from the Propata campaign (hereinafter referred to as “P” samples) and 25 samples from the Milan campaign (“AIN” samples). The aim of the comparison is to verify whether the particulate sampled in a rural area has a different optical behaviour than the aerosol sampled in an urban area. The following steps were performed identically for both datasets.
4.1 Preliminary: comparison with levoglucosan concentrations
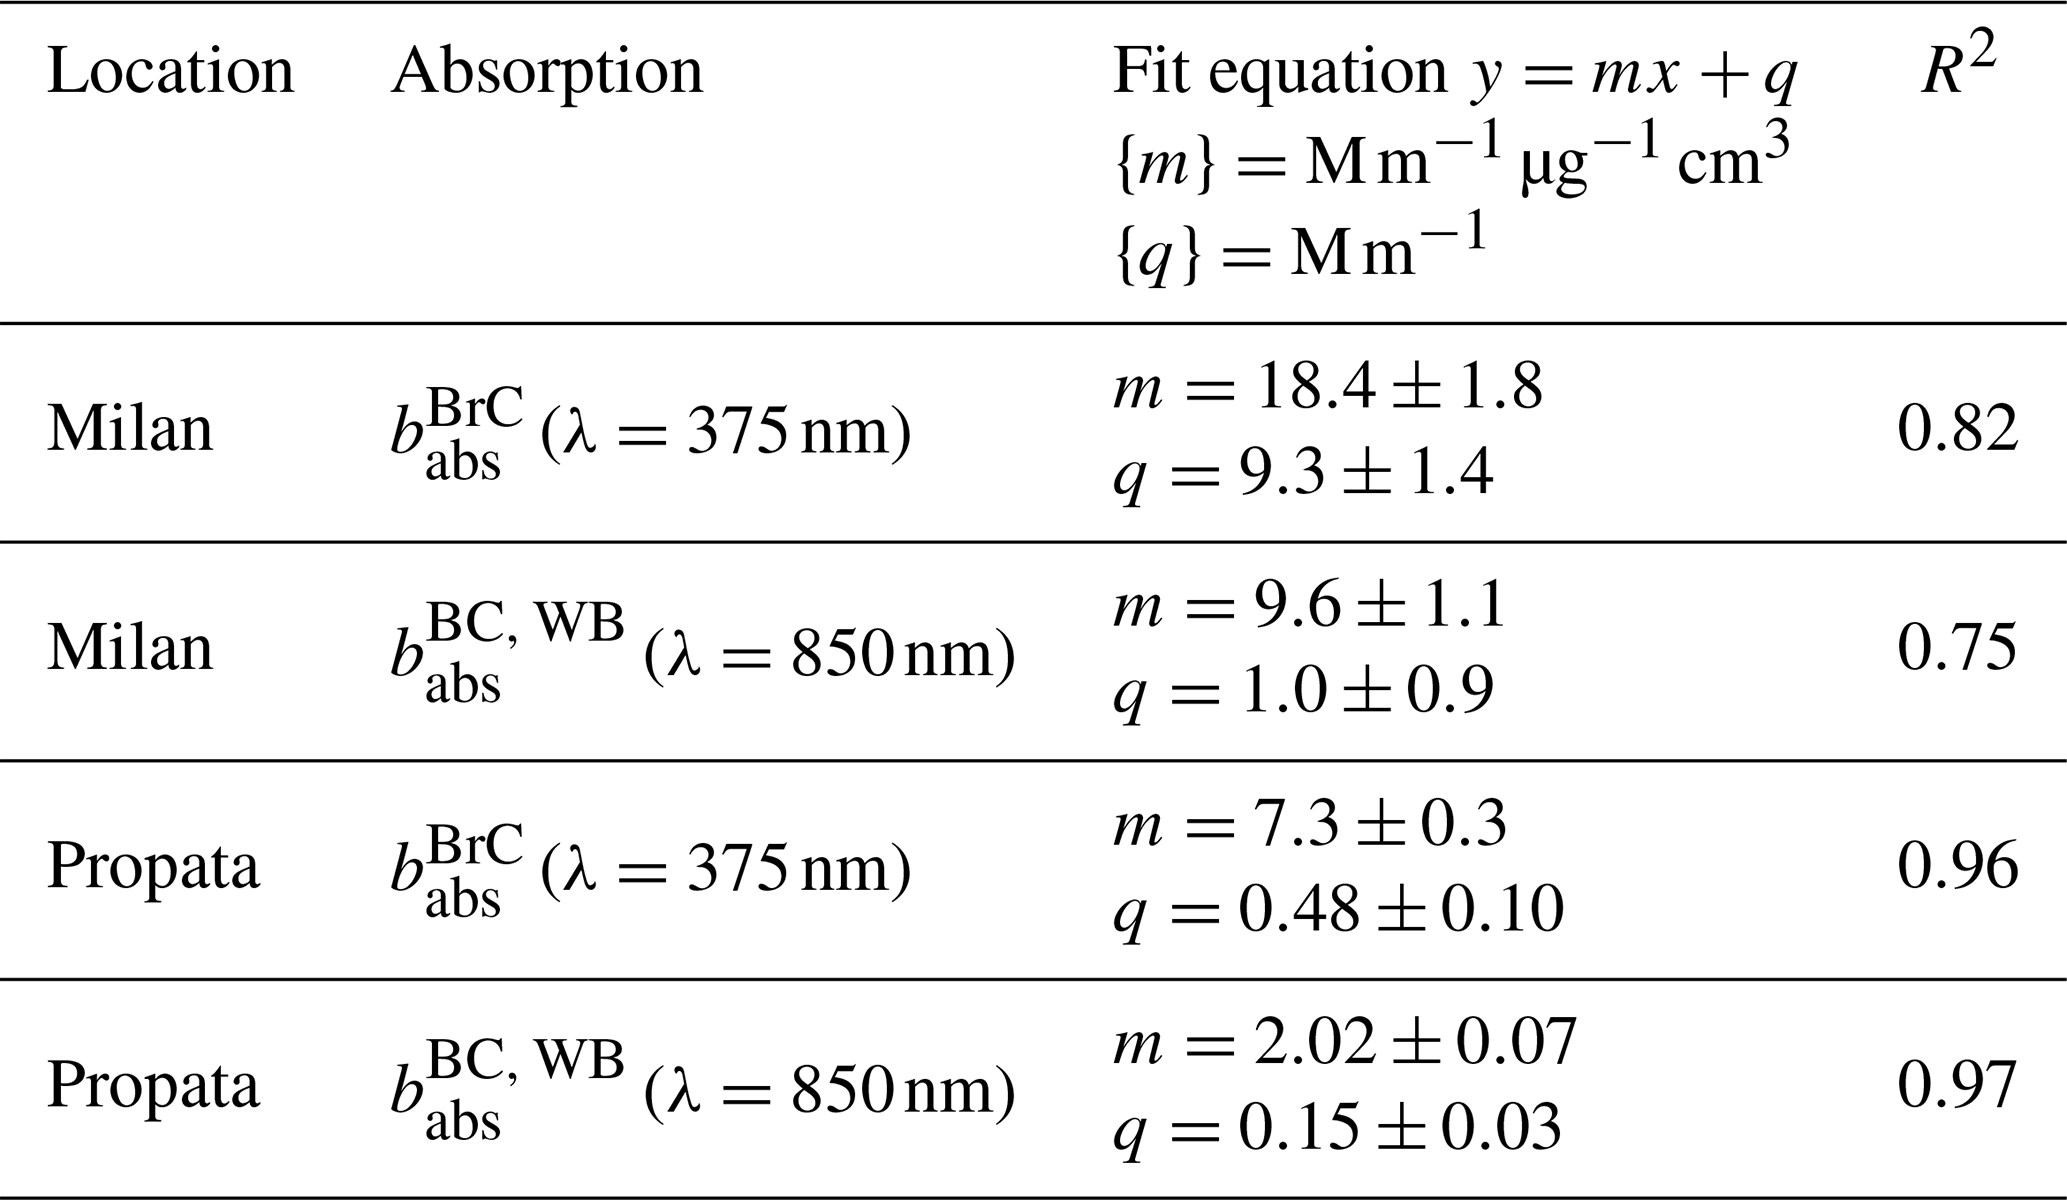
To determine the goodness of the apportionment procedure even without the extra pre-processing step, default values for the free parameters were chosen (, αWB=2) and the standard MWAA model for optical apportionment (steps II and III above) was run. Figure 2 shows the correlation plots between the levoglucosan concentration and the relevant apportionment results, namely and The linear regression equations and coefficients of determination are given in Table 1.
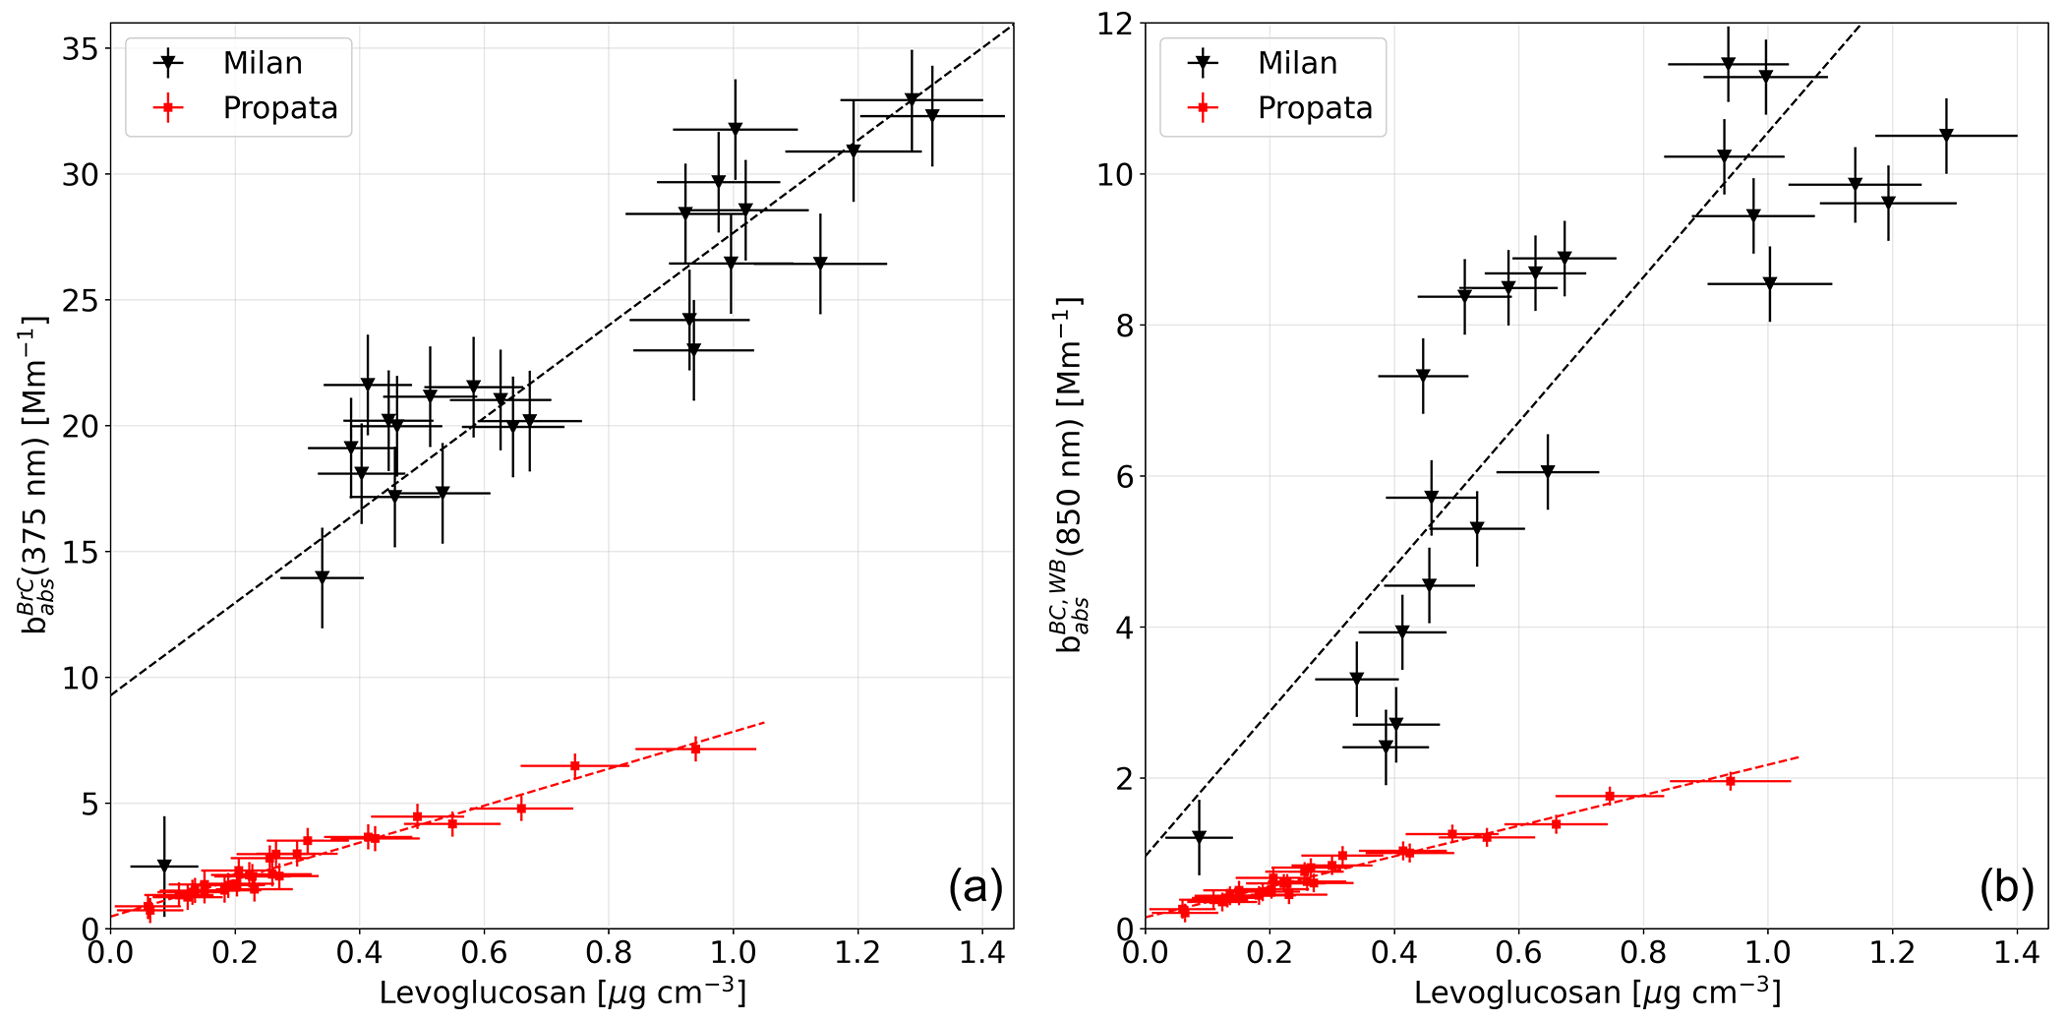
Figure 2Correlation between the levoglucosan concentration and the apportioned absorption coefficient of BrC at 375 nm (a) and the absorption coefficient of BC due to wood burning at 850 nm (b). The rural site, Propata (red dots) exhibits a higher correlation than the urban site Milan (black triangles).
Table 1Results of the correlation analysis between the apportioned data and the independent measurement, in this case levoglucosan concentration. The goodness-of-fit of the correlation, represented by the coefficient of determination R2, is much higher in Propata than in Milan.
4.2 Analysis step I
As described in Sect. 2, the first step of the upgraded apportionment model is to find the values of the absorption exponents that maximize the correlation between some of the model's output values and one or more independent techniques. In this case, since the concentration of levoglucosan (hereinafter cl) was measured on all samples, the following set of optimizations (levoglucosan analysis preset in MWAA_MT) was carried out:
-
vary αBC to maximize the correlation between and cl;
-
vary αFF to maximize the correlation between and cl;
-
vary αWB to maximize the correlation between and cl.
The resulting sets of exponents were for Propata and for Milan. Figure 3 shows the variation in the R2 coefficient in the two sites: the change in αWB value does not produce any sizeable impact on the analysis of the rural dataset, whereas in Milan the best choice turned out to be . Through the sensitivity tests we performed on the preprocessing step, we discovered that the apportioned optical absorption coefficients can vary by up to 10 % by adjusting the values of the α parameters within their uncertainty brackets. We estimated the uncertainty in the α parameters by considering the steepness of the R2 vs. α curves. The curve of αFF is very steep, which led us to estimate an uncertainty of 0.02, whereas the R2 vs. α curves for the other two parameters were flatter, indicating a larger uncertainty for these parameters.
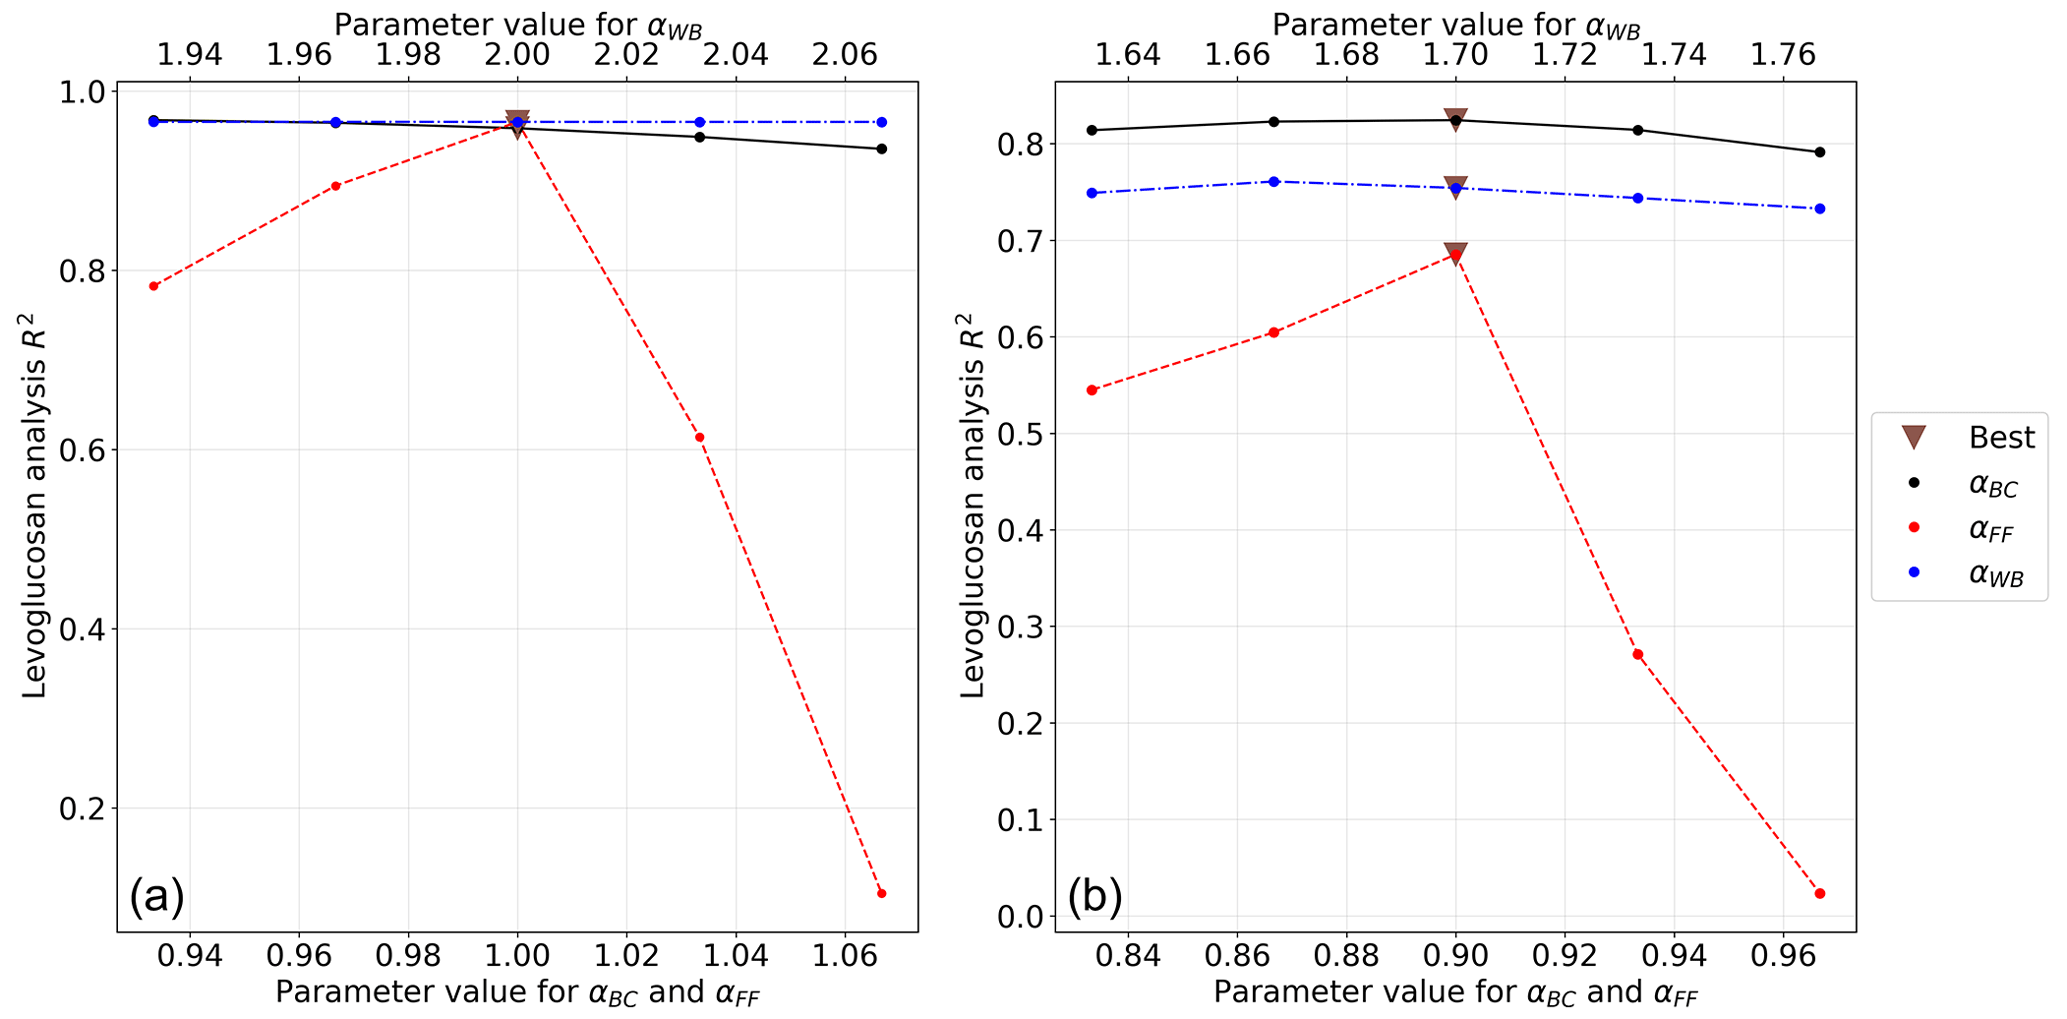
Figure 3Trend of the R2 correlation coefficient between the levoglucosan concentration and the apportioned optical absorption coefficient vs. the value of the α exponents: Propata (a) and Milan dataset (b). The values of α parameter which maximize the R2 coefficient are marked with a brown triangle. The plots are shown only for the last iteration of the preprocessing step.
This justifies the choice of setting αWB=2.0 for the rural site, while the same choice is less robust for the urban site, where αWB=1.7 would be the more appropriate setting. The analysis confirms the usual choice of αBC=1.0 for the rural site, while αBC=0.9 gives the optimal value for the urban dataset, possibly indicating a further reprocessing and ageing of pure BC particles in the urban environment (Minderytė et al., 2022). As with αFF, the analysis yields αFF=1.0 and αFF=0.9 for the rural and urban site/dataset respectively.
4.3 Analysis step II
The parameters found in step I are then fixed for each dataset, and a complete double fit of the experimental data is performed for each sample following Eqs. (1) and (2). An example of such fits for a sample belonging to each of the two datasets is shown in Fig. 4.
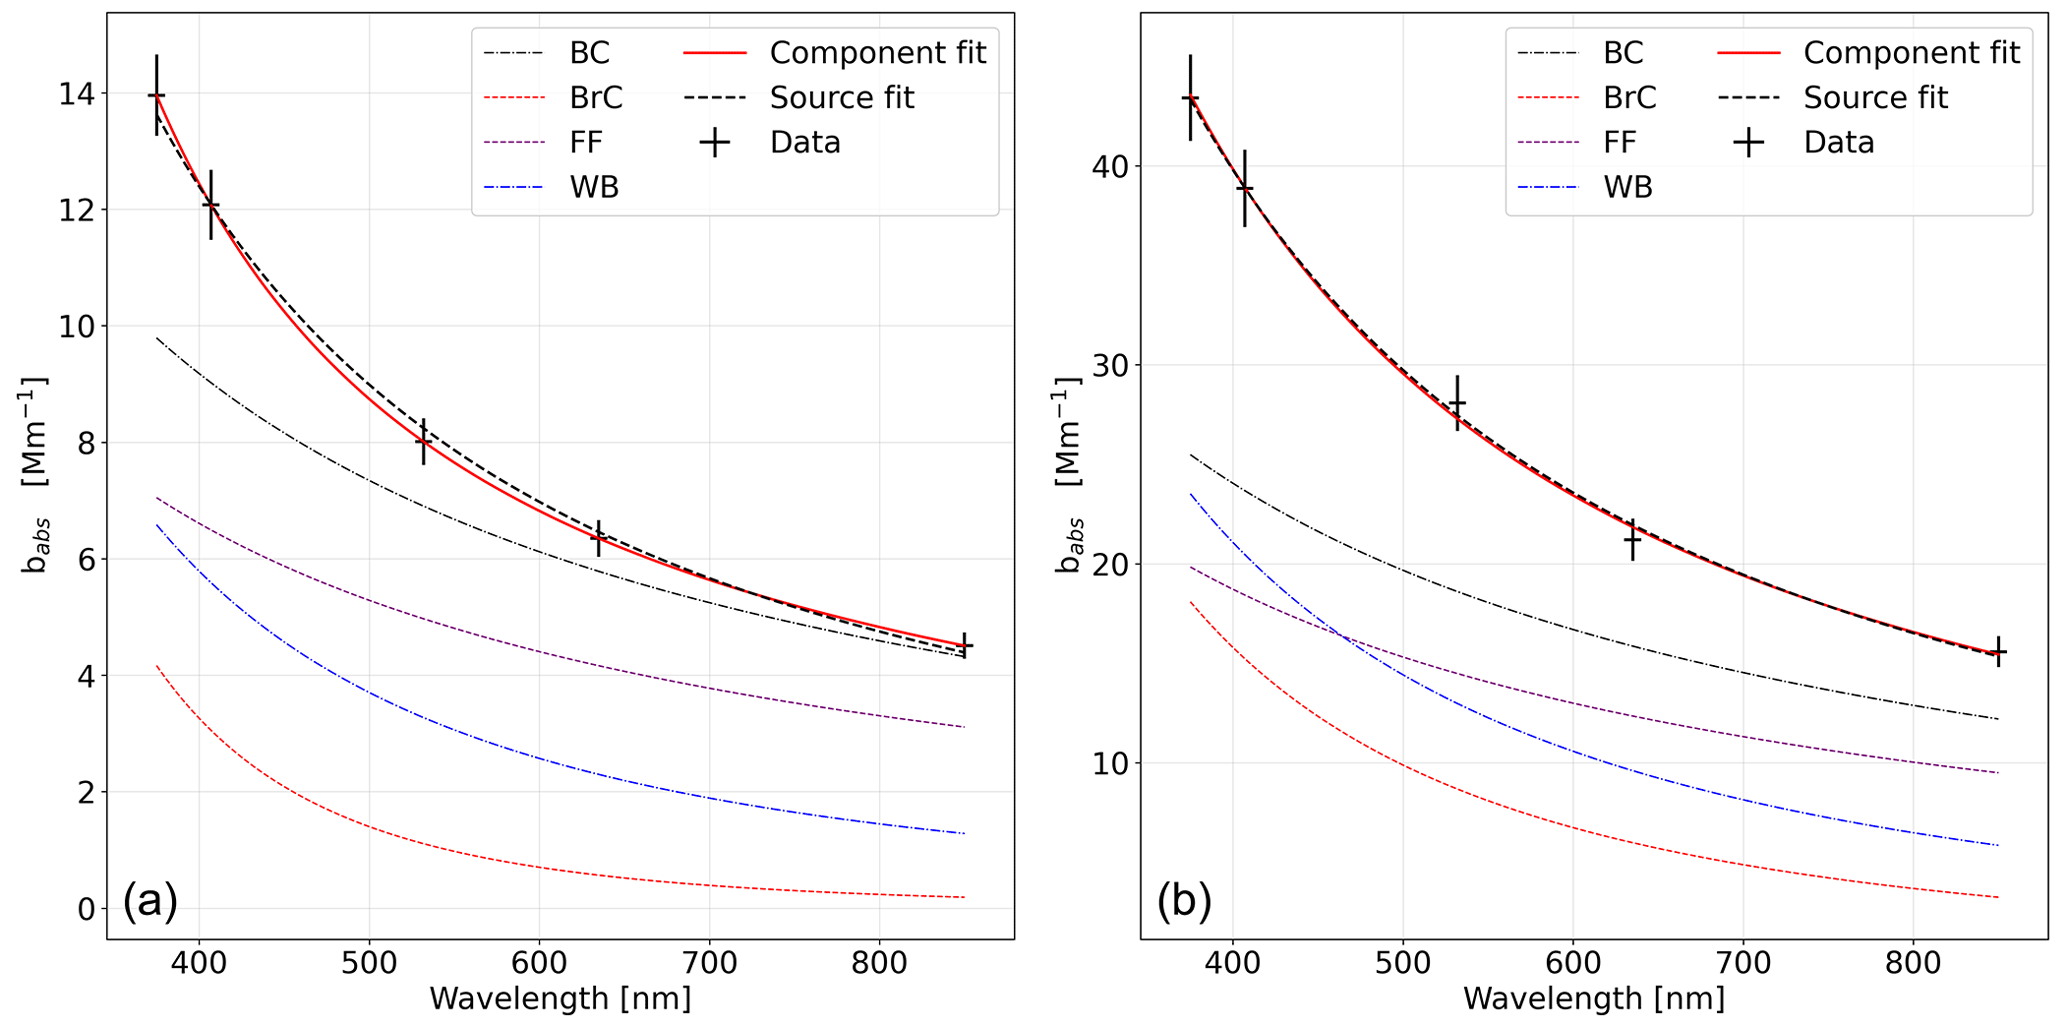
Figure 4Absorption coefficient plots for a representative sample from the rural site in Propata (a) and the urban site in Milan (b). The experimental data points are marked with uncertainty crosses. Superimposed on the graphs are the results of the fits carried out with the two different decompositions from Sect. 1.
One of the parameters determined during the fitting procedure is αBrC. Its range of variability over the entire dataset and the uncertainty associated with its value allow for estimation of the physical and chemical variability in the analysed particulate. Figure 5 shows the determined values of αBrC for the entire sampling period at the two sites. At a rural site such as Propata, where wood burning is the predominant source of carbonaceous particulate in the atmosphere during winter, BrC corresponds to a well-defined sub-category of organic carbon, and its absorption properties are therefore constant. This is confirmed by the very small range of variation in the value of αBrC obtained for all Propata samples, with , where the uncertainty is due to inherent systematic variations in the minimization routine. At the Milan urban site, the range of variability in αBrC is much higher. This can be due to the fact that the urban aerosol is much more complex and contains a larger number of organic carbon compounds from different types of wood burned under different conditions, some of which could affect the optical behaviour of the aerosol. Moreover, stagnation conditions that favour ageing processes are typical of Milan (and the Po Valley in general): they generally lead to an increase in the molecular weight of organic matter, possibly enhancing light-absorption properties. Therefore, our model, based on this simple decomposition, does not retrieve a sharp value for αBrC, since the optical properties of BrC vary strongly in Milan, unlike in Propata where the sampled particulate was comparatively simpler. The determined absorption exponent for BrC in Milan is therefore .
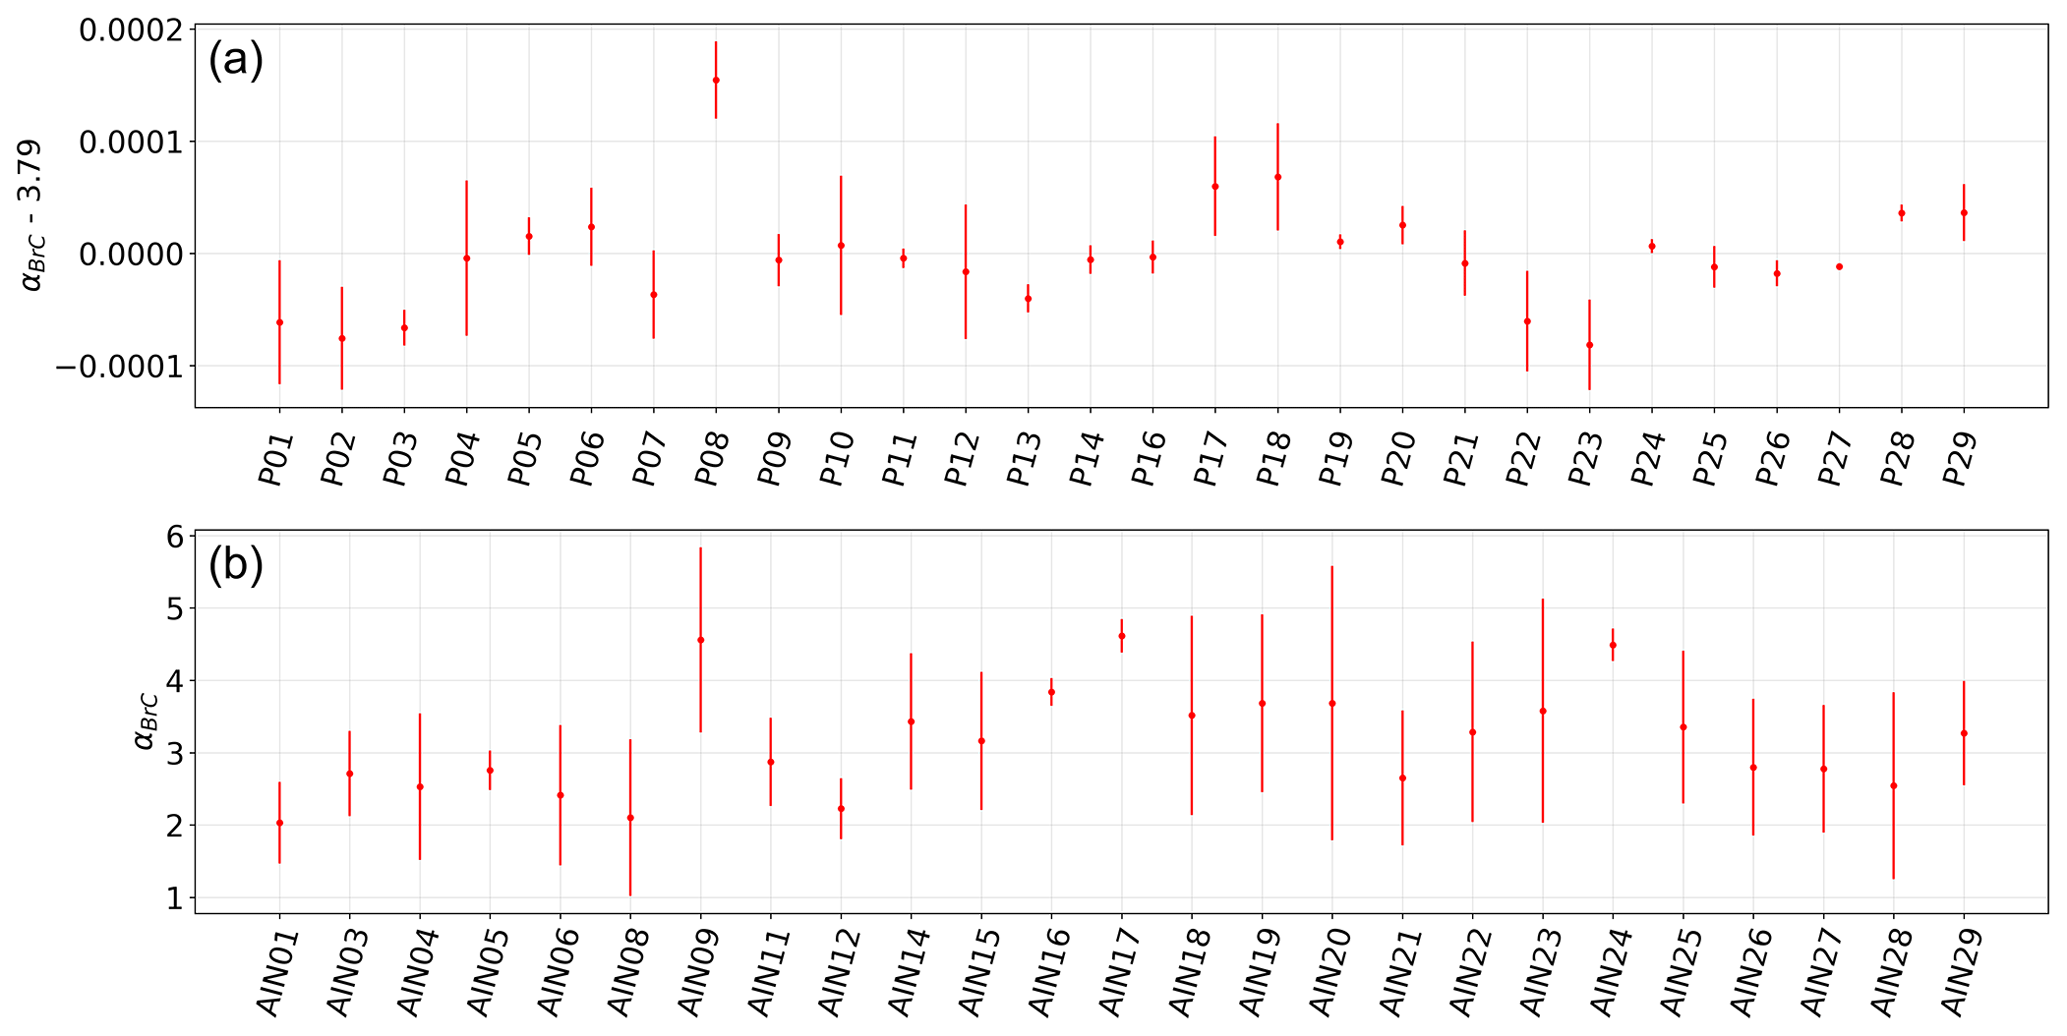
Figure 5Values of the parameter αBrC for all samples in the datasets: Propata/rural (a) and Milan/urban (b).
4.4 Analysis step III
The optical apportionment of the absorption coefficient is performed for all available wavelengths according to Eq. (3). Figures 6 and 7 show the apportioned babs at UV (375 nm) and IR (850 nm) wavelengths for Propata and Milan respectively. The main difference between the two sites is the correlation between and . In Propata (Fig. 6) the correlation is high, as can be inferred by the blue and black lines having the same time trend. This means that most of the BrC is produced via WB. On the other hand, in Milan (Fig. 7) this correlation is lower, and BrC cannot be entirely attributed to WB. In fact, in Milan the particulate is impacted by a number of different sources, and it is heavily processed due to stagnation. A general feature common to both datasets is the negligible absorption attributed to BrC at long wavelengths; this is consistent with previous work (Massabò et al., 2015).
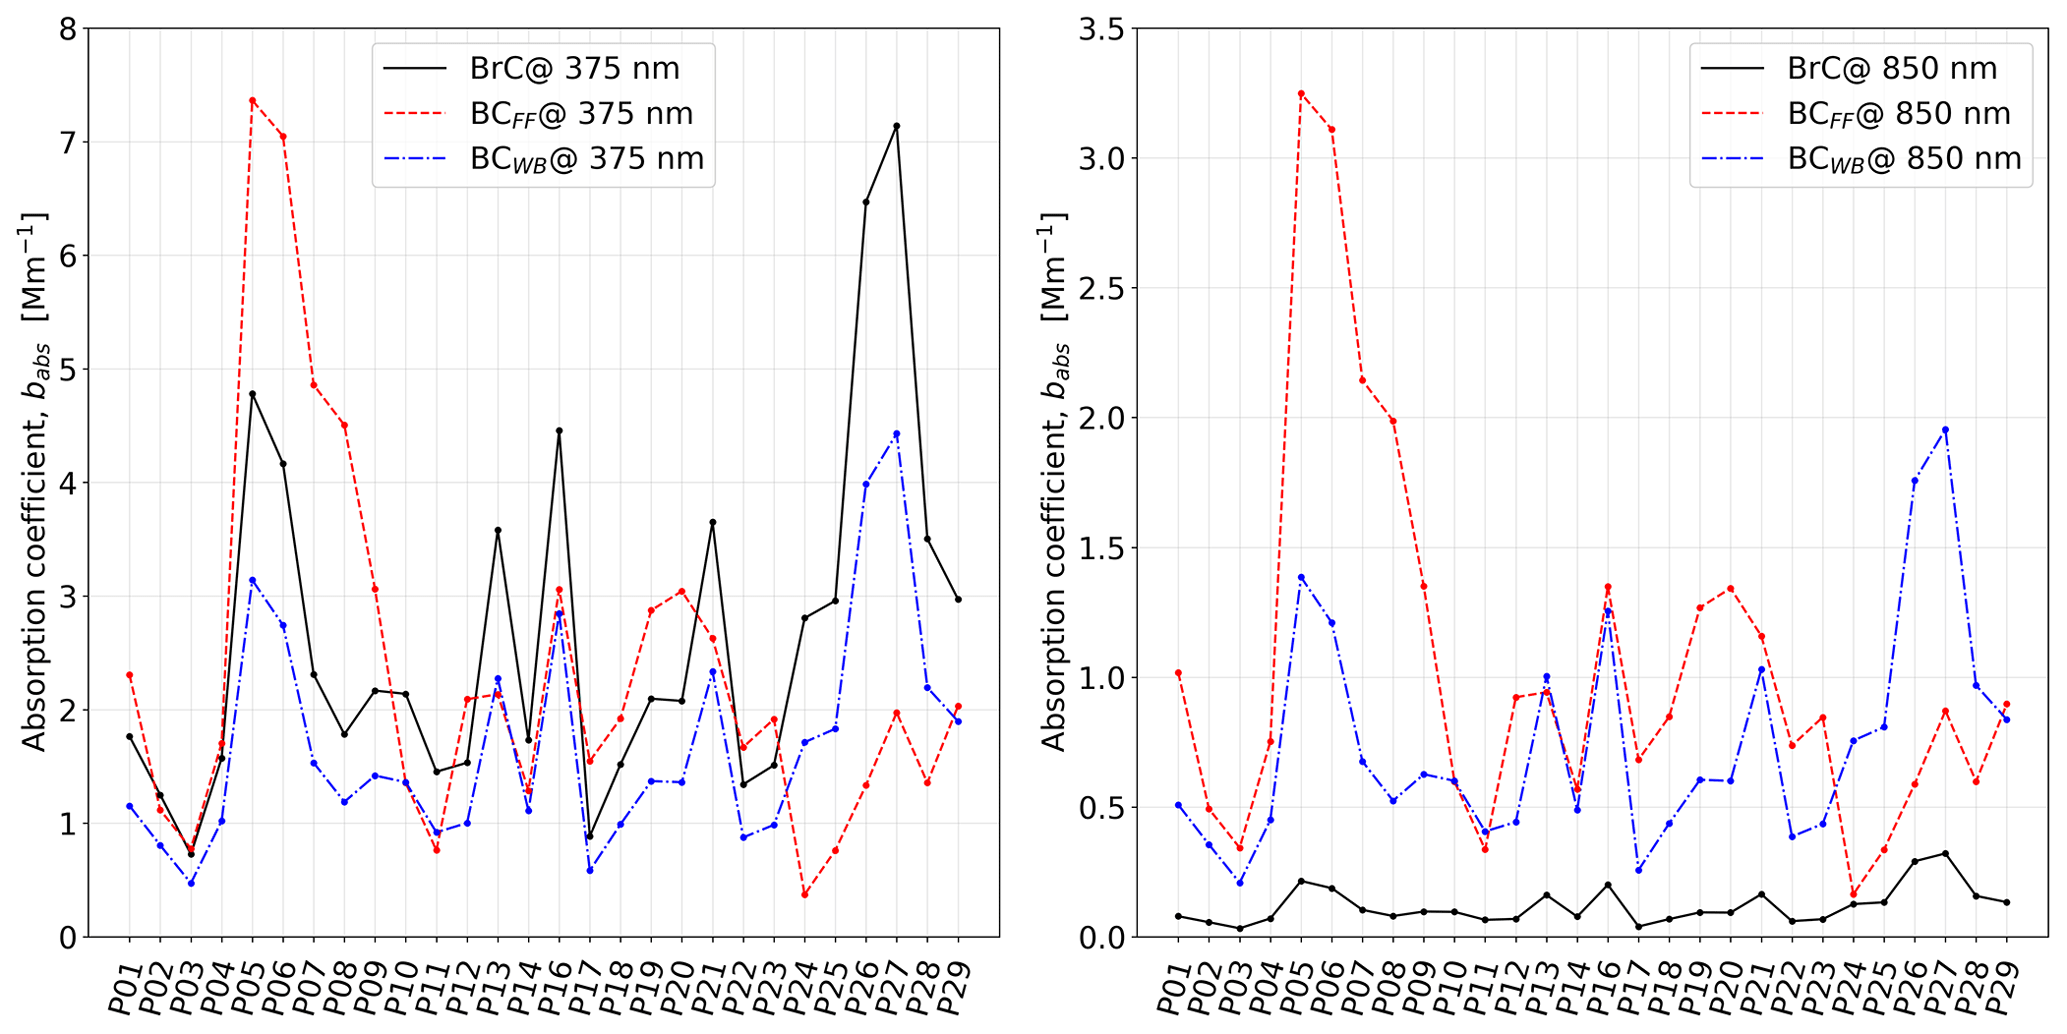
Figure 6Temporal variability in the apportioned absorption coefficients in Propata. Each sample covers a 48 h period, starting from 7 November 2014 for P01.
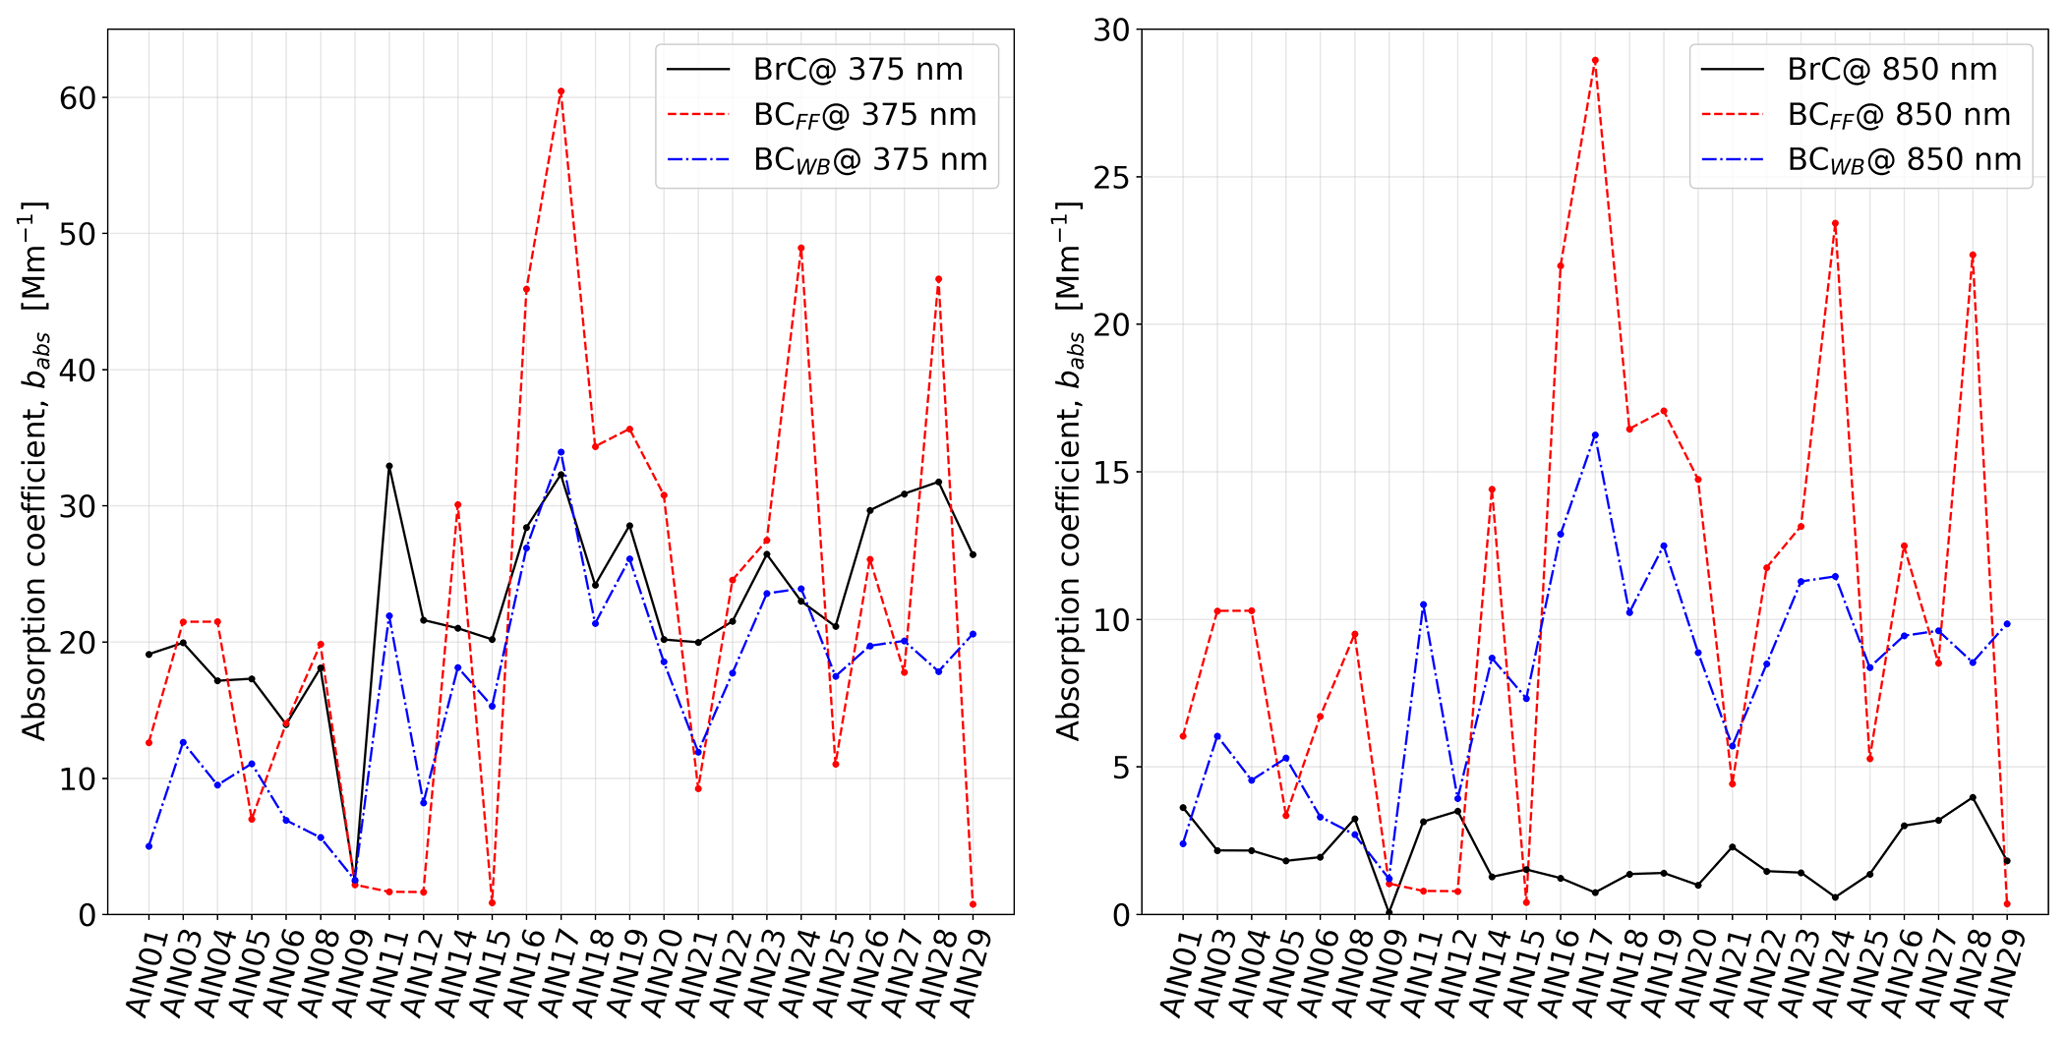
Figure 7Temporal variability in the apportioned absorption coefficients in Milan. Each sample covers a 12 h period, starting at 21:00 CET 21 November 2016 for AIN01.
4.5 Analysis step IV
Mass apportionment was performed for both datasets using the approach detailed in Sect. 2. The toolkit allows the user to choose automatically determining the coefficients k1 and k2 from the linear regressions (see Eq. 4) or setting them manually. The latter approach is recommended when the dataset does not contain suitable candidate samples for the k1 regression analysis (i.e. when there are no samples whose EC content is predominant as evidenced by an α close to 1) and especially when the values for k1 and k2 can be estimated by complementary methods or by previous analyses of aerosol samples taken at the same location during a comparable period of the year.
For this example application, the second approach was followed. For Milan, the regression coefficients were set to g m−2, g m−2, while for Propata they were set to g m−2, g m−2, as described in Bernardoni et al. (2017).
The average EC EC ratio turned out to be 49 ± 20 % and 58 ± 15 %, and complementary EC EC resulted in 51 ± 20 % and 42 ± 15 % respectively in Milan and Propata. For the organic aerosol, the average OC OC was found to be 25 ± 14 % and 18 ± 9 %, while OC OC was 58 ± 17 % and 61 ± 14 %, in Milan and Propata respectively. The non-combustion component of the organic aerosol, OCNC, contributed 17 ± 15 % and 21 ± 15 % of the total OC measured in Milan and Propata. For all reported results, the uncertainty is understood as the standard deviation of the mass-apportioned values of EC and OC in the distribution for all samples. These results are in full agreement with those reported in Bernardoni et al. (2017).
In the aerosol community concerned with aerosol source apportionment, the possibility of apportioning carbonaceous sources by exploiting optical properties has occupied much space in recent years. The main reason for this growing interest is the diffusion of optical instruments that are relatively easy-to-use and offer high time resolution measurements. The main weakness of this apportionment methodology, based on optical measurements, is the practically obligatory choice of the critical parameters necessary as input, in particular αWB and αFF, whose values vary considerably in the literature (Sandradewi et al., 2008; Favez et al., 2010; Herich et al., 2011: Harrison et al., 2013; Massabò et al., 2015; Zotter et al., 2017; Forello et al., 2019). In this work, we show that it is possible to perform optical source and component apportionment of carbonaceous aerosols without constraining any physical parameters with a priori knowledge. Instead, the upgraded model toolkit presented here (MWAA_MT) allows for the determination of these parameters for any specific receptor site, provided that a measurement using an independent technique able to trace biomass burning emissions is available for comparison, also with different (lower) time resolution. This offers the advantage of an apportionment routine based entirely on experimental data, where computational parameters are automatically adjusted to best match the results with the data themselves. With this upgrade, it is possible to obtain α absorption exponents that are related to the specific site and season, allowing for better characterization of future measurements at the same site or at sites with similarities (e.g. rural sites with similar geographical characteristics such as type of wood burnt). In addition, the α parameters obtained from the analysis of robust, low time resolution samples can be used to inform and fine-tune the apportionment procedure on high time resolution data.
We have also shown how sensitive the model is to the choice of some of these parameters: in our example, in particular, the choice of αFF has the greatest impact on the reliability of the subsequent apportionment. It should be emphasized that this could be a feature of these specific data/sites: other datasets could be more sensitive to the variation in another one of the free parameters. It is therefore recommended that, whenever possible, such an analysis be performed to determine the best value for any of these exponents.
We have applied this upgraded methodology to the apportionment of the optical absorption coefficient in two different sites in northern Italy. The “pre-processing step” has shown that, for the example dataset we considered, the values for αBC, αFF, and αWB at a rural site are consistent with the literature, while in the case of an urban site, values of αBC=0.9, αFF=0.9, and αWB=1.7 seem to be a more appropriate choice. We would like to underline that the Milan case study is to be considered a stress test of our algorithm: the context is very complex due to the presence of a large number of sources, such as traffic, biomass combustion, and industry, in a city with over 1.3 million inhabitants. The city is also subject to major regional transport events, high PM concentrations (average PM10 value during the campaign of 68.3±25.6 µg m−3), and air stagnation conditions resulting in a high level of aerosol reprocessing. On the other hand, when it comes to the Propata dataset, the correlation with levoglucosan is much higher (R2=0.96), indicating that within the experimental uncertainties, the assumption that BrC is only produced by WB is satisfied.
Finally, we have described the operation of the new software toolkit, MWAA_MT, that we have used to perform this analysis and which has been made available to the scientific community.
The source code is available at https://doi.org/10.5281/zenodo.10462245 (tisolabella and Bigi, 2024). Any updates will also be published on Zenodo.
Data will be made available on request.
The supplement related to this article is available online at: https://doi.org/10.5194/amt-17-1363-2024-supplement.
TI and DM designed the extension to the original mathematical model. TI developed and tested the Python model code. AB translated the software to R. TI prepared the article with contributions from all co-authors.
The contact author has declared that none of the authors has any competing interests.
Publisher's note: Copernicus Publications remains neutral with regard to jurisdictional claims made in the text, published maps, institutional affiliations, or any other geographical representation in this paper. While Copernicus Publications makes every effort to include appropriate place names, the final responsibility lies with the authors.
We are indebted to the personnel of the mechanical workshop of the INFN division of Genoa for the continuous support in the development of scientific instrumentation.
This work was supported by the Italian Ministry of the University (MUR) through the PRIN2017 grant for the RHAPS project (grant no. 2017MSN7M8); the National Institute for Nuclear Physics (INFN) through the ISPIRA project; the PNRR MUR Project ”Multi Risk sciEnce for resilienT commUnities undeR a changiNg climate (RETURN)” (grant no. PE00000005 CUP HUB B63D22000670006); the IR0000032-ITINERIS project (ITalian INtegrated Environmental Research Infrastructures System – grant no. CUP B53C22002150006) funded by the European Union (NextGenerationEU PNRR, Mission 4 “Education and Research”, Component 2 “From research to business”, 5 Investment 3.1, “Fund for the realization of an integrated system of research and innovation infrastructures”); and the “Ecosystem for sustainable transition in Emilia Romagna (ECOSISTER)” project, funded by the European Union NextGenerationEU programme, under the National Recovery and Resilience Plan (NRRP) Mission 4, Component 2, 10 Investment Line 1.5.
This paper was edited by Hartmut Herrmann and reviewed by two anonymous referees.
Alfaro, S. C., Lafon, S., Rajot, J. L., Formenti, P., Gaudichet, A., and Maillé, M.: Iron oxides and light absorption by pure desert dust: An experimental study, J. Geophys. Res., 109, D08208, https://doi.org/10.1029/2003JD004374, 2004.
Andreae, M. O. and Gelencsér, A.: Black carbon or brown carbon? The nature of light-absorbing carbonaceous aerosols, Atmos. Chem. Phys., 6, 3131–3148, https://doi.org/10.5194/acp-6-3131-2006, 2006.
Bernardoni, V., Pileci, R. E., Caponi, L., and Massabò, D.: The Multi-Wavelength Absorption Analyzer (MWAA) Model as a Tool for Source and Component Apportionment Based on Aerosol Absorption Properties: Application to Samples Collected in Different Environments, Atmosphere, 8, 218, https://doi.org/10.3390/atmos8110218, 2017.
Bond, T. C. and Bergstrom, R. W.: Light absorption by carbonaceous particles: an investigative review, Aerosol Sci. Tech., 40, 27–67, 2006.
Bond, T. C., Doherty, S. J., Fahey, D. W., Forster, P. M., Berntsen, T., Deangelo, B. J., Flanner, M. G., Ghan, S., Kärcher, B., Koch, D., Kinne, S., Kondo, Y., Quinn, P. K., Sarofim, M. C., Schultz, M. G., Schulz, M., Venkataraman, C., Zhang, H., Zhang, S., Bellouin, N., Guttikunda, S. K., Hopke, P. K., Jacobson, M. Z., Kaiser, J. W., Klimont, Z., Lohmann, U., Schwarz, J. P., Shindell, D., Storelvmo, T., Warren, S. G., and Zender, C. S.: Bounding the role of black carbon in the climate system: A scientific assessment, J. Geophys. Res.-Atmos., 118, 5380–5552, https://doi.org/10.1002/jgrd.50171, 2013.
Caponi, L., Formenti, P., Massabó, D., Di Biagio, C., Cazaunau, M., Pangui, E., Chevaillier, S., Landrot, G., Andreae, M. O., Kandler, K., Piketh, S., Saeed, T., Seibert, D., Williams, E., Balkanski, Y., Prati, P., and Doussin, J.-F.: Spectral- and size-resolved mass absorption efficiency of mineral dust aerosols in the shortwave spectrum: a simulation chamber study, Atmos. Chem. Phys., 17, 7175–7191, https://doi.org/10.5194/acp-17-7175-2017, 2017.
Di Biagio, C., Formenti, P., Balkanski, Y., Caponi, L., Cazaunau, M., Pangui, E., Journet, E., Nowak, S., Andreae, M. O., Kandler, K., Saeed, T., Piketh, S., Seibert, D., Williams, E., and Doussin, J.-F.: Complex refractive indices and single-scattering albedo of global dust aerosols in the shortwave spectrum and relationship to size and iron content, Atmos. Chem. Phys., 19, 15503–15531, https://doi.org/10.5194/acp-19-15503-2019, 2019.
Favez, O., El Haddad, I., Piot, C., Boréave, A., Abidi, E., Marchand, N., Jaffrezo, J.-L., Besombes, J.-L., Personnaz, M.-B., Sciare, J., Wortham, H., George, C., and D'Anna, B.: Inter-comparison of source apportionment models for the estimation of wood burning aerosols during wintertime in an Alpine city (Grenoble, France), Atmos. Chem. Phys., 10, 5295–5314, https://doi.org/10.5194/acp-10-5295-2010, 2010.
Forello, A. C., Bernardoni, V., Calzolai, G., Lucarelli, F., Massabò, D., Nava, S., Pileci, R. E., Prati, P., Valentini, S., Valli, G., and Vecchi, R.: Exploiting multi-wavelength aerosol absorption coefficients in a multi-time resolution source apportionment study to retrieve source-dependent absorption parameters, Atmos. Chem. Phys., 19, 11235–11252, https://doi.org/10.5194/acp-19-11235-2019, 2019.
Forrister, H., Liu, J., Scheuer, E., Dibb, J., Ziemba, L., Thornhill, K. L., Anderson, B., Diskin, G., Perring, A. E., Schwarz, J. P., Campuzano-Jost, P., Day, D. A., Palm, B. B., Jimenez, J. L., Nenes, A., and Weber, R. J.: Evolution of brown carbon in wildfire plumes, Geophys. Res. Lett., 42, 4623–4630, https://doi.org/10.1002/2015GL063897, 2015.
Harrison, R. M., Beddows, D. C. S., Jones, A. M., Calvo, A., Alves, C., and Pio, C.: An evaluation of some issues regarding the use of aethalometers to measure woodsmoke concentrations, Atmos. Environ., 80, 540–548, 2013.
Helin, A., Niemi, J. V., Virkkula, A., Pirjola, L., Teinilä, K., Backman, J., Aurela, M., Saarikoski, S., Rönkkö, T., Asmi, E., and Timonen, H.: Characteristics and source apportionment of black carbon in the Helsinki metropolitan area, Finland, Atmos. Environ., 190, 87–98, https://doi.org/10.1016/j.atmosenv.2018.07.022, 2018.
Herich, H., Hueglin, C., and Buchmann, B.: A 2.5 year's source apportionment study of black carbon from wood burning and fossil fuel combustion at urban and rural sites in Switzerland, Atmos. Meas. Tech., 4, 1409–1420, https://doi.org/10.5194/amt-4-1409-2011, 2011.
Hoffer, A., Gelencsér, A., Guyon, P., Kiss, G., Schmid, O., Frank, G. P., Artaxo, P., and Andreae, M. O.: Optical properties of humic-like substances (HULIS) in biomass-burning aerosols, Atmos. Chem. Phys., 6, 3563–3570, https://doi.org/10.5194/acp-6-3563-2006, 2006.
Ivančič, M., Gregorič, A., Lavrič, G., Alföldy, B., Ježek, I., Hasheminassab, S., Pakbin, P., Ahangar, F., Sowlat, M., Boddeker, S., and Rigler, M.: Two-Year-Long High-Time-Resolution Apportionment of Primary and Secondary Carbonaceous Aerosols in the Los Angeles Basin Using an Advanced Total Carbon–Black Carbon (TC-BC(λ)) Method, Sci. Total Environ., 848, 157606, https://doi.org/10.1016/j.scitotenv.2022.157606, 2022.
Lack, D. A. and Langridge, J. M.: On the attribution of black and brown carbon light absorption using the Ångström exponent, Atmos. Chem. Phys., 13, 10535–10543, https://doi.org/10.5194/acp-13-10535-2013, 2013.
Laj, P., Bigi, A., Rose, C., Andrews, E., Lund Myhre, C., Collaud Coen, M., Lin, Y., Wiedensohler, A., Schulz, M., Ogren, J. A., Fiebig, M., Gliß, J., Mortier, A., Pandolfi, M., Petäja, T., Kim, S.-W., Aas, W., Putaud, J.-P., Mayol-Bracero, O., Keywood, M., Labrador, L., Aalto, P., Ahlberg, E., Alados Arboledas, L., Alastuey, A., Andrade, M., Artíñano, B., Ausmeel, S., Arsov, T., Asmi, E., Backman, J., Baltensperger, U., Bastian, S., Bath, O., Beukes, J. P., Brem, B. T., Bukowiecki, N., Conil, S., Couret, C., Day, D., Dayantolis, W., Degorska, A., Eleftheriadis, K., Fetfatzis, P., Favez, O., Flentje, H., Gini, M. I., Gregorič, A., Gysel-Beer, M., Hallar, A. G., Hand, J., Hoffer, A., Hueglin, C., Hooda, R. K., Hyvärinen, A., Kalapov, I., Kalivitis, N., Kasper-Giebl, A., Kim, J. E., Kouvarakis, G., Kranjc, I., Krejci, R., Kulmala, M., Labuschagne, C., Lee, H.-J., Lihavainen, H., Lin, N.-H., Löschau, G., Luoma, K., Marinoni, A., Martins Dos Santos, S., Meinhardt, F., Merkel, M., Metzger, J.-M., Mihalopoulos, N., Nguyen, N. A., Ondracek, J., Pérez, N., Perrone, M. R., Petit, J.-E., Picard, D., Pichon, J.-M., Pont, V., Prats, N., Prenni, A., Reisen, F., Romano, S., Sellegri, K., Sharma, S., Schauer, G., Sheridan, P., Sherman, J. P., Schütze, M., Schwerin, A., Sohmer, R., Sorribas, M., Steinbacher, M., Sun, J., Titos, G., Toczko, B., Tuch, T., Tulet, P., Tunved, P., Vakkari, V., Velarde, F., Velasquez, P., Villani, P., Vratolis, S., Wang, S.-H., Weinhold, K., Weller, R., Yela, M., Yus-Diez, J., Zdimal, V., Zieger, P., and Zikova, N.: A global analysis of climate-relevant aerosol properties retrieved from the network of Global Atmosphere Watch (GAW) near-surface observatories, Atmos. Meas. Tech., 13, 4353–4392, https://doi.org/10.5194/amt-13-4353-2020, 2020.
Liu, S., Aiken, A. C., Gorkowski, K., Dubey, M. K., Cappa, C. D., Williams, L. R., Herndon, S. C., Massoli, P., Fortner, E. C., Chhabra, P. S., Brooks, W. A., Onasch, T. B., Jayne, J. T., Worsnop, D. R., China, S., Sharma, N., Mazzoleni, C., Xu, L., Ng, N. L., Liu, D., Allan, J. D., Lee, J. D., Fleming, Z. L., Mohr, C., Zotter, P., Szidat, S., and Prévôt, A. S. H.: Enhanced light absorption by mixed source black and brown carbon particles in UK winter, Nat. Commun., 6, 8435, https://doi.org/10.1038/ncomms9435, 2015.
Martinsson, J., Abdul Azeem, H., Sporre, M. K., Bergström, R., Ahlberg, E., Öström, E., Kristensson, A., Swietlicki, E., and Eriksson Stenström, K.: Carbonaceous aerosol source apportionment using the Aethalometer model – evaluation by radiocarbon and levoglucosan analysis at a rural background site in southern Sweden, Atmos. Chem. Phys., 17, 4265–4281, https://doi.org/10.5194/acp-17-4265-2017, 2017.
Massabò, D., Caponi, L., Bernardoni, V., Bove, M. C., Brotto, P., Calzolai, G., Cassola, F., Chiari, M., Fedi, M., Fermo, P., Giannoni, M., Lucarelli, F., Nava, S., Piazzalunga, A., Valli, G., Vecchi, R., and Prati, P.: Multi-wavelength optical determination of black and brown carbon in atmospheric aerosols, Atmos. Environ., 108, 1–12, https://doi.org/10.1016/j.atmosenv.2015.02.058, 2015.
Massabò, D., Altomari, A., Vernocchi, V., and Prati, P.: Two-wavelength thermal–optical determination of light-absorbing carbon in atmospheric aerosols, Atmos. Meas. Tech., 12, 3173–3182, https://doi.org/10.5194/amt-12-3173-2019, 2019.
Minderytė, A., Pauraite, J., Dudoitis, V., Plauškaitė, K., Kilikevičius, A., Matijošius, J., Rimkus, A., Kilikevičienė, K., Vainorius, D., and Byčenkienė, S.: Carbonaceous aerosol source apportionment and assessment of transport-related pollution, Atmos. Environ., 279, 119043, https://doi.org/10.1016/j.atmosenv.2022.119043, ISSN 1352-2310, 2022.
Moosmüller, H., Chakrabarty, R. K., Ehlers, K. M., and Arnott, W. P.: Absorption Ångström coefficient, brown carbon, and aerosols: basic concepts, bulk matter, and spherical particles, Atmos. Chem. Phys., 11, 1217–1225, https://doi.org/10.5194/acp-11-1217-2011, 2011.
Piazzalunga, A., Fermo, P., Bernardoni, V., Vecchi, R., Valli, G., and De Gregorio, M. A.: A simplified method for levoglucosan quantification in wintertime atmospheric particulate matter by high performance anion-exchange chromatography coupled with pulsed amperometric detection, Int. J. Environ. An. Ch., 90, 934–947, https://doi.org/10.1080/03067310903023619, 2010.
Pöschl, U.: Aerosol particle analysis: challenges and progress, Anal. Bioanal. Chem., 375, 3032, https://doi.org/10.1007/s00216-002-1611-5, 2003.
Sandradewi, J., Prévôt, A. S., Szidat, S., Perron, N., Alfarra, M. R., Lanz, V. A., Weingartner, E., and Baltensperger, U.: Using aerosol light absorption measurements for the quantitative determination of wood burning and traffic emission contributions to particulate matter, Environ. Sci Technol., 42, 3316–3323, https://doi.org/10.1021/es702253m, 2008.
Schepanski, K.: Transport of Mineral Dust and Its Impact on Climate, Geosciences, 8, 151, https://doi.org/10.3390/geosciences8050151, 2018.
Simoneit, B. R. T., Schauer, J. J., Nolte, C. G., Oros, D. R., Elias, V. O., Fraser, M. P., Rogge, W. F., and Cass, G. R.: Levoglucosan, a tracer for cellulose in biomass burning and atmospheric particles, Atmos. Environ., 33, 173–182, https://doi.org/10.1016/S1352-2310(98)00145-9, 1999.
Seinfeld, J. and Pandis, S.: Atmospheric Chemistry and Physics: from air pollution to climate change, Wiley & Sons, ISBN 978-1-118-94740-1, 2016.
Tang, M., Alexander, J. M., Kwon, D., Estillore, A. D., Laskina, O., Young, M. A., Kleiber, P. D., and Grassian, V. H.: Optical and Physicochemical Properties of Brown Carbon Aerosol: Light Scattering, FTIR Extinction Spectroscopy, and Hygroscopic Growth, J. Phys. Chem. A, 120, 4155–4166, https://doi.org/10.1021/acs.jpca.6b03425, 2016.
tisolabella and Bigi, A.: tisolabella/mwaamt: mwaamt v1.0.0, Version v1.0.0, Zenodo [code], https://doi.org/10.5281/zenodo.10462245, 2024.
Titos, G., del Águila, A., Cazorla, A., Lyamani, H., Casquero Vera, J. A., Colombi, C., Cuccia, E., Gianelle, V., Močnik, G., Alastuey, A., Olmo, F. J., and Alados Arboledas, L.: Spatial and temporal variability of carbonaceous aerosols: Assessing the impact of biomass burning in the urban environment, Sci. Total Environ., 578, 613–625, https://doi.org/10.1016/j.scitotenv.2016.11.007, 2017.
Utry, N., Ajtai, T., Filep, Á, Pintér, M., Török, Zs, Bozóki, Z., and Szabó, G.: Correlations between absorption Angström exponent (AAE) of wintertime ambient urban aerosol and its physical and chemical properties, Atmos. Environ., 91, 52–59, https://doi.org/10.1016/j.atmosenv.2014.03.047, 2014.
Vernocchi, V., Brunoldi, M., Danelli, S. G., Parodi, F., Prati, P., and Massabò, D.: Characterization of soot produced by the mini inverted soot generator with an atmospheric simulation chamber, Atmos. Meas. Tech., 15, 2159–2175, https://doi.org/10.5194/amt-15-2159-2022, 2022.
Zotter, P., Herich, H., Gysel, M., El-Haddad, I., Zhang, Y., Močnik, G., Hüglin, C., Baltensperger, U., Szidat, S., and Prévôt, A. S. H.: Evaluation of the absorption Ångström exponents for traffic and wood burning in the Aethalometer-based source apportionment using radiocarbon measurements of ambient aerosol, Atmos. Chem. Phys., 17, 4229–4249, https://doi.org/10.5194/acp-17-4229-2017, 2017.
- Abstract
- Introduction
- Model description
- Software features
- Example application: black and brown carbon optical apportionment of MWAA data
- Conclusions
- Code availability
- Data availability
- Author contributions
- Competing interests
- Disclaimer
- Acknowledgements
- Financial support
- Review statement
- References
- Supplement