the Creative Commons Attribution 4.0 License.
the Creative Commons Attribution 4.0 License.
 | 12 Mar 2024
Characterization of the Vaporization Inlet for Aerosols (VIA) for online measurements of particulate highly oxygenated organic molecules (HOMs)
Valter Mickwitz
Yuanyuan Luo
Ella Häkkinen
Frans Graeffe
Jiangyi Zhang
Hilkka Timonen
Manjula Canagaratna
Jordan E. Krechmer
Markku Kulmala
Juha Kangasluoma
Douglas Worsnop
Particulate matter has major climate and health impacts, and it is therefore of utmost importance to be able to measure the composition of these particles to gain insights into their sources and characteristics. Many methods, both offline and online, have been employed over the years to achieve this goal. One of the most recent developments is the Vaporization Inlet for Aerosols (VIA) coupled to a nitrate Chemical Ionization Mass Spectrometer (NO3-CIMS), but a thorough understanding of the VIA–NO3-CIMS system remains incomplete. In this work, we ran a series of tests to assess the impacts from different systems and sampling parameters on the detection efficiency of highly oxygenated organic molecules (HOMs) in the VIA–NO3-CIMS system. Firstly, we found that the current VIA system (which includes an activated carbon denuder and a vaporization tube) efficiently transmits particles (> 90 % for particles larger than 50 nm) while also removing gaseous compounds (> 97% for tested volatile organic compounds – VOCs). One of the main differences between the VIA and traditional thermal desorption (TD) techniques is the very short residence time in the heating region, on the order of 0.1 s. We found that this short residence time, and the corresponding short contact with heated surfaces, is likely one of the main reasons why relatively reactive or weakly bound peroxides, for example, were observable using the VIA. However, the VIA also requires much higher temperatures in order to fully evaporate the aerosol components. For example, the evaporation temperature of ammonium sulfate particles using the VIA was found to be about 100–150 °C higher than in typical TD systems. We also observed that the evaporation of particles with larger sizes occurred at slightly higher temperatures compared to smaller particles. Another major aspect that we investigated was the gas-phase wall losses of evaporated molecules. With a more optimized interface between the VIA and the NO3-CIMS, we were able to greatly decrease wall losses and thus improve the sensitivity compared to our earlier VIA work. This interface included a dedicated sheath flow unit to cool the heated sample and provide the NO3-CIMS with the needed high flow (10 L min−1). Our results indicate that most organic molecules observable by the NO3-CIMS can evaporate and be transported efficiently in the VIA system, but upon contact with the hot walls of the VIA, the molecules are instantaneously lost. This loss potentially leads to fragmentation products that are not observable by the NO3-CIMS. Thermograms, obtained by scanning the VIA temperature, were found to be very valuable for both quantification purposes and for estimating the volatility of the evaporating compounds. We developed a simple one-dimensional model to account for the evaporation of particles and the temperature-dependent wall losses of the evaporated molecules, and we thereby estimate the concentration of HOMs in secondary organic aerosol (SOA) particles. Overall, our results provide much-needed insights into the key processes underlying the VIA–NO3-CIMS method. Although there are still some limitations that could be addressed through hardware improvements, the VIA–NO3-CIMS system is a very promising and useful system for fast online measurements of HOMs in the particle phase.
- Article
(4432 KB) - Full-text XML
-
Supplement
(3432 KB) - BibTeX
- EndNote


Organic aerosol (OA) contributes a large portion (20 %–70 %) to atmospheric fine particles in the lower troposphere (Zhang et al., 2007), but it remains less characterized compared to other particulate components because of its vast number (> 104 organic species) of constituents (Goldstein and Galbally, 2007). OA can be directly emitted into the atmosphere through various sources (e.g., vehicles, biomass burning, and daily cooking) as primary OA (POA) and can be formed through condensation of the oxidation products of volatile organic compounds (VOCs) as secondary OA (SOA). Recently, highly oxygenated organic molecules (HOMs) were found to contribute considerably to SOA formation (Kulmala et al., 2014; Ehn et al., 2014; Jokinen et al., 2015). These OA particles greatly affect the global climate and human health (Kuniyal and Guleria, 2019; Déméautis et al., 2022) and thus need to be well characterized. The traditional techniques of OA measurement, based on filter collections followed by lab analysis, tend to be limited by low time resolution (hours to days), sample degradation/evaporation, and incomplete analyte extraction. Thus, the development and application of online techniques, with the ability to track the formation and evolution of organic species in real time (against rapid change in various sampling conditions), could improve our ability to understand and model OA over its entire atmospheric lifetime (Hallquist et al., 2009; Heald and Kroll, 2020).
Online mass spectrometers (MS) have been widely used to study the size-resolved chemical composition of aerosol particles and have greatly improved our understanding of OA over the past decades, such as the single-particle laser MS (Murphy, 2007) and the aerodyne aerosol MS (AMS) based on thermal evaporation (600 °C) and electron impact (EI) ionization for non-refractory submicron particles (Canagaratna et al., 2007). Furthermore, the linear superposition and reproducibility of mass spectra of individual components from EI are crucial for the source apportionment of different OA factors (Zhang et al., 2011). However, the significant fragmentation introduced by these hard ionization techniques makes the identification of parent molecules difficult, even in relatively well-controlled lab experiments. Soft ionization, especially chemical ionization (CI), is one of the solutions to achieve “near-molecular-level” measurements of gaseous organic species in trace concentrations (Huey, 2007; Zahardis et al., 2011). One advantage of soft ionization (i.e., less fragmentation) lies in the potential to identify molecular markers to track emission sources and oxidation pathways of different organic species in the gas phase. The detection of OA usually involves the vaporization of particles with subsequent ionization of the resulting gas-phase compounds and analysis by a mass spectrometer. A temperature-programmed thermal desorption analysis could be used to obtain the volatility information of different OA components (Stark et al., 2017; Thornton et al., 2020). In addition, gas-to-particle partitioning could be investigated by deploying simultaneous gas- and particle-phase measurements, but the results need to be carefully interpreted (Stark et al., 2017; Gkatzelis et al., 2018). For example, thermal decomposition may bias the real distribution of particle-phase products, and there is the possibility that the same molecular formulas identified in both the gas and particle phases are in fact isomers (Isaacman-Vanwertz et al., 2017).
Currently widely used online molecular-level techniques are summarized in Table S1 in the Supplement and briefly described below. The thermal desorption chemical ionization mass spectrometer (TDCIMS), using a charged metal filament to effectively collect sub-20 nm particles, was designed to obtain the chemical composition of freshly nucleated ultrafine particles (Voisin et al., 2003; Smith et al., 2004; Li et al., 2021). Another aerosol CIMS technique, which thermally vaporizes particles in a heated tube without size-selecting, was deployed to detect organic molecules with different functionalities using various positive and negative reagent ions (e.g., NO+, H+(H2O)2, O, and F−) (Hearn and Smith, 2004, 2006) but with a relatively higher detection limit compared to other techniques. The filter inlet for gases and aerosols (FIGAERO)-CIMS, using a Teflon (PTFE) filter, is capable of achieving a unit collection efficiency of particles and simultaneous gas- and particle-phase measurements down to parts per trillion levels (Lopez-Hilfiker et al., 2014). However, potential perturbation owing to the absorption of semi-volatile and low-volatility vapors onto the Teflon surface might be an issue (Matsunaga and Ziemann, 2010; Krechmer et al., 2016), although it can be minimized to large extents by using a pre-stage filter for blank measurements (Lopez-Hilfiker et al., 2014; Thornton et al., 2020). Without pre-collection, a chemical analysis of aerosol online (CHARON) inlet (Eichler et al., 2015) coupled with a proton transfer reaction (PTR) MS (Yuan et al., 2017) was used to detect VOCs and oxygenated (O)VOCs in the particle phase. The separation of particles from the gas phase is achieved by using a charcoal denuder, and this system can resolve 20 %–30 % of the SOA mass (based on comparison to the AMS measurements) almost without thermal decomposition (Gkatzelis et al., 2018). However, the protonation-induced ionic fragmentation of oxygenated organic molecules, in particular peroxides, might be enhanced by high-energy collisions in the strong electric field of the ion drift tube. This was confirmed by both experimental studies and theoretical computations (Müller et al., 2017; Li et al., 2022; Peng et al., 2023), limiting its detection of the most oxidized species. Recently, an extractive electrospray ionization (EESI) inlet was designed to extract OA samples into charged droplets, thereby preventing thermal decomposition and ion-induced fragmentation (Lopez-Hilfiker et al., 2019). This technique was subsequently upgraded to a dual-phase version, which is now capable of measuring both gas- and particle-phase species but with different response factors (Lee et al., 2022).
The most recent addition to the suite of instrumentation used to measure aerosol components is the Vaporization Inlet for Aerosols (VIA) coupled with a nitrate-ion-based (NO3-based) CIMS (NO3-CIMS) (Häkkinen et al., 2023). The NO3-CIMS is routinely used to detect HOMs (i.e., the most oxidized organic species from the gas phase), which are known to be important contributors to OA in the atmosphere. Coupled with the new VIA system, the NO3-CIMS has been shown to also be able to detect HOMs from particles. The paper by Häkkinen et al. (2023), as a proof-of-concept work, presents the fact that without sample collection, continuous thermal desorption and online detection of particle-phase HOMs are feasible after removing the gaseous compounds. By coupling the VIA with a NO3-CIMS, the detection limits were reported below 1 ng m−3 for a single HOM compound (Häkkinen et al., 2023), and the relationship between the gas- and particle-phase HOMs from α-pinene ozonolysis was systematically studied in a separate work (Zhao et al., 2023). These studies suggested potential particle-phase reactions to explain the discrepancies between the two phases. Unfortunately, the effects of the thermal desorption process on HOM detection (e.g., temperature-dependent sensitivity of different HOM species) and vapor losses within the VIA were unclear back then, limiting a quantitative investigation of the particle-phase HOMs in SOA. Therefore, a thorough characterization of the entire system is needed to better understand the mass spectra it provides.
In this work, we performed an extensive characterization of the VIA–NO3-CIMS system to quantify the concentrations of particle-phase HOMs, formed in the α-pinene (C10H16) ozonolysis system. In order to minimize the vapor losses of those (extremely) low-volatility HOM species after the VIA, a dedicated sheath flow unit (as shown in Fig. 1, part 3) was designed as the main hardware update from the initial version of the VIA (Häkkinen et al., 2023). Then, we evaluated the performance of the different components of the VIA setup and the interface to the NO3-CIMS and further characterized how the signals changed as a function of variations in different parameters of the VIA and the sample, including evaporation temperature, flow rates, and particle sizes. In addition, by scanning the VIA temperature, we investigated the fact that volatility information can be inferred from the measured thermograms. The homogeneous series of polyethylene glycol (PEG) was used to evaluate the volatility measurements. Finally, we constructed a simple one-dimensional model to estimate the concentration of the sampled particles by accounting for vapor losses within the VIA vaporization tube.
2.1 Vaporization Inlet for Aerosols (VIA)
The VIA (Vaporization Inlet for Aerosols, Aerodyne Research, Inc.) was designed to provide online measurements of compounds in the particle phase and to be coupled with different types of gas monitors for analysis, e.g., chemical ionization mass spectrometers. Its current commercial version contains the first two parts in Fig. 1, i.e., an activated carbon gas denuder to remove the gas compounds and a vaporization tube for particle evaporation, and the coupling of this VIA with a NO3-CIMS has been described by Häkkinen et al. (2023). The sheath flow unit was designed in this work to minimize the wall loss of the evaporated hot vapors.
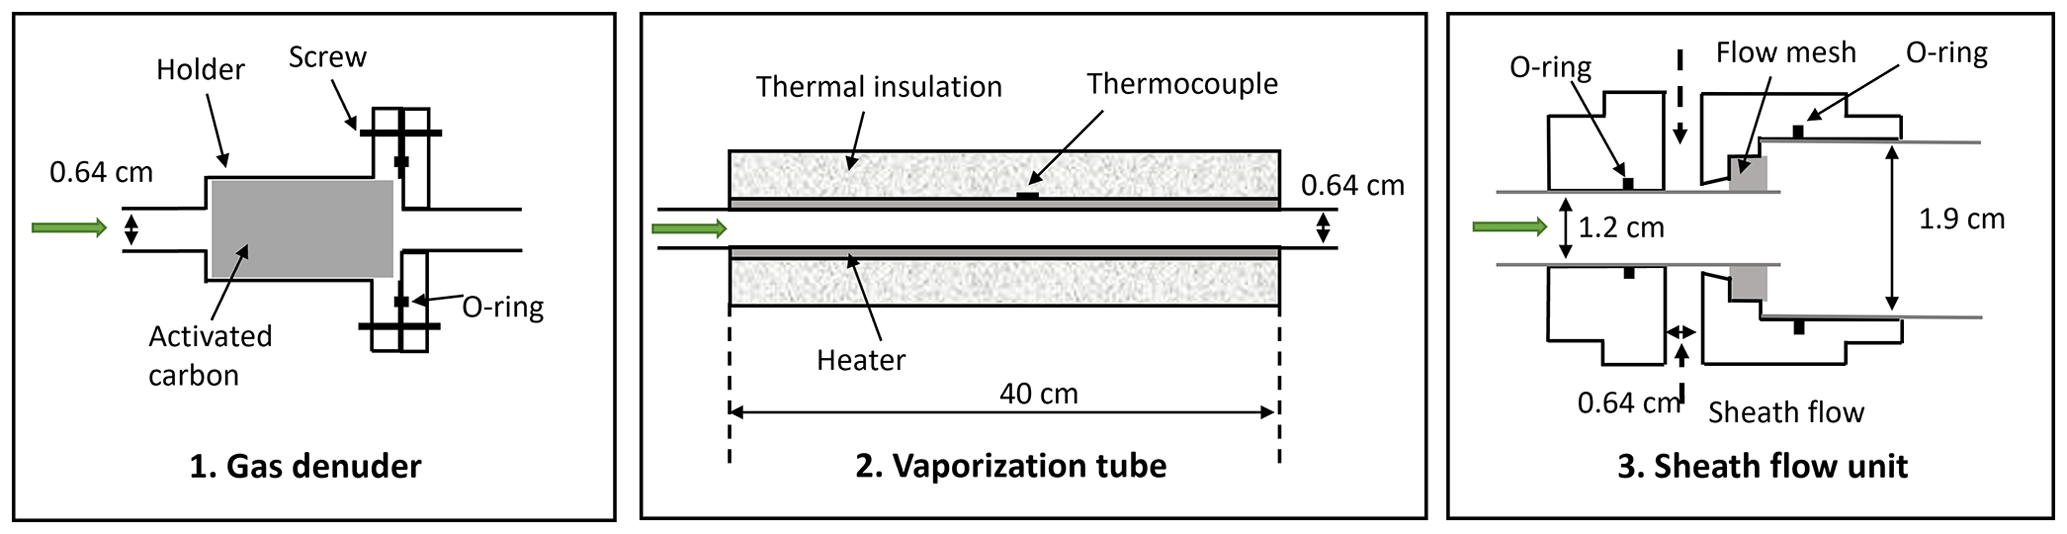
Figure 1A schematic diagram of the new VIA inlet including (1) a gas-phase denuder (length: ∼ 10 cm), (2) a vaporization tube (length: ∼ 40 cm), and (3) a sheath flow unit (length: ∼ 5 cm). The green arrows indicate the direction of the sampling flow, and the figures are not drawn to scale with their physical dimensions.
2.1.1 Gas-phase denuder
A honeycomb-channeled activated carbon gas denuder (Fig. 1) is deployed to remove gas compounds while transmitting particles. The cylindrical gas denuder (length: 4 cm, outer diameter: 2 cm) is mounted in a plated aluminum holder, the two halves of which are sealed with a Viton O-ring and have external 1/4 in. tube ends (i.e., outer diameter: 0.64 cm). The activated carbon denuder can be regenerated by flushing through clean air of ∼ 100 °C for at least 4 h.
The gas-phase removal efficiency was evaluated with a certified gas-phase mixture of 13 volatile organic compounds (VOCs) diluted into nitrogen gas in a cylinder (Apel-Riemer Environmental Inc., USA) containing acetaldehyde, acetone, isoprene, methyl vinyl ketone (MVK), methyl ethyl ketone (MEK), benzene, toluene, hexanal, m-xylene, p-xylene, α-pinene, 1,3,4-trimethylbenzene, and naphthalene (detailed information in Table S2 in the Supplement). The particle transmission efficiency of the gas denuder was evaluated by using monodispersed ammonium sulfate (AS, Sigma-Aldrich) particles (20–700 nm) generated from an atomizer (Aerosol Generator ATM 220, TOPAS, Germany). The results of the above tests will be discussed in Sect. 3.1.1.
2.1.2 Vaporization tube
A vaporization tube (length: 40 cm, outer diameter: 0.64 cm), made of Sulfinert-coated stainless steel (i.e., bonding an inert silica layer into the surface) and covered by a 24 V resistive heating element and glass-wool insulation, is used to initiate the evaporation of particles (Fig. 1). A thermocouple attached to the surface of this vaporization tube was used to monitor the temperature, and the recorded temperature was used for thermogram analysis. The heating temperature can be manually set to a fixed value (25–350 °C) or connected to a Vocus instrument (Tofwerk AG) or an Eyeon box (Aerodyne Research, Inc.) to be programmed either in the ramping mode (i.e., continuously heating up within minutes to hours) or in the step mode (i.e., jumping among several temperature stages). The Eyeon software uses a proportional-integral-derivative controller based on the monitored temperature to adjust the voltage output applied to the heating element to closely follow the setting values. In addition, volatility information could be estimated based on the ramping mode dataset (i.e., thermograms) and will be discussed in Sect. 3.2.
The gas and particle transmission efficiency of the vaporization tube at different temperatures (25, 100, 200, and 300 °C) was evaluated by using the same VOC cylinder described in Sect. 2.1.1 and monodispersed sodium chloride (NaCl, Sigma-Aldrich, 20–700 nm) particles generated from an atomizer, respectively. The results will be discussed in Sect. 3.1.2.
2.1.3 Sheath flow unit
A sheath flow unit (Fig. 1) was designed in this work to cool down the sampling flow and minimize the wall loss of the evaporated vapors after the vaporization tube. Meanwhile, the sheath flow is also necessary to compensate for instrument configurations that need a large inlet flow (e.g., atmospheric pressure source such as an Eisele-type NO3-CIMS; Eisele and Tanner, 1993). Previously, a cross-fitting unit was used for the connection, and large vapor losses were inferred from the concentration comparisons between the measured HOM vapor and evaporated particles (Häkkinen et al., 2023; Zhao et al., 2023). In this newly designed piece, zero air or pure N2 can be used as a sheath flow, which merges with the central sampling flow after a dense stainless-steel mesh (to keep the sheath flow as laminar as possible). Nevertheless, the tubing length before and after the sheath flow unit and the ratio of flow rates between the sampling and sheath line through this unit were found to be two critical factors that affect the final sensitivity of this entire system. The results will be discussed in Sect. 3.1.3. Note that the current version of this sheath flow unit, with a 3/4 in. (i.e., outer diameter: 1.9 cm) output, was designed for the Eisele-type nitrate CI inlet (Eisele and Tanner, 1993).
2.2 Other instrumentation
In this section, the instruments used for the characterization of the VIA are described in detail. A NO3-CIMS (Tofwerk AG/Aerodyne Research, Inc.) was coupled with the VIA to detect particle-phase HOMs with high selectivity and sensitivity (Jokinen et al., 2012; Ehn et al., 2014). The sampling flow is 10 L min−1 along with 20 L min−1 of sheath flow to minimize the wall loss of HOMs within the CI inlet. A soft X-ray source was used to ionize HNO3 to nitrate ions, which were directed from the sheath flow into the sampling flow by an electric field. The NO3-CIMS was equipped with a long time-of-flight mass spectrometer, providing a mass resolution of ∼ 8500 above 125 Th. The calibration was conducted using sulfuric acid (SA) formed by the oxidation of SO2 by OH (Kurten et al., 2012), and a calibration factor of 4×109 cm−3 (±50 %) was obtained to convert the raw signals of HOMs (normalized by the sum of reagent ions) to concentrations.
A proton transfer reaction time-of-flight mass spectrometer (PTR-TOF 8000, Ionicon Analytik GmbH) along with the calibration cylinder of 13 VOC standards (described in Sect. 2.1.1) was used to evaluate the removal efficiency of the gas-phase denuder and the transmission efficiency of the vaporization tube. A detailed description of the PTR-TOF was given by Jordan et al. (2009). The inlet flow is 1 L min−1 with 0.1 L min−1 being subsampled into the ion drift tube, which was operated at a pressure of ∼ 2.6 mbar, a temperature of 60 °C, and a voltage of 600 V (with reduced electrical field strength parameter E/N of 115 Td). Based on these settings, the primary ion isotope HO+ (at 21 Th) was 5800 counts per second (cps) and the mass resolution at 137 Th (C10H was ∼ 4500.
A long time-of-flight aerosol mass spectrometer (LTOF-AMS, Aerodyne Research, Inc.) was used to measure the mass concentration of SOA, with a mass resolution of ∼ 8000. Using an aerodynamic lens to focus particles and thermal evaporation (600 °C) followed by electron impact ionization (70 eV), the mass concentration of submicron OA and inorganic particles can be obtained (Decarlo et al., 2006; Canagaratna et al., 2007). The ionization efficiency of AMS was calibrated by using 300 nm ammonium nitrate particles, and the default relative ionization efficiency of 1.4 was used for organics. Note that the above mass spectra datasets were analyzed either by the MATLAB-based tofTool (version 607) package or the Igor-based Tofware (Tofware_v3_ 2_3) and ToFAMS (ToF_AMS_HRAnalysis_v1_25A) packages. In addition, a custom-made Vienna-type differential mobility analyzer (DMA, 10–800 nm) (Reischl et al., 1997) and a commercial condensation particle counter (CPC 3750, TSI) were used to measure the size distribution of aerosol particles. The inner and outer radii of the DMA electrodes are 2.5 and 3.3 cm, respectively, with the effective electrode length being 28 cm.
2.3 Experiments
In order to characterize the performance of this VIA–NO3-CIMS system, we used several stable particle sources as the input (summarized in Table S3). First, a single-component solution of AS was used to generate monodispersed aerosol particles. Different sizes and number concentrations of AS particles were used to evaluate the evaporation and detection efficiency of the system. Next, a solution of polyethylene glycol mixtures (PEG 400, which is a mixture of different PEG oligomers with an average molar mass between 380–420 g mol−1) was used to evaluate the volatility measurements. The homogeneous series of PEGs was recommended and used by previous studies as benchmark molecules for volatility measurements, owing to their chemical and thermal stability (Krieger et al., 2018; Bannan et al., 2019). PEGs are in the liquid phase at room and measurement temperatures and thus can be easily prepared and used to mimic the liquid or amorphous solid OA particles (Cappa et al., 2008). On the other hand, the intra-consistency of different organic compounds with a large variety of volatility ranges using current techniques is usually much better than intercomparisons of the same compounds among different techniques (Bilde et al., 2015). Thus, PEGs can be used to evaluate the systematic bias related to different instruments and systems. In addition, a potential aerosol mass (PAM) oxidation flow reactor (∼ 13 L, stainless steel) was used to generate a multicomponent organic mixture, with SOA mass concentrations ranging from 7.23 to 94.4 µg m−3 from α-pinene ozonolysis under dry conditions. The total flow rate through the PAM reactor was 8 L min−1, resulting in a residence of ∼ 1.6 min. For a more detailed concept and description of the PAM, please refer to previous works (Kang et al., 2007; Lambe et al., 2011). Note that the identified HOM species, with six or more oxygen numbers from the α-pinene ozonolysis reactions (Bianchi et al., 2019), were grouped into different carbon number families as described in Zhao et al. (2023). HOM monomer and HOM dimer (i.e., dimetric accretion products) refer to C8–C10 and C16–C20 compounds, respectively, while the peaks of other carbon numbers observed are named as ”HOM others” in the following discussion.
2.4 Description of the fitting method for the thermograms
Thermograms can be obtained during temperature-programmed thermal desorption. The observed vapor concentration of a given compound is determined by its evaporation from the particles and losses of the evaporated vapors. In the FIGAERO design, a limited quantity of particles are collected on the Teflon filter and a maximum of the vapor signal is observed after the full evaporation of that compound (Lopez-Hilfiker et al., 2014). The temperature corresponding to that maximum in the thermogram (Tmax) is related to its volatility (Schobesberger et al., 2018; Thornton et al., 2020). In the VIA, real-time evaporation of particles is achieved without pre-collection. Assuming negligible losses of vapors within the vaporization tube, we expect that the evaporated fraction of aerosol particles will increase as the VIA temperature rises and reaches a plateau (instead of a single maximum) after full evaporation. The plateau is expected since the vaporization tube is constantly supplied with new particles in the sampling flow through the VIA. Therefore, there will be no decrease in the signal due to it running out of mass to evaporate. This sigmoid-shaped thermogram was obtained when using ammonium sulfate as the particle source in the experiments, during which sulfuric acid was generated and measured using the VIA–NO3-CIMS system (Fig. 2).
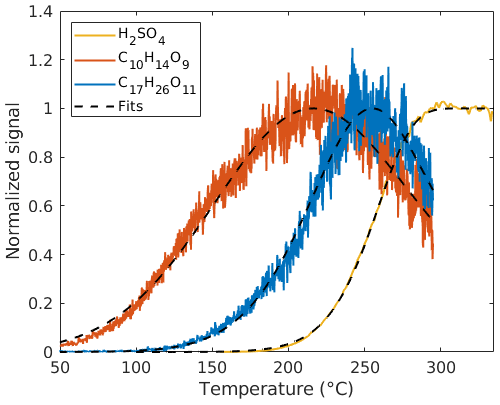
Figure 2Measured (solid lines, 10 s dataset) and fitted (dashed lines) thermograms for H2SO4 (sulfuric acid), C10H14O9, and C17H26O11.
In order to simulate the thermogram, the temperature-dependent rate of evaporation of compound X from the particle phase is adapted from the one used by Schobesberger et al. (2018):
where T∗ and k are the free parameters to be fitted based on the measurements. The temperature inside the vaporization tube as a function of time T(t) is obtainable by combining the temperature profile inside the tube (Fig. S1) with the flow rate as a function of temperature. A more detailed description of Eq. (1) is given in Sect. S1. Then, the evaporated concentration of compound [X]evaporated can be described by
where [X]0 is the initial mass concentration of compound X in the particle phase, which also needs to be fitted, and τ is the total residence time in the vaporization tube. The fitting of SA signals using this model shows good agreement with the SA measurements (Fig. 2). In contrast to the SA experiments, HOMs (multifunctional organic compounds evaporated from SOA particles) may be lost upon impacting the hot walls of the vaporization tube. Indeed, thermograms which look like those obtained by the FIGAERO system were also measured for HOM compounds using the VIA–NO3-CIMS system. We assume this is owing to the vapor losses within the vaporization tube, with earlier evaporation in the tube causing a larger fraction of a compound to be lost, thus reaching a single maximum (at Tmax) during the thermal desorption ramp (examples shown as orange and blue lines in Fig. 2). It is important to note that the mechanism behind the shape and peak of the VIA thermogram is entirely different from the FIGAERO system's. For any organic compound X, the rate of the impacts is assumed to be proportional to its diffusion coefficient DX and gas-phase concentration [X]gas as
where a proportionality constant c is included in the model. The c constant is assumed to be instrument specific and constant for different temperatures and compounds, and it was determined by manually checking the thermograms for several different compounds (Fig. S2). Note that a manual approach for determining c was preferred to ensure the quality of the thermograms used. DX(T) was obtained using the Fuller method (Fuller et al., 1966; Tang et al., 2014), which has previously been used for determining the diffusion coefficients of HOMs (Peräkylä et al., 2020). The free parameters ([X]0, T∗, and k) were determined by a least-square fit of the numeric solution of [X]gas from Eq. (3) to thermogram data (dashed lines in Fig. 2). The corrected signal (i.e., without vapor losses) is then given by the fitted value of [X]0. This model for correcting the signal is one-dimensional and does not account for any radial variations in temperature and flow rate. Our model only includes a “bulk” aerosol mass; i.e., it does not account for different particle sizes or any kinetic limitations that may exist in the particles. Effects of thermal decomposition of molecules in advance of interaction with the walls are not included. A more detailed explanation of the fitting results for the thermogram of sulfuric acid and HOM species is given in Sect. 3.3.1.
3.1 Characterization of the VIA inlet
3.1.1 The gas-phase denuder
Gas removal efficiency and particle transmission efficiency are the two key parameters to evaluate the performance of a gas denuder. Based on the PTR-TOF measurements (Figs. S3a and S4) with a flow rate of 1 L min−1, removal efficiencies of 97.2 %–99.9 % were observed for 13 different VOCs (∼ 8 ppb) under dry conditions (relative humidity < 1 %). In addition, ∼ 80 % of 500–800 ppb α-pinene and > 95% of 4 ppm O3 were removed (with a 1.5 L min−1 flow rate) during one test within the PAM chamber. However, we observed a degraded performance of VOC removal under humid conditions (relative humidity around 73 %) and during continuous exposure to ∼ 130 ppb of VOC mixture after several hours (Table S4 and Fig. S5). In addition, the performance of an old gas denuder, which has been regenerated many times, tends to decrease compared to a new one. Overall, we recommend future users keep track of the performance of gas denuders during long-term usage, in particular under humid conditions. Based on the CPC measurements of monodispersed AS particles (20–700 nm, Fig. S3b), particle losses within the gas denuder are less than 5 % for particles above 50 nm. Overall, this honeycomb-activated carbon gas denuder is expected to work effectively under various lab and field conditions.
3.1.2 The vaporization tube
Residence time, as a function of flow rates for a given tubing dimension, within the vaporization tube is a crucial parameter for its design (Burtscher et al., 2001). A longer residence means better evaporation but may result in more particle losses (including wall loss and potential thermal decomposition), while a shorter residence time may lead to incomplete vaporization. For example, it has been found that the temperature needed to fully evaporate AS particles increases with the decrease in residence time and the increase in particle size, which may lead to some inconsistencies among different volatility measurements (Burtscher et al., 2001; An et al., 2007; Faulhaber et al., 2009).
The residence time within the VIA vaporization tube is estimated to be within a range of 0.045–0.36 s with working flow rates of 1–4 L min−1 and temperatures used during the experiments (Fig. 3a). Since only ∼ 40% of the vaporization tube could reach the set temperatures (Fig. 3b), the effective residence time (for evaporation) would be roughly half of the above estimations. The residence time is much shorter than those (9–63 s) used in previous thermodenuder designs (Burtscher et al., 2001; Wehner et al., 2002; An et al., 2007; Huffman et al., 2008), which focused on measuring the non-volatile part of the particles at different temperatures. Consequently, much higher temperatures (∼ 300 °C, Fig. 4a) are needed to fully evaporate AS particles than those reported by previous TD studies, e.g., 150–180 °C for 100 nm AS particles (Burtscher et al., 2001; An et al., 2007).
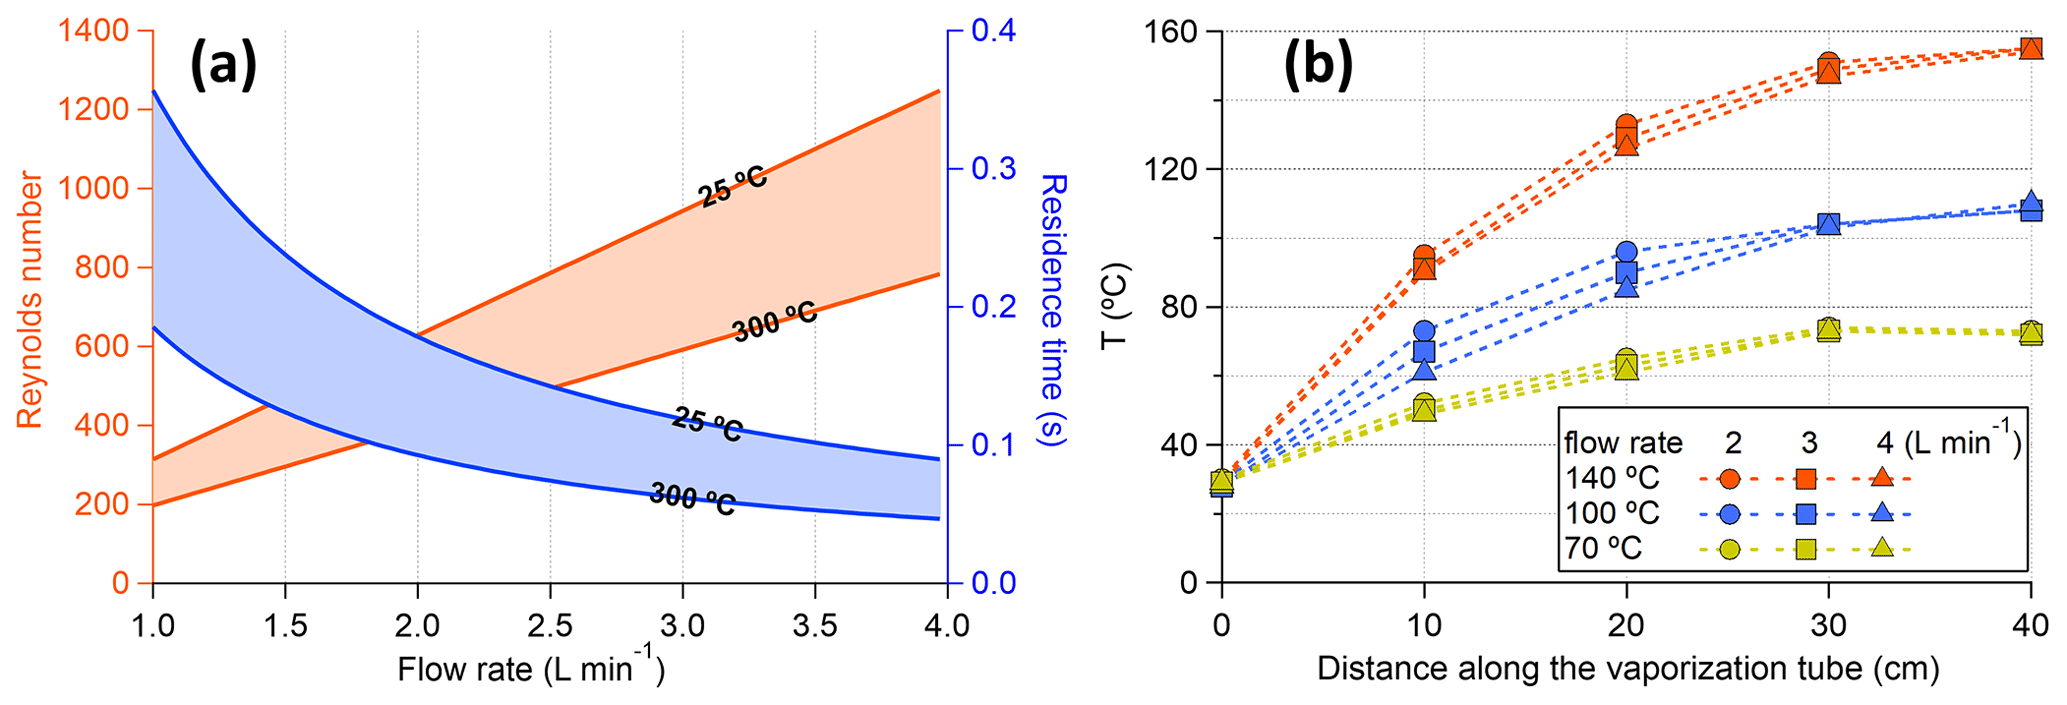
Figure 3(a) Residence time and Reynolds number as a function of volumetric flow rate (at the input side of the vaporization tube). (b) Temperature profile within the vaporization tube monitored with different flow rates. The temperatures were measured by inserting a thermocouple in the 1/4 in. vaporization tube, and the comparable temperature profiles at different flow rates might be partly explained by the thermocouple touching the tubing wall.
Assuming that the flow within the VIA vaporization tube is laminar (Reynolds number < 1300, Fig. 3a), particle losses mainly include diffusion, sedimentation, and thermophoresis onto the tube walls. All of these processes are particle-size-, temperature-, and residence-time-dependent. In the following discussion, we will evaluate the particle loss with a flow rate of 1 L min−1 as a lower limit of the particle transmission efficiency, because higher flow rates (with a smaller residence time) will generally decrease particle losses. First, sediment loss increases with the increase in particle size. For a 1 um spherical NaCl particle at 25 °C as the worst scenario, the settling velocity is calculated to be cm s−1. With a residence time of 0.36 s, the settling distance is cm, which is much smaller than the inner diameter of the vaporization tubing (by a factor of ∼ 155). Thus, the effect of sedimentation is negligible. Second, diffusive loss increases with the decrease in particle size. For a 10 nm spherical NaCl particle at 300 °C as the worst scenario, the diffusion constant D is about cm2 s−1, and the root mean square displacement by diffusion Y is calculated to be cm, which is much smaller than the inner diameter of the tube (by a factor of ∼ 20). Thus, the effect of particle diffusion should also be negligible. Lastly, thermophoresis will force the particles to the centerline, which partly compensates for the diffusion and sedimentation (Villani et al., 2007). Overall, the above rough estimations give an upper limit of the particle loss within the vaporization tube. The detailed calculations are given in Sect. S2.
Comparable to our above estimation, the CPC measurements (Fig. S6b of monodispersed NaCl particles, which are 20–700 nm) showed particle losses < 10 % with a slight increase as the VIA temperature increases. Similar results were reported from previous TD studies (Wehner et al., 2002; Huffman et al., 2008). The lowest particle transmission efficiency (89.5 %) was observed for 300 nm NaCl particles at 300 °C. Thus, the particle loss through processes other than thermal evaporation will not affect the results largely. On the other hand, near-unity transmission efficiency for most of the VOC standards was observed based on the PTR-TOF measurements (Figs. S4 and S6a), indicating that this VIA system can perform well if mounted in front of a PTR-TOF to measure less oxidized organic species. The increase in some VOC species at high temperatures was mainly owing to the evaporation of those gases, condensed at low-temperature stages, from the tubing wall. Differently, the losses of more oxidized organic species (e.g., HOMs) within this vaporization tube were observed and will be discussed in Sect. 3.2.
3.1.3 The sheath flow unit
After thermal desorption, vapor transmission is the key parameter that determines the sensitivity of the entire system. Within the sheath flow unit, a sheath flow was supplied to cool down the sampling flow and minimize the wall loss of the hot vapors during the transport for analysis. In addition, the sheath flow is needed to compensate for the 10 L min−1 inlet flow of the NO3-CIMS. Compared to the evaporated organic/inorganic vapors, the diffusion of air is faster, which results in a rapid temperature drop between the vaporization tube and the sheath flow unit. Consequently, turbulence (along with thermophoretic losses) and recondensation of hot vapors may take place in the cooling area (Fierz et al., 2007). Thus, the sheath flow unit needs to be supplied immediately as the evaporated vapors exit the vaporization tube to minimize their wall losses.
However, we found that directly connecting the VIA vaporization tube to the sheath flow unit will lead to a significant drop in the total ion counts of the NO3-CIMS, possibly owing to the formation of turbulence, after mixing the hot sampling flow with the cooler sheath flow, in the CI inlet tubing. Using a piece of stainless-steel tubing (length: 5, 15, or 30 cm; outer diameter: 1.2 cm, as a cooling tube before the sheath flow unit) to cool the sampling flow down before mixing with the sheath flow could help to reduce the turbulence. Alternatively, using longer inlet tubing (75 cm vs. 40 cm, after the sheath flow unit) for the NO3-CIMS, with the shortest cooling tube (5 cm), also helped to decrease the effects of turbulence. As shown in Fig. S7, this setup (purple markers) gave the best sensitivity among different setups and showed consistency of sulfuric acid mass concentrations between the SMPS and NO3-CIMS measurements, indicating that the nucleation/recondensation of the evaporated vapors might not be an issue. Furthermore, comparable thermograms were observed between the SMPS and NO3-CIMS measurements (Fig. 4b), confirming the negligible losses of sulfuric acid after evaporation. Nevertheless, a slight delay of the evaporation was observed with the increases in particle sizes (Fig. 4a). Multiple charged particles might play a role in this delay (based on our quick tests), but nearly full evaporation of 300 nm AS particles at 300 °C is already good enough for most lab and field experiments; thus, we did not put much effort into digging into the details.
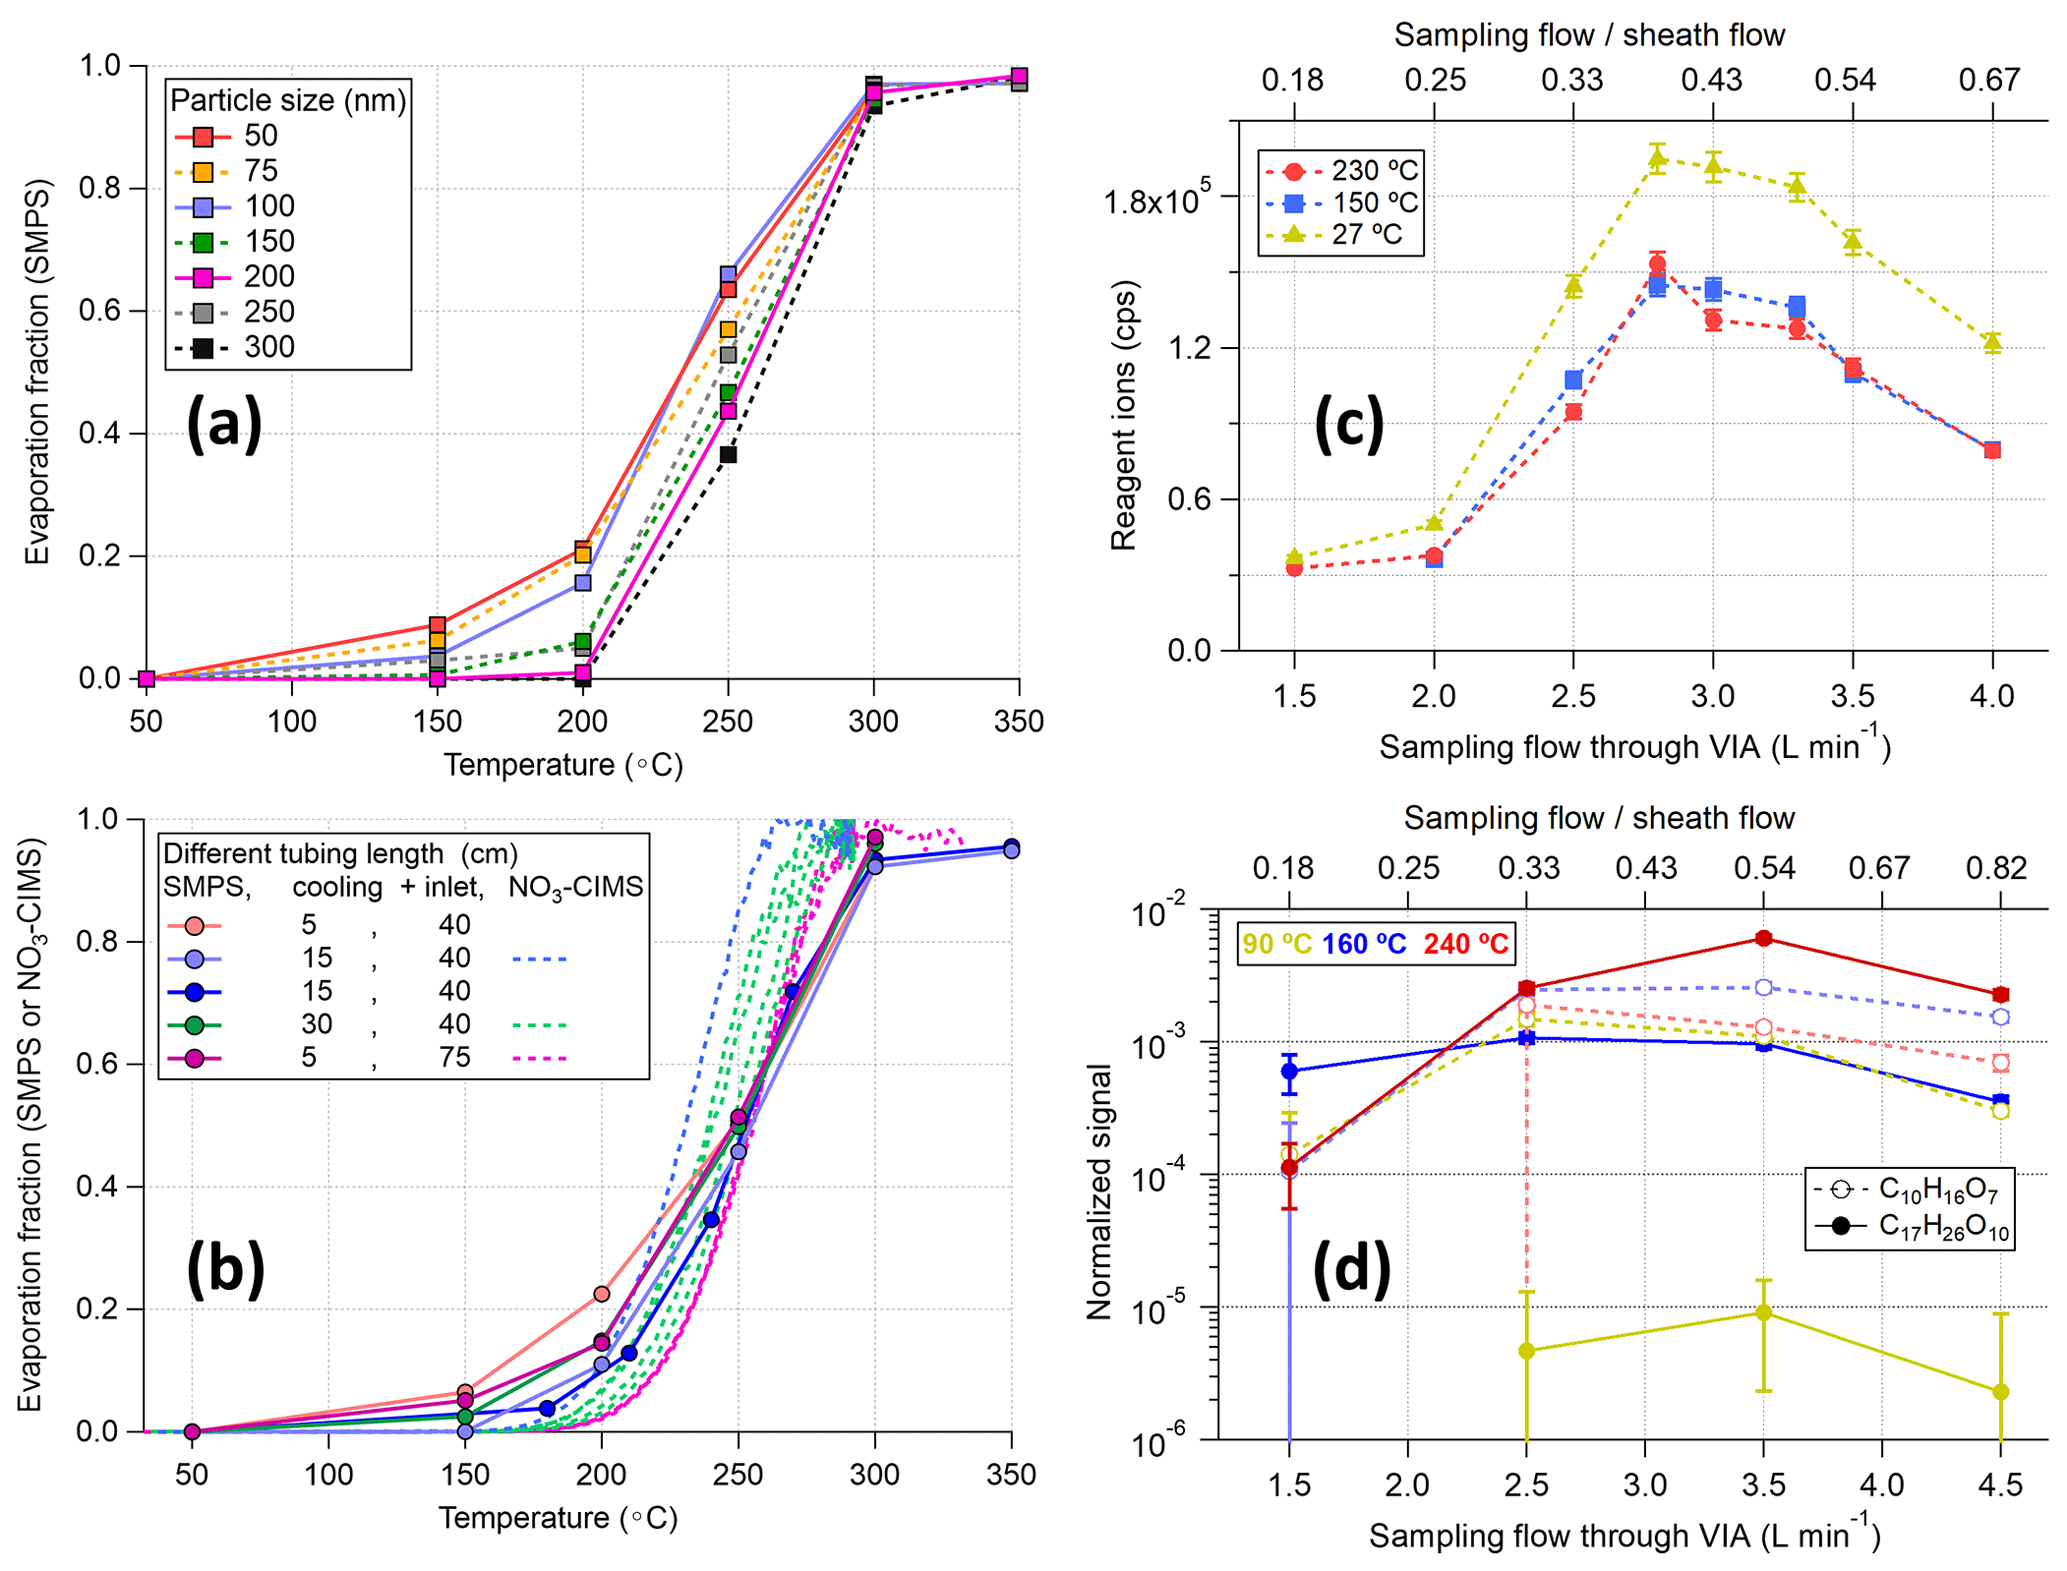
Figure 4Evaluation of the detection efficiency of the VIA for (a) size-selected (50–300 nm) ammonium sulfate particles with a fixed setup (i.e., 5 cm cooling and 40 cm inlet tube) and (b) different setups with 100 nm ammonium sulfate particles. The SMPS measurements in panels (a) and (b) were corrected for the size-dependent transmission efficiency (details in Fig. S8). The effects of different sampling flow rates on the sensitivity of the system with (c) zero air and (d) stable SOA (14±1.5 µg m−3) input at three different temperatures are shown. HOM signals were normalized to the reagent ions and the dilution factors of different flow ratios were applied for HOM signals for more straight comparisons in panel (d) and in Fig. S9.
In addition to the length of the cooling and inlet tubing (i.e., the temperature effects on mixing flows), the flow ratios between the sampling flow (1.5–4 L min−1) and the sheath flow (8.5–6 L min−1), which together make up the total inlet flow of 10 L min−1, could also affect the sensitivity of the VIA–NO3-CIMS system. During the zero-air test, the temperature effect is not significant owing to the usage of a 15 cm cooling tube (yellow markers vs. red and blue markers in Fig. 4c). Thus, the decrease in total reagent ion signals (i.e., the sum of nitrate monomer, dimer, and trimer) is mainly owing to the turbulence caused by mixing flows of different flow rates, altering the total ion counts by a factor of 5–6, despite the usage of flow meshes to keep the sheath flow as laminar as possible. This result highlights a well-known issue in the CIMS community that the Eisele-type nitrate CI inlet is super sensitive to flow arrangements.
The optimal sampling flow rate was observed around 2.5–3.5 L min−1 for the highest total ion counts, and similar trends were observed for particle-phase HOM measurements (Figs. 4d and S9). For example, although the C17H26O8 signal increased significantly with temperature because of enhanced evaporation, the relative changes in signals for different flow rates were similar for all temperatures. Furthermore, these relative changes among different HOM species (i.e., the distribution of measured HOM species) started to stabilize when the sampling flow through the VIA exceeded 2.5 L min−1 (Fig. S10). The reason for an optimal flow ratio of around 3–7 is related to the current physical dimensions of this sheath flow piece, which were designed to minimize turbulence after flow mixing, with a face velocity ratio of 1.25 between the sample and sheath flow. Note that a sampling flow of 3 L min−1 was used in the experiments discussed in the following sections.
3.2 Thermogram
In this section, we investigated the performance of the VIA–NO3-CIMS system when sampling from a stable aerosol source (a PAM oxidation flow reactor for SOA particles or an atomizer for size-selected particles). The VIA used in this work can be operated by ramping the desorption temperature from 25 to 350 °C in the ramping mode or by setting the temperature to several temperature steps of interest in the steps mode. The particle-phase HOM signals measured between these two modes are compared in Fig. 5, where the thermogram of some HOM monomers (C8–C10 with Tmax ∼ 100–150 °C) and dimers (C16–C20 with Tmax> 200 °C) are shown. In general, both the thermograms of most low-volatility HOM species (Fig. 5a) and the distribution of bulk HOM compounds (Fig. 5b, c) between these two modes are quite comparable, although the total HOM signals obtained in the steps mode are ∼ 18 % lower than in the ramping mode. The lower HOM concentrations observed in the step mode can be partly explained by lower SOA mass concentrations compared to the ramping mode measurements (Fig. S11). In addition, the largest difference is on the thermograms of relatively high-volatility compounds (e.g., C8H10O6 and C9H12O7), which are less selective by the NO3-CIMS (Hyttinen et al., 2015).
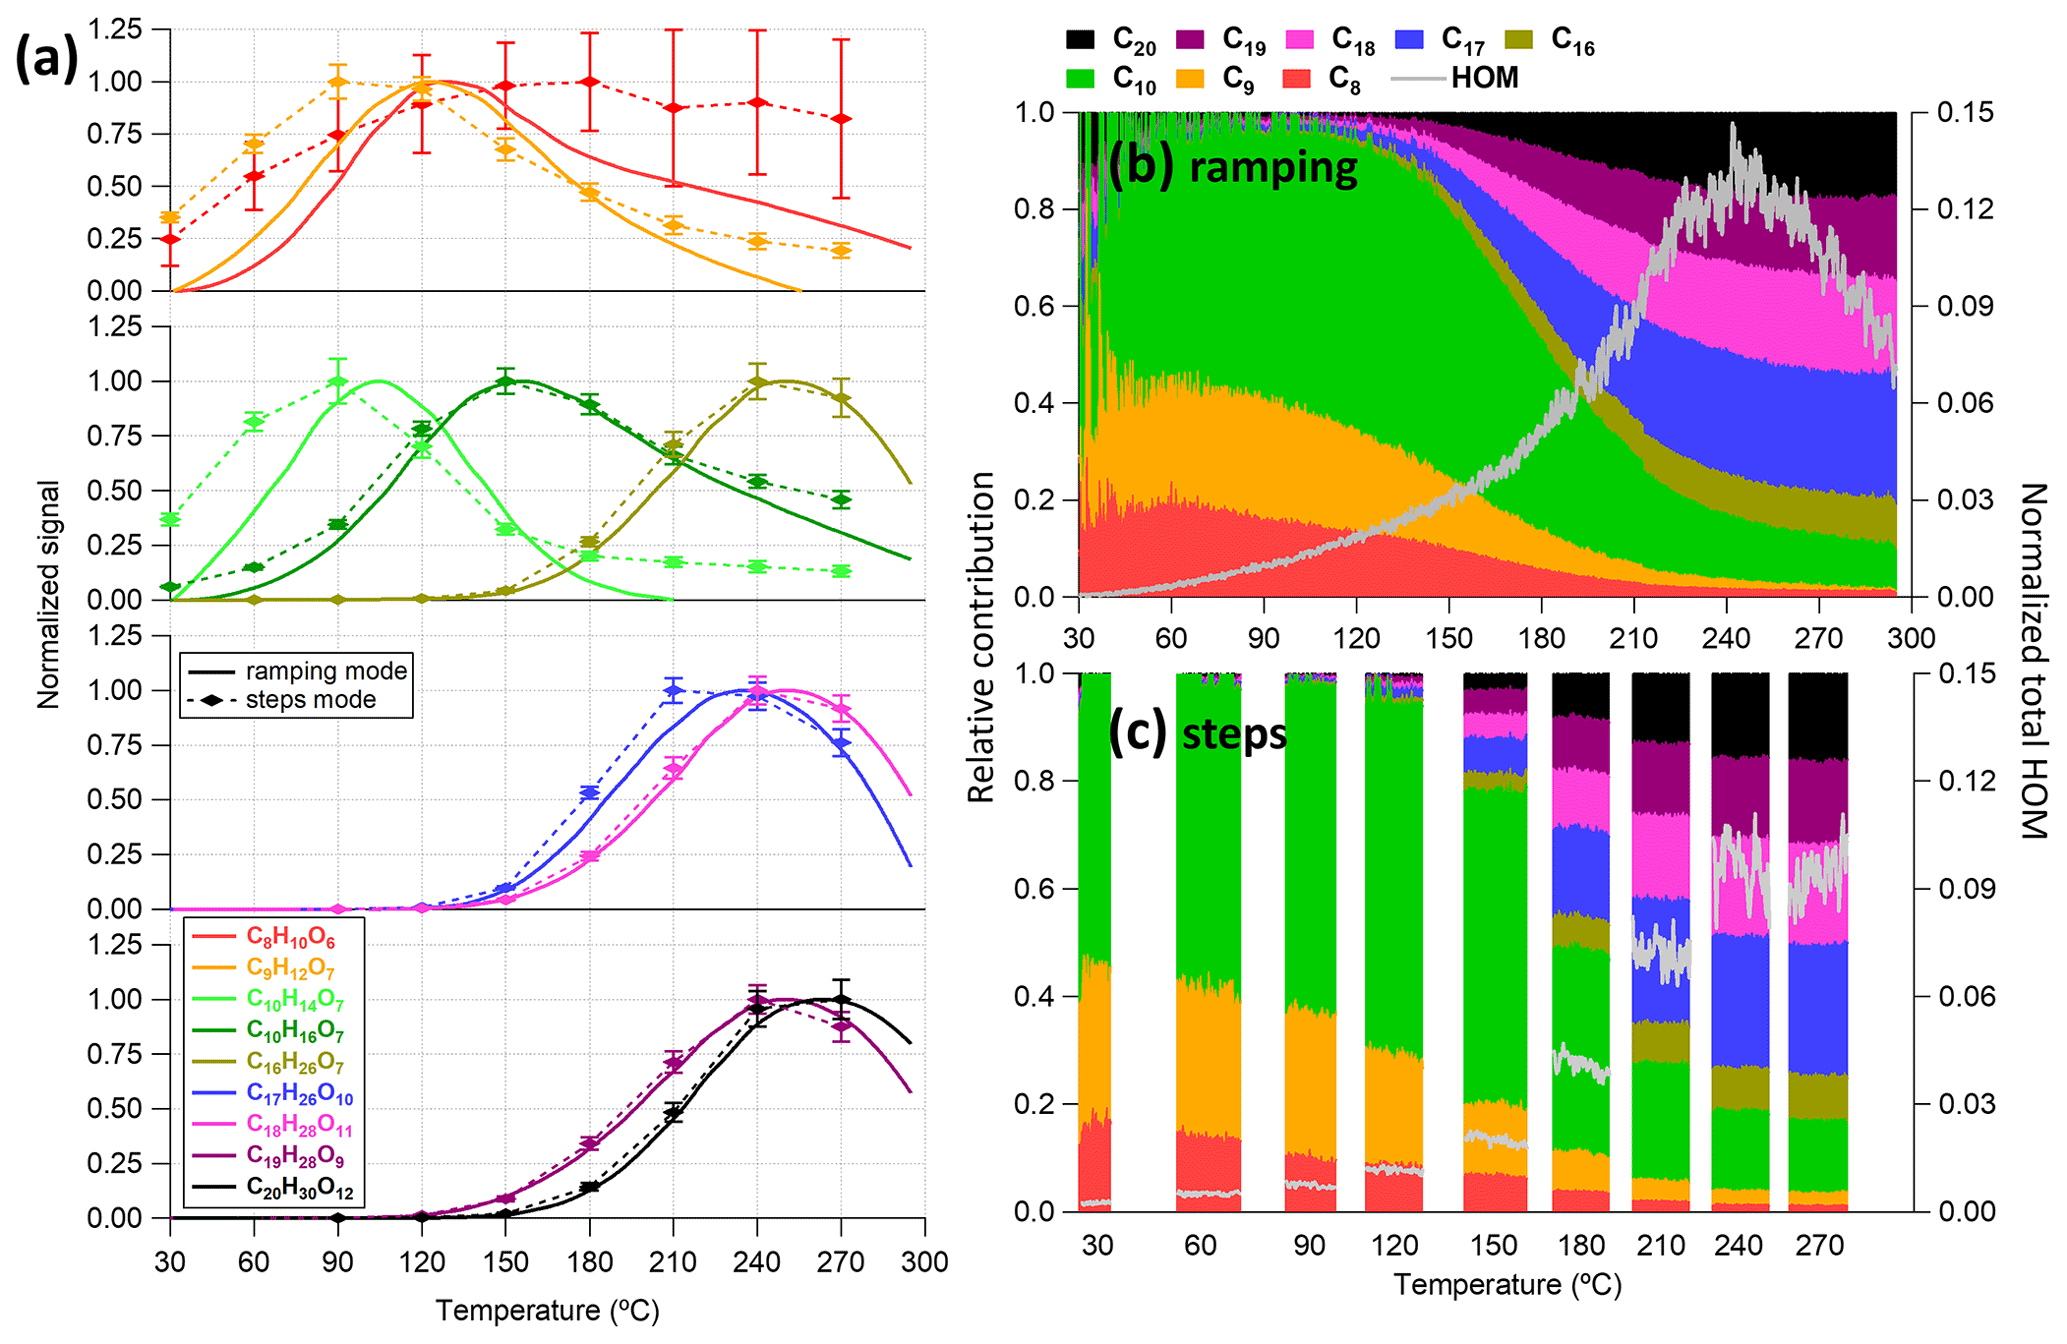
Figure 5Comparison of measurements obtained between the ramping and the step mode for (a) the thermogram of some chosen HOM monomers and dimers and (b, c) the relative contributions of different C number families to the total HOM signals. In panel (a), smoothed signals are shown for the ramping mode (LOESS algorithm with a bandwidth of 0.25 and the second-order local polynomial was used), while the mean (diamond markers) and standard deviation (bottom and top whiskers) are shown for the step mode. The thermograms are normalized to the reagent ions first and then to their maximums. The raw signals of the same dataset are given in Fig. S11.
3.2.1 Volatility
Figure 5a shows a very interesting trend of decreasing HOM signals after reaching their maximums as described in Sect. 2.4. This decrease at high temperatures can be largely explained by vapor losses after evaporation within the vaporization tube, but this is not the case for sulfuric acid and VOCs as discussed in Sects. 2.4 and 3.1.2, respectively. In particular, for each HOM compound, lower temperatures are not enough to fully evaporate the particle phase, while higher temperatures might cause earlier evaporation within the vaporization tube, thus with larger losses (i.e., HOM vapors collide with the walls and decompose). Therefore, the maximum signal (and corresponding Tmax) in the measured thermogram is determined by the balance between the evaporation rate and the loss rate. Here, we suspect that the thermal decomposition of HOM vapors upon the hot walls dominates the loss term because both HOM monomers and dimers largely consist of similar functional groups (e.g., carbonyls, alcohols, and peroxides). If decomposition was purely a function of temperature, and C10H14O7 started to decompose around 100 °C and lose ∼ 70 % around 150 °C (Fig. 5a), we would not expect to see any HOMs above 200 °C. However, some dimers only start to show up at this temperature, suggesting that there has been only a marginal loss of these compounds before evaporation; i.e., rapid particle-phase decomposition was negligible. Similarly, we did not feel that rapid gas-phase decomposition should be expected either. However, contact with a hot metal surface could be expected to lead to fast decomposition, as the heat transfer to the molecule is likely to be much larger in this case. In addition, as discussed in Sect. 3.3, our model was able to capture the thermogram shape with the assumption of efficient wall thermal decomposition.
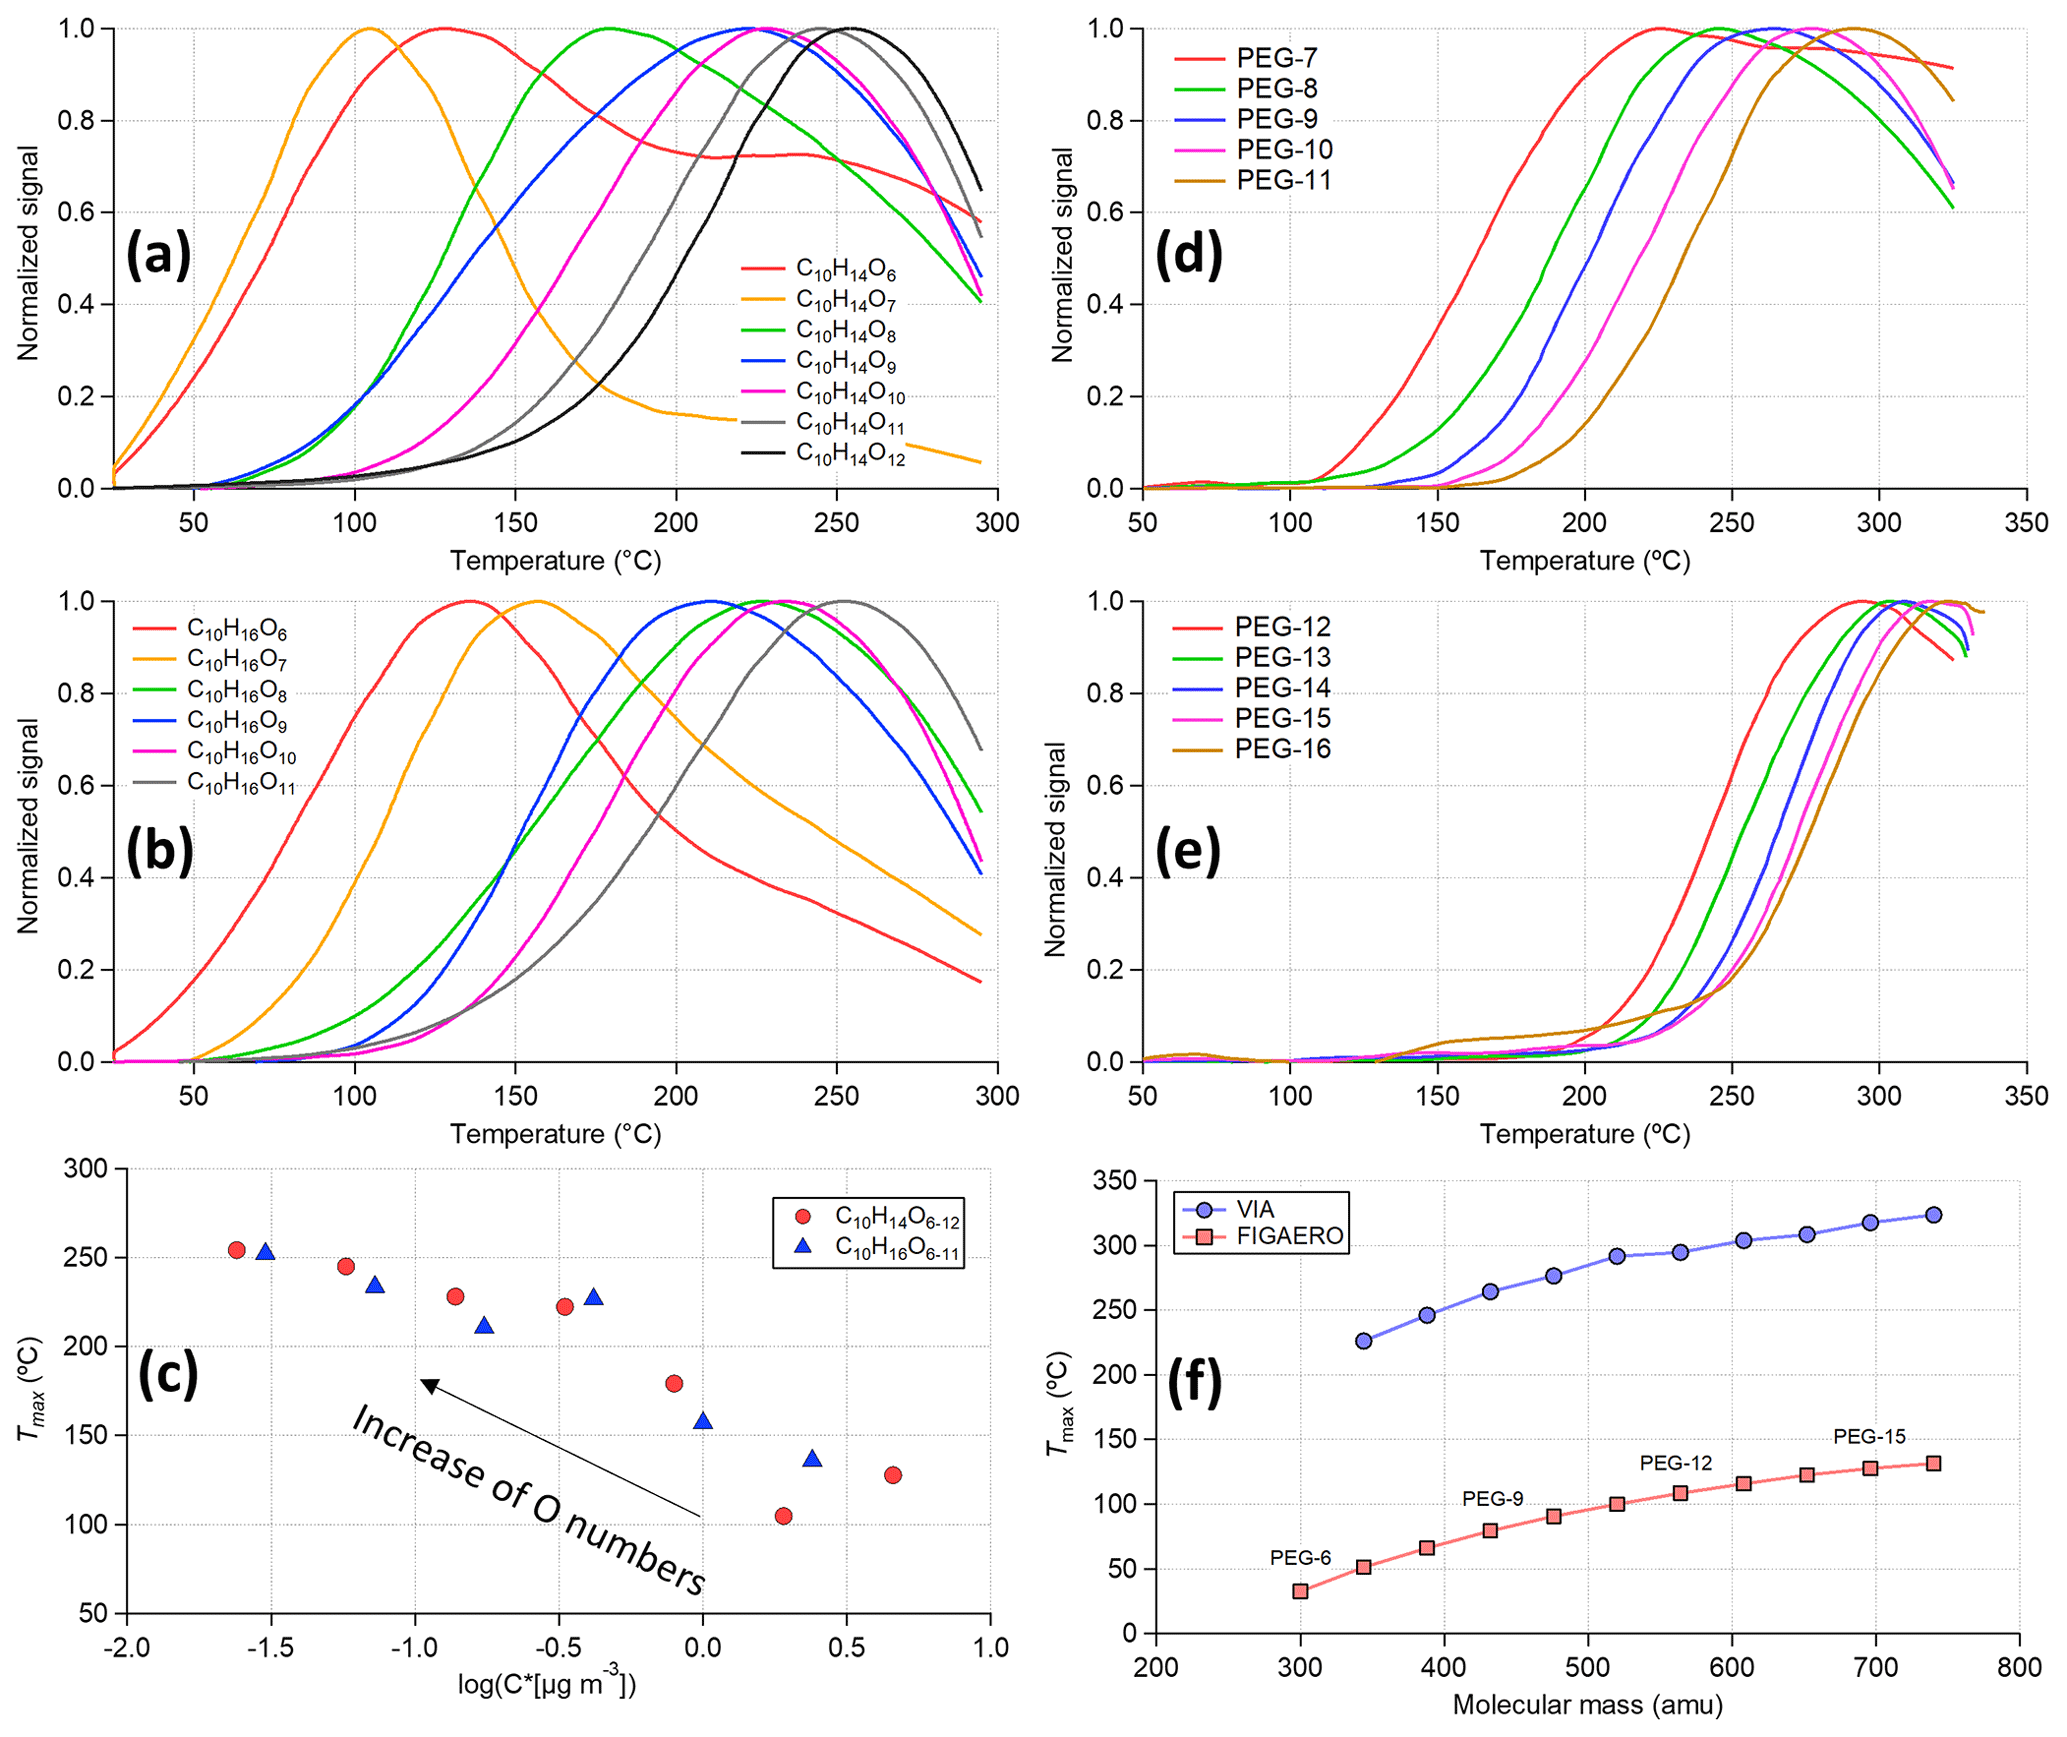
Figure 6Thermogram of (a) C10H14O6−12, (b) C10H16O6−11, and (d, e) polyethylene glycols (PEGs). (c) The scattering plot of Tmax obtained from panels (a) and (b) vs. the estimated saturation vapor concentration using the composition-determined empirical expression in Peräkylä et al. (2020). (f) Tmax as a function of molecular mass (atomic mass unit) for PEGs measured by the VIA–NO3-CIMS system and the FIGAERO-iodide-CIMS (Ylisirniö et al., 2021).
In Fig. 5a, HOM compounds containing more carbon and oxygen atoms tend to show higher Tmax (i.e., lower volatility), and this trend is conserved within the C10H14Oz and C10H16Oz families (Fig. 6a, b) as well. The measured Tmax of these compounds is related to their saturation vapor concentrations (Fig. 6c) estimated using the composition-determined empirical expression given in Peräkylä et al. (2020), indicating that Tmax can be used to represent the volatility of measured organic compounds as used in the FIGAERO measurements (Lopez-Hilfiker et al., 2014). Next, the homogeneous series of PEGs was used (Fig. 6d–f) to compare the volatility measurements between the VIA–NO3-CIMS system (identified PEG peaks are summarized in Table S5) and the FIGAERO-iodide-CIMS (Ylisirniö et al., 2021) system. Similar to the ammonium sulfate experiments discussed in Sect. 3.1.2, by using a millisecond residence time within the VIA heating tube, a much higher Tmax was obtained compared to other thermal desorption techniques (e.g., the FIGAERO and TD systems). In the FIGAERO system, the collected particles are continuously heated up (10–50 K min−1) on the filter. For the VIA, the time spent above a given temperature is an appropriate factor that can be used for determining the evaporation (Fig. S12). Furthermore, the very short residence time of the VIA can explain the shift of the Tmax to higher values for PEGs (Fig. 6f) and HOMs (Fig. 7a) compared to previous FIGAERO measurements (Ylisirniö et al., 2020, 2021). Nevertheless, a near-perfect linear relationship of measured Tmax for the PEGs was found between these two systems (Fig. S13), indicating the potential to infer volatility from the measured thermograms using the VIA–NO3-CIMS system.
Another very interesting feature of the thermograms is that most of the HOMs, including monomers, only showed a single mode. Comparable or even slightly higher contributions of HOM dimers than monomers were observed in this (Fig. 9) and previous VIA works (Häkkinen et al., 2023; Zhao et al., 2023). These results suggest that thermal decomposition products are rarely detected by the VIA–NO3-CIMS system, unlike what has been reported in the FIGAERO setup (Lopez-Hilfiker et al., 2015). Some exceptions exist, e.g., the signal of C10H14O6 (Fig. 6a), which also seems to have a contribution from decomposition of larger molecules. Nevertheless, the combination of the VIA and the NO3-CIMS has the potential to also detect weakly bonded peroxide accretion products (e.g., C20 dimers in α-pinene SOA). Other CIMS instruments, with selectivity towards less functionalized and more volatile species, may be able to detect more of the decomposition products.
3.2.2 Reproducibility of thermograms
It is crucial to ensure the reproducibility of the thermograms to estimate the uncertainty when relating the measured Tmax to the volatility for organic species. The calibration method (syringe deposition vs. atomization), solution/mass concentration, particle size, matrix effects of inorganics, and heating ramp rate are factors that have been reported to affect the determined volatility (i.e., Tmax) in the FIGAERO-iodide-CIMS system (Ylisirniö et al., 2021; Ren et al., 2022). The effects of SOA mass concentration on the measured Tmax using the VIA–NO3-CIMS system were investigated in this section. As shown in Fig. 7b, the Tmax of HOMs measured under lower SOA mass concentrations showed a negative bias from the mean of the five experiments, while the Tmax under higher SOA mass concentrations showed positive biases from the mean value. In addition, the Tmax measured under comparable SOA conditions correlated well (Fig. S14b). Reproducible thermograms were obtained using a steady SOA input and showed negligible background levels during the continuously ramping mode (Fig. S15). On the other hand, the delay of Tmax with the decreases in the residence time and the increases in particle sizes has been discussed in Sect. 3.2.1 and 3.1.3, respectively. Furthermore, when the 100 nm AS particles were coated with organics, the evaporation of sulfuric acid was delayed (Fig. S14c), while the temperature ramping rate did not affect the evaporation because the thermal desorption process is different from the FIGAERO system. Overall, most of the factors that affect the volatility measurements in the previous FIGAERO and TD systems seem to have also played an important role in the VIA, and these effects warranted a more systematic investigation in future works to obtain more accurate volatility measurements using the VIA–NO3-CIMS system.
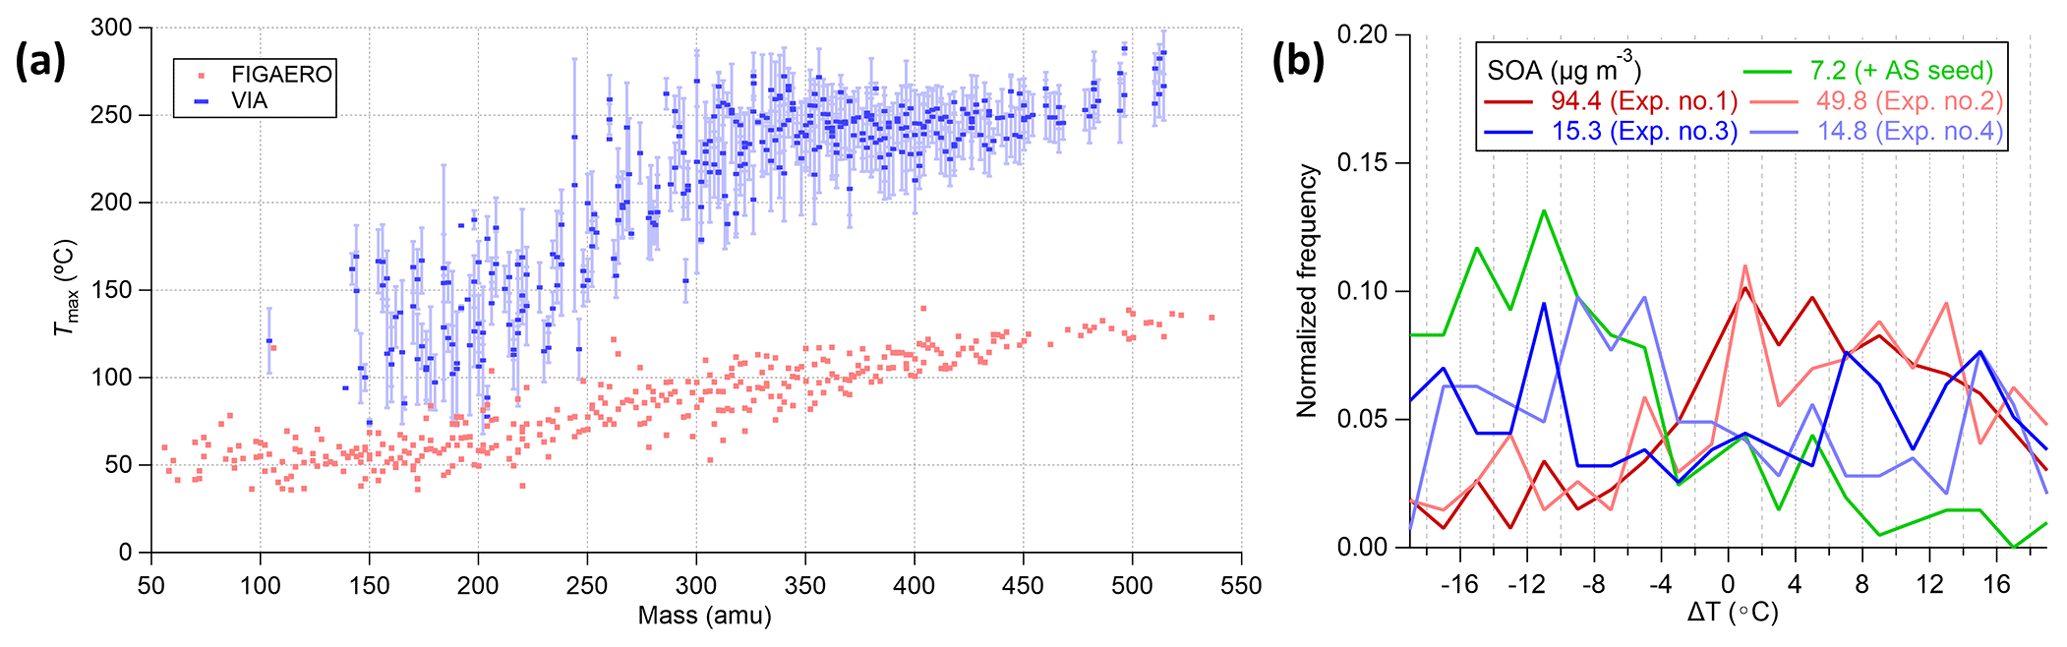
Figure 7(a) Tmax for α-pinene SOA measured by the VIA–NO3-CIMS system (blue markers for the mean and light-blue whiskers for the 1 standard deviation) and the FIGAERO-iodide-CIMS system adapted from Ylisirniö et al. (2020). (b) The normalized distribution of Tmax difference (ΔT) between each experiment and the mean of five experiments for HOMs. In panel (b), only the 7.2 µg m−3 SOA experiment was conducted using ammonium sulfate as the seed particles.
3.3 Quantification of particle-phase HOMs
3.3.1 Fitting the thermograms
In this section, we used the one-dimensional model described in Sect. 2.4 to simulate the evaporation of particles and the loss of evaporated HOM vapors within the vaporization tube to fit the measured thermograms. As the temperature ramps up, the particles within the sampled aerosol start to evaporate earlier inside the vaporization tube. Without significant losses for sulfuric acid, the measured signal increases with the temperature and reaches a plateau after full evaporation. This hypothesis is supported by the good agreements between the measurements and the fitted signal using only the evaporation function (Fig. 8a). For HOMs, the situation is more complicated, and an extra loss term is added to fit the thermograms (Fig. 8c, d). The competition between the evaporation and loss of HOM vapors leads to the thermogram rising and later falling as the VIA temperature ramps up. We suspect this loss is mainly owing to the fact that HOMs were lost upon impacting the walls of the vaporization tube then decomposing to fragmentation products that are not detectable by the NO3-CIMS. The earlier the particles evaporate within the vaporization tube, the longer HOM vapors had to diffuse to the walls. This leads to a significant loss of signals at higher temperatures, where most of the particle mass has evaporated before reaching the end of the vaporization tube. Consistently, a mass dependency of the estimated correction factor was observed (Fig. 8b) because heavier HOMs evaporate later; thus, a smaller correction is needed. However, lower temperatures may not be able to fully evaporate the low-volatility species. Consequently, the measured signal shows one single maximum (Ymax), which unfortunately only represents a fraction of the total particle-phase concentration that survived to enter the NO3-CIMS. Therefore, the fitting method to the thermograms is needed to obtain a more accurate estimation of the particle-phase HOM concentration in the aerosol sample.
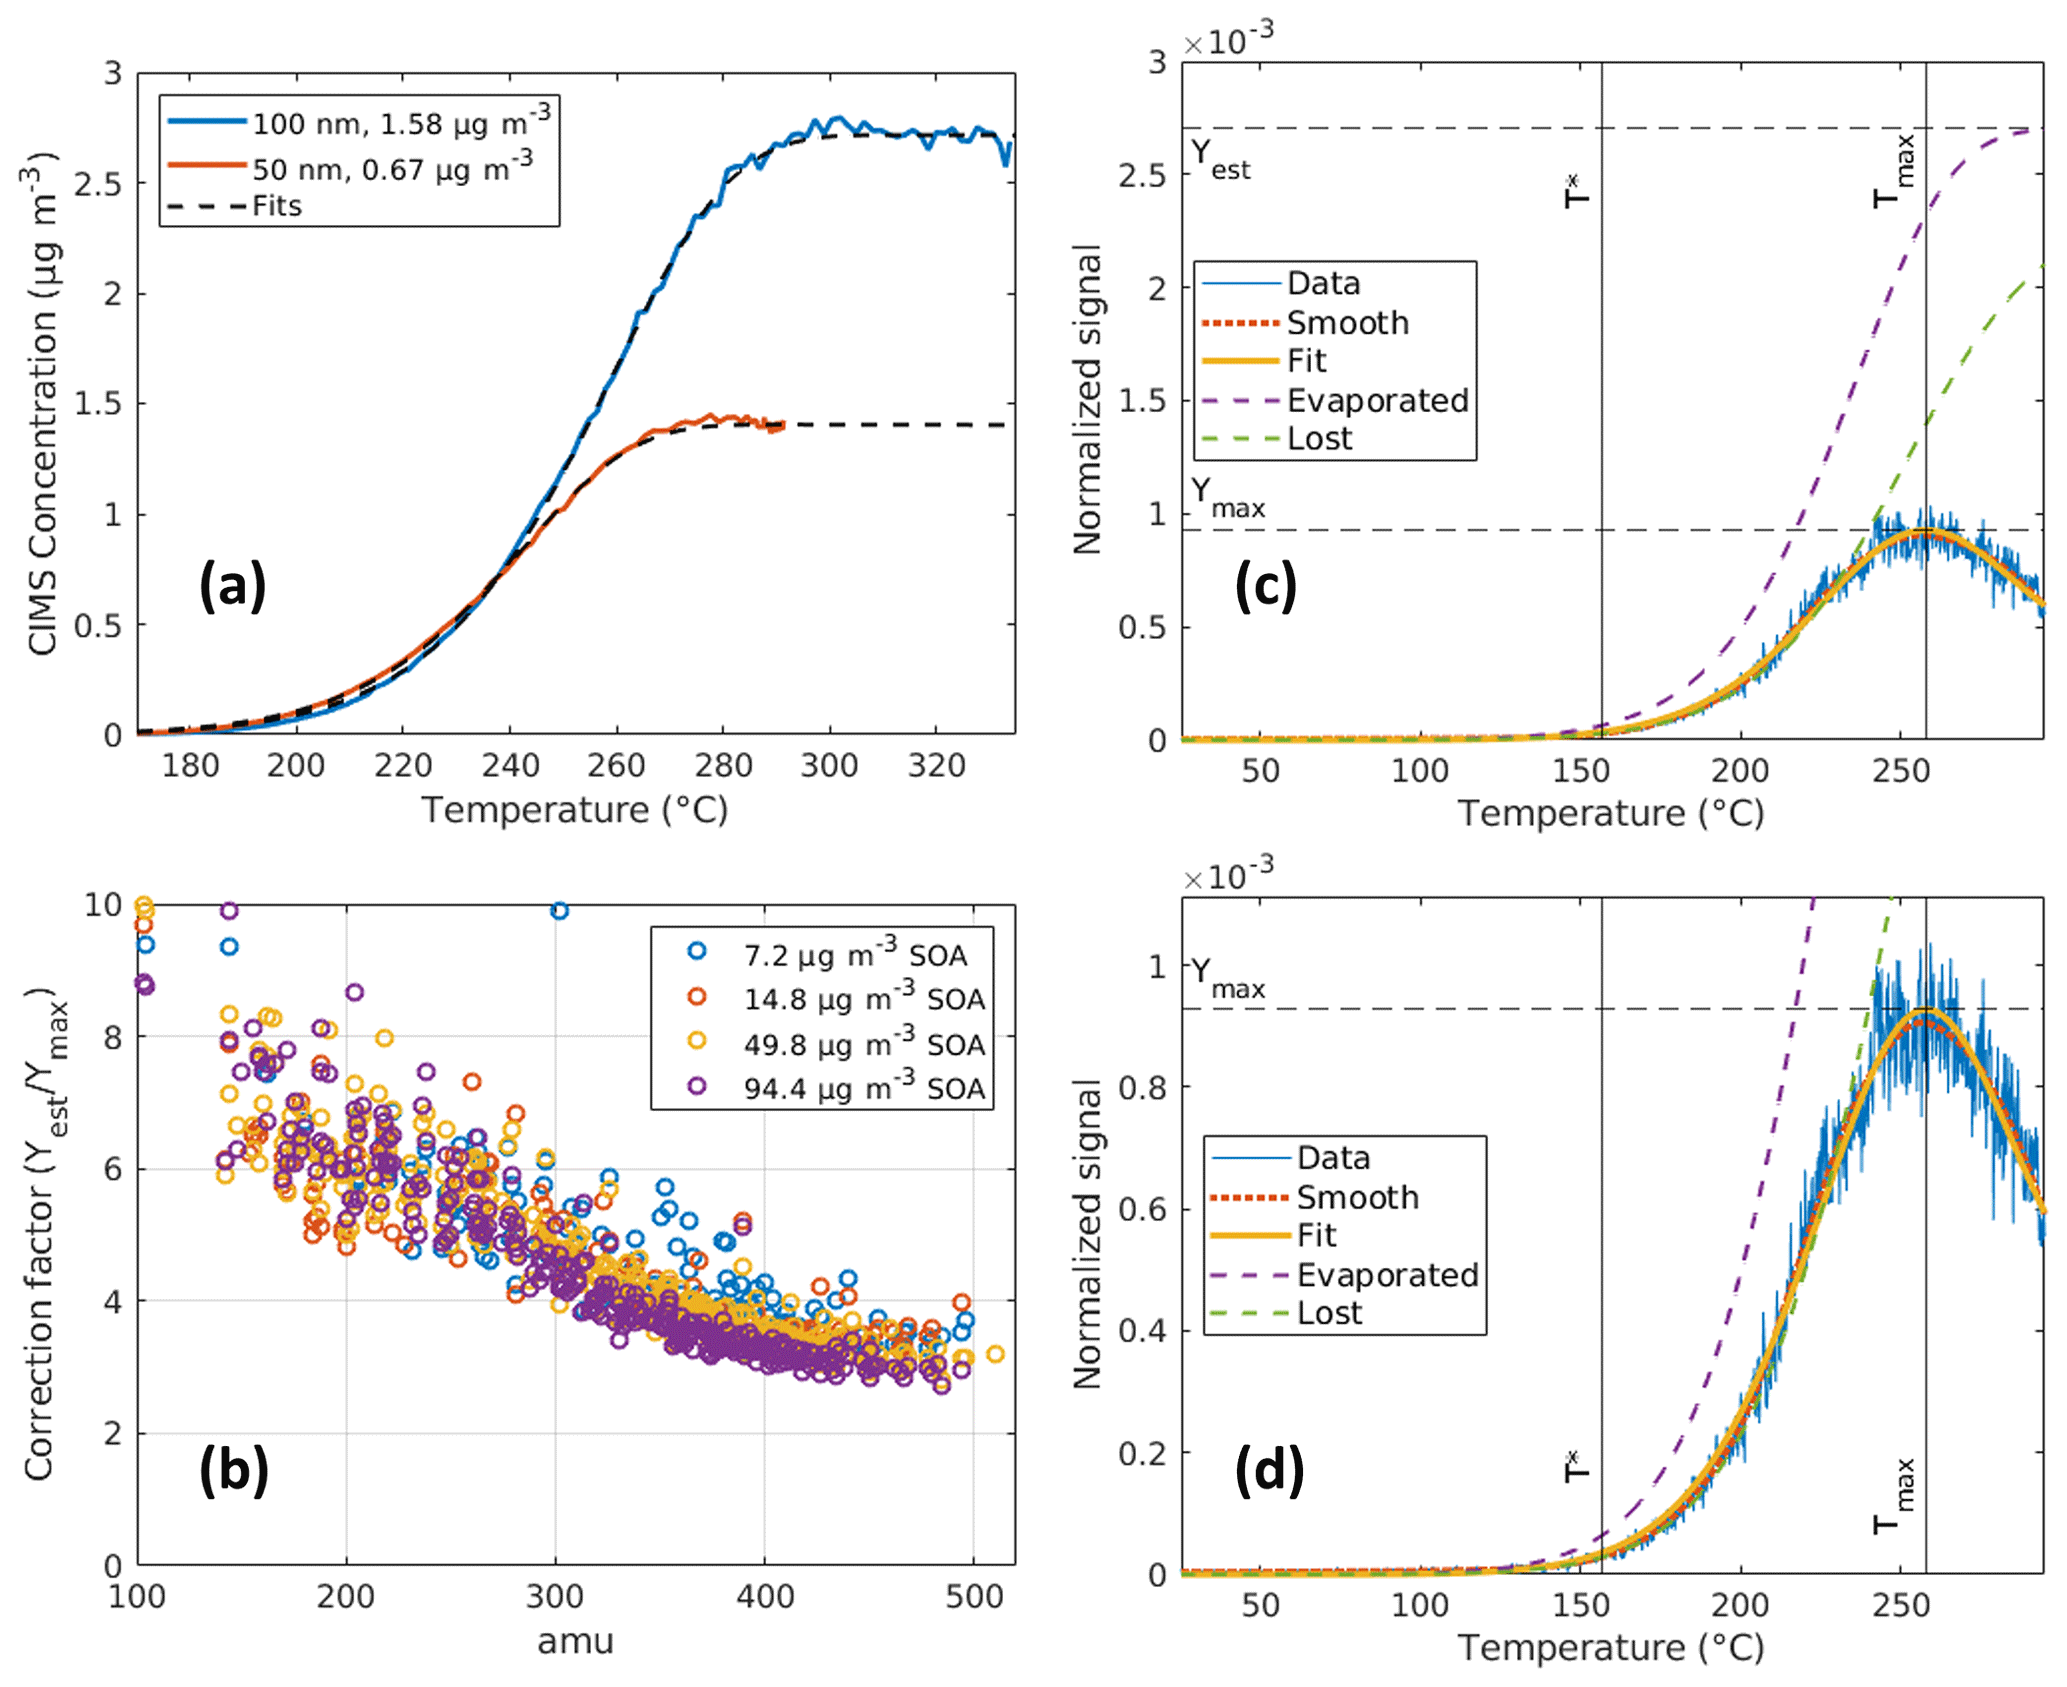
Figure 8Fitting results of the observed thermogram for (a) sulfuric acid and (c) C20H30O12. (b) Summary of the correction factor (CF) for the VIA–NO3-CIMS system in terms of particle-phase HOM measurement; the mass dependency of these curves makes sense because heavier HOMs evaporate later. Thus, smaller correction is needed. (d) The same result as panel (c) but zoomed in on the details to show the agreement between the fit and measurement. In panel (c), the data curve is the measured signal of C20H30O12 normalized to the reagent ions. The smooth curve used LOESS smoothing with a bandwidth of 0.25 on the data. The evaporated curve represents the estimated signal without gas-phase losses using Eq. (1), which shows the estimated maximum signal (Yest). The lost curve describes the cumulated diffusional vapor losses (assuming a 100 % loss once a molecule hit the wall) within the VIA vaporization tube. The fit curve displays the calculated gas-phase signal as the difference between the evaporated and lost curves. More examples of the fitting result for other HOMs and the fitted parameters (T∗ and k) are shown in Figs. S16 and S17, respectively.
Here, we define the correction factor (CF) as the ratio of the estimated initial particle-phase concentration (Yest, fitted maximum) and the measured maximum (Ymax) in the thermogram. The CF obtained for several datasets (with SOA mass concentrations of 7.2–94.4 µg m−3) is relatively comparable (Fig. 8b). However, the CF is quite sensitive to the proportionality constant, which also has some uncertainties associated with it (Fig. S2 and Table S6). This means that while the relative correction factors between different compounds may be well known, the absolute values can still vary by an order of magnitude. An additional source of error in the CF values is the estimated diffusion constants; these may be off by up to 10 %. There is also little information available about how the Fuller-method-estimated diffusion coefficients scale up to temperatures of > 300 °C (Tang et al., 2015). In addition, the lighter species show more erratic and less consistent thermograms, and this may introduce larger uncertainties compared to low-volatility larger molecules. In the end, summing up the uncertainties mentioned above as an upper limit leads to a factor of 2.8 and was used for the error bars in Fig. 9.
3.3.2 Particle-phase HOMs
Based on the correction factor obtained for each compound, the mass concentration of particle-phase HOMs can be estimated as shown in Fig. 9a. Though with large uncertainties, our best estimate for the contribution of particle-phase HOMs to the total SOA mass is ∼ 15 %; we hope that future studies will be able to narrow down the uncertainties. A linear relationship was measured between the particle-phase HOMs and SOA, with a roughly comparable distribution between HOM monomers and dimers among all experiments (i.e., dimers make up between 65 %–74 % of the total HOM monomers and dimers mass), suggesting that while our absolute quantification is very uncertain, the reproducibility of the measurements is much better. The linear relationship also applies to most individual species, disregarding some outliers (Fig. S18). The contribution of the HOM others increases with the increase in SOA mass concentrations, which can be largely explained by the gas–particle partitioning theory because HOM others are dominated by compounds with carbon numbers less than 8. The estimated fractions of particle-phase HOM monomers and dimers are expected to have smaller uncertainties than the estimated mass, since the relative uncertainties of CF for different species are smaller than for their absolute values.
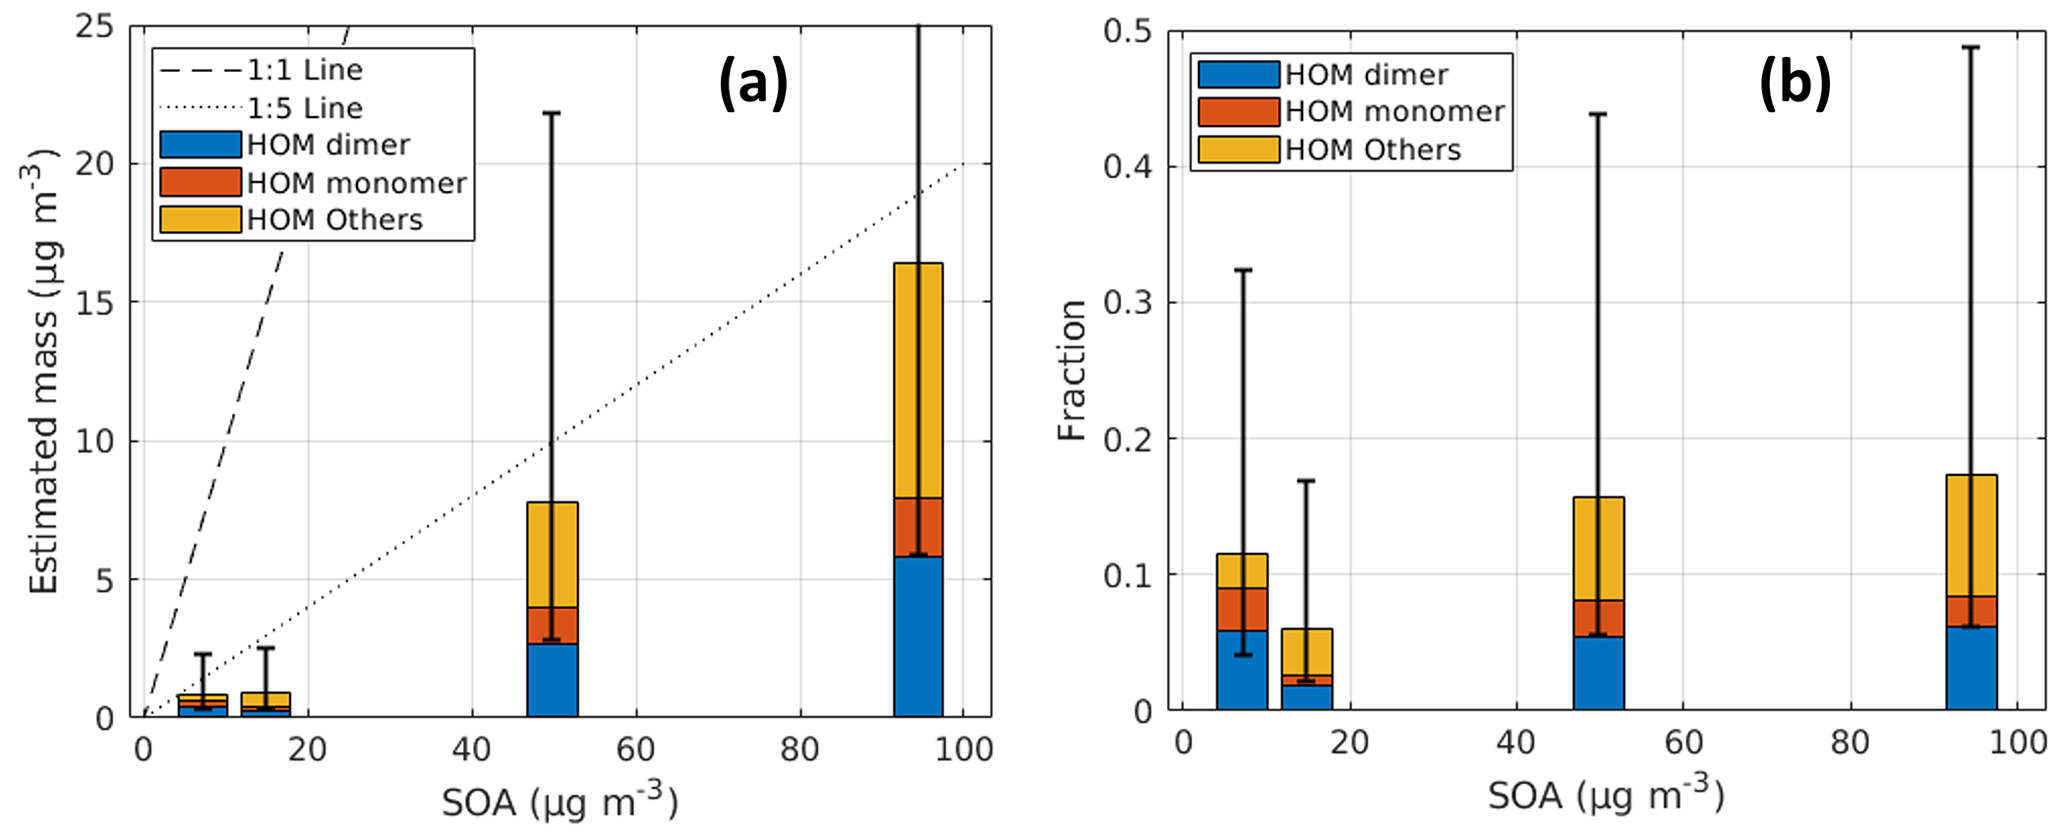
Figure 9Estimated (a) mass concentration and (b) mass fraction as a function of SOA mass concentration. HOM monomer, HOM dimer, and HOM others refer to C8-C10, C16-C20, and HOMs of other C numbers measured in the NO3-CIMS mass spectra. SOA mass concentrations were measured by the AMS.
3.4 Current challenges and future improvements
In the current design of the VIA–NO3-CIMS system, the time resolution of particle-phase HOM measurements (i.e., one entire temperature ramping-up and ramping-down cycle) is limited by the lack of a cooling system. Under ambient conditions, at least 20–30 min are needed for its natural cooling down to room temperature. In future works, actively cooling the vaporization tube can be considered. If the cooling rate is larger than the heating rate, one could control the cooling rate by controlling the heat supply to make the temperature decrease linearly. Thus, the measurements during the cooling stage can also be useful, doubling the duty cycle (if the time for ramping up and down is the same). This is feasible since we already showed that the results of ramping up and stepping down (Fig. 5) are quite comparable for most HOM species. Alternatively, the cooling stage can be used for the gas-phase HOM measurements. Then, a separate gas sampling line and an automatic valve would be needed to couple in the current system. If the hardware does not introduce limitations to the time resolution, then the next limitation comes when we start ramping rapidly enough that the shapes of the thermograms become noisy due to shorter data averaging at each temperature. Then, the correction factor based on fitting the thermograms would bear larger uncertainties. At this point, the feasible maximum ramping rate becomes a function of the aerosol loading.
The correction factor (i.e., the quantification) relies on the measured thermograms. The exact shape of the thermogram depends on the setup (e.g., flow rates and tubing length) and cannot be assumed to be universal. In our experience, the temperature ramping mode provides so much valuable information that we would recommend running in temperature ramping mode despite the poorer time resolution discussed above. Currently, a very large correction factor (∼ 3–9) is needed to quantitatively estimate the concentrations of the particle-phase HOMs, suggesting significant losses within the VIA system. On the one hand, the uncertainty of this correction factor could potentially be reduced significantly if the detection efficiency could be determined experimentally (i.e., mass concentration of standards measured by the VIA system vs. the SMPS). For example, using some known organic aerosol as the standards, this value could be determined or calibrated more exactly. This would yield better quantitative estimates of the particle-phase chemical composition. On the other hand, based on our experiments, (1) particle loss was < 10 % within the entire system based on the NaCl test, and (2) vapor loss was negligible for sulfuric acid and VOCs, indicating that nucleation/recondensation should be negligible and that less oxidized organics did not decompose during thermal desorption, respectively. However, the thermogram of HOMs indicates significant vapor loss after evaporation. Using larger diameters of the vaporization tube and larger sampling flow rates may help to reduce the vapor loss but would reduce the heat transfer at the same time. Then, the small working flow rates of the gas denuder would be the limiting factor. Packing several gas denuders in parallel can be one solution to run the system with larger flows while effectively removing the gaseous compounds. In that case, the sheath flow unit may need to be designed to couple with a different flow configuration.
The application of the VIA–NO3-CIMS system in the field will be one critical next step. In most cases, using the ramping mode is preferred, as the additional information from the thermograms aids both quantification and estimations of volatility. Fixing the thermal desorption temperature could be preferable under conditions where aerosol loadings are expected to change on short timescales, e.g., close to large primary emissions. In these cases, quantification is limited, but chemical information can be obtained from short-term plumes. As a compromise, most of the time measuring is done at one fixed temperature (which can evaporate the major fraction of OA), but running entire temperature scans routinely to get the correction factors, e.g., twice a day, could be an option. In addition, having an AMS or SMPS system after the VIA during scans at the same time would be very helpful to check if the particles evaporated completely. Though there would also be value in having an AMS/SMPS measuring ambient air all the time to provide information on how the total OA signal changes throughout a ramp. At some point, it is clear that the sensitivity of the VIA system becomes the limiting factor in capturing very fast changes in the composition. In comparison to other online techniques used for aerosol phase characterization, the VIA–NO3-CIMS system has both benefits and drawbacks. The NO3-CIMS was chosen due to its sensitivity and selectivity towards HOMs, which ultimately means that we can use it to measure OA composition with a low detection limit, but it will not be able to detect all the evaporated species. This was particularly clear from the fact that we do not detect any of the decomposition products of the HOMs, as they are going to be smaller and less oxygenated, whereby they do not readily cluster with the nitrate ions in our CIMS. In addition, we observed large decreases in reagent ions (and total ions counts) when temperatures increased. This variation might be related to flow changes under high temperatures, and we found out that particle mass loadings might also relate to it. Nevertheless, normalization to the reagent ions seems to work pretty well to compensate for the signal variations, yet with relatively lower signal-to-noise ratios.
Finally, although this work focused on the particle-phase HOM measurements by using a NO3-CIMS, the VIA could be adapted to other CI inlets or gas analyzers in general. Different types of detectors attached after the VIA could give us a more complete picture of the molecules in SOA particles. As mentioned in Sect. 3.1.2, negligible loss was observed for most of the tested VOC standards, indicating that much fewer wall losses would be expected if one put the VIA in front of a detector measuring less oxidized organic species in SOA particles, e.g., using an iodide CIMS or a PTR-TOF (Avery et al., 2023).
We have characterized the VIA–NO3-CIMS system and its ability to measure HOMs as a function of different parameters. The system used was the same as in previous studies (Häkkinen et al., 2023; Zhao et al., 2023), with the exception that a sheath flow unit was designed and used as an interface between the VIA and NO3-CIMS to decrease the vapor losses after evaporation. First, the performance of each component of the current VIA system was characterized. (1) The honeycomb-activated carbon denuder allows particles to pass through (> 95 % for AS particles larger than 50 nm) while removing gaseous compounds (> 97 % for tested VOCs) effectively. (2) The vaporization tube is capable of generating reproducible temperature profiles with working flow rates of 2–4 L min−1 and with a sub-second residence time (e.g., 0.045 s with 4 L min−1 at 300 °C), which is still enough to fully evaporate AS particles < 300 nm. The small residence time may be of benefit for the detection of (hydro)peroxides under thermal desorption using this system. In addition, particle losses, other than thermal desorption, were found to be < 10 % with NaCl particles, while a near-unity transmission was obtained for the tested VOCs in the vaporization tube at measurement temperatures, indicating great performances would be expected if coupling the VIA with a PTR-TOF or an iodide-CIMS.
Then, with an optimized setup to connect the sheath flow unit to the current VIA–NO3-CIMS system, we were able to obtain thermograms by using temperature-programmed thermal desorption for different aerosol particles, including AS, polyethylene glycol (PEG) mixtures, and α-pinene SOA particles. Unlike sulfuric acid, the decrease in signals after reaching the maximum in the thermograms of HOMs indicates significant vapor losses upon contact with the hot walls of the VIA. This loss potentially leads to fragmentation products that are not observable by the NO3-CIMS and need further investigation by coupling the VIA with a detector measuring less oxidized organic species. In general, the measured Tmax in the thermograms was ∼ 150 °C higher than the measurements of the FIGAERO-iodide-CIMS system, and this difference can be largely explained by the extremely short residence time within the heating area. Nevertheless, the linear relationship of the Tmax between these two systems indicates the potential to infer volatility information from the thermograms measured by the VIA–NO3-CIMS system. In addition, a one-dimensional model was used to simulate the evaporation and temperature-dependent wall losses of evaporated molecules within the VIA vaporization tube, allowing a quantitative estimate of the concentration of particle-phase HOMs. Overall, the coupling of the VIA and NO3-CIMS can be a promising and useful system for online measurements of HOMs in SOA particles.
As the raw dataset is extensive, we have included some tables in the supplementary material for comparisons. However, data are available upon request from the corresponding author.
The supplement related to this article is available online at: https://doi.org/10.5194/amt-17-1527-2024-supplement.
ME and JZ designed the study. JZ, VM, YL, EH, and JYZ conducted the experiments. JZ, VM, and YL analyzed the data. VM developed the model. JEK designed and built the original VIA used in this study. JK designed the sheath flow unit. ME, HT, MC, QZ, and DW provided support for the experimental setup and analysis methods. JZ and VM prepared the paper with contributions from all co-authors.
Douglas Worsnop and Manjula Canagaratna work for Aerodyne Research, Inc., which developed and commercialized the Vaporization Inlet for Aerosols (VIA) used in this study.
Publisher’s note: Copernicus Publications remains neutral with regard to jurisdictional claims made in the text, published maps, institutional affiliations, or any other geographical representation in this paper. While Copernicus Publications makes every effort to include appropriate place names, the final responsibility lies with the authors.
The authors thank Jing Cai, Nina Sarnela, and Lauriane Quéléver for the calibration of the NO3-CIMS and Pekka Rantala for technical support. The authors thank Arttu Ylisirniö and Siegfried Schobesberger for discussing and sharing the FIGAERO measurements.
This work was supported by funding from the Research Council of Finland (grant nos. 317380, 320094, 325656, 345982, and 346370) and a University of Helsinki 3-year grant (grant no. 75284132). Valter Mickwitz thanks Svenska Kultufonden (grant no. 190437) for financial support. Ella Häkkinen thanks the Vilho, Yrjö, and Kalle Väisälä Foundation for financial support. Frans Graeffe acknowledges Svenska Kulturfonden (grant nos. 167344 and 177923) for financial support.
Open-access funding was provided by the Helsinki University Library.
This paper was edited by Hartmut Herrmann and reviewed by two anonymous referees.
An, W. J., Pathak, R. K., Lee, B.-H., and Pandis, S. N.: Aerosol volatility measurement using an improved thermodenuder: Application to secondary organic aerosol, J. Aerosol Sci., 38, 305–314, https://doi.org/10.1016/j.jaerosci.2006.12.002, 2007.
Avery, A. M., Alton, M. W., Canagaratna, M. R., Krechmer, J. E., Sueper, D. T., Bhattacharyya, N., Hildebrandt Ruiz, L., Brune, W. H., and Lambe, A. T.: Comparison of the Yield and Chemical Composition of Secondary Organic Aerosol Generated from the OH and Cl Oxidation of Decamethylcyclopentasiloxane, ACS Earth Space Chem., 7, 218–229, https://doi.org/10.1021/acsearthspacechem.2c00304, 2023.
Bannan, T. J., Le Breton, M., Priestley, M., Worrall, S. D., Bacak, A., Marsden, N. A., Mehra, A., Hammes, J., Hallquist, M., Alfarra, M. R., Krieger, U. K., Reid, J. P., Jayne, J., Robinson, W., McFiggans, G., Coe, H., Percival, C. J., and Topping, D.: A method for extracting calibrated volatility information from the FIGAERO-HR-ToF-CIMS and its experimental application, Atmos. Meas. Tech., 12, 1429–1439, https://doi.org/10.5194/amt-12-1429-2019, 2019.
Bianchi, F., Kurtén, T., Riva, M., Mohr, C., Rissanen, M. P., Roldin, P., Berndt, T., Crounse, J. D., Wennberg, P. O., Mentel, T. F., Wildt, J., Junninen, H., Jokinen, T., Kulmala, M., Worsnop, D. R., Thornton, J. A., Donahue, N., Kjaergaard, H. G., and Ehn, M.: Highly Oxygenated Organic Molecules (HOM) from Gas-Phase Autoxidation Involving Peroxy Radicals: A Key Contributor to Atmospheric Aerosol, Chem. Rev., 119, 3472–3509, https://doi.org/10.1021/acs.chemrev.8b00395, 2019.
Bilde, M., Barsanti, K., Booth, M., Cappa, C. D., Donahue, N. M., Emanuelsson, E. U., McFiggans, G., Krieger, U. K., Marcolli, C., Topping, D., Ziemann, P., Barley, M., Clegg, S., Dennis-Smither, B., Hallquist, M., Hallquist, Å. M., Khlystov, A., Kulmala, M., Mogensen, D., Percival, C. J., Pope, F., Reid, J. P., Ribeiro da Silva, M. A. V., Rosenoern, T., Salo, K., Soonsin, V. P., Yli-Juuti, T., Prisle, N. L., Pagels, J., Rarey, J., Zardini, A. A., and Riipinen, I.: Saturation Vapor Pressures and Transition Enthalpies of Low-Volatility Organic Molecules of Atmospheric Relevance: From Dicarboxylic Acids to Complex Mixtures, Chem. Rev., 115, 4115–4156, https://doi.org/10.1021/cr5005502, 2015.
Burtscher, H., Baltensperger, U., Bukowiecki, N., Cohn, P., Hüglin, C., Mohr, M., Matter, U., Nyeki, S., Schmatloch, V., Streit, N., and Weingartner, E.: Separation of volatile and non-volatile aerosol fractions by thermodesorption: instrumental development and applications, J. Aerosol Sci., 32, 427–442, https://doi.org/10.1016/S0021-8502(00)00089-6, 2001.
Canagaratna, M., Jayne, J., Jimenez, J., Allan, J., Alfarra, M., Zhang, Q., Onasch, T., Drewnick, F., Coe, H., and Middlebrook, A.: Chemical and microphysical characterization of ambient aerosols with the aerodyne aerosol mass spectrometer, Mass Spectrom. Rev., 26, 185–222, https://doi.org/10.1002/mas.20115, 2007.
Cappa, C. D., Lovejoy, E. R., and Ravishankara, A. R.: Evidence for liquid-like and nonideal behavior of a mixture of organic aerosol components, P. Natl. Acad. Sci. USA, 105, 18687–18691, https://doi.org/10.1073/pnas.0802144105, 2008.
DeCarlo, P. F., Kimmel, J. R., Trimborn, A., Northway, M. J., Jayne, J. T., Aiken, A. C., Gonin, M., Fuhrer, K., Horvath, T., and Docherty, K. S.: Field-deployable, high-resolution, time-of-flight aerosol mass spectrometer, Anal. Chem., 78, 8281–8289, https://doi.org/10.1021/ac061249n, 2006.
Déméautis, T., Delles, M., Tomaz, S., Monneret, G., Glehen, O., Devouassoux, G., George, C., and Bentaher, A.: Pathogenic Mechanisms of Secondary Organic Aerosols, Chem. Res. Toxicol., 35, 1146–1161, https://doi.org/10.1021/acs.chemrestox.1c00353, 2022.
Ehn, M., Thornton, J. A., Kleist, E., Sipila, M., Junninen, H., Pullinen, I., Springer, M., Rubach, F., Tillmann, R., Lee, B., Lopez-Hilfiker, F., Andres, S., Acir, I. H., Rissanen, M., Jokinen, T., Schobesberger, S., Kangasluoma, J., Kontkanen, J., Nieminen, T., Kurten, T., Nielsen, L. B., Jorgensen, S., Kjaergaard, H. G., Canagaratna, M., Maso, M. D., Berndt, T., Petaja, T., Wahner, A., Kerminen, V. M., Kulmala, M., Worsnop, D. R., Wildt, J., and Mentel, T. F.: A large source of low-volatility secondary organic aerosol, Nature, 506, 476–479, https://doi.org/10.1038/nature13032, 2014.
Eichler, P., Müller, M., D'Anna, B., and Wisthaler, A.: A novel inlet system for online chemical analysis of semi-volatile submicron particulate matter, Atmos. Meas. Tech., 8, 1353–1360, https://doi.org/10.5194/amt-8-1353-2015, 2015.
Eisele, F. L. and Tanner, D. J.: Measurement of the gas phase concentration of H2SO4 and methane sulfonic acid and estimates of H2SO4 production and loss in the atmosphere, J. Geophys. Res.-Atmos., 98, 9001–9010, https://doi.org/10.1029/93JD00031, 1993.
Faulhaber, A. E., Thomas, B. M., Jimenez, J. L., Jayne, J. T., Worsnop, D. R., and Ziemann, P. J.: Characterization of a thermodenuder-particle beam mass spectrometer system for the study of organic aerosol volatility and composition, Atmos. Meas. Tech., 2, 15–31, https://doi.org/10.5194/amt-2-15-2009, 2009.
Fierz, M., Vernooij, M. G. C., and Burtscher, H.: An improved low-flow thermodenuder, J. Aerosol Sci., 38, 1163–1168, https://doi.org/10.1016/j.jaerosci.2007.08.006, 2007.
Fuller, E. N., Schettler, P. D., and Giddings, J. C.: NEW METHOD FOR PREDICTION OF BINARY GAS-PHASE DIFFUSION COEFFICIENTS, Indust. Eng. Chem., 58, 18–27, https://doi.org/10.1021/ie50677a007, 1966.
Gkatzelis, G. I., Hohaus, T., Tillmann, R., Gensch, I., Müller, M., Eichler, P., Xu, K.-M., Schlag, P., Schmitt, S. H., Yu, Z., Wegener, R., Kaminski, M., Holzinger, R., Wisthaler, A., and Kiendler-Scharr, A.: Gas-to-particle partitioning of major biogenic oxidation products: a study on freshly formed and aged biogenic SOA, Atmos. Chem. Phys., 18, 12969–12989, https://doi.org/10.5194/acp-18-12969-2018, 2018.
Goldstein, A. H. and Galbally, I. E.: Known and Unexplored Organic Constituents in the Earth's Atmosphere, Environ. Sci. Technol., 41, 1514–1521, https://doi.org/10.1021/es072476p, 2007.
Häkkinen, E., Zhao, J., Graeffe, F., Fauré, N., Krechmer, J. E., Worsnop, D., Timonen, H., Ehn, M., and Kangasluoma, J.: Online measurement of highly oxygenated compounds from organic aerosol, Atmos. Meas. Tech., 16, 1705–1721, https://doi.org/10.5194/amt-16-1705-2023, 2023.
Hallquist, M., Wenger, J. C., Baltensperger, U., Rudich, Y., Simpson, D., Claeys, M., Dommen, J., Donahue, N. M., George, C., Goldstein, A. H., Hamilton, J. F., Herrmann, H., Hoffmann, T., Iinuma, Y., Jang, M., Jenkin, M. E., Jimenez, J. L., Kiendler-Scharr, A., Maenhaut, W., McFiggans, G., Mentel, Th. F., Monod, A., Prévôt, A. S. H., Seinfeld, J. H., Surratt, J. D., Szmigielski, R., and Wildt, J.: The formation, properties and impact of secondary organic aerosol: current and emerging issues, Atmos. Chem. Phys., 9, 5155–5236, https://doi.org/10.5194/acp-9-5155-2009, 2009.
Heald, C. L. and Kroll, J. H.: The fuel of atmospheric chemistry: Toward a complete description of reactive organic carbon, Sci. Adv., 6, eaay8967, https://doi.org/10.1126/sciadv.aay8967, 2020.
Hearn, J. D. and Smith, G. D.: A chemical ionization mass spectrometry method for the online analysis of organic aerosols, Anal. chem., 76, 2820–2826, https://doi.org/10.1021/ac049948s, 2004.
Hearn, J. D. and Smith, G. D.: Reactions and mass spectra of complex particles using Aerosol CIMS, Int. J. Mass spectrom., 258, 95–103, https://doi.org/10.1016/j.ijms.2006.05.017, 2006.
Huey, L. G.: Measurement of trace atmospheric species by chemical ionization mass spectrometry: Speciation of reactive nitrogen and future directions, Mass Spectrom. Rev., 26, 166–184, https://doi.org/10.1002/mas.20118, 2007.
Huffman, J. A., Ziemann, P. J., Jayne, J. T., Worsnop, D. R., and Jimenez, J. L.: Development and Characterization of a Fast-Stepping/Scanning Thermodenuder for Chemically-Resolved Aerosol Volatility Measurements, Aerosol Sci. Technol., 42, 395–407, https://doi.org/10.1080/02786820802104981, 2008.
Hyttinen, N., Kupiainen-Määttä, O., Rissanen, M. P., Muuronen, M., Ehn, M., and Kurtén, T.: Modeling the Charging of Highly Oxidized Cyclohexene Ozonolysis Products Using Nitrate-Based Chemical Ionization, The J. Phys. Chem. A, 119, 6339–6345, https://doi.org/10.1021/acs.jpca.5b01818, 2015.
Isaacman-VanWertz, G., Massoli, P., O'Brien, R. E., Nowak, J. B., Canagaratna, M. R., Jayne, J. T., Worsnop, D. R., Su, L., Knopf, D. A., Misztal, P. K., Arata, C., Goldstein, A. H., and Kroll, J. H.: Using advanced mass spectrometry techniques to fully characterize atmospheric organic carbon: current capabilities and remaining gaps, Faraday Discuss., 200, 579–598, https://doi.org/10.1039/C7FD00021A, 2017.
Jokinen, T., Sipilä, M., Junninen, H., Ehn, M., Lönn, G., Hakala, J., Petäjä, T., Mauldin III, R. L., Kulmala, M., and Worsnop, D. R.: Atmospheric sulphuric acid and neutral cluster measurements using CI-APi-TOF, Atmos. Chem. Phys., 12, 4117–4125, https://doi.org/10.5194/acp-12-4117-2012, 2012.
Jokinen, T., Berndt, T., Makkonen, R., Kerminen, V. M., Junninen, H., Paasonen, P., Stratmann, F., Herrmann, H., Guenther, A. B., Worsnop, D. R., Kulmala, M., Ehn, M., and Sipila, M.: Production of extremely low volatile organic compounds from biogenic emissions: Measured yields and atmospheric implications, P. Natl. Acad. Sci. USA, 112, 7123–7128, https://doi.org/10.1073/pnas.1423977112, 2015.
Jordan, A., Haidacher, S., Hanel, G., Hartungen, E., Maerk, L., Seehauser, H., Schottkowsky, R., Sulzer, P., and Maerk, T. D.: A high resolution and high sensitivity proton-transfer-reaction time-of-flight mass spectrometer (PTR-TOF-MS), Int. J. Mass spectrom., 286, 122–128, https://doi.org/10.1016/j.ijms.2009.07.005, 2009.
Kang, E., Root, M. J., Toohey, D. W., and Brune, W. H.: Introducing the concept of Potential Aerosol Mass (PAM), Atmos. Chem. Phys., 7, 5727–5744, https://doi.org/10.5194/acp-7-5727-2007, 2007.
Krechmer, J. E., Pagonis, D., Ziemann, P. J., and Jimenez, J. L.: Quantification of Gas-Wall Partitioning in Teflon Environmental Chambers Using Rapid Bursts of Low-Volatility Oxidized Species Generated in Situ, Environ. Sci. Technol., 50, 5757–5765, https://doi.org/10.1021/acs.est.6b00606, 2016.
Krieger, U. K., Siegrist, F., Marcolli, C., Emanuelsson, E. U., Gøbel, F. M., Bilde, M., Marsh, A., Reid, J. P., Huisman, A. J., Riipinen, I., Hyttinen, N., Myllys, N., Kurtén, T., Bannan, T., Percival, C. J., and Topping, D.: A reference data set for validating vapor pressure measurement techniques: homologous series of polyethylene glycols, Atmos. Meas. Tech., 11, 49–63, https://doi.org/10.5194/amt-11-49-2018, 2018.
Kulmala, M., Petäjä, T., Ehn, M., Thornton, J., Sipilä, M., Worsnop, D. R., and Kerminen, V.-M.: Chemistry of Atmospheric Nucleation: On the Recent Advances on Precursor Characterization and Atmospheric Cluster Composition in Connection with Atmospheric New Particle Formation, Annu. Rev. Phys. Chem., 65, 21–37, https://doi.org/10.1146/annurev-physchem-040412-110014, 2014.
Kuniyal, J. C. and Guleria, R. P.: The current state of aerosol-radiation interactions: A mini review, J. Aerosol Sci., 130, 45–54, https://doi.org/10.1016/j.jaerosci.2018.12.010, 2019.
Kurten, A., Rondo, L., Ehrhart, S., and Curtius, J.: Calibration of a chemical ionization mass spectrometer for the measurement of gaseous sulfuric acid, The journal of physical chemistry. A, 116, 6375–6386, https://doi.org/10.1021/jp212123n, 2012.
Lambe, A. T., Ahern, A. T., Williams, L. R., Slowik, J. G., Wong, J. P. S., Abbatt, J. P. D., Brune, W. H., Ng, N. L., Wright, J. P., Croasdale, D. R., Worsnop, D. R., Davidovits, P., and Onasch, T. B.: Characterization of aerosol photooxidation flow reactors: heterogeneous oxidation, secondary organic aerosol formation and cloud condensation nuclei activity measurements, Atmos. Meas. Tech., 4, 445–461, https://doi.org/10.5194/amt-4-445-2011, 2011.
Lee, C. P., Surdu, M., Bell, D. M., Dommen, J., Xiao, M., Zhou, X., Baccarini, A., Giannoukos, S., Wehrle, G., Schneider, P. A., Prevot, A. S. H., Slowik, J. G., Lamkaddam, H., Wang, D., Baltensperger, U., and El Haddad, I.: High-frequency gaseous and particulate chemical characterization using extractive electrospray ionization mass spectrometry (Dual-Phase-EESI-TOF), Atmos. Meas. Tech., 15, 3747–3760, https://doi.org/10.5194/amt-15-3747-2022, 2022.
Li, H., Almeida, T. G., Luo, Y., Zhao, J., Palm, B. B., Daub, C. D., Huang, W., Mohr, C., Krechmer, J. E., Kurtén, T., and Ehn, M.: Fragmentation inside proton-transfer-reaction-based mass spectrometers limits the detection of ROOR and ROOH peroxides, Atmos. Meas. Tech., 15, 1811–1827, https://doi.org/10.5194/amt-15-1811-2022, 2022.
Li, X., Li, Y., Lawler, M. J., Hao, J., Smith, J. N., and Jiang, J.: Composition of Ultrafine Particles in Urban Beijing: Measurement Using a Thermal Desorption Chemical Ionization Mass Spectrometer, Environ. Sci. Technol., 55, 2859–2868, https://doi.org/10.1021/acs.est.0c06053, 2021.
Lopez-Hilfiker, F. D., Mohr, C., Ehn, M., Rubach, F., Kleist, E., Wildt, J., Mentel, Th. F., Lutz, A., Hallquist, M., Worsnop, D., and Thornton, J. A.: A novel method for online analysis of gas and particle composition: description and evaluation of a Filter Inlet for Gases and AEROsols (FIGAERO), Atmos. Meas. Tech., 7, 983–1001, https://doi.org/10.5194/amt-7-983-2014, 2014.
Lopez-Hilfiker, F. D., Mohr, C., Ehn, M., Rubach, F., Kleist, E., Wildt, J., Mentel, Th. F., Carrasquillo, A. J., Daumit, K. E., Hunter, J. F., Kroll, J. H., Worsnop, D. R., and Thornton, J. A.: Phase partitioning and volatility of secondary organic aerosol components formed from α-pinene ozonolysis and OH oxidation: the importance of accretion products and other low volatility compounds, Atmos. Chem. Phys., 15, 7765–7776, https://doi.org/10.5194/acp-15-7765-2015, 2015.
Lopez-Hilfiker, F. D., Pospisilova, V., Huang, W., Kalberer, M., Mohr, C., Stefenelli, G., Thornton, J. A., Baltensperger, U., Prevot, A. S. H., and Slowik, J. G.: An extractive electrospray ionization time-of-flight mass spectrometer (EESI-TOF) for online measurement of atmospheric aerosol particles, Atmos. Meas. Tech., 12, 4867–4886, https://doi.org/10.5194/amt-12-4867-2019, 2019.
Matsunaga, A. and Ziemann, P. J.: Gas-Wall Partitioning of Organic Compounds in a Teflon Film Chamber and Potential Effects on Reaction Product and Aerosol Yield Measurements, Aerosol Sci. Technol., 44, 881–892, https://doi.org/10.1080/02786826.2010.501044, 2010.
Murphy, D. M.: The design of single particle laser mass spectrometers, Mass Spectrom. Rev., 26, 150–165, https://doi.org/10.1002/mas.20113, 2007.
Müller, M., Eichler, P., D'Anna, B., Tan, W., and Wisthaler, A.: Direct Sampling and Analysis of Atmospheric Particulate Organic Matter by Proton-Transfer-Reaction Mass Spectrometry, Anal. chem., 89, 10889–10897, https://doi.org/10.1021/acs.analchem.7b02582, 2017.
Peng, Y., Wang, H., Gao, Y., Jing, S., Zhu, S., Huang, D., Hao, P., Lou, S., Cheng, T., Huang, C., and Zhang, X.: Real-time measurement of phase partitioning of organic compounds using a proton-transfer-reaction time-of-flight mass spectrometer coupled to a CHARON inlet, Atmos. Meas. Tech., 16, 15–28, https://doi.org/10.5194/amt-16-15-2023, 2023.
Peräkylä, O., Riva, M., Heikkinen, L., Quéléver, L., Roldin, P., and Ehn, M.: Experimental investigation into the volatilities of highly oxygenated organic molecules (HOMs) , Atmos. Chem. Phys., 20, 649–669, https://doi.org/10.5194/acp-20-649-2020, 2020.
Reischl, G. P., Mäkelä, J. M., and Necid, J.: Performance of Vienna Type Differential Mobility Analyzer at 1.2–20 Nanometer, Aerosol Sci. Technol., 27, 651–672, https://doi.org/10.1080/02786829708965503, 1997.
Ren, S., Yao, L., Wang, Y., Yang, G., Liu, Y., Li, Y., Lu, Y., Wang, L., and Wang, L.: Volatility parameterization of ambient organic aerosols at a rural site of the North China Plain, Atmos. Chem. Phys., 22, 9283–9297, https://doi.org/10.5194/acp-22-9283-2022, 2022.
Schobesberger, S., D'Ambro, E. L., Lopez-Hilfiker, F. D., Mohr, C., and Thornton, J. A.: A model framework to retrieve thermodynamic and kinetic properties of organic aerosol from composition-resolved thermal desorption measurements, Atmos. Chem. Phys., 18, 14757–14785, https://doi.org/10.5194/acp-18-14757-2018, 2018.
Smith, J. N., Moore, K. F., McMurry, P. H., and Eisele, F. L.: Atmospheric measurements of sub-20 nm diameter particle chemical composition by thermal desorption chemical ionization mass spectrometry, Aerosol Sci. Technol., 38, 100–110, https://doi.org/10.1080/02786820490249036, 2004.
Stark, H., Yatavelli, R. L. N., Thompson, S. L., Kang, H., Krechmer, J. E., Kimmel, J. R., Palm, B. B., Hu, W., Hayes, P. L., Day, D. A., Campuzano-Jost, P., Canagaratna, M. R., Jayne, J. T., Worsnop, D. R., and Jimenez, J. L.: Impact of Thermal Decomposition on Thermal Desorption Instruments: Advantage of Thermogram Analysis for Quantifying Volatility Distributions of Organic Species, Environ. Sci. Technol., 51, 8491–8500, https://doi.org/10.1021/acs.est.7b00160, 2017.
Tang, M. J., Cox, R. A., and Kalberer, M.: Compilation and evaluation of gas phase diffusion coefficients of reactive trace gases in the atmosphere: volume 1. Inorganic compounds, Atmos. Chem. Phys., 14, 9233–9247, https://doi.org/10.5194/acp-14-9233-2014, 2014.
Tang, M. J., Shiraiwa, M., Pöschl, U., Cox, R. A., and Kalberer, M.: Compilation and evaluation of gas phase diffusion coefficients of reactive trace gases in the atmosphere: Volume 2. Diffusivities of organic compounds, pressure-normalised mean free paths, and average Knudsen numbers for gas uptake calculations, Atmos. Chem. Phys., 15, 5585–5598, https://doi.org/10.5194/acp-15-5585-2015, 2015.
Thornton, J. A., Mohr, C., Schobesberger, S., D'Ambro, E. L., Lee, B. H., and Lopez-Hilfiker, F. D.: Evaluating Organic Aerosol Sources and Evolution with a Combined Molecular Composition and Volatility Framework Using the Filter Inlet for Gases and Aerosols (FIGAERO), Account. Chem. Res., 53, 1415–1426, https://doi.org/10.1021/acs.accounts.0c00259, 2020.
Villani, P., Picard, D., Marchand*, N., and Laj, P.: Design and Validation of a 6-Volatility Tandem Differential Mobility Analyzer (VTDMA), Aerosol Sci. Technol., 41, 898–906, https://doi.org/10.1080/02786820701534593, 2007.
Voisin, D., Smith, J. N., Sakurai, H., McMurry, P. H., and Eisele, F. L.: Thermal Desorption Chemical Ionization Mass Spectrometer for Ultrafine Particle Chemical Composition, Aerosol Sci. Technol., 37, 471–475, https://doi.org/10.1080/02786820300959, 2003.
Wehner, B., Philippin, S., and Wiedensohler, A.: Design and calibration of a thermodenuder with an improved heating unit to measure the size-dependent volatile fraction of aerosol particles, J. Aerosol Sci., 33, 1087–1093, https://doi.org/10.1016/S0021-8502(02)00056-3, 2002.
Ylisirniö, A., Buchholz, A., Mohr, C., Li, Z., Barreira, L., Lambe, A., Faiola, C., Kari, E., Yli-Juuti, T., Nizkorodov, S. A., Worsnop, D. R., Virtanen, A., and Schobesberger, S.: Composition and volatility of secondary organic aerosol (SOA) formed from oxidation of real tree emissions compared to simplified volatile organic compound (VOC) systems , Atmos. Chem. Phys., 20, 5629–5644, https://doi.org/10.5194/acp-20-5629-2020, 2020.
Ylisirniö, A., Barreira, L. M. F., Pullinen, I., Buchholz, A., Jayne, J., Krechmer, J. E., Worsnop, D. R., Virtanen, A., and Schobesberger, S.: On the calibration of FIGAERO-ToF-CIMS: importance and impact of calibrant delivery for the particle-phase calibration, Atmos. Meas. Tech., 14, 355–367, https://doi.org/10.5194/amt-14-355-2021, 2021.
Yuan, B., Koss, A. R., Warneke, C., Coggon, M., Sekimoto, K., and de Gouw, J. A.: Proton-Transfer-Reaction Mass Spectrometry: Applications in Atmospheric Sciences, Chem. Rev., 117, 13187–13229, https://doi.org/10.1021/acs.chemrev.7b00325, 2017.
Zahardis, J., Geddes, S., and Petrucci, G. A.: Improved Understanding of Atmospheric Organic Aerosols via Innovations in Soft Ionization Aerosol Mass Spectrometry, Anal. chem., 83, 2409–2415, https://doi.org/10.1021/ac102737k, 2011.
Zhang, Q., Jimenez, J. L., Canagaratna, M. R., Allan, J. D., Coe, H., Ulbrich, I., Alfarra, M. R., Takami, A., Middlebrook, A. M., Sun, Y. L., Dzepina, K., Dunlea, E., Docherty, K., DeCarlo, P. F., Salcedo, D., Onasch, T., Jayne, J. T., Miyoshi, T., Shimono, A., Hatakeyama, S., Takegawa, N., Kondo, Y., Schneider, J., Drewnick, F., Borrmann, S., Weimer, S., Demerjian, K., Williams, P., Bower, K., Bahreini, R., Cottrell, L., Griffin, R. J., Rautiainen, J., Sun, J. Y., Zhang, Y. M., and Worsnop, D. R.: Ubiquity and dominance of oxygenated species in organic aerosols in anthropogenically-influenced Northern Hemisphere midlatitudes, Geophys. Res. Lett., 34, 13, https://doi.org/10.1029/2007gl029979, 2007.
Zhang, Q., Jimenez, J. L., Canagaratna, M. R., Ulbrich, I. M., Ng, N. L., Worsnop, D. R., and Sun, Y.: Understanding atmospheric organic aerosols via factor analysis of aerosol mass spectrometry: a review, Anal. Bioanal. Chem., 401, 3045–3067, https://doi.org/10.1007/s00216-011-5355-y, 2011.
Zhao, J., Häkkinen, E., Graeffe, F., Krechmer, J. E., Canagaratna, M. R., Worsnop, D. R., Kangasluoma, J., and Ehn, M.: A combined gas- and particle-phase analysis of highly oxygenated organic molecules (HOMs) from α-pinene ozonolysis, Atmos. Chem. Phys., 23, 3707–3730, https://doi.org/10.5194/acp-23-3707-2023, 2023.