the Creative Commons Attribution 4.0 License.
the Creative Commons Attribution 4.0 License.
 | 08 Apr 2024
Evaluation of Aeris mid-infrared absorption (MIRA), Picarro CRDS (cavity ring-down spectroscopy) G2307, and dinitrophenylhydrazine (DNPH)-based sampling for long-term formaldehyde monitoring efforts
Asher P. Mouat
Zelda A. Siegel
Jennifer Kaiser
Current formaldehyde (HCHO) measurement networks rely on the TO-11A offline chemical derivatization technique, which can be resource intensive and limited in temporal resolution. In this work, we evaluate the field performance of three new commercial instruments for continuous in situ formaldehyde monitoring: the Picarro cavity ring-down spectroscopy G2307 gas concentration analyzer and Aeris Technologies' mid-infrared absorption Pico and Ultra gas analyzers. All instruments require regular drift correction, which is accomplished through instrument zeroing using dinitrophenylhydrazine (DNPH)-coated cartridges, Drierite, or molecular sieves, while heated Hopcalite failed to remove all incoming HCHO. We show that a modified precision estimate accounting for regular instrument zeroing results in values of 0.09, 0.20, and 0.22 ppb at a 20 min integration time for the G2307, Ultra, and Pico, respectively. After applying standard addition and dynamic dilution calibrations, all instruments agreed within 13 % and were well correlated with each other (all r ≥ 0.90). TO-11A HCHO observations resulted in a normalized mean bias of −58 % compared to co-located Picarro G2307 measurements (r=0.62, slope = 0.38, int = 0.07 ppb HCHO). Using a 6-month deployment period in the Atlanta metropolitan area, we determined that the Picarro G2307 and Aeris units have sufficient accuracy and precision to capture the Atlanta spatial HCHO gradient. We find that midday HCHO concentrations have decreased by 22.3 % since 1999 in the city's urban core, and DNPH measurements at a nearby Photochemical Assessment Monitoring Station (PAMS) site show a greater decrease of 53 %.
- Article
(2221 KB) - Full-text XML
- BibTeX
- EndNote


Observations of formaldehyde (HCHO) provide useful insight into the photochemical formation of secondary pollutants and the sources and fate of volatile organic compounds (VOCs). While direct emissions of HCHO from wildfires, the biosphere, and anthropogenic activities can contribute to ambient mixing ratios (Parrish et al., 2012; Lui et al., 2017; Luecken et al., 2018; Alvarado et al., 2020; Wu et al., 2021), regional HCHO abundance is generally governed by secondary production (Parrish et al., 2012; Zhang et al., 2013; Zhu et al., 2014; Luecken et al., 2018; Zeng et al., 2019). Because HCHO photolysis and oxidation are sources of HOx radicals, HCHO loss can further propagate oxidative chemistry (Tonnesen and Dennis, 2000; Lin et al., 2012; Valin et al., 2016; Wolfe et al., 2019; Yang et al., 2021). Additionally, HCHO is a known carcinogen ranking highest in health risks among the 187 hazardous air pollutants listed by the US Environmental Protection Agency (EPA) in the Clean Air Act (Scheffe et al., 2016; Strum and Scheffe, 2016; Zhu et al., 2017b). Due to its central role in atmospheric chemistry, HCHO is a target molecule at EPA Photochemical Assessment Monitoring Station (PAMS) and National Air Toxics Trends Station (NATTS) network sites for which observations are typically included in chemically comprehensive field intensives.
Since 1990, the standard EPA approach for HCHO measurements is collection on 2,4-dinitrophenylhydrazine (DNPH)-coated cartridges followed by offline derivative detection via high-performance liquid chromatography (HPLC), known as the TO-11A method (U.S. Epa, 1999). Sample collection and analysis are resource and labor intensive with measurements typically reported over sampling times that are on the order of hours. EPA TO-11A measurements in the PAMS and NATTS are 8 or 24 h integrated samples collected every 3 or 6 d, respectively. The low time resolution limits the usefulness of observations for studies of both photochemistry and air toxics exposure. Previous approaches have used modeled diel cycles or satellite-based observations in combination with the TO-11A method to infer ground-based diel cycles (Zhu et al., 2017a, b; Wang et al., 2022). However, this DNPH method of capturing HCHO has known interferences from NO2 and O3 (Karst et al., 1993; Achatz et al., 1999; Tang et al., 2004), can be impacted by relative humidity (RH) (Wisthaler et al., 2008; Uchiyama et al., 2009; Ho et al., 2014), and has had mixed results in comparison to research-grade observations (Hak et al., 2005; Wisthaler et al., 2008; Dunne et al., 2018), making the accuracy of these inferred diel cycles difficult to determine. While other studies have demonstrated the feasibility for continuous measurements via various spectroscopy-based methods (Yokelson et al., 1999; Cardenas et al., 2000; Dasgupta et al., 2005; Hak et al., 2005; Spinei et al., 2018; St. Clair et al., 2019; Dugheri et al., 2021), the number of multi-month, ground-based, continuous, in situ HCHO measurements is limited to a handful of studies, all of which employ a proton-transfer-reaction mass spectrometer (Warneke et al., 2013; Hansen et al., 2014; Coggon et al., 2021).
A HCHO monitoring instrument more suitable for long-term deployment would reduce manual labor and provide continuous observations, experience little or correctable drift in instrument baseline and sensitivity, and have low uncertainty and sufficient precision at typical ambient concentrations. In recent years, several commercially available instruments have been developed towards that goal, including a cavity ring-down spectroscopy (CRDS) instrument from Picarro, a photoacoustic gas analyzer from Gasera, and tunable diode laser spectroscopy (TDLS) instruments from Aeris Technologies and Aerodyne Research, Inc. Here, we focus on the Aeris mid-infrared absorption (MIRA) and Picarro CRDS G2307 instruments, which have been compared against other instruments in a small number of informal (Whitehill et al., 2018; Furdyna, 2020) and peer-reviewed (Shutter et al., 2019; Glowania et al., 2021) intercomparison efforts. Glowania et al. (2021) is the only peer-reviewed work to employ a G2307 using the current spectral fitting algorithm (version 1.6.015), which updates the procedure for fitting at low humidity. The Aeris Ultra, which offers improved thermal stabilization over the Aeris Pico, has not previously been examined in literature. Whereas previous comparisons were conducted either in controlled chamber studies or through the analysis of short-term ambient observations, a full characterization of instrument suitability in measurement networks requires multi-month deployment.
Previous intercomparisons involving either Aeris MIRA or Picarro CRDS instruments have highlighted concerns with measurement accuracy as a function of ambient humidity. The Aeris MIRA technique relies on a HDO (deuterated water) line (located at 2831.8413 cm−1) for spectral referencing. At low humidity (< 0.2 % H2O), the Aeris Real-Time (ART) fitting algorithm cannot reliably reference its HDO spectral feature, and the instrument fails to produce measurements (Shutter et al., 2019). Including CH4 as a secondary spectral reference in data post-processing extends the range of conditions under which the Aeris instruments work, though the instrument's precision decreases by a factor of 1.2±0.3. While the G2307 fitting algorithm uses both H2O and CH4 spectral references, CH4 fitting currently remains a research approach for ART. Whitehill et al. (2018) found an inverse correlation between Picarro HCHO measurements and instrument-reported water mixing ratios at typical ambient concentrations and, along with Furdyna (2020), observed that the G2307's measurements were lower by 1–2 ppb HCHO compared to DNPH-based measurements. Glowania et al. (2021) found that variable humidity can decrease reported HCHO concentrations by as much as 1.75 ppb with the most significant offsets at ≤ 0.2 % H2O where the H2O spectral feature is not clearly observed.
Both the Picarro and Aeris instruments periodically sample HCHO-free air to determine an instrument baseline. Several scrubbers are capable of removing HCHO, the most common of which are DNPH-coated cartridges (DNPH), heated catalytic hydrocarbon scrubbers like oxides of copper and manganese (Hopcalite, HO), calcium sulfate (Drierite, DR), and molecular sieves (MS) (Herndon et al., 2007; Cazorla et al., 2015; Pei et al., 2015; Shutter et al., 2019; St. Clair et al., 2019; Fried et al., 2020). These methods differ in removal mechanism, molecular selectivity, and desiccation efficiency. DNPH-coated cartridges are recommended by Aeris Technologies and are chemically selective for carbonyls, thus allowing the majority of H2O to pass through. Heated HO is expected to oxidize HCHO to CO, forming H2O as a by-product and providing a humidified airstream that may also be suitable for baseline determination. Picarro Inc. recommends instrument zeroing via adsorption by DR. A column of MS is often plumbed in the upstream area of a DR column (DR + MS) as it both desiccates the gas flowing through it and, with the right pore size, removes molecules with kinetic diameters greater than that of HCHO. This both prevents the DR from becoming saturated and prolongs its HCHO-removal efficiency as only smaller organic compounds can adsorb to it. HO and DR + MS may be less cost-intensive and longer-lasting and have a comparable HCHO-removal efficiency to DNPH-coated cartridges. However, since humidity is known to impact HCHO concentrations, the impact of scrubber choice on overall measurement accuracy is unclear.
We use HCHO measurements taken over 1 year in Atlanta, GA, from the Picarro G2307 and the Aeris instruments with aims to determine the best calibration procedures and optimal measurement configurations and to assess the suitability for remote, continuous operation. We compare co-located observations from all three monitors as well as observations from the Picarro G2307 and TO-11A DNPH analysis. For each continuous monitor, we assess the performance over a range of zeroing methods and ambient humidities. Finally, we demonstrate the use of Picarro G2307 and Aeris Ultra and Pico measurements for long-term, continuous observations of HCHO spatial gradients in an urban environment and discuss the feasibility of deploying these instruments to form a spatiotemporally comprehensive network.
2.1 Picarro G2307
2.1.1 CRDS operating principles
The operating principle of cavity ring-down spectroscopy as used by the G2307 is described fully in Glowania et al. (2021) and briefly summarized here. Air is pulled through a temperature- and pressure-controlled cavity at a rate of 0.4 standard liters per minute (SLPM). Laser light is directed into the resonance cavity, where three high-reflectivity mirrors create effective path lengths on the kilometer scale. After the laser is shut off, the small amount of light transmitted through one mirror is monitored via photodetector. Detected light exponentially decays, with faster decay rates corresponding to higher absorption of light in the cavity. An on-board wavelength monitor measures the absolute laser wavelength with a precision that is 3 orders of magnitude narrower than the HCHO spectral linewidth. The instrument can change the voltage applied to the laser and tune it to wavelengths that HCHO is known to either minimally or maximally absorb at, producing closely clustered spectral features at and around the HCHO absorption peak. The laser scans the 5625.5 to 5626.5 cm−1 wavelength range at a 100 Hz repetition rate, while the length of the cavity is adjusted to achieve resonance. On-board spectral fitting and signal averaging results in measurements of HCHO, CH4, and H2O reported at 1 Hz. The unit assessed in this work utilizes the same spectral fitting algorithm as described in Glowania et al. (2021).
2.1.2 Determining instrument baseline
The G2307 measurements reported here differ from prior studies primarily in that we employed an external zeroing system. The system is equipped to sample from either DNPH (Supelco LpDNPH S10L), DR (Drierite, 8 mesh, > 98 % CaSO4, < 2 % CoCl2), or DR + MS (Sigma Aldrich molecular sieve, 3 A pore size zeolite beads) to regularly monitor and correct the instrument's baseline. The baseline is defined throughout this work as the signal reported by the instrument when sampling from a HCHO-free source and drift as the rate of change in the baseline. This setup was accomplished by connecting the G2307 inlet to a three-way perfluoroalkoxy (PFA) solenoid valve which alternated between an ambient sampling line and a zeroing line. The zeroing line was then connected to another three-way PFA solenoid valve to which the scrubbers were attached. The instrument sampled from DR or DR + MS for 5 min of every hour. Every fourth hour, the instrument sampled for 5 min through DNPH either directly before or after sampling from DR. The relative order of DR/DNPH sampling was found to have no impact on reported instrument baselines.
2.1.3 Humidity dependence
Two trials were performed to quantify the impact of humidity on G2307 measurements. HCHO-free air was provided by either a zero-air (ZA) generator (Tofwerk) with a DR column (trial 1) or an Airgas ultra zero grade air cylinder (trial 2). The ZA generator uses a platinum catalyst heated to 400 °C and requires the DR column as it does not remove water vapor. A portion of the ZA stream was humidified by using a bubbler containing high-purity water (Barnstead GenPure Pro, 18.2 MΩ cm resistivity, < 5 ppb total organic carbon). The fraction of ZA humidified was varied using a mass flow controller such that the measured water vapor mole fraction ranged from 0.05 %–1.7 %.
Figure 1 shows the reported HCHO concentrations in HCHO-free air as a function of measured % H2O. As reported in Glowania et al. (2021), data fell into two linear regimes with a demarcation at 0.2 % H2O. Data were averaged to 5 min and each regime fitted using a York regression (York et al., 2004) with standard deviations of the measurements used as uncertainty. We find significantly smaller slopes (lower H2O influence) than Glowania et al. (2021), indicating that humidity dependencies may be instrument-specific. The HCHO offset is defined in Eq. (1):
where [HCHO]offset (ppb) accounts for the HCHO signal lost at some % H2O and [H2O] is the corresponding instrument-reported % H2O mole fraction.
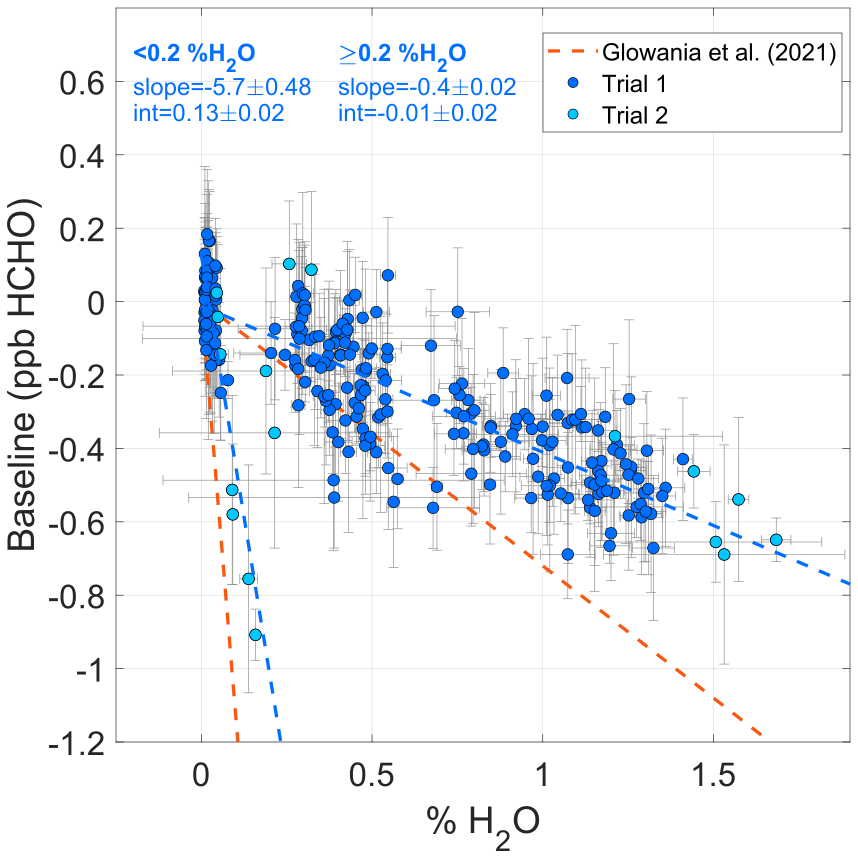
Figure 1Picarro G2307 HCHO concentrations as a function of measured H2O concentrations. Regressions for the two H2O spectral fitting regimes are plotted alongside the slopes from Glowania et al. (2021). Error bars are the standard deviation in instrument baseline or % H2O for each 5 min averaged point.
Depending on the instrument zeroing method, ambient and baseline humidities may be very different. These differences could lead to significant biases in reported HCHO differential measurements. For example, Fig. 1 suggests the use of a desiccant such as DR, for sampling ambient air at 1 % H2O would generate a bias of −0.4 ppb if the humidity dependence is not corrected. We emphasize the importance of experimentally determining a correction factor for humidity effects before deployment.
2.1.4 Data processing
Averaged HCHO datasets at variable time resolutions (1–60 min) were created from the 1 Hz data using the following procedure: first, all 1 Hz data were corrected for humidity effects by subtracting the [HCHO]offset from Eq. (1). Observations made within 30 s of a valve change were removed and baseline measurements were then averaged to 4.5 min points and linearly interpolated to create an instrument background on the same time basis as ambient data. The interpolated baseline was subtracted from the 1 Hz ambient measurements. Baseline-corrected ambient data were averaged to the desired time resolution with any periods having < 50 % data completeness discarded. Data were further screened to exclude points where scrubbers were exhausted and therefore unreliable.
2.1.5 Impact of scrubber choice – DNPH, DR, and DR + MS
Before comparing scrubbers, we first examine the HCHO-removal efficiency of DNPH compared to a ZA generator. We find instrument baselines were on average 14 ppt larger than those measured using a ZA generator. This difference was consistent whether sampling the indoor conditions or ambient air. This difference is not statistically significant given the instrument precision and accuracy determined later in Sect. 3. We note DNPH initially off-gases material that produces spectral interferences that subside after a “burn-in” period of ∼ 2 h. It is possible that off-gassing material could have negative effects on instrument performance if used the long term (e.g., mirror degradation). These impacts were not seen in our study and would require further investigation.
The impact of DR and DR + MS on the Picarro G2307's baseline was then assessed using ambient measurements taken from the consecutive sampling of DNPH and DR/DR + MS in the ambient sequencer schedule. We combine the DR and DR + MS measurements as we find the two methods produce baselines with a relative difference that is within instrument measurement uncertainty. The 4.5 min averaged baselines are shown in Fig. 2. Both scrubbing methods produced normally distributed baseline measurements with means and standard deviations of ppb (DNPH) and ppb (DR/DR + MS) and an average absolute difference of < 0.03 ppb HCHO. This difference is finer than the 5 min precision of the instrument and demonstrates a comparable performance between the two scrubbing methods.
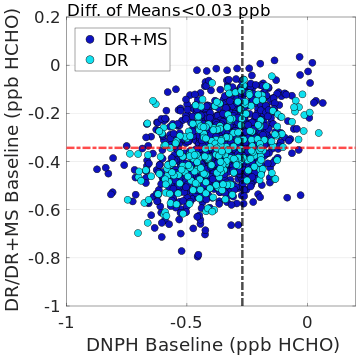
Figure 2Picarro G2307 baselines determined using the DR, DR + MS, or DNPH-scrubbing methods. Each data point represents a consecutive, 4.5 min averaged DNPH and DR baseline measurement while sampling ambient air.
Previous studies have noted that derivatization of hydrazine to hydrazone, which is the reaction that functionally captures HCHO in the DNPH-coated cartridge, is slowed or stopped at RH < 15 % (Wisthaler et al., 2008; Uchiyama et al., 2009). Few days throughout the G2307's deployment fell below this threshold, and RH (converted from instrument-reported % H2O using indoor conditions) was always ≥ 25 %. While low RH likely did not affect our measurements, we note this is a limitation on DNPH as deployment in arid locations could hamper performance, whereas DR/DR + MS would operate unaffected.
Ho et al. (2014) found that high temperatures (> 22 °C) and RH (> 50 %) led to DNPH-HPLC analysis underestimating ambient HCHO by 35 %–80 %. This could inflate instrument baselines as summer 2022 in Atlanta regularly exceeded these values, with DNPH-derived baselines in Fig. 2 having RH values in the range of 7 %–87 %. As DR baselines are determined using desiccated air and the average baseline difference with DNPH is within instrument precision, we conclude measurements are not significantly affected at high RH. These results lead us to conclude that either DR/DR + MS or DNPH usage with the G2307 is advisable so long as humidity corrections are applied.
2.1.6 Instrument calibration
Single-point and dynamic dilution calibrations were conducted at the beginning, middle, and end of the G2307's deployment. Single-point calibrations were performed by flowing a concentrated standard (Apel Riemer: 1015 ppb ± 5 %; Airgas: 1031 ppb ± 10 %; or Airgas: 1044 ± 10 %) through a SilcoNert-coated stainless-steel (SS) regulator and directly into the instrument. This configuration avoids interaction between the calibration gas and stainless-steel surfaces, thereby reducing passivation times to sub-hour lengths. However, this technique relies on the assumption that observations are linear from 0–1 ppm HCHO. The single-point measured concentration was determined as the instrument-reported concentration multiplied by an N2–air matrix conversion factor of 1.0625 (Bent et al., 2023).
Dynamic dilution calibrations were performed by diluting the HCHO standards with ZA from either a Tofwerk ZA generator or an ultra-ZA cylinder. After a 5 h passivation time at ∼ 200 ppb HCHO, concentrations were varied in the 0–40 ppb range. Each concentration step was 3 h in duration with 5 min zeroing periods conducted hourly.
Slopes from all calibrations (single-point, dynamic dilution, and original factory calibration) agreed within 10 %, with no systematic bias between calibration methods. This indicates both that G2307 measurements are linear up to a ppm range and that sensitivity remained stable during the 2021–2023 period. Ambient measurements are processed according to the temporally closest calibration. We determine the uncertainty in ambient measurements to be 10 % as per the uncertainty associated with the standards used for calibration.
2.2 Aeris MIRA
2.2.1 MIRA operating principles
The operating principle of the Aeris MIRA instruments is described fully in Shutter et al. (2019). Air is pulled at a rate of 0.45–0.75 SLPM into a folded Herriott detection cell, which achieves a path length of 13 m. The laser scans over the HCHO feature at 2831.6413 cm−1 and HDO spectral feature at 2831.8413 cm−1. The ART algorithm corrects for broad slope in the raw signal of the instrument baseline and then calculates measured HCHO and H2O concentrations based on absorption features. We use the two commercial Aeris MIRA models in this work: the Pico and the Ultra model. The Ultra is identical in operation but offers higher optical cell temperature stability and is designed for longer-term, low-drift measurements.
2.2.2 Instrument baseline
The Aeris instruments have a two-inlet design allowing for the determination of instrument baseline throughout the data collection process. We run the instruments in the “programmed” mode, which allows the user to select the duration of sampling through each inlet. The instruments also have a “differential” mode, which produces ambient HCHO concentrations using on-board baseline subtractions. The zero inlet was connected to either a DNPH-coated cartridge or a heated HO (United Filtration) scrubber and teed with the ambient inlet to the main sampling line as per the manufacturer's recommendation. We sample ambient air for 180 s and scrubbed air for 30 s. This sequence was determined through visual inspection of Aeris time series with the intention of minimizing DNPH-sampling time while maintaining sufficient precision for ambient monitoring. We found 180 s to be the longest length of time between zeroes that either unit achieved where the instrument-reported HCHO signal remained consistently stable. Both units were then set to the same schedule. This led to DNPH-coated cartridges lasting 5–8 d, corresponding to a breakthrough time of 17–27 h. Variability in breakthrough time is dependent on ambient conditions and atmospheric chemical composition.
2.2.3 Impact of scrubber choice – heated HO and DNPH for Aeris MIRA
As stated previously, the Aeris ART fitting algorithm requires the presence of H2O as a spectral reference for finding the HCHO absorption peak. We therefore do not consider desiccating scrubbers as an option. Throughout deployment, the Aeris instruments reported an ambient range of 0.18 %–3.3 % H2O while sampling through DNPH with only a few days in winter falling below the 0.2 % H2O threshold. The heated HO airstream produced humidities in a similar range to DNPH.
Ambient measurements of HCHO-scrubbed air from the Pico were used to assess the HCHO-removal efficiency of heated HO as compared to DNPH. The zeroing inlet on the Pico was teed to a DNPH-coated cartridge and a stainless-steel column (length of 20.3 cm, radius of 2 cm) containing 215 cm3 of HO. The HO column was wrapped in high-temperature heat tape, insulated in a fiberglass sleeve, and heated to 180 °C. Pei et al. (2015) found that HO at this temperature achieved nearly 100 % HCHO removal and preserved the scrubber bed from H2O poisoning. A condensation trap and second particulate filter (PF) were placed downstream of the HO column to protect the instrument against potential liquid H2O and particulate matter. Two mass flow controllers were placed upstream of the scrubbers and used as valves. The Pico sampled from its zeroing inlet while the incoming flow alternated between scrubbers in 40 s intervals. The first 10 s of data after every switch was removed to preclude any effects from valve switching. This removal period was determined experimentally.
DNPH-scrubbed baselines exhibited a normal distribution centered around a mean and standard deviation of ppb. HO-scrubbed baselines exhibited a normal distribution with a larger mean of ppb resulting in an absolute difference of 0.71 ppb, which falls outside of the instrument's precision (discussed in Sect. 3) and indicates less efficient HCHO removal. Since ambient humidity perennially remained sufficiently high in the Atlanta area, we recommend the use of DNPH for zeroing the Aeris instruments.
2.2.4 Data processing
We generated temporally averaged datasets with variable time resolutions (1–60 min) using a data handling scheme like that of the Picarro G2307 observations. Zeroes are averaged to single points and interpolated to a 1 Hz resolution and subtracted from the 1 Hz ambient data, and ≥ 50 % data completeness is required for any averaging interval. We discard the first 5 s of measurements after a valve switch.
2.2.5 Instrument calibration
In September 2023, both Aeris instruments were calibrated using dilutions of a HCHO gas standard (Apel Riemer: 1015 ppb ± 5 %; Airgas: 1044 ppb ± 10 %) with humidified ultra-ZA. The configurations for humidifying air and diluting the gas standard were as described in Sect. 2.1.3 and 2.1.6. Both instrument calibrations produced slopes within 5 % of the original factory calibration, which occurred in February 2021. Intercepts were in the range of −0.03–0.12 ppb. These results indicate that the calibration throughout the instruments' respective deployments remained stable.
In October 2022 and September 2023, standard addition calibrations were performed by adding small amounts of the gas standard to the ambient line. Expected concentrations are calculated as the flow-weighted average of the gas standard concentration and the ambient concentration. Ambient concentration is measured by a co-located reference instrument. In October 2022, the two Aeris units were co-located and informed one another. In September 2023, Picarro G2307 measurements were used as the reference.
Results for the standard addition calibrations are shown in Fig. 3. York regressions (not plotted) incorporated the 1 min standard deviation of the measured concentrations, cylinder concentration uncertainty, and, for the standard addition calibrations, the measurement uncertainty associated with the corresponding reference instrument.
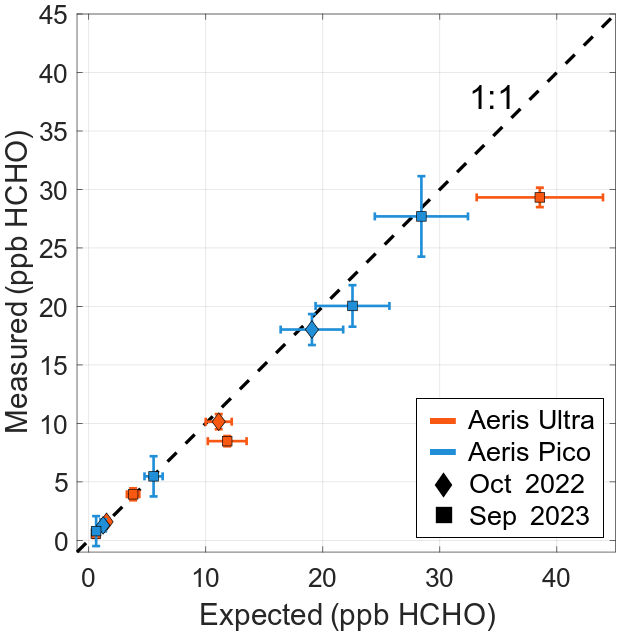
Figure 3Results from Aeris standard addition calibrations. Error bars are the uncertainty at each data point, with measured concentrations using the standard deviation of each averaged concentration step and expected concentrations using the cylinder uncertainty. For the standard addition, the measurement uncertainty of the reference instrument is also incorporated.
The Pico's standard addition calibrations agreed closely with the ZA dynamic dilution calibration and produced slopes of 0.94 ± 0.16 and 0.97 ± 0.16, intercepts of 0.13 ± 0.61 and 0.16 ± 1.18, and normalized mean biases (NMBs) between measured and expected concentrations of −4.9 % and −5.5 % in 2022 and 2023, respectively. The high uncertainty with the 2023 intercept is attributed to issues with the instrument's thermoelectric cooler which began in August 2023. All Pico data were processed according to the standard addition calibration closest in time.
The Ultra's 2022 standard addition calibration produced a slope of 0.86±0.16 and a NMB of −13.2 % between measured and expected concentrations. This calibration and the Ultra's 2023 dynamic dilution calibration agree within the uncertainties of both techniques. However, the 2023 standard addition calibration produced a slope of 0.77 ± 0.08, which has relative decreases of 10.5 % from 2022 and 19 % from the dynamic dilution calibration and a NMB of −22.8 % between measured and expected concentrations. This NMB persisted in the Ultra's ambient observations and could not be related to any measured instrument parameters.
These results suggest that standard addition calibrations are useful as a secondary check on instrument sensitivity once in the field. All ambient data for the Ultra data were processed using the 2023 standard addition calibration. This decision is owed to the intercomparison results presented in Sect. 5, wherein application of this calibration most effectively reduces the NMB relative to the G2307 and Pico. Correspondingly, a 14 % relative uncertainty from propagating the measurement uncertainties of the G2307 and Ultra in quadrature. A 0.3 ppb offset is added as per the Pico–FILIF (FIber Laser Induced Fluorescence) comparison in Shutter et al. (2019), which falls within the range of calibration offsets seen in this work.
2.3 DNPH (TO-11A)
Method TO-11A outlines in detail the EPA guidance on the preparation of DNPH-coated cartridges and subsequent analysis through HPLC (U.S. Epa, 1999). Formaldehyde was measured using an ATEC Model 8000 Toxic Air Sampler over three consecutive 8 h periods spanning a full 24 h with samples collected every 3 d. Ambient air was drawn at a rate of 0.9–1.1 L min−1 through a potassium-iodide-coated copper inlet heated to 50 °C to remove O3 before passing through a DNPH-coated cartridge (Supelco LpDNPH S10) which collected carbonyls in their non-volatile, carbonyl-hydrazone derivative form. The denuder is necessary as it minimizes potential O3-related interferences in the resultant HPLC chromatograms (Vairavamurthy et al., 1992). At the end of the sampling period, the cartridges were capped and stored in a refrigeration unit at ≤ 4 °C until analysis. The cartridges were then eluted with 10 mL of acetonitrile and the eluent analyzed via a Waters HPLC-UV system with a temperature stabilized (25±1 °C), reversed-phase C18-coated silica gel (1.7 µm particle size) column (bridged ethyl hybrid, 2.1 mm × 50 mm i.d.) at 360 nm wavelength. The eluents used in the HPLC process were deionized H2O and acetonitrile. The HPLC system was calibrated before each use with known concentrations of HCHO, and field samples are analyzed in comparison to blank cartridges.
Method TO-11A requires that collocated DNPH samples produce observations within 20 %, which is vindicated through EPA historical data (U.S. Epa, 1999). As such, an uncertainty of 20 % is assumed for TO-11A observations in this work. We note that this may not account for any biases caused by interfering species such as NO2 or issues brought on by variable sample flow rates or ambient RH (Karst et al., 1993; Herrington and Hays, 2012; Ho et al., 2014; Souza et al., 2020).
The precisions of the three analyzers were characterized in two ways. First, the instruments' inlets were overflowed using a ZA source for 24 h and precision was calculated via an Allan–Werle curve (Allan, 1966), as in prior instrument characterization studies (Shutter et al., 2019; Glowania et al., 2021). Results are shown as the solid lines in Fig. 4. The G2307 achieves precisions of 0.09, 0.05, and 0.03 ppb for integration times of 5, 20, and 60 min. This performance is similar to the 5 min 0.06 ppb precision reported by the manufacturer and results determined in Glowania et al. (2021). The Ultra achieves precisions of 0.20, 0.20, and 0.28 ppb for the same periods. The best precision achieved by the Pico is 0.66 ppb at a 30 s integration time. At longer integration times, fluctuations in concentrations reported by the Pico instrument can be attributed to thermal instability. Internal instrument temperatures varied by ±0.3–0.4 °C over the course of 7 h and were well-correlated (r>0.85) with the instrument baseline. Resultingly, precisions past 40 s integration times quickly became unsuitable for ambient monitoring. During deployment, the Pico's internal temperature was more stable compared to the ZA tests performed in the laboratory. When using 30 s zeroing periods from the Pico's ambient time series, a precision of 0.40 ppb HCHO is determined, which is comparable to that of the Ultra for the same integration window.
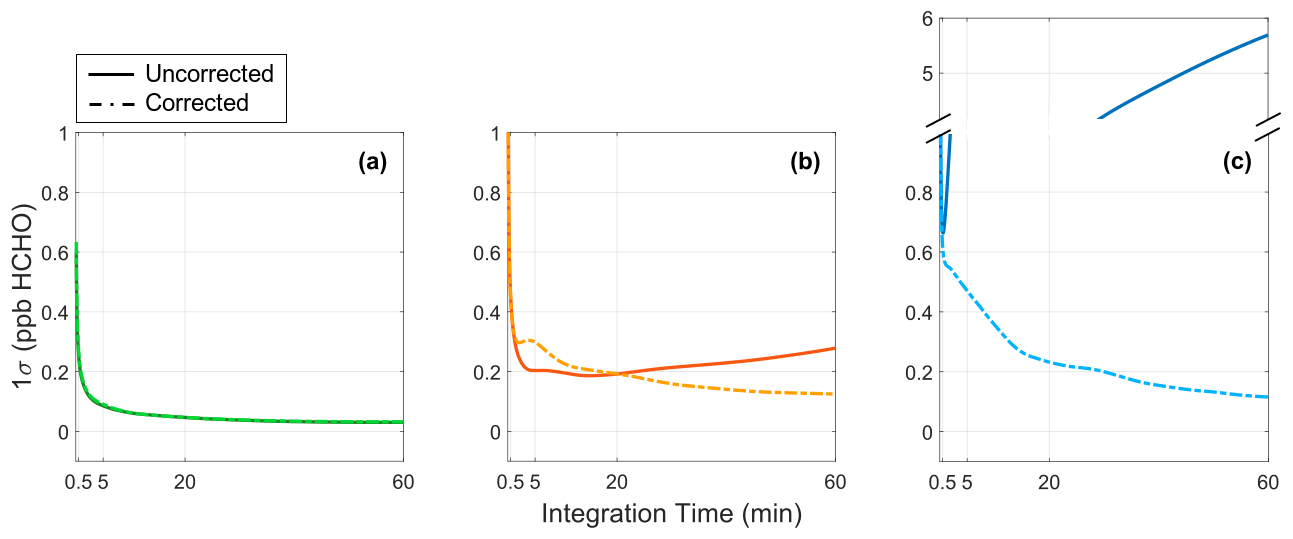
Figure 4Allan–Werle curves for (a) Picarro G2307, (b) Aeris Ultra, and (c) Aeris Pico instruments. Uncorrected precisions (solid lines) are calculated without accounting for baseline variation, whereas corrected precisions (dashed lines) use the same baseline-characterization method used to process ambient data.
As Allan variance is not meant to address systematic errors like temperature effects, we developed a modified, or corrected, Allan–Werle curve that better characterizes the precision of ambient measurements. Still sampling ZA, we replicated the sampling sequences and data processing methods used for ambient measurements (i.e., the 1 Hz data are drift-corrected by averaging and subtracting out each zeroing period). We then treated the 1 Hz data measured on the “ambient” inlet as contiguous. Results are shown as dashed lines in Fig. 4. For the Picarro G2307 (Fig. 4a), there is no change in precision using this method, as the baseline is relatively constant in this period. Both Aeris units benefited significantly from this correction, reaching 40 min precisions of 0.140 and 0.154 ppb for the Ultra and Pico, respectively. The Pico's modified precision is within 15 ppt of the 40 min precision of 0.14 ppb observed in Shutter et al. (2019). The corrected Aeris Allan–Werle curves trend similarly to the G2307's, achieving better precisions with longer integration times. These results indicate that the ambient sampling sequences used for each instrument are sufficient to account for the influence of any physical instrument variables on the baseline. As the precision of the ambient measurements (which are calculated differentially) is impacted by both the precision of the ambient and zero baselines, the modified Allan–Werle curves do not account for the precision of the zero measurement. In our ambient dataset, we are limited to a 30 s integration time as per the sampling sequence of the Aeris units. The 30 s Allan deviation while sampling through DNPH in our ambient dataset is 0.45 ppb for the Ultra. For the Pico, observations prior to August 2023 have a precision of 0.41 and 0.66 ppb otherwise. This is taken as the true precision of the ambient dataset. Longer zeroing times may achieve higher precision in the dashed lines of Fig. 4 if the baseline has sufficiently low drift through the sampling period.
To quantify instrument baseline drift, we show a typical time series of scrubbed-air observations for all three instruments. The period chosen spans 3–8 September 2022 and is shown in Fig. 5. The zero measurements are averaged according to the respective data scheme for each instrument and plotted differentially relative to the first value of each time series. The G2307 exhibits comparatively little drift with a maximum difference of 1.3 ppb when sampling DR-scrubbed air, occurring late on 4 September. Over the same time frame, the Aeris Ultra's baseline can shift by up to ±6 ppb, while the Aeris Pico baseline exhibits the most variability, changing by as much as ±20 ppb just over the course of 12 h. This significant drift necessitates more frequent zeroing, thus reducing the total time spent sampling ambiently and exhausting scrubbers faster. At their fastest drift rates (1.67 ppb HCHO h−1 for the Pico and 0.125 ppb HCHO h−1 for the Ultra), the improved thermal stability reduces drift by a factor of 13.36. From our observations, we determined that the Pico should be zeroed at least every 3 min and the Ultra every 10 min under typical indoor-deployment configurations as the instrument-reported HCHO signals do not consistently remain stable at longer intervals. For the G2307, observations of the instrument baseline drift obtained using DR suggest that hourly zeroing is sufficient.
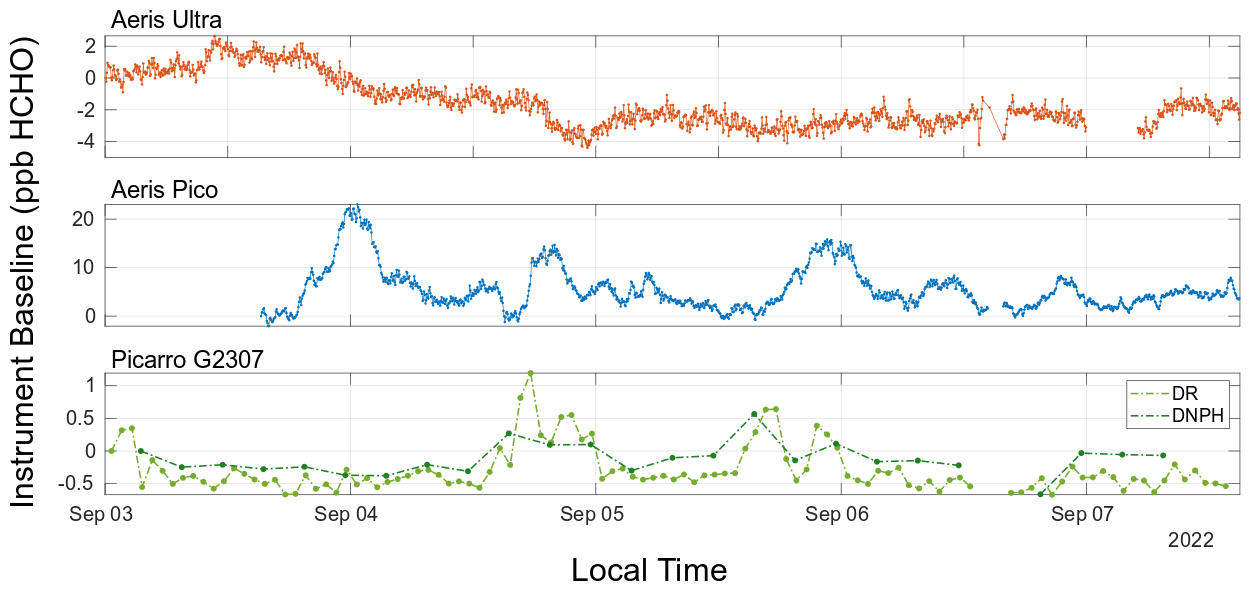
Figure 5Instrument baseline time series for all three HCHO monitors plotted differentially to the first point in the time series. The Ultra and G2307, equipped with better thermal stabilization, show significantly less drift than the Pico.
4.1 Field site descriptions
4.1.1 South DeKalb
The location of the South DeKalb (SDK) PAMS is shown in Fig. 6. The site is located approximately 19 km southeast of the university campus in a less industrialized area with comparatively greater tree coverage. The G2307 was permanently stationed at SDK, with two intercomparisons performed during its deployment. First, the Aeris Pico was co-deployed from 28 July to 13 September 2022 according to the configuration shown in Fig. 7a. Then, the Aeris Ultra and Pico were co-deployed from 21–29 August 2023 in their standard ambient configurations without sharing ambient lines. Instruments were housed in a climate-controlled trailer with an indoor temperature maintained at 21–23 °C. All tubing was 0.125 in. i.d. (0.25 in. o.d.) PTFE with 7.5 m extending from inside the trailer and up a mast, where the inlet was situated 5 m above the ground. The G2307 and Pico instruments had flow rates of 450 cm3 min−1, leading to a residence time of approximately 4 s when teed together and 8 s when separate. The Ultra had a flow rate of 800 cm3 min−1 with a residence time of 5 s; 1 µm PTFE particulate filters (PFs) in Savillex PTFE holders were used, and inlets were shielded by PTFE funnels covered with PTFE mesh. The indoor portion of the sampling lines were heated to 46 °C (≥ 1 °C above the cavity cell temperature of the instruments) to avoid condensation in the plumbing.
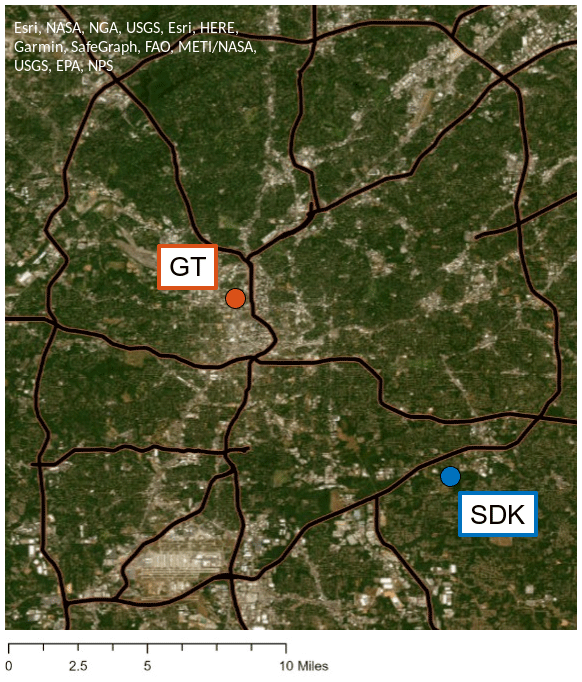
Figure 6Locations of the two field sites in the Atlanta, GA, area where the Aeris Ultra, Aeris Pico, and Picarro G2307 were deployed.
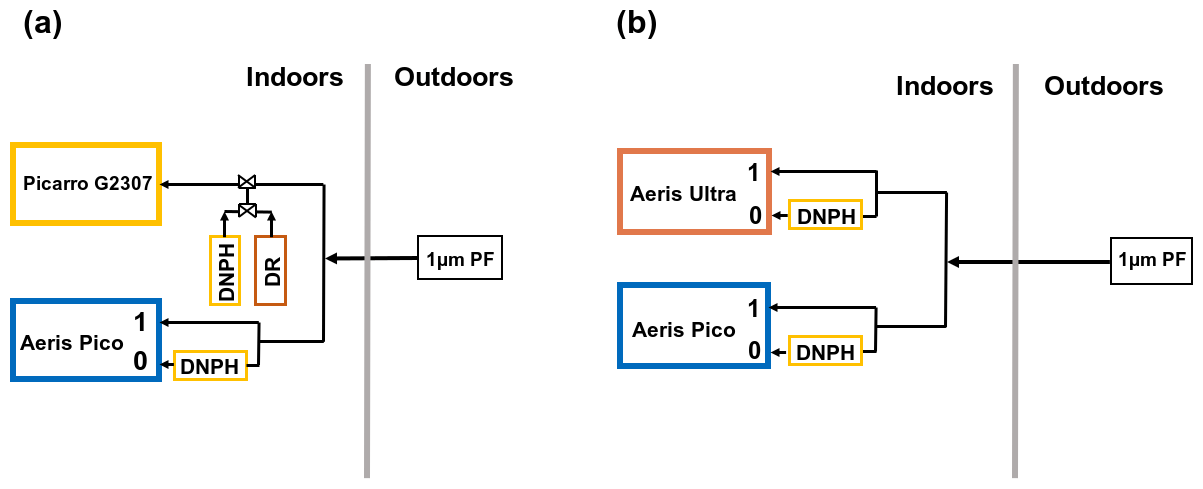
Figure 7Configurations of instruments during their respective intercomparisons. Panel (a) shows the teed setup used from 28 July–13 September 2022 for the Aeris Pico and Picarro G2307. When not co-located, the G2307 has the same configuration without being teed to the Pico. Panel (b) shows the setup used for the Aeris instruments while deployed at GT from 25–28 July and 4–17 October 2022. For each panel, “0” references HCHO-scrubbed air, “1” is ambient air, and “PF” is a particulate filter.
The Aeris instruments' baselines were determined solely using DNPH, while the G2307 sampled between DNPH, DR, or DR + MS. When scrubbing only with DR, air was passed through two adsorption columns (length of 16 in., radius of 2 in.) in series containing 0.5 kg of material each. For DR + MS, the column first in the series was replaced with the MS material. When the adsorption columns were exhausted, the scrubber bed was replaced with either new or regenerated material. DR was thermally regenerated according to the manufacturer instructions.
4.1.2 Georgia Tech
The Aeris instruments were co-deployed in the penthouse laboratory of the Ford Environmental Science and Technology building (GT, Georgia Tech) from 25–28 July 2022 and 4–18 October 2022 with the setups used during their co-located periods shown in Fig. 7b. The ambient temperature of the lab was maintained at 22 °C. A total of 7 m of 0.25 in. o.d. (0.125 in. i.d.) PTFE line ran from the instruments through a wall port, where the inlet was suspended 3 m above the outdoor roof floor. As before, a 1 µm PTFE PF in a Savillex PTFE filter holder was attached, the inlet shielded with a PTFE funnel, and indoor tubing insulated to prevent condensation from forming. The Aeris instruments solely used the DNPH-scrubbing method for zeroing.
4.2 Instrument intercomparisons
4.2.1 Continuous HCHO monitor comparison
Figure 8 shows all HCHO observations from the Aeris and Picarro G2307 instruments from their co-location periods. York regressions of 20 min averaged data incorporate the measurement uncertainties defined in Sect. 2. Observations correlate strongly (r≥0.9) for each comparison.
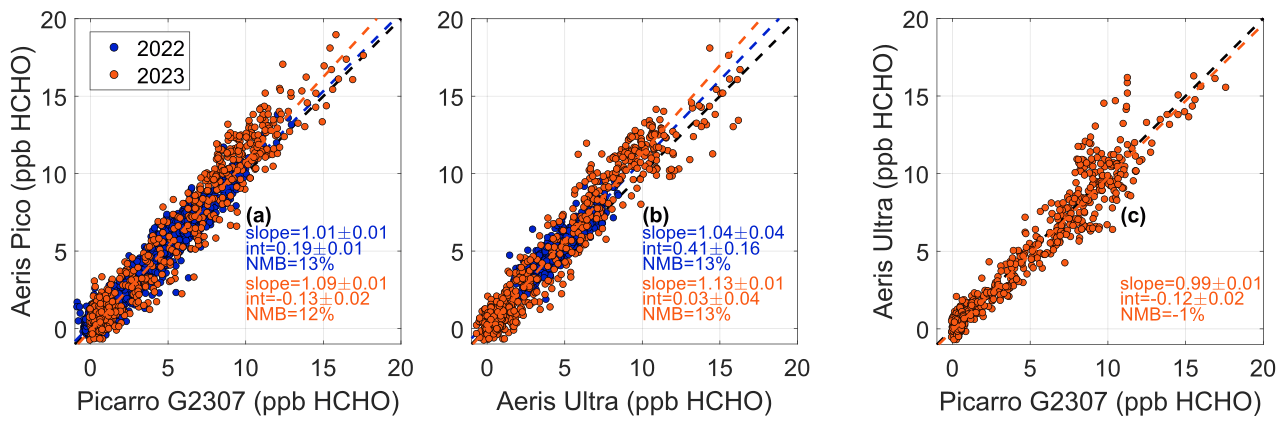
Figure 8Comparison of ambient observations from the three HCHO monitors assessed in this work. (a) Pico and G2307 observations taken at SDK in 2022 and 2023, (b) Pico and Ultra with 2022 measurements taken at GT in 2022 and SDK in 2023, and (c) Ultra and G2307 observations at SDK 2023. Slopes and intercepts result from applying the York regression technique, which incorporates the respective uncertainties of each instrument.
The Pico had a NMB of 12 %–13 % relative to the G2307 (Fig. 8a), with slopes ranging from 1.01 to 1.09. Figure 8b shows a Pico NMB of 13 % compared to the Ultra, with slopes ranging from 1.04 to 1.13. Before applying a standard addition calibration factor, the Ultra's observations were consistently lower compared to the other instruments. The good agreement in the Ultra vs. G2307 comparison (Fig. 8c; slope = 0.99; NMB = −1 %) supports the use of the standard addition calibration. Intercepts for all regressions range from −0.11–0.41 ppb, which is near or less than the intercomparison offsets observed in Shutter et al. (2019) for ART-fitted measurements.
The scatter around the lines of best fit is primarily owed to the low precision of the Aeris ambient measurements, which is determined by the 30 s zeroing intervals. There are occasional periods of large deviations from the lines of best fit. These periods typically lasted multiple hours, suggesting accuracy (rather than precision) is the cause of the deviations. Specifically, on four separate occasions the Aeris instruments both measured 10–15 ppb HCHO, while the Picarro observations remained at ∼ 10 ppb. Reasons underlying this behavior could not be traced to measured instrument parameters or ambient variables.
4.2.2 Picarro G2307 and TO-11A DNPH comparison
Figure 9 compares G2307 observations from June–August 2022 with those from co-located TO-11A measurements. One-minute integrated G2307 concentrations are averaged to the 8 h TO-11A sampling window. We find moderate correlation (r=0.75) and a −52 % NMB of TO-11A observations relative to the G2307 (slope = 0.35±0.02). Previous studies have demonstrated DNPH-based observations being up to 25 % lower relative to continuous HCHO observations (Hak et al., 2005; Dunne et al., 2018). Hak et al. (2005) determined slopes in the range of 0.64–0.83 when comparing DNPH-HPLC and Hantzsch fluorometric measurements. A comparison of Hantzsch and G2307 observations in Glowania et al. (2021) produced a slope of 1.08.
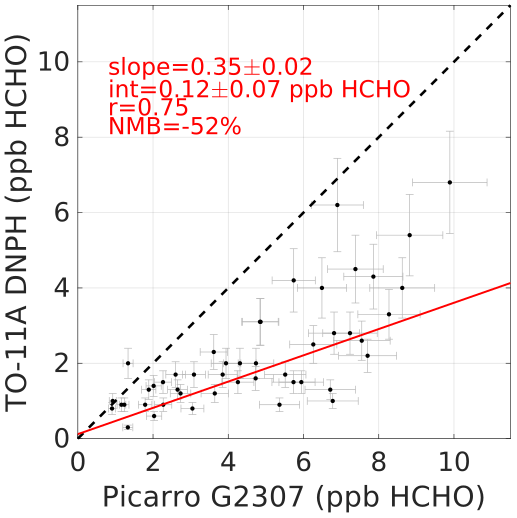
Figure 9Eight-hour TO-11A DNPH observations compared to Picarro G2307 observations at the SDK site from June through August 2022. Error bars represent the 10 % and 20 % uncertainty associated with the G2307 and TO-11A measurements.
While a low bias is not unusual for TO-11A measurements, the magnitude of the discrepancy presented here is larger than in prior studies. We find 8 h G2307 and TO-11A observations are well correlated () with temperature, RH, and O3, which are expected to either drive ambient HCHO or reflect its secondary chemistry. TO-11A observations did not correlate notably with NO2 which would be expected to bias reported HCHO concentrations high (Herrington and Hays, 2012). Noted in Sect. 2.1.5, summertime in Atlanta exhibits high RH and temperatures, which can lead DNPH measurements to underestimate ambient HCHO by 35 %–80 % (Ho et al., 2014). While we are unable to provide a definite reason for this significant discrepancy, the accuracy and stability shown through the G2307's calibrations as well as its agreement with the Aeris units (with independently verified accuracies) lend confidence to its measurements.
To demonstrate whether these continuous HCHO monitors capture the urban HCHO gradient, we plot time series from both field sites from August 2022–January 2023 (Fig. 10) and quantify the HCHO concentration gradient that arises between GT (located in Atlanta's urban core) and SDK (a less industrialized, rural–urban area). Gaps in data typically result from downtime due to scrubber exhaustion or instrument maintenance. The Aeris instruments overall have less available data due to more frequent and intense scrubber usage, valve failures, and spectral fitting failures that could not self-correct. Over this period, the Pico was stationed at both field sites with only sparse data available after 18 October 2022 as it was dedicated to other experiments.
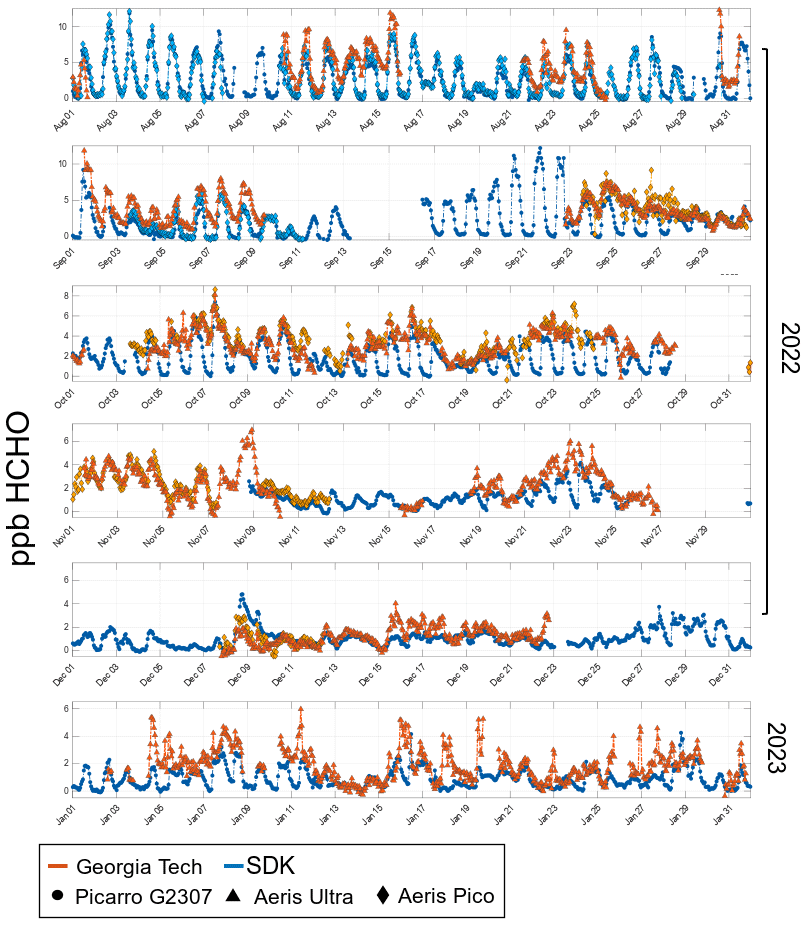
Figure 10One-hour averaged HCHO time series from Picarro G2307, Aeris Ultra, and Aeris Pico from August 2022 through January 2023. Observations at GT show less defined diurnal amplitudes than the SDK site and are on average higher regardless of the time of year. Aeris Pico data are sparse past 18 October 2022 as the instrument was periodically dedicated to other experiments.
In August, both sites reached their daily maximums around 13:00 LT with monthly averaged peaks of 7.76 ppb HCHO at GT and 6.38 ppb HCHO at SDK. On average, HCHO concentrations were 2.12 ppb higher than the SDK site, with 1 h maximums of 12.33 ppb at GT on 30 August and 11.86 ppb at SDK on 3 August. Measurements at GT generally had average nighttime minimums above 2 ppb in August and ≤ 1 ppb throughout the winter. Diel cycles showed less definition at GT as the year progressed into the colder months, with SDK maintaining comparatively clearer amplitudes that have sub-ppb nighttime minimums throughout the year. Given that the SDK site is located in a less urbanized area and immediately surrounded by trees, this trend matches results found in Wang et al. (2022), who noted that cities with higher levels of biogenic VOCs exhibited larger HCHO diurnal amplitudes. As such, we expect that the influence of isoprene chemistry on HCHO production is stronger at SDK. The consistent nighttime threshold at GT could result from a combination of anthropogenic, primary HCHO emission sources local to the city or possibly from stagnant atmospheric conditions leading to localized changes in nighttime surface layer mixing heights. Figure 10 spans a long enough time to capture the ambient extremes of the metropolitan area, showing that the observed HCHO gradient between the two sites is within the measurement capabilities of the G2307 and the Aeris instruments.
These data also allow for a snapshot comparison with previous measurements from both sites to quantify changes in HCHO concentrations. The only prior ground-based campaign to measure HCHO via a continuous monitor in the Atlanta metropolitan area was the 1999 Atlanta Supersite Project (Solomon et al., 2003), where a Hantzsch fluorometric monitor was deployed during the month of August (Dasgupta et al., 2005). HCHO observations taken in the urban core are used to calculate an August diel cycle for their respective years. We employ the PAMS HCHO data taken at SDK in August 1999 (AQS, 1999) to compare them with the August 2022 data previously used in Fig. 9. In 1999, DNPH samples were collected every 3 h from 06:00–18:00 LT. As stated previously, samples are now collected every 8 h over a 24 h period starting at 04:00 LT. As such, a 6 h average of the 1999 observations (12:00–18:00 LT) is compared with the 2022 8 h average (12:00–20:00 LT) with the results shown in Fig. 11.
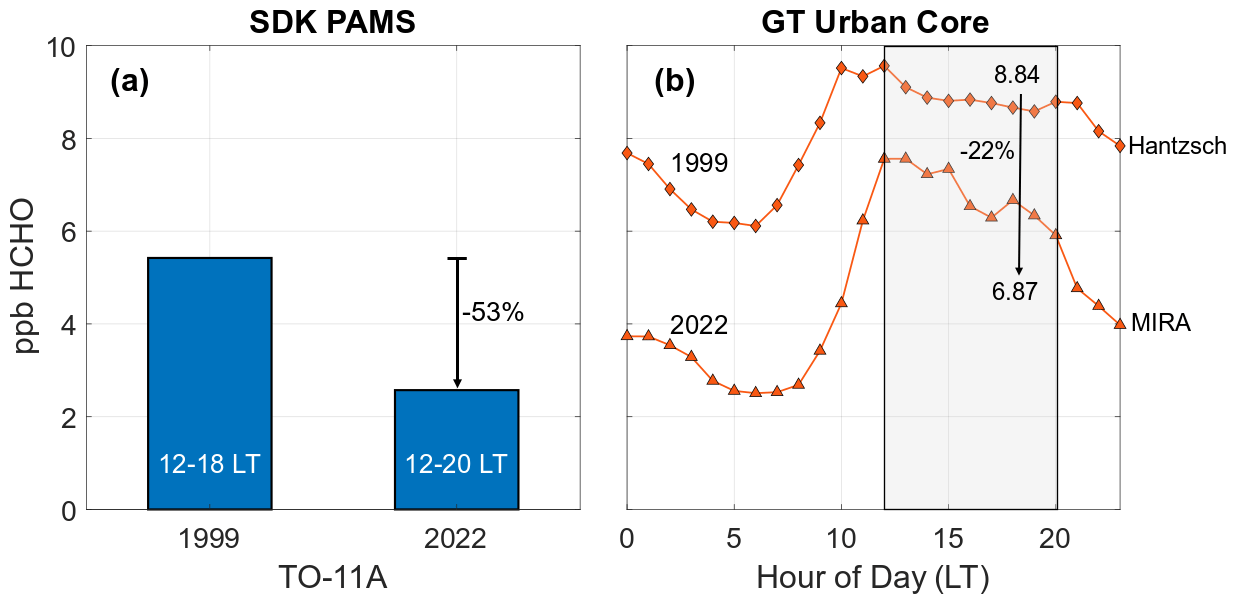
Figure 11HCHO concentrations from 1999 and 2022. Panel (a) shows a 53 % decrease from July 1999 to 2022 as the midday average (12:00–20:00 LT) of PAMS measurements taken at SDK, and panel (b) shows a 22 % decrease for the same averaging window in August in Atlanta's urban core.
An average of the August HCHO observations over the 12:00–20:00 LT window shows that concentrations at GT have reduced by 22.3 % since 1999 despite the increasing urbanization of the city over the last 2 decades. The average relative decrease in the 1 h monthly maximums and minimums at GT is 22.9 % and 59.0 %, respectively. Dasgupta et al. (2005) state the possible influence of nearby HCHO emission sources on their observations, but this remains a nonetheless considerable decrease in nighttime concentrations. A significantly greater midday decrease of 53 % is calculated for the SDK PAMS data. However, Picarro G2307 data averaged to the same midday window result in a relative decrease of only 1.9 %. Monthly averaged minimum values cannot be calculated for SDK as the 1999 data do not span a complete diurnal cycle.
Continuous measurements provide the benefit of comprehensive time series, meaning local chemical trends in HCHO can be more clearly related to time-dependent atmospheric conditions. In the urban core, maximum HCHO concentrations always occur in the daytime and minimums in the nighttime, with the relative change in minimums since 1999 being significantly greater than that of the maximums. OH oxidation of isoprene is one of the dominant sources of HCHO in urban environments that have sufficiently high NOx concentrations, with the southeast having comparably higher biogenic influences on its atmospheric chemistry than the rest of the country (Travis et al., 2016). As significant reductions in US NOx emissions have been observed over the decades (Duncan et al., 2016), urban daytime HCHO production is then expected to decrease. As OH is largely a daytime oxidant, nighttime decreases in HCHO are more likely attributable to reductions in direct emissions of both HCHO as well as its anthropogenic VOC precursors.
We used yearlong ambient datasets from three commercially new in situ HCHO monitors to quantify instrument performance and to compare observations with measurements produced from co-located monitors employing the EPA TO-11A methodology. These continuous monitors offer an advantage given that their measurements are online, have sufficient precision at finer time resolutions, and do not require special handling or storage of samples or hazardous chemicals. However, previous measurements exhibited humidity dependencies, produced significantly lower concentrations, and showed non-negligible variability in HCHO concentration dependent on the zeroing method. Additionally, all three instruments require frequent zeroing via HCHO scrubbers to account for baseline drift, with each method presenting its own set of practical considerations. We determined calibration procedures and optimal field setups by assessing how measurements were impacted with the usage of four common scrubbing methods: DNPH, DR, DR + MS, and HO.
DNPH-derived baselines were compared to a ZA source, producing values within 14 ppt HCHO on average and demonstrating their efficacy. Ambient conditions year-round at the GT and SDK field sites had sufficient RH (≥ 25 %) to not impede DNPH derivatization of hydrazine. At high RH (> 50 %), no clear impact to instrument baselines could be observed. DR, DR + MS, and HO-scrubbed baselines were then compared to those resulting from DNPH. HO performed poorly, exhibiting a mean differential baseline value of 0.71 ppb HCHO. DR and DR + MS performed on par with DNPH, indicating high HCHO-scrubbing efficiency. As such, we recommend the use of DR/DR + MS and DNPH for zeroing the Picarro G2307 and only DNPH for use with the Aeris units given their humidity requirements. Additionally, the G2307's humidity dependence was quantified experimentally. We emphasize this procedure before deployment as results here show this relationship to be instrument specific.
We developed a modified method for determining instrument precision that accounts for instrument zeroing. The G2307, Ultra, and Pico achieved modified precisions of 0.05, 0.20, and 0.22 ppb, respectively, for a 20 min integration time. We determined that the sensitivities of the monitors were stable during their respective deployments. The Aeris Ultra exhibited a NMB of −30 %–36 % compared to Aeris Pico and Picarro G2307 measurements if dynamic dilution calibrations were used as the basis. However, standard addition calibration of the Aeris units led to all instruments agreeing within 13 %. Co-located TO-11A observations exhibited a NMB of −52 % relative to the G2307, which is the largest TO-11A intercomparison discrepancy reported in the extant literature.
Finally, using time series that span August 2022 to January 2023 at two fields sites separated by 12 mi, we demonstrated that these instruments capture the HCHO gradient in the Atlanta metro area over a wide range of ambient conditions, including summer and wintertime seasonal extremes. Comparison with historical HCHO measurements revealed a relative decrease in daytime ambient HCHO of 22.3 % at the urban-core site and 53 % at the urban–rural site. Nighttime HCHO concentrations in the urban core decreased by 59 % during this time. Ultimately, the performance of these instruments and the subsequent results show the feasibility of both deploying across multiple cities and taking fast, accurate HCHO observations, offering the potential for greater insights into the complex chemistry of urban HCHO.
All data shown in this work are available at https://doi.org/10.5281/zenodo.10855090 (KaiserLab-GeorgiaTech, 2024). Met and chemical data from Dasgupta et al. (2005) are available at https://doi.org/10.5067/ASDCDAAC/NARSTO/0060 (NASA/LARC/SD/ASDC, 2003).
APM led this work, designed and conducted experiments, and wrote this paper with input from all co-authors. ZAS assisted in conducting experiments, instrument maintenance, and writing. As a principal investigator, JK provided supervision, helped in experimental design, and acquired financial support for this project.
The contact author has declared that none of the authors has any competing interests.
Publisher’s note: Copernicus Publications remains neutral with regard to jurisdictional claims made in the text, published maps, institutional affiliations, or any other geographical representation in this paper. While Copernicus Publications makes every effort to include appropriate place names, the final responsibility lies with the authors.
The authors kindly thank Jaime Gore and DeAnna Oser from the Georgia Environmental Protection Division for the input provided for this work.
This research has been supported by the National Aeronautics and Space Administration (grant no. 80NSSC21K0944).
This paper was edited by Thomas F. Hanisco and reviewed by two anonymous referees.
Achatz, S., Lörinci, G., Hertkorn, N., Gebefügi, I., and Kettrup, A.: Disturbance of the determination of aldehydes and ketones: Structural elucidation of degradation products derived from the reaction of 2,4-dinitrophenylhydrazine (DNPH) with ozone, Fresenius' J. Anal. Chem., 364, 141–146, https://doi.org/10.1007/s002160051313, 1999.
Allan, D. W.: Statistics of atomic frequency standards, Proc. IEEE, 54, 221–230, 1966.
Alvarado, L. M. A., Richter, A., Vrekoussis, M., Hilboll, A., Kalisz Hedegaard, A. B., Schneising, O., and Burrows, J. P.: Unexpected long-range transport of glyoxal and formaldehyde observed from the Copernicus Sentinel-5 Precursor satellite during the 2018 Canadian wildfires, Atmos. Chem. Phys., 20, 2057–2072, https://doi.org/10.5194/acp-20-2057-2020, 2020.
Bent, J., Wallace, C., Lucic, G., Rella, C., Haffnagle, J., and Baumann, K.: G2307: Traceable calibration of Formaldehyde (H2CO), White Paper, Picarro, Inc., 2023.
Cardenas, L., Brassington, D., Allan, B., Coe, H., Alicke, B., Platt, U., Wilson, K., Plane, J., and Penkett, S.: Intercomparison of formaldehyde measurements in clean and polluted atmospheres, J. Atmos. Chem., 37, 53–80, 2000.
Cazorla, M., Wolfe, G. M., Bailey, S. A., Swanson, A. K., Arkinson, H. L., and Hanisco, T. F.: A new airborne laser-induced fluorescence instrument for in situ detection of formaldehyde throughout the troposphere and lower stratosphere, Atmos. Meas. Tech., 8, 541–552, https://doi.org/10.5194/amt-8-541-2015, 2015.
Coggon, M. M., Gkatzelis, G. I., McDonald, B. C., Gilman, J. B., Schwantes, R. H., Abuhassan, N., Aikin, K. C., Arend, M. F., Berkoff, T. A., and Brown, S. S.: Volatile chemical product emissions enhance ozone and modulate urban chemistry, P. Natl. Acad. Sci. USA, 118, e2026653118, https://doi.org/10.1073/pnas.2026653118, 2021.
Dasgupta, P. K., Li, J., Zhang, G., Luke, W. T., McClenny, W. A., Stutz, J., and Fried, A.: Summertime ambient formaldehyde in five US metropolitan areas: Nashville, Atlanta, Houston, Philadelphia, and Tampa, Environ. Sci. Technol., 39, 4767–4783, 2005.
Dugheri, S., Massi, D., Mucci, N., Marrubini, G., Cappelli, G., Speltini, A., Bonferoni, M. C., and Arcangeli, G.: Exposure to airborne formaldehyde: Sampling and analytical methods – A review, Trend. Environ. Anal. Chem., 29, e00116, https://doi.org/10.1016/j.teac.2021.e00116, 2021.
Duncan, B. N., Lamsal, L. N., Thompson, A. M., Yoshida, Y., Lu, Z., Streets, D. G., Hurwitz, M. M., and Pickering, K. E.: A space-based, high-resolution view of notable changes in urban NOx pollution around the world (2005–2014), J. Geophys. Res.-Atmos., 121, 976–996, 2016.
Dunne, E., Galbally, I. E., Cheng, M., Selleck, P., Molloy, S. B., and Lawson, S. J.: Comparison of VOC measurements made by PTR-MS, adsorbent tubes–GC-FID-MS and DNPH derivatization–HPLC during the Sydney Particle Study, 2012: a contribution to the assessment of uncertainty in routine atmospheric VOC measurements, Atmos. Meas. Tech., 11, 141–159, https://doi.org/10.5194/amt-11-141-2018, 2018.
Fried, A., Walega, J., Weibring, P., Richter, D., Simpson, I. J., Blake, D. R., Blake, N. J., Meinardi, S., Barletta, B., and Hughes, S. C.: Airborne formaldehyde and volatile organic compound measurements over the Daesan petrochemical complex on Korea's northwest coast during the Korea-United States Air Quality studyEstimation of emission fluxes and effects on air quality, Elementa: Science of the Anthropocene, 8, 121, https://doi.org/10.1525/elementa.2020.121, 2020.
Furdyna, P.: Experiences with Picarro G2307 HCHO Analyzers, New York Department of Environmental Conservation, 1–17, https://www.4cleanair.org/wp-content/uploads/Documents/NY_HCHO_Aug2020Furdyna.pdf (last access: 11 March 2024), 2020.
Glowania, M., Rohrer, F., Dorn, H.-P., Hofzumahaus, A., Holland, F., Kiendler-Scharr, A., Wahner, A., and Fuchs, H.: Comparison of formaldehyde measurements by Hantzsch, CRDS and DOAS in the SAPHIR chamber, Atmos. Meas. Tech., 14, 4239–4253, https://doi.org/10.5194/amt-14-4239-2021, 2021.
Hak, C., Pundt, I., Trick, S., Kern, C., Platt, U., Dommen, J., Ordóñez, C., Prévôt, A. S. H., Junkermann, W., Astorga-Lloréns, C., Larsen, B. R., Mellqvist, J., Strandberg, A., Yu, Y., Galle, B., Kleffmann, J., Lörzer, J. C., Braathen, G. O., and Volkamer, R.: Intercomparison of four different in-situ techniques for ambient formaldehyde measurements in urban air, Atmos. Chem. Phys., 5, 2881–2900, https://doi.org/10.5194/acp-5-2881-2005, 2005.
Hansen, R. F., Griffith, S. M., Dusanter, S., Rickly, P. S., Stevens, P. S., Bertman, S. B., Carroll, M. A., Erickson, M. H., Flynn, J. H., Grossberg, N., Jobson, B. T., Lefer, B. L., and Wallace, H. W.: Measurements of total hydroxyl radical reactivity during CABINEX 2009 – Part 1: field measurements, Atmos. Chem. Phys., 14, 2923–2937, https://doi.org/10.5194/acp-14-2923-2014, 2014.
Herndon, S. C., Zahniser, M. S., Nelson Jr, D. D., Shorter, J., McManus, J. B., Jiménez, R., Warneke, C., and De Gouw, J. A.: Airborne measurements of HCHO and HCOOH during the New England Air Quality Study 2004 using a pulsed quantum cascade laser spectrometer, J. Geophys. Res.-Atmos., 112, D10S03, https://doi.org/10.1029/2006JD007600, 2007.
Herrington, J. S. and Hays, M. D.: Concerns regarding 24-h sampling for formaldehyde, acetaldehyde, and acrolein using 2, 4-dinitrophenylhydrazine (DNPH)-coated solid sorbents, Atmos. Environ., 55, 179–184, 2012.
Ho, S. S. H., Chow, J. C., Watson, J. G., Ip, H. S. S., Ho, K. F., Dai, W. T., and Cao, J.: Biases in ketone measurements using DNPH-coated solid sorbent cartridges, Anal. Method., 6, 967–974, 2014.
KaiserLab-GeorgiaTech: KaiserLab-GeorgiaTech/long-term-HCHO-monitoring_efforts_datasets: long-term-HCHO-monitoring-efforts-datasets, Zenodo [data set], https://doi.org/10.5281/zenodo.10855090, 2023.
Karst, U., Binding, N., Cammann, K., and Witting, U.: Interferences of nitrogen dioxide in the determination of aldehydes and ketones by sampling on 2,4-dinitrophenylhydrazine-coated solid sorbent, Fresenius' J. Anal. Chem., 345, 48–52, https://doi.org/10.1007/BF00323325, 1993.
Lin, Y. C., Schwab, J. J., Demerjian, K. L., Bae, M. S., Chen, W. N., Sun, Y., Zhang, Q., Hung, H. M., and Perry, J.: Summertime formaldehyde observations in New York City: Ambient levels, sources and its contribution to HOx radicals, J. Geophys. Res.-Atmos., 117, D08305, https://doi.org/10.1029/2011JD016504, 2012.
Luecken, D., Napelenok, S., Strum, M., Scheffe, R., and Phillips, S.: Sensitivity of ambient atmospheric formaldehyde and ozone to precursor species and source types across the United States, Environ. Sci. Technol., 52, 4668–4675, 2018.
Lui, K. H., Ho, S. S. H., Louie, P. K. K., Chan, C. S., Lee, S. C., Hu, D., Chan, P. W., Lee, J. C. W., and Ho, K. F.: Seasonal behavior of carbonyls and source characterization of formaldehyde (HCHO) in ambient air, Atmos. Environ., 152, 51–60, https://doi.org/10.1016/j.atmosenv.2016.12.004, 2017.
NASA/LARC/SD/ASDC: NARSTO EPA Supersite (SS) Atlanta 1999 Air Chemistry, Particulate Matter (PM), and Meteorological Data, NASA Langley Atmospheric Science Data Center DAAC [data set], https://doi.org/10.5067/ASDCDAAC/NARSTO/0060, 2003.
Parrish, D. D., Ryerson, T. B., Mellqvist, J., Johansson, J., Fried, A., Richter, D., Walega, J. G., Washenfelder, R. A., de Gouw, J. A., Peischl, J., Aikin, K. C., McKeen, S. A., Frost, G. J., Fehsenfeld, F. C., and Herndon, S. C.: Primary and secondary sources of formaldehyde in urban atmospheres: Houston Texas region, Atmos. Chem. Phys., 12, 3273–3288, https://doi.org/10.5194/acp-12-3273-2012, 2012.
Pei, J., Han, X., and Lu, Y.: Performance and kinetics of catalytic oxidation of formaldehyde over copper manganese oxide catalyst, Build. Environ., 84, 134–141, 2015.
Scheffe, R. D., Strum, M., Phillips, S. B., Thurman, J., Eyth, A., Fudge, S., Morris, M., Palma, T., and Cook, R.: Hybrid modeling approach to estimate exposures of hazardous air pollutants (HAPs) for the national air toxics assessment (NATA), Environ. Sci. Technol., 50, 12356–12364, 2016.
Shutter, J. D., Allen, N. T., Hanisco, T. F., Wolfe, G. M., St. Clair, J. M., and Keutsch, F. N.: A new laser-based and ultra-portable gas sensor for indoor and outdoor formaldehyde (HCHO) monitoring, Atmos. Meas. Tech., 12, 6079–6089, https://doi.org/10.5194/amt-12-6079-2019, 2019.
Solomon, P. A., Chameides, W., Weber, R., Middlebrook, A., Kiang, C., Russell, A. G., Butler, A., Turpin, B., Mikel, D., and Scheffe, R.: Overview of the 1999 Atlanta supersite project, J. Geophys. Res.-Atmos., 108, 8413, https://doi.org/10.1029/2001JD001458, 2003.
Souza, M. d. O., Sánchez, B., Fuentes, M., Gilaranz, J., and Canela, M. C.: Analytical validation using a gas mixing system for the determination of gaseous formaldehyde, Anal. Method., 12, 5247–5256, 2020.
Spinei, E., Whitehill, A., Fried, A., Tiefengraber, M., Knepp, T. N., Herndon, S., Herman, J. R., Müller, M., Abuhassan, N., Cede, A., Richter, D., Walega, J., Crawford, J., Szykman, J., Valin, L., Williams, D. J., Long, R., Swap, R. J., Lee, Y., Nowak, N., and Poche, B.: The first evaluation of formaldehyde column observations by improved Pandora spectrometers during the KORUS-AQ field study, Atmos. Meas. Tech., 11, 4943–4961, https://doi.org/10.5194/amt-11-4943-2018, 2018.
St. Clair, J. M., Swanson, A. K., Bailey, S. A., and Hanisco, T. F.: CAFE: a new, improved nonresonant laser-induced fluorescence instrument for airborne in situ measurement of formaldehyde, Atmos. Meas. Tech., 12, 4581–4590, https://doi.org/10.5194/amt-12-4581-2019, 2019.
Strum, M. and Scheffe, R.: National review of ambient air toxics observations, J. Air Waste Manag. Assoc., 66, 120–133, 2016.
Tang, S., Graham, L., Shen, L., Zhou, X., and Lanni, T.: Simultaneous determination of carbonyls and NO2 in exhausts of heavy-duty diesel trucks and transit buses by HPLC following 2, 4-dinitrophenylhydrazine cartridge collection, Environ. Sci. Technol., 38, 5968–5976, 2004.
Tonnesen, G. S. and Dennis, R. L.: Analysis of radical propagation efficiency to assess ozone sensitivity to hydrocarbons and NOx: 1. Local indicators of instantaneous odd oxygen production sensitivity, J. Geophys. Res.-Atmos., 105, 9213–9225, https://doi.org/10.1029/1999JD900371, 2000.
Travis, K. R., Jacob, D. J., Fisher, J. A., Kim, P. S., Marais, E. A., Zhu, L., Yu, K., Miller, C. C., Yantosca, R. M., Sulprizio, M. P., Thompson, A. M., Wennberg, P. O., Crounse, J. D., St. Clair, J. M., Cohen, R. C., Laughner, J. L., Dibb, J. E., Hall, S. R., Ullmann, K., Wolfe, G. M., Pollack, I. B., Peischl, J., Neuman, J. A., and Zhou, X.: Why do models overestimate surface ozone in the Southeast United States?, Atmos. Chem. Phys., 16, 13561–13577, https://doi.org/10.5194/acp-16-13561-2016, 2016.
U.S. EPA: Compendium of Methods for the Determination of Toxic Organic Compounds in Ambient Air, EPA/625/R-96/010b, 56 pp., https://www.epa.gov/sites/default/files/2019-11/documents/to-11ar.pdf (last access: 11 March 2024), 1999.
Uchiyama, S., Naito, S., Matsumoto, M., Inaba, Y., and Kunugita, N.: Improved measurement of ozone and carbonyls using a dual-bed sampling cartridge containing trans-1, 2-bis (2-pyridyl) ethylene and 2, 4-dinitrophenylhydrazine-impregnated silica, Anal. Chem., 81, 6552–6557, 2009.
Vairavamurthy, A., Roberts, J. M., and Newman, L.: Methods for determination of low molecular weight carbonyl compounds in the atmosphere: a review, Atmos. Environ. A, 26, 1965–1993, 1992.
Valin, L., Fiore, A., Chance, K., and González Abad, G.: The role of OH production in interpreting the variability of CH2O columns in the southeast US, J. Geophys. Res.-Atmos., 121, 478–493, 2016.
Wang, P., Holloway, T., Bindl, M., Harkey, M., and De Smedt, I.: Ambient Formaldehyde over the United States from Ground-Based (AQS) and Satellite (OMI) Observations, Remote Sens., 14, 2191, https://doi.org/10.3390/rs14092191, 2022.
Warneke, C., de Gouw, J. A., Edwards, P. M., Holloway, J. S., Gilman, J. B., Kuster, W. C., Graus, M., Atlas, E., Blake, D., Gentner, D. R., Goldstein, A. H., Harley, R. A., Alvarez, S., Rappenglueck, B., Trainer, M., and Parrish, D. D.: Photochemical aging of volatile organic compounds in the Los Angeles basin: Weekday-weekend effect, J. Geophys. Res.-Atmos., 118, 5018–5028, https://doi.org/10.1002/jgrd.50423, 2013.
Whitehill, A. R., Long, R., Kaushik, S., Szykman, J., Williams, D., Valin, L., Furdyna, P., and Felton, D.: Evaluation of Continuous Formaldehyde Measurements in Ambient Air, AGU Fall Meeting Abstracts, Abstract #A33G-3207, 2018.
Wisthaler, A., Apel, E. C., Bossmeyer, J., Hansel, A., Junkermann, W., Koppmann, R., Meier, R., Müller, K., Solomon, S. J., Steinbrecher, R., Tillmann, R., and Brauers, T.: Technical Note: Intercomparison of formaldehyde measurements at the atmosphere simulation chamber SAPHIR, Atmos. Chem. Phys., 8, 2189–2200, https://doi.org/10.5194/acp-8-2189-2008, 2008.
Wolfe, G. M., Nicely, J. M., St. Clair, J. M., Hanisco, T. F., Liao, J., Oman, L. D., Brune, W. B., Miller, D., Thames, A., and González Abad, G.: Mapping hydroxyl variability throughout the global remote troposphere via synthesis of airborne and satellite formaldehyde observations, P. Natl. Acad. Sci. USA, 116, 11171–11180, 2019.
Wu, Y., Nehrir, A. R., Ren, X., Dickerson, R. R., Huang, J., Stratton, P. R., Gronoff, G., Kooi, S. A., Collins, J. E., and Berkoff, T. A.: Synergistic aircraft and ground observations of transported wildfire smoke and its impact on air quality in New York City during the summer 2018 LISTOS campaign, Sci. Total Environ., 773, 145030, https://doi.org/10.1016/j.scitotenv.2021.145030, 2021.
Yang, X., Lu, K., Ma, X., Liu, Y., Wang, H., Hu, R., Li, X., Lou, S., Chen, S., and Dong, H.: Observations and modeling of OH and HO2 radicals in Chengdu, China in summer 2019, Sci. Total Environ., 772, 144829, https://doi.org/10.1016/j.scitotenv.2020.144829, 2021.
Yokelson, R. J., Goode, J. G., Ward, D. E., Susott, R. A., Babbitt, R. E., Wade, D. D., Bertschi, I., Griffith, D. W., and Hao, W. M.: Emissions of formaldehyde, acetic acid, methanol, and other trace gases from biomass fires in North Carolina measured by airborne Fourier transform infrared spectroscopy, J. Geophys. Res.-Atmos., 104, 30109–30125, 1999.
York, D., Evensen, N. M., Martı́nez, M. L., and De Basabe Delgado, J.: Unified equations for the slope, intercept, and standard errors of the best straight line, Am. J. Phys., 72, 367–375, https://doi.org/10.1119/1.1632486, 2004.
Zeng, P., Lyu, X., Guo, H., Cheng, H., Wang, Z., Liu, X., and Zhang, W.: Spatial variation of sources and photochemistry of formaldehyde in Wuhan, Central China, Atmos. Environ., 214, 116826, https://doi.org/10.1016/j.atmosenv.2019.116826, 2019.
Zhang, H., Li, J., Ying, Q., Guven, B. B., and Olaguer, E. P.: Source apportionment of formaldehyde during TexAQS 2006 using a source-oriented chemical transport model, J. Geophys. Res.-Atmos., 118, 1525–1535, 2013.
Zhu, L., Jacob, D. J., Mickley, L. J., Marais, E. A., Cohan, D. S., Yoshida, Y., Duncan, B. N., Abad, G. G., and Chance, K. V.: Anthropogenic emissions of highly reactive volatile organic compounds in eastern Texas inferred from oversampling of satellite (OMI) measurements of HCHO columns, Environ. Res. Lett., 9, 114004, https://doi.org/10.1088/1748-9326/9/11/114004, 2014.
Zhu, L., Mickley, L. J., Jacob, D. J., Marais, E. A., Sheng, J., Hu, L., Abad, G. G., and Chance, K.: Long-term (2005–2014) trends in formaldehyde (HCHO) columns across North America as seen by the OMI satellite instrument: Evidence of changing emissions of volatile organic compounds, Geophys. Res. Lett., 44, 7079–7086, https://doi.org/10.1002/2017GL073859, 2017a.
Zhu, L., Jacob, D. J., Keutsch, F. N., Mickley, L. J., Scheffe, R., Strum, M., González Abad, G., Chance, K., Yang, K., and Rappenglu'ck, B.: Formaldehyde (HCHO) as a hazardous air pollutant: Mapping surface air concentrations from satellite and inferring cancer risks in the United States, Environ. Sci. Technol., 51, 5650–5657, 2017b.