the Creative Commons Attribution 4.0 License.
the Creative Commons Attribution 4.0 License.
 | 23 Apr 2024
Response of protonated, adduct, and fragmented ions in Vocus proton-transfer-reaction time-of-flight mass spectrometer (PTR-ToF-MS)
Fangbing Li
Dan Dan Huang
Linhui Tian
Wen Tan
Liang Zhu
Penglin Ye
Douglas Worsnop
Ka In Hoi
Kai Meng Mok
Yong Jie Li
Volatile organic compounds (VOCs) affect secondary pollutant formation via active chemistry. Proton-transfer-reaction mass spectrometry (PTR-MS) is one of the most important techniques to study the highly variable spatial and temporal characteristics of VOCs. The response of protonated, adduct, and fragmented ions in PTR-MS in changing instrument settings and varying relative humidity (RH) requires rigorous characterization. Herein, we present dedicatedly designed laboratory experiments conducted to investigate the response of these ions for 21 VOCs, including 12 oxygenated VOCs and 2 nitriles, using the recently developed Vocus PTR-MS. Our results show that the focusing ion–molecule reactor (FIMR) axial voltage increases sensitivity by 3 to 4 orders of magnitude but does not significantly change the fractions of protonated ions. Reducing the FIMR pressure, however, substantially increases fragmentation. Applying a high radio frequency (RF) amplitude radially to the FIMR can enhance sensitivity by 1 to 2 orders of magnitude without affecting the protonated ion fractions. The change in big segmented quadrupole (BSQ) amplitude mainly affects sensitivity and protonated ion fraction by modifying ion transmission. The relationship between sensitivity and proton-transfer reaction rate constant is complicated by the influences from both ion transmission and protonated ion fraction. The protonated ions of most VOCs studied (19 out of 21) show less than 15 % variations in sensitivity as RH increases from ∼ 5% to ∼ 85 %, except for some long-chain aldehydes which show a positive RH variation of up to 30 %. Our results suggest that the Vocus PTR-MS can reliably quantify the majority of VOCs under ambient conditions with varying RH. However, caution is advised for small oxygenates such as formaldehyde and methanol due to their low sensitivity and for long-chain aldehydes due to their slight RH dependence and fragmentation.
- Article
(4357 KB) - Full-text XML
-
Supplement
(3151 KB) - BibTeX
- EndNote


Atmospheric volatile organic compounds (VOCs) affect atmospheric chemistry by forming secondary pollutants such as tropospheric O3 (Shao et al., 2016) and secondary organic aerosols (SOA) (Shrivastava et al., 2017). In addition to their low mixing ratios (parts per billion by volume, ppbv, or even lower), the spatial and temporal variabilities in atmospheric VOCs pose another analytical challenge to the study of their atmospheric occurrence, sources, and fates. Mass spectrometry (MS) techniques based on ion-molecule reactions (Ŝpaněl and Smith, 1996) or specifically proton-transfer reactions (Hansel et al., 1995; Lindinger et al., 1998) in a selected ion flow tube (SIFT) have been developed to provide fast-responding measurements of VOCs. These techniques, especially the proton-transfer-reaction MS (PTR-MS), have been widely used in VOC measurements in outdoor and indoor environments (Salazar Gómez et al., 2021; Sekimoto and Koss, 2021; Pagonis et al., 2019; Pleil et al., 2019; Claflin et al., 2021; Schripp et al., 2014; Jensen et al., 2021).
Quantification of VOCs (denoted as M) by PTR-MS relies heavily on their proton-transfer reactions with the hydronium ion H3O+ (Reaction R1). In early SIFT-MS studies where reagent ions include a multitude of H3O+(H2O)n (n=0, 1, 2, 3, etc.) ion series (Ŝpaněl and Smith, 2000), proton-transfer reactions with more hydrated (n≥1) hydronium ions (Reaction R2a) are also important for species with proton affinity (PA) larger than water clusters. In addition, ligand-switching reactions (Reaction R2b) and association reactions (Reaction R3, with N being N2 or O2) are also common, leading to [MH+H2O]+ instead of MH+. Under these circumstances, the quantification of VOCs might be heavily influenced by the water vapor concentration or relative humidity (RH) of the sample. For instance, acetone concentrations in exhaled air were overestimated by 13 % even using both protonated (MH+) and water adduct ([MH+H2O]+) ions for quantification when water vapor varied in the range of (1–10) × 1012 molecules cm−3 (Ŝpaněl and Smith, 2000). A later study (Smith et al., 2001) showed that quantification of other oxygenated VOCs (OVOCs) such as ethyl acetate, diethyl ether, methanol, ethanol, and propanol by SIFT-MS also suffered from RH dependence to various degrees.
For PTR-MS that normally uses the MH+ for quantification, RH dependence was also widely reported. For instance, Warneke et al. (2001) reported that the sensitivity of benzene in PTR-MS decreased significantly with the increase in RH, while Steinbacher et al. (2004) suggested a slight decrease with the increase in RH. Quantification of biogenic volatile organic compounds (BVOCs) was also reported to be slightly affected by RH (Kari et al., 2018). The RH dependence stems from the change in reagent ion distribution, i.e., among H3O+ and H3O+(H2O)n (n≥1), which can lead to the overestimation or underestimation of VOCs if such a dependence is strong because ambient RH is deemed highly variable. Therefore, RH-dependent calibrations for VOC measurements using PTR-MS were normally recommended (de Gouw and Warneke, 2007; Inomata et al., 2008; Sinha et al., 2009; Vlasenko et al., 2010; Cui et al., 2016; Michoud et al., 2018).
Another complication in VOC measurements using SIFT-MS or PTR-MS is that, due to the nucleophilicity of the oxygen atom, protonated OVOCs dehydrate and form fragmented ions (Reaction R4). This reaction often occurs in heavy alcohols, aldehydes, and carboxylic acids (Španěl et al., 1997; Ŝpaněl and Smith, 1998; Hartungen et al., 2004; Baasandorj et al., 2015).
In addition, cleavage on the C–C bond of the protonated ion (R5) is also possible, especially for alkyl-substituted VOCs under high-energy conditions (e.g., a high ratio, which is the reduced electric field parameter with E being the electric field and N the number density of the gas in the drift tube).
For instance, at an ratio of 120 townsend (Td), substituted monocyclic aromatic compounds such as ethylbenzene and propylbenzene start to fragment into a benzenium ion (C6H (de Gouw et al., 2003; Gueneron et al., 2015).
A newly designed focusing ion-molecule reactor (FIMR) was used for PTR-MS, termed Vocus PTR-MS, and has been shown to have little RH dependence for the protonated ion because of the high concentration of water vapor introduced into the FIMR (Krechmer et al., 2018). The concentration of hydronium ion (H3O+) in the FIMR is high enough to be maintained at a constant level and dominate over other side reactions, thereby minimizing the RH dependence for VOC measurement. Yet, the formation of adduct ions and fragmented ions in Vocus PTR-MS as a function of RH has not been fully scrutinized, hindering a complete understanding of the ion chemistry in the Vocus PTR-MS and potential cross interference when measuring ambient air with complex VOC mixtures. Herein, we conducted experiments on the effects of instrument settings and RH variations on the quantification of 21 VOCs, including 12 OVOCs and 2 nitriles, using a Vocus PTR-MS. The responses of protonated ions (MH+), adduct ions ([MH+H2O]+), and fragmented ions ([MH–H2O]+ or [MH−CxHy]+) to these VOCs were investigated as a function of instrument setting and RH. Results are interpreted based on the PA values and/or proton-transfer reaction rate constants (kptr). Some caveats to using the Vocus PTR-MS to measure VOCs, especially OVOCs, are also provided.
2.1 Instrument settings
Experiments were performed with a Vocus proton-transfer-reaction time-of-flight mass spectrometer (PTR-ToF-MS, Vocus 2R, TOFWERK AG, Thun, Switzerland), hereinafter referred to as Vocus. The Vocus consists of (i) a discharge ion source, (ii) a focusing ion-molecule reactor (FIMR), (iii) a big segmented quadrupole (BSQ), (iv) a series of direct current (DC) optics that further focus and accelerate the primary beam (PB), and (v) a time-of-flight (ToF) mass analyzer (Krechmer et al., 2018). The ion source is a plasma discharge composed of two conical surfaces. Water vapor is supplied by purging 20 to 30 mL of Milli-Q water and is ionized by plasma discharge. The reagent ions pass through a ring offset from the central axis so that the photons generated by the discharge cannot enter. The drift tube was improved by replacing the stacked ring electrodes of the traditional PTR-MS with a FIMR, which is a glass tube with a resistive coating on the inner surface, and a quadrupole with a radio frequency (RF) electric field was applied. The FIMR increases ion transmission by a factor of 7 to 9 and sensitivity by more than 1 order of magnitude (Krechmer et al., 2018). Moreover, the mean kinetic energy of H3O+ is increased by 3 times, and the formation of more hydrated hydronium ions is reduced, suppressing RH dependence for most VOCs measured (Krechmer et al., 2018). Meanwhile, the mean kinetic energy of VOCs measured is not significantly increased, thereby minimizing fragmentation (Krechmer et al., 2018). The ToF mass analyzer offers a mass-resolving power of 12 000 at a mass-to-charge ratio ( of 107 thomson (Th).
In our experiments, sample air was drawn into the instrument using perfluoroalkoxy (PFA) Teflon tubing of ∼ 0.5 m length and 1/4 in. outer diameter, with a flow rate of 0.5 L min−1. Most of the sample air was directed to the exhaust, while the actual flow into the FIMR was around 0.15 L min−1. In typical experiments, the FIMR was operated at a pressure of 2.0 mbar and a temperature of 373.15 K. The axial and radial voltages were normally set to 625 and 500 V, respectively, unless stated otherwise.
We also performed experiments by varying the instrument settings such as the FIMR axial voltage (V) and pressure (p), both of which affect the ratio, as well as RF and BSQ amplitudes to investigate how protonated, adduct, and fragmented ions respond to those changes. These experiments were performed under dry (RH ∼ 5 %) conditions, and the concentrations were approximately 12 ppbv for most VOCs (except for β-caryophyllene at about 1.2 ppbv). The instrument settings were varied by (1) changing the FIMR axial voltage from 260 to 700 V, (2) changing the pressure in the FIMR from 1.5 to 3.5 mbar, (3) changing the RF amplitude from 13 to 500 V (with p of 2.0 or 3.5 mbar), and (4) changing the BSQ voltage from 50 to 300 V (with p of 2.0 or 3.5 mbar). The other instrument settings were fixed as the default values while changing the tested ones. Specifically, the RF amplitude was at 500 V and the BSQ amplitude was at 300 V when changing E (i.e., V) and N (i.e., p), and an ratio of 142 Td was used when changing RF and BSQ amplitudes (Table S1 in the Supplement).
2.2 Experimental setup
The VOCs (Table S2 and Fig. 1) in mixtures from two cylinders were separately delivered to the dilution and/or RH control setup (Fig. S1). Dilution air was generated from a zero-air generator (Environics series 7000, Environics Analytics Group Ltd., Canada). Gas cylinder I (Table 1, Apel-Riemer Environmental Inc., United States; valid for 12 months) contains mainly hydrocarbons, while gas cylinder II (Table 1, Linde Gas, United States; valid for 12 months) contains mainly OVOCs and nitriles. Most VOCs in the cylinders are at approximately 1000 ppbv, except for β-caryophyllene, which is at approximately 100 ppbv. Table S2 shows their Chemical Abstracts Service (CAS) numbers and values of the protonated ions (MH+), as well as PA and kptr values. According to their functional groups, the 21 VOCs are grouped into nine categories, and Fig. 1 shows their structures. Note that although n-butanal and methyl ethyl ketone are isomers, they are in different cylinders and measured separately and thus will not interfere with each other.
Dry experiments were performed by diluting the VOCs from the cylinders with dry zero air with seven concentrations from 0 to approximately 22 ppbv (or approximately 2 ppbv for β-caryophyllene). For each concentration step, measurements lasted for about half an hour for gas cylinder I with hydrocarbons but about 2 h for gas cylinder II with OVOCs and nitriles. The 2 h stabilization time for cylinder II, which contained mainly OVOCs and nitriles, should be sufficient because even with half-an-hour stabilization time for cylinder I, the overlapping species acetone and acetaldehyde showed deviations of less than ±1.5 % in sensitivity. Other measures, such as minimizing the length of the Teflon tube at the inlet (less than 30 cm), were also undertaken to allow the fast establishment of equilibrium-state concentrations for OVOCs. In RH-dependent experiments (Fig. S1), dilution was made by RH-conditioned air produced from a humidity generator (OHG-4, Owlstone, United States). The accuracy of the RH sensor (RH-USB Probe, Omega) is within 4 % of RH. Nine RH ramping steps from ∼ 5 % to ∼ 85 % with approximately 10 % intervals were used, and the VOCs were set with four concentrations from 0 to approximately 12 ppbv (or approximately 1.2 ppbv for β-caryophyllene). After the initial equilibration of 0.5 h under dry conditions (RH ∼ 5 %), each RH ramping lasted for 15 min. Triplicate experiments were performed for the highest concentration.
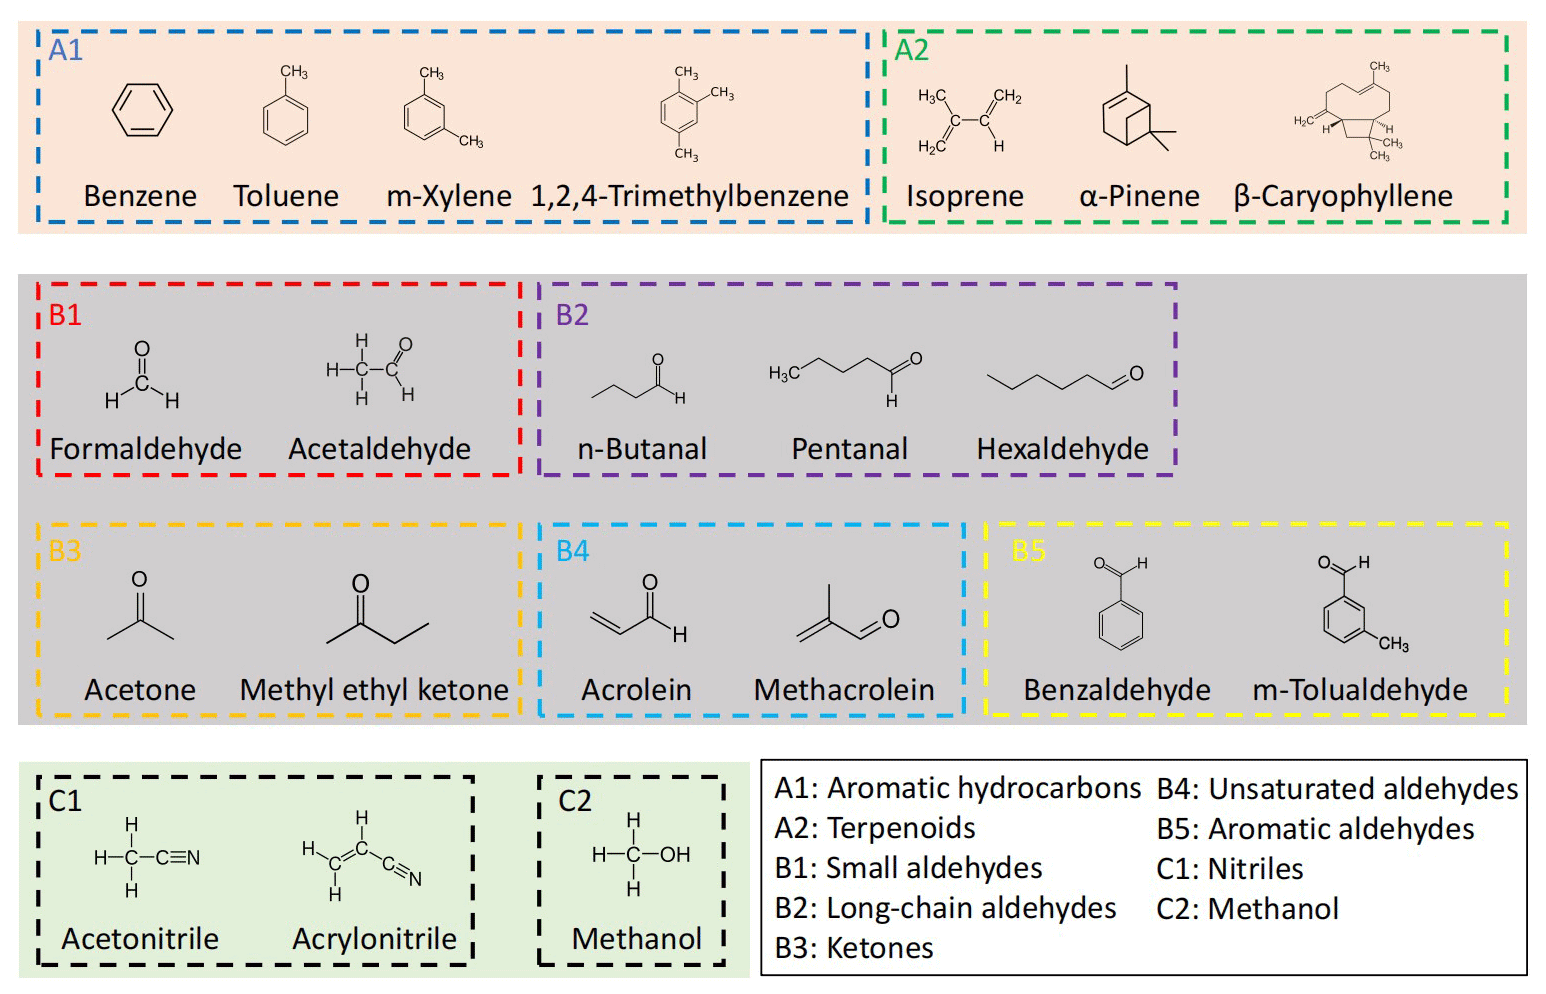
Figure 1Names, structures, and grouping of the 21 VOCs in this study. These VOCs were prepared in two gas standard cylinders (I and II) with mixing ratios of ∼ 1000 ppbv (∼ 100 ppbv for β-caryophyllene) balanced by N2. Acetaldehyde and acetone are present in both gas standard cylinders, with concentrations differing by < 5 %. n-Butanal and methyl ethyl ketone are isomers but are in different gas standard cylinders.
2.3 Data analysis
The Vocus data were analyzed with the manufacturer-supplied software package Tofware (v3.2.3) based on IGOR Pro (WaveMetrics). Peak fitting was performed using Tofware routines and the measured values of the pronated ions (MH+) are shown in Table S2 together with their exact values. In addition to MH+, we also looked for adduct ions ([MH+H2O]+) and fragmented ions ([MH−H2O]+ or [MH−CxHy]+), since those ions are also anticipated for VOCs, especially OVOCs, in PTR-MS measurements (Pagonis et al., 2019). Although the VOCs were in mixtures and showed ensemble mass spectra, we constructed the mass spectrum for each VOC by plotting their identified adduct or fragmented ions alongside the protonated ions, as shown in Figs. S2–S4 in the Supplement. Their percentage contributions are presented in Fig. 2 and numerically in Table S4.
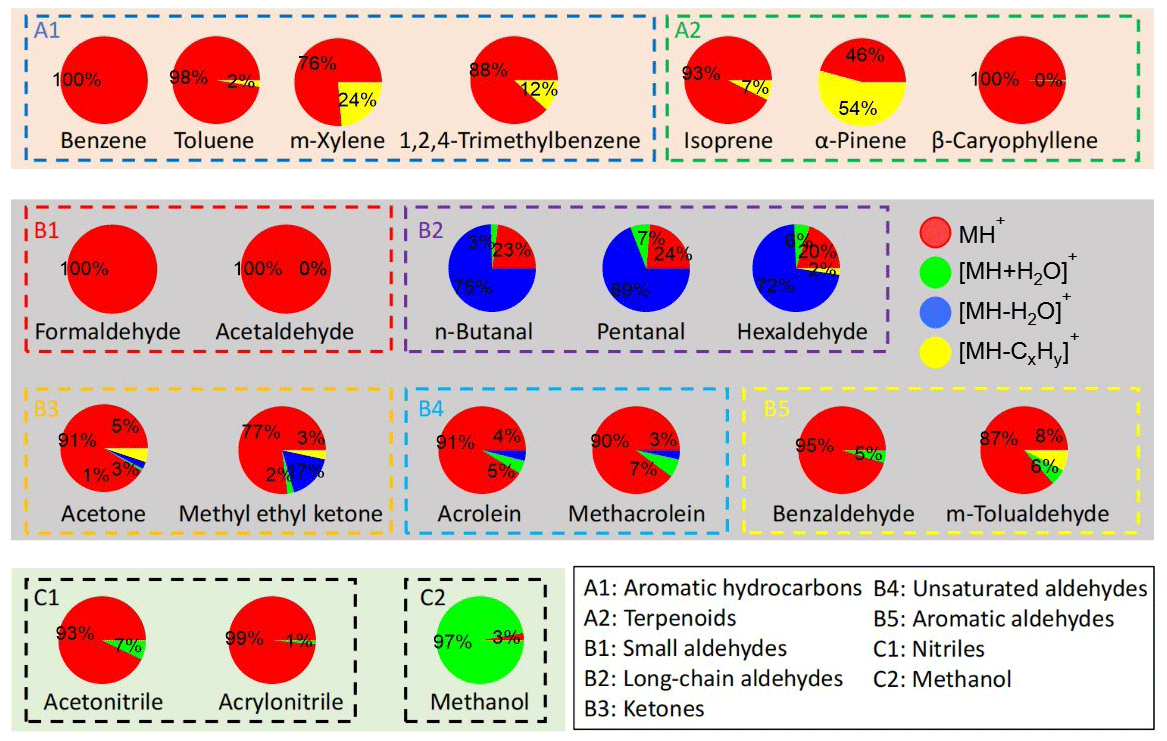
Figure 2The average signal percentages of protonated, adduct, and fragmented ions at a concentration of ∼ 12 ppbv (∼ 1.2 ppbv for β-caryophyllene).
For both dry and RH-dependent experiments from the 1 min averages from 1 Hz data sets, the last five points were averaged to obtain stable signals. Figure S5 shows the time series of selected hydrocarbons (groups A1 and A2, aromatic hydrocarbons and terpenoids, Fig. S5a) and OVOCs (groups B2 and B5, long-chain and aromatic aldehydes, Fig. S5b) during dry experiments with concentration stepping. Figure S6 shows the time series of protonated ions (MH+), adduct ions ([MH+H2O]+), and fragmented ions ([MH–H2O]+ and/or [MH−CxHy]+) for n-butanal, pentanal, and hexaldehyde, whose adduct and fragmented ions contributed substantially to the total signals (Fig. 2 and Table S4). Some dealkylated fragments ([MH−CxHy]+) of long-chain aldehydes (e.g., n-butanal and pentanal) might overlap with the protonated ions ([MH]+) of unsaturated aldehydes (i.e., acrolein and methacrolein). Since the intensities of the former are expected to be low by analogy with that of hexaldehyde (∼ 2 %, Fig. 2), however, the ions at those m/Q values are only considered to be the protonated ions of unsaturated aldehydes (the latter).
Similarly to RH-dependent experiments, the duration of each instrument setting experiment was 15 min. The signal intensities, as well as the relative proportions of MH+, [MH + H2O]+, and [MH − H2O]+ (and/or [MH − CxHy]+), were presented in Figs. S7 to S10 for two representative hydrocarbons (α-pinene and 1,2,4-trimethylbenzene) and two OVOCs (acetone and hexaldehyde). These measurements were conducted across varying axial voltages and pressures (both factors that influence the ratio) within the FIMR, as well as with adjustments to the RF amplitude and BSQ amplitude. The reduced electric field parameter ( ratio) was estimated by comparing the signal fraction of fragment of α-pinene in Materić et al. (2017), in which detailed examination of fragment signal fraction at different ratio was performed (Fig. S11).
2.4 Sensitivity estimation
The formation of the protonated ion MH+ via Reaction (R1) is desirable for quantification of VOCs, which is described by the kinetics of the proton-transfer reaction (de Gouw and Warneke, 2007; Yuan et al., 2017):
where [MH+] is the number concentration of the protonated ion and [H3O+]0 that of the initial hydronium ion, k is the rate constant of R1 (kptr), [M] is the number concentration of the target VOCs in the sample air, and Δt is the reaction time in the FIMR. Two conditions allow simplification of Eq. (1) to Eq. (2) below for the easy quantification of VOCs: (1) the term k[M]Δt is much smaller than 1, such that R1 can be considered essentially first-order, and (2) H3O+ is not significantly depleted and remains more or less constant after the FIMR. Compared with traditional ion sources, the Vocus ion source produces sufficient H3O+ (Krechmer et al., 2018). Ambient levels of ppbv (or less) for [M] (∼1010 molecule cm−3) generally fulfill such requirements, given that kptr is on the order of 10−9 cm3 molecule−1 s−1 and Δt is on the order of 10−4 s (Ellis and Mayhew, 2014). Therefore,
where [H3O+] is the number concentration of hydronium ions after the FIMR (i.e., being detected in the mass spectrometer). Then,
where and are signal intensities of the protonated ion and the hydronium ion, respectively.
In general, the sensitivity (S) of PTR-MS for quantification of VOCs is defined as the ratio between the signal intensity normalized by 106 cps (counts per second) of and 1 ppbv (10−9 mol mol−1) of VOCs, i.e.,
where N is the number density of air (N in Reaction R3) in the FIMR. The sensitivity S is thus expressed as a normalized signal per ppbv, having a unit of ncps ppbv−1. Combining Eqs. (3) and (4) yields
where 10 is specific to the instrument settings. Equation (5) dictates that S should have a linear relationship with the proton-transfer reaction rate constant (kptr) if the instrument settings are fixed and can be utilized to predict S if kptr values are known (Ellis and Mayhew, 2014).
In reality, however, the quantification of VOCs using MH+ from PTR-MS measurements is complicated by (1) formation of adduct (e.g., with H2O) and fragmented (e.g., dehydration) ions and (2) discriminated transmission for MH+ ions with different values (de Gouw and Warneke, 2007; Yuan et al., 2017). The fraction of MH+ in all related ions ( and the relative transmission efficiency ( are used to account for these two effects, respectively.
In our study, the sensitivity is expressed as the slope of signal intensity (in counts per second, cps) vs. concentration (in ppbv) having a unit of cps ppbv−1 (Fig. S12). Signal normalization to H3O+ (ncps) was not adopted because the signal of H3O+ ( Th) was substantially suppressed with low transmission (see below) for those ions with small values (but too-high intensities) to minimize ion currents.
3.1 Effects of instrumental settings on the ion signals
An increase in the ratio from 48 to 142 Td manifested by the increases in the FIMR axial voltage (V, with front from 226 to 666 V and back keeping at 34 V) led to drastic increases in MH+ signal intensity by 3 to 4 orders of magnitude for all VOCs studied (Fig. 3a). Such increases were also observed for adduct and fragmented ions (Figs. S7–S10), albeit to different extents. It has been shown that increasing the axial voltage in the FIMR can substantially increase protonated ion signals mainly due to three reasons (Krechmer et al., 2018; de Gouw and Warneke, 2007). First, a high FIMR axial voltage can accelerate the ions and thus reduce their residence time, thereby preventing diffusional loss. Second, the high voltage in the FIMR significantly increases the concentration of all reagent ions (Fig. S13). Lastly, at high voltages, reactions between some OVOCs (such as acetone) and H3O+ lead to more protonated ions (MH+) instead of adduct ions ([MH+H2O]+) through ligand-switching reactions (Reaction R2b). This last result was believed to be less significant for species that do not readily react with H3O+(H2O)n (such as aromatics and terpenoids).

Figure 3The ratio of the logarithm of intensity (panels a, b, and c) and the difference in fractional signal of the protonated ion (MH+) among all ions (panels d, e, and f) when changing axial voltage (V) or FIMR pressure (p) (panels a and d), RF amplitude (panels b and e), and BSQ amplitude (panels c and f). The ratios were taken after taking the logarithm of the signal intensities of MH+ on the right-hand side of the instrument setting (after the arrow) to that on the left-hand side of the instrument setting stated in the panel label; likewise, the fractional differences are the fractions of the MH+ signal among the protonated, fragmented, and adduct signals under these two instrument settings.
To investigate whether the desired MH+ is indeed more favorably formed by suppressing Reaction (R2b) under high axial voltages, we plot the differences in the signal fractions of MH+ between axial voltages of 666 V and 226 V (Fig. 3d). The results show that about one-third of the 21 VOCs do not have significant differences in the signal fractions: most VOCs in this one-third have MH+ as the sole or dominating ion observed (cf. Fig. 2). Meanwhile, about one-third of the VOCs show negative differences (i.e., decreasing MH+ fractions) of up to 0.2, including the two hydrocarbons and two OVOCs shown in panel d of Figs. S7–S10. The remaining one-third of the VOCs show positive differences (i.e., increasing MH+ fractions) of up to 0.3, mainly for unsaturated or aromatic aldehydes, as well as nitriles (Fig. 3d). A closer inspection of the fractional changes as axial voltage increases for acetone (Fig. S9d) and hexaldehyde (Fig. S10d) reveals that the fractions of both MH+ and [MH+H2O]+ decrease, while those of fragmented ions ([MH−H2O]+ and/or [MH−CxHy]+) increase. The relative decreases in the signal fractions of MH+ (8 % for acetone and 51 % for hexaldehyde) are, however, much lower than those of [MH+H2O]+ (57 % for acetone and 80 % for hexaldehyde). These observations suggest that while fractions of both MH+ and [MH+H2O]+ decrease, the decreases in the adduct ion ([MH+H2O]+) are more significant. This supports the third explanation above that more H3O+ (instead of H3O+(H2O)n) at higher axial voltages react with these OVOCs. However, as the voltage increases, all ion signals increase (Figs. S7a–S10a). This observation illustrates that the ion acceleration and diffusion prevention should be the primary cause of signal enhancement at high axial voltages. Nevertheless, the signal fractions of the MH+ do not change substantially (within 30 %) as the FIMR axial voltage increases, making quantification reliable even for species with high signal contributions from adduct and fragmented ions (e.g., long-chain aldehydes, group B2; cf. Fig. 2).
The increase in ratio by decreasing the FIMR pressure from 3.5 to 1.5 mbar increases signal intensities (Fig. S14a) of MH+ by less than 1 order of magnitude or even decreases those for some OVOCs such as long-chain aldehydes. The changes in the signal fractions of MH+ (Fig. S14d), on the other hand, are more than those when changing axial voltages, especially for ketones, unsaturated aldehydes, aromatic aldehydes, and nitriles. The increase in pressure in the PTR reactor also favors the formation of reagent clusters H3O+(H2O)n, which leads to the formation of adduct ions (Wang et al., 2020). For OVOCs (acetone and hexaldehyde), the fractions of MH+ increase when FIMR pressure decreases from 3.5 to 2.5 mbar ( ratio from 162 to 95), which is accompanied by significant decreases in the adduct ion [MH+H2O]+ (Figs. S9j and S10j). This observation suggests less formation of adduct ions at lower FIMR pressures. A further decrease in FIMR pressure to 1.5 mbar, however, results in slight decreases in MH+ fractions in lieu of increases in fragmented ions [MH−H2O]+ and [MH−CxHy]+ (Figs. S9j and S10j); for hydrocarbons α-pinene and 1,2,4-trimethylbenzene (Figs. S7j and S8j) that only have MH+ and [MH−CxHy]+, continuous decreases in MH+ fractions and increases in [MH−CxHy]+ are observed for the whole range of FIMR pressure tested (3.5 to 1.5 mbar). A recent study using Vocus PTR-MS to measure organic peroxides also observed that less fragmented ions were formed under higher FIMR pressure (Li et al., 2022) presumably due to the efficient transfer of excess kinetic energy by frequent collisions at higher pressures. A medium FIMR pressure of 2.0 mbar was chosen to have relatively low fractions of both adduct ions ([MH+H2O]+) and fragmented ions ([MH−H2O]+ and [MH−CxHy]+).
The radial RF electric field in the FIMR is unique for the Vocus PTR-MS, which can (1) collimate the ions towards the central axis (especially heavier ions) and (2) increase the kinetic energy of the ions (especially for lighter ions) (Krechmer et al., 2018). These effects led to signals 1 to 1.5 orders of magnitude higher for MH+ at 2.0 mbar of FIMR pressure (Fig. 3b) and 1.5 to 2 orders of magnitude higher at 3.5 mbar (Fig. S14b) when the RF amplitude was changed from 13 to 500 V. The additional enhancement of signal intensity at a higher FIMR pressure (i.e., 3.5 mbar compared to 2.0 mbar) can be attributed to a longer residence time of the reagent ions (Krechmer et al., 2018). The more pronounced increase in kinetic energy for lighter ions (e.g., H3O+) than heavier ions (i.e., clusters H3O+(H2O)n) might imply the favorable formation of the protonated ion MH+ rather than adduct ions. The fractions of MH+ for different RF amplitudes do not change significantly (within ±0.2) at either 2.0 mbar (Fig. 3e) or 3.5 mbar (Fig. S14e). This observation suggests that adding the RF can increase signal intensities by 1–2 orders of magnitude but does not affect the fractional signal for MH+, making it beneficial for accurate quantification.
The BSQ amplitude above 100 V does not change the signal intensities significantly (Figs. 3c and S14c, as well as Fig. S7–S10). The BSQ ion guide provides a high-pass band filter to reduce the number of ions (thus signal intensity) of low m/Q values (especially for reagent ions, H3O+, with high ion currents), preventing the fast degradation of the microchannel plate (MCP) detector (Krechmer et al., 2018). As will be discussed below, this high-pass band filter leads to lower ion transmission efficiency (< 1) for ions with smaller values. Therefore, the signal reduction when the BSQ amplitude increases from 100 to 300 V is more obvious for small analytes such as formaldehyde, acetonitrile, and methanol (Figs. 3c and S14c). For other analytes whose fragmented ions have values of less than 60 Th, the signal fractions of MH+ would also be affected (Figs. 3f and S14f). For example, the intensities of fragmented ions [MH−H2O]+ (CH3CCH, Th) and [MH−CxHy]+ (CH3CO+, Th) for acetone had substantial decreases when BSQ amplitude was higher than 200 V (Figs. S9c and S10). The protonated ion MH+ (CH3COCH3H+, Th) and adduct ion (CH3COCH3H3O+, Th), however, remained less unaffected. This effect leads to noticeable changes in the signal fractions of MH+ (maximum 0.4) for small analytes such as ketones, unsaturated aldehydes, nitriles, and methanol (Figs. 3f and S14f) as the BSQ amplitude changes from 100 to 300 V.
3.2 Sensitivity and transmission of protonated ions
We calculated the sensitivity and transmission of the protonated ions (MH+) for the 21 VOCs studied when the instrument was under the optimized conditions. Table 1 shows the sensitivities (cps ppbv−1) as slopes of MH+ signals vs. mixing ratios (average value from 0 to 22 ppbv under dry conditions, except for β-caryophyllene to 2 ppbv) and the limit of detection (LOD, 3σ). Panels a and b in Fig. 4 show the sensitivity vs. kptr for all 21 VOCs, while panels c and d show the transmission efficiencies calculated from the division of the sensitivity vs. kptr ratio for each VOC by the slope fitted in Fig. 4a and b.
Except for formaldehyde (A2-1) and methanol (C2-1), whose MH+ ions have values much lower than 60 Th, and β-caryophyllene (A2-3), which came with a very low concentration range, most VOCs had sensitivities above 1000 cps ppbv−1. In addition to its low values that limit the transmission, the backward reaction is also an important reason for the low sensitivity. For instance, formaldehyde has a low PA value (712.5 kJ mol−1) that is not much higher than that of water (691.0 kJ mol−1) and has been shown to have a high tendency of backward reaction of Reaction (R1) (Inomata et al., 2008; Vlasenko et al., 2010; Warneke et al., 2011). The two compounds in group B5 (aromatic aldehydes), benzaldehyde and m-tolualdehyde, had the highest sensitivities of > 12 000 cps ppbv−1. This might be due to their high PA values (> 830 kJ mol−1), which are among the highest except for those of terpenoids (Table S2).
Table 1Sensitivity (slope), intercept, and limit of detection (LOD) based on 3 standard deviations (σ) and cylinder numbers (no.). Results were obtained from measurements of 0–22 ppbv for all VOCs except for β-caryophyllene (up to ∼ 2 ppbv). The cylinder numbers for the VOCs studied are also shown here.

a A1: aromatic hydrocarbons, A2: terpenoids, B1: small aldehydes; B2: long-chain aldehydes, B3: ketones, B4: unsaturated aldehydes, B5: aromatic aldehydes, C1: nitriles, C2: methanol. b The average value from gas cylinders I and II, with a deviation of less than ±1.5 %.; c low sensitivity and high LOD due to low transmission.
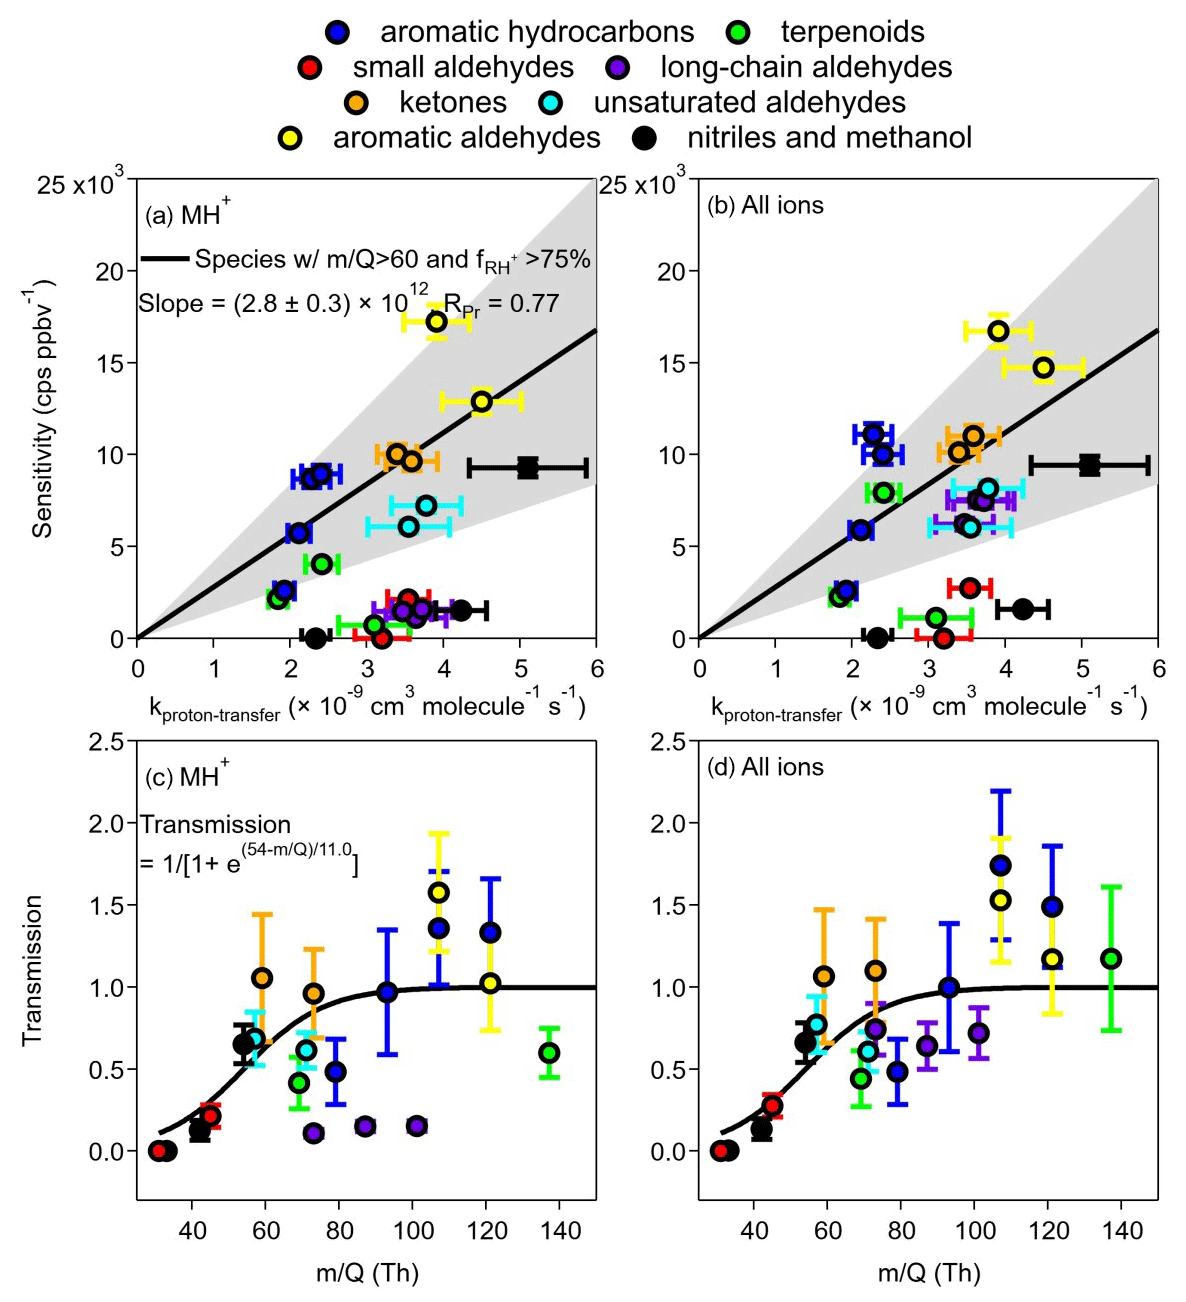
Figure 4Sensitivity as a function of kptr for (a) MH+ and (b) all ions. Linear fitting was performed only for MH+ sensitivity. Species included in the fitting were those with value > 60 Th (Table S2) and signal percentage of MH+ ( % (Table 1). The grey-shaded area is bounded by 0.5 × slope 2 × slope. The fitted curve in panel (b) is the same as in panel (a) and is for reference only. Panels (c) and (d) are transmission curves from MH+ only and from the sum of all ions, respectively. The sigmoidal curve for MH+ (same for c and d) was fitted from species except for β-caryophyllene, α-pinene, n-butanal, pentanal, and hexaldehyde, whose fragmentation was significant. Note that only the values of MH+ were used on the x axes of panel (c) and (d), although panel (d) contains information for adduct and fragmented ions that have values different from that of MH+, which does not consider the differences in values of adduct and fragmented ions.
It was shown that the sensitivities for different VOCs in PTR-MS can be calculated from the kinetics of the proton-transfer reactions (Warneke et al., 2003; Sekimoto et al., 2017; Cappellin et al., 2012). For Vocus, Krechmer et al. (2018) also pointed out that the relationship between sensitivity and kptr can be established and used to calculate the sensitivity for other compounds. We herein compare the relationship between sensitivity and kptr (Fig. 4a). In our data, the uncertainties for sensitivity were conservatively taken as the maximum percentage uncertainty (5.3 %) of fitted slopes. Values of kptr were calculated as averages of both modeled and experimental results found in the literature (Table S3), with uncertainties propagated from an estimated percentage error of 15 % for both modeled (Zhao and Zhang, 2004) and experimental values. The anticipated linear relationship of sensitivity vs. kptr is not easily visible, most likely due to the formation of fragments/adducts for some VOCs and low transmission efficiencies for others. However, a relatively improved linear relationship was found if we limit the VOCs to values for MH Th and a fraction of MH+ ion in all ions (including adduct/fragmented ions) larger than 75 % (cf. Fig. 2). With these limitations, the fitted linear line gives a slope of (2.8±0.3) ×1012 cps ppbv−1 molec s cm−3, approximately 38 % lower than that [(4.5±0.4) ×1012 cps ppbv−1 molec s cm−3] of Krechmer et al. (2018). Pearson's R (RPr) is 0.77. A grey area is also shown by two lines of 2 × slope and 0.5 × slope, which includes approximately half (10) of the VOCs studied. Those that fall outside of the grey area and into the lower region are mainly compounds in groups B2 (long-chain aldehydes, purple), C1 and C2 (nitriles or methanol, black), B1 (small aldehydes, red), and A2 (terpenoids, green). Using the total signals of all ions (protonated, adduct, and fragmented), Fig. 4b shows the improvements for compounds in group B2 only, while others (especially those in C1, C2, and B1) do not move up to the grey area.
We also calculated the transmission efficiencies (Fig. 4c and d) from the division of the sensitivity vs. kptr ratio for each VOC by the slope fitted in Fig. 4a. It is shown that compounds in groups B1, C1, and C2 are mainly on the rising range of the sigmoidal curve, while the three long-chain aldehydes in group B2 (purple) are well below the curve if only MH+ ions were used; these three long-chain aldehydes move up to transmission >0.5 when all ions are considered (Fig. 4d). Of particular interest is the compound α-pinene, whose transmission was < 0.5 when only the MH+ ion was used but increases to about 1.5 when the fragmented ion was considered. Note that in Fig. 4d, the value of MH+ was used for the x axis for the summed ion signals, which might lead to certain bias as the fragmented and adduct ions have different values. Nevertheless, the above analysis suggests that both the formation and transmission of adduct/fragmented ions affect the relationship between sensitivity and kptr, requiring precaution when using predicted sensitivity directly from kptr. In addition, one needs to be cautious regarding the prediction of transmission efficiency with greater than 150.
3.3 RH dependence of ion signals
One of the most important causes of RH dependence is that the distribution of reagent ions might vary with ambient RH, especially when the abundance of H3O+ in the PTR reactor is not high. While the Vocus has been shown to have abundant H3O+ (Krechmer et al., 2018), whether it can substantially minimize RH dependence for most VOCs deserves scrutiny. Figure 5a–h show the relative sensitivity defined as the relative change in sensitivity of MH+ ion vs. VOC concentration under different RH conditions. Among the nine groups of VOCs studied, seven groups show almost flat relative sensitivities within the RH range of ∼ 5 % to ∼ 85 % (298 K), with the exception of long-chain aldehydes (group B2) that show increasing sensitivities as RH increases (Fig. 5d) and methanol (group C2) showing large variations (Fig. 5h). Some other compounds, such as β-caryophyllene (A2-3, Fig. 5b) and formaldehyde (B1-1, Fig. 5c), also show either relatively large uncertainties or fluctuations, which can be ascribed to their low intensities (cf. Table 1).

Figure 5The dependence of the MH+ signals on RH for the VOCs studied. Panels (a)–(h) illustrate the relative sensitivity calculated as the slope (sensitivity) under all conditions compared to that under the dry (RH < 5 %) condition. Panel (i) shows the percent change in relative sensitivity per 10 % RH increase. See Figs. S15–S17 for other ion signals.
Figure 5i shows the RH dependence of the MH+ ions, defined as the percentage change in sensitivity per 10 % RH increase, for all 21 VOCs studied. Aromatic hydrocarbons (group A1) show negative RH dependence as in previous studies using PTR-MS with a drift tube (Warneke et al., 2001; Steinbacher et al., 2004). While previous studies reported decreases in benzene sensitivity by 16 %–56 % from dry to humid conditions (up to 100 % RH), our results show a decrease of less than 1.1 % per 10 % RH increase (i.e., < 11 % in the whole RH range) with a somewhat narrower RH range (up to ∼ 85 % RH). In addition, two out of the three terpenoids (group A2) also show slightly negative RH dependence, and the other one (α-pinene) shows very small positive RH dependence (Fig. 5i). These hydrocarbons (aromatics and terpenoids) in groups A1 and A2 have relatively low kptr values (mostly < cm3 molec−1 s−1, Table S3), and their RH dependence shows a fairly strong correlation with the PA value (Fig. 6a, purple circles and squares). This observation suggests that there might be a thermodynamic reason behind the noticeable decrease in sensitivity for hydrocarbons such as benzene as RH increases. Since hydrocarbons such as benzene and toluene do not readily react with H3O+(H2O) (Warneke et al., 2001), Reaction (R1) is the main reaction required to form MH+. As water vapor concentration increases at high RH, the reverse reaction of Reaction (R1) might be important for compounds with low PA and low kptr values (Inomata et al., 2008).
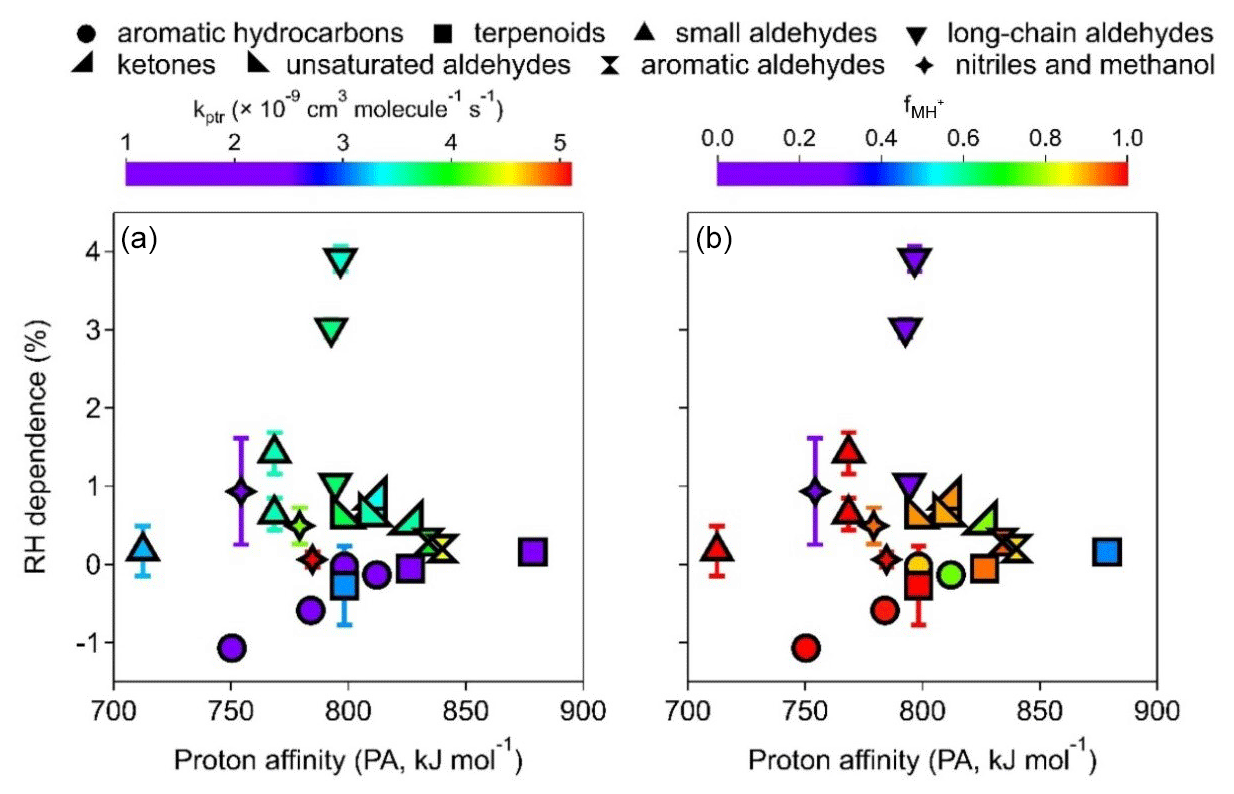
Figure 6The RH dependence of the MH+ ion plotted against PA, color-coded by (a) kptr and (b) .
Long-chain aldehydes (group B2) have the largest RH dependence of 1 %–4 % positive deviation per 10 % RH increase for the MH+ ions. The RH dependence of the [MH+H2O]+ ions (Fig. S15g) is much higher (1.4 %–8.5 % positive deviation per 10 % RH increase). Interestingly, the trends of RH dependence for the MH+ ions and that for the [MH+H2O]+ ions for long-chain aldehydes are exactly opposite (Figs. 5i and S15g); i.e., pentanal > n-butanal > hexaldehyde. The reason behind this observation is out of the scope of this study. The dominating [MH−H2O]+ ions for long-chain aldehydes (Fig. 2), however, show much less (± 1 % per 10 % RH increase) RH dependence (Fig. S16i). Other carbonyl compounds (groups B1, B3, B4, and B5) also show positive deviations as RH increases (less than 1.5 % increase in sensitivity per 10 % RH increase), albeit to various degrees (Fig. 5i). Similarly to long-chain aldehydes, the [MH+H2O]+ ions also show a large positive deviation (Fig. S16g), and [MH−H2O]+ ions show little RH dependence (Fig. S16e). These carbonyl compounds (except formaldehyde) have medium PA values (Fig. 6a). If we exclude formaldehyde (with an extremely low PA value, the upward-pointing triangle to the far left in Fig. 6b) and long-chain aldehydes (low percentages of MH+ ions, < 25 %, downward-pointing triangles in Fig. 6b), the RH dependence of other carbonyl compounds shows a slightly decreasing trend of RH dependence vs. PA values (Fig. 6b, upward-pointing triangles, left-pointing triangles, right-pointing triangles, and double triangles). These observations might hint at the relationships between the RH dependence of carbonyl compounds and reagent ion distribution as well as the reaction direction for Reactions (R1)–(R4), which is different from those for pure hydrocarbons (groups A1 and A2). Finally, the RH dependence of MH+ for compounds in groups C1 (nitriles) and C2 (methanol) is within +1 % per 10 % RH increase (Fig. 5i).
Overall, in the whole RH range studied (∼ 5 % to ∼ 85 %), the RH dependence of MH+ ions for the 21 VOCs studied is less than 30 %, with most compounds (except group B2, long-chain aldehydes) less than 15 %. For [MH+H2O]+ ions (mainly for carbonyl compounds), strong RH dependence was observed (Fig. S15) at 1.4 %–8.5 % per 10 % RH increase or 8.9 %–63.2 % from ∼ 5 % to ∼ 85 % RH. The dehydrated ions ([MH−H2O]+), however, show the smallest RH dependence (± 1 % per 10 % RH increase) among all the ions (Fig. S16). Fragmented ions with decarbonization ([MH−CxHy]+) show a mainly negative RH dependence of generally less than 3 % per 10 % RH increase (Fig. S17).
We investigated the response of protonated, adduct, and fragmented ions of 21 atmospherically relevant VOCs in a Vocus PTR-MS as instrument settings and RH conditions vary. For the two ways of increasing the ratio, increasing the FIMR axial voltage can substantially (by 3 to 4 orders of magnitude) increase sensitivity but does not change the fractions of the MH+ ions (mostly within 30 %); reducing the FIMR pressure, however, does not enhance sensitivity much but can lead to more substantial fragmentation. Therefore, a high FIMR axial voltage of 600–700 V and a medium pressure of around 2.0 mbar are recommended. Increasing the RF amplitude of the FIMR can increase sensitivity by 1 to 1.5 orders of magnitude at 2.0 mbar and 1.5 to 2 orders of magnitude at 3.5 mbar, and it does not change the MH+ ion fractions (within 20 %). Therefore, a high RF amplitude of 500 V is recommended. Increasing the BSQ amplitude does not increase the sensitivity much but changes the MH+ ion fractions of small ions substantially by changing the transmission efficiency. The choice of this instrument setting mainly relies on which ions (i.e., those reagent ions with an abundance that is too high) one wishes to filter out. Our selected setting is 300 V, which gives a 50 % transmission at about 55 Th.
The relationship between sensitivity and kptr is strongly affected by two factors, including whether the MH+ ion has a high transmission efficiency and whether the MH+ ion is the dominating ion. When both conditions are met, a fairly strong correlation (RPr=0.77) was observed for the VOCs studied. The transmission curve also more reasonably resembles the sigmoid function only if all the ions (protonated, adduct, and fragmented) are considered. The low transmission efficiencies of formaldehyde and methanol result in extremely low sensitivities of these two small OVOCs, although a low PA value is another reason for the former.
As RH increases from ∼ 5 % to ∼ 85 %, the MH+ ions for 19 out of the 21 VOCs studied have sensitivity variation of less than 15 %, but long-chain aldehydes have a positive RH dependence of up to 30 %. The RH dependence of [MH+H2O]+ ions for long-chain aldehydes is stronger, while that of the dominating [MH−H2O]+ ions is limited. Therefore, the signal distributions among protonated, adduct, and fragmented ions are also affected by RH variation. Together with their relatively high background signals (especially for n-butanal, Fig. S5b), quantification of long-chain aldehydes in the ambient environment using Vocus requires special attention. It is also worth noting that hydrocarbons generally show a slightly negative RH dependence, probably due to their relatively low kptr values, although such RH dependence does not affect quantification significantly; their RH dependence shares a fairly strong correlation with their PA values, hinting at a thermodynamic reason behind this trend.
The time series of RH experiments and the instrument setting experiment are freely available: https://zenodo.org/records/10947779 (Li et al., 2024).
The supplement related to this article is available online at: https://doi.org/10.5194/amt-17-2415-2024-supplement.
YJL and FL conceived the ideas and designed the methodology. FL conducted the experiments. YJL and FL analyzed the data and drafted the manuscript. DDH, LT, BY, WT, LZ, PY, DW, KIH, and KMM provided significant input during the revision of the manuscript. YJL and KMM acquired financial support for the project. All authors contributed critically to the drafts and gave final approval for publication.
At least one of the (co-)authors is a member of the editorial board of Atmospheric Measurement Techniques. The peer-review process was guided by an independent editor, and the authors also have no other competing interests to declare.
Publisher’s note: Copernicus Publications remains neutral with regard to jurisdictional claims made in the text, published maps, institutional affiliations, or any other geographical representation in this paper. While Copernicus Publications makes every effort to include appropriate place names, the final responsibility lies with the authors.
This work was supported by funding support from the Science and Technology Development Fund, Macau SAR (file no. FDCT 0031/2023/AFJ), and a multiyear research grant (no. MYRG2022-00027-FST) from the University of Macau.
This research has been supported by the Fundo para o Desenvolvimento das Ciências e da Tecnologia (grant no. FDCT 0031/2023/AFJ) and the Universidade de Macau (grant no. MYRG2022-00027-FST).
This paper was edited by Hendrik Fuchs and reviewed by two anonymous referees.
Baasandorj, M., Millet, D. B., Hu, L., Mitroo, D., and Williams, B. J.: Measuring acetic and formic acid by proton-transfer-reaction mass spectrometry: sensitivity, humidity dependence, and quantifying interferences, Atmos. Meas. Tech., 8, 1303–1321, https://doi.org/10.5194/amt-8-1303-2015, 2015.
Cappellin, L., Karl, T., Probst, M., Ismailova, O., Winkler, P. M., Soukoulis, C., Aprea, E., Märk, T. D., Gasperi, F., and Biasioli, F.: On Quantitative Determination of Volatile Organic Compound Concentrations Using Proton Transfer Reaction Time-of-Flight Mass Spectrometry, Environ. Sci. Technol., 46, 2283–2290, https://doi.org/10.1021/es203985t, 2012.
Claflin, M. S., Pagonis, D., Finewax, Z., Handschy, A. V., Day, D. A., Brown, W. L., Jayne, J. T., Worsnop, D. R., Jimenez, J. L., Ziemann, P. J., de Gouw, J., and Lerner, B. M.: An in situ gas chromatograph with automatic detector switching between PTR- and EI-TOF-MS: isomer-resolved measurements of indoor air, Atmos. Meas. Tech., 14, 133–152, https://doi.org/10.5194/amt-14-133-2021, 2021.
Cui, L., Zhang, Z., Huang, Y., Lee, S. C., Blake, D. R., Ho, K. F., Wang, B., Gao, Y., Wang, X. M., and Louie, P. K. K.: Measuring OVOCs and VOCs by PTR-MS in an urban roadside microenvironment of Hong Kong: relative humidity and temperature dependence, and field intercomparisons, Atmos. Meas. Tech., 9, 5763–5779, https://doi.org/10.5194/amt-9-5763-2016, 2016.
de Gouw, J. and Warneke, C.: Measurements of volatile organic compounds in the earths atmosphere using proton-transfer-reaction mass spectrometry, Mass Spectrom. Rev., 26, 223–257, https://doi.org/10.1002/mas.20119, 2007.
de Gouw, J. A., Goldan, P. D., Warneke, C., Kuster, W. C., Roberts, J. M., Marchewka, M., Bertman, S. B., Pszenny, A. A. P., and Keene, W. C.: Validation of proton transfer reaction-mass spectrometry (PTR-MS) measurements of gas-phase organic compounds in the atmosphere during the New England Air Quality Study (NEAQS) in 2002, J. Geophys. Res.-Atmos., 108, 4682, https://doi.org/10.1029/2003JD003863, 2003.
Ellis, A. M. and Mayhew, C. A.: Chemical Ionization: Chemistry, Thermodynamics and Kinetics, in: Proton Transfer Reaction Mass Spectrometry, Wiley, 25–48, https://doi.org/10.1002/9781118682883.ch2, 2014.
Gueneron, M., Erickson, M. H., VanderSchelden, G. S., and Jobson, B. T.: PTR-MS fragmentation patterns of gasoline hydrocarbons, Int. J. Mass Spectrom., 379, 97–109, https://doi.org/10.1016/j.ijms.2015.01.001, 2015.
Hansel, A., Jordan, A., Holzinger, R., Prazeller, P., Vogel, W., and Lindinger, W.: Proton transfer reaction mass spectrometry: on-line trace gas analysis at the ppb level, Int. J. Mass Spectrom. Ion Process., 149–150, 609–619, https://doi.org/10.1016/0168-1176(95)04294-U, 1995.
Hartungen, E. v., Wisthaler, A., Mikoviny, T., Jaksch, D., Boscaini, E., Dunphy, P. J., and Märk, T. D.: Proton-transfer-reaction mass spectrometry (PTR-MS) of carboxylic acids: Determination of Henry's law constants and axillary odour investigations, Int. J. Mass Spectrom., 239, 243–248, https://doi.org/10.1016/j.ijms.2004.09.009, 2004.
Inomata, S., Tanimoto, H., Kameyama, S., Tsunogai, U., Irie, H., Kanaya, Y., and Wang, Z.: Technical Note: Determination of formaldehyde mixing ratios in air with PTR-MS: laboratory experiments and field measurements, Atmos. Chem. Phys., 8, 273–284, https://doi.org/10.5194/acp-8-273-2008, 2008.
Jensen, A., Liu, Z., Tan, W., Dix, B., Chen, T., Koss, A., Zhu, L., Li, L., and de Gouw, J.: Measurements of Volatile Organic Compounds During the COVID-19 Lockdown in Changzhou, China, Geophys. Res. Lett., 48, e2021GL095560, https://doi.org/10.1029/2021GL095560, 2021.
Kari, E., Miettinen, P., Yli-Pirilä, P., Virtanen, A., and Faiola, C. L.: PTR-ToF-MS product ion distributions and humidity-dependence of biogenic volatile organic compounds, Int. J. Mass Spectrom., 430, 87–97, https://doi.org/10.1016/j.ijms.2018.05.003, 2018.
Krechmer, J., Lopez-Hilfiker, F., Koss, A., Hutterli, M., Stoermer, C., Deming, B., Kimmel, J., Warneke, C., Holzinger, R., Jayne, J., Worsnop, D., Fuhrer, K., Gonin, M., and de Gouw, J.: Evaluation of a New Reagent-Ion Source and Focusing Ion–Molecule Reactor for Use in Proton-Transfer-Reaction Mass Spectrometry, Anal. Chem., 90, 12011–12018, https://doi.org/10.1021/acs.analchem.8b02641, 2018.
Li, F., Huang, D. D., Tian, L., Bin, Y., Wen, T., Zhu, L., Ye, P., Worsnop, D., Hoi, K. I., Mok, K. M., and Li, Y. J.: Response of protonated, adduct, and fragmented ions in Vocus proton-transfer-reaction time-of-flight mass (PTR-ToF-MS) spectrometer, Zenodo [data set], https://zenodo.org/records/10947779 (last access: 23 April 2024), 2024.
Li, H., Almeida, T. G., Luo, Y., Zhao, J., Palm, B. B., Daub, C. D., Huang, W., Mohr, C., Krechmer, J. E., Kurtén, T., and Ehn, M.: Fragmentation inside proton-transfer-reaction-based mass spectrometers limits the detection of ROOR and ROOH peroxides, Atmos. Meas. Tech., 15, 1811–1827, https://doi.org/10.5194/amt-15-1811-2022, 2022.
Lindinger, W., Hansel, A., and Jordan, A.: On-line monitoring of volatile organic compounds at pptv levels by means of proton-transfer-reaction mass spectrometry (PTR-MS) medical applications, food control and environmental research, Int. J. Mass Spectrom. Ion Process., 173, 191–241, https://doi.org/10.1016/S0168-1176(97)00281-4, 1998.
Materić, D., Lanza, M., Sulzer, P., Herbig, J., Bruhn, D., Gauci, V., Mason, N., and and Turner, C.: Selective reagent ion-time of flight-mass spectrometry study of six common monoterpenes, Int. J. Mass Spectrom., 421, 40–50, https://doi.org/10.1016/j.ijms.2017.06.003, 2017.
Michoud, V., Sauvage, S., Léonardis, T., Fronval, I., Kukui, A., Locoge, N., and Dusanter, S.: Field measurements of methylglyoxal using proton transfer reaction time-of-flight mass spectrometry and comparison to the DNPH–HPLC–UV method, Atmos. Meas. Tech., 11, 5729–5740, https://doi.org/10.5194/amt-11-5729-2018, 2018.
Pagonis, D., Sekimoto, K., and de Gouw, J.: A Library of Proton-Transfer Reactions of H3O+ Ions Used for Trace Gas Detection, J. Am. Soc. Mass. Spectr., 30, 1330–1335, https://doi.org/10.1007/s13361-019-02209-3, 2019.
Pleil, J. D., Hansel, A., and Beauchamp, J.: Advances in proton transfer reaction mass spectrometry (PTR-MS): applications in exhaled breath analysis, food science, and atmospheric chemistry, J. Breath Res., 13, 039002, https://doi.org/10.1088/1752-7163/ab21a7, 2019.
Salazar Gómez, J. I., Sojka, M., Klucken, C., Schlögl, R., and Ruland, H.: Determination of trace compounds and artifacts in nitrogen background measurements by proton transfer reaction time-of-flight under dry and humid conditions, J. Mass. Spectrom., 56, e4777, https://doi.org/10.1002/jms.4777, 2021.
Schripp, T., Etienne, S., Fauck, C., Fuhrmann, F., Märk, L., and Salthammer, T.: Application of proton-transfer-reaction-mass-spectrometry for Indoor Air Quality research, Indoor Air, 24, 178–189, https://doi.org/10.1111/ina.12061, 2014.
Sekimoto, K., Li, S.-M., Yuan, B., Koss, A., Coggon, M., Warneke, C., and de Gouw, J.: Calculation of the sensitivity of proton-transfer-reaction mass spectrometry (PTR-MS) for organic trace gases using molecular properties, Int. J. Mass Spectrom., 421, 71–94, https://doi.org/10.1016/j.ijms.2017.04.006, 2017.
Sekimoto, K. and Koss, A. R.: Modern mass spectrometry in atmospheric sciences: Measurement of volatile organic compounds in the troposphere using proton-transfer-reaction mass spectrometry, J. Mass Spectrom., 56, https://doi.org/10.1002/jms.4619, 2021.
Shao, P., An, J., Xin, J., Wu, F., Wang, J., Ji, D., and Wang, Y.: Source apportionment of VOCs and the contribution to photochemical ozone formation during summer in the typical industrial area in the Yangtze River Delta, China, Atmos. Res., 176–177, 64–74, https://doi.org/10.1016/j.atmosres.2016.02.015, 2016.
Shrivastava, M., Cappa, C. D., Fan, J., Goldstein, A. H., Guenther, A. B., Jimenez, J. L., Kuang, C., Laskin, A., Martin, S. T., Ng, N. L., Petaja, T., Pierce, J. R., Rasch, P. J., Roldin, P., Seinfeld, J. H., Shilling, J., Smith, J. N., Thornton, J. A., Volkamer, R., Wang, J., Worsnop, D. R., Zaveri, R. A., Zelenyuk, A., and Zhang, Q.: Recent advances in understanding secondary organic aerosol: Implications for global climate forcing, Rev. Geophys., 55, 509–559, https://doi.org/10.1002/2016RG000540, 2017.
Sinha, V., Custer, T. G., Kluepfel, T., and Williams, J.: The effect of relative humidity on the detection of pyrrole by PTR-MS for OH reactivity measurements, Int. J. Mass Spectrom., 282, 108–111, https://doi.org/10.1016/j.ijms.2009.02.019, 2009.
Smith, D., Diskin, A., Ji, Y. F., and Spanel, P.: Concurrent use of H3O+, NO+, and O-2(+) precursor ions for the detection and quantification of diverse trace gases in the presence of air and breath by selected ion-flow tube mass spectrometry, Int. J. Mass Spectrom., 209, 81–97, https://doi.org/10.1016/S1387-3806(01)00478-X, 2001.
Ŝpaněl, P. and Smith, D.: SIFT studies of the reactions of H3O+, NO+ and O+2 with a series of volatile carboxylic acids and esters, Int. J. Mass Spectrom. Ion Process., 172, 137–147, https://doi.org/10.1016/S0168-1176(97)00246-2, 1998.
Ŝpaněl, P. and Smith, D.: Selected ion flow tube: a technique for quantitative trace gas analysis of air and breath, Med. Biol. Eng. Comput., 34, 409–419, https://doi.org/10.1007/BF02523843, 1996.
Ŝpaněl, P., Ji, Y., and Smith, D.: SIFT studies of the reactions of H3O+, NO+ and O2+ with a series of aldehydes and ketones, Int. J. Mass Spectrom. Ion Process., 165–166, 25–37, https://doi.org/10.1016/S0168-1176(97)00166-3, 1997.
Ŝpaněl, P. and Smith, D.: Influence of water vapour on selected ion flow tube mass spectrometric analyses of trace gases in humid air and breath, Rapid Commun. Mass Spectrom., 14, 1898–1906, https://doi.org/10.1002/1097-0231(20001030)14:20<1898::AID-RCM110>3.0.CO;2-G, 2000.
Steinbacher, M., Dommen, J., Ammann, C., Spirig, C., Neftel, A., and Prevot, A. S. H.: Performance characteristics of a proton-transfer-reaction mass spectrometer (PTR-MS) derived from laboratory and field measurements, Int. J. Mass Spectrom., 239, 117–128, https://doi.org/10.1016/j.ijms.2004.07.015, 2004.
Vlasenko, A., Macdonald, A. M., Sjostedt, S. J., and Abbatt, J. P. D.: Formaldehyde measurements by Proton transfer reaction – Mass Spectrometry (PTR-MS): correction for humidity effects, Atmos. Meas. Tech., 3, 1055–1062, https://doi.org/10.5194/amt-3-1055-2010, 2010.
Wang, Y., Yang, G., Lu, Y., Liu, Y., Chen, J., and Wang, L.: Detection of gaseous dimethylamine using vocus proton-transfer-reaction time-of-flight mass spectrometry, Atmos. Environ., 243, 117875, https://doi.org/10.1016/j.atmosenv.2020.117875, 2020.
Warneke, C., van der Veen, C., Luxembourg, S., de Gouw, J. A., and Kok, A.: Measurements of benzene and toluene in ambient air using proton-transfer-reaction mass spectrometry: calibration, humidity dependence, and field intercomparison, Int. J. Mass Spectrom., 207, 167–182, https://doi.org/10.1016/S1387-3806(01)00366-9, 2001.
Warneke, C., De Gouw, J. A., Kuster, W. C., Goldan, P. D., and Fall, R.: Validation of atmospheric VOC measurements by proton-transfer-reaction mass spectrometry using a gas-chromatographic preseparation method, Environ. Sci. Technol., 37, 2494–2501, https://doi.org/10.1021/es026266i, 2003.
Warneke, C., Veres, P., Holloway, J. S., Stutz, J., Tsai, C., Alvarez, S., Rappenglueck, B., Fehsenfeld, F. C., Graus, M., Gilman, J. B., and de Gouw, J. A.: Airborne formaldehyde measurements using PTR-MS: calibration, humidity dependence, inter-comparison and initial results, Atmos. Meas. Tech., 4, 2345–2358, https://doi.org/10.5194/amt-4-2345-2011, 2011.
Yuan, B., Koss, A. R., Warneke, C., Coggon, M., Sekimoto, K., and de Gouw, J. A.: Proton-Transfer-Reaction Mass Spectrometry: Applications in Atmospheric Sciences, Chem. Rev., 117, 13187–13229, https://doi.org/10.1021/acs.chemrev.7b00325, 2017.
Zhao, J. and Zhang, R.: Proton transfer reaction rate constants between hydronium ion (H3O+) and volatile organic compounds, Atmos. Environ., 38, 2177–2185, https://doi.org/10.1016/j.atmosenv.2004.01.019, 2004.