the Creative Commons Attribution 4.0 License.
the Creative Commons Attribution 4.0 License.
 | 03 May 2024
CH4Net: a deep learning model for monitoring methane super-emitters with Sentinel-2 imagery
Anna Vaughan
Gonzalo Mateo-García
Luis Gómez-Chova
Vít Růžička
Luis Guanter
Itziar Irakulis-Loitxate
We present a deep learning model, CH4Net, for automated monitoring of methane super-emitters from Sentinel-2 data. When trained on images of 23 methane super-emitter locations from 2017–2020 and evaluated on images from 2021, this model detects 84 % of methane plumes compared with 24 % of plumes for a state-of-the-art baseline while maintaining a similar false positive rate. We present an in-depth analysis of CH4Net over the complete dataset and at each individual super-emitter site. In addition to the CH4Net model, we compile and make open source a hand-annotated training dataset consisting of 925 methane plume masks as a machine learning baseline to drive further research in this field.
- Article
(4370 KB) - Full-text XML
- BibTeX
- EndNote


As a potent greenhouse gas responsible for approximately 25 % of warming since the industrial revolution (Stocker, 2014; Varon et al., 2021) with rapidly increasing atmospheric concentrations (Tollefson, 2022), curbing methane emissions is an important step in combating the climate crisis. Anthropogenic emissions emanate from diverse sources, principally associated with livestock, agriculture, landfills and the fossil fuel industry (oil and gas extraction and coal mining) (Saunois et al., 2020; Maasakkers et al., 2022). Of particular interest for rapid suppression of emissions are super-emitters, defined to be sources in the top 1 % of global anthropogenic methane emitters, corresponding to an approximate flow rate of 25 kg h−1 (Zavala-Araiza et al., 2017). These sources contribute a substantial fraction of all methane emissions in the oil and gas sector (Alvarez et al., 2018), providing an opportunity to rapidly limit emissions with mitigation at a reasonable cost (Lauvaux et al., 2022).
Over the past 5 years, remote sensing instruments have been extensively utilised for detecting and monitoring super-emitters (Irakulis-Loitxate et al., 2022; Lauvaux et al., 2022; Varon et al., 2021; Maasakkers et al., 2022; Irakulis-Loitxate et al., 2021). To monitor these point sources, it is necessary to use point source imagers, instruments with a spatial resolution of less than 60 m (Jacob et al., 2022). In addition to this, the ideal instrument would also have global coverage, a rapid revisit time, and high spectral resolution in the 1700 and 2300 nm short-wave infrared spectral windows where methane absorption is the strongest. Unfortunately, no currently available instrument has all of these desired characteristics.
Hyperspectral instruments, for example PRISMA and EnMAP, produce more accurate methane retrievals because they are more sensitive to small concentrations (Jacob et al., 2022; Guanter et al., 2021). However, they have limited swaths (30 km) and image acquisitions need to be tasked – via request to the ground segment to acquire a particular area of interest – therefore they have limited data availability.
An alternative approach is to utilise multispectral imagery such as Sentinel-2 (Drusch et al., 2012) and Landsat 8 and Landsat 9 (Roy et al., 2014). These instruments have relatively rapid revisit time (approximately 5 d for Sentinel-2 and 16 d for Landsat at the Equator) and high (20–30 m) spatial resolution. They, however, have significantly degraded spectral resolution compared to hyperspectral instruments, resulting in a lower sensitivity to methane (Sherwin et al., 2023). Recent works have demonstrated successful detection and quantification of large plumes from Sentinel-2 imagery (Varon et al., 2021; Ehret et al., 2022; Irakulis-Loitxate et al., 2022). These approaches are based on temporal differences and ratios between Sentinel-2 bands 11 (1560–1660 nm) and 12 (2090–2290 nm). Band 12 strongly overlaps with the methane absorption feature, while band 11 provides an estimate of the background at a relatively similar wavelength. Varon et al. (2021) present a series of approaches differencing between Sentinel-2 bands 11 and 12 to quantify methane emissions. Their most successful approach quantifies emissions down to a rate of 3 t h−1 (tonnes of CH4 emitted per hour) by taking the difference between bands 11 and 12 comparing two consecutive passes; however, it remains sensitive to surface artefacts. Ehret et al. (2022) take a similar approach projecting onto a time series of 30 previous images with two-stage linear regression and a manual verification step to identify the presence of false positives caused by surface artefacts. There are two significant limitations with these methods. The first and most important is that they remain sensitive to surface artefacts, often requiring manual verification. The second is that a time series of images is required.
In this study, we ask the following question: “for a known set of methane super-emitters, is it possible to accurately identify plumes in Sentinel-2 imagery to monitor future emissions?” This has the important application of assessing whether mitigation work on existing emissions has been successful. We train a machine learning model, CH4Net, to segment methane plumes from a single image. In contrast to previous methods, CH4Net learns background characteristics of the sites by processing multiple passes over each location during training without the need for a time series of previous images, reference image or manual verification step. Machine learning has been successfully applied to segmenting plumes in hyperspectral data (Groshenry et al., 2022; Jongaramrungruang et al., 2022; Schuit et al., 2023); however, this methodology has not yet been applied to Sentinel-2 imagery as a sufficiently large dataset of verified plumes has been unavailable. We first collect and annotate a dataset of methane plumes from known super-emitters in Turkmenistan (Irakulis-Loitxate et al., 2022), a semi-arid region with strong emissions providing the best-case scenario for multispectral methane imaging. This is used to train a deep learning model to segment methane plumes from the background. We evaluate this model for a future time period for the training locations. In addition, we show that the model can successfully be applied to monitor a super-emitter at a new location in the same region unseen at the training time. The aims of this paper are as follows:
-
Collect and label a machine learning dataset of methane plumes in Sentinel-2 imagery.
-
Develop an automated plume segmentation system. In contrast to existing works, this is a fully automated system that does not require a time series of Sentinel-2 images or identification of a reference image at the test time.
-
Apply this system to track emissions from a selection of known methane super-emitters during a future time period.
Section 2 presents an overview of the dataset collection, CH4Net architecture and training procedure. Results are presented in Sects. 3 and 4, with conclusions and a discussion in Sect. 5.
2.1 Dataset collection and processing
We first collect and manually annotate a dataset of methane plumes from Sentinel-2 images from 2017–2021 consisting of 10 046 images of 0.01 × 0.01° (200 × 200 pixels) resolution from Sentinel-2 L1C scenes centred on 23 known super-emitter locations in Turkmenistan (Irakulis-Loitxate et al., 2022). Several locations identified are in close proximity to each other and are combined into a single scene. For a map and complete list of the included sites, see Fig. 1 and Table 1. For each site, all available images were downloaded using the Sentinel Hub API, each image consisting of the 13 scaled and harmonised Sentinel-2 channels (Sinergise Ltd., 2023). Images containing clouds are deliberately not discarded to allow the model to learn a mapping robust to these features without the need for costly pre-processing steps. We note that the model output is therefore predicting whether a plume is visible in the scene or not; it is possible that an emission may be present but is covered by clouds. Cloudy scenes could easily be discarded if necessary for a particular application by applying a cloud detection model (Jeppesen et al., 2019; López-Puigdollers et al., 2021; Aybar et al., 2022).
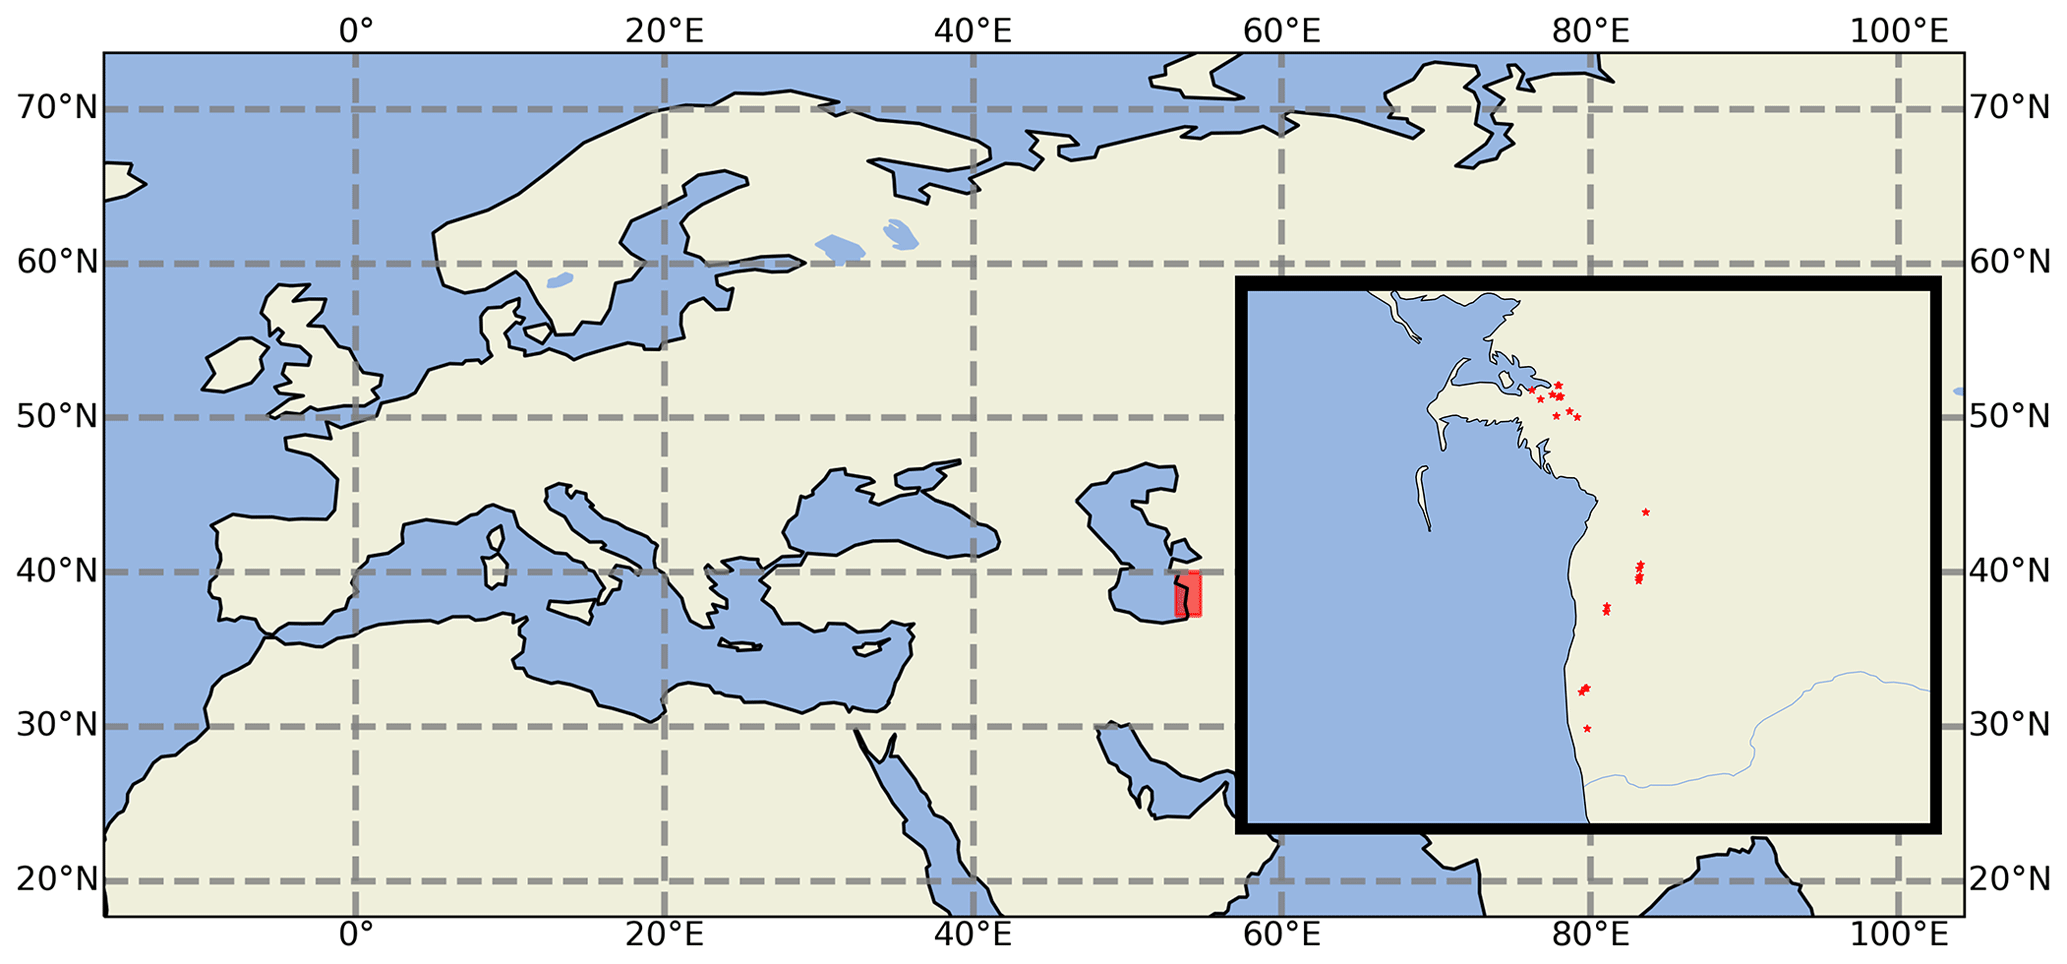
Figure 1Locations of the 23 super emitters included in the dataset showing the study region shaded in red and precise locations (inset).
We frame methane detection as a binary segmentation problem, where a pixel is classified as either 0 if not part of a plume or 1 if part of a plume. To manually label the plumes, enhanced images were created for each time step using the multi-band multi-pass (MBMP) method developed by Varon et al. (2021). A clear-sky reference image was chosen for each location, with the multi-band multi-pass image given by
where R11 and R12 are the raw Sentinel-2 band 11 and 12 observations for the current image, and are the raw Sentinel-2 band 11 and 12 observations for the reference image, and c (c′) is calculated by least-squares regression of R11 against R12 ( against ) for all pixels. These images were used to manually identify and label the extent of the methane plumes for each time step. For examples of the MBMP images and corresponding hand-labelled plumes, see Fig. 2. It is emphasised that these MBMP images are used as an auxiliary tool to guide annotation only and are not included as input predictors to the final model.
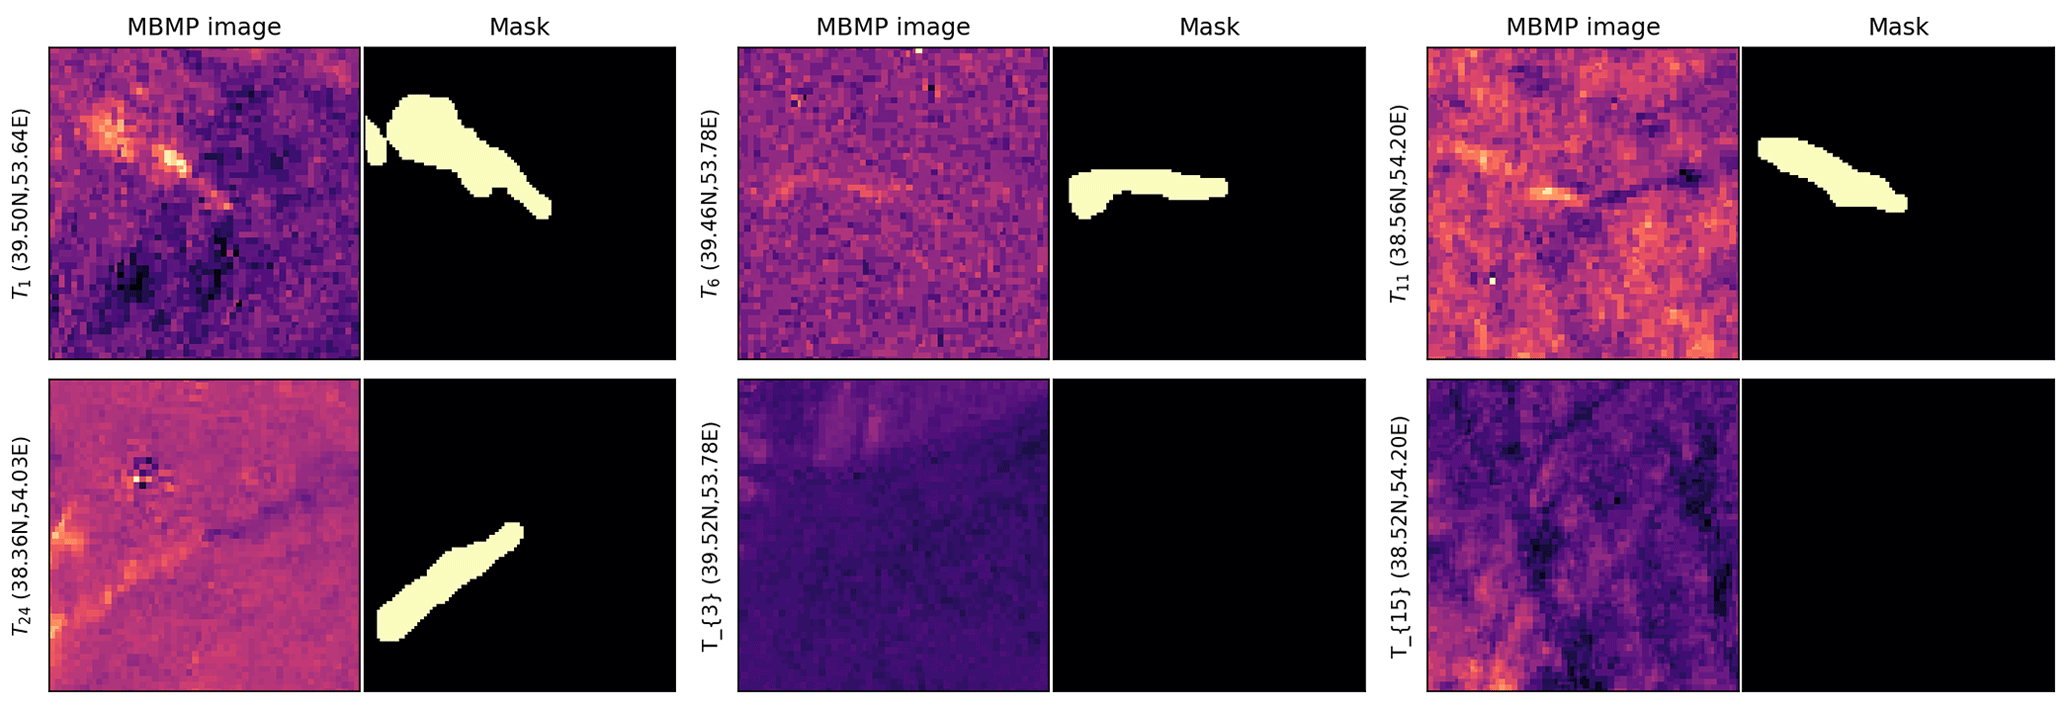
Figure 2Examples of the MBMP images and corresponding hand-annotated masks.
Each data point consists of the 13 Sentinel-2 bands interpolated to a common resolution of 10 m together with the hand-labelled plume mask for a total of 925 scenes containing a plume and 9121 without. The resolution of 10 m is chosen as adding the highest-resolution RGB channels improves the model performance, so all data are interpolated to this resolution to avoid loss of information. We emphasise that only a single time step is required at the test time, unlike in previously proposed methods where multiple time steps are required. This removes the requirement to identify a clear-sky reference image or series of images, which typically requires manual selection, and is simpler to deploy and maintain.
This dataset is split into train, test and validation sets:
-
The train set is all images from 2017–2020 excluding the validation set.
-
The validation set is a held-out randomly subsampled selection of 256 train images stratified by plume presence.
-
The test set is all images from 2021.
The validation split is used for model selection, and we use the test set to report results. As a baseline, we consider an MBMP approach based on that outlined by Irakulis-Loitxate et al. (2022). To calculate the baseline prediction, the multi-band multi-pass image is constructed for each image. This is denoised using a Gaussian filter and then thresholded to identify clusters of pixels with values more than 2 standard deviations below the mean. Resulting clusters are kept as a predicted plume if they contain more than 115 pixels.
2.2 Model architecture and training
The detection model uses a simple and flexible UNet architecture (Ronneberger et al., 2015) consisting of four encoder blocks (2D convolution layer, batch norm, ReLU activation, max pool) followed by four decoder blocks (transposed 2D convolution layer, 2D convolution layer, batch norm, ReLU activation, 2D convolution layer, batch norm ReLU activation) with skip connections between blocks of corresponding scale. Channel output dimensions for each of these blocks are with kernel sizes of 3 for all convolution layers and 2 for the max pooling layers. For a complete schematic of the model, see Fig. 3. This model takes the Sentinel-2 bands as input and outputs a pixel-wise prediction of the probability (between 0 and 1) of the pixel being part of a methane plume.
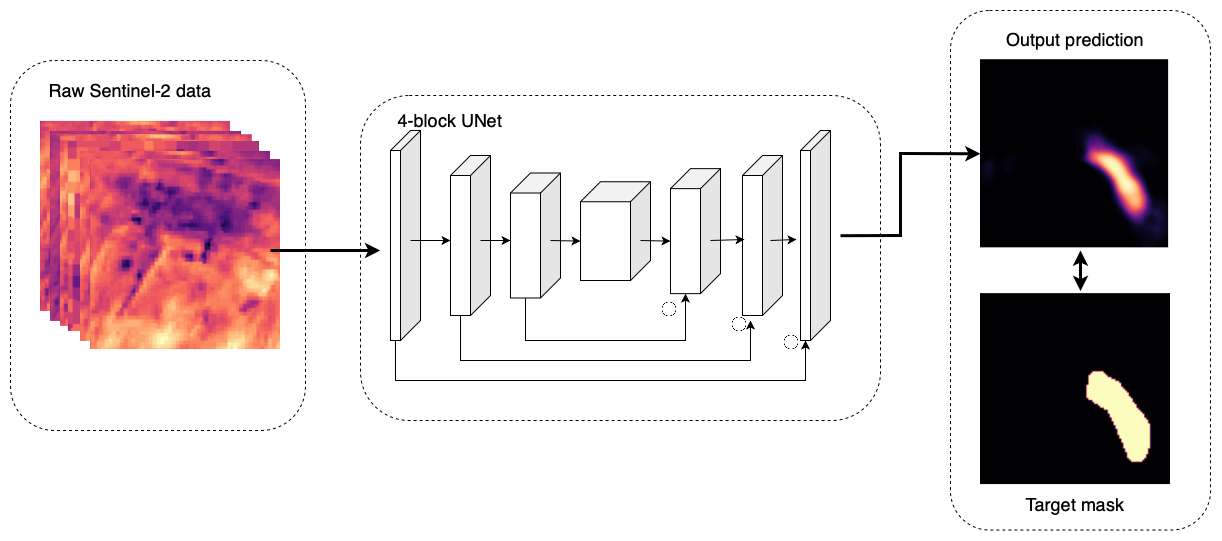
Figure 3Schematic of the CH4Net model architecture showing the Sentinel-2 bands' input to the UNet and probabilistic output compared to the hand-annotated mask.
The UNet is trained on the training dataset described above with binary cross-entropy loss, Adam optimisation (Kingma and Ba, 2014) and a learning rate of for 250 epochs. As the dataset is unbalanced with significantly more negative than positive images, at each epoch n negative images are randomly sampled, where n is the total size of the positive image set. To prevent over-fitting, augmentation is applied by cropping a random 100 × 100-pixel scene from the larger image tiles. In order to investigate the optimal predictor set, the UNet is trained with both bands 11 and 12 only as predictors (11+12) and all bands (ALL).
We first evaluate the skill of CH4Net at correctly identifying whether a given image contains a methane plume. This is referred to as scene-level prediction, as opposed to pixel-level prediction. For scene-level prediction, the probabilistic predictions are transformed into a binary prediction by defining a methane plume as a contiguous region greater than 115 pixels with probability greater than or equal to 0.25. The 115-pixel threshold is chosen as this is the size of the smallest plume contained in the training set, while the 0.25 threshold is selected to maximise the balanced accuracy score. A scene is classified as 1 (containing a plume) if such a feature is present and 0 otherwise.
The accuracy, balanced accuracy, precision, recall, false positive rate and false negative rate for both the ALL and the 11+12 experiments over the 2021 images are shown in the upper portion of Table 1. The model with all bands included as predictors outperforms that with only bands 11 and 12, indicating that other bands add value for methane detection or for the reduction of false positives. Results over the test set for the model with all bands included (bands 11+12 only, the MBMP baseline) are as follows: accuracy 0.80 (0.69, 0.50), balanced accuracy 0.76 (0.75, 0.71), precision 0.30 (0.24, 0.11), recall 0.84 (0.61, 0.24), false positive rate 0.24 (0.23, 0.23) and false negative rate 0.16 (0.39, 0.76). The model with all bands included outperforms that with only bands 11 and 12 on all metrics except for the false positive rate, which is slightly higher. CH4Net outperforms the baseline substantially on all metrics except for the false positive rate which is very slightly higher for ALL and the same for 11+12. The new model detects 83 % of all plumes in the validation set compared to 24 % for the baseline whilst producing a similar number of false positives, indicating a large improvement in performance.
Table 1Scene- and pixel-level metrics over the test dataset (year 2021) for CH4Net trained with the complete 13-band predictor set (ALL), the predictor set of bands 11 and 12 only (11+12), and the MBMP baseline. IoU denotes intersection over union. Values in bold indicate the best-performing model for each experiment.
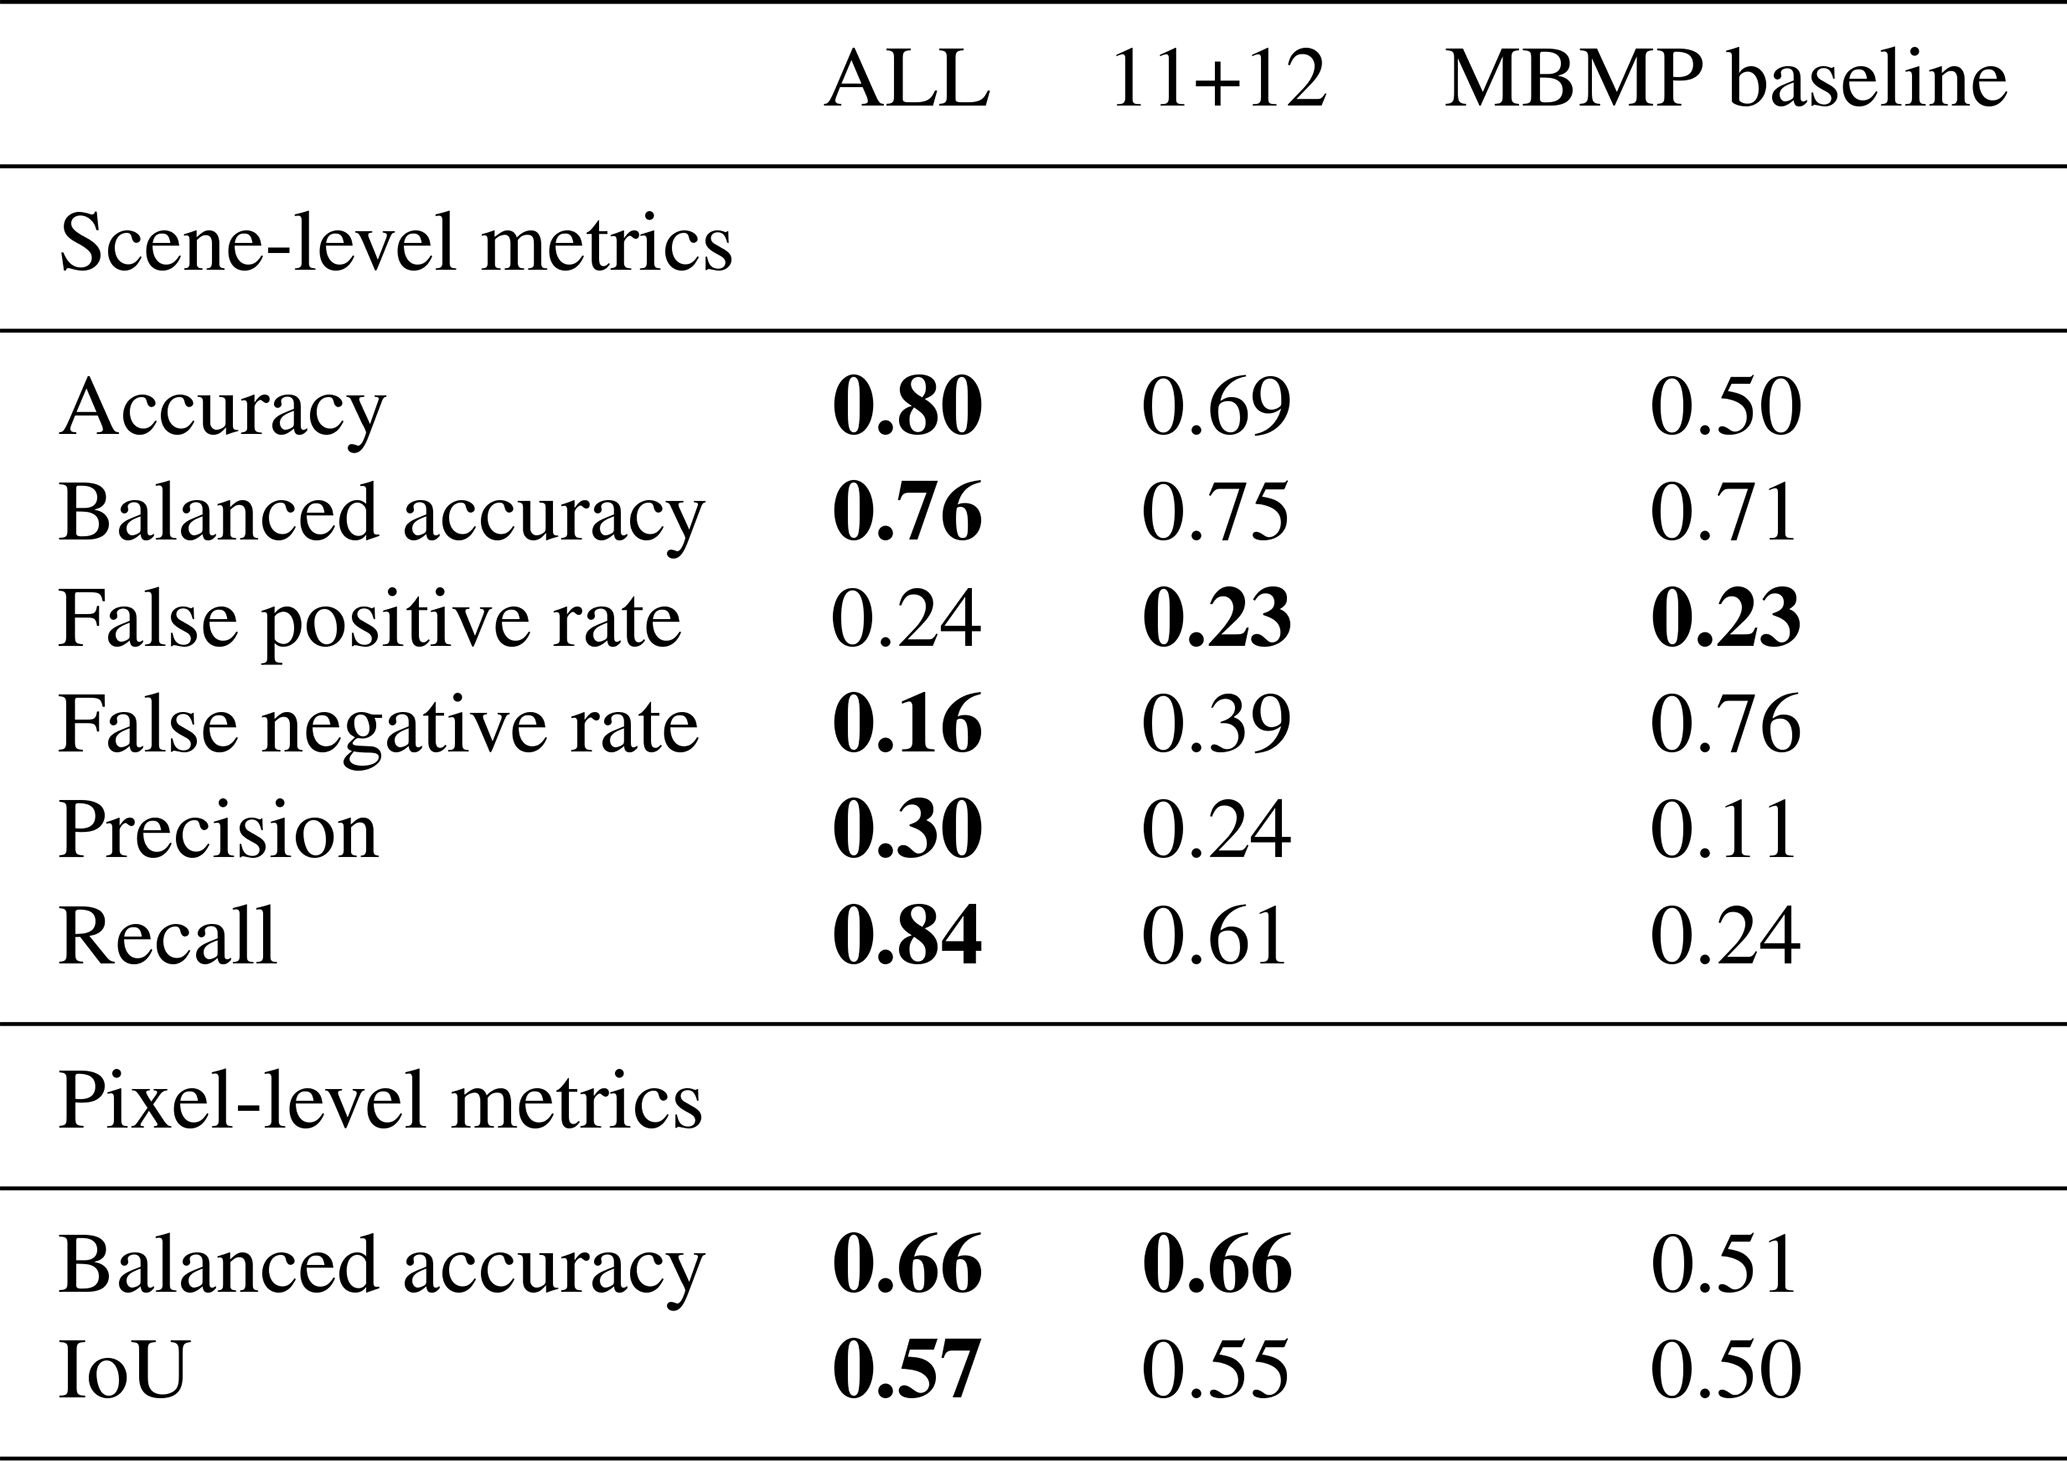
A more challenging task is to assess prediction skill at a pixel level, quantified by balanced accuracy and IoU over all pixels. Results for these metrics are shown in the lower section of Table 1. The model trained with all bands achieves a balanced accuracy (IoU) of 0.66 (0.57) compared to 0.66 (0.55) for the model with just bands 11 and 12, indicating that inclusion of other channels also improves performance at the pixel level. Both CH4Net models outperform the baseline, which achieves a balanced accuracy of 0.51 and IoU of 0.50.
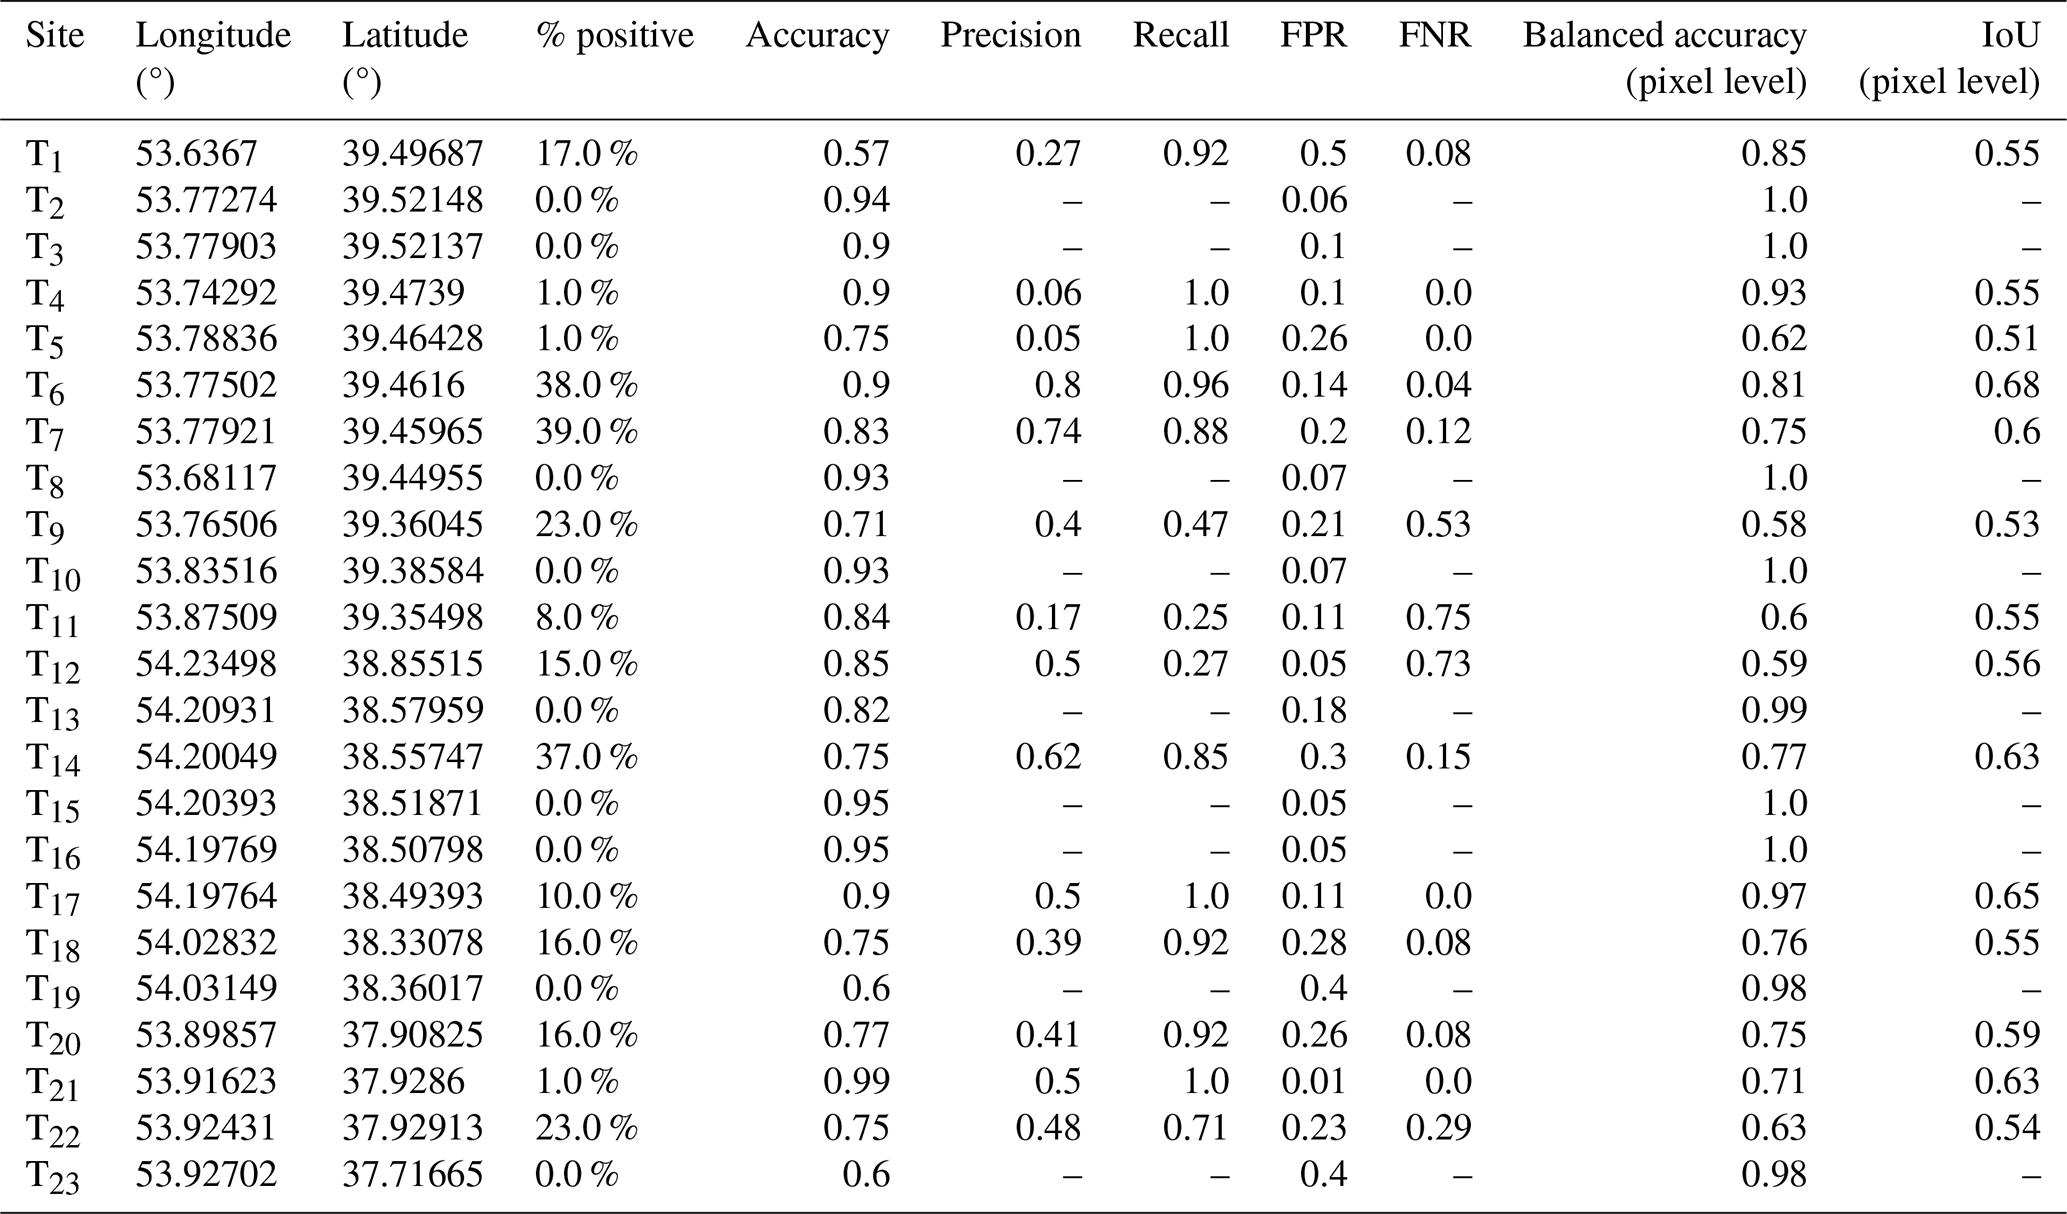
For a more nuanced assessment of skill at each individual location in the training set, we produce predictions for all available images during the 2021 test period at each of the 23 sites. Results for each site are presented in Table 2. In all cases, these are generated using the optimal predictor set with all bands (ALL).
At a scene level, high accuracy is observed for a majority of sites, with accuracy greater than 75 % for 19 out of 23 sites and ranging from 0.57 to 0.71 for the remaining sites. False positive rates range from 0.01 to 0.4, and false negative rates range from 0.0 to 0.75, though they are below 0.2 for a majority of sites.
At a pixel level, balanced accuracy ranges from 0.62 to 1.0, with 17 out of the 23 sites above 0.75. IoU (only defined for cases where at least one mask is available) ranges from 0.54 to 0.68.
Table 2CH4Net performance evaluated on all available images at the 23 super-emitter sites for 2021, showing (L–R) site ID, site longitude, site latitude, percentage of images containing a plume, scene-level accuracy, scene-level precision, scene-level recall, the false positive rate (FPR), the false negative rate (FNR), pixel-level balanced accuracy and pixel-level balanced intersection over union (IoU).
To better understand the successes and limitations of this approach, we present several case studies, two of locations with excellent prediction quality (sites T7 and T17) and two with poor prediction quality (sites T1 and T11).
4.1 Case studies: sites T7 and T17 (high-quality predictions)
For example, consider site T7 where the prediction system has a balanced accuracy score of 0.83, with a false positive rate of 0.20 and false negative rate of 0.12 for a site where 39 % of scenes in the test set contain an emission. Figure 4 compares predictions to the observed values for scene-level classification. Overall predictions are in good agreement with observations, correctly identifying two emissions early in 2021 followed by a period of high emission activity which subsides towards the end of the year.
Predictions at site T17 provide an example of correct prediction of multiple sporadic emission events over the course of the 2021 year. For this site, the scene-level accuracy is 0.90, false positive rate 0.11 and false negative rate 0.0 and the pixel-level balanced accuracy and IoU are 0.97 and 0.65, respectively. A more detailed view of predictions at a pixel scale is shown in Fig. 5. This shows the observation mask compared to prediction overlaid on the RGB imagery for every available Sentinel-2 image in 2021. Both the occurrence and the morphology of each plume are largely well captured, though two false positives are observed.
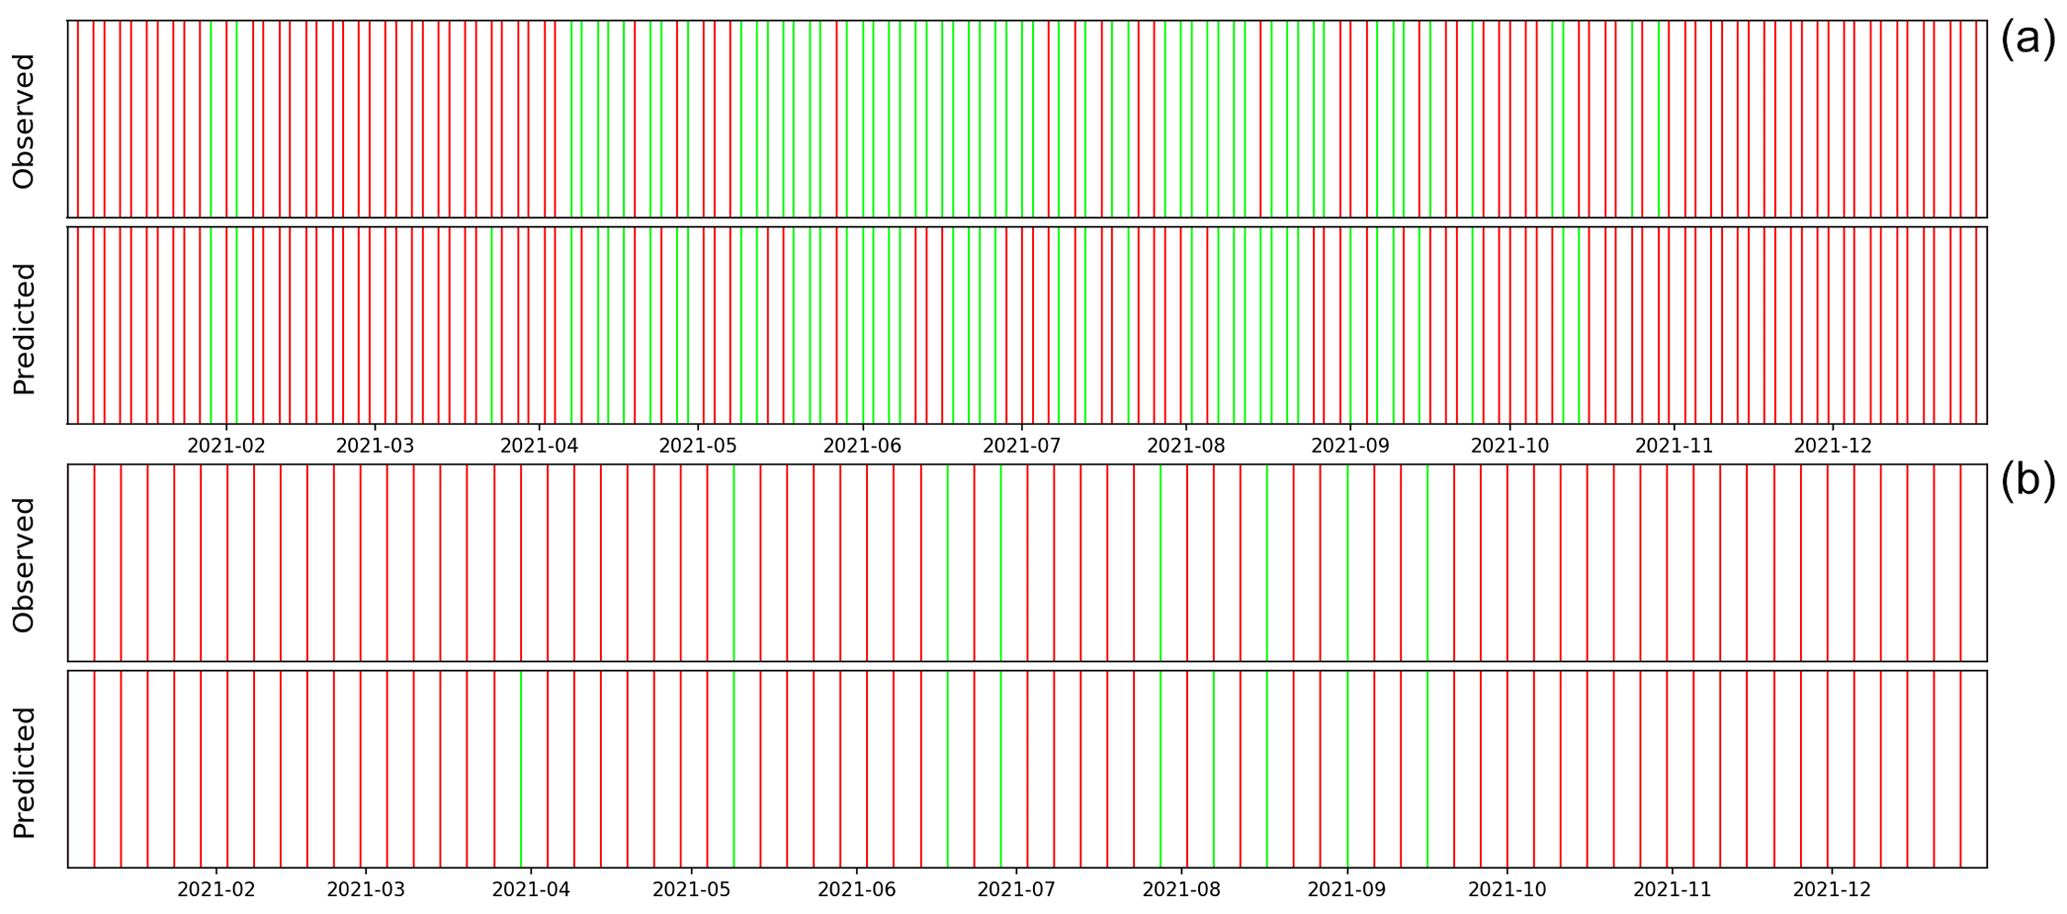
Figure 4Time series of predictions for sites T7 (a) and T17 (b) over the test year (2021). Green (red) lines indicate that a plume was (was not) observed or predicted. Observed ground truth values are shown in the upper time series and CH4Net predictions in the lower time series. The date format is year-month.

Figure 5CH4Net pixel-level predictions for every image over site T17 during 2021. For each time step, the observed mask (left) and probabilistic prediction (right) are shown overlaid on the RGB image. The date format is year-month-day.
4.2 Case studies: sites T1 and T11 (low-quality predictions)
We next examine two cases with comparatively poor prediction quality. Results for site T1 are the worst out of all locations with at least one emission during 2021, with an accuracy of 0.57, false positive rate of 0.5 and false negative rate of 0.08. A time series of predictions compared to observations is shown in the upper panel of Fig. 6. This demonstrates that the model produces a high number of false positives, particularly through the second half of the year. Closer examination of individual predictions images indicates that there are three primary sources of false positives. Artefacts in the image (e.g. Fig. 7a) and thin clouds (e.g. Fig. 7b) produce occasional false positives throughout the time series. During the second half of 2021, multiple false positives are produced, coinciding with a bright surface artefact visible in both the RGB and the MBMP images (e.g. Fig. 7c). It is possible that this is a methane emission source; however, it is not labelled as such during the manual labelling as either the wind speed is too low to produce a clear plume or alternatively the emissions are weak with only the area immediately at the source detectable with the limited detection capability of Sentinel-2.
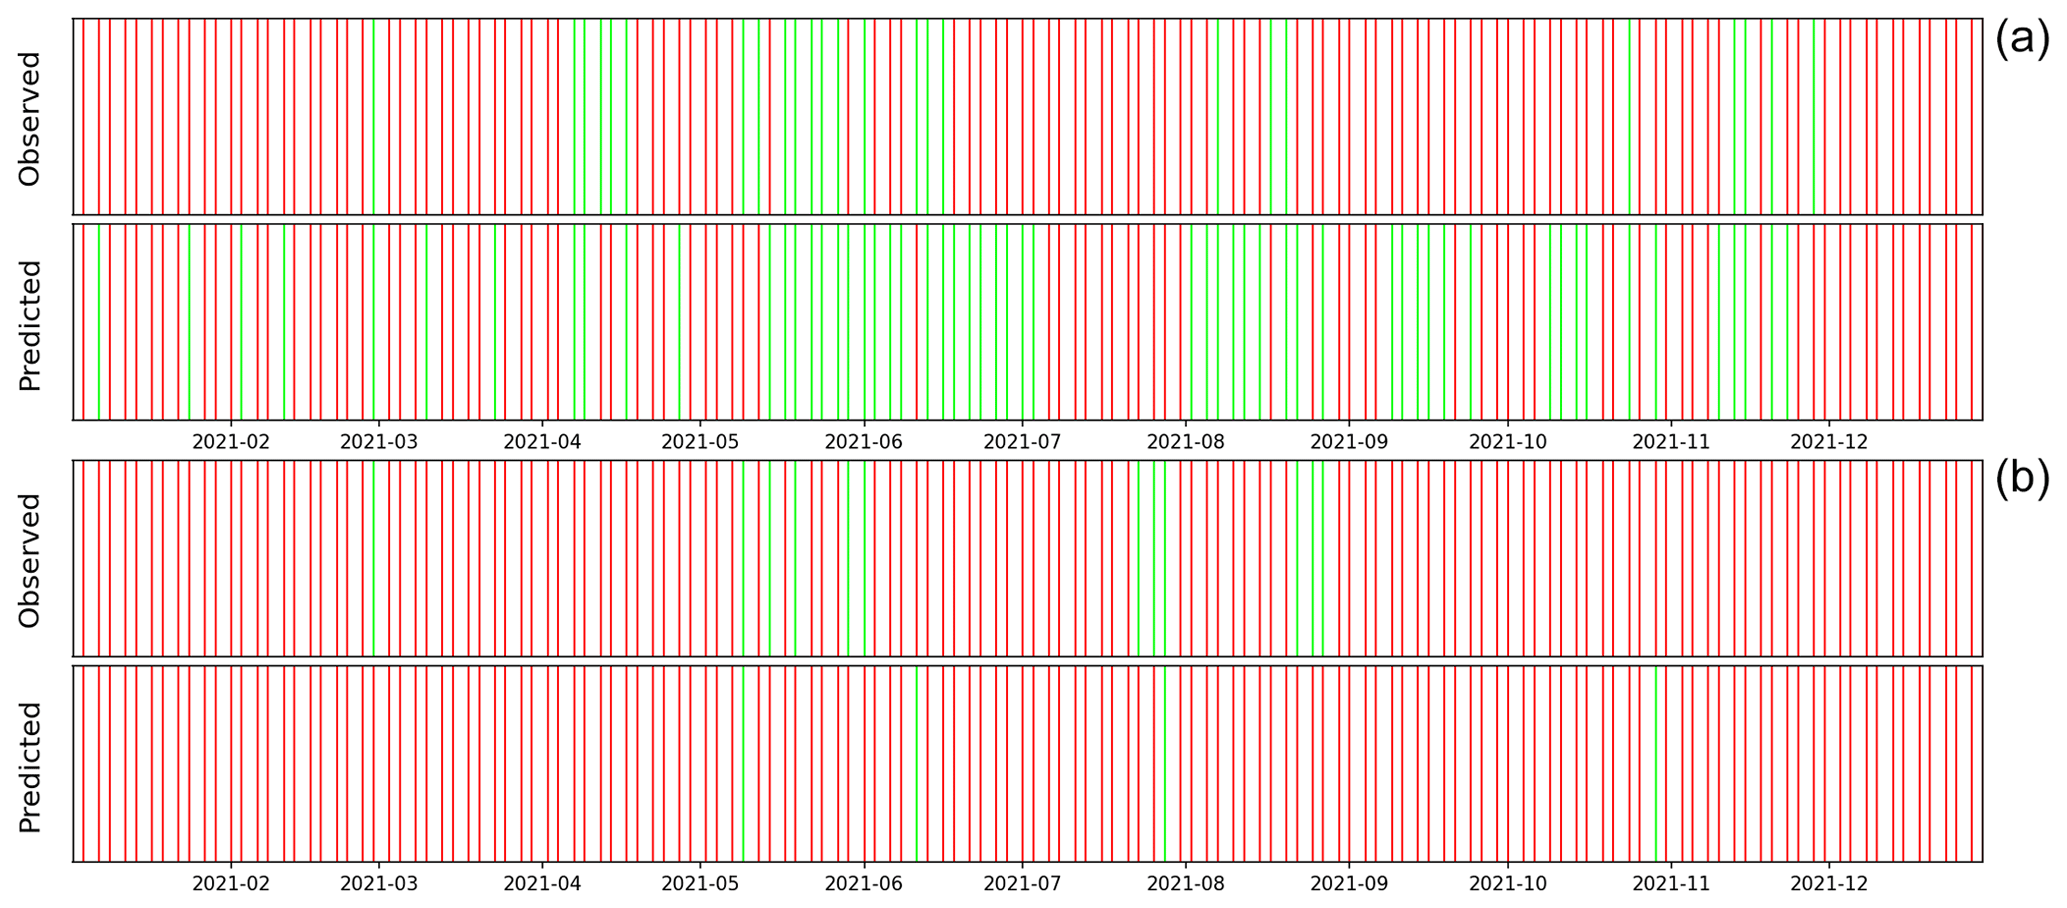
Figure 6Time series of predictions for sites T1 (a) and T11 (b) over the test year (2021). Green (red) lines indicate that a plume was (was not) observed or predicted. Observed ground truth values are shown in the upper time series and CH4Net predictions in the lower time series. The date format is year-month.

Figure 7Examples of false positives and negatives for sites T1 and T11, showing (a) a false positive at site T1 resulting from an image artefact, (b) a false positive at site T1 resulting from thin cloud (not easily visible in the RGB window), (c) a false positive at site T1 resulting from a potential low-intensity methane source and (d) a false negative at site T11 resulting from a strongly heterogeneous background. The date format is year-month-day.
Site T11 is an example of a site with multiple false negatives. For this location, the scene accuracy is 0.84, with a false positive rate of 0.11; however the false negative rate at 0.75 is the highest for all sites. The prediction time series for this site is shown in the lower panel of Fig. 6. Here the false negatives appear to arise in cases with a heterogeneous background (which also often results in an increase in false positives). This is consistent with recent work indicating that the detection capability of Sentinel-2 is significantly lower in cases with a strongly heterogeneous background (Gorroño et al., 2023).
We have implemented CH4Net, the first fully automated system for monitoring known methane super-emitter sites, and produced the first large-scale dataset of methane plumes in Sentinel-2 imagery. Model skill was assessed using multiple scene-level and pixel-level metrics, demonstrating that overall predictions are of high quality, though several sources of false positives and false negatives remain to be addressed. CH4Net comprehensively outperforms the multi-band multi-pass baseline on all metrics except the false positive rate, where both methods perform similarly. These results offer promise for implementing ongoing tracking of known sources to mitigate emissions and provide early warnings when an event is observed.
In contrast to existing methods for methane plume detection in Sentinel-2 images (Varon et al., 2021; Ehret et al., 2022; Irakulis-Loitxate et al., 2022), this model requires only a single pass to generate predictions at the test time and is fully automated. This creates a significant advantage in allowing large volumes of data to be processed without requiring costly manual verification. We believe that this is a significant breakthrough since, as has been shown in other works (e.g. Irakulis-Loitxate et al., 2022), emissions from a single site often recur over a long period of time. With this model we can envision a system that, when a new location is added, we can label past data, retrain the model and use it to produce notifications of new plumes on incoming Sentinel-2 acquisitions over that location. This is very useful to verify that leaks have been permanently fixed and to notify the emitters if this is not the case.
Further work is required in several areas to extend these results. One avenue for future work is improving the current monitoring methodology. For the dataset, the priority for future work in this area is to collect further data over new areas and test whether CH4Net is suitable for application to other semi-arid locations. Furthermore, the accuracy of each mask could further be improved by having multiple annotators providing a mask for each image and taking the intersection over the proposed masks. A current shortcoming of this work is that the output of CH4Net provides only a binary mask as opposed to quantifying the methane concentration at each pixel. Direct prediction of this quantity would allow for both emission occurrence and volume to be monitored. There are also a number of improvements that could be explored to improve the modelling methodology, including implementing scene-level classification with a classification head and implementing more sophisticated segmentation models such as vision transformers (Dosovitskiy et al., 2020). We hope that providing this dataset and baselines will lead to further work on machine learning models for this task.
A second avenue for future work is to explore training a similar model for scanning Sentinel-2 images to discover new super-emitter sites. This would require collecting a much larger dataset of heterogeneous images (images from different locations and biomes) and training a model capable of limiting false positives in areas with highly heterogeneous backgrounds.
Code and hand-annotated masks are available at https://doi.org/10.57967/hf/2117 (Vaughan, 2024). Sentinel-2 data are available at https://www.sentinel-hub.com/ from Sentinel Hub (2024).
AV designed the study, implemented the code, labelled the dataset, conducted the experiments and wrote the first draft. All authors contributed to the analysis of results and final version of the paper.
The contact author has declared that none of the authors has any competing interests.
Publisher’s note: Copernicus Publications remains neutral with regard to jurisdictional claims made in the text, published maps, institutional affiliations, or any other geographical representation in this paper. While Copernicus Publications makes every effort to include appropriate place names, the final responsibility lies with the authors.
Early stages of this project were funded as part of the European Space Agency 3CS grant of Trillium Technologies, reference Starcop 1-2022-00380. The authors gratefully acknowledge the support of the Trillium team and ESA technical officer. Anna Vaughan acknowledges the UKRI Centre for Doctoral Training in the Application of Artificial Intelligence to the study of Environmental Risks (AI4ER), led by the University of Cambridge and British Antarctic Survey, and studentship funding from Google DeepMind. Gonzalo Mateo-García and Luis Gómez-Chova acknowledge support from the Spanish Ministry of Science, Innovation and Universities (project ID: PID2019-109026RB-I00; funder ID: MCIN/AEI/10.13039/501100011033) and the European Social Fund. Luis Gómez-Chova and Luis Guanter acknowledge support from the GVA PROMETEO programme (project no. CIPROM/2021/056).
This research has been supported by the Spanish Ministry of Science, Innovation and Universities (project PID2019-109026RB-I00; funder ID: MCIN/AEI/10.13039/501100011033) and the European Social Fund.
This paper was edited by Dominik Brunner and reviewed by three anonymous referees.
Alvarez, R. A., Zavala-Araiza, D., Lyon, D. R., Allen, D. T., Barkley, Z. R., Brandt, A. R., Davis, K. J., Herndon, S. C., Jacob, D. J., Karion, A., Kort, E. A., Lamb, B. K., Lauvaux, T., Maasakkers, J. D., Marchese, A. J., Omara, M., Pacala, S. W., Peischl, J., Robinson, A. L., Shepson, P. B., Sweeney, C., Townsend-Small, A., Wofsy, S. C., and Hamburg, S. P.: Assessment of methane emissions from the US oil and gas supply chain, Science, 361, 186–188, 2018. a
Aybar, C., Ysuhuaylas, L., Loja, J., Gonzales, K., Herrera, F., Bautista, L., Yali, R., Flores, A., Diaz, L., Cuenca, N., Espinoza, W., Prudencio, F., Llactayo, V., Montero, D., Sudmanns, M., Tiede, D., Mateo-García, G., and Gómez-Chova, L.: CloudSEN12, a global dataset for semantic understanding of cloud and cloud shadow in Sentinel-2, Scientific Data, 9, 782, https://doi.org/10.1038/s41597-022-01878-2, 2022. a
Dosovitskiy, A., Beyer, L., Kolesnikov, A., Weissenborn, D., Zhai, X., Unterthiner, T., Dehghani, M., Minderer, M., Heigold, G., Gelly, S., Uszkoreit, J., and Houlsby, N.: An image is worth 16x16 words: Transformers for image recognition at scale, arXiv [preprint], https://doi.org/10.48550/arXiv.2010.11929, 3 June 2020. a
Drusch, M., Del Bello, U., Carlier, S., Colin, O., Fernandez, V., Gascon, F., Hoersch, B., Isola, C., Laberinti, P., Martimort, P., Meygret, A., Spoto, F., Sy, O., Marchese, F., and Bargellini, P.: Sentinel-2: ESA's optical high-resolution mission for GMES operational services, Remote Sens. Environ., 120, 25–36, 2012. a
Ehret, T., De Truchis, A., Mazzolini, M., Morel, J.-M., D’aspremont, A., Lauvaux, T., Duren, R., Cusworth, D., and Facciolo, G.: Global tracking and quantification of oil and gas methane emissions from recurrent sentinel-2 imagery, Environ. Sci. Technol., 56, 10517–10529, 2022. a, b, c
Gorroño, J., Varon, D. J., Irakulis-Loitxate, I., and Guanter, L.: Understanding the potential of Sentinel-2 for monitoring methane point emissions, Atmos. Meas. Tech., 16, 89–107, https://doi.org/10.5194/amt-16-89-2023, 2023. a
Groshenry, A., Giron, C., Lauvaux, T., d'Aspremont, A., and Ehret, T.: Detecting Methane Plumes using PRISMA: Deep Learning Model and Data Augmentation, arXiv [preprint], https://doi.org/10.48550/arXiv.2211.15429, 17 November 2022. a
Guanter, L., Irakulis-Loitxate, I., Gorroño, J., Sánchez-García, E., Cusworth, D. H., Varon, D. J., Cogliati, S., and Colombo, R.: Mapping methane point emissions with the PRISMA spaceborne imaging spectrometer, Remote Sens. Environ., 265, 112671, https://doi.org/10.1016/j.rse.2021.112671, 2021. a
Irakulis-Loitxate, I., Guanter, L., Liu, Y.-N., Varon, D. J., Maasakkers, J. D., Zhang, Y., Chulakadabba, A., Wofsy, S. C., Thorpe, A. K., Duren, R. M., Frankenberg, C., Lyon, D. R., Hmiel, B., Cusworth, D. H., Zhang, Y., Segl, K., Gorroño, J., Sánchez-García, E., Sulprizio, M. P., Cao, K., Zhu, H., Liang, J., Li, X., Aben, I., and Jacob, D. J.: Satellite-based survey of extreme methane emissions in the Permian basin, Science Advances, 7, eabf4507, https://doi.org/10.1126/sciadv.abf4507, 2021. a
Irakulis-Loitxate, I., Guanter, L., Maasakkers, J. D., Zavala-Araiza, D., and Aben, I.: Satellites Detect Abatable Super-Emissions in One of the World’s Largest Methane Hotspot Regions, Environ. Sci. Technol., 56, 2143–2152, 2022. a, b, c, d, e, f, g
Jacob, D. J., Varon, D. J., Cusworth, D. H., Dennison, P. E., Frankenberg, C., Gautam, R., Guanter, L., Kelley, J., McKeever, J., Ott, L. E., Poulter, B., Qu, Z., Thorpe, A. K., Worden, J. R., and Duren, R. M.: Quantifying methane emissions from the global scale down to point sources using satellite observations of atmospheric methane, Atmos. Chem. Phys., 22, 9617–9646, https://doi.org/10.5194/acp-22-9617-2022, 2022. a, b
Jeppesen, J. H., Jacobsen, R. H., Inceoglu, F., and Toftegaard, T. S.: A cloud detection algorithm for satellite imagery based on deep learning, Remote Sens. Environ., 229, 247–259, 2019. a
Jongaramrungruang, S., Thorpe, A. K., Matheou, G., and Frankenberg, C.: MethaNet – An AI-driven approach to quantifying methane point-source emission from high-resolution 2-D plume imagery, Remote Sens. Environ., 269, 112809, https://doi.org/10.1016/j.rse.2021.112809, 2022. a
Kingma, D. P. and Ba, J.: Adam: A method for stochastic optimization, arXiv [preprint], https://doi.org/10.48550/arXiv.1412.6980, 22 December 2014. a
Lauvaux, T., Giron, C., Mazzolini, M., d’Aspremont, A., Duren, R., Cusworth, D., Shindell, D., and Ciais, P.: Global assessment of oil and gas methane ultra-emitters, Science, 375, 557–561, 2022. a, b
López-Puigdollers, D., Mateo-García, G., and Gómez-Chova, L.: Benchmarking Deep Learning Models for Cloud Detection in Landsat-8 and Sentinel-2 Images, Remote Sens.-Basel, 13, 992, https://doi.org/10.3390/rs13050992, 2021. a
Maasakkers, J. D., Varon, D. J., Elfarsdóttir, A., McKeever, J., Jervis, D., Mahapatra, G., Pandey, S., Lorente, A., Borsdorff, T., Foorthuis, L. R., Schuit, B. J., Tol, P., van Kempen, T. A., van Hees, R., and Aben, I.: Using satellites to uncover large methane emissions from landfills, Science Advances, 8, eabn9683, https://doi.org/10.1126/sciadv.abn96832022. a, b
Ronneberger, O., Fischer, P., and Brox, T.: U-net: Convolutional networks for biomedical image segmentation, in: Medical Image Computing and Computer-Assisted Intervention–MICCAI 2015: 18th International Conference, Munich, Germany, 5–9 October 2015, Proceedings, Part III 18, Springer, 234–241, https://doi.org/10.1007/978-3-319-24574-4_28, 2015. a
Roy, D. P., Wulder, M. A., Loveland, T. R., Woodcock, C. E., Allen, R. G., Anderson, M. C., Helder, D., Irons, J. R., Johnson, D. M., Kennedy, R., Scambos, T. A., Schaaf, C. B., Schott, J. R., Sheng, Y., Vermote, E. F., Belward, A. S., Bindschadler, R., Cohen, W. B., Gao, F., Hipple, J. D., Hostert, P., Huntington, J., Justice, C. O., Kilic, A., Kovalskyy, V., Lee, Z. P., Lymburner, L., Masek, J. G., McCorkel, J., Shuai, Y., Trezza, R., Vogelmann, J., Wynne, R. H., and Zhu, Z.: Landsat-8: Science and product vision for terrestrial global change research, Remote Sens. Environ., 145, 154–172, 2014. a
Saunois, M., Stavert, A. R., Poulter, B., Bousquet, P., Canadell, J. G., Jackson, R. B., Raymond, P. A., Dlugokencky, E. J., Houweling, S., Patra, P. K., Ciais, P., Arora, V. K., Bastviken, D., Bergamaschi, P., Blake, D. R., Brailsford, G., Bruhwiler, L., Carlson, K. M., Carrol, M., Castaldi, S., Chandra, N., Crevoisier, C., Crill, P. M., Covey, K., Curry, C. L., Etiope, G., Frankenberg, C., Gedney, N., Hegglin, M. I., Höglund-Isaksson, L., Hugelius, G., Ishizawa, M., Ito, A., Janssens-Maenhout, G., Jensen, K. M., Joos, F., Kleinen, T., Krummel, P. B., Langenfelds, R. L., Laruelle, G. G., Liu, L., Machida, T., Maksyutov, S., McDonald, K. C., McNorton, J., Miller, P. A., Melton, J. R., Morino, I., Müller, J., Murguia-Flores, F., Naik, V., Niwa, Y., Noce, S., O'Doherty, S., Parker, R. J., Peng, C., Peng, S., Peters, G. P., Prigent, C., Prinn, R., Ramonet, M., Regnier, P., Riley, W. J., Rosentreter, J. A., Segers, A., Simpson, I. J., Shi, H., Smith, S. J., Steele, L. P., Thornton, B. F., Tian, H., Tohjima, Y., Tubiello, F. N., Tsuruta, A., Viovy, N., Voulgarakis, A., Weber, T. S., van Weele, M., van der Werf, G. R., Weiss, R. F., Worthy, D., Wunch, D., Yin, Y., Yoshida, Y., Zhang, W., Zhang, Z., Zhao, Y., Zheng, B., Zhu, Q., Zhu, Q., and Zhuang, Q.: The Global Methane Budget 2000–2017, Earth Syst. Sci. Data, 12, 1561–1623, https://doi.org/10.5194/essd-12-1561-2020, 2020. a
Schuit, B. J., Maasakkers, J. D., Bijl, P., Mahapatra, G., van den Berg, A.-W., Pandey, S., Lorente, A., Borsdorff, T., Houweling, S., Varon, D. J., McKeever, J., Jervis, D., Girard, M., Irakulis-Loitxate, I., Gorroño, J., Guanter, L., Cusworth, D. H., and Aben, I.: Automated detection and monitoring of methane super-emitters using satellite data, Atmos. Chem. Phys., 23, 9071–9098, https://doi.org/10.5194/acp-23-9071-2023, 2023. a
Sentinel Hub: Sentinel-2 L1C, https://www.sentinel-hub.com/, last access: 25 April 2024. a
Sherwin, E. D., Rutherford, J. S., Chen, Y., Aminfard, S., Kort, E. A., Jackson, R. B., and Brandt, A. R.: Single-blind validation of space-based point-source detection and quantification of onshore methane emissions, Sci. Rep.-UK, 13, 3836, https://doi.org/10.1038/s41598-023-30761-2, 2023. a
Sinergise Ltd., S. L.: Sentinel Hub, https://www.sentinel-hub.com (last access: 10 August 2023), 2023. a
Stocker, T.: Climate change 2013: the physical science basis: Working Group I contribution to the Fifth assessment report of the Intergovernmental Panel on Climate Change, Cambridge University Press, ISBN 978-1-107-05799-1 hardback, ISBN 978-1-107-66182-0 paperback, 2014. a
Tollefson, J.: Scientists raise alarm over `dangerously fast' growth in atmospheric methane, Nature, https://doi.org/10.1038/d41586-022-00312-2, 8 February 2022. a
Varon, D. J., Jervis, D., McKeever, J., Spence, I., Gains, D., and Jacob, D. J.: High-frequency monitoring of anomalous methane point sources with multispectral Sentinel-2 satellite observations, Atmos. Meas. Tech., 14, 2771–2785, https://doi.org/10.5194/amt-14-2771-2021, 2021. a, b, c, d, e, f
Vaughan, A.: ch4net (Revision 568db19), Hugging Face [data set], https://doi.org/10.57967/hf/2117, 2024. a
Zavala-Araiza, D., Alvarez, R. A., Lyon, D. R., Allen, D. T., Marchese, A. J., Zimmerle, D. J., and Hamburg, S. P.: Super-emitters in natural gas infrastructure are caused by abnormal process conditions, Nat. Commun., 8, 1–10, 2017. a