the Creative Commons Attribution 4.0 License.
the Creative Commons Attribution 4.0 License.
 | 13 May 2024
Observing low-altitude features in ozone concentrations in a shoreline environment via uncrewed aerial systems
Josie K. Radtke
Benjamin N. Kies
Whitney A. Mottishaw
Sydney M. Zeuli
Aidan T. H. Voon
Kelly L. Koerber
Grant W. Petty
Michael P. Vermeuel
Timothy H. Bertram
Ankur R. Desai
Joseph P. Hupy
R. Bradley Pierce
Timothy J. Wagner
Ozone is a pollutant formed in the atmosphere by photochemical processes involving nitrogen oxides (NOx) and volatile organic compounds (VOCs) when exposed to sunlight. Tropospheric boundary layer ozone is regularly measured at ground stations and sampled infrequently through balloon, lidar, and crewed aircraft platforms, which have demonstrated characteristic patterns with altitude. Here, to better resolve vertical profiles of ozone within the atmospheric boundary layer, we developed and evaluated an uncrewed aircraft system (UAS) platform for measuring ozone and meteorological parameters of temperature, pressure, and humidity. To evaluate this approach, a UAS was flown with a portable ozone monitor and a meteorological temperature and humidity sensor to compare to tall tower measurements in northern Wisconsin. In June 2020, as a part of the WiscoDISCO20 campaign, a DJI M600 hexacopter UAS was flown with the same sensors to measure Lake Michigan shoreline ozone concentrations. This latter UAS experiment revealed a low-altitude structure in ozone concentrations in a shoreline environment showing the highest ozone at altitudes from 20–100 m a.g.l. These first such measurements of low-altitude ozone via a UAS in the Great Lakes region revealed a very shallow layer of ozone-rich air lying above the surface.
- Article
(3309 KB) - Full-text XML
-
Supplement
(1206 KB) - BibTeX
- EndNote


Ozone at elevated concentrations near the surface is a pollutant that causes respiratory irritation in humans (Bell et al., 2006; Brauner et al., 2016) and oxidative stress on photosynthesizing organisms in many ecosystems (Fuhrer, 2002). In the troposphere, ozone is generated by reactions of nitrogen oxides (NOx = NO + NO2) and volatile organic compounds (VOCs) exposed to sunlight (Sillman, 1999). NOx compounds are emitted from combustion sources and VOCs are emitted by biogenic processes and anthropogenic industrial sources such as transportation and evaporated solvents (benzene, formaldehyde, ethyl alcohol, etc.). While ozone is monitored at the surface to meet various air quality monitoring standards, or to understand ozone depositional losses, ozone gradients aloft have been measured in various ways over the years using sondes that reach the stratosphere (Beekmann et al., 1995; Witte et al., 2018), instrumented towers (Crawford et al., 1996; Desjardins et al., 1995), tethered balloons (Chandrasekar et al., 2003; Li et al., 2018; Mazzuca et al., 2017; Zhang et al., 2019; Tang et al., 2021; DeMuer et al., 1997; Greenberg et al., 2009; Knapp et al., 1998), and crewed aircraft (e.g., Kaser et al., 2017; Crawford et al., 1996; Tanimoto et al., 2015; Tarasick et al., 2019; Desjardins et al., 1995). Because ozone is generated by chemical reactions, the confinement of primary pollutants near the surface via atmospheric inversions tends to produce higher-ozone-concentration events at the surface. Understanding the volume of air in and above an inversion at a shoreline location prone to high-ozone events can help elucidate the chemical evolution processes in this environment (Chai et al., 2013; Tang et al., 2021, 2009).
Recently there has been an expansion of efforts for uncrewed aircraft systems (UASs) to be used for atmospheric profiling (Telg et al., 2017; Chilson et al., 2019; de Boer et al., 2024; Hemingway et al., 2017; Jacob et al., 2018; Koch et al., 2018; Wainwright et al., 2015; Li et al., 2018). Tethered balloons have been used to study vertical ozone (DeMuer et al., 1997; Peng et al., 2008; Knapp et al., 1998; Zhang et al., 2019; Greenberg et al., 2009) and meteorological conditions (Chandrasekar et al., 2003) by gathering data at heights ranging from ground level to 1500 m a.g.l., which included evaluations of episodes of biomass burning (Xu et al., 2018) and mesoscale modeling of ozone in the upper troposphere (Peng et al., 2008). UAS platforms measuring atmospheric properties have deployed at heights ranging from ground level to 4000 m a.g.l. (Adkins and Sescu, 2017; Chilson et al., 2019; Cook et al., 2013; Greatwood et al., 2017; Hemingway et al., 2017). The portable Personal Ozone Monitor (POM; 2B Tech) mounted on a UAS performed consistently in comparison to a larger ozone photo analyzer equipped to a tethered airship in the lower troposphere (Li et al., 2018) but with some significant discrepancies between platforms within the planetary boundary layer. Through modeling efforts using generalized additive models (GAMs), Li et al. (2018) attributed these discrepancies to a horizontal separation of platforms and vertical variations in atmospheric structure including temperature and relative humidity.
The effect of lake breeze or sea breeze on regional ozone in shoreline environments has been a point of interest in several studies. The association of sea breezes and lake breezes with elevated ozone at shoreline locations has been documented in Houston (Banta et al., 2005), in Toronto (Levy et al., 2010; Sills et al., 2011), in New York City during LISTOS (Zhang et al., 2020), and near Chesapeake Bay (Gronoff et al., 2019), but few studies have explored vertical profiles within the marine layer structure. The lake and sea breeze meteorology develops from colder air parcels moving over land underneath buoyant warmer air, which can create capping inversion that can trap pollutants (Lu and Turco, 1994; Gaza, 1998; Levy et al., 2010; Sills et al., 2011). Multiple groups have found there to be a notable difference in ozone levels during a sea or lake breeze including the OWLETS (Ozone Water-Land Transition Study) in the Chesapeake Bay region (Sullivan et al., 2019); ABLE (Amazon Boundary Layer Experiment) over Manaus, Brazil (Guimaras et al., 2020); and a research team in the Salt Lake City region (Blaylock et al., 2017). The OWLETS analyzed ozone pollution using ozone sensors mounted onto ships and UASs. These measurements showed that ozone builds up over the bay due to the effect of sea breeze up to 2000 m above sea level (Sullivan et al., 2019). With these observations, Sullivan et al. (2019) attempted to forecast chemical emissions based upon emissions from ships and other emission sources in the bay. During ABLE, Guimaras et al. (2020) used a UAS to study the urban nighttime boundary layer over Manaus, Brazil, in both the dry and wet seasons. They conducted flights from the center of the city from the ground level up to 500 m to quantify the effect humidity has on ozone pollution over Manaus at night (Guimaras et al., 2020). Crewed aircraft were used over the Great Salt Lake in Utah to study ozone levels up to 4000 m a.g.l. and demonstrated a complicating factor of lake breeze transporting contrasting air masses into the region (Blaylock et al., 2017; Crosman et al., 2017; Horel et al., 2016).
The relationship between ambient ozone and coastal environments has been investigated by aircraft mobile platforms for the 2017 Lake Michigan Ozone Study (LMOS) (Cleary et al., 2022b; Doak et al., 2021; Stanier et al., 2021), a UAS for the OWLETS campaign (Gronoff et al., 2019), and multi-UAS strategies for WiscoDISCO21 (Wisconsin's Dynamic Influence of Shoreline Circulations on Ozone; Tirado et al., 2023; Cleary et al., 2022a). Ozone concentrations have been shown to sharply vary with altitude in low-altitude crewed aircraft flights over Lake Michigan (Cleary et al., 2022b; Stanier et al., 2021). During the OWLETS campaign, the high over-water ozone was investigated by UAS and ship-based platforms, including low-ozone titration events. In these transitional environments, the model and observation agreement can be improved with the capture of small gradients and by modeling marine inversions over water (Abdi-Oskouei et al., 2020; McNider et al., 2018; Cleary et al., 2015). Recent observations over riverine environments have demonstrated the viability of a UAS for detecting low-altitude variations in ozone and plume chemistry (Li et al., 2021; Guimaras et al., 2020; Ye et al., 2022). The horizontal extent of lake breeze has also been documented at the shoreline of Lake Michigan where horizontal gradients close to the shoreline were observed during the 2017 LMOS (Cleary et al., 2022b; Stanier et al., 2021).
The goal of this study is to develop a technique for investigating the vertical profiles of ozone at a shoreline location impacted by high-ozone episodes. Chiwaukee Prairie, Wisconsin, hosts a regulatory site at a shoreline state natural area, which is one of the few in Wisconsin which regularly exceed federal ozone standards and is regularly impacted by lake breeze. The large sources of emissions for ozone precursors are mainly concentrated in the Chicago metro area, and the presence of Lake Michigan provides an inverted atmosphere at times in which to trap said pollutants. The role of the inversion over Lake Michigan, the advection of pollutants over Lake Michigan and then back on land during the mesoscale meteorological phenomenon of the lake breeze, is the focus of the WiscoDISCO field campaigns. We first outline how the instrumentation was tested in a non-lakeshore environment during CHEESEHEAD19 and then describe improvements to instrumentation performance for the first WiscoDISCO field campaign in 2020. Here, the UAS-based observations of ozone and meteorological variables were compared to tower observations in a forested environment in 2019 and then ground observations at a Lake Michigan shoreline in 2020, demonstrating improved performance and viability of a UAS atmospheric profiler to investigate lower atmospheric variability at a site impacted by lake breeze and poor air quality.
2.1 CHEESEHEAD19 and PEcorINO (Probing Ecosystem Responses Involving Notable Organics) measurement campaigns
The University of Wisconsin–Eau Claire team joined the 2019 Chequamegon Heterogenous Ecosystem Energy-balance Study Enabled by a High-density Extensive Array of Detectors (CHEESEHEAD19) campaign (Butterworth et al., 2021) in July 2019 in order to compare UAS-based observations with tower observations made during the first 7 d intensive observation period of the field campaign. CHEESEHEAD19 was the multi-institute campaign that sought to give insight into atmosphere–land exchanges in a temperate mixed forest (Butterworth et al., 2021). The CHEESEHEAD19 domain incorporated a swath of land in the Chequamegon-Nicolet National Forest near Park Falls, Wisconsin, where multiple tower, UAS, aircraft, ground, and remote sensing observations were conducted, focused around the 447 m instrumented tower operated by WLEF-TV (45.946° N, 90.273° W) and owned by the state of Wisconsin. Local vehicular traffic at the tall tower site was light and a mix of trucking, forestry, and automobile traffic on Wisconsin Highway 182 (Fig. 1). The tower has been in operation since 1995 as a National Oceanic and Atmospheric Administration (NOAA) greenhouse gas tall tower site (LEF) and since 1996 as an AmeriFlux eddy covariance site (US-PFa), with sampling inlets and flux measurements currently at 30, 122, and 396 m a.g.l. Ozone concentration observations were made at two specific heights on the tower (30 and 122 m) by two instruments: a chemical ionization time-of-flight mass spectrometer (CI-TOFMS; Tofwerk and Aerodyne) using oxygen anion (O) ionization chemistry (1 s LOD, limit of detection, ∼ 10 ppt) (Novak et al., 2020) and an EPA standard photometric analyzer (LOD of 0.5 ppb Thermo Scientific 49i; Vermeuel et al., 2021). The fast observations of ozone by the CI-TOFMS instrument were used for flux measurements (Vermeuel et al., 2021). For the purposes of proving the viability of a UAS-mounted ozone measurement, the tower ozone measurements were compared to ozone gradient measurements from the UAS-mounted POM.
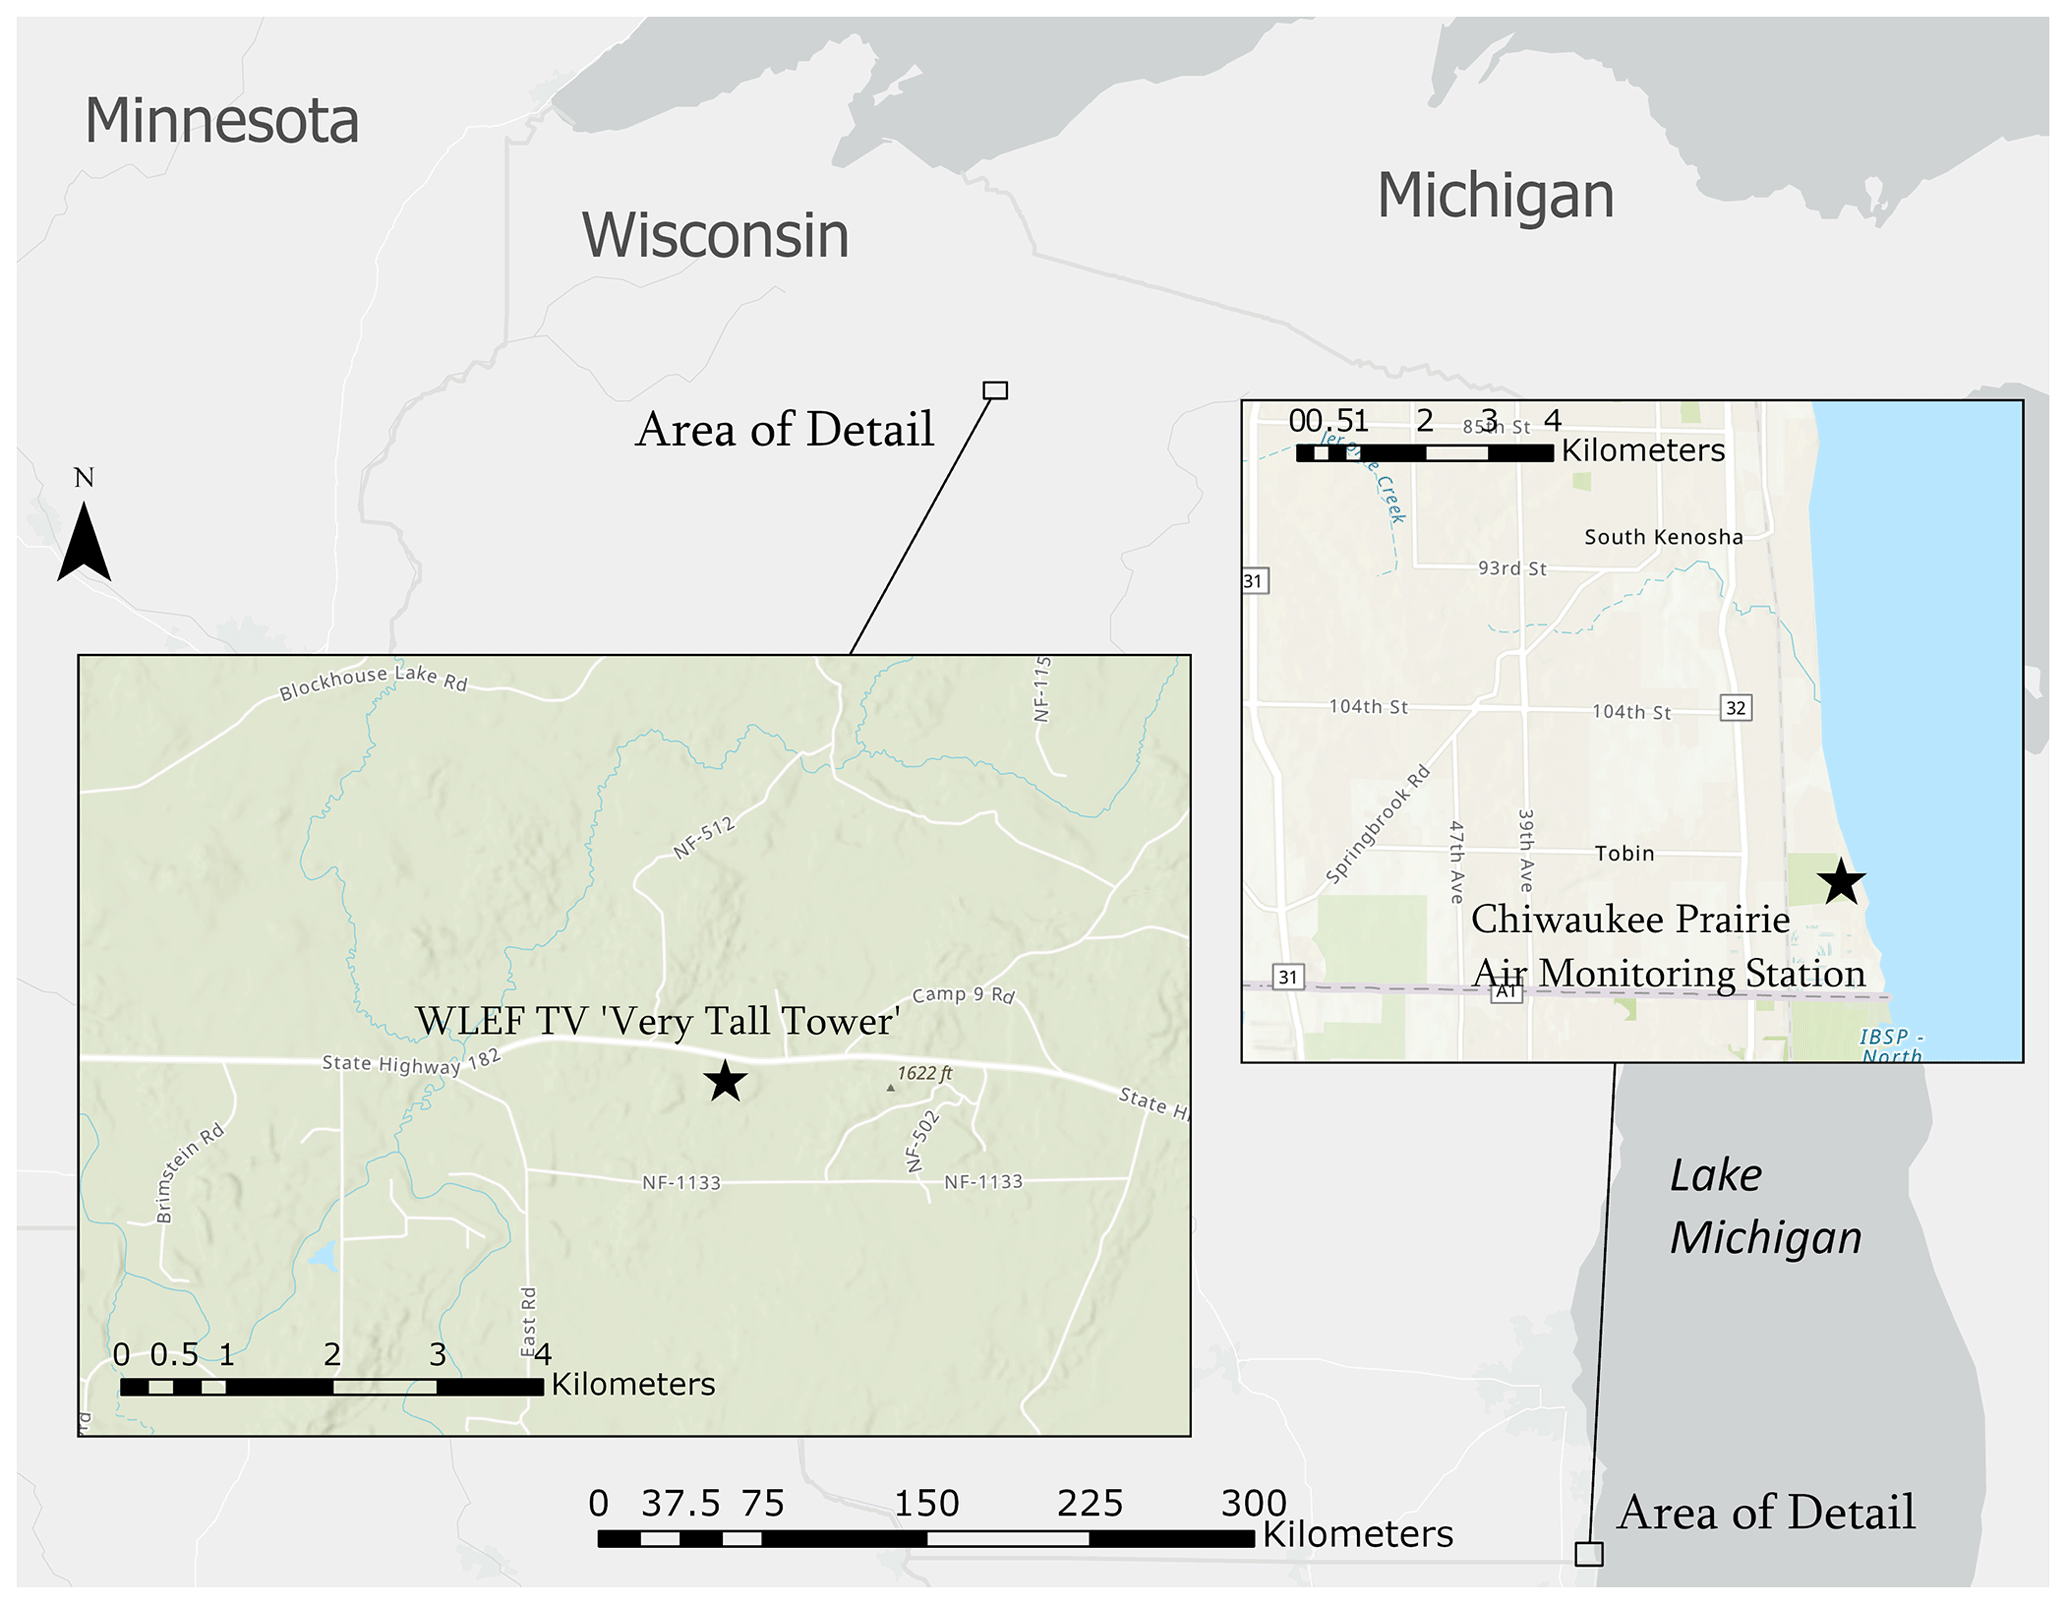
Figure 1During the CHEESEHEAD19 and PEcorINO campaigns, measurements were taken at the WLEF TV “Very Tall Tower” (northern Wisconsin). During the WISCODisco20 campaign, measurements were taken by the Chiwaukee Prairie air monitoring station (southeastern Wisconsin). The map was made with ArcGIS Pro 2.8 using ESRI basemap data.
A follow-up study, Probing Ecosystem Responses Involving Notable Organics (PEcorINO; Vermeuel et al., 2023), was conducted in September 2020 at the WLEF tower with observations of VOCs and ozone at the 30 m inlet (Fig. 1). A high-resolution proton-transfer-reaction time-of-flight mass spectrometer (HR-PTR-TOFMS; Vocus; Aerodyne Research Inc. and Tofwerk AG; Krechmer et al., 2018) collected continuous 10 Hz measurements of VOCs, and a photometric analyzer (Thermo Scientific 49i) collected 1 Hz O3 measurements at 30 m. Routine US-PFa site measurements of 10 Hz temperature and 1 Hz measurements of relative humidity (HMP-45C) were also collected during this period.
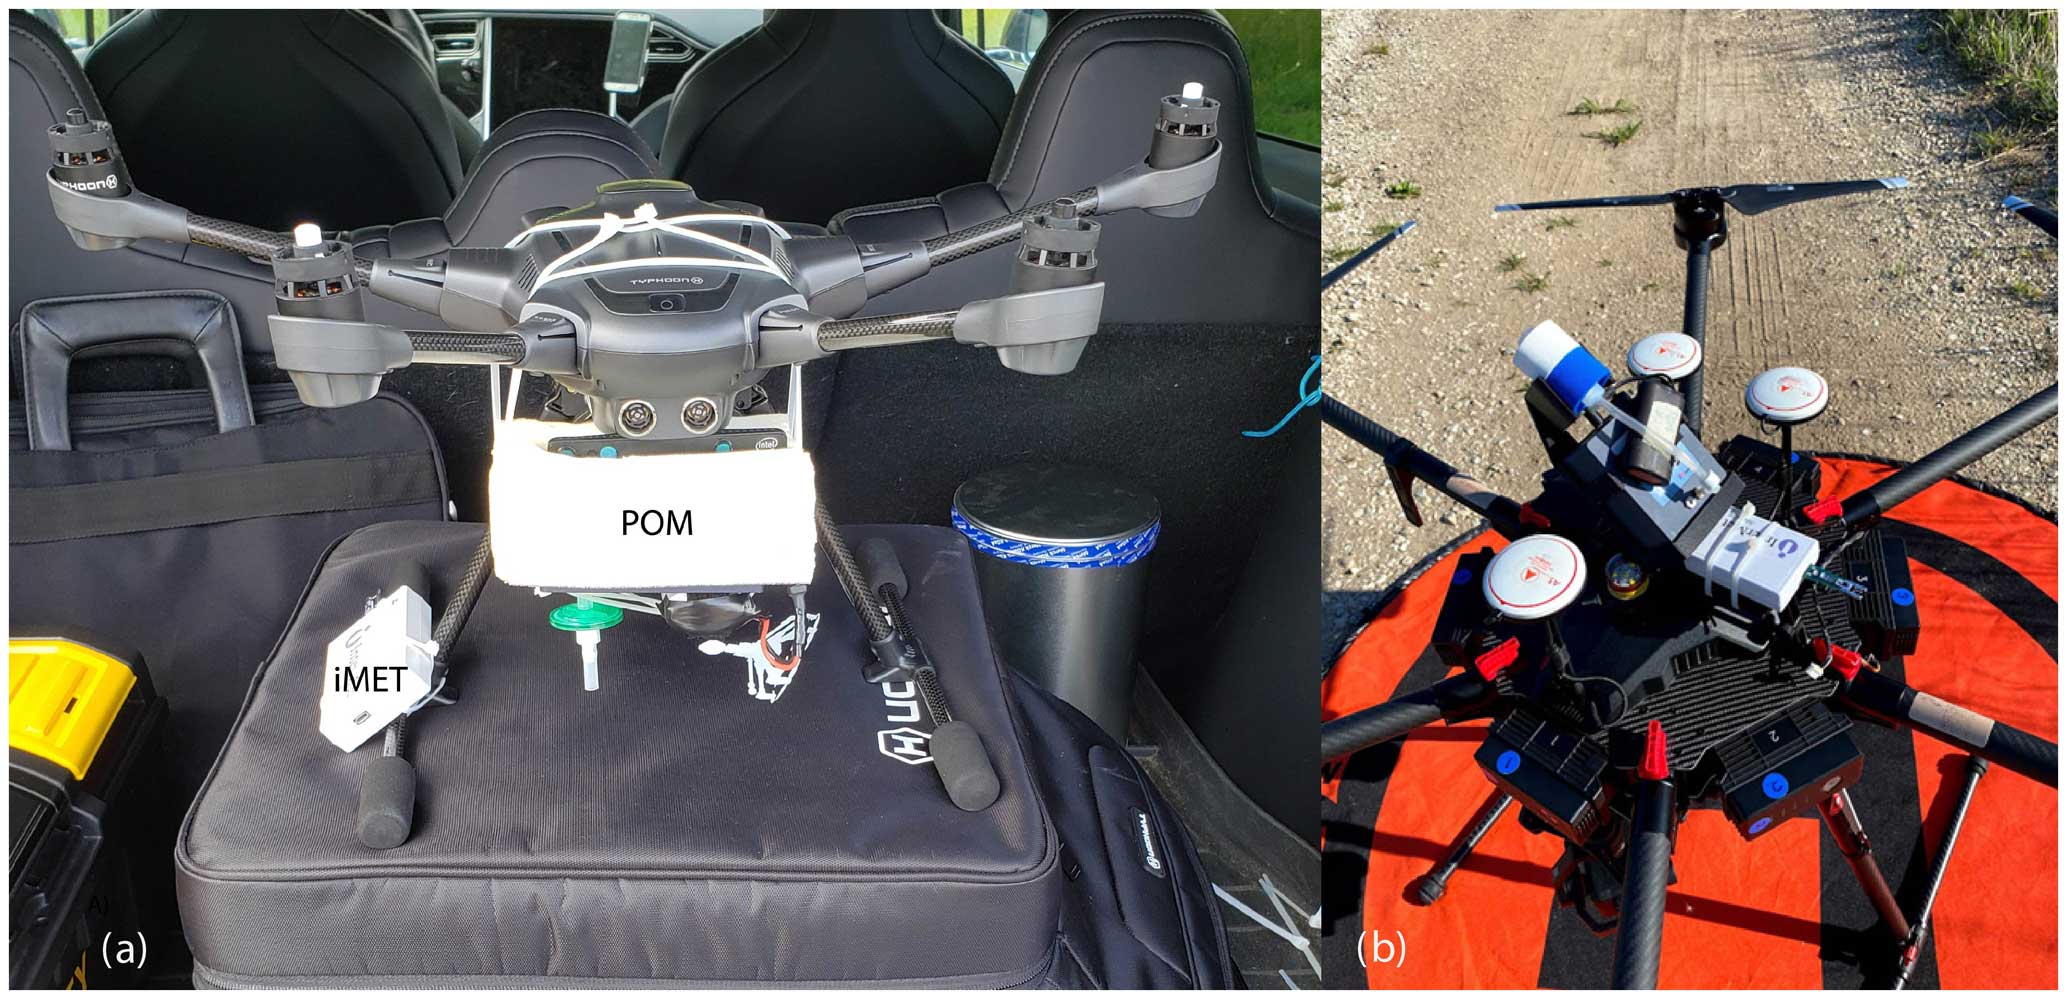
Figure 2(a) Typhoon H UAS with mounted POM and iMet-XQ2 as flown during CHEESEHEAD19 in 2019. The POM was housed in foam for vibration dampening. (b) A top-mounted iMet-XQ2 and POM on a DJI M600 as flown in September 2020 for WiscoDISCO20. The inlet to the POM is held up with a bracket to hold the inlet filter assembly (blue and white).
For CHEESEHEAD19, the Yuneec Typhoon H hexacopter UAS was flown a total of 4 d in July 2019 (8, 11, 12, and 16 July) during the campaign at the WLEF tower and on 13 and 14 September 2020 during PEcorINO. The Typhoon H, owned by UW–Eau Claire, was chosen for this campaign because it was an inexpensive commercial UAS with a capability of holding the payload of the POM. Flights in 2019 were conducted in the time window of 11:00–15:00 local time (CDT) and at 11:00 and 18:00 CDT in 2020. The Typhoon H was equipped with the POM for each of the flights at the tall tower and an InterMet Systems meteorological sensor, the iMet-XQ2, for the flights on 16 July 2019 and September flights from 2020 (see Fig. 2a). The iMet-XQ2 sensor was placed on the landing gear of the Typhoon H to balance the payload. The days were chosen for suitable flying conditions without strong winds (24 km h−1/< 15 mph gusts) or rainstorms or other precipitation. The Typhoon H was flown from a location roughly 30 m (100 ft) from the tall tower in different patterns to hover for 5 min at 30, 60, 90, and 122 m a.g.l. Tower gradient uncertainties were determined from 1 standard deviation of the data from 30 and 122 m. The instruments sampling at the 122 and 30 m heights from the tall tower were switched periodically (Vermeuel et al., 2021). The POM ozone data were collected at 10 s intervals and averaged to 5 min.
Before the CHEESEHEAD19 campaign, numerous test flights were necessary to work out payload distribution and to devise flight strategies. The Typhoon H had an approximate 15 min flight time per battery with the payload. Each flight of the Typhoon H flights consisted of two hovers at different heights for 5 min. UAS flight log data were saved and used as a primary source for GPS data. All UAS flights were conducted under Federal Aviation Administration (FAA) Part 107 UAS regulations with a licensed UAS pilot.
2.2 The WiscoDISCO20 campaign
The purpose of the Wisconsin's Dynamic Influence on Shoreline Circulations on Ozone (WiscoDISCO) campaign was to investigate the marine inversion influence on ozone measurements at the Lake Michigan shoreline using a UAS at Chiwaukee Prairie Natural Area in Kenosha County, Wisconsin. A regulatory monitor at Chiwaukee Prairie, managed by the Wisconsin Department of Natural Resources (WiDNR), records some of the highest ozone in the state of Wisconsin, and many Wisconsin shoreline Lake Michigan counties are in non-attainment of federal ozone standards (Stanier et al., 2021). Chiwaukee Prairie is located at the border between Wisconsin and Illinois and is situated between the coastal communities of Winthrop Harbor, Illinois, and Pleasant Prairie, Wisconsin. Suburban housing developments and mixed farmland surround the prairie (Fig. 1). Local automobile traffic near the monitor and UAS launch site was light and limited to neighborhood traffic and occasional train traffic.
The main goal of this campaign was to capture ozone exceedance days at this site where there was an influence of the lake breeze circulation. Ozone exceedance days are typically those in which the synoptic winds bring air from the south northward with high pressure systems over the Ohio Valley (Hanna and Chang, 1995), which are influenced heavily by Chicago pollution plumes. In this environment, temperature inversions commonly form when near-surface air is chilled by thermal exchange with the comparatively cold water of Lake Michigan and are exacerbated when lake breezes advect this dense but shallow layer of cold air inland (Wagner et al., 2022). The result is a shallow pool of colder, denser air overlain by warmer air aloft, with the inversion defined by the temperature increase with height at the boundary between the dissimilar air masses. Inversions act as a cap on the vertical mixing of air that would otherwise dilute and disperse NOx and VOCs within these pollution plumes. Thus, these ozone precursors can accumulate in the near-surface air to relatively high concentrations.
During WiscoDISCO20, UASs were deployed on 8, 9, and 15–19 June 2020. The WiscoDISCO20 campaign was in collaboration with the Wisconsin Department of Natural Resources' (DNR) enhanced monitoring plan for the Chiwaukee Prairie site and included Pandora (Herman et al., 2009; a ground-based differential optical absorption spectrometer which uses the sun as a light source to obtain total column trace gas measurements) and Doppler lidar observations at the site, provided by the Space Science and Engineering Center at the University of Wisconsin–Madison. The Doppler lidar instruments were deployed on 9 June 2020 and operated continuously throughout the summer. The Pandora instrument is part of the Pandonia Global Network (Verhoelst et al., 2021), which provides automated measurements of total column and tropospheric column NO2.
A DJI M600 hexacopter was utilized in a collaborative research endeavor with Purdue University for the WiscoDISCO20 campaign with an FAA-compliant Part 107 UAS pilot, Joe Hupy. The DJI M600 had an increased payload capacity with its camera removed and the ability to place a top mount for the sensor package, thus increasing the stability of the payload and providing a longer flight time than the Typhoon H (see Fig. 2b). A 3D-printed bracket to support the POM was mounted to the top of the vehicle. The inlet filter cartridge for the POM was held at a position with the least influence from propeller wash at the center of the top position of the UAS with a ∼ 6 cm inlet tube. The iMet-XQ2 sensor was mounted to the bracket and secured with cable ties (see Fig. S2 in the Supplement). During WiscoDISCO20, a series of flights were conducted to produce an atmospheric vertical profile with fixed altitudes where the UAS hovered for 5 min at each designated altitude. The flight times were approximately 15–20 min, during which the UAS would ascend for 15 m altitude increments where it would hover for 5 min. In an approximate 1.25 h time window, eight heights were sampled from 0–122 m a.g.l. with three individual flights (see Table S1). Flights were conducted from a gravel road inside of the Chiwaukee Prairie State Natural Area, with two focused vertical profile sampling periods: one in the morning at approximately 07:00–09:00 LT (CDT) and one in the afternoon at approximately 14:00–16:00 LT (CDT).
2.3 Personal ozone monitor (POM)
The 2B Tech personal ozone monitor (POM) measured ozone concentrations via UV absorption spectroscopy, which is designed to account for a known interference with humidity in the atmosphere (Wilson and Birks, 2006). The POM measures ozone concentrations by calculating the difference in absorption between a whole air sample and an ozone-scrubbed air sample in series with one optical cell. The POM operates with an in-series duty cycle of measuring the whole air sample for 5 s and an ozone-scrubbed background air sample for another 5 s in the same optical cell (Andersen et al., 2010). This differs from current robust ground analyzers, such as the Thermo Scientific 49i, which use dual optical cells, with one chamber of whole air and another chamber with the ozone scrubbed out, to measure a real-time background interference in the absorption signal (Ollison et al., 2013; Wilson and Birks, 2006). This duty cycle must be considered when the POM is on a moving platform, as the air sampled in the first 5 s must be representative of the air sampled in the second 5 s interval for each measurement; therefore, slow movement of the UAS during sampling was preferred. For all measurements described here, the UAS was held at one altitude for 5 min to collect representative data from that air mass. The absorption spectroscopy principle behind the POM with the active background humidity subtraction has a higher specificity to ozone than other lightweight electrochemical sensors (Kim et al., 2018). The POM was calibrated with the 2B Tech Model 309 transfer standard ozone generator within 24 h of UAS flights during CHEESEHEAD19. The POM was placed in a foam case to dampen any vibrations associated with the UAS to which it was fastened. The filter on the POM was used for all flights to protect the optical cell from atmospheric particles and debris. The POM was independently powered by lithium-ion batteries. During WiscoDISCO20, the POM was calibrated with the Model 309 ozone generator within 2 h of each atmospheric profile series of UAS flights. Zero drift of the POM was monitored by collecting ozone-scrubbed data using a cartridge ozone scrubber in between flights. The 2B Tech POM accuracy and precision are given as 1.5 ppb or 2 % of observations, whichever is highest. For the range of observations in this study, the accuracy and precision ranged from 1.5 ppb for many morning observations up to 2.1 ppb for high-ozone afternoon observations.
2.4 iMet-XQ2
The iMet-XQ2 sensor is lightweight and portable, which allows it to measure temperature (bead thermistor), relative humidity (capacitive), and pressure (piezoresistive) along with recording GPS data with its own internal storage and power systems. The International Met Systems listed the iMet-XQ2 accuracy and resolution of ±0.3 and 0.01 °C for temperature, ±5 % and 0.1 % for relative humidity, ±1.5 and 0.01 hPa for pressure, and an accuracy of 12 m for vertical GPS data. The data were extracted from the iMet-XQ2 after each flight.
Previous studies have evaluated the accuracy of the iMet-XQ2 on UAS platforms (Kimball et al., 2020; Inoue and Sato, 2022). Kimball et al. (2020) executed an exhaustive study on the performance of the iMet-XQ on a UAS in certain solar radiation and wind speed conditions. While they found that under low solar radiation the accuracy and precision of the temperature measurement followed the listed accuracy and precision, with some direct solar radiation, higher wind speeds on the thermistor allowed for an improved precision of the measurements. In cold conditions, shielding the thermistor from both solar radiation and heating from the UAS is important (Inoue and Sato, 2022). Sensor position on the UAS has been found to be important for preventing additional bias from motor heating and propeller wash if the sensor is placed too close to UAS motors (Greene et al., 2019). For this study, a lower accuracy of the iMet-XQ was considered reasonable to ascertain the vertical profile structure of the atmosphere at a shoreline location if the solar radiation conditions and flight conditions were similar throughout the data collection flight.
3.1 UAS to tower comparisons
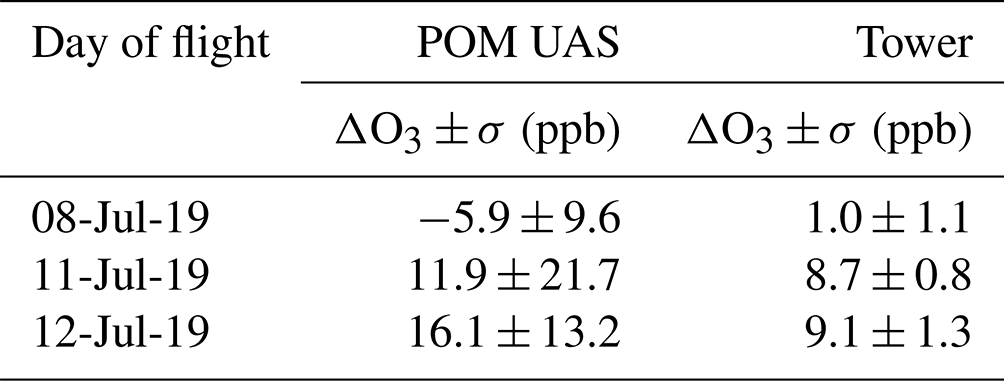
During the CHEESEHEAD19 campaign, an intercomparison was conducted between the observations of ozone from the WLEF tower and UAS. The tall tower ozone measurements were from either a Thermo Scientific 49i photometric analyzer or a CI-TOFMS instrument. Each sampled air from either the 122 or 30 m inlet simultaneously, and source inlets (i.e., sampled heights) were switched between instruments periodically. The absolute ozone concentrations at the 122 and 30 m heights from the tower ranged from midday highs of 40–60 ppb. Tower ozone gradients were calculated as the difference between the ozone measured at 122 and 30 m inlet heights. These tower observations were compared to the gradient ozone observations made by hovering the UAS at the 122 and 30 m altitudes for 5 min each. The gradient ozone observations reproduced the reported ozone gradients on the tower within the considerable uncertainty (see Table 1). The absolute concentrations from the POM were as much as 20 ppb higher than the tower observations (see Fig. S3), with tower observations from both the 49i and TOF considered to be the more reliable measurements with consistent calibration procedures and low detection limits (Vermeuel et al., 2021, 2023). Technically the overall comparison between tower gradients and UAS gradients show agreement; however, the considerable uncertainties make POM gradients from 8 and 11 July indistinguishable from zero (see Table 1). This evaluation demonstrated a likely source of inaccuracy with POM ozone observations, with significant offset from the absolute tower observations. These inaccuracies have since been attributed to a zero-point drift of the POM, which was substantiated by further laboratory experiments on calibration conditions of the POM. Those experiments showed differences in calibrations due to different sources of power to the POM (batteries versus wall power). The large noise in the POM observations was attributed to disrupted airflow from propeller wash, which was exacerbated by the bottom mount of the POM on the UAS; this was observed as a higher noise during takeoff and at the start of every hover.
Table 1Comparison of ozone gradients made from WLEF tower at Park Falls and UAS-based POM during CHEESEHEAD19. The ozone gradient, ΔO3, calculated as measured O3 at 122 m − O3 at 30 m. The tower measurements were selected coincidentally with UAS-mounted POM measurements. The reported uncertainties are propagated from 1 standard deviation at each altitude.
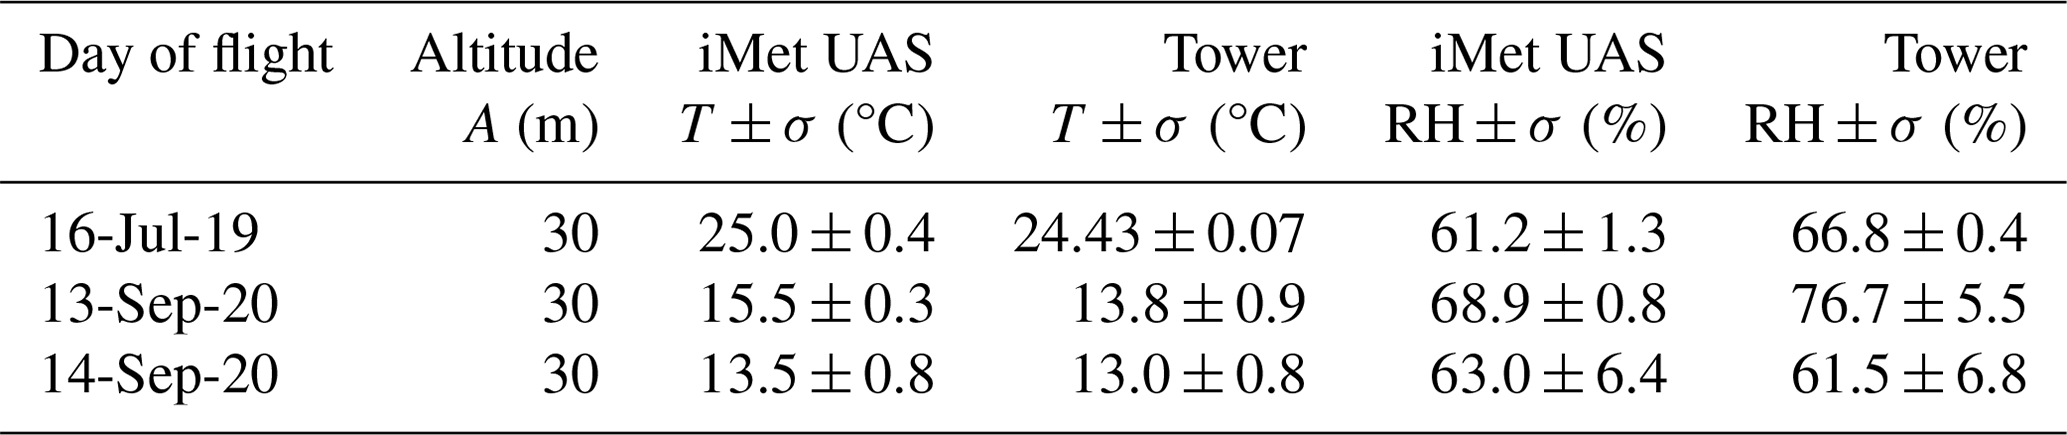
Improvements to the UAS sensor package for the WiscoDISCO20 system were developed as a result of these findings as follows: (a) the POM was mounted at the top of a larger UAS with the inlet positioned to the center of a larger, more robust platform; (b) the POM was calibrated with the same independent POM battery source as the flights, and calibrations were conducted within 2 h of every flight; and (c) zero drift was monitored by placing an in-line ozone scrubber on the POM inlet directly after each flight for 5 min. The temperature and relative humidity measurements observed from the UAS using the iMet were found to vary from the tower measurements by no more than 1.7 °C for temperature and 8 % for RH (relative humidity; see Table 2).
Table 2Comparison of average air temperature and relative humidity made from WLEF tower at Park Falls and iMet-XQ during CHEESEHEAD19 and PEcorINO in 2020. The average Tower temperatures at the 30 m inlet were computed at the time intervals when the UAS altitude was 30 m a.g.l. The iMET and Tower data were evaluated at 1 Hz; therefore, approximately n = 300 for each 5 min hover period.
3.2 Observations at the Lake Michigan shoreline: WiscoDISCO20 UAS to ground comparisons
The viability for UAS-mounted ozone observations to capture low-altitude features in ozone is well-matched to the small-scale vertical structure of marine layer ozone concentrations in a nearshore environment. For the June 2020 observations, the UAS platform was the DJI M600 with a top-mounted bracket for positioning the filter cartridge for the POM in a space for minimal disruption of the air mass from propeller wash. The iMet-XQ2 sensor was mounted to this bracket to the side of the POM (see Fig. S2). The DJI M600 was flown at the Chiwaukee Prairie State Natural Area to capture shoreline air masses impacted by lake breeze onshore flow during a time of high ozone. The week of 15–19 June 2020 provided ideal conditions for high ozone and lake breeze conditions (as seen in Fig. 3) where daytime winds shifted regularly to southeasterly winds and daily maximum temperatures increased throughout the week (see the Supplement for the identification of lake breeze from GOES-East satellite imagery). Most days during the week of 15–19 June had observable cumulous cloud suppression fronts over land near the shoreline of Lake Michigan, which is indicative of marine air incursion over land (see Figs. S4–S5). Particulate matter concentrations also increased during the week. The UAS was flown in a 2 h window to capture morning and afternoon vertical atmospheric profiles. A single battery flight of the UAS accounted for three to four hover heights, and multiple sets of batteries were used to hover for 10 total points to get a vertical distribution.
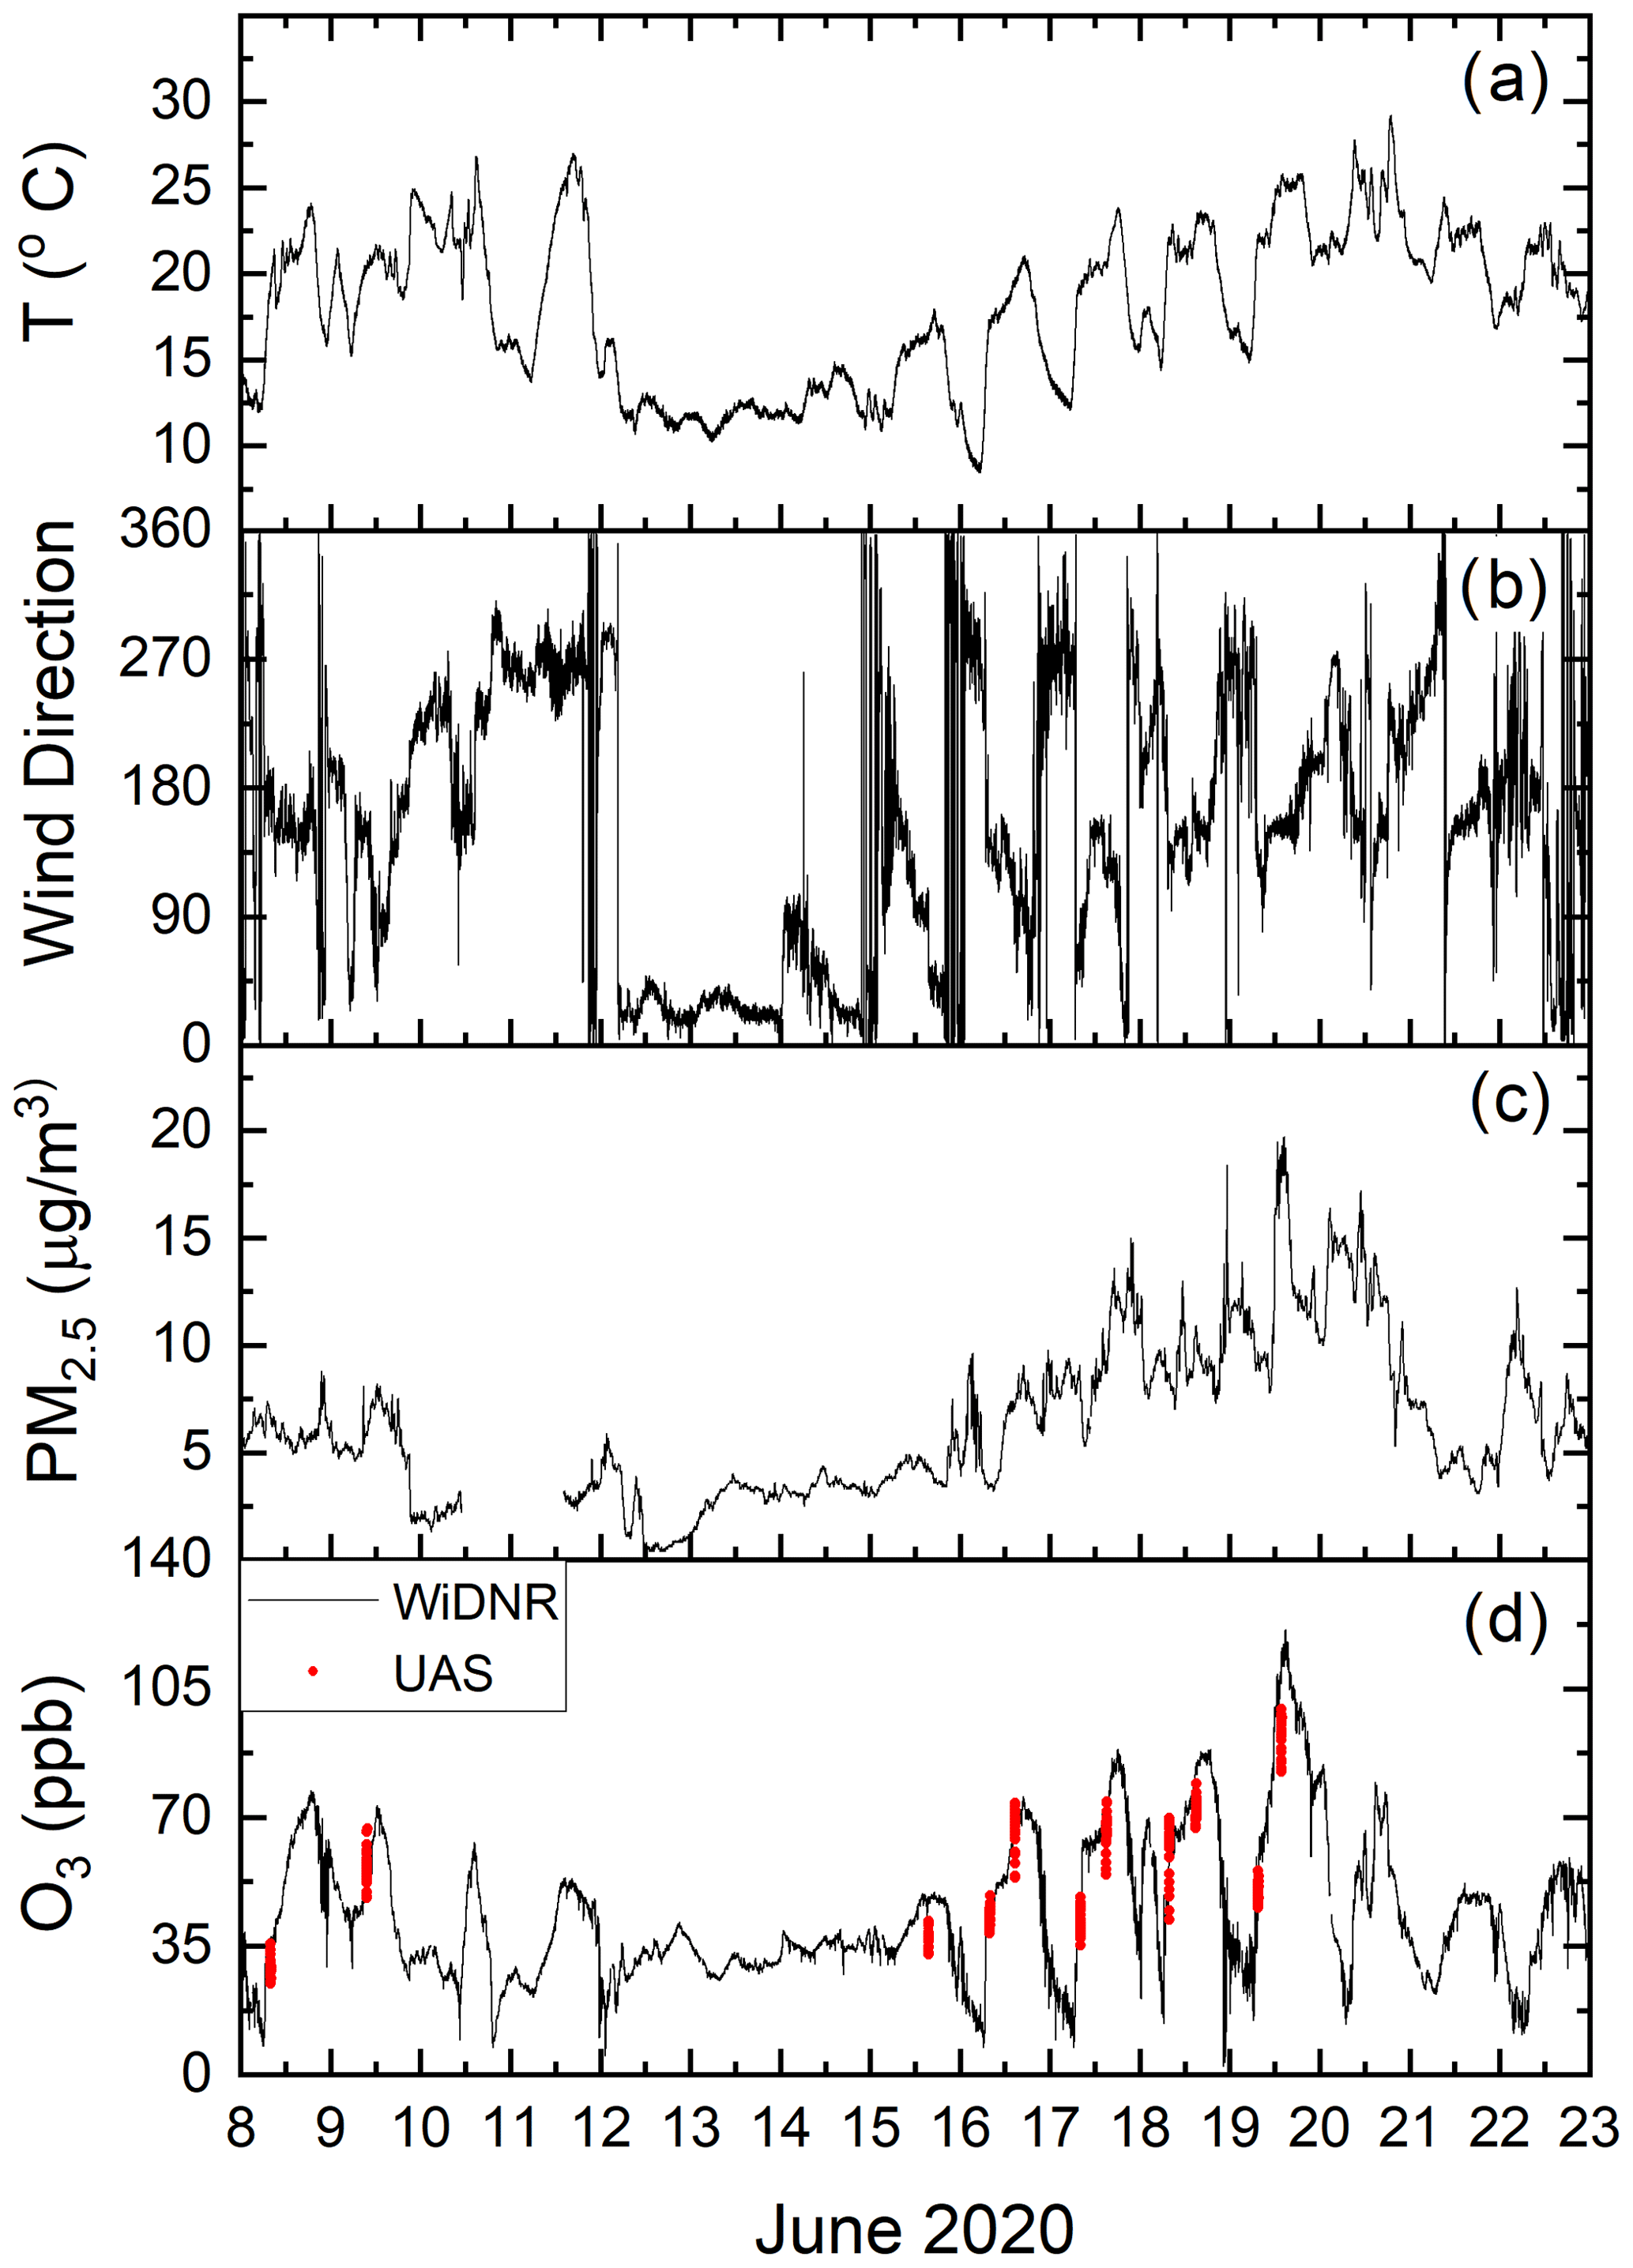
Figure 3From 8–22 June 2020 (a) temperature in °C, (b) wind direction, (c) PM2.5 in µg m−3, and (d) O3 as measured at the WiDNR ground station (black) and on the UAS via POM (red).
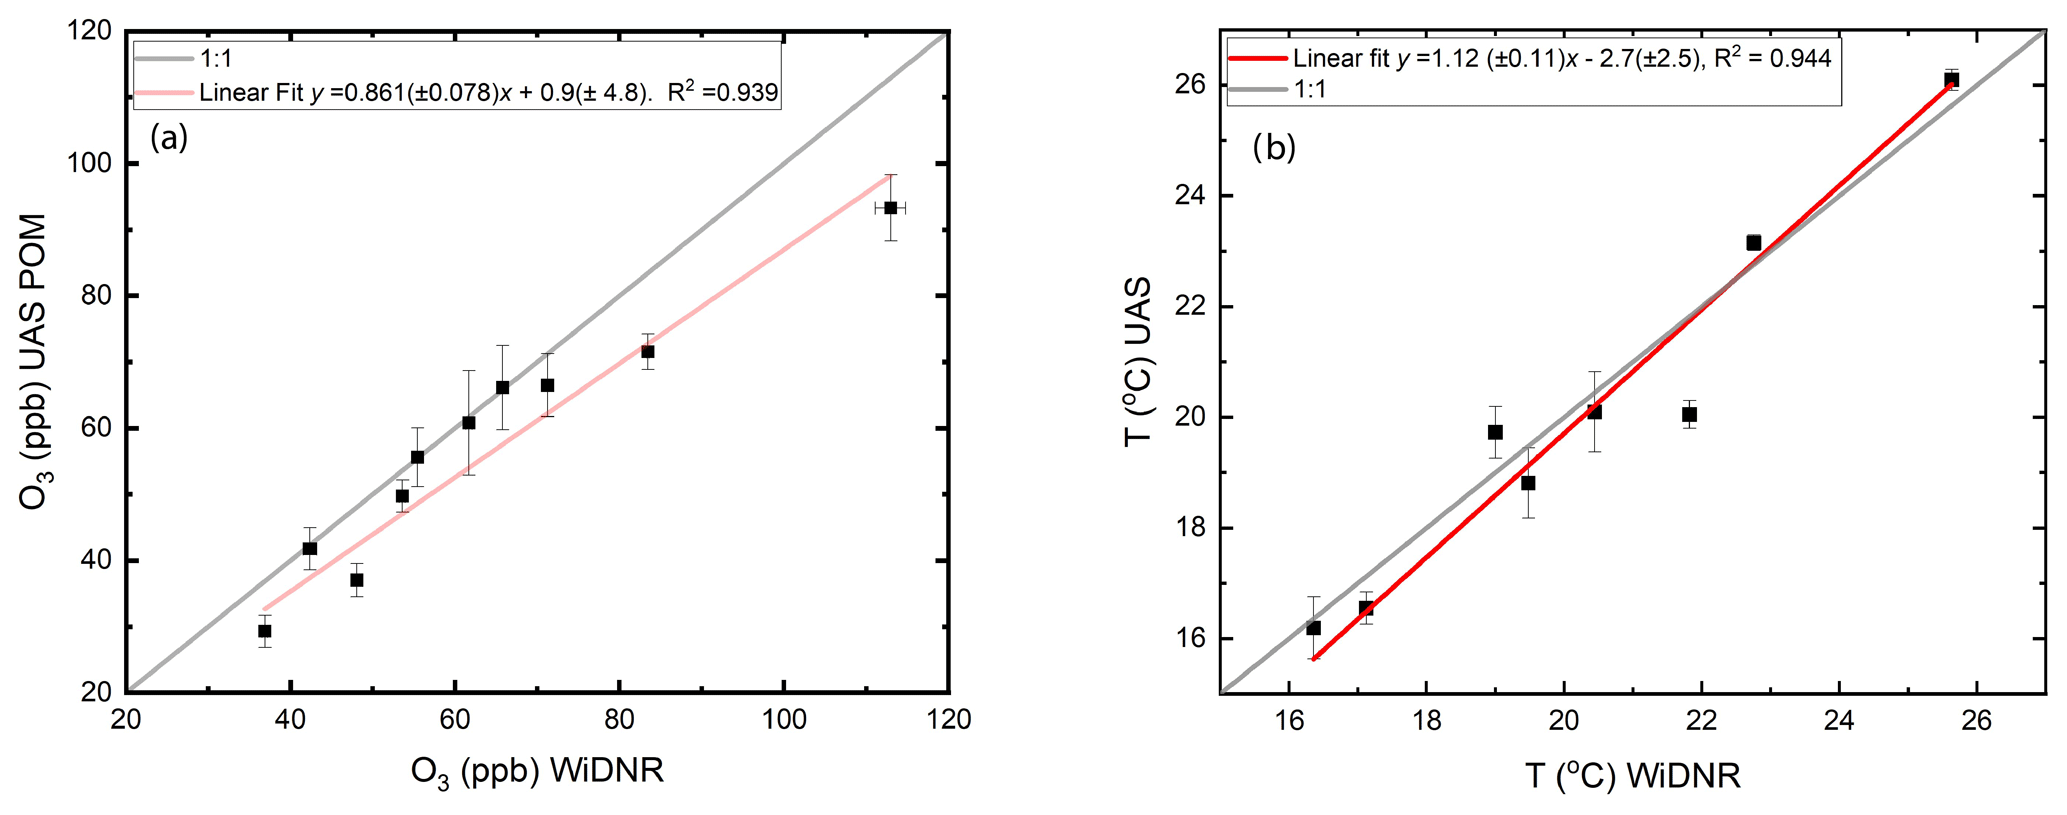
Figure 4(a) Intercomparison O3 UAS POM measurements in comparison to O3 WiDNR Chiwaukee Prairie measurements on 8, 9, 15–19 June 2020. The 5 min average WiDNR and UAS POM data from the lowest hovering altitude are with uncertainties as 1σ from the mean. The grey line demonstrates a 1 : 1 line and the red line depicts a linear regression fit (R2 = 0.939), with a fit of [O3 POM] = 0.861 (± 0.078) [O3 WiDNR] + 0.9 (± 4.8). (b) Intercomparison of temperatures from a lowest-altitude reading from the UAS-mounted iMet-XQ2 and the WiDNR ground station. The red line indicates the linear regression (TiMET-XQ2 = 1.12 (± 0.11) TWiDNR − 2.7(± 2.5), R2 = 0.944) and the grey line is a 1 : 1 fit.
The accuracy of the ozone concentration, temperature, and relative humidity (RH) observations made aloft on the UAS was evaluated by comparing the lowest-altitude hover altitude at 9 m a.g.l. to 1 min data from the local air monitoring station in Chiwaukee Prairie (AIRSID no. 55-059-0019). The uncertainty in the UAS-mounted POM was determined to be the 1 standard deviation in the averaged 10 s data. A regression analysis of the two observations is given in Fig. 4a; these data are strongly correlated as the R2 value is 0.939. The linear fit to the graph is weighted by the highest ozone data and the RMSD = 5.3 ppb. Some disagreement could be from the discrepancy in altitudes for the two observations (the DNR inlet is at 4.5 m in comparison to the first altitude for hovers at 9 m) or to accuracy issues with the zero drift as observed during CHEESEHEAD19. A similar comparison was conducted for the iMet temperature measured at the lowest hovering altitude (approx. 9 m) with ground temperatures (Fig. 4b) with an agreement at R2 = 0.944. With these added observations, the accuracy for the O3 concentrations via UAS-mounted POM is considered accurate within 10 ppb and when the iMet temperatures are within 11 %. This figure has some similarities to Fig. 5a from Li et al. (2020) where they saw a linear fit of 0.7x−7 for a POM correlation to a regulatory ozone measurement instrument standard. The difference between our measurement and theirs is that we see more observations along the 1 : 1 line with higher ozone concentrations deviating the most from the center line, whereas Li et al. (2020) showed a consistent linear response at ∼ 70 % of the regulatory O3 measurement.
3.3 Case study: low-altitude gradients at the Lake Michigan shoreline
The week of 15–19 June 2020 had 4 d where O3 concentrations exceeded 70 ppb (Fig. 3d). The dominant winds were from the south, and lake breezes were observed on all days that week (Fig. 3b), which are conditions conducive to higher ozone concentrations along the Lake Michigan shoreline due to Chicago emissions getting trapped over Lake Michigan during optimal conditions for a photochemical production of ozone and then advecting ozone back on land at the shoreline (Vermeuel et al., 2019; Abdi-Oskouei et al., 2020; Cleary et al., 2022b; Baker et al., 2023). The conditions near Lake Michigan were consistently sunny at the shoreline, with some evidence for inland cumulus cloud formation on 19 June 2020 often used as an identifying signature of lake breeze from satellite observations (Levy et al., 2010; Sills et al., 2011).
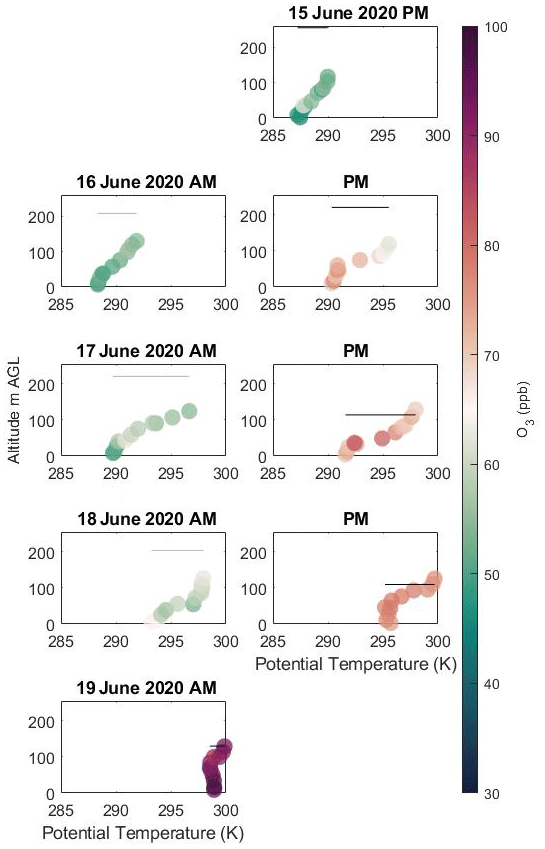
Figure 5Altitude (m a.g.l.) versus potential temperature (K) with O3 (ppb) for the following flights: (a) 15 June; (b) 16 June in the morning (am) and (c) in the afternoon (pm); (d) 17 June in the morning and (e) in the afternoon; (f) 18 June in the morning and (g) in the afternoon; and (h) 19 June in the afternoon. All times are in CDT (2020). The grey and black bars indicate the HRRR boundary layer heights for the morning and afternoon, respectively.
Vertical profiles for UAS flights were constructed using hovering altitudes of the UAS and time stamps for each altitude to determine observed average O3, temperature, pressure, and relative humidity (RH) for each altitude. Because of limited battery time, each vertical profile was constructed from three to four hovering altitudes during 3 separate 20 min flights, covering a time window of approximately 1.25 h (see Table S2). Figure 5 depicts vertical profiles of potential temperatures overlaid with ozone concentrations through the week of 15–19 June 2020. Every day shows an inverted stable atmosphere. Some days show a well-mixed buoyant internal boundary layer in the lowest 40–100 m a.g.l. (Fig. 5) where the potential temperature is close to a vertical line with respect to altitude, particularly during the 18 and 19 June afternoon flights. This discontinuity of most vertical profiles exists where the lowest 40–60 m a.g.l. is closer to a more vertical potential temperature profile, which we refer to as the internal boundary layer, followed by a steep inversion aloft, which is most pronounced in the afternoons of 16, 17, and 18 June with a gradient of 5 K or more within 60–100 m a.g.l. The morning of 18 June (Fig. 5c) was the only day to show a steep inversion down to the surface with no discontinuity. Ozone concentrations in all ascents had maximum observations below the maximum altitude of the flight. Ozone concentrations tended to be highest near areas of steep inversion (flights from 15 and 17 June in the morning and afternoon and 18 June in the afternoon) or near or within the internal boundary layer (16 June in the afternoon and 19 June) except on 18 June in the morning when ozone concentrations were highest at the lowest altitudes when the inversion extended to the surface. For all 5 d, afternoon maximum ozone concentrations were observed at higher altitudes than adjacent to the surface (Fig. 5a–e). The higher ozone concentrations in the vertical profiles tended to be at or near the maximum inversion generally in the region of 40–60 m a.g.l.
The variation in height of the steep inversion layer is evident in the day-to-day differences, from as low as 40 m a.g.l. (15, 16, and 17 June) to as high as 100 m a.g.l. on 19 June. Morning to afternoon differences on 16 and 17 July show a steeper gradient in temperature later in the afternoon with not much change in the inversion height. By contrast, on the morning of 18 July, the vertical profile of temperatures shows an inversion starting at the surface (Fig. 5d), and, by the afternoon, the inversion height starts at 60 m a.g.l. In comparison, turbulent-kinetic-energy-based (TKE-based) boundary layer depths given by the High-Resolution Rapid Refresh (HRRR; Dowell et al., 2022) atmospheric model outputs extend from 80 to 250 m a.g.l. for this location, which is not as low as the data in Fig. 5. HRRR boundary layer height is a metric which addresses how photochemical models are treating vertical profiles when computing photochemical ozone production. The use of the HRRR boundary layer height highlights the subgrid scale of the vertical profiling, which indicates that UAS observations can sample important properties of the marine air incursion of a lake breeze. The lower boundary layer heights in the afternoon in comparison to the morning are proposed to arise from stronger synoptic winds degrading the inversion from above (Lyman and Tran, 2015). Doppler lidar measurements (which cannot make observations below 100 m a.g.l.) show high aerosol loading in the afternoons at altitudes close to the ∼ 100 m cutoff altitudes below which the instrument has a dead zone, which may correspond to continued inversion up to 200 m or more. The UAS observations give a complementary measurement to indicate the region of inversion and the compositional layering below, within, and above the inversion to demonstrate a more complicated picture of mixing and vertical stratification in the lower atmosphere. While these measurements may not adequately address exactly why models do not represent the shoreline effectively (see Fig. S6), they can shed light on the required resolution and vertical structure that encompasses plume volume within an inverted atmosphere near Lake Michigan.
The UAS observations at Chiwaukee Prairie shown here demonstrate a very shallow internal boundary layer (40–100 m a.g.l.) developed over land underneath the temperature inversion (modeled boundary layer heights of 80–250 m a.g.l.) where ozone is found to be in highest abundance near the maximum inversion. During 2 d with the highest internal boundary layer height, ozone concentrations were highest within the internal boundary layer, suggesting that an extended internal boundary layer height over land could possibly play a role in the transport of pollutants in the marine layer. However, more observations of atmospheric profiles of ozone and meteorology are required over land and over water to better characterize this transitional environment.
The work by Li et al. (2020) described use of POM and particle observation on a fixed-wing UAS flying at a speed of 150 km h−1 and compared measurements from those instruments to regulatory instruments on a tethered airship and addressed intercomparison with the POM and a regulatory ozone measurement instrument (O342M from ESA). They used an insulated box for the POM and were able to show a high correlation with a regulatory monitor but with an offset. Their conclusions are that the POM measures atmospheric variability consistent with a regulatory monitor but demonstrates a negative bias. Here, we flew the POM at a much lower flight speed and only averaged data from a single hovered point at which we stayed for 5 min each flight. This was to address the duty cycle limitations of the POM with the on-off in-series subtraction of the water vapor absorption. Li et al. (2020) only address the regulatory monitor they used for comparison, which employed an in-line heating method for removing water vapor interference instead of a dual-cell active subtraction in parallel as is typical of other regulatory monitors. While Li et al. (2020) demonstrated some correlation between RH and variability between the UAS-mounted POM and tethered-airship-platform regulatory monitors, they do show that vertical gradients can be captured by UAS and tethered airships but with discrepancies in locations of a planetary boundary layer. This is consistent with our observations that the gradient observations from UAS are in agreement (with high variability) with tower-based observations in the lowest 120 m a.g.l. What we cannot account for here is the difference in POM variability on a UAS which hovers for 5 min in comparison to a fixed wing traveling at 150 km h−1, which may also lead to additional variability in the measurement due to inlet pressure changes and optical cell vibrations. Additional improvements to the POM performance could arise from (a) thermal insulation and (b) a slow constant accent instead of hovering and are intended for future studies. Additional improvements to the iMET-XQ2 performance could arise from a slow ascent (to assist in aspirating the thermistor) and from shielding the iMET to account for solar irradiation of the sensors.
The feasibility of using a UAS in shoreline environments depends on the vertical scale of the phenomenon, the UAS flight time and requisite battery life for such UAS observations, and the legal flight conditions within each municipality. Some researchers have successfully used UASs for vertical ozone profiles up to 1000 m (Chen et al., 2022; Wu et al., 2021), tethered balloons (Li et al., 2020; Chen et al., 2022), and a thermally insulated UAS-mounted POM in the winter (Chen et al., 2020, 2019). The scales of the sea breeze influence on vertical profiles have ranged from 400–600 m a.g.l. at coastal locations in Nova Scotia (Gong et al., 2000), 600–800 m a.g.l. at coastal locations in China (Wu et al., 2010), and 400–800 m a.g.l. in lake-breeze-influenced locations in Saskatchewan (Sun et al., 1998). The lake breeze vertical dimensionality near Lake Michigan has been shown to have large effects at altitudes from 50–500 m a.g.l. from crewed aircraft (Stanier et al., 2021; Cleary et al., 2022b), remote sensing (Wagner et al., 2022), and UAS studies (Tirado et al., 2023).
A UAS atmospheric profiler was tested in comparison to tower-based instrumental observations indicating a need for careful adjustments to operating parameters for the ozone measurements. Improvements including a top mount for the sensor package, a larger UAS, and higher-frequency calibrations and zero-drift checks were shown to improve the overall accuracy of the ozone observations near a ground air monitoring station. The improved vertical atmospheric profiler was shown to capture atmospheric variability in the lowest 120 m of the atmosphere at a Lake Michigan shoreline region, demonstrating a feasible use for UASs in atmospheric sampling to connect the scales of ground-based observations and tower or remote sensing aloft. These observations are the first UAS observations of ozone near Lake Michigan that document the over-land penetration of the marine layer and gradients in ozone within it. This work highlights the necessity for a higher vertical resolution in observations in this shoreline location to inform improvements about how air quality models represent the stratification and mixing of air parcels at locations like these.
Suggestions for further improvements are as follows: in this study, the POM performance on a UAS was improved by inlet positioning and slow flight parameters, a top-mount placement on a robust UAS, and increasing the rate of calibrations to pair each calibration with a specific battery power source, all of which improved the precision and accuracy. However, added thermal insulation, as described by Li et al. (2020), appears to be another promising additional consideration for improved performance of the POM on UASs. The POM appears to be a robust-enough instrument for course atmospheric measurements in the atmosphere (to 2 ppb precision or 2 % of reading), but integration onto a UAS should be carefully considered. A wider variety of studies have been conducted on iMET performance on a UAS (Kimball et al., 2020; Inoue and Sato, 2022; Greene et al., 2019).
A data repository was generated for CHEESEHEAD19 at https://data.eol.ucar.edu/master_lists/generated/cheesehead/ (Desai et al., 2020). A data repository was generated for the WiscoDISCO20 field campaign at https://zenodo.org/communities/wiscodisco2020/ (last access: 2 May 2024). The dataset is available at https://doi.org/10.5281/zenodo.8118176 (Cleary and Hupy, 2023). Each data file is in a .txt tab delimited structure with descriptive column titles. Any data file with a full suite of data from both iMET and POM instruments is given without a qualifier. On days when data were collected from one of the instruments, the file names indicate them as such.
The supplement related to this article is available online at: https://doi.org/10.5194/amt-17-2833-2024-supplement.
JKR, BNK, MPV, and KLK contributed to the data acquisition, data analysis, and manuscript writing. WAM, SMZ, and ATHV contributed to the data analysis. GWP and TJW contributed to the data acquisition and manuscript writing and editing. ARD, THB, and RBP contributed to the field campaign planning and manuscript editing and writing. JPH contributed to the field campaign planning, data analysis, and manuscript writing and editing. PAC contributed to the field campaign management, data acquisition, data analysis, and manuscript writing and editing.
The contact author has declared that none of the authors has any competing interests.
Any opinions, findings, and conclusions or recommendations expressed in this material are those of the author(s) and do not necessarily reflect the views of the National Science Foundation.
Publisher’s note: Copernicus Publications remains neutral with regard to jurisdictional claims made in the text, published maps, institutional affiliations, or any other geographical representation in this paper. While Copernicus Publications makes every effort to include appropriate place names, the final responsibility lies with the authors.
The University of Wisconsin–Eau Claire team acknowledges funding from the Office of Research and Sponsored Programs Faculty/Student Research Collaboration Grants through Blugold differential tuition. Ankur R. Desai coordinated the efforts for CHEESEHEAD19 and acknowledges funding from NSF AGS-1822420 and the Department of Energy AmeriFlux Network Management Program award to the ChEAS core site cluster.
Ancestral and Indigenous lands acknowledgement. We acknowledge that our research took place at the ancestral lands of the Očhéthi Šakówiŋ, Anishinaabe, Ho-Chunk, Myaamia, Potawatomi, Kaskaskia, Peoria, and Kiikaapoi people.
This research has been supported by the National Science Foundation (grant nos. AGS-1918850 and AGS-1822420), the UWEC Office of Research and Sponsored Programs Faculty/Student Research Collaboration Grants through Blugold differential tuition, and the Department of Energy AmeriFlux Network Management Program award.
This paper was edited by Jochen Stutz and reviewed by two anonymous referees.
Abdi-Oskouei, M., Carmichael, G., Christiansen, M., Ferrada, G., Roozitalab, B., Sobhani, N., Wade, K., Czarnetzki, A., Pierce, R. B., Wagner, T., and Stanier, C.: Sensitivity of Meteorological Skill to Selection of WRF-Chem Physical Parameterizations and Impact on Ozone Prediction During the Lake Michigan Ozone Study (LMOS), J. Geophys. Res.-Atmos., 125, e2019JD031971, https://doi.org/10.1029/2019jd031971, 2020.
Adkins, K. A. and Sescu, A.: Observations of relative humidity in the near-wake of a wind turbine using an instrumented unmanned aerial system, Int. J. Green Energy, 14, 845–860, https://doi.org/10.1080/15435075.2017.1334661, 2017.
Andersen, P. C., Williford, C. J., and Birks, J. W.: Miniature Personal Ozone Monitor Based on UV Absorbance, Anal. Chem., 82, 7924–7928, https://doi.org/10.1021/ac1013578, 2010.
Baker, K. R., Liljegren, J., Valin, L., Judd, L. M., Szykman, J., Millet, D. B., Czarnetzki, A., Whitehill, A. R., Murphy, B. P., and Stanier, C.: Photochemical model representation of ozone and precursors during the 2017 Lake Michigan Ozone Study (LMOS), Atmos. Environ., 293, 119465, https://doi.org/10.1016/j.atmosenv.2022.119465, 2023.
Banta, R. M., Senff, C. J., Nielsen-Gammon, J., Darby, L. S., Ryerson, T. B., Alvarez, R. J., Sandberg, S. R., Williams, E. J., and Trainer, M.: A bad air day in Houston, B. Am. Meteorol. Soc., 86, 657–669, https://doi.org/10.1175/bams-86-5-657, 2005.
Beekmann, M., Ancellet, G., Martin, D., Abonnel, C., Duverneuil, G., Eidelman, F., Bessemoulin, P., Fritz, N., and Gizard, E.: Intercomparison Of Tropospheric Ozone Profiles Obtained By Electrochemical Sondes, A Ground-Based Lidar And An Airborne UV-Photometer, Atmos. Environ., 29, 1027–1042, https://doi.org/10.1016/1352-2310(94)00336-j, 1995.
Bell, M. L., Peng, R. D., and Dominici, F.: The exposure-response curve for ozone and risk of mortality and the adequacy of current ozone regulations, Environ. Health Persp., 114, 532–536, https://doi.org/10.1289/ehp.8816, 2006.
Blaylock, B. K., Horel, J. D., and Crosman, E. T.: Impact of Lake Breezes on Summer Ozone Concentrations in the Salt Lake Valley, J. Appl. Meteorol. Clim., 56, 353–370, https://doi.org/10.1175/jamc-d-16-0216.1, 2017.
Brauner, E. V., Karottki, D. G., Frederiksen, M., Kolarik, B., Spilak, M., Andersen, Z. J., Vibenholt, A., Ellermann, T., Gunnarsen, L., and Loft, S.: Residential ozone and lung function in the elderly, Indoor Built Environ., 25, 93–105, https://doi.org/10.1177/1420326x14539339, 2016.
Butterworth, B. J., Desai, A. R., Metzger, S., Townsend, P. A., Schwartz, M. D., Petty, G. W., Mauder, M., Vogelmann, H., Andresen, C. G., Augustine, T. J., Bertram, T. H., Brown, W. O. J., Buban, M., Cleary, P., Durden, D. J., Florian, C. R., Iglinski, T. J., Kruger, E. L., Lantz, K., Lee, T. R., Meyers, T. P., Mineau, J. K., Olson, E. R., Oncley, S. P., Paleri, S., Pertzborn, R. A., Pettersen, C., Plummer, D. M., Riihimaki, L., Ruiz Guzman, E., Sedlar, J., Smith, E. N., Speidel, J., Wagner, T. J., Wang, Z., Wanner, L., White, L. D., Wilczak, J. M., Wright, D. B., and Zheng, T.: Connecting land-atmosphere interactions to surface heterogeneity in CHEESEHEAD19, B. Am. Meteorol. Soc., 102, E421–E445, https://doi.org/10.1175/BAMS-D-19-0346.1, 2021.
Chai, T., Kim, H.-C., Lee, P., Tong, D., Pan, L., Tang, Y., Huang, J., McQueen, J., Tsidulko, M., and Stajner, I.: Evaluation of the United States National Air Quality Forecast Capability experimental real-time predictions in 2010 using Air Quality System ozone and NO2 measurements, Geosci. Model Dev., 6, 1831–1850, https://doi.org/10.5194/gmd-6-1831-2013, 2013.
Chandrasekar, A., Philbrick, C. R., Doddridge, B., Clark, R., and Georgopoulos, P.: A comparison study of RAMS simulations with aircraft, wind profiler, lidar, tethered balloon and RASS data over Philadelphia during a 1999 summer episode, Atmos. Environ., 37, 4973–4984, https://doi.org/10.1016/j.atmosenv.2003.08.030, 2003.
Chen, L., Pang, X. B., Li, J. J., Xing, B., An, T. C., Yuan, K. B., Dai, S., Wu, Z. T., Wang, S. Q., Wang, Q., Mao, Y. P., and Chen, J. M.: Vertical profiles of O3, NO2 and PM in a major fine chemical industry park in the Yangtze River Delta of China detected by a sensor package on an unmanned aerial vehicle, Sci. Total Environ., 845, 157113, https://doi.org/10.1016/j.scitotenv.2022.157113, 2022.
Chen, Q., Wang, D. S., Li, X. B., Li, B., Song, R. F., He, H. D., and Peng, Z. R.: Vertical Characteristics of Winter Ozone Distribution within the Boundary Layer in Shanghai Based on Hexacopter Unmanned Aerial Vehicle Platform, Sustainability, 11, 7026, https://doi.org/10.3390/su11247026, 2019.
Chen, Q., Li, X. B., Song, R. F., Wang, H. W., Li, B., He, H. D., and Peng, Z. R.: Development and utilization of hexacopter unmanned aerial vehicle platform to characterize vertical distribution of boundary layer ozone in wintertime, Atmos. Pollut. Res., 11, 1073–1083, https://doi.org/10.1016/j.apr.2020.04.002, 2020.
Chilson, P. B., Bell, T. M., Brewster, K. A., de Azevedo, G. B. H., Carr, F. H., Carson, K., Doyle, W., Fiebrich, C. A., Greene, B. R., Grimsley, J. L., Kanneganti, S. T., Martin, J., Moore, A., Palmer, R. D., Pillar-Little, E. A., Salazar-Cerreno, J. L., Segales, A. R., Weber, M. E., Yeary, M., and Droegemeier, K. K.: Moving towards a Network of Autonomous UAS Atmospheric Profiling Stations for Observations in the Earth's Lower Atmosphere: The 3D Mesonet Concept, Sensors, 19, 2720, https://doi.org/10.3390/s19122720, 2019.
Cleary, P. and Hupy, J.: WiscoDISCO2020_dataset (Version V1), Zenodo [data set], https://doi.org/10.5281/zenodo.8118176, 2023.
Cleary, P. A., Fuhrman, N., Schulz, L., Schafer, J., Fillingham, J., Bootsma, H., McQueen, J., Tang, Y., Langel, T., McKeen, S., Williams, E. J., and Brown, S. S.: Ozone distributions over southern Lake Michigan: comparisons between ferry-based observations, shoreline-based DOAS observations and model forecasts, Atmos. Chem. Phys., 15, 5109–5122, https://doi.org/10.5194/acp-15-5109-2015, 2015.
Cleary, P. A., de Boer, G., Hupy, J. P., Borenstein, S., Hamilton, J., Kies, B., Lawrence, D., Pierce, R. B., Tirado, J., Voon, A., and Wagner, T.: Observations of the lower atmosphere from the 2021 WiscoDISCO campaign, Earth Syst. Sci. Data, 14, 2129–2145, https://doi.org/10.5194/essd-14-2129-2022, 2022a.
Cleary, P. A., Dickens, A. J., McIlquham, M., Sanchez, M., Geib, K., Hedberg, C., Hupy, J., Watson, M. W., Fuoco, M., Olson, E. R., Pierce, R. B., Stanier, C., Long, R., Valin, L., Conley, S., and Smith, M.: Impacts of lake breeze meteorology on ozone gradient observations along Lake Michigan Shorelines in Wisconsin, Atmos. Environ., 269, 118834, https://doi.org/10.1016/j.atmosenv.2021.118834, 2022b.
Cook, D. E., Strong, P. A., Garrett, S. A., and Marshall, R. E.: A small unmanned aerial system (UAS) for coastal atmospheric research: preliminary results from New Zealand, J. Roy. Soc. New Zeal., 43, 108–115, https://doi.org/10.1080/03036758.2012.695280, 2013.
Crawford, T. L., Dobosy, R. J., McMillen, R. T., Vogel, C. A., and Hicks, B. B.: Air-surface exchange measurement in heterogeneous regions: Extending tower observations with spatial structure observed from small aircraft, Glob. Change Biol., 2, 275–285, https://doi.org/10.1111/j.1365-2486.1996.tb00079.x, 1996.
Crosman, E. T., Jacques, A. A., and Horel, J. D.: A novel approach for monitoring vertical profiles of boundary-layer pollutants: Utilizing routine news helicopter flights, Atmos. Pollut. Res., 8, 828–835, https://doi.org/10.1016/j.apr.2017.01.013, 2017.
de Boer, G., Butterworth, B. J., Elston, J. S., Houston, A., Pillar-Little, E., Argrow, B., Bell, T. M., Chilson, P., Choate, C., Greene, B. R., Islam, A., Martz, R., Rhodes, M., Rico, D., Stachura, M., Lappin, F. M., Segales, A. R., Whyte, S., and Wilson, M.: Evaluation and Intercomparison of Small Uncrewed Aircraft Systems Used for Atmospheric Research, J. Atmos. Ocean. Tech., 41, 127–145, https://doi.org/10.1175/jtech-d-23-0067.1, 2024.
DeMuer, D., Heylen, R., VanLoey, M., and DeSadelaer, G.: Photochemical ozone production in the convective mixed layer, studied with a tethered balloon sounding system, J. Geophys. Res.-Atmos., 102, 15933–15947, https://doi.org/10.1029/97jd01211, 1997.
Desai, A., Schwartz, M., Mauder, M., Metzger, S., and Pertzborn, R.: CHEESEHEAD Data Sets, EOL Archive [data set], https://data.eol.ucar.edu/master_lists/generated/cheesehead/ (last accesss: 2 May 2024), 2020.
Desjardins, R. L., Macpherson, J. I., Neumann, H., Denhartog, G., and Schuepp, P. H.: Flux Estimates Of Latent And Sensible Heat, Carbon-Dioxide, And Ozone Using An Aircraft-Tower Combination, Atmos. Environ., 29, 3147–3158, https://doi.org/10.1016/1352-2310(95)00007-l, 1995.
Doak, A. G., Christiansen, M. B., D.A., H., Bertram, T. H., Carmichael, G., Cleary, P., Czarnetzki, A. C., Dickens, A. F., Janssen, M., Kenski, M., Millet, D. B., Novak, G., Pierce, B. R., Stone, E. A., Szykman, J., Vermeuel, M., Wagner, T. J., Valin, L., and Stanier, C. O.: Characterization of ground-based atmospheric pollution and meteorology sampling stations during the Lake Michigan Ozone Study 2017, J. Air Waste Manage. Assoc., 71, 866–889, https://doi.org/10.1080/10962247.2021.1900000, 2021.
Dowell, D. C., Alexander, C. R., James, E. P., Weygandt, S. S., Benjamin, S. G., Manikin, G. S., Blake, B. T., Brown, J. M., Olson, J. B., Hu, M., Smirnova, T. G., Ladwig, T., Kenyon, J. S., Ahmadov, R., Turner, D. D., Duda, J. D., and Alcott, T. I.: The High-Resolution Rapid Refresh (HRRR): An Hourly Updating Convection-Allowing Forecast Model. Part I: Motivation and System Description, Weather Forecast., 37, 1371–1395, https://doi.org/10.1175/waf-d-21-0151.1, 2022.
Fuhrer, J.: Ozone impacts on vegetation, Ozone-Sci. Eng., 24, 69–74, https://doi.org/10.1080/01919510208901597, 2002.
Gaza, R. S.: Mesoscale meteorology and high ozone in the northeast United States, J. Appl. Meteorol., 37, 961–977, https://doi.org/10.1175/1520-0450(1998)037<0961:Mmahoi>2.0.Co;2, 1998.
Gong, W. M., Mickle, R. E., Bottenheim, J., Froude, F., Beauchamp, S., and Waugh, D.: Marine/coastal boundary layer and vertical structure of ozone observed at a coastal site in Nova Scotia during the 1996 NARSTO-CE field campaign, Atmos. Environ., 34, 4139–4154, https://doi.org/10.1016/s1352-2310(00)00226-0, 2000.
Greatwood, C., Richardson, T. S., Freer, J., Thomas, R. M., MacKenzie, A. R., Brownlow, R., Lowry, D., Fisher, R. E., and Nisbet, E. G.: Atmospheric Sampling on Ascension Island Using Multirotor UAVs, Sensors, 17, 1189, https://doi.org/10.3390/s17061189, 2017.
Greenberg, J. R., Guenther, A. B., and Turnipseed, A.: Tethered balloon-based soundings of ozone, aerosols, and solar radiation near Mexico City during MIRAGE-MEX, Atmos. Environ., 43, 2672–2677, https://doi.org/10.1016/j.atmosenv.2009.02.019, 2009.
Greene, B. R., Segales, A. R., Bell, T. M., Pillar-Little, E. A., and Chilson, P. B.: Environmental and Sensor Integration Influences on Temperature Measurements by Rotary-Wing Unmanned Aircraft Systems, Sensors, 19, 1470, https://doi.org/10.3390/s19061470, 2019.
Gronoff, G., Robinson, J., Berkoff, T., Swap, R., Farris, B., Schroeder, J., Halliday, H. S., Knepp, T., Spinei, E., Carrion, W., Adcock, E. E., Johns, Z., Allen, D., and Pippin, M.: A method for quantifying near range point source induced O-3 titration events using Co-located Lidar and Pandora measurements, Atmos. Environ., 204, 43–52, https://doi.org/10.1016/j.atmosenv.2019.01.052, 2019.
Guimaras, P., Ye, J. H., Batista, C., Barbosa, R., Ribeiro, I., Medeiros, A., Zhao, T. N., Hwang, W. C., Hung, H. M., Souza, R., and Martin, S. T.: Vertical Profiles of Atmospheric Species Concentrations and Nighttime Boundary Layer Structure in the Dry Season over an Urban Environment in Central Amazon Collected by an Unmanned Aerial Vehicle, Atmosphere, 11, 1371, https://doi.org/10.3390/atmos11121371, 2020.
Hanna, S. R. and Chang, J. C.: Relations between meteorology and ozone in the Lake Michigan region, J. Appl. Meteorol., 34, 670–678, https://doi.org/10.1175/1520-0450(1995)034<0670:rbmaoi>2.0.co;2, 1995.
Hemingway, B. L., Frazier, A. E., Elbing, B. R., and Jacob, J. D.: Vertical Sampling Scales for Atmospheric Boundary Layer Measurements from Small Unmanned Aircraft Systems (sUAS), Atmosphere, 8, 176, https://doi.org/10.3390/atmos8090176, 2017.
Herman, J., Cede, A., Spinei, E., Mount, G., Tzortziou, M., and Abuhassan, N.: NO2 column amounts from ground-based Pandora and MFDOAS spectrometers using the direct-sun DOAS technique: Intercomparisons and application to OMI validation, J. Geophys. Res.-Atmos., 114, D13307, https://doi.org/10.1029/2009jd011848, 2009.
Horel, J., Crosman, E., Jacques, A., Blaylock, B., Arens, S., Long, A., Sohl, J., and Martin, R.: Summer ozone concentrations in the vicinity of the Great Salt Lake, Atmos. Sci. Lett., 17, 480–486, https://doi.org/10.1002/asl.680, 2016.
Inoue, J. and Sato, K.: Toward sustainable meteorological profiling in polar regions: Case studies using an inexpensive UAS on measuring lower boundary layers with quality of radiosondes, Environ. Res., 205, 112468, https://doi.org/10.1016/j.envres.2021.112468, 2022.
Jacob, J. D., Chilson, P. B., Houston, A. L., and Smith, S. W.: Considerations for Atmospheric Measurements with Small Unmanned Aircraft Systems, Atmosphere, 9, 252, https://doi.org/10.3390/atmos9070252, 2018.
Kaser, L., Patton, E. G., Pfister, G. G., Weinheimer, A. J., Montzka, D. D., Flocke, F., Thompson, A. M., Stauffer, R. M., and Halliday, H. S.: The effect of entrainment through atmospheric boundary layer growth on observed and modeled surface ozone in the Colorado Front Range, J. Geophys. Res.-Atmos., 122, 6075–6093, https://doi.org/10.1002/2016jd026245, 2017.
Kim, J., Shusterman, A. A., Lieschke, K. J., Newman, C., and Cohen, R. C.: The BErkeley Atmospheric CO2 Observation Network: field calibration and evaluation of low-cost air quality sensors, Atmos. Meas. Tech., 11, 1937–1946, https://doi.org/10.5194/amt-11-1937-2018, 2018.
Kimball, S. K., Montalvo, C. J., and Mulekar, M. S.: Evaluating Temperature Measurements of the iMET-XQ, in the Field, under Varying Atmospheric Conditions, Atmosphere, 11, 335, https://doi.org/10.3390/atmos11040335, 2020.
Knapp, K. G., Jensen, M. L., Balsley, B. B., Bognar, J. A., Oltmans, S. J., Smith, T. W., and Birks, J. W.: Vertical profiling using a complementary kite and tethered balloon platform at Ferryland Downs, Newfoundland, Canada: Observation of a dry, ozone-rich plume in the free troposphere, J. Geophys. Res.-Atmos., 103, 13389–13397, https://doi.org/10.1029/97jd01831, 1998.
Koch, S. E., Fengler, M., Chilson, P. B., Elmore, K. L., Argrow, B., Andra, D. L., and Lindley, T.: On the Use of Unmanned Aircraft for Sampling Mesoscale Phenomena in the Preconvective Boundary Layer, J. Atmos. Ocean. Tech., 35, 2265–2288, https://doi.org/10.1175/jtech-d-18-0101.1, 2018.
Krechmer, J., Lopez-Hilfiker, F., Koss, A., Hutterli, M., Stoermer, C., Deming, B., Kimmel, J., Warneke, C., Holzinger, R., Jayne, J., Worsnop, D., Fuhrer, K., Gonin, M., and de Gouw, J.: Evaluation of a New Reagent-Ion Source and Focusing Ion-Molecule Reactor for Use in Proton-Transfer-Reaction Mass Spectrometry, Anal. Chem., 90, 12011–12018, https://doi.org/10.1021/acs.analchem.8b02641, 2018.
Levy, I., Makar, P. A., Sills, D., Zhang, J., Hayden, K. L., Mihele, C., Narayan, J., Moran, M. D., Sjostedt, S., and Brook, J.: Unraveling the complex local-scale flows influencing ozone patterns in the southern Great Lakes of North America, Atmos. Chem. Phys., 10, 10895–10915, https://doi.org/10.5194/acp-10-10895-2010, 2010.
Li, X. B., Wang, D. F., Lu, Q. C., Peng, Z. R., Fu, Q. Y., Hu, X. M., Huo, J. T., Xiu, G. L., Li, B., Li, C., Wang, D. S., and Wang, H. Y.: Three-dimensional analysis of ozone and PM2.5 distributions obtained by observations of tethered balloon and unmanned aerial vehicle in Shanghai, China, Stoch. Environ. Res. Risk Assess., 32, 1189–1203, https://doi.org/10.1007/s00477-018-1524-2, 2018.
Li, X. B., Peng, Z. R., Lu, Q. C., Wang, D. F., Hu, X. M., Wang, D. S., Li, B., Fu, Q. Y., Xiu, G. L., and He, H. D.: Evaluation of unmanned aerial system in measuring lower tropospheric ozone and fine aerosol particles using portable monitors, Atmos. Environ., 222, 117134, https://doi.org/10.1016/j.atmosenv.2019.117134, 2020.
Li, Y. W., Liu, B., Ye, J. H., Jia, T. J., Khuzestani, R. B., Jia, Y. S., Cheng, X., Zheng, Y., Li, X., Wu, C., Xin, J. Y., Wu, Z. H., Tomoto, M. A., McKinney, K. A., Martin, S. T., Yong, J. L., and Chen, Q.: Unmanned Aerial Vehicle Measurements of Volatile Organic Compounds over a Subtropical Forest in China and Implications for Emission Heterogeneity, ACS Earth Space Chem., 5, 247–256, https://doi.org/10.1021/acsearthspacechem.0c00271, 2021.
Lu, R. and Turco, R. P.: Air Pollutant Transport In A Coastal Environment .1. 2-Dimensional Simulations Of Sea-Breeze And Mountain Effects, J. Atmos. Sci., 51, 2285–2308, https://doi.org/10.1175/1520-0469(1994)051<2285:Aptiac>2.0.Co;2, 1994.
Lyman, S. and Tran, T.: Inversion structure and winter ozone distribution in the Uintah Basin, Utah, USA, Atmos. Environ., 123, 156–165, https://doi.org/10.1016/j.atmosenv.2015.10.067, 2015.
Mazzuca, G. M., Pickering, K. E., Clark, R. D., Loughner, C. P., Fried, A., Zweers, D. C. S., Weinheimer, A. J., and Dickerson, R. R.: Use of tethersonde and aircraft profiles to study the impact of mesoscale and microscale meteorology on air quality, Atmos. Environ., 149, 55–69, https://doi.org/10.1016/j.atmosenv.2016.10.025, 2017.
McNider, R. T., Pour-Biazar, A., Doty, K., White, A., Wu, Y. L., Qin, M. M., Hu, Y. T., Odman, T., Cleary, P., Knipping, E., Dornblaser, B., Lee, P., Hain, C., and McKeen, S.: Examination of the Physical Atmosphere in the Great Lakes Region and Its Potential Impact on Air QualityOverwater Stability and Satellite Assimilation, J. Appl. Meteorol. Clim., 57, 2789–2816, https://doi.org/10.1175/jamc-d-17-0355.1, 2018.
Novak, G. A., Vermeuel, M. P., and Bertram, T. H.: Simultaneous detection of ozone and nitrogen dioxide by oxygen anion chemical ionization mass spectrometry: a fast-time-response sensor suitable for eddy covariance measurements, Atmos. Meas. Tech., 13, 1887–1907, https://doi.org/10.5194/amt-13-1887-2020, 2020.
Ollison, W. M., Crow, W., and Spicer, C. W.: Field testing of new-technology ambient air ozone monitors, J. Air Waste Manage. Assoc., 63, 855–863, https://doi.org/10.1080/10962247.2013.796898, 2013.
Peng, Y. P., Chen, K. S., Lou, J. C., Hwang, S. W., Wang, W. C., Lai, C. H., and Tsai, M. Y.: Measurements and Mesoscale Modeling of Autumnal Vertical Ozone Profiles in Southern Taiwan, Terr. Atmos. Ocean. Sc., 19, 505–514, https://doi.org/10.3319/tao.2008.19.5.505(a), 2008.
Sillman, S.: The relation between ozone, NOx and hydrocarbons in urban and polluted rural environments, Atmos. Environ., 33, 1821–1845, https://doi.org/10.1016/s1352-2310(98)00345-8, 1999.
Sills, D. M. L., Brook, J. R., Levy, I., Makar, P. A., Zhang, J., and Taylor, P. A.: Lake breezes in the southern Great Lakes region and their influence during BAQS-Met 2007, Atmos. Chem. Phys., 11, 7955–7973, https://doi.org/10.5194/acp-11-7955-2011, 2011.
Stanier, C. O., Pierce, R. B., Abdi-Oskouei, M., Adelman, Z. E., Al-Saadi, J., Alwe, H. D., Bertram, T. H., Carmichael, G. R., Christiansen, M. B., Cleary, P. A., Czarnetzki, A. C., Dickens, A. F., Fuoco, M. A., Hughes, D. D., Hupy, J. P., Janz, S. J., Judd, L. M., Kenski, D., Kowalewski, M. G., Long, R. W., Millet, D. B., Novak, G., Roozitalab, B., Shaw, S. L., Stone, E. A., Szykman, J., Valin, L., Vermeuel, M., Wagner, T. J., Whitehill, A. R., and Williams, D. J.: Overview of the Lake Michigan Ozone Study 2017, B. Am. Meteorol. Soc., 102, E2207–E2225, https://doi.org/10.1175/bams-d-20-0061.1, 2021.
Sullivan, J. T., Berkoff, T., Gronoff, G., Knepp, T., Pippin, M., Allen, D., Twigg, L., Swap, R., Tzortziou, M., Thompson, A. M., Stauffer, R. M., Wolfe, G. M., Flynn, J., Pusede, S. E., Judd, L. M., Moore, W., Baker, B. D., Al-Saadi, J., and McGee, T. J.: The Ozone Water-Land Environmental Transition Study: An Innovative Strategy for Understanding Chesapeake Bay Pollution Events, B. Am. Meteorol. Soc., 100, 291–306, https://doi.org/10.1175/bams-d-18-0025.1, 2019.
Sun, J. L., Desjardins, R., Mahrt, L., and MacPherson, I.: Transport of carbon dioxide, water vapor, and ozone by turbulence and local circulations, J. Geophys. Res.-Atmos., 103, 25873–25885, https://doi.org/10.1029/98jd02439, 1998.
Tang, G. Q., Liu, Y. T., Huang, X., Wang, Y. H., Hu, B., Zhang, Y. C., Song, T., Li, X. L., Wu, S., Li, Q. H., Kang, Y. Y., Zhu, Z. Y., Wang, M., Wang, Y. M., Li, T. T., Li, X., and Wang, Y. S.: Aggravated ozone pollution in the strong free convection boundary layer, Sci. Total Environ., 788, 147740, https://doi.org/10.1016/j.scitotenv.2021.147740, 2021.
Tang, Y. H., Lee, P., Tsidulko, M., Huang, H. C., McQueen, J. T., DiMego, G. J., Emmons, L. K., Pierce, R. B., Thompson, A. M., Lin, H. M., Kang, D. W., Tong, D., Yu, S. C., Mathur, R., Pleim, J. E., Otte, T. L., Pouliot, G., Young, J. O., Schere, K. L., Davidson, P. M., and Stajner, I.: The impact of chemical lateral boundary conditions on CMAQ predictions of tropospheric ozone over the continental United States, Environ. Fluid Mech., 9, 43–58, https://doi.org/10.1007/s10652-008-9092-5, 2009.
Tanimoto, H., Zbinden, R. M., Thouret, V., and Nedelec, P.: Consistency of tropospheric ozone observations made by different platforms and techniques in the global databases, Tellus B, 67, 27073, https://doi.org/10.3402/tellusb.v67.27073, 2015.
Tarasick, D., Galbally, I. E., Cooper, O. R., Schultz, M. G., Ancellet, G., Leblanc, T., Wallington, T. J., Ziemke, J., Liu, X., Steinbacher, M., Staehelin, J., Vigouroux, C., Hannigan, J. W., Garcia, O., Foret, G., Zanis, P., Weatherhead, E., Petropavlovskikh, I., Worden, H., Osman, M., Liu, J., Chang, K. L., Gaudel, A., Lin, M. Y., Granados-Munoz, M., Thompson, A. M., Oltmans, S. J., Cuesta, J., Dufour, G., Thouret, V., Hassler, B., Trickl, T., and Neu, J. L.: Tropospheric Ozone Assessment Report: Tropospheric ozone from 1877 to 2016, observed levels, trends and uncertainties, Elem. Sci. Anth., 7, 39, https://doi.org/10.1525/elementa.376, 2019.
Telg, H., Murphy, D. M., Bates, T. S., Johnson, J. E., Quinn, P. K., Giardi, F., and Gao, R. S.: A practical set of miniaturized instruments for vertical profiling of aerosol physical properties, Aerosol Sci. Tech., 51, 715–723, https://doi.org/10.1080/02786826.2017.1296103, 2017.
Tirado, J., Torti, A. O., Butterworth, B. J., Wangen, K., Voon, A., Kies, B., Hupy, J. P., de Boer, G., Pierce, R. B., Wagner, T. J., and Cleary, P. A.: Observations of coastal dynamics during lake breeze at a shoreline impacted by high ozone, Environ. Sci.-Atmos., 3, 494–505, https://doi.org/10.1039/D2EA00101B, 2023.
Verhoelst, T., Compernolle, S., Pinardi, G., Lambert, J.-C., Eskes, H. J., Eichmann, K.-U., Fjæraa, A. M., Granville, J., Niemeijer, S., Cede, A., Tiefengraber, M., Hendrick, F., Pazmiño, A., Bais, A., Bazureau, A., Boersma, K. F., Bognar, K., Dehn, A., Donner, S., Elokhov, A., Gebetsberger, M., Goutail, F., Grutter de la Mora, M., Gruzdev, A., Gratsea, M., Hansen, G. H., Irie, H., Jepsen, N., Kanaya, Y., Karagkiozidis, D., Kivi, R., Kreher, K., Levelt, P. F., Liu, C., Müller, M., Navarro Comas, M., Piters, A. J. M., Pommereau, J.-P., Portafaix, T., Prados-Roman, C., Puentedura, O., Querel, R., Remmers, J., Richter, A., Rimmer, J., Rivera Cárdenas, C., Saavedra de Miguel, L., Sinyakov, V. P., Stremme, W., Strong, K., Van Roozendael, M., Veefkind, J. P., Wagner, T., Wittrock, F., Yela González, M., and Zehner, C.: Ground-based validation of the Copernicus Sentinel-5P TROPOMI NO2 measurements with the NDACC ZSL-DOAS, MAX-DOAS and Pandonia global networks, Atmos. Meas. Tech., 14, 481–510, https://doi.org/10.5194/amt-14-481-2021, 2021.
Vermeuel, M. P., Novak, G. A., Alwe, H. D., Hughes, D. D., Kaleel, R., Dickens, A. F., Kenski, D., Czarnetzki, A. C., Stone, E. A., Stanier, C. O., Pierce, R. B., Millet, D. B., and Bertram, T. H.: Sensitivity of Ozone Production to NOx and VOC Along the Lake Michigan Coastline, J. Geophys. Res.-Atmos., 124, 10989–11006, https://doi.org/10.1029/2019jd030842, 2019.
Vermeuel, M. P., Cleary, P. A., Desai, A. R., and Bertram, T. H.: Simultaneous Measurements of O-3 and HCOOH Vertical Fluxes Indicate Rapid In-Canopy Terpene Chemistry Enhances O-3 Removal Over Mixed Temperate Forests, Geophys. Res. Lett., 48, 2020gl090996, https://doi.org/10.1029/2020gl090996, 2021.
Vermeuel, M. P., Novak, G. A., Kilgour, D. B., Claflin, M. S., Lerner, B. M., Trowbridge, A. M., Thom, J., Cleary, P. A., Desai, A. R., and Bertram, T. H.: Observations of biogenic volatile organic compounds over a mixed temperate forest during the summer to autumn transition, Atmos. Chem. Phys., 23, 4123–4148, https://doi.org/10.5194/acp-23-4123-2023, 2023.
Wagner, T. J., Czarnetzki, A. C., Christiansen, M., Pierce, R. B., Stanier, C. O., Dickens, A. F., and Eloranta, E. W.: Observations of the Development and Vertical Structure of the Lake Breeze Circulation During the 2017 Lake Michigan Ozone Study, J. Atmos. Sci., 79, 1005–1020, https://doi.org/10.1175/JAS-D-20-0297.1, 2022.
Wainwright, C. E., Bonin, T. A., Chilson, P. B., Gibbs, J. A., Fedorovich, E., and Palmer, R. D.: Methods for Evaluating the Temperature Structure-Function Parameter Using Unmanned Aerial Systems and Large-Eddy Simulation, Bound.-Lay. Meteorol., 155, 189–208, https://doi.org/10.1007/s10546-014-0001-9, 2015.
Wilson, K. L. and Birks, J. W.: Mechanism and elimination of a water vapor interference in the measurement of ozone by UV absorbance, Environ. Sci. Technol., 40, 6361–6367, https://doi.org/10.1021/es052590c, 2006.
Witte, J. C., Thompson, A. M., Smit, H. G. J., Vomel, H., Posny, F., and Stubi, R.: First Reprocessing of Southern Hemisphere ADditional OZonesondes Profile Records: 3. Uncertainty in Ozone Profile and Total Column, J. Geophys. Res.-Atmos., 123, 3243–3268, https://doi.org/10.1002/2017jd027791, 2018.
Wu, C., Liu, B., Wu, D., Yang, H. L., Mao, X., Tan, J., Liang, Y., Sun, J. Y., Xia, R., Sun, J. R., He, G. W., Li, M., Deng, T., Zhou, Z., and Li, Y. J.: Vertical profiling of black carbon and ozone using a multicopter unmanned aerial vehicle (UAV) in urban Shenzhen of South China, Sci. Total Environ., 801, 149689, https://doi.org/10.1016/j.scitotenv.2021.149689, 2021.
Wu, Y. L., Lin, C. H., Lai, C. H., Lai, H. C., and Young, C. Y.: Effects of Local Circulations, Turbulent Internal Boundary Layers, and Elevated Industrial Plumes on Coastal Ozone Pollution in the Downwind Kaohsiung Urban-Industrial Complex, Terr. Atmos. Ocean. Sc., 21, 343–357, https://doi.org/10.3319/tao.2009.04.14.01(a), 2010.
Xu, Z. N., Huang, X., Nie, W., Shen, Y. C., Zheng, L. F., Xie, Y. N., Wang, T. Y., Ding, K., Liu, L. X., Zhou, D. R., Qi, X. M., and Ding, A. J.: Impact of Biomass Burning and Vertical Mixing of Residual-Layer Aged Plumes on Ozone in the Yangtze River Delta, China: A Tethered-Balloon Measurement and Modeling Study of a Multiday Ozone Episode, J. Geophys. Res.-Atmos., 123, 11786–11803, https://doi.org/10.1029/2018jd028994, 2018.
Ye, J., Batista, C. E., Zhao, T., Campos, J., Ma, Y., Guimarães, P., Ribeiro, I. O., Medeiros, A. S. S., Stewart, M. P., Vilà-Guerau de Arellano, J., Guenther, A. B., Souza, R. A. F. d., and Martin, S. T.: River Winds and Transport of Forest Volatiles in the Amazonian Riparian Ecoregion, Environ. Sci. Technol., 56, 12667–12677, https://doi.org/10.1021/acs.est.1c08460, 2022.
Zhang, J., Ninneman, M., Joseph, E., Schwab, M. J., Shrestha, B., and Schwab, J. J.: Mobile Laboratory Measurements of High Surface Ozone Levels and Spatial Heterogeneity During LISTOS 2018: Evidence for Sea Breeze Influence, J. Geophys. Res.-Atmos., 125, e2019JD031961, https://doi.org/10.1029/2019jd031961, 2020.
Zhang, K., Zhou, L., Fu, Q. Y., Yan, L., Bian, Q. G., Wang, D. F., and Xiu, G. L.: Vertical distribution of ozone over Shanghai during late spring: A balloon-borne observation, Atmos. Environ., 208, 48–60, https://doi.org/10.1016/j.atmosenv.2019.03.011, 2019.