the Creative Commons Attribution 4.0 License.
the Creative Commons Attribution 4.0 License.
 | 15 Aug 2024
Drone CO2 measurements during the Tajogaite volcanic eruption
John Ericksen
Tobias P. Fischer
Scott Nowicki
Nemesio M. Pérez
Pedro Hernández Pérez
Eleazar Padrón González
Melanie E. Moses
We report in-plume carbon dioxide (CO2) concentrations and carbon isotope ratios during the 2021 eruption of Tajogaite volcano, island of La Palma, Spain. CO2 measurements inform our understanding of volcanic contributions to the global climate carbon cycle and the role of CO2 in eruptions. Traditional ground-based methods of CO2 collection are difficult and dangerous, and as a result only about 5 % of volcanoes have been directly surveyed. We demonstrate that unpiloted aerial system (UAS) surveys allow for fast and relatively safe measurements. Using CO2 concentration profiles we estimate the total flux during several measurements in November 2021 to be to t d−1. Carbon isotope ratios of plume CO2 indicate a deep magmatic source, consistent with the intensity of the eruption. Our work demonstrates the feasibility of UASs for CO2 surveys during active volcanic eruptions, particularly for deriving rapid emission estimates.
- Article
(3223 KB) - Full-text XML
- BibTeX
- EndNote


Measurements of volcanic CO2 emissions during eruptions are critical for understanding magma and eruption dynamics. CO2 is a significant greenhouse gas (Arrhenius, 1896), and making measurement of CO2 emissions is important for climate science. CO2 gas is second only to water vapor in abundance in volcanic emissions (Giggenbach, 1996). Despite the significance and abundance of CO2 in the Earth system in general and in magmatic systems in particular, measuring the emission rates of this gas from volcanic craters, diffuse sources and low-level hydrothermal sites has remained a major challenge (Fischer and Aiuppa, 2020). As a result, detailed CO2 surveys have been conducted at just 5 % of volcanoes (Fischer et al., 2019).
The main contributions of this work are that, for the first time, we estimate CO2 flux using direct in-plume CO2 measurements rather than using in-plume CO2 SO2 ratios combined with separately measured SO2 emissions. The second major contribution is that we perform in situ gas sample return during a major volcanic eruption for carbon isotope measurements. We use the Dragonfly unpiloted aerial system (UAS) (Ericksen et al., 2022) to gather samples directly from the eruption plume (Fig. 1). The UAS transects the plume and employs an onboard infrared (IR) sensor to continuously obtain concentration readings. These readings are then used to estimate a 2D isotropic Gaussian concentration model (Eq. 1). In-plume wind velocity measurements in combination with the plume model allow us to estimate CO2 flux (Eq. 2). While our technique has similarities to the “ladder traverse” technique utilizing large in situ sensing equipment mounted on a piloted fixed-wing aircraft (Werner et al., 2013), it has the obvious advantages of being much less costly, logistically less challenging and less hazardous. Since our approach extrapolates the shape of the plume, it requires far fewer plume transects. Crucially, the Dragonfly UAS does not use a combustion engine, which previous work has shown to contaminate CO2 measurements and samples with jet-fuel-derived organic carbon (Fischer and Lopez, 2016). The resulting plume CO2 concentration profile is used to guide the UAS to a productive sample return location of maximum concentration. Carbon isotope analyses of the samples reveal information, such as the CO2 source, which is relevant to predicting the course of the eruption. We tested this technique during the 2021 Tajogaite volcanic eruption on the island of La Palma, Spain, and compared the resulting flux estimates to the traditional ground-based CO2 SO2 ratio method. As we demonstrate, UASs provide a method for obtaining in-plume gas samples, concentrations and wind velocity measurements. Together these data allow for the determination of isotope ratios and estimation of CO2 flux, furthering our understanding of volcano dynamics during an eruption and allowing for predictions of eruption intensity and duration. Our technique can be widely used at passively degassing and erupting volcanoes to obtain near-real-time CO2 flux measurements to better constrain the global volcanic CO2 budget and assess volcanic activity.
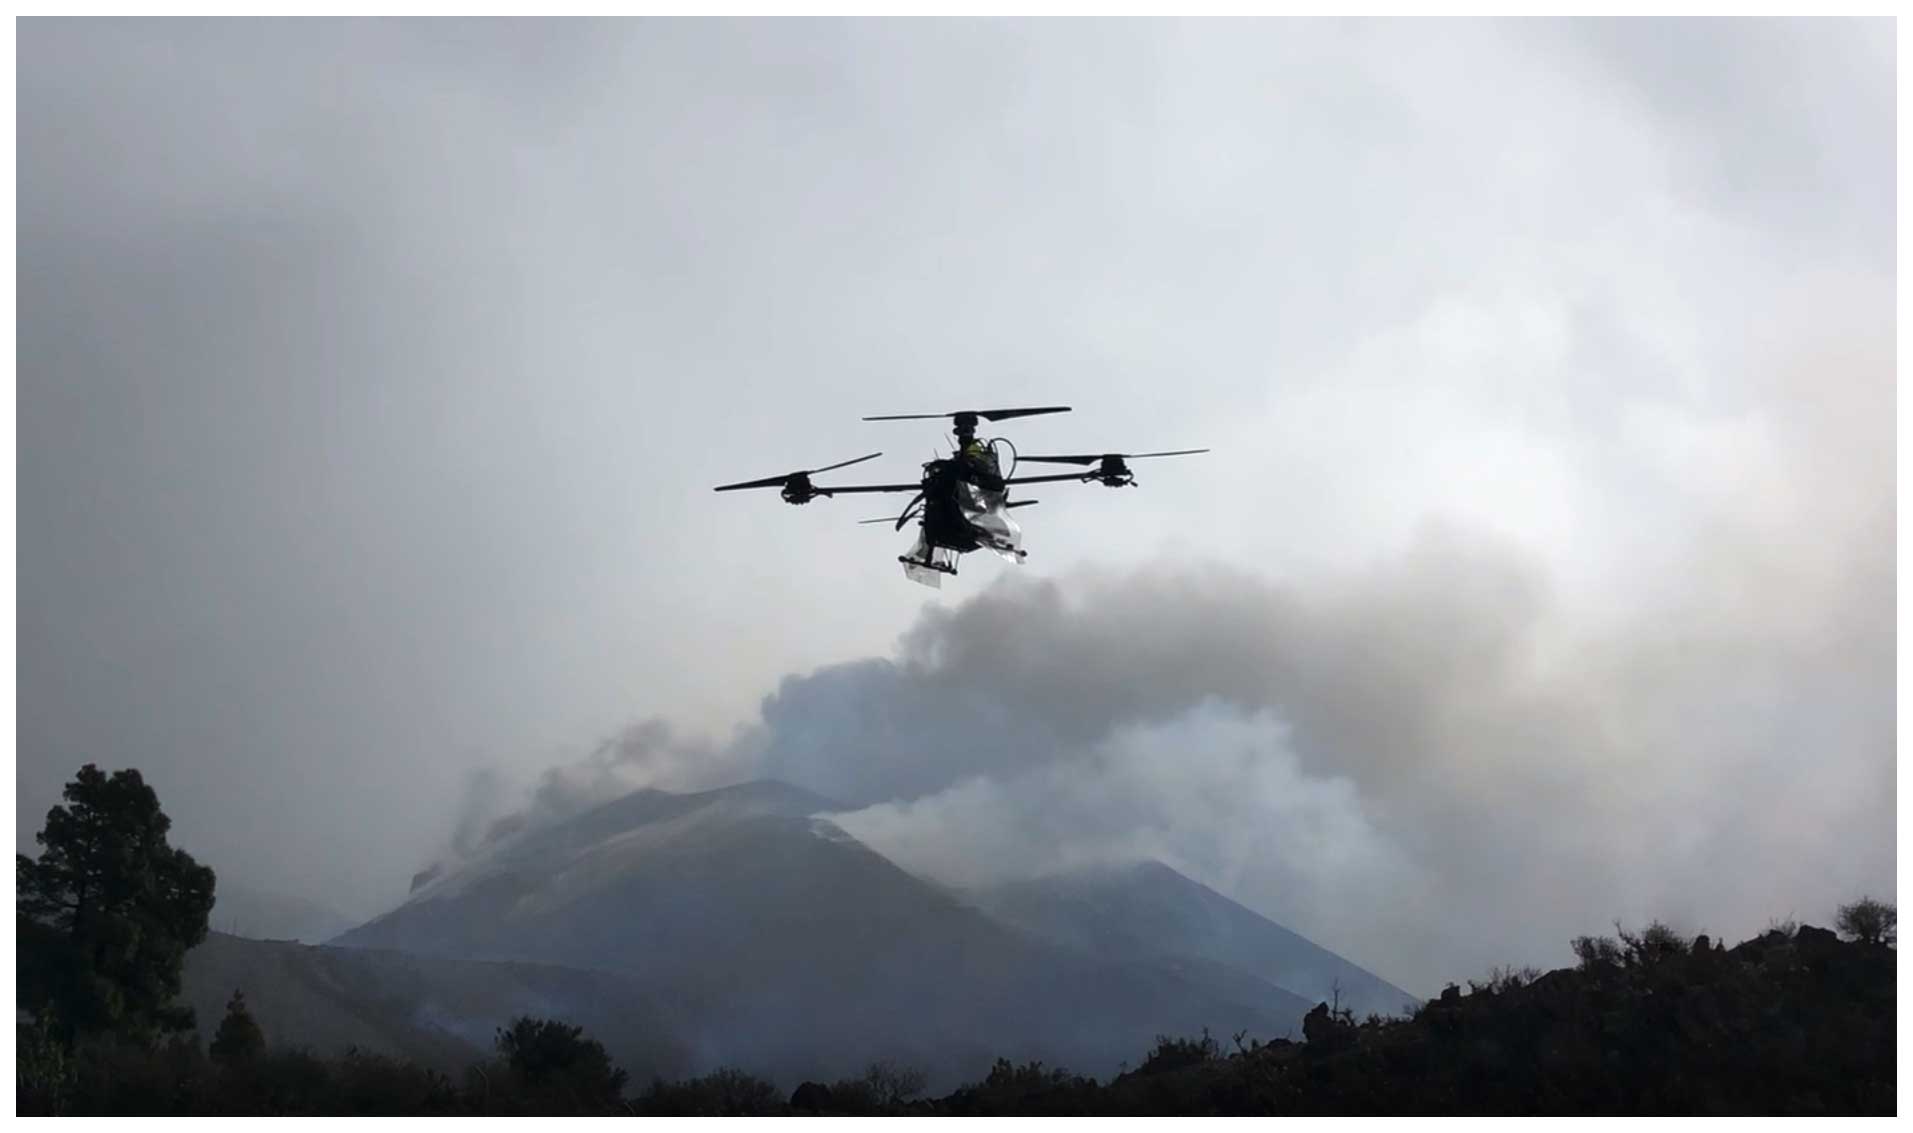
Figure 1A Dragonfly UAS returning from a CO2 sample mission during the November 2021 eruption of Tajogaite volcano. The large volcanic ash plume is visible in the background and contains an invisible CO2 plume, which was the mapping target of this drone.
1.1 Related work
While global initiatives to directly determine CO2 flux from biogenic sources, i.e., FLUXNET (Office of Science, 2023), have advanced our understanding of the surface carbon cycle, estimates of volcanic flux are to a large extent obtained by combining SO2 flux measurements with observed CO2 SO2 ratios (Fischer and Aiuppa, 2020). This approach relies on two separate sets of measurements utilizing a ground-based or space-based remote sensing technique to determine the SO2 concentration of the volcanic plume and a direct sampling or sensing technique to determine the CO2 SO2 ratio. In almost all cases, these two separate sets of measurements are not made simultaneously and result in intrinsic uncertainties in CO2 flux estimates (Burton et al., 2013). CO2 surveys have been performed using satellite-based approaches; for example, Johnson et al. (2020) performed CO2 flux estimates of Kīlauea volcano in 2018. Their work utilized the Orbiting Carbon Observatory-2 (OCO-2) to measure the CO2 emissions from the 2018 Kīlauea eruption. A measurement of 77.1 ± 41.6 kt d−1 was obtained during the 1 d of observations where conditions enabled the collection of consistent high-quality data. Cloud coverage and aerosol are the major inhibitors for obtaining consistent CO2 data using OCO-2. In addition, the wind direction must be near perpendicular to the satellite's orbit path and the measurements must be made downwind from the plume. The OCO-2 16 d repeat cycle currently makes this method impractical for frequent, high-rate CO2 flux measurements from erupting volcanoes, and the only other successful volcanic CO2 emission study was by Schwandner et al. (2017) of Yasur in Vanuatu. Therefore, space-based CO2 instruments require favorable atmospheric conditions and satellite positioning and are not yet feasible for volcano monitoring (Schwandner et al., 2017).
The value of UAS surveys of volcanic emissions was recognized by Xi et al. (2016), who surveyed passively degassing SO2 at Turrialba volcano, Costa Rica, and estimated SO2 flux. Other investigators have used UASs to measure plume SO2 and collect plume trace gases (Rüdiger et al., 2018) or use miniDOAS (differential optical absorption spectroscopy) systems mounted on an unpiloted aerial vehicle (UAV) to obtain SO2 fluxes (Stix et al., 2018). Recently UASs (unpiloted aerial systems) have been used to collect gas samples and measure gas compositions of volcanic plumes from passively degassing volcanoes in remote regions (Liu et al., 2020; Galle et al., 2021) and during the 2023 eruption of Litli Hrútur, Iceland, to obtain information on CO2 degassing and related carbon isotope fractionation (Fischer et al., 2024)
Gerlach et al. (1997) and Werner et al. (2013) estimate plume CO2 flux using the parsimonious assumption that plumes are uniform. They use the mean value to estimate the flux, whereas we use our observations in the field that support the hypothesis that plumes can be well modeled by Gaussian distributions. Our work relies on the assumption that a Gaussian model of the plume cross-section results in more accurate estimates of total flux.
Burton et al. (2023) surveyed emissions of the Tajogaite eruption in early October 2021. Their survey included SO2 measurements by UAV that were used to infer CO2 concentrations. Our work in late November complements the Burton et al. (2023) survey by providing additional information on the evolution of the eruption and using a different CO2 flux estimation method that employs direct CO2 measurements rather than CO2 SO2 ratios. Our estimates of CO2 flux taken a month later were lower than those of Burton et al. (2023).
1.2 Background
The island of La Palma is in Spain's Canary archipelago (Schmincke, 1982). The northern sector of the island hosts the oldest subaerial (on-land) volcanism, characterized by repeated large lateral edifice collapses (Day et al., 1999; Acocella et al., 2015). Volcanism resulted in the formation of Garafía and Taburiente and then moved southward to form Cumbre Vieja volcano, at the southern part of the island. This southern system represents the last stage in the geological evolution of the island of La Palma, as volcanic activity has taken place exclusively on that part of the island for the last 123 kyr (Carracedo et al., 1998). The most recent volcanic eruption of Cumbre Vieja is Tajogaite (2021) (Carracedo et al., 2001; Ward and Day, 2001), preceded by that of Teneguía in 1971 (Fernández et al., 2021) and San Juan in 1940 (Fernández et al., 2021; Albert et al., 2016). At 14:10 UTC on 19 September 2021 Tajogaite volcano erupted from a vent on the western side of the island of La Palma, in the vicinity of the Llano del Banco eruptive center of the San Juan eruption of 1949 (Instituto Geográfico Nacional, 2022). The eruption was forecast using seismic, geodetic and geochemical techniques by Spanish researchers who alerted the civil protection officials several days before the start of the eruption (De Luca et al., 2022). The monitoring network of diffuse CO2 emissions on La Palma detected magmatic CO2 several months before the eruption (Santana de León et al., 2022; Rodríguez-Pérez et al., 2022). This monitoring activity took advantage of extensive previous work characterizing diffuse CO2 emissions on La Palma. This work provided key insights into the dynamics of magmatic CO2 degassing on the island (Padrón et al., 2015). The eruption itself began with an explosive phase that ejected ash to an altitude of 5 km, then transitioned to fire fountains, violent strombolian activity and the production of highly fluid lava flows. Within 24 h of the initial eruption a 3 km long lava flow was evident (Instituto Geográfico Nacional, 2022). The eruption lasted for more than 85 d and built a pyroclastic cone of about 225 m in height. Over the period of the eruption, the volcano showed dynamic and changing activity with new vents frequently opening on the active cone. These vents produced explosive and effusive eruptions of varying intensity (Castro and Feisel, 2022). Bulk tephra, matrix glass and glass inclusions have a basanitic–tephritic composition of 43 wt % to 46 wt %.
Since the onset of the 2021 Tajogaite eruption on 19 September, frequent measurements of SO2 emission rates using miniDOAS traverses by car, ship and helicopter have been performed. Using these data a flux of over 5×10⁴ t d−1 of SO2 was estimated (Pérez et al., 2022). Daily monitoring of SO2 gas emissions occurred before and throughout the eruption using TROPOMI (TROPOspheric Monitoring Instrument) data from the Sentinel-5P satellite (Copernicus SO2 satellite monitoring; Smithsonian Institution's Global Volcanism Program, 2021). The range of measured emissions rates depended upon wind direction and velocity, as well as eruptive style and activity. The measured SO2 flux ranged from 3×10⁴ to 5×10⁴ t d−1 at the beginning of the eruption and had a mean of 104 t d−1 over the duration of the active eruption (Albertos et al., 2022). These SO2 emission rates are likely different from CO2 but provide the best available proxy for CO2 emissions and are a useful point of comparison for our UAS-based flux estimates in addition to the measurements made by Burton et al. (2023) in October 2021, which range from 3.36×10⁴ to 4.19×10⁴ t d−1.
Additional gas monitoring techniques deployed during the eruption included stationary Multi-GAS- (multiple gas analyzer) and FTIR-based plume gas composition measurements as well as carbon isotope analyses of plume CO2 in collaboration with the international volcanic gas community (Pérez et al., 2022).
Our aim was to measure plume CO2 concentrations, calculate the resulting flux and obtain isotope data from samples taken within the plume. To achieve these goals we utilized the Dragonfly UAS, with an approximate battery life of 50 min. This extended flight time enables long-distance transects to capture large plumes. CO2 concentrations were measured by a PP Systems SBA-5 IR sensor mounted on the Dragonfly with data transmitted to the pilot in real time (Ericksen et al., 2022). Wind velocity and direction were derived from the ERA5 model of the European Centre for Medium-Range Weather Forecasts 10 m height wind velocities corresponding to the time of each flight (Liu et al., 2020). These measurements were independently validated using a handheld anemometer and the UAS drift method (Liu et al., 2020; Galle et al., 2021). For the drift method, a Dragonfly was programmed to maintain its altitude but not its lateral position and allowed to drift with the plume. We used this estimate of wind velocity within the plume with the highest CO2 concentration (plume B) to parameterize the flux estimation (Fig. 2).
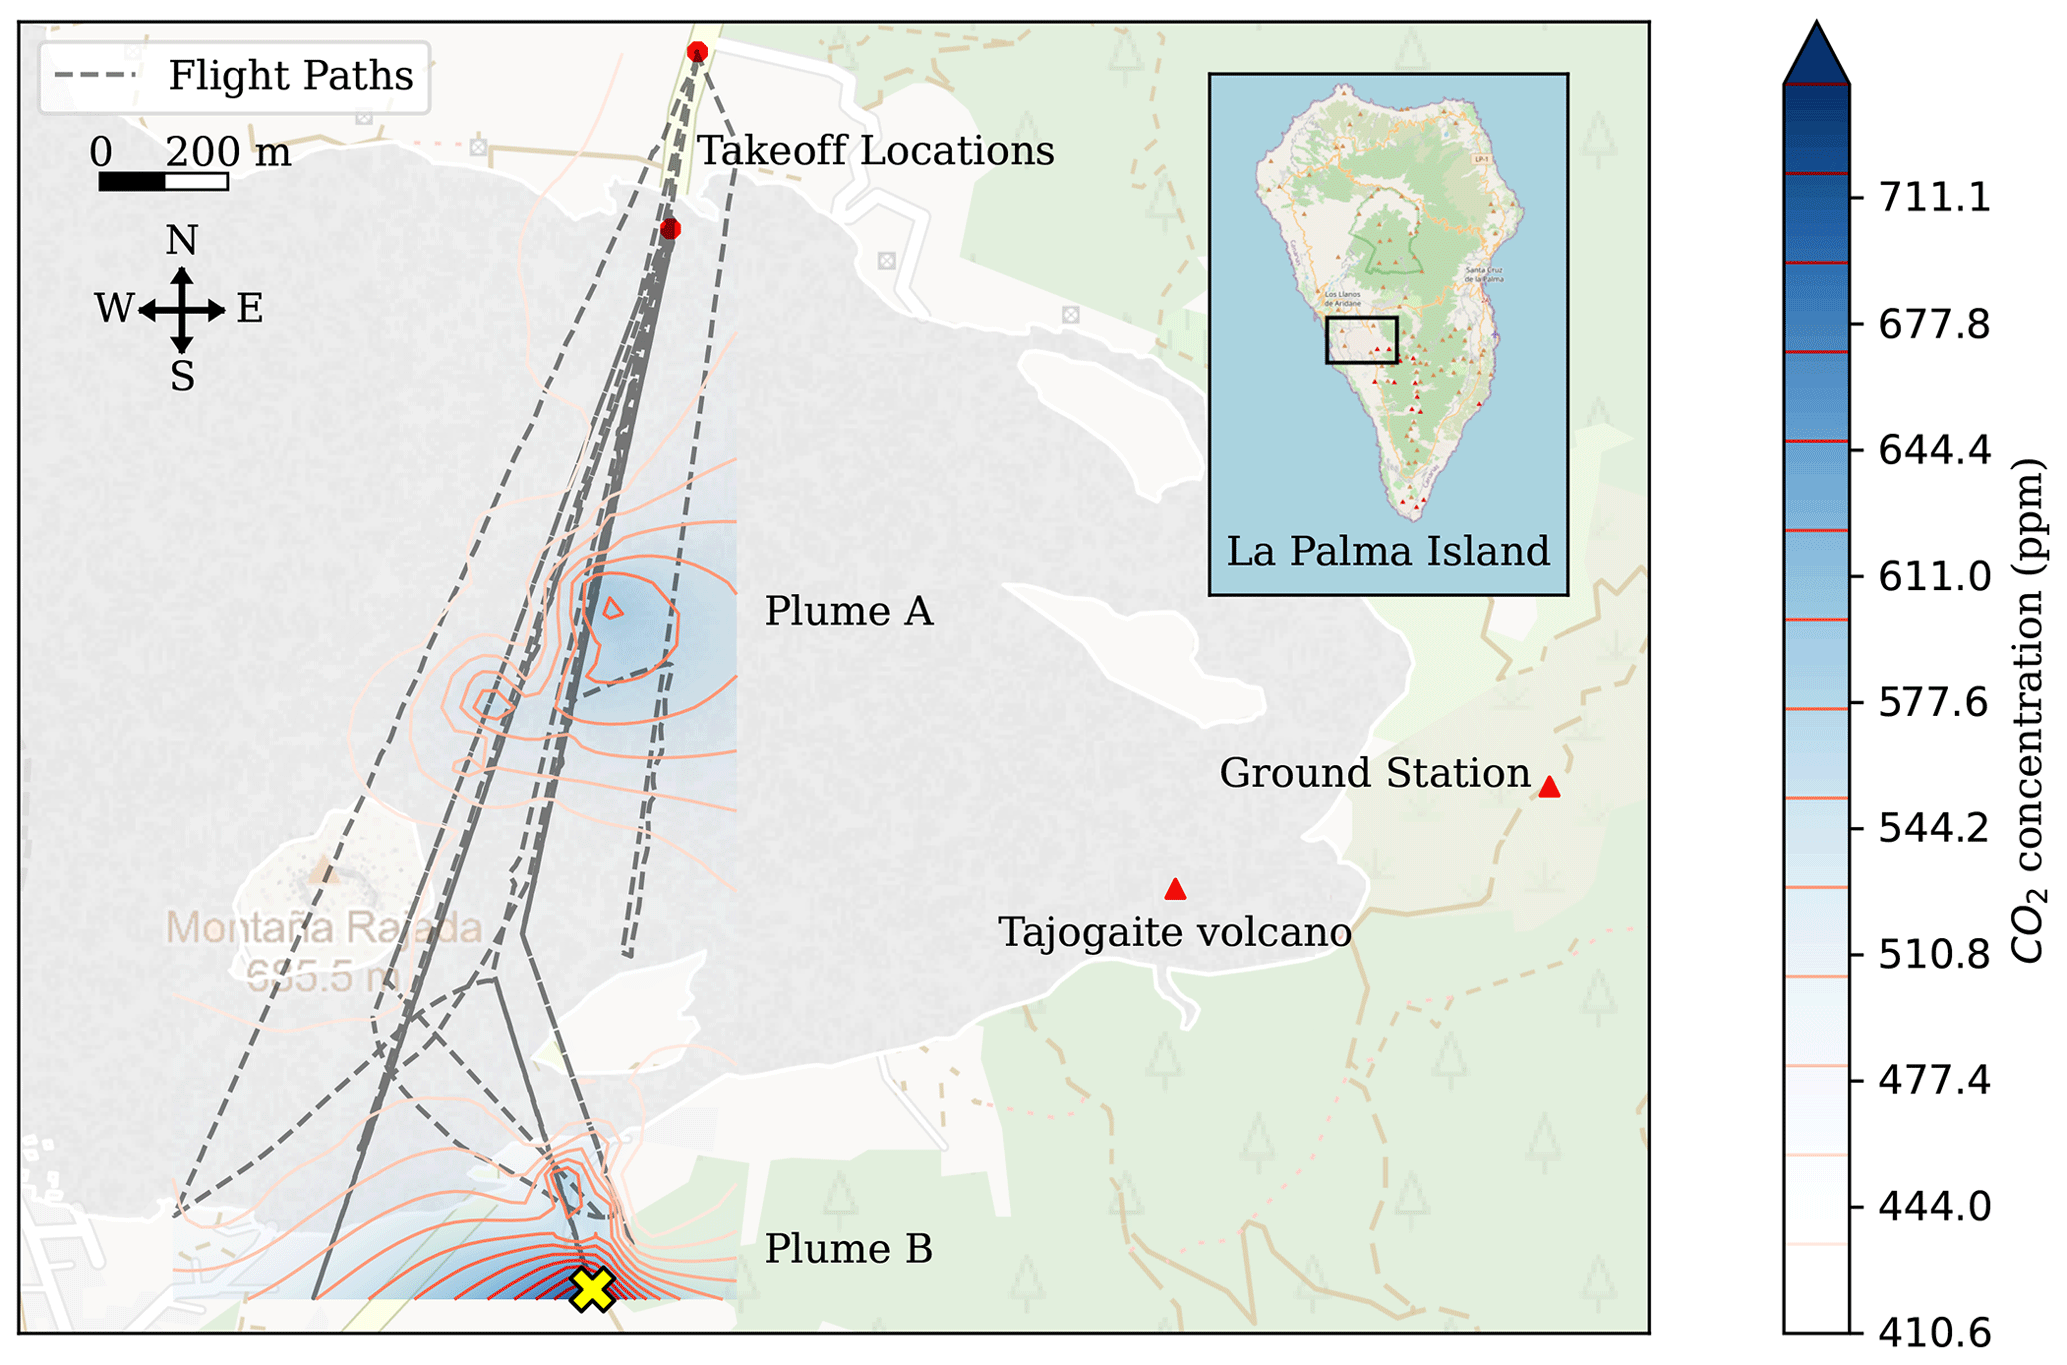
Figure 2Top-down perspective map of all transect flight paths. Flights occurred over a 4 d period during the 2021 eruption. This map includes a horizontal cross-section Kriging plot of the CO2 concentration highlighted as the distinct plume A and plume B. The sample collection location is indicated by the yellow ×. Insert shows the location of Tajogaite volcano on the island of La Palma. Map images © OpenStreetMap contributors 2024. Distributed under the Open Data Commons Open Database License (ODbL) v1.0.
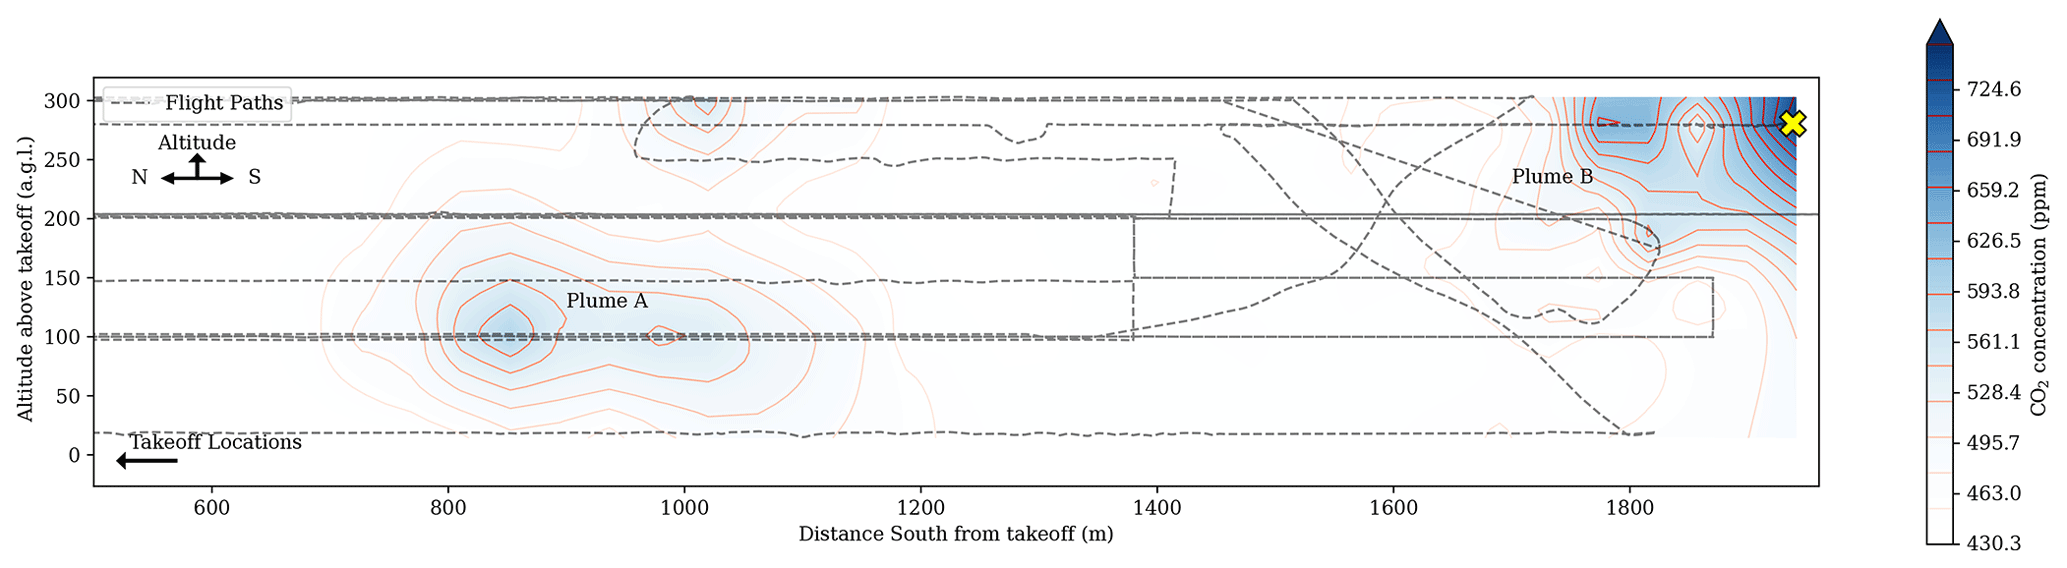
Figure 3Lateral-perspective Kriging map of all transects plotted in Fig. 2. The plot indicates two separate plumes in the vertical cross-section labeled plume A and plume B. The sample collection location is indicated by the yellow ×.
At the location with the highest measured CO2 concentration, a timed trigger activated a small pump and a plume gas sample was collected into a Tedlar bag (Figs. 2 and 3). We also collected gas samples of the plume from the ground when the wind direction was favorable and volcanic activity permitted. Ground-based plume samples were analyzed by infrared isotope spectroscopy with a Delta Ray located at the INVOLCAN Volcano Observatory, La Palma, following the procedure described previously (Fischer and Lopez, 2016; Ilanko et al., 2019). The error bounds on the δ13C measurements are less than 0.1 ‰ for all analyses.
We also placed a Multi-GAS instrument at an accessible and safe location about 1 km to the north of the crater. Data from this instrument recorded CO2 and SO2 concentrations in the gas plume. The ratios were calculated using the Ratiocalc software, and we report averages for each day of the experiment.
Crosswind transects were flown downwind of the eruption to encounter the plume. CO2 was measured at 10 Hz during flights across the plume at specified altitudes relative to launch. Each measurement was correlated to the latitude, longitude, altitude and time of the UAS during flight, giving a CO2 concentration cross-section of the plume.
We set the ambient background CO2 to the value observed outside the plume for each flight. The actual measurements of ambient CO2 were made well outside of the plume (up to 400 m away from the edge of the plume) and only vary from 415 to 430 ppm.
To estimate the total flux of the plume, we perform the following procedure.
-
Convert GPS coordinates into a linear distance in meters from the launch point. Each distance is normalized to the wind direction perpendicular by multiplying it by cos (headinguas−headingwind).
-
Isolate the plume by setting an ambient CO2 threshold and removing data points less than that threshold.
-
Fit a Gaussian curve to the data set as follows.
- a.
Calculate the mean μ and standard deviation σ of the CO2 across the transect.
- b.
Scale the 2D Gaussian curve to fit the data by choosing a constant amplitude a using the gradient descent to minimize the squared difference between the model and plume sample data. We assume that the Gaussian shape is uniform in both the x and y dimensions.
- a.
-
Integrate the 2D Gaussian and multiply by the measured wind velocity v to obtain plume flux in mg S−1 m−2. Multiplying this again by the number of seconds in a day and the number of milligrams in a metric ton gives the flux in metric tons per day (t d−1).
Uncertainty in the flux calculation is given by the following root sum of squares (RSS) method which combines the uncertainties in wind velocity ϵv, wind direction ϵd, sensor error ϵs and background CO2 ϵb. The total uncertainty ϵ is calculated in accordance with the uncertainty estimation techniques described in Nassar et al. (2021), Lin et al. (2023), Nassar et al. (2017) and Johnson et al. (2020).
Flux estimates are derived from the three UAS transects that crossed plume A. These transects were collected on 26 and 27 November 2021. Other transects shown in Fig. 2 either did not intersect any plume or did not cross the entire plume. In the latter case this resulted in a poor fit to the Gaussian distribution, violating our assumption of normality. We also report carbon isotopes of plume CO2 and flux estimates based on the Multi-GAS CO2 SO2 ratios.
3.1 Plume transect wind measurements
The calculated CO2 flux for the five relevant transects with the corresponding wind velocities and directions are shown in Table 1 for transects across plume A and plume B. The wind velocity measured by UAS drift method was 10.7 m s−1. ERA5 modeled wind velocities yielded results ranging from 10.0 to 12.2 m s−1 with an average of 11.1 m s−1. The wind direction given by the ERA5 model yielded results ranging from 38 to 68°, with an average of 53°. These ranges contribute to the overall uncertainty ϵd.
Table 1CO2 data collected by UAS across plume A and plume B during the Tajogaite eruption.
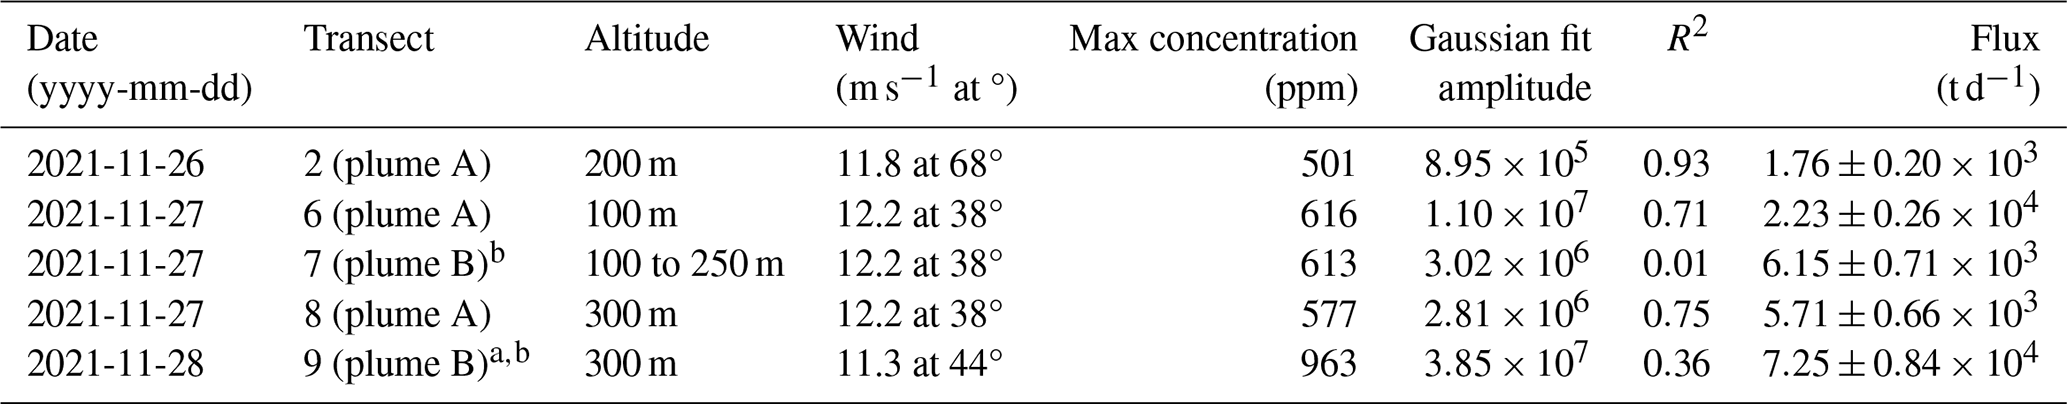
a Transect with samples collected into Tedlar bags and analyzed by infrared isotope ratio spectroscopy. b Transects that encountered plume B but for which the gas distribution did not meet our Gaussian fit assumptions, as indicated by the low R2 value in comparison to the Gaussian amplitude. Thus we did not include plume B in our flux calculations.
3.2 Carbon isotopes of plume CO2
The CO2 concentrations and δ13C values of plume gas samples are given in Table 2. Samples collected from the ground at the University of New Mexico (UNM) Multi-GAS site show background CO2 concentrations of 416 to 471 ppm CO2 with δ13C values of −8 ‰ (relative to Vienna Peedee belemnite, VPDB), which is close to that of air. The sample collected by UAS has a CO2 concentration distinctly elevated from air of 671 ppm and a heavier δ13C value of −4.44 ‰.
Table 2Measured CO2 concentrations and δ13C from the ground and UAS.
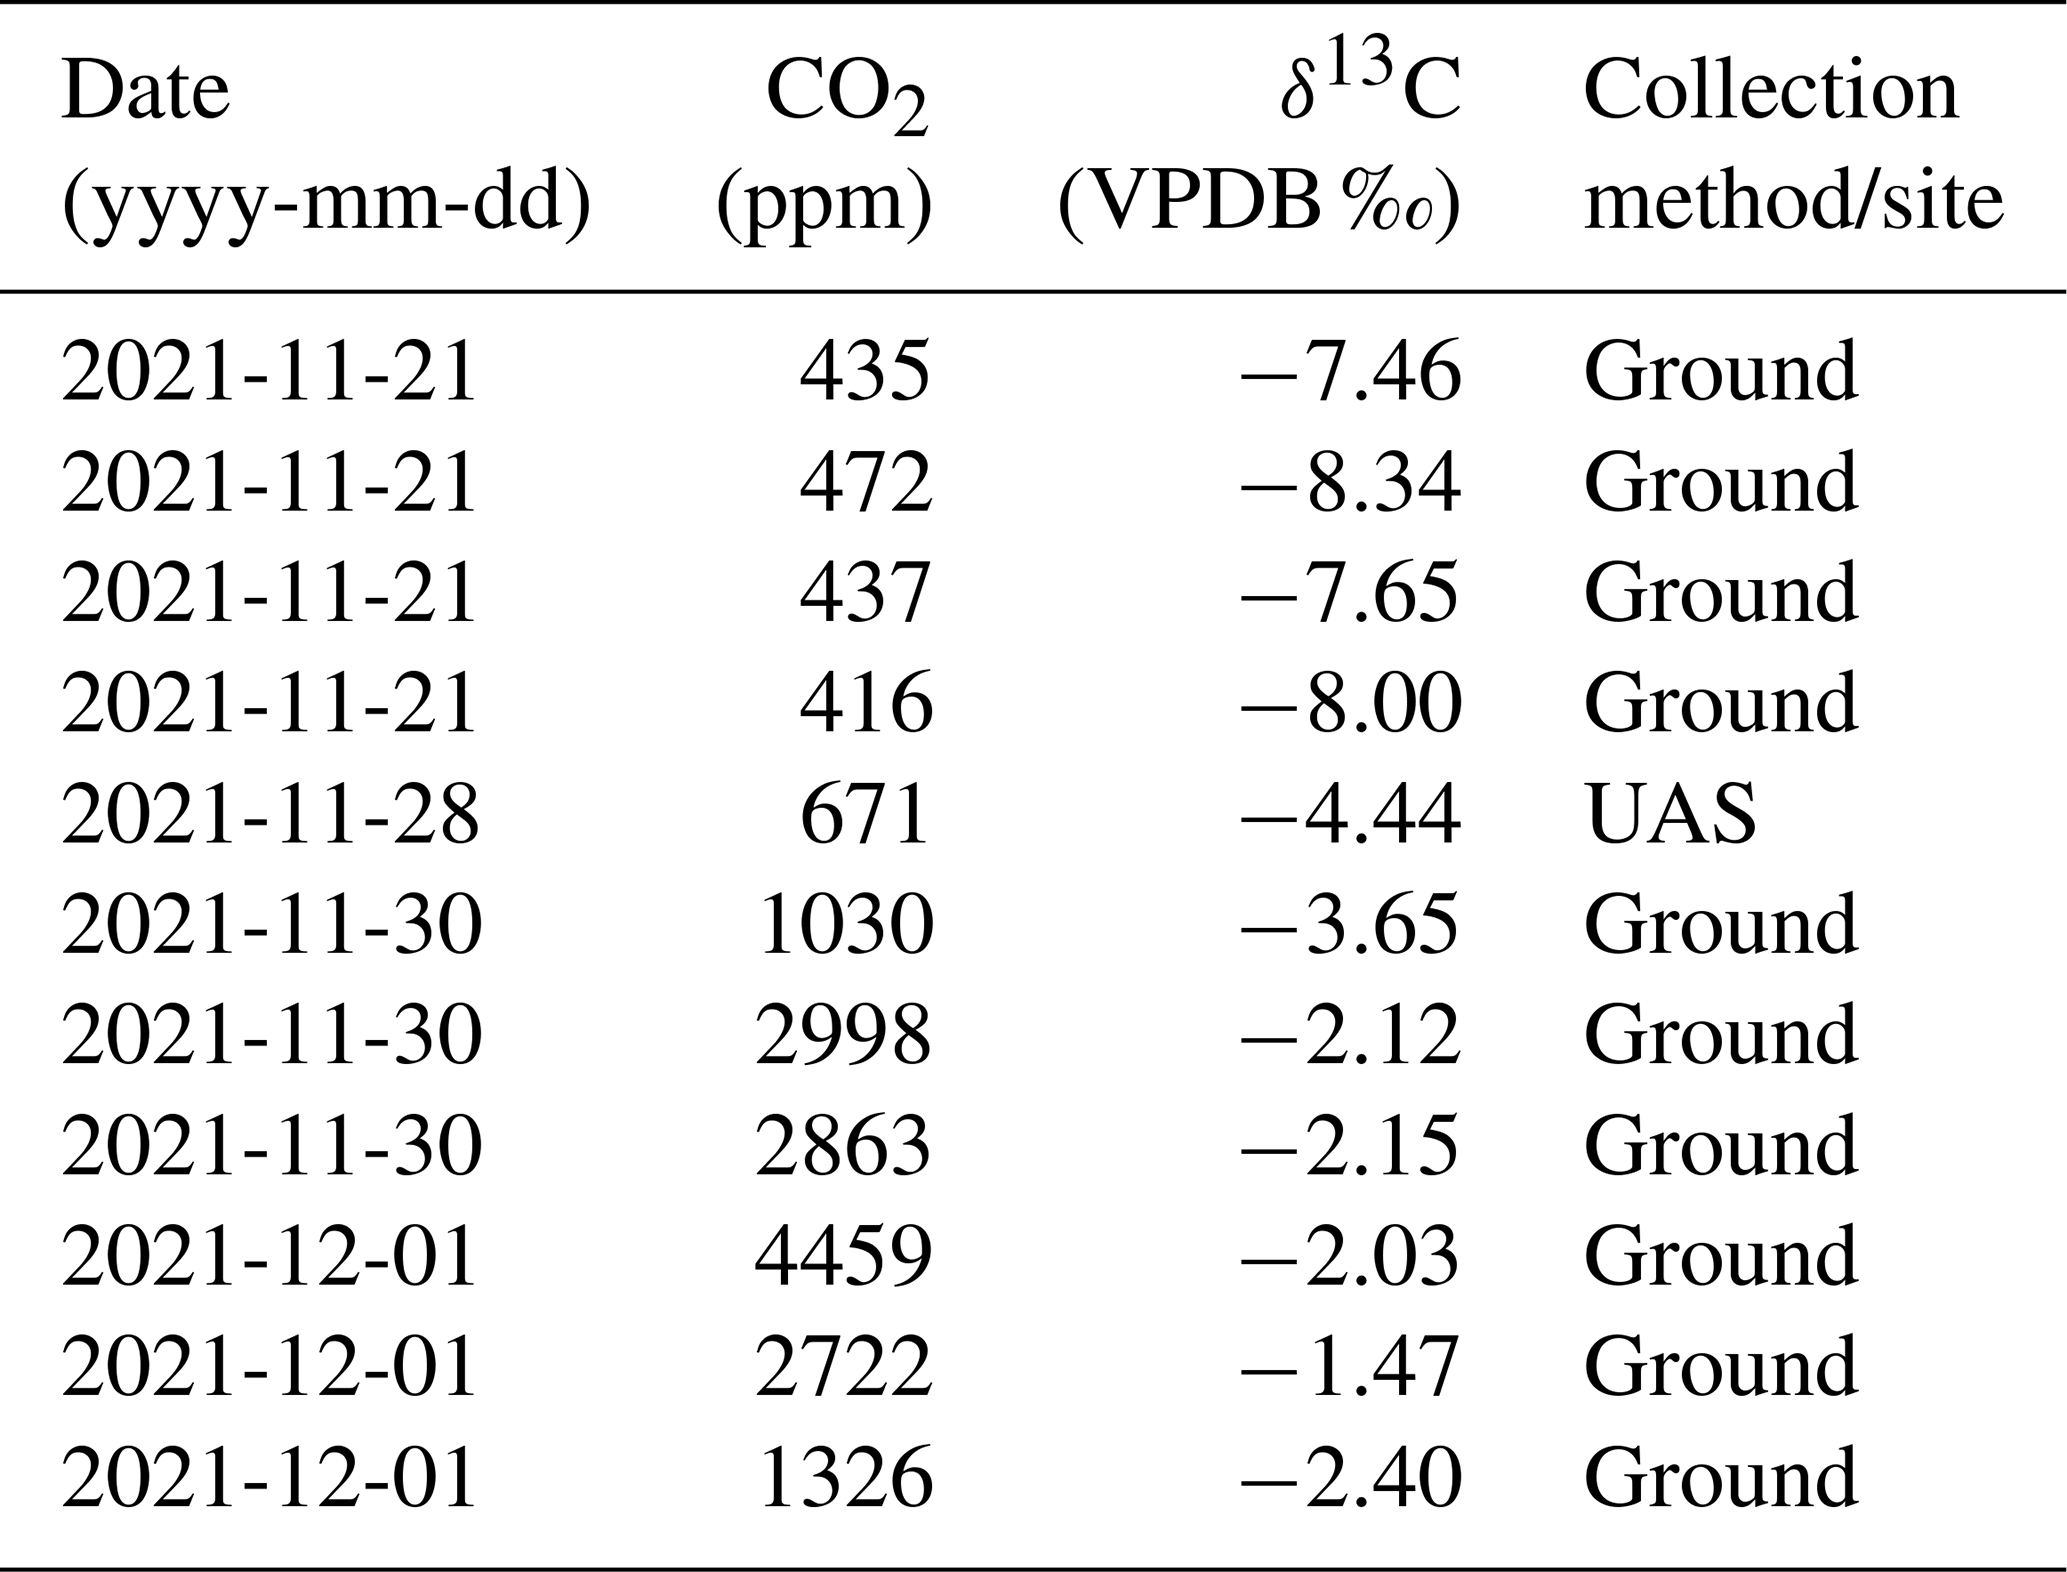
Samples collected from the ground closer to the vent have even higher CO2 concentrations from 1030 to 4459 ppm with δ13C values from −2.40 ‰ to −1.47 ‰.
3.3 Multi-GAS measurements of plume
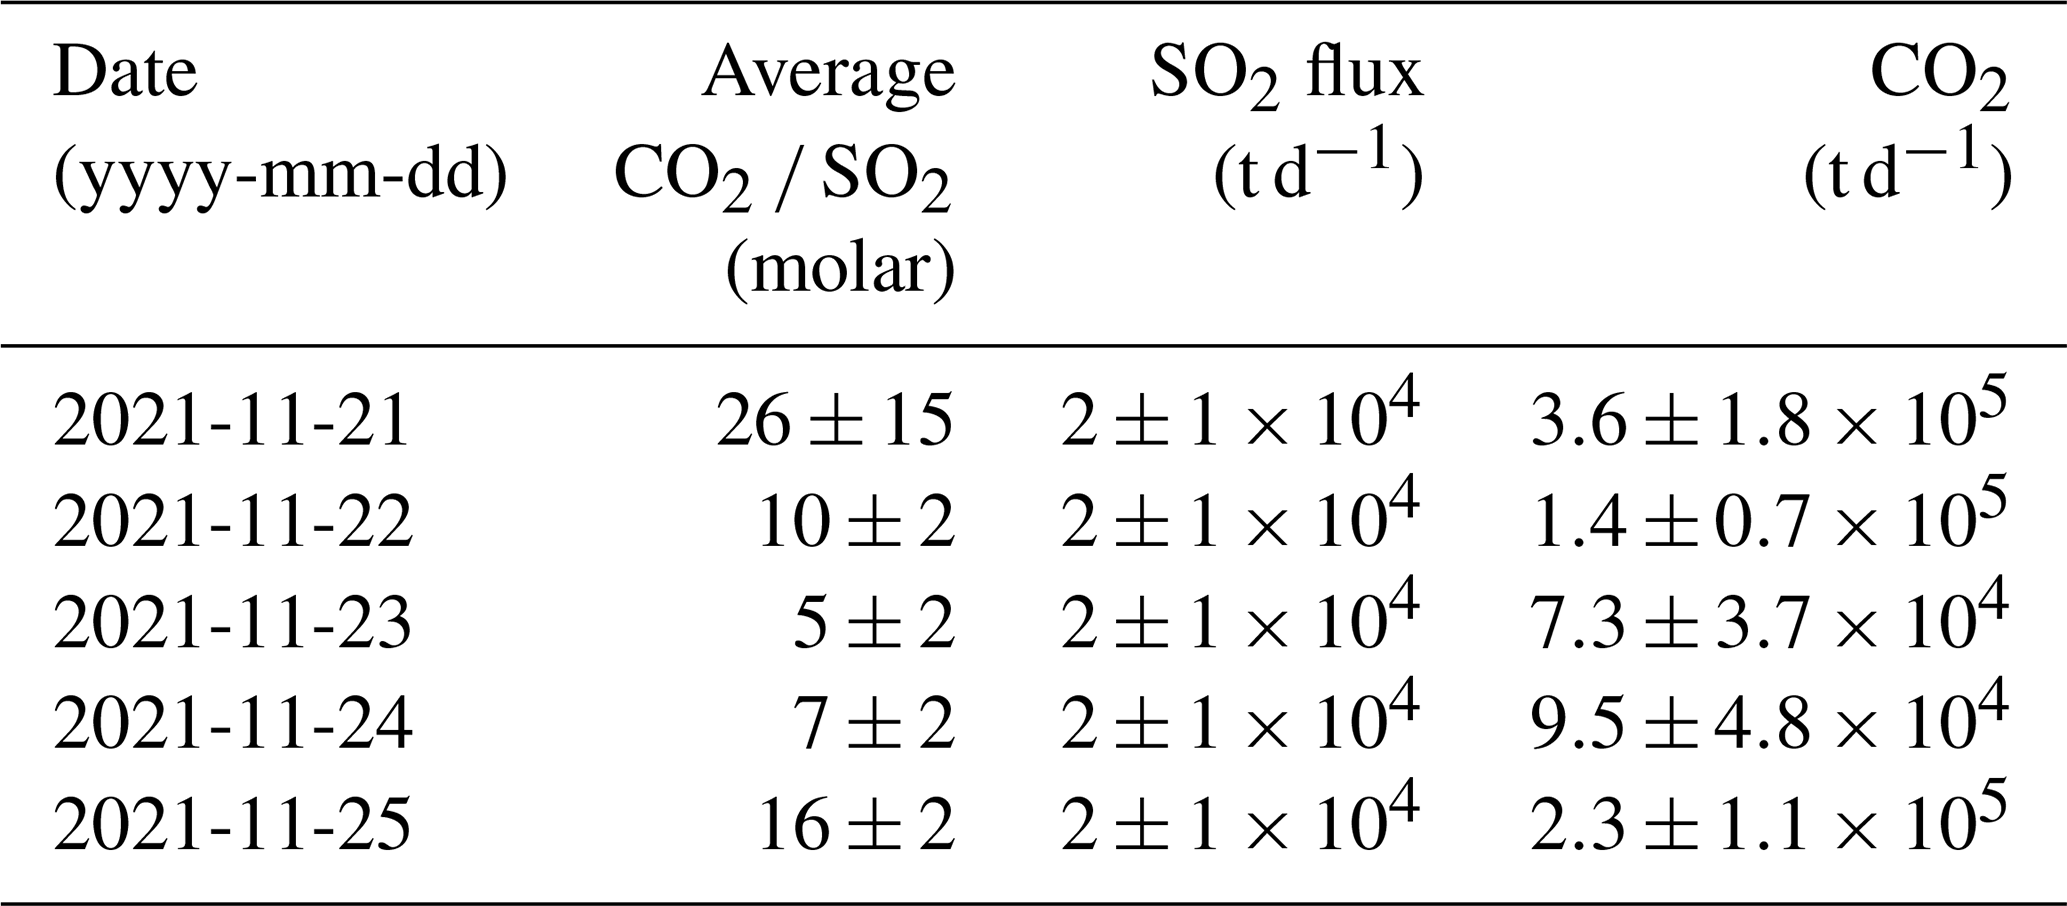
The Multi-GAS CO2 SO2 ratios during the period from 21 to 25 November 2021 range from 5 to 26 and are shown in Table 2. These values are consistent with those reported by Albertos et al. (2022) and Burton et al. (2023). We use the range of reported SO2 fluxes (mean of 104 t d−1 over the duration of the active eruption; Albertos et al., 2022) in combination with the range of our Multi-GAS CO2 SO2 ratios to obtain CO2 fluxes ranging from 7.3×10⁴ to 3.6×10⁵ t CO2 d−1 for this period (Table 3).
Table 3Multi-GAS measurements, SO2 flux and computed CO2 flux.
This work highlights our efforts in collecting and analyzing CO2 gases during the Tajogaite volcanic eruption. Through this work, we demonstrated the efficacy of using a UAS to study the CO2 plumes associated with an in-process eruption.
4.1 CO2 emissions
Our UAS-based CO2 emission estimation technique yields CO2 fluxes using direct measurement with a single instrument type. This simplifies the estimation of CO2 flux. However, in situ measurement during an active eruption is challenging. The most serious difficulty we encountered was obtaining complete transects across the plume or plumes. In several of our transects, especially for the more distant plume B, we were not successful in flying the UAS far enough to get to background CO2 on the far side of the plume. Gas plumes change shape and direction on relatively short timescales as the wind shifts. While, ideally, we would like to perform several flights at various altitudes through a plume in order to obtain a complete CO2 concentration map of the plume, this is challenging for wide or distant plumes because of limited UAS flight times and the need to know the plume's location and extent a priori. To address this challenge we assume a Gaussian plume and fit a Gaussian curve to our data. We then rotate the Gaussian fit to obtain a 2D concentration slice which is multiplied with estimated wind velocity to yield the flux. This approach produces the most accurate results if we transect the plume through its widest part. However, identifying the widest part and then transecting the plume before the plume changes will require teams of collaborating UASs. A good fit of the data by the Gaussian model is given by a high R2 value. For instance, transect 2 was fit with a R2 value of 0.93 and accounts for 93 % of the variance in the observed data. The model fit represented by this high R2 value is depicted in Fig. 4.
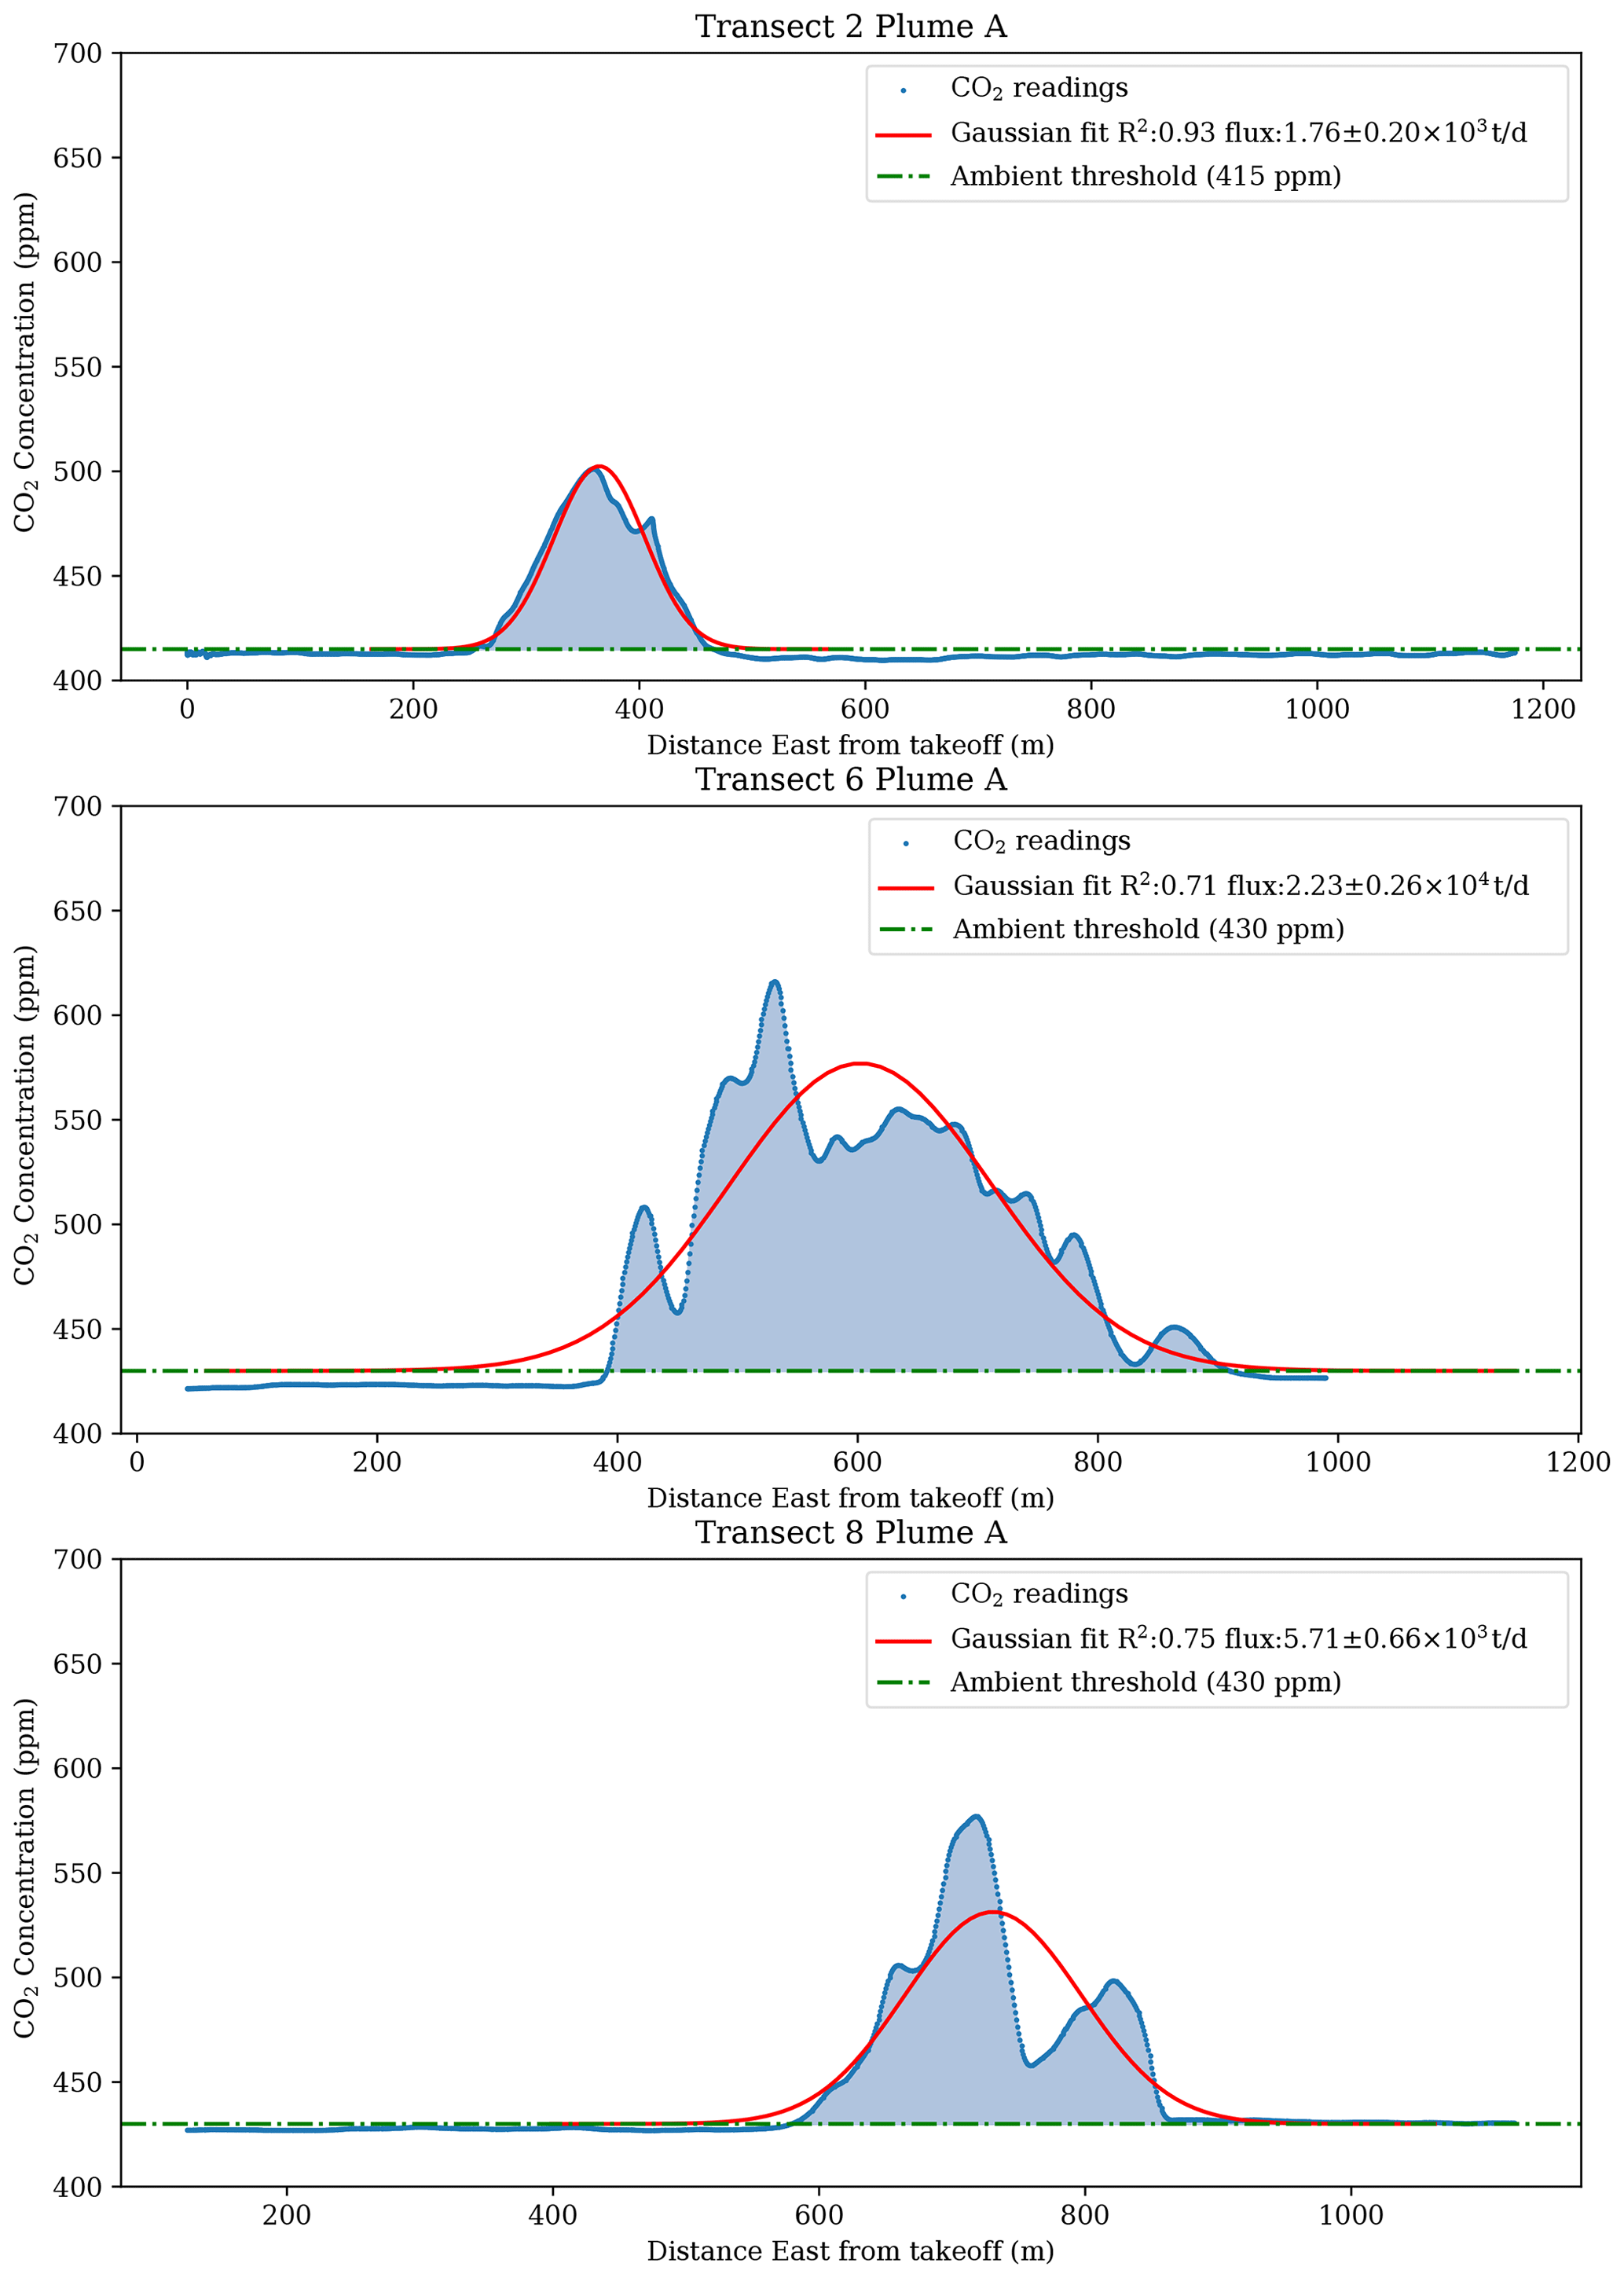
Figure 4Three plots of encounters with plume A with the closest Gaussian model fit. CO2 concentration (blue) over the encountered plume as a function of distance from the takeoff location.
Uncertainty is introduced by the assumptions made by the model. We combine the various sources of uncertainly using the RSS method (Eq. 4). With just one horizontal transect, we assume the vertical Gaussian standard deviation is identical to the horizontal standard deviation of the plume. The standard deviations of both dimensions are linearly correlated to the flux calculation, meaning that a 20 % error in the vertical standard deviation will affect the flux estimate by 20 %. We estimate that the vertical standard deviation is likely close to the horizontal standard deviation, but the difference is impossible to determine. Additionally, we assume that the horizontal transect samples the plume at the altitude where the plume is widest. If the transect is not through the largest cross-section, the flux calculation may be a lower bound. Wind velocity was measured during one of the transects, but weather is notoriously unpredictable. This represents another source of uncertainty in the model which has a linear effect on the flux measurement. We used our wind estimates during the time of each flux calculation. This variation in wind velocity ϵv is ±11 %, which is calculated from the wind velocity range measured over the experiments (Table 1). The range of wind directions is ±15° from Table 1, which gives an error in the flux estimate based on , thus ±3.40 %. The SBA-5 documentation reports sensor error ϵs of 1 % in the range of CO2 we measured. Finally, background ambient CO2 ϵb adds 1 % to the uncertainty model which we calculated from the uncertainty in ambient CO2 readings. Therefore, our estimated flux uncertainty given by the RSS method is 11.61 %.
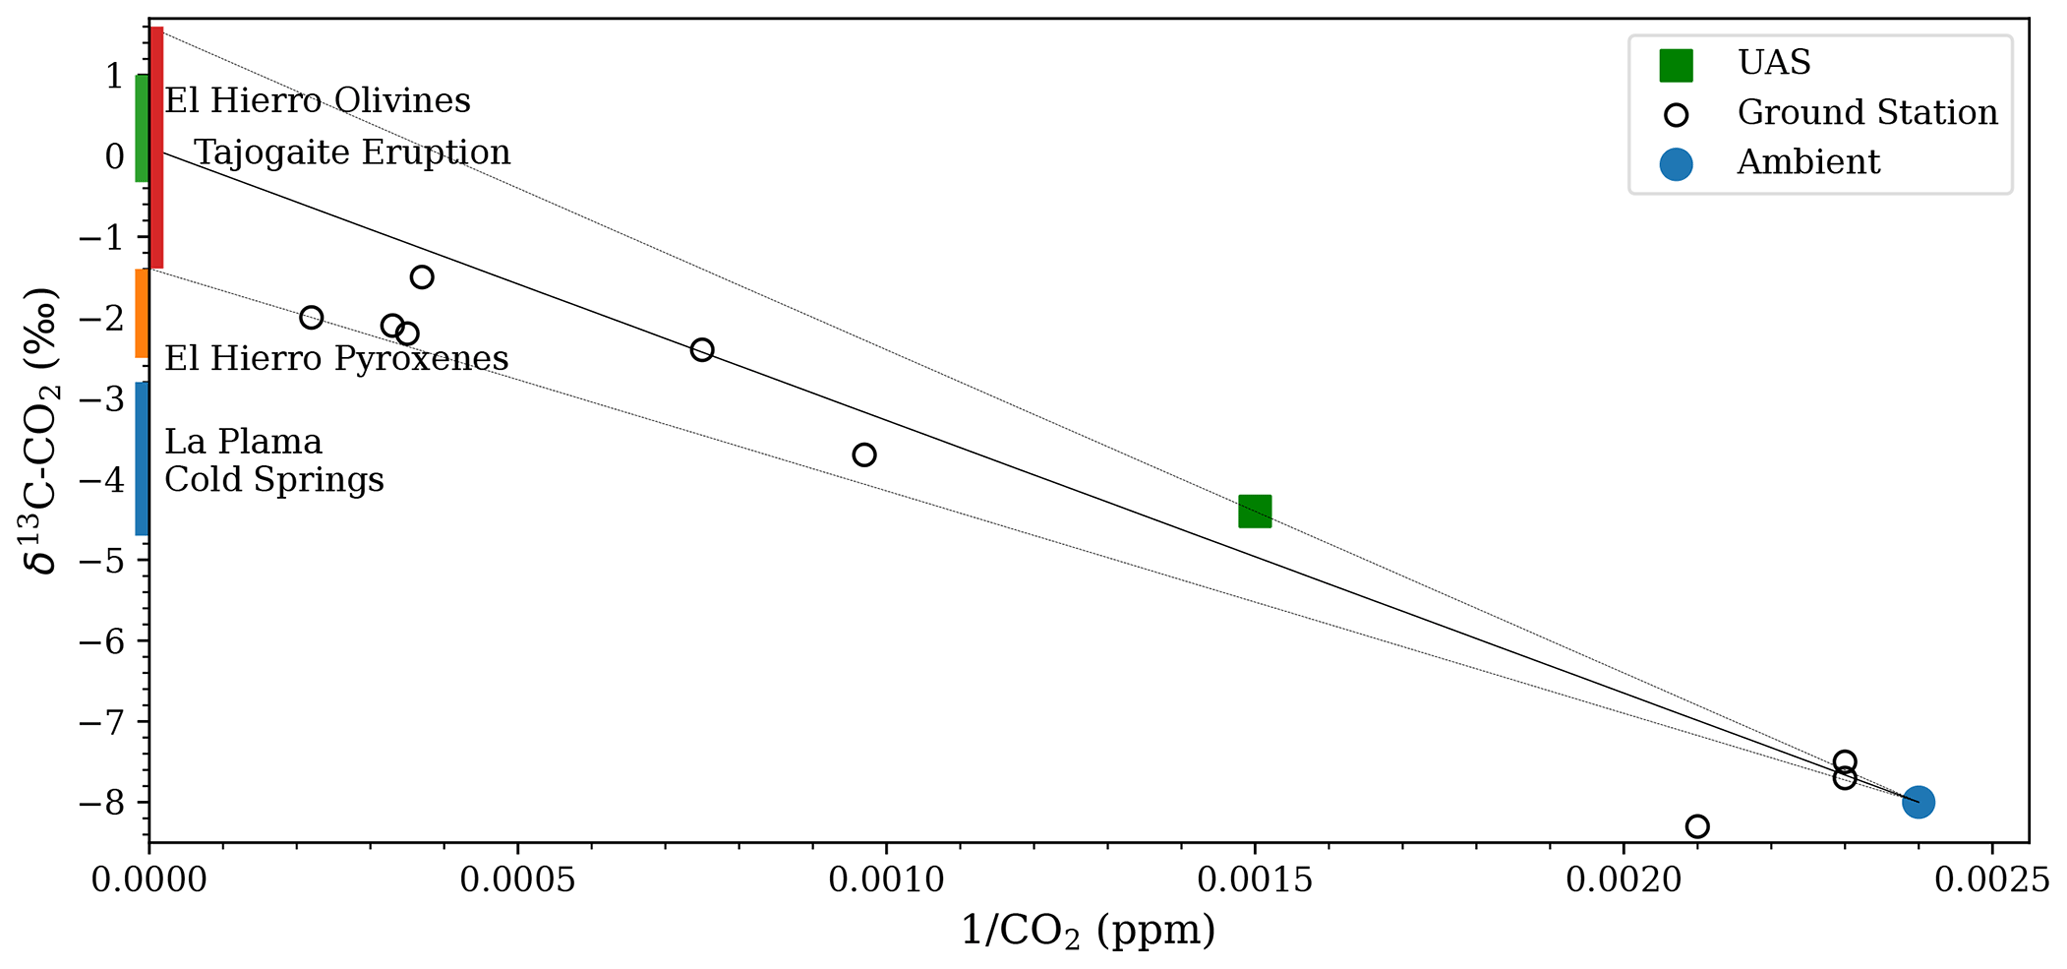
Figure 5Keeling plot showing standard air and samples collected on the ground, as well as with the UAS. Linear extrapolation indicates a volcanic δ13C–CO2 value of −1.40 ‰ to 1.60 ‰. Also shown are data from olivines and pyroxenes collected at El Hierro volcano (Sandoval-Velasquez et al., 2021) and the composition of cold CO2-rich gas discharges on the island of La Palma (Padrón et al., 2015).
Our data show that for plume A, transect 6 (Fig. 3) represents the widest plume and results in the highest CO2 flux value of t d−1, an order of magnitude higher than the other two plume A transects. This transect was flown at the lowest altitude (100 m) of the three, implying that the other two transects only captured the upper parts of the plume. Comparison with CO2 fluxes obtained by combining SO2 fluxes with CO2 SO2 ratios measured 1 km from the vent gives fluxes ranging from 7.3×10⁴ to 3.6×10⁵ t CO2 d−1 (Table 3). Therefore our highest flux measurement is consistent with the lowest estimate using the combined method. While comparing these two approaches is helpful, our experiment was not designed to make a direct comparison. The discrepancy could be due to a significantly varying CO2 emission rate during eruptions, an overestimate of the SO2 flux or the lack of validity of the 2D Gaussian extrapolation approach. Our estimates are consistent with the October 2021 high emissions presented by Burton et al. (2023), who report fluxes of 3.36×10⁴ to 4.19×10⁴ t CO2 d−1 (389 to 486 kg s−1) for the smaller, non-ashy plume that we measured. More work needs to be performed in the future to better assess sources of discrepancies with new and coordinated measurements at passively degassing and erupting volcanoes. However, even with such discrepancies, it is clear that the Tajogaite eruption in November 2021 produced a CO2 flux up to 2×10⁴ t d−1 or even 5×10⁵ t d−1. Even the 5×10⁵ t d−1 would be only 0.4 % of the daily CO2 emitted by the burning of fossil fuels (Conlen, 2021).
4.2 Carbon isotopes
The carbon isotope data obtained from the UAS-captured samples and the samples collected from the ground are generally consistent and show mixing of air-derived CO2 with a deep magmatic source. Figure 5 shows that all plume samples collected from the ground define a set of mixing lines in δ13C–CO space, i.e., in a Keeling plot (Keeling, 1958) that allows for the extrapolation of the δ13C value of the pure CO2 being emitted from the volcanic vent. The sample collected by UAV lies slightly above this set of mixing lines and extrapolates to somewhat heavier δ13C. The resulting volcanic δ13C values taking into account all samples lies between −1.5 ‰ and +1.5 ‰. Despite these uncertainties, these values overlap with δ13C data obtained from mantle xenoliths in lava erupted at the nearby El Hierro volcano (Sandoval-Velasquez et al., 2021).
Extrapolation of all these data results in a δ13C value of 0.1±1.5 ‰. Notably the carbon isotope values are significantly heavier than those measured in cold CO2-rich gas discharges from springs on La Palma (Padrón et al., 2015) and within the range of values measured in olivines and pyroxenes of xenoliths from the island of El Hierro (Sandoval-Velasquez et al., 2021). These authors suggested that the heavy values of the xenoliths are related to recycling of crustal carbon, likely derived from carbonates into the mantle source of the Canary Islands hot spot. Our data suggest that the magmatic system that is driving the Tajogaite eruption taps into this deep CO2, rather than remobilizing CO2 that feeds the cold degassing springs on the island. Sandoval-Velasquez et al. (2024) report δ13C values measured in olivines, clinopyroxenes and orthopyroxenes from lava flows erupted in 2021. Their data are consistent with our extrapolated heavy δ13C values. For olivines, representing the earliest crystallization phase, their values range from 0 ‰ to 1 ‰. Values are somewhat lighter for orthopyroxenes and clinopyroxenes. Using all data, their estimated mantle endmember is −1.5 ‰. Our data extrapolate to −1.4 ‰ to +1.6 ‰. Given the difference in sample medium, i.e., phenocrysts versus gas plume, the results are remarkably consistent. More work on erupting volcanoes is needed to better constrain the sources of magmatic CO2 emitted during heightened activity of volcanic systems.
The use of UASs is revolutionizing volcano science by enabling the collection of data that previously required extensive, costly and hazardous aerial surveys using piloted fixed-wing aircraft or helicopters. Especially in the field of volcanic gases, recent UAS-based campaigns showed the value of utilizing UASs to make gas flux and gas composition measurements and also collect plume samples for subsequent chemical and isotopic analyses (Liu et al., 2020; Galle et al., 2021). Our work during the explosive and hazardous eruption of Tajogaite volcano shows that CO2 emission measurements and plume gas samples can be collected even during these heightened periods of volcanic activity. We demonstrate that a UAS capable of automated sampling can be guided by the expert knowledge of scientists in the field to collect valuable data that would be impossible with robots or scientists alone. The collected data provide key insights into the volcano's state and the course of an eruption. Future work is needed to increase UAS autonomy in choosing flight paths to more completely capture data from dynamic plumes, but, as we have demonstrated, the present approach works for volcano monitoring during eruptions and can provide much-needed information about eruptive gas emissions.
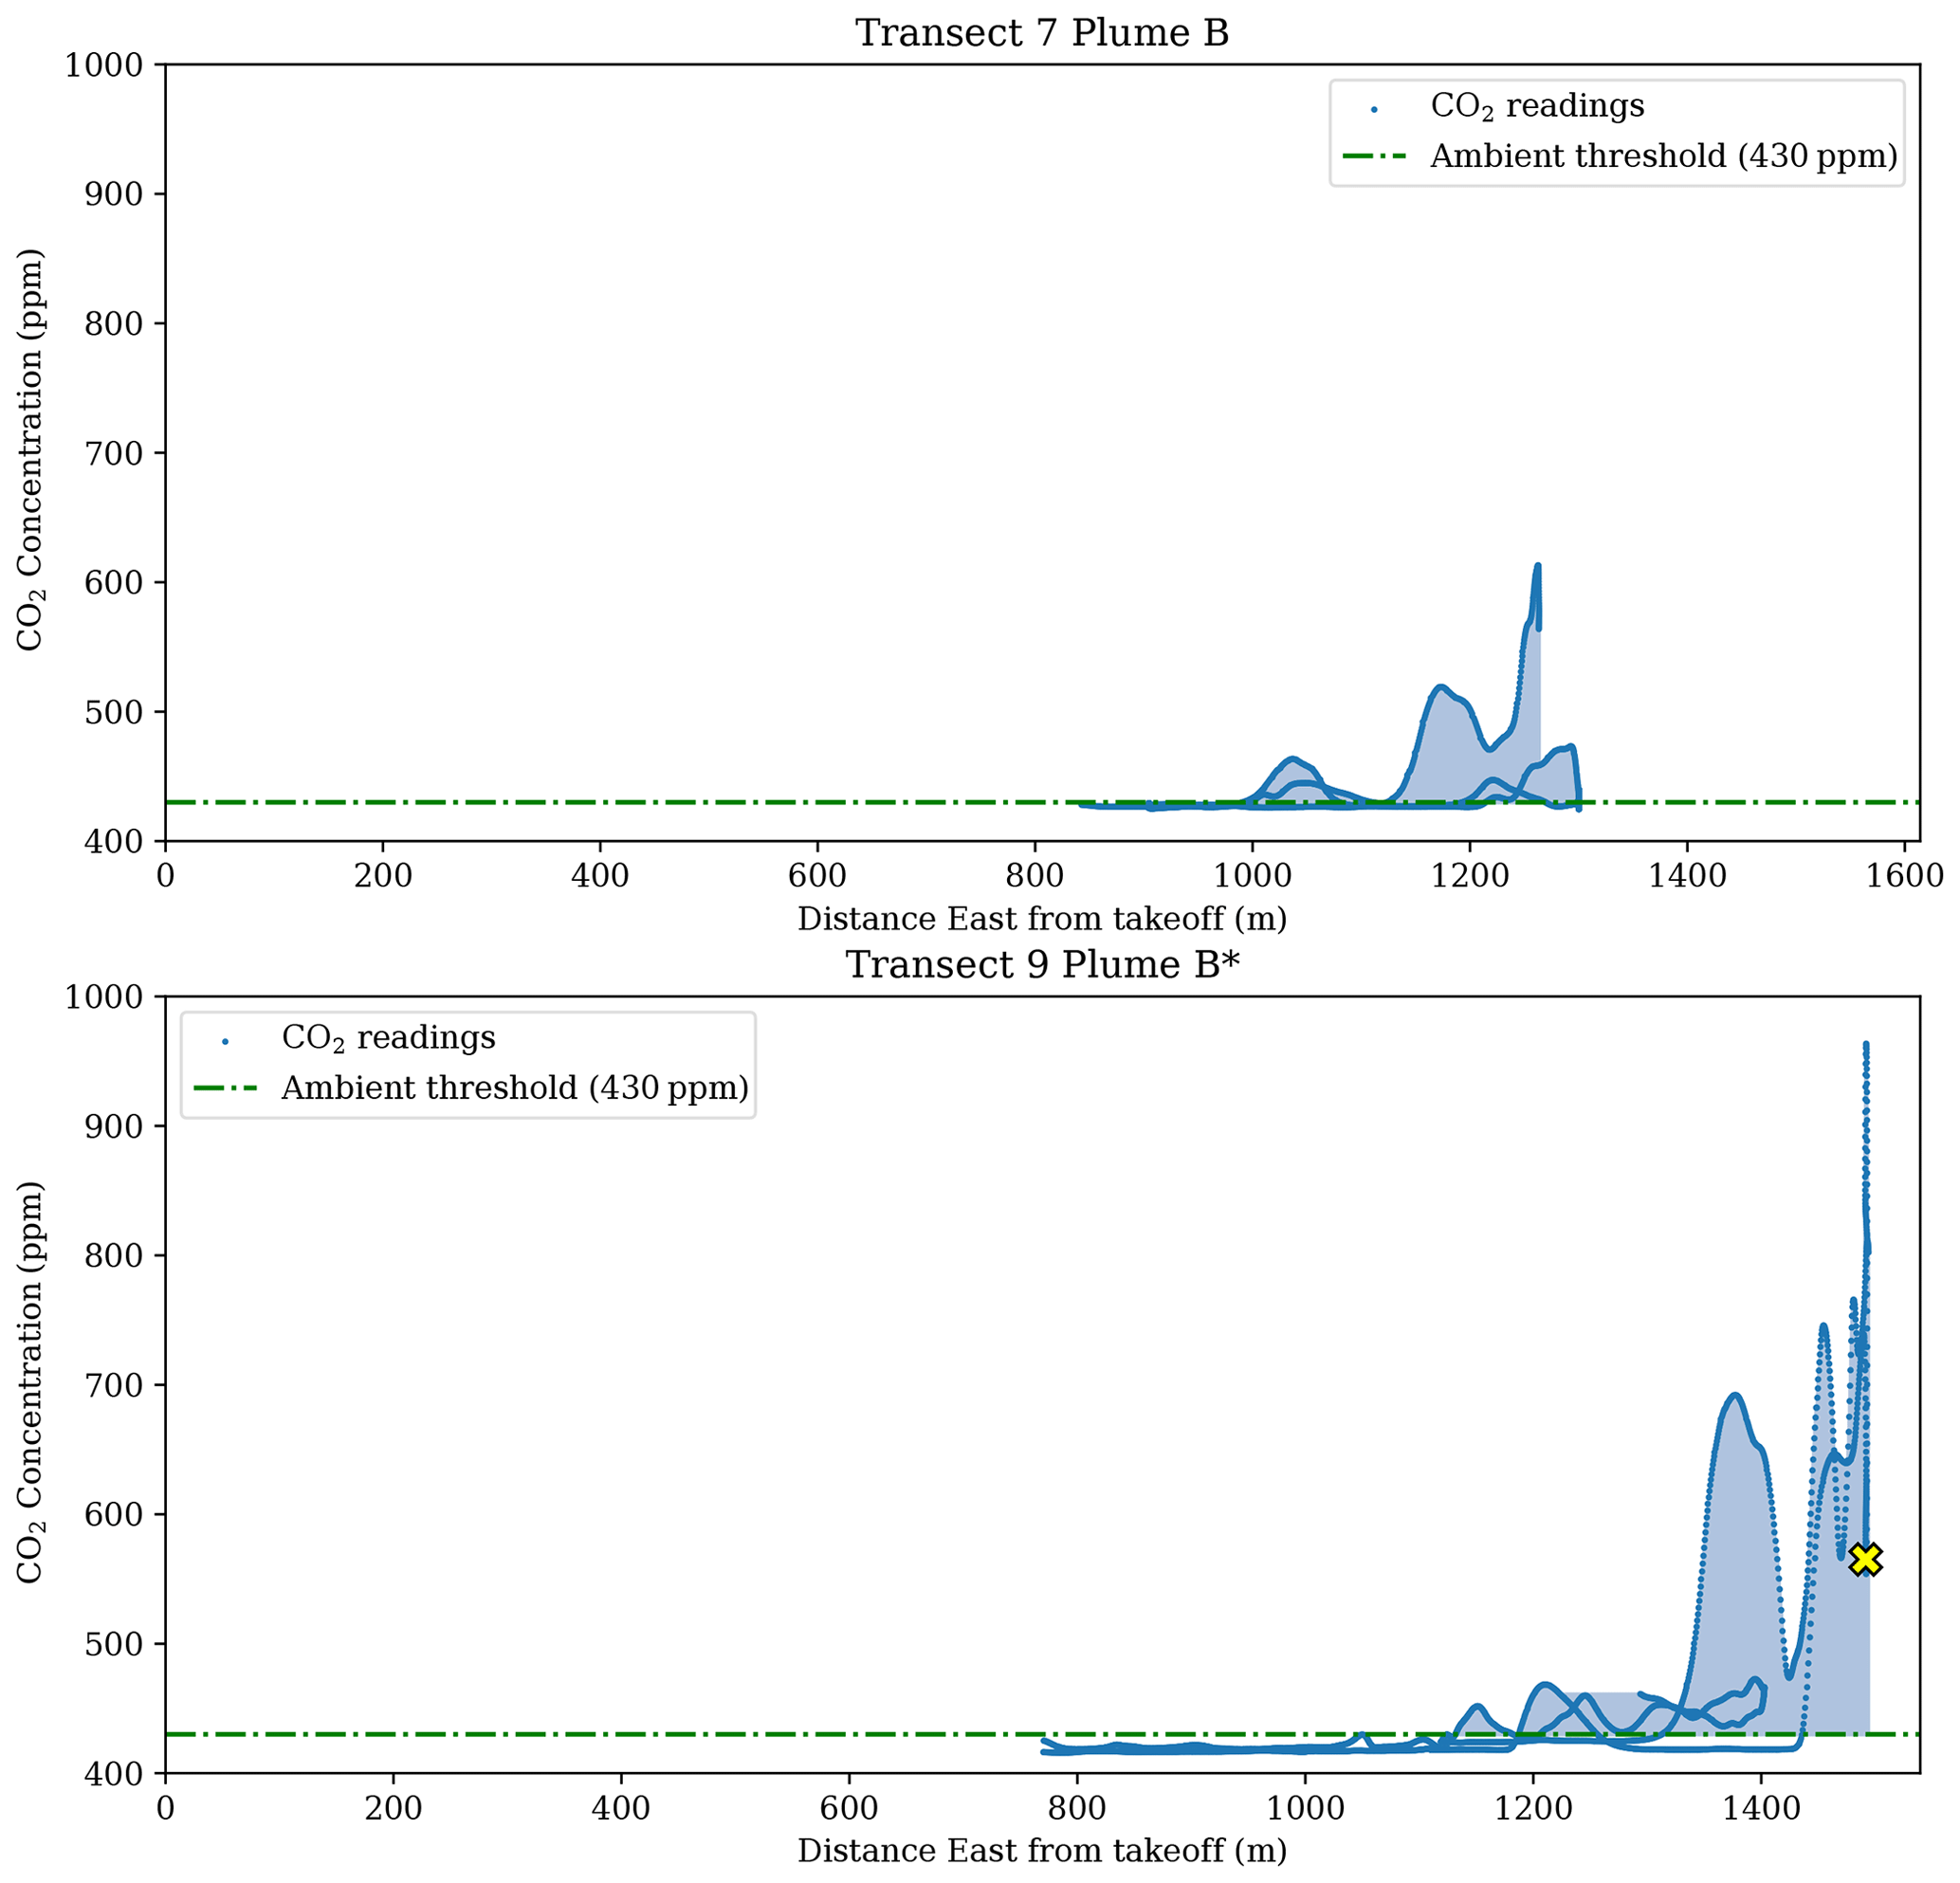
Figure A1Encounters with plume B were not as well fit as plume A encounters. These plots show the CO2 readings collected during the two highest plume model fits. As with Fig. 4, CO2 concentration (blue) over the encountered plume as a function of distance from the takeoff location. The sample collection location is indicated by the yellow ×.
All data needed to evaluate the conclusions in the paper are present in the paper. Additional data and plot generation code are available at https://github.com/BCLab-UNM/lapalma-expedition/tree/2021_tajogaite_eruption (last access: 8 August 2024; https://doi.org/10.5281/zenodo.13274766, Ericksen and Fricke, 2024). UAS code is available at https://github.com/BCLab-UNM/dragonfly-dashboard (last access: 8 August 2024; https://doi.org/10.5281/zenodo.13274798, Ericksen and Frost, 2024) and https://github.com/BCLab-UNM/dragonfly-controller (last access: 8 August 2024; https://doi.org/10.5281/zenodo.13274812, Ericksen et al., 2024).
JE, GMF, SN and TPF (UNM VolCAN team) performed UAS fieldwork for this paper. JE, NMP, PHP, EPG (INVOLCAN team) and TPF conducted the ground fieldwork. JE developed UAS software and hardware and was supervised by GMF and MEM. SN designed the sample collection device. JE, NMP, PHP and EPG performed data analysis. TPF performed isotope and gas analysis. JE, TPF, GMF, SN and MEM wrote the manuscript.
The contact author has declared that none of the authors has any competing interests.
Publisher's note: Copernicus Publications remains neutral with regard to jurisdictional claims made in the text, published maps, institutional affiliations, or any other geographical representation in this paper. While Copernicus Publications makes every effort to include appropriate place names, the final responsibility lies with the authors.
We thank UAV operator Jonatan Rodriguez Felipe for filing our flight plan, the Unidad Militar de Emergencias for enabling access to the eruption site and Samantha Wolf for assistance with the emission calculations.
This research has been supported by the US National Science Foundation Directorate of Engineering (grant no. 2024520) to Melanie E. Moses and Tobias P. Fischer. Support was also provided by a Google CSR award to Melanie E. Moses, by Honeywell Federal Manufacturing & Technologies, LLC, and by VOLRISKMAC II (MAC2/3.5b/328), financed by the Program INTERREG VA Spain-Portugal MAC 2014–2020 of the European Commission.
This paper was edited by Daniel Varon and reviewed by Cyril Aubaud and one anonymous referee.
Acocella, V., Di Lorenzo, R., Newhall, C., and Scandone, R.: An overview of recent (1988 to 2014) caldera unrest: Knowledge and perspectives, Rev. Geophys., 53, 896–955, https://doi.org/10.1002/2015RG000492, 2015. a
Albert, H., Costa, F., and Martí, J.: Years to weeks of seismic unrest and magmatic intrusions precede monogenetic eruptions, Geology, 44, 211–214, https://doi.org/10.1130/G37239.1, 2016. a
Albertos, V. T., Recio, G., Alonso, M., Amonte, C., Rodríguez, F., Rodríguez, C., Pitti, L., Leal, V., Cervigón, G., González, J., Przeor, M., Santana-León, J. M., Barrancos, J., Hernández, P. A., Padilla, G. D., Melián, G. V., Padrón, E., Asensio-Ramos, M., and Pérez, N. M.: Sulphur dioxide (SO2) emissions by means of miniDOAS measurements during the 2021 eruption of Cumbre Vieja volcano, La Palma, Canary Islands, EGU General Assembly 2022, Vienna, Austria, 23–27 May 2022, EGU22-5603, https://doi.org/10.5194/egusphere-egu22-5603, 2022. a, b, c
Arrhenius, S.: On the Influence of Carbonic Acid in the Air upon the Temperature of the Ground, Philos. Mag, 41, 237–276, 1896. a
Burton, M., Aiuppa, A., Allard, P., Asensio-Ramos, M., Cofrades, A. P., La Spina, A., Nicholson, E. J., Zanon, V., Barrancos, J., Bitetto, M., Hartley, M., Romero, J. E., Waters, E., Stewart, A., Hernández, P. A., Lages, J. P., Padrón, E., Wood, K., Esse, B., Hayer, C., Cyrzan, K., Rose-Koga, E. F., Schiavi, F., D'Auria, L., and Pérez, N. M.: Exceptional eruptive CO2 emissions from intra-plate alkaline magmatism in the Canary volcanic archipelago, Communications Earth & Environment, 4, 1–10, https://doi.org/10.1038/s43247-023-01103-x, 2023. a, b, c, d, e, f
Burton, M. R., Sawyer, G. M., and Granieri, D.: Deep Carbon Emissions from Volcanoes, Rev. Mineral. Geochem., 75, 323–354, https://doi.org/10.2138/RMG.2013.75.11, 2013. a
Carracedo, J. C., Day, S., Guillou, H., Rodríguez Badiola, E., Canas, J. A., and Pérez Torrado, F. J.: Hotspot volcanism close to a passive continental margin: the Canary Islands, Geol. Mag., 135, 591–604, https://doi.org/10.1017/S0016756898001447, 1998. a
Carracedo, J. C., Badiola, E. R., Guillou, H., De La Nuez, J., and Pérez Torrado, F. J.: Geology and volcanology of la Palma and el Hierro, western Canaries, Estud. Geol., 57, 175–273, 2001. a
Castro, J. M. and Feisel, Y.: Eruption of ultralow-viscosity basanite magma at Cumbre Vieja, La Palma, Canary Islands, Nat. Commun., 13, 1–12, https://doi.org/10.1038/s41467-022-30905-4, 2022. a
Conlen, M.: How Much Carbon Dioxide Are We Emitting? – Climate Change: Vital Signs of the Planet, NASA, https://climate.nasa.gov/news/3020/how-much-carbon-dioxide-are-we-emitting/ (last access: 8 August 2024), 2021. a
Day, S. J., Carracedo, J. C., Guillou, H., and Gravestock, P.: Recent structural evolution of the Cumbre Vieja volcano, La Palma, Canary Islands: Volcanic rift zone reconfiguration as a precursor to volcano flank instability?, J. Volcanol. Geoth. Res., 94, 135–167, https://doi.org/10.1016/S0377-0273(99)00101-8, 1999. a
De Luca, C., Valerio, E., Giudicepietro, F., Macedonio, G., Casu, F., and Lanari, R.: Pre-and Co-Eruptive Analysis of the September 2021 Eruption at Cumbre Vieja Volcano (La Palma, Canary Islands) Through DInSAR Measurements and Analytical Modeling, Geophys. Res. Lett., 49, e2021GL097293, https://doi.org/10.1029/2021GL097293, 2022. a
Ericksen, J. and Fricke, G. M.: BCLab-UNM/lapalma-expedition: AMT 2024 (2021_tajogaite_eruption), Zenodo [data and code], https://doi.org/10.5281/zenodo.13274766, 2024. a
Ericksen, J. and Frost, C.: BCLab-UNM/dragonfly-dashboard: AMT 2024 (Version AMT2024), Zenodo [code], https://doi.org/10.5281/zenodo.13274798, 2024. a
Ericksen, J., Fricke, G. M., Nowicki, S., Fischer, T. P., Hayes, J. C., Rosenberger, K., Wolf, S. R., Fierro, R., and Moses, M. E.: Aerial Survey Robotics in Extreme Environments: Mapping Volcanic CO2 Emissions With Flocking UAVs, Frontiers in Control Engineering, 3, 836720, https://doi.org/10.3389/FCTEG.2022.836720, 2022. a, b
Ericksen, J., Frost, C., and Islam, A.: BCLab-UNM/dragonfly-controller: AMT 2024 (Version AMT2024), Zenodo [code], https://doi.org/10.5281/zenodo.13274812, 2024. a
Fernández, J., Escayo, J., Hu, Z., Camacho, A. G., Samsonov, S. V., Prieto, J. F., Tiampo, K. F., Palano, M., Mallorquí, J. J., and Ancochea, E.: Detection of volcanic unrest onset in La Palma, Canary Islands, evolution and implications, Sci. Rep., 11, 2540, https://doi.org/10.1038/s41598-021-82292-3, 2021. a, b
Fischer, T. P. and Aiuppa, A.: AGU Centennial Grand Challenge: Volcanoes and Deep Carbon Global CO2 Emissions From Subaerial Volcanism – Recent Progress and Future Challenges, Geochem. Geophy. Geosy., 21, e2019GC008690, https://doi.org/10.1029/2019GC008690, 2020. a, b
Fischer, T. P. and Lopez, T. M.: First airborne samples of a volcanic plume for δ13C of CO2 determinations, Geophys. Res. Lett., 43, 3272–3279, https://doi.org/10.1002/2016GL068499, 2016. a, b
Fischer, T. P., Arellano, S., Carn, S., Aiuppa, A., Galle, B., Allard, P., Lopez, T., Shinohara, H., Kelly, P., Werner, C., Cardellini, C., and Chiodini, G.: The emissions of CO2 and other volatiles from the world's subaerial volcanoes, Sci. Rep., 9, 18716, https://doi.org/10.1038/s41598-019-54682-1, 2019. a
Fischer, T. P., Mandon, C. L., Nowicki, S., Ericksen, J., Vilches, F. R., Pfeffer, M. A., Aiuppa, A., Bitetto, M., Vitale, A., Fricke, G. M., Moses, M. E., and Stefánsson, A.: CO2 emissions during the 2023 Litli Hrútur eruption in Reykjanes, Iceland: δ13C tracks magma degassing, B. Volcanol., 86, 1–10, https://doi.org/10.1007/S00445-024-01751-7, 2024. a
Galle, B., Arellano, S., Bobrowski, N., Conde, V., Fischer, T. P., Gerdes, G., Gutmann, A., Hoffmann, T., Itikarai, I., Krejci, T., Liu, E. J., Mulina, K., Nowicki, S., Richardson, T., Rüdiger, J., Wood, K., and Xu, J.: A multi-purpose, multi-rotor drone system for long-range and high-altitude volcanic gas plume measurements, Atmos. Meas. Tech., 14, 4255–4277, https://doi.org/10.5194/amt-14-4255-2021, 2021. a, b, c
Gerlach, T. M., Delgado, H., McGee, K. A., Doukas, M. P., Venegas, J. J., and Cárdenas, L.: Application of the LI-COR CO2 analyzer to volcanic plumes: A case study, volcán Popocatépetl, Mexico, June 7 and 10, 1995, J. Geophys. Res.-Sol. Ea., 102, 8005–8019, https://doi.org/10.1029/96JB03887, 1997. a
Giggenbach, W. F.: Chemical Composition of Volcanic Gases, in: Monitoring and Mitigation of Volcano Hazards, Springer-Verlag Berlin Heidelberg, 221–256, https://link.springer.com/chapter/10.1007/978-3-642-80087-0_7 (last access: 8 August 2024), 1996. a
Ilanko, T., Fischer, T. P., Kyle, P., Curtis, A., Lee, H., and Sano, Y.: Modification of fumarolic gases by the ice-covered edifice of Erebus volcano, Antarctica, J. Volcanol. Geoth. Res., 381, 119–139, https://doi.org/10.1016/J.JVOLGEORES.2019.05.017, 2019. a
Instituto Geográfico Nacional: Noticias e informe mensual de vigilancia volcánica, https://www.ign.es/web/resources/volcanologia/html/CA_noticias.html (last access: 8 August 2024), 2022. a, b
Johnson, M. S., Schwandner, F. M., Potter, C. S., Nguyen, H. M., Bell, E., Nelson, R. R., Philip, S., and O'Dell, C. W.: Carbon Dioxide Emissions During the 2018 Kilauea Volcano Eruption Estimated Using OCO-2 Satellite Retrievals, Geophys. Res. Lett., 47, e2020GL090507, https://doi.org/10.1029/2020GL090507, 2020. a, b
Keeling, C. D.: The concentration and isotopic abundances of atmospheric carbon dioxide in rural areas, Geochim. Cosmochim. Ac., 13, 322–334, https://doi.org/10.1016/0016-7037(58)90033-4, 1958. a
Lin, X., van der A, R., de Laat, J., Eskes, H., Chevallier, F., Ciais, P., Deng, Z., Geng, Y., Song, X., Ni, X., Huo, D., Dou, X., and Liu, Z.: Monitoring and quantifying CO2 emissions of isolated power plants from space, Atmos. Chem. Phys., 23, 6599–6611, https://doi.org/10.5194/acp-23-6599-2023, 2023. a
Liu, E. J., Aiuppa, A., Alan, A., Arellano, S., Bitetto, M., Bobrowski, N., Carn, S., Clarke, R., Corrales, E., De Moor, J. M., Diaz, J. A., Edmonds, M., Fischer, T. P., Freer, J., Fricke, G. M., Galle, B., Gerdes, G., Giudice, G., Gutmann, A., Hayer, C., Itikarai, I., Jones, J., Mason, E., McCormick Kilbride, B. T., Mulina, K., Nowicki, S., Rahilly, K., Richardson, T., Rüdiger, J., Schipper, C. I., Watson, I. M., and Wood, K.: Aerial strategies advance volcanic gas measurements at inaccessible, strongly degassing volcanoes, Science Advances, 6, eabb9103, https://doi.org/10.1126/sciadv.abb9103, 2020. a, b, c, d
Nassar, R., Hill, T. G., McLinden, C. A., Wunch, D., Jones, D. B., and Crisp, D.: Quantifying CO2 Emissions From Individual Power Plants From Space, Geophys. Res. Lett., 44, 10045–10053, https://doi.org/10.1002/2017GL074702, 2017. a
Nassar, R., Mastrogiacomo, J. P., Bateman-Hemphill, W., McCracken, C., MacDonald, C. G., Hill, T., O'Dell, C. W., Kiel, M., and Crisp, D.: Advances in quantifying power plant CO2 emissions with OCO-2, Remote Sens. Environ., 264, 112579, https://doi.org/10.1016/J.RSE.2021.112579, 2021. a
Office of Science: FLUXNET, Office of Science, US DOE, http://fluxnet.org (last access: 8 August 2024), 2023. a
Padrón, E., Pérez, N. M., Rodríguez, F., Melián, G., Hernández, P. A., Sumino, H., Padilla, G., Barrancos, J., Dionis, S., Notsu, K., and Calvo, D.: Dynamics of diffuse carbon dioxide emissions from Cumbre Vieja volcano, La Palma, Canary Islands, B. Volcanol., 77, 1–15, https://doi.org/10.1007/s00445-015-0914-2, 2015. a, b, c
Pérez, N. M., Hernández, P. A., Melián, G. V., Padrón, E., Asensio-Ramos, M., Barrancos, J., Padilla, G. D., Rodríguez, F., D'Auria, L., Amonte, C., Alonso, M., Martín-Lorenzo, A., Calvo, D., Rodríguez, C., Hernández, W., Coldwell, B., and Pankhurst, M. J. and the International Collaborative Research TEAM: The 2021 Cumbre Vieja eruption: an overview of the geochemical monitoring program, EGU General Assembly 2022, Vienna, Austria, 23–27 May 2022, EGU22-12491, https://doi.org/10.5194/egusphere-egu22-12491, 2022. a, b
Rodríguez-Pérez, C., Barrancos, J., Hernández, P. A., Pérez, N. M., Padrón, E., Melián, G. V., Rodríguez, F., Asensio-Ramos, M., and Padilla, G. D.: Continuous monitoring of diffuse CO2 emission from Cumbre Vieja volcano: early evidences of magmatic CO2 surface arrival, EGU General Assembly 2022, Vienna, Austria, 23–27 May 2022, EGU22-9819, https://doi.org/10.5194/egusphere-egu22-9819, 2022. a
Rüdiger, J., Tirpitz, J.-L., de Moor, J. M., Bobrowski, N., Gutmann, A., Liuzzo, M., Ibarra, M., and Hoffmann, T.: Implementation of electrochemical, optical and denuder-based sensors and sampling techniques on UAV for volcanic gas measurements: examples from Masaya, Turrialba and Stromboli volcanoes, Atmos. Meas. Tech., 11, 2441–2457, https://doi.org/10.5194/amt-11-2441-2018, 2018. a
Sandoval-Velasquez, A., Rizzo, A. L., Aiuppa, A., Remigi, S., Padrón, E., Pérez, N. M., and Frezzotti, M. L.: Recycled crustal carbon in the depleted mantle source of El Hierro volcano, Canary Islands, Lithos, 400–401, 106414, https://doi.org/10.1016/j.lithos.2021.106414, 2021. a, b, c
Sandoval-Velasquez, A., Casetta, F., Ntaflos, T., Aiuppa, A., Coltorti, M., Frezzotti, M. L., Alonso, M., Padrón, E., Pankhurst, M., Pérez, N. M., and Rizzo, A. L.: 2021 Tajogaite eruption records infiltration of crustal fluids within the upper mantle beneath La Palma, Canary Islands, Front. Earth Sci., 12, 1303872, https://doi.org/10.3389/FEART.2024.1303872, 2024. a
Santana de León, J. M., Melián, G. V., Rodríguez, C., Cervigón-Tomico, G., Ortega, V., Martínez van Dorth, D., Cabrera-Pérez, I., Cordero, M., Przeor, M., Silva, R. F. F., Matos, S. B. D., Baldoni, E., Ramalho, M. M. P., Viveiros, F., Calvo, D., and Pérez, N. M.: Long-term variations of diffuse CO2 at Cumbre Vieja volcano, La Palma, Canary Islands, EGU General Assembly 2022, Vienna, Austria, 23–27 May 2022, EGU22-8773, https://doi.org/10.5194/egusphere-egu22-8773, 2022. a
Schmincke, H. U.: Volcanic and chemical evolution of the Canary Islands, in: Geology of the northwest African continental margin, Springer, 273–306, https://doi.org/10.1007/978-3-642-68409-8_12, 1982. a
Schwandner, F. M., Gunson, M. R., Miller, C. E., Carn, S. A., Eldering, A., Krings, T., Verhulst, K. R., Schimel, D. S., Nguyen, H. M., Crisp, D., O'Dell, C. W., Osterman, G. B., Iraci, L. T., and Podolske, J. R.: Spaceborne detection of localized carbon dioxide sources, Science, 358, eaam5782, https://doi.org/10.1126/science.aam5782, 2017. a, b
Stix, J., de Moor, J. M., Rüdiger, J., Alan, A., Corrales, E., D'Arcy, F., Diaz, J. A., and Liotta, M.: Using Drones and Miniaturized Instrumentation to Study Degassing at Turrialba and Masaya Volcanoes, Central America, J. Geophys. Res.-Sol. Ea., 123, 6501–6520, https://doi.org/10.1029/2018JB015655, 2018. a
Ward, S. N. and Day, S.: Cumbre Vieja Volcano-Potential collapse and tsunami at La Palma, Canary Islands, Geophys. Res. Lett., 28, 3397–3400, https://doi.org/10.1029/2001GL013110, 2001. a
Werner, C., Kelly, P. J., Doukas, M., Lopez, T., Pfeffer, M., McGimsey, R., and Neal, C.: Degassing of CO2, SO2, and H2S associated with the 2009 eruption of Redoubt Volcano, Alaska, J. Volcanol. Geoth. Res., 259, 270–284, https://doi.org/10.1016/J.JVOLGEORES.2012.04.012, 2013. a, b
Xi, X., Johnson, M. S., Jeong, S., Fladeland, M., Pieri, D., Diaz, J. A., and Bland, G. L.: Constraining the sulfur dioxide degassing flux from Turrialba volcano, Costa Rica using unmanned aerial system measurements, J. Volcanol. Geoth. Res., 325, 110–118, https://doi.org/10.1016/J.JVOLGEORES.2016.06.023, 2016. a