the Creative Commons Attribution 4.0 License.
the Creative Commons Attribution 4.0 License.
 | 20 Aug 2024
Number- and size-controlled rainfall regimes in the Netherlands: physical reality or statistical mirage?
Marc Schleiss
An experimental study aimed at identifying special rainfall regimes with the help of co-located disdrometers is performed. Eight potentially special events (i.e., four number-controlled events and four size-controlled events) are identified and examined. However, a detailed cross-check with additional, independent radar measurements reveals no clear evidence of special rainfall dynamics. The research underscores the difficulty of experimentally confirming seemingly straightforward questions about rainfall patterns and dynamics that have been theorized in the literature for several decades but never formally validated experimentally. The study also questions the reliability of previous claims and serves as a reminder to approach such problems with more caution, emphasizing the need for rigorous uncertainty analysis and multiple cross-checks between sensors to avoid misinterpretation.
- Article
(4380 KB) - Full-text XML
- BibTeX
- EndNote


The study of raindrop size distributions (DSDs) is crucial for understanding the microphysical processes involved in rainfall. The DSD is defined as the average concentration N(D) of raindrops of diameter D (mm) per unit volume of air:
where (in m−3) is the total number of raindrops, and f(D) (mm−1) is a probability density function for the drop diameters such that and .
The rainfall rate R (in mm h−1) directly depends on the DSD through the following equation:
where v(D) (m s−1) denotes the average fall velocity of a raindrop as a function of drop diameter (Beard, 1976, 1985).
One question that arises when studying rainfall dynamics is whether there are special moments in time during which f(D) or NT are approximately constant. The first of these special cases is the so-called “number-controlled” regime, in which the size distribution f(D) is constant and all the temporal variability of the rainfall rate can be explained by changes in NT. The second special case is the so-called “size-controlled” regime, in which NT is constant and all the variability in the rainfall rate can be explained by changes in f(D).
Conditions of approximately constant size distributions have been theorized for high rain rates by Hudson (1963), Blanchard and Spencer (1970), Srivastava (1971) and Uijlenhoet et al. (2003). According to these studies, number-controlled regimes are likely to occur during the growth phase of warm rain processes, in intense tropical rainfall, strongly organized midlatitude storm systems or persistent orographic rainfall. In the literature, number-controlled rainfall regimes are often associated with equilibrium DSDs (Srivastava, 1971; List et al., 1987), toward which DSDs should converge over time after being released at cloud base. Several numerical and observational studies have looked at the conditions under which such equilibrium states can be reached, how long they take to emerge and what their shapes are (Zawadzki and De Agostinho Antonio, 1988; Sauvageot and Lacaux, 1995; Brandes et al., 2004; D'Adderio et al., 2018). For example, Zawadzki and De Agostinho Antonio (1988) showed that DSDs in intense, tropical rainfall in Brazil come close to equilibrium shape. Similarly, D'Adderio et al. (2018) detected many equilibrium DSDs in heavy convective events at intensities between 20 and 40 mm h−1. Interestingly, while number-controlled regimes and equilibrium DSDs share similar properties, it is worth pointing out that these two concepts are not perfectly equivalent to each other. Equilibrium DSDs are number controlled by definition. However, just because two consecutive DSDs share the same size distribution does not necessarily imply that they are at equilibrium. Proportionality between DSDs could also be the result of very steady rainfall production mechanisms or homogeneous space–time structures.
Compared to number-controlled regimes, size-controlled regimes are substantially more elusive and controversial. They have been speculated to occur in stratiform-like drizzle (Rogers et al., 1991) and warm orographic clouds during phases where raindrops are neither created nor destroyed but steadily grow by accretion from cloud droplets (Steiner et al., 2004). Carbone and Nelson (1978) also suggested that size-controlled regimes may arise during the dissipating stage of convective cells, while Gunn and Marshall (1955) think they could arise due to size sorting in periods of strong vertical winds or turbulence. However, these are mostly speculations, and very little empirical evidence has been provided so far to support these hypotheses.
1.1 Background
The existence (or absence) of special rainfall regimes has important theoretical and practical implications. Previous studies have shown that DSDs can exhibit large spatial and temporal variations at storm scale. But the dynamics and magnitude of these variations are still poorly understood and constrained. The knowledge that special rainfall regimes exist could also play an important role in advancing microphysical parameterizations and statistical representations in numerical weather models. For example, modelers could compare two microphysical schemes to see whether they can successfully reproduce such special rainfall regimes or not. Hopefully, the increased understanding about rainfall microphysics will also lead to better, overall, DSD models and scaling laws for linking rainfall-integral parameters such as reflectivity and rain rate. From a practical point of view, the ability to identify and diagnose special regimes could also be useful to improve quantitative precipitation estimation algorithms (e.g., by constraining the prefactor and exponent in the Z–R relationship), reduce the number of independent parameters in DSD retrieval algorithms based on polarimetric weather radar data, or improve the statistical modeling of the co-fluctuations between raindrop number concentrations and raindrop size distributions in stochastic rainfall simulators.
Despite their relevance, only a few methods for detecting number- and size-controlled regimes based on disdrometer and radar data have been proposed so far. Steiner et al. (2004) proposed a method for identifying special rainfall regimes through the relationship between the radar reflectivity Z (in mm6 m−3) and the rainfall rate R. They emphasized that in a number-controlled regime the exponent β in the equation Z=αRβ should be equal to 1, whereas in a size-controlled regime β should be equal to 1.63. The application of this technique can, however, be rather challenging. The substantial measurement uncertainty that impacts Z–R measurements, along with the reliance on strong modeling assumptions (specifically, the fact that Z–R relationships can be approximated by a power law) imply that large sample sizes are needed to reliably estimate α and β. Consequently, obtaining a β value of 1 or 1.63 does not inherently imply the presence of a special regime, as these particular values could also arise by chance or as a result of measurement uncertainty.
A second method for detecting special regimes pioneered by Uijlenhoet et al. (2003) consists of separating DSDs into different groups of rain rates for which the single-moment DSD normalization framework by Sempere-Torres et al. (1994) can be applied. This leads to a series of exponents describing the scaling properties of the DSDs as a function of rainfall rate. Using this technique, Uijlenhoet et al. (2003) showed that DSDs tend to shift toward a more number-controlled regime at higher rainfall intensities. However, a primary concern with the approach, aside from the fact that it also requires substantial sample sizes, is that it combines DSDs from various events into a single group. In other words, it provides only a rudimentary overview of the average, climatological scaling properties of DSDs. While this is valuable for modeling purposes, it is very different from studying the genuine, dynamical changes in DSDs and rainfall rates within a specific event.
Interestingly, the study conducted by Uijlenhoet et al. (2003) also features two heavy rain events, for which the authors conducted a more detailed analysis of the temporal variations in rain rate and DSDs. According to the authors, at least one of these events displayed signs of potentially being governed by a number-controlled regime. Nevertheless, it is important to note that the authors did not use any formal statistical tests to confirm the presence of a special regime, and they also pointed out that they may have been a modest correlation between drop concentration and mean drop diameter, which suggests that the underlying rainfall regime may not have been purely number controlled. Given the considerable measurement uncertainty and the absence of an independent data source, such as a second disdrometer, the question of whether the authors indeed captured a number-controlled regime remains unanswered.
1.2 Reality or mirage?
To date, the peer-reviewed literature on size- and number-controlled rainfall regimes remains notably scarce, and no compelling observational evidence of an authentic, number- or size-controlled regime has been presented. The presented evidence consists primarily of anecdotal accounts or relies on highly simplified numerical simulations of DSDs along one-dimensional rain columns. Moreover, the few observational studies asserting the existence of special rainfall regimes all suffer from substantial methodological shortcomings, including (1) limited sample sizes, (2) a lack of comprehensive uncertainty assessment and (3) an absence of proper validation through an independent secondary data source. In addition to the issues above, there also appears to be a lot of ambiguity in the definitions themselves. For example, in most studies, it remains highly unclear whether the definitions of number- or size-controlled regimes are framed in the context of a mobile reference framework (commonly known as the Lagrangian perspective) or relative to a stationary observer positioned on the ground (referred to as the Eulerian perspective). While this may sound like a subjective choice, and in theory either viewpoint is permissible, researchers should articulate their choices more explicitly. This is imperative as the temporal variability of DSDs is likely to exhibit substantial differences when observed from these two distinct frameworks.
Given the problems mentioned above, I believe that there are at least three main issues that need to be addressed: (1) a clear definition of what constitutes number- and size-controlled regimes in a given reference framework, (2) a rigorous methodology for identifying special rainfall regimes based on observational evidence, and (3) a proper way to validate results by taking into account measurement uncertainty and sampling effects. The validation part holds significant importance, as assertions founded solely on data from a single sensor are susceptible to a range of statistical artifacts and human misjudgments. In this study, we address these concerns by harnessing the benefits of a newly acquired dataset of co-located DSD measurements from two disdrometers at the Cabauw Experimental Site for Atmospheric Research. The ability to cross-check detections between these two sensors substantially increases our confidence in the results, allowing us to draw much stronger conclusions than in previous studies. The primary research questions under investigation are the following. Do we see empirical evidence of number- or size-controlled rainfall regimes in the Netherlands? If yes, what type of events do these regimes correspond to? How frequent are they? How long do they last? And what are the conditions under which they occur?
2.1 Disdrometer data
The DSD data used in this study were collected by two co-located Parsivel2 (particle size and velocity) optical disdrometers (Löffler-Mang and Joss, 2000; Tokay et al., 2014) at the Cabauw Experimental Site for Atmospheric Research. The data span a period of approximately 2.5 years, between 1 January 2021 and 31 July 2023. The sampling resolution of the data is 1 min. To assess measurement uncertainty and mitigate biases due to wind effects, the laser beams of the two disdrometers are oriented in perpendicular directions (see Fig. 1). The DSD data are not published yet but are available upon request to the author.
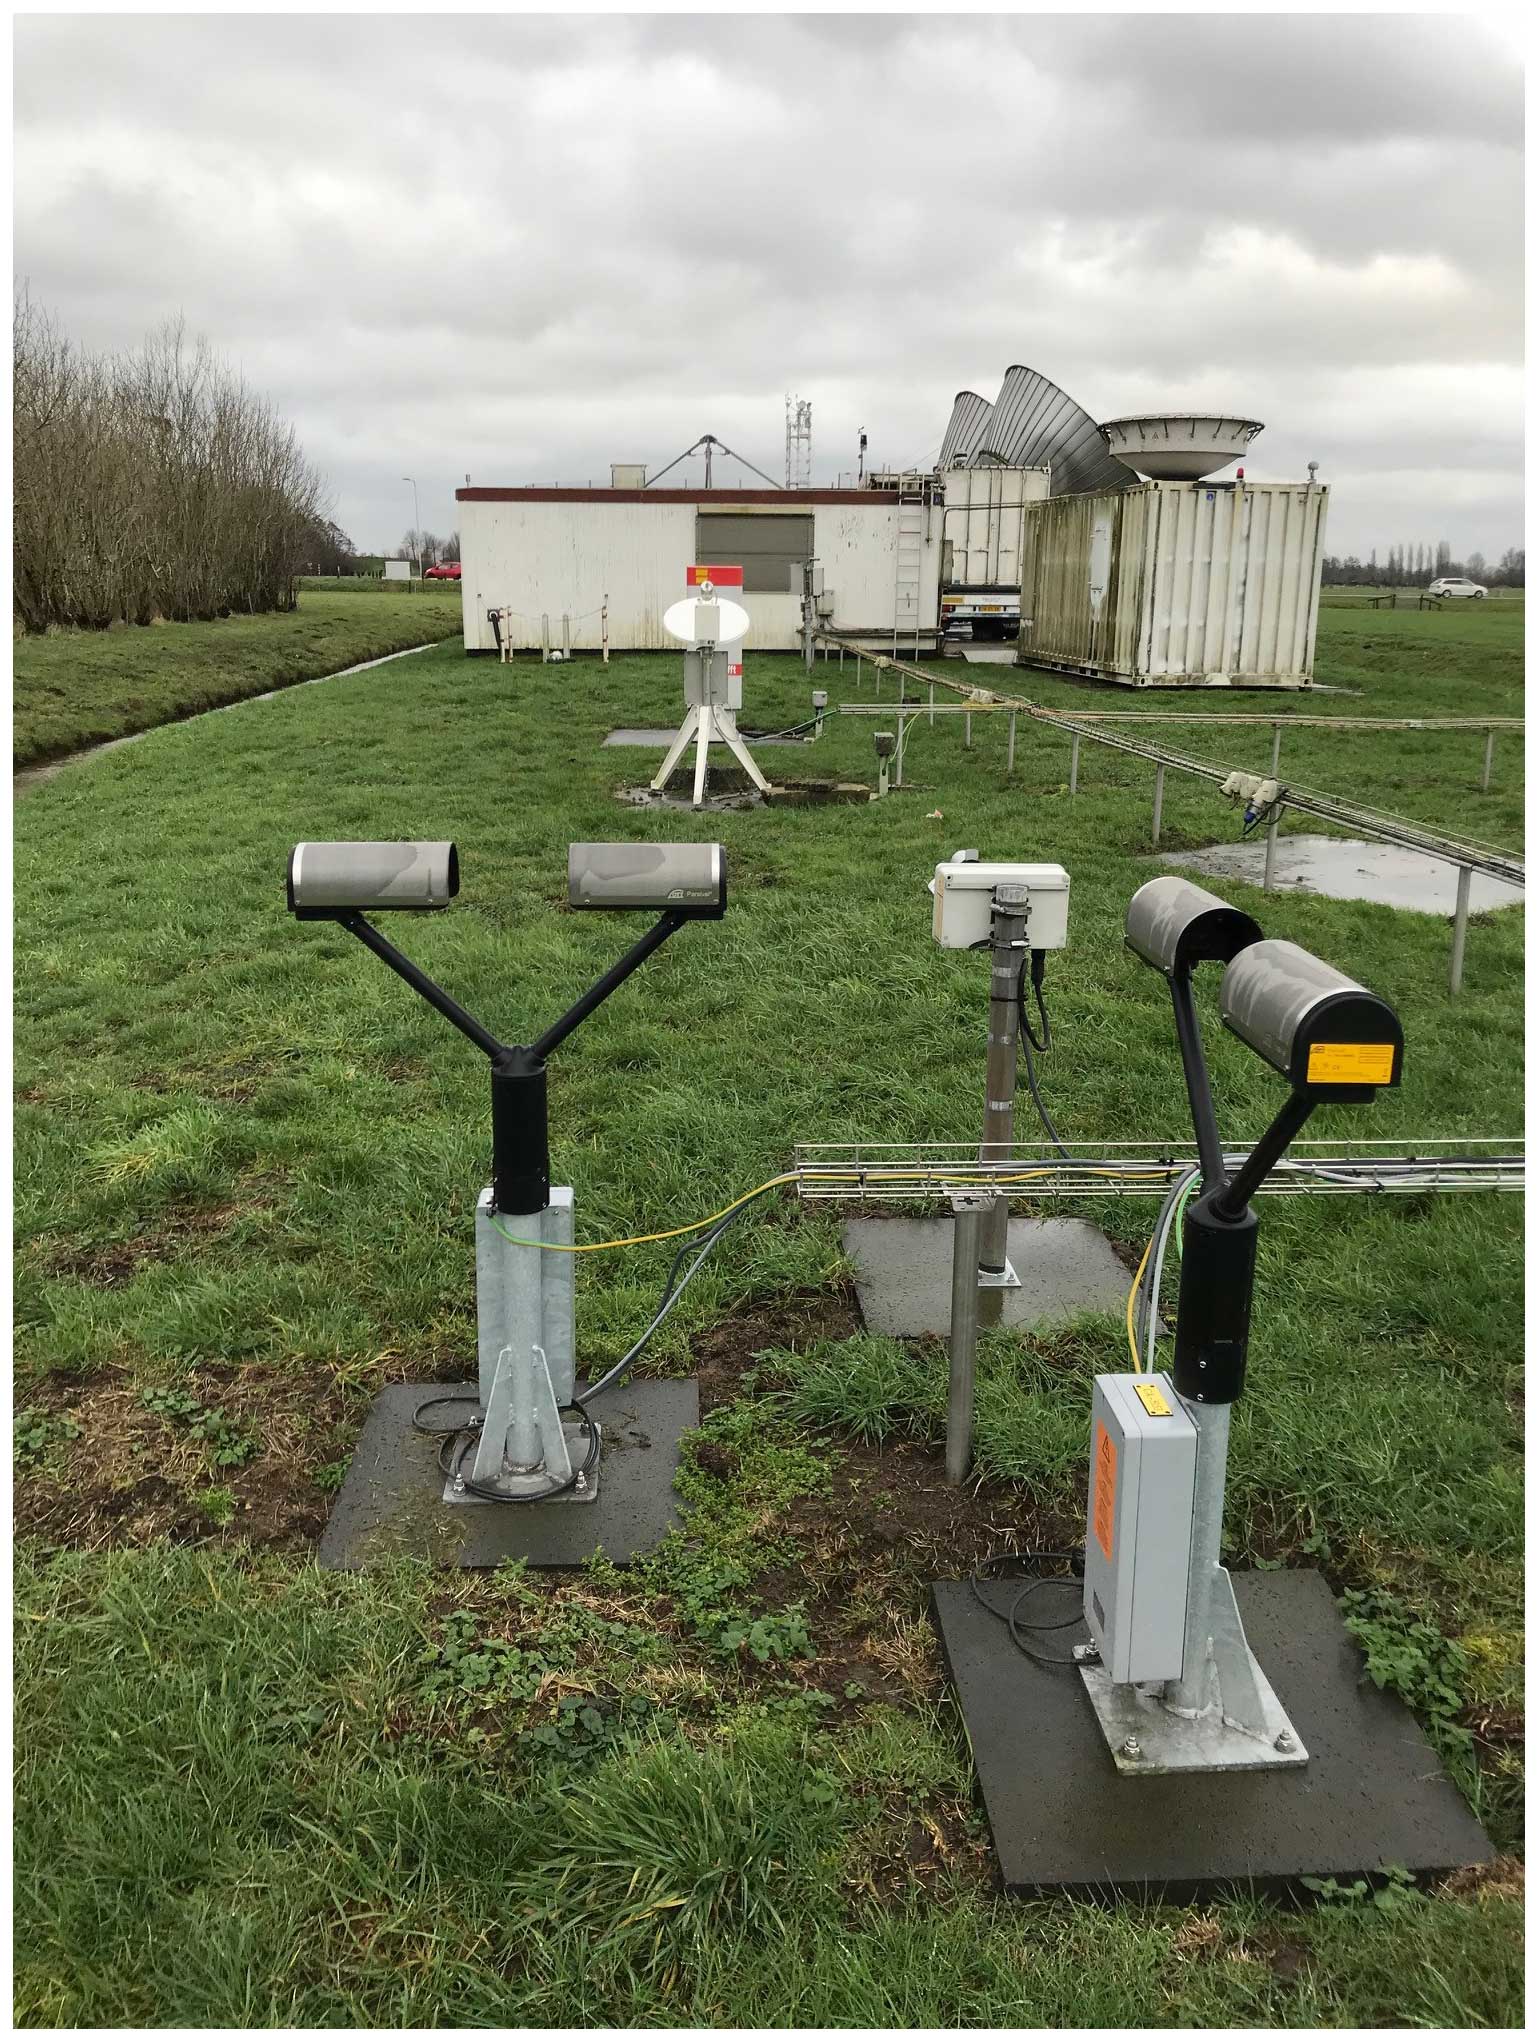
Figure 1Parsivel2 disdrometers at the Cabauw Experimental Site for Atmospheric Research in the Netherlands. The micro-rain radar is visible in the background.
2.2 Micro-rain radar data
In addition to the disdrometer data, we also use time–height profiles of a vertically pointing micro-rain radar (MRR-Pro by Metek GmbH). The MRR is located within a few meters of the two disdrometers (see Fig. 1). The sampling resolution is 10 s, with a 35 m range resolution and a maximum range of 4.5 km. The MRR provides valuable data for understanding the dynamics of rainfall and associated microphysics (Peters et al., 2002; Kim and Lee, 2016; Wen et al., 2016; Wang et al., 2017). The main variables used in this study are the attenuation-corrected reflectivity Z (in dBZ) and rain rate R (in mm h−1). In additional to that, the raw Doppler spectrum of the MRR can be used to retrieve the DSD at each range gate through the link between the size and fall velocity of raindrops. More information about this dataset and how to download the data can be found in the data catalog of the KNMI (Royal Netherlands Meteorological Institute) Data Platform. See the “Data availability” section for more information about how to access this dataset.
2.3 Weather data
In addition to the disdrometers and the MRR, we also consider basic 10 min weather data from a meteorological tower located approximately 150 m away from the disdrometers. The variables of interest include air temperature, dew point temperature, wind speed and wind direction at seven different heights from the ground up to 200 m (see the “Data availability” section for more information about how to access this dataset). However, for this study, only the measurements at the ground level were taken. The weather data are used to provide additional context and better understand the environmental conditions under which the special rainfall regimes detected by the disdrometers occurred.
3.1 Definition
In this paper, all special regimes are defined from the vantage point of a fixed observer on the ground. A number-controlled regime corresponds to a time frame during which the rainfall rate R, as defined in Eq. (2), varies by at least 1 mm h−1 while f(D) in Eq. (1) remains constant. Conversely, a size-controlled regime is defined as a time period over which R fluctuates by at least 1 mm h−1 while the total drop number concentration NT remains constant. The 1 mm h−1 threshold on the range R is used to avoid trivial cases during which the entire rainfall process is stationary and both NT and f(D) are constant at the same time. The fact that everything is defined from the perspective of a fixed observer makes it more challenging to link the regimes on the ground to microphysical processes occurring along the horizontal and vertical dimensions, such as drop coalescence and breakup. However, this fixed observation framework is imperative for conducting experimental studies based on disdrometer data. In the Results section, we delve deeper into the implications of this choice and explore in greater detail how it may influence the conclusions.
3.2 Moving time window approach
The proposed method for identifying number- and size-controlled regimes is very simple. A 15 min moving time window is applied to the 1 min disdrometer data in order to estimate the local (co-)fluctuations in DSD-related quantities. The goal is to find short time intervals over which NT or f(D) remain approximately constant. The length of the time window is somewhat subjective, but experience shows that 15 min provides a sufficiently large sample size to capture meaningful temporal variations in the data while still maintaining a reasonably high temporal resolution. For completeness, some additional experiments using shorter time windows of 10 and 5 min were also conducted (see Sect. 4.5). To avoid issues due to intermittency, we exclude all time intervals in which one or more of the 15 rain rate values is zero. The elimination of dry periods within the designated time window guarantees equal sample sizes. It also avoids special cases in which two or more consecutive rain pulses separated by a few minutes of dry weather are erroneously attributed to the same rainfall regime.
3.3 Proxy for f(D)
Unfortunately, since f(D) is a distribution, it is not trivial to quantify its temporal changes over the moving window. One approach would be to calculate the average dissimilarity of f(D) with respect to the average distribution over the time window using some form of statistical metric such as the Kolmogorov–Smirnov test or Kullback–Leibler divergence. However, such an approach can be subject to large uncertainties due to the fact that most raindrops are small and that the Parsivel2 is known to have issues when it comes to accurately measuring the concentration of small drops. Therefore, a much simpler approach in which the mass-weighted mean drop diameter Dm and its changes over time are used as a proxy for studying the changes in f(D). The mass-weighted mean drop diameter Dm puts more weight on the larger drop sizes, which are the most important for understanding variations in rainfall rates.
Because it is a ratio between two successive moments, Dm is independent of NT. This means that if f(D) is constant, Dm must be constant as well. A constant Dm does, however, not necessarily imply a constant f(D), although it is very difficult to imagine a plausible scenario in which f(D) could change significantly without causing any fluctuations in Dm. In case of doubt, one can always use a second, characteristic drop size in addition to Dm, such as the mean or median drop diameter. If multiple characteristic drop sizes are constant, then f(D) is very likely to be constant.
3.4 Sample estimates of NT, Dm and R
The Parsivel2 optical disdrometer counts the number of drops crossing the measurement surface using 32 non-linearly spaced diameter and velocity classes. From these raw counts, the sensor derives the theoretical drop number concentrations Ni () across 32 drop diameter classes Di (in mm) for every 1 min interval. This is known as “Field 90” in the documentation of the OTT Parsivel2. Based on these drop concentrations, the total number concentration NT, mass-weighted mean drop diameter Dm and rain rate R can be derived.
where ΔDi (mm) denotes the width of the ith drop diameter class of the Parsivel2 disdrometer, and v(Di) (m s−1) is the average terminal fall velocity of a raindrop of size Di. Note that because raindrops cannot be arbitrarily large, only the diameter classes up to 7 mm are used. Because the definition of number- and size-controlled regimes implicitly assumes a deterministic relationship between the size and velocity of a raindrop, we prefer to recalculate the rain rate through Eq. (6) rather than directly taking the values provided by the Parsivel2 disdrometer (i.e., “Field 01” in the Parsivel2 documentation). The two rain rates are almost the same, but due to turbulence, collisions and breakup, the actual fall velocity of a raindrop may occasionally deviate from the theoretical one. This is a problem because it means that even if the drop size distribution would be perfectly stationary, the rainfall rate could still fluctuate over time due to random changes in the fall velocities of raindrops. Technically speaking, the Parsivel2 records the velocity of every single raindrop, but after some preliminary analyses and testing, we decided that it would be easier to detect special regimes by using a fixed, deterministic fall velocity model by Beard (1976) rather than the actual fall velocities recorded by the disdrometer. For more information about this important issue and what could be done differently, the reader is referred to Sect. 4.6.
3.5 Moving window statistics
For each 15 min time window, the following statistics are computed:
-
The coefficients of variation and of and over the time window are computed, defined as the ratio between the standard deviation and the arithmetic mean.
-
The correlation coefficients and over the time window are computed. For , the Pearson correlation is used, while for the Spearman rank correlation is used. In addition to computing the value of the correlation coefficient, the cor.test() function in R-CRAN (R Core Team, 2023) is used to determine whether the sample correlations are significantly different from zero at the 5 % level. Note that the CV and correlations are only computed on time intervals for which all rain rates are strictly positive and varies by at least 1 mm h−1.
3.6 Detection rules
Number- and size-controlled regimes are detected using the following criteria:
-
Time intervals for which , and at the 5 % level are labeled as number controlled.
-
Time intervals for which , and at the 5 % level are size controlled.
The thresholds (–) and (–) can be set by the user to achieve a specific detection sensitivity or dynamically adapted to the characteristics of the data over the time window. In our case, the thresholds were set to be equal to the fifth quantile of the empirical distribution of and over the entire 2.5 years of data, which roughly corresponds to and . Experience shows that these thresholds work well for identifying the most interesting periods of almost constant NT or Dm while allowing for some residual variability due to measurement uncertainty. Note that there is little value in trying to optimize these thresholds since we are not interested in identifying all events but only the most promising cases with the strongest correlations and lowest coefficients of variation.
3.7 Cross-check with the other disdrometer
The detection algorithm described above is applied independently to each disdrometer by shifting the time window by 1 min at each step. Whenever a number- or size-controlled regime is detected, a cross-check with the other disdrometer is performed to assess the reliability of the detection. If both disdrometers detect the same regime within ± 1 min, the detection is labeled as “confirmed”. The tolerance of ± 1 min is used to account for the fact that the two internal clocks of the disdrometers are not always completely synchronized, which can lead to small time differences in terms of the timing of the individual detections.
3.8 Grouping into events
In the final step, all confirmed detections separated by less than 45 min of dry weather are aggregated into events. This grouping is only done for visualization purposes and for understanding the environmental conditions under which the regimes occur (e.g., the time of the year, temperature and wind speed). For each event, the data from the vertically pointing micro-rain radar are used to get additional insight into rainfall types, melting layer height (if it exists), vertical variability and DSD dynamics.
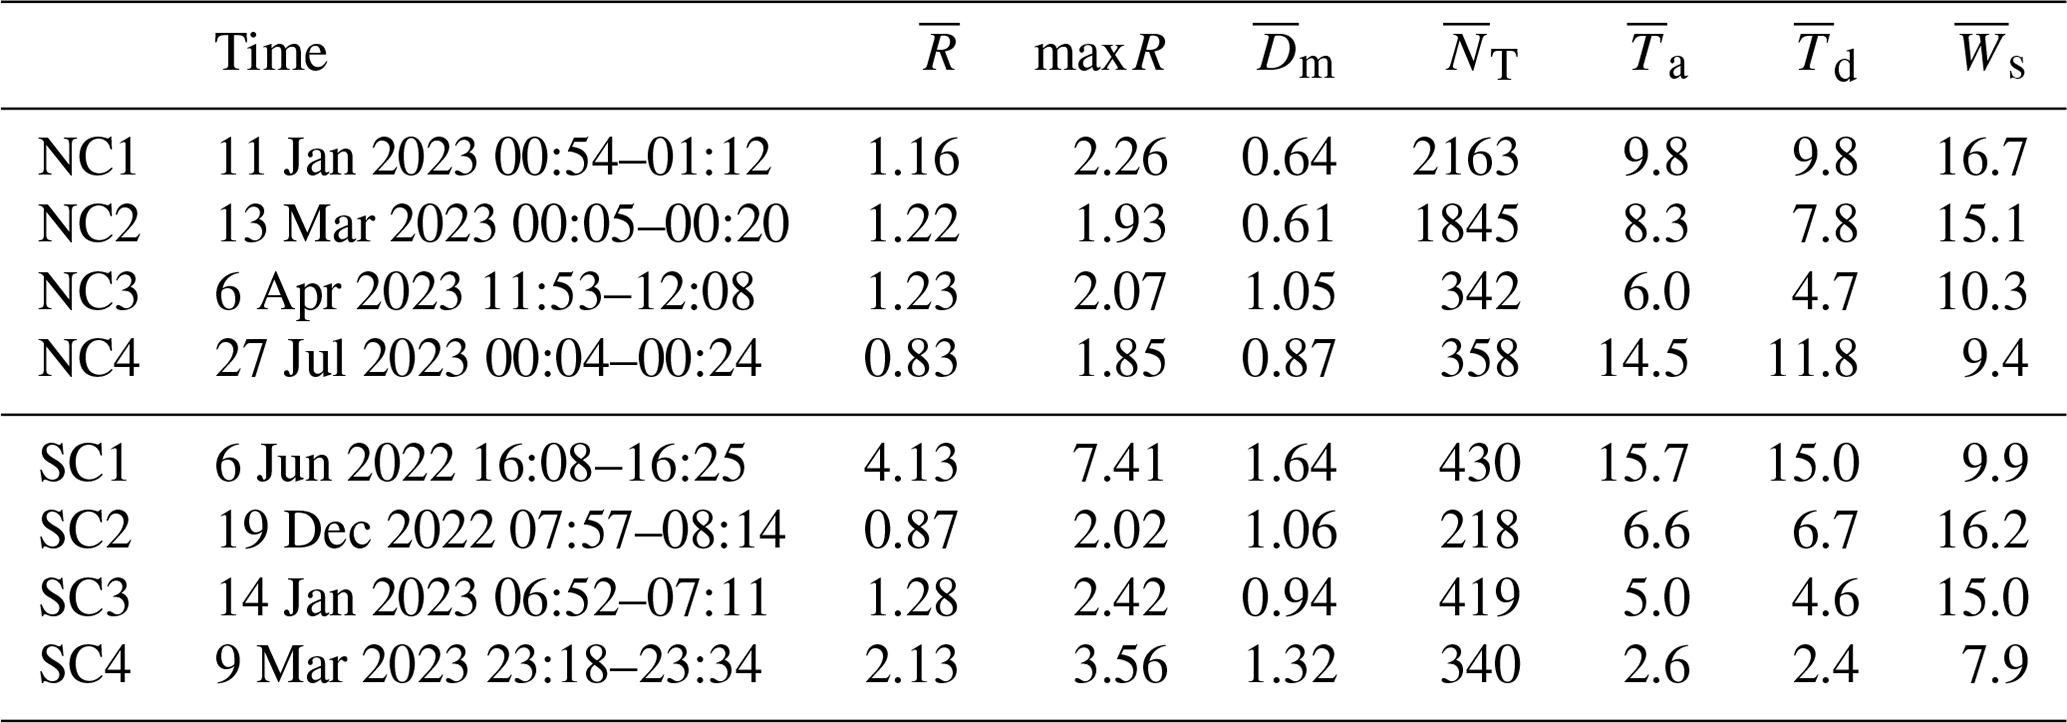
Table 1List of all number-controlled (NC) and size-controlled (SC) events with confirmed detections, together with average rain rate (in mm h−1), maximum rain rate (in mm h−1) and average mass-weighted mean drop diameter (in mm). is the average air temperature (in °C), is the average dew point temperature (in °C) and is the average wind speed (in m s−1) for the event, at the base of the nearby meteorological tower.
The following describes the results obtained after applying the moving-window-based detection method to the full dataset of co-located DSD measurements in Cabauw. In total, 376 time intervals of length 15 min with potential number-controlled rainfall regimes and 139 time intervals with potential size-controlled regimes were identified. However, only 11 time intervals with number-controlled regimes and 12 intervals with size-controlled regimes were confirmed after the cross-check with the other disdrometer. Therefore, the first question we must address is, why are more than 90 % of all detected special regimes not corroborated by the other disdrometer? Quality control shows that, in general, the two disdrometers agree very well with each other. There are no large biases, time shifts or data gaps that could explain such a high level of disagreement between the two sensors. Therefore, the large false alarm rate must be the result of large measurement noise and sampling uncertainty. Indeed, it is important to keep in mind that both the correlation coefficient and coefficient of variation over each time window are computed based on only 15 samples. This small sample size, combined with the large measurement uncertainty of the Parsivel2 disdrometer at 1 min resolution leads to a lot of statistical issues. For example, the time series of or are likely to exhibit spurious correlations with R due to correlated measurement noise (e.g., wind effects or internal processing/filtering), which can make it look like there is a special rainfall regime. Another serious issue in small sample sizes is the presence of high leverage points, that is, observations that have a large impact on the estimated correlation coefficient or coefficient of variation. For example, a single, large rainfall value within the 15 min window can be sufficient to create a high correlation between R and (or ). Our results show that the cross-check with the second disdrometer is essential in mitigating these statistical issues.
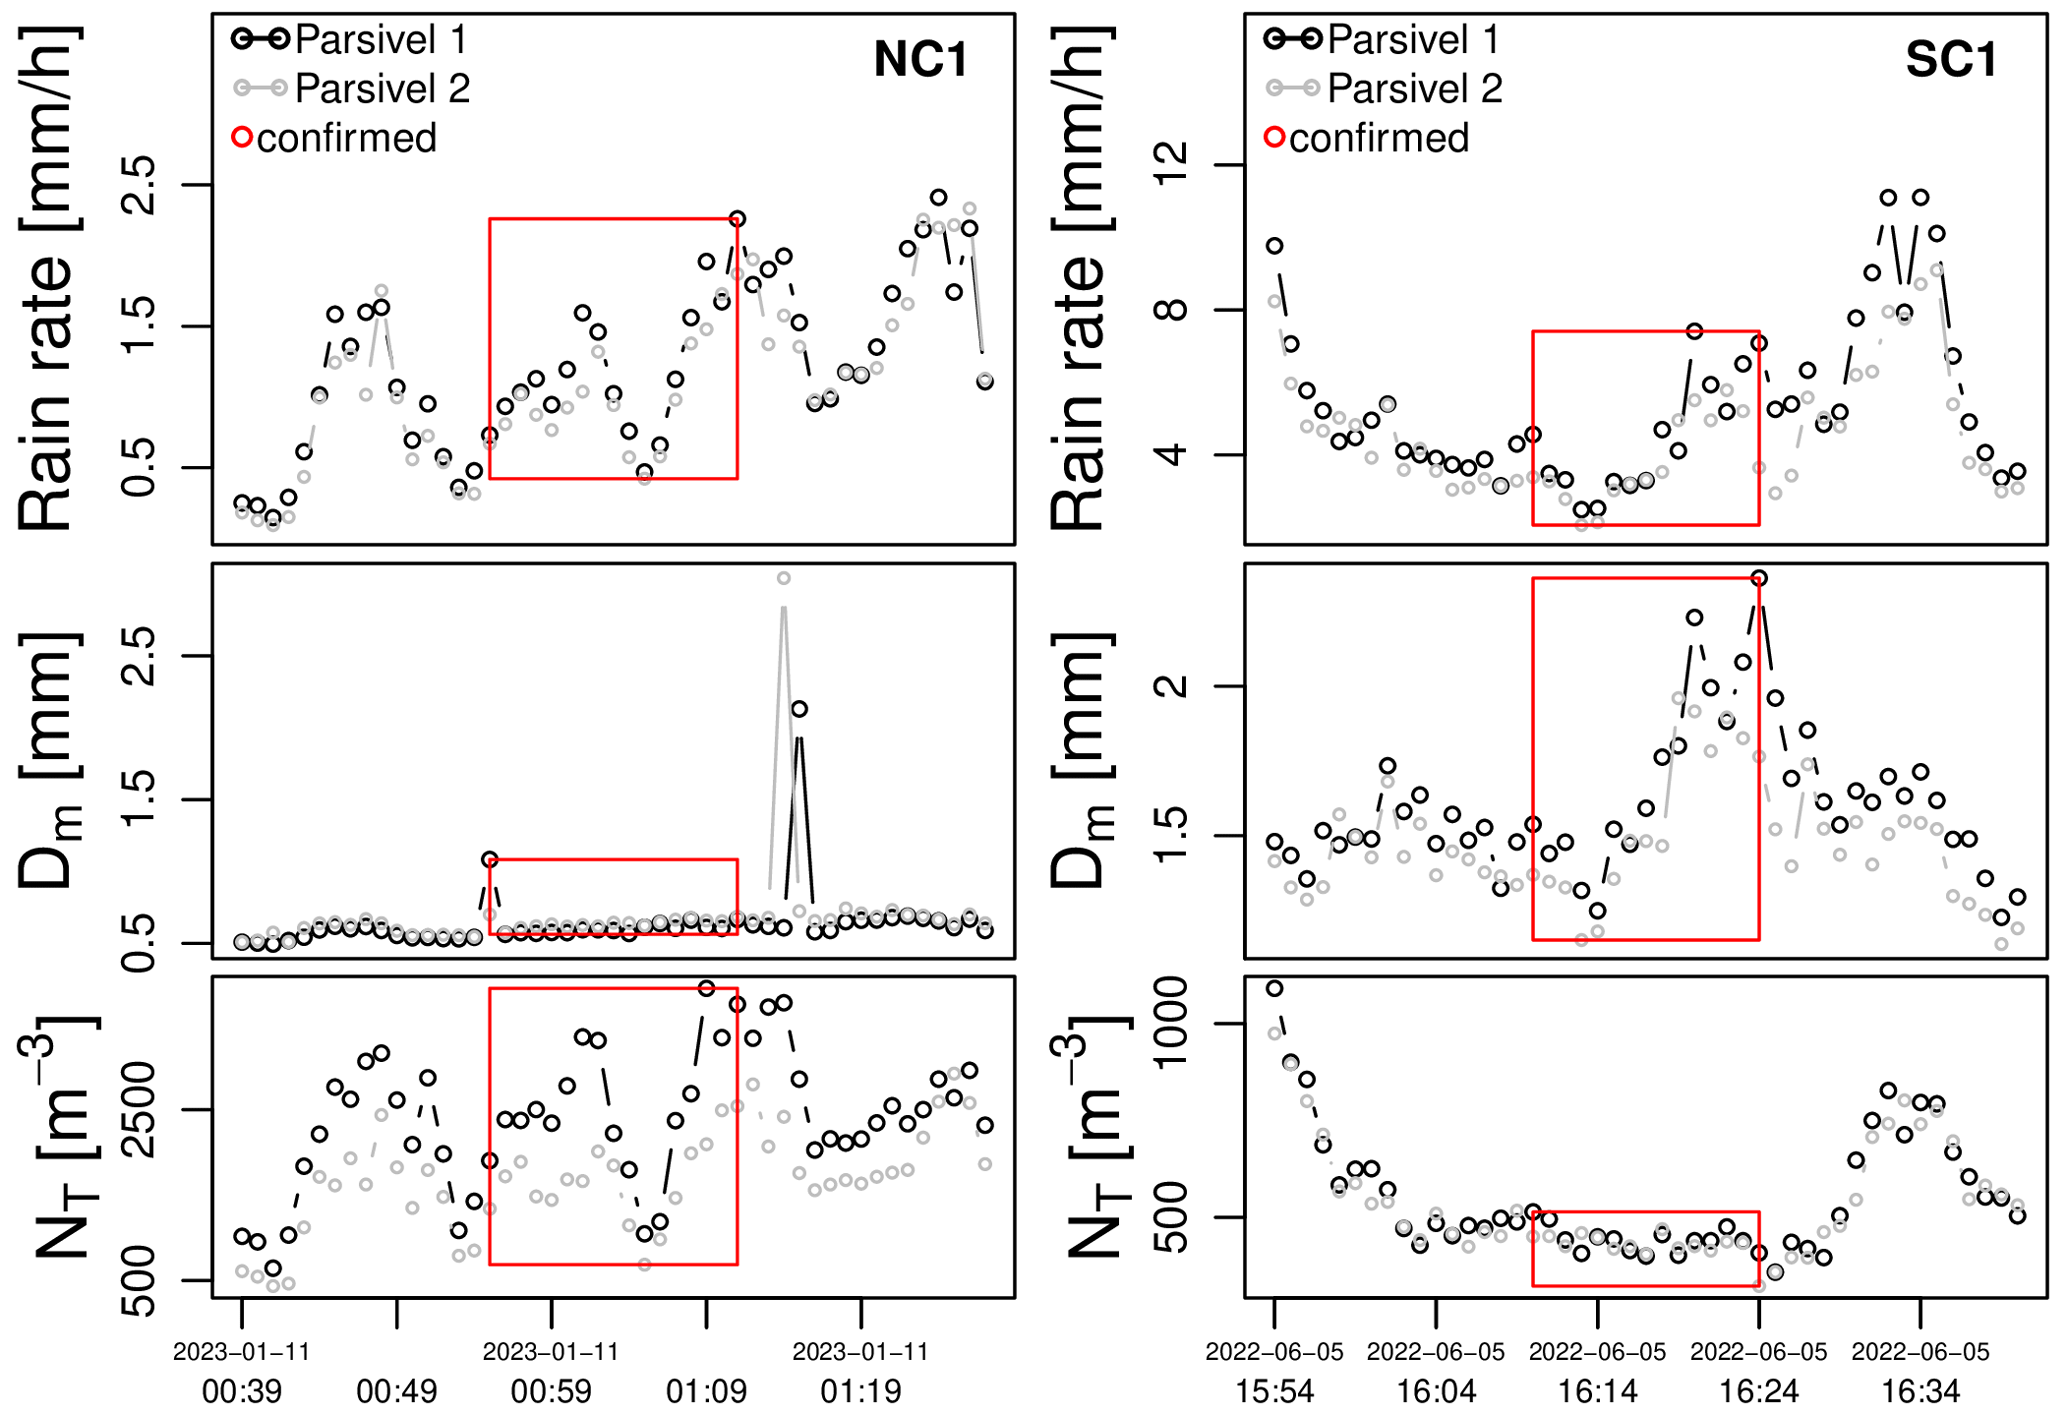
Figure 2Time series of R, Dm and NT for the first potential number-controlled regime (NC) and first potential size-controlled regime (SC).
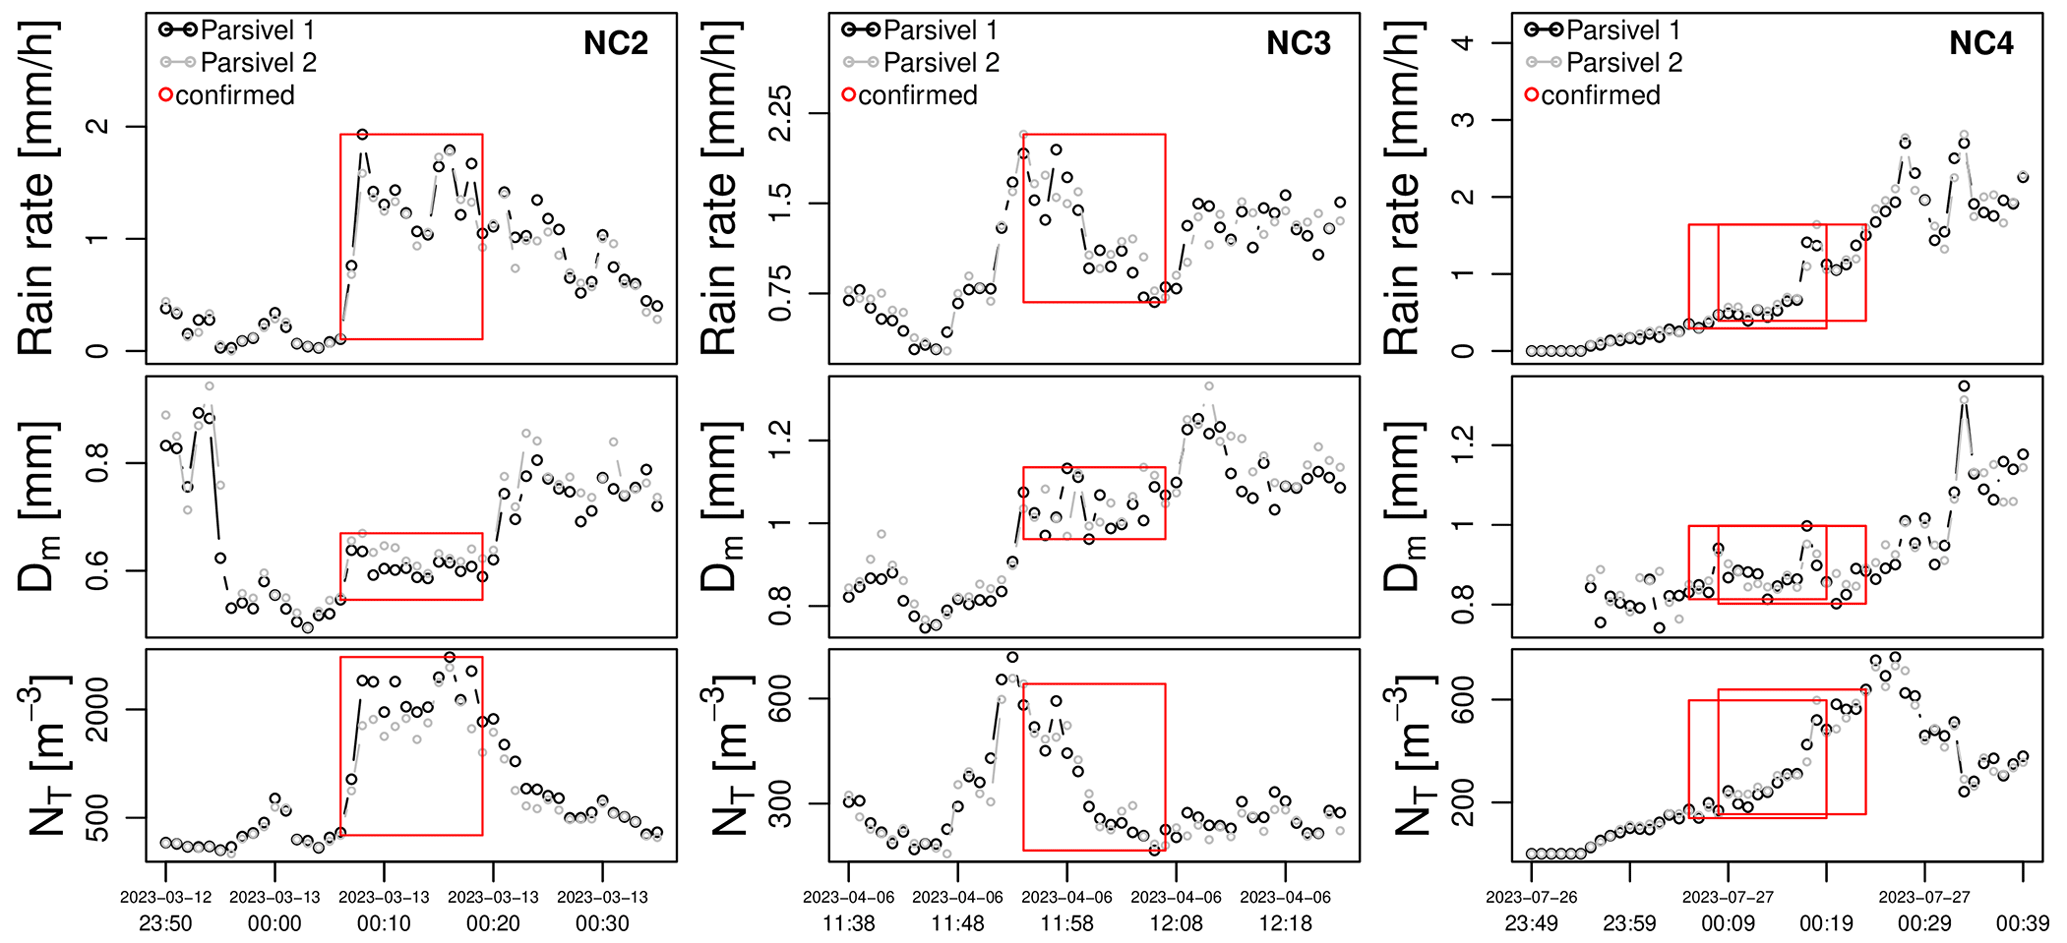
Figure 3Time series of R, Dm and NT for the second, third and fourth potential number-controlled regime (NC2–NC4).
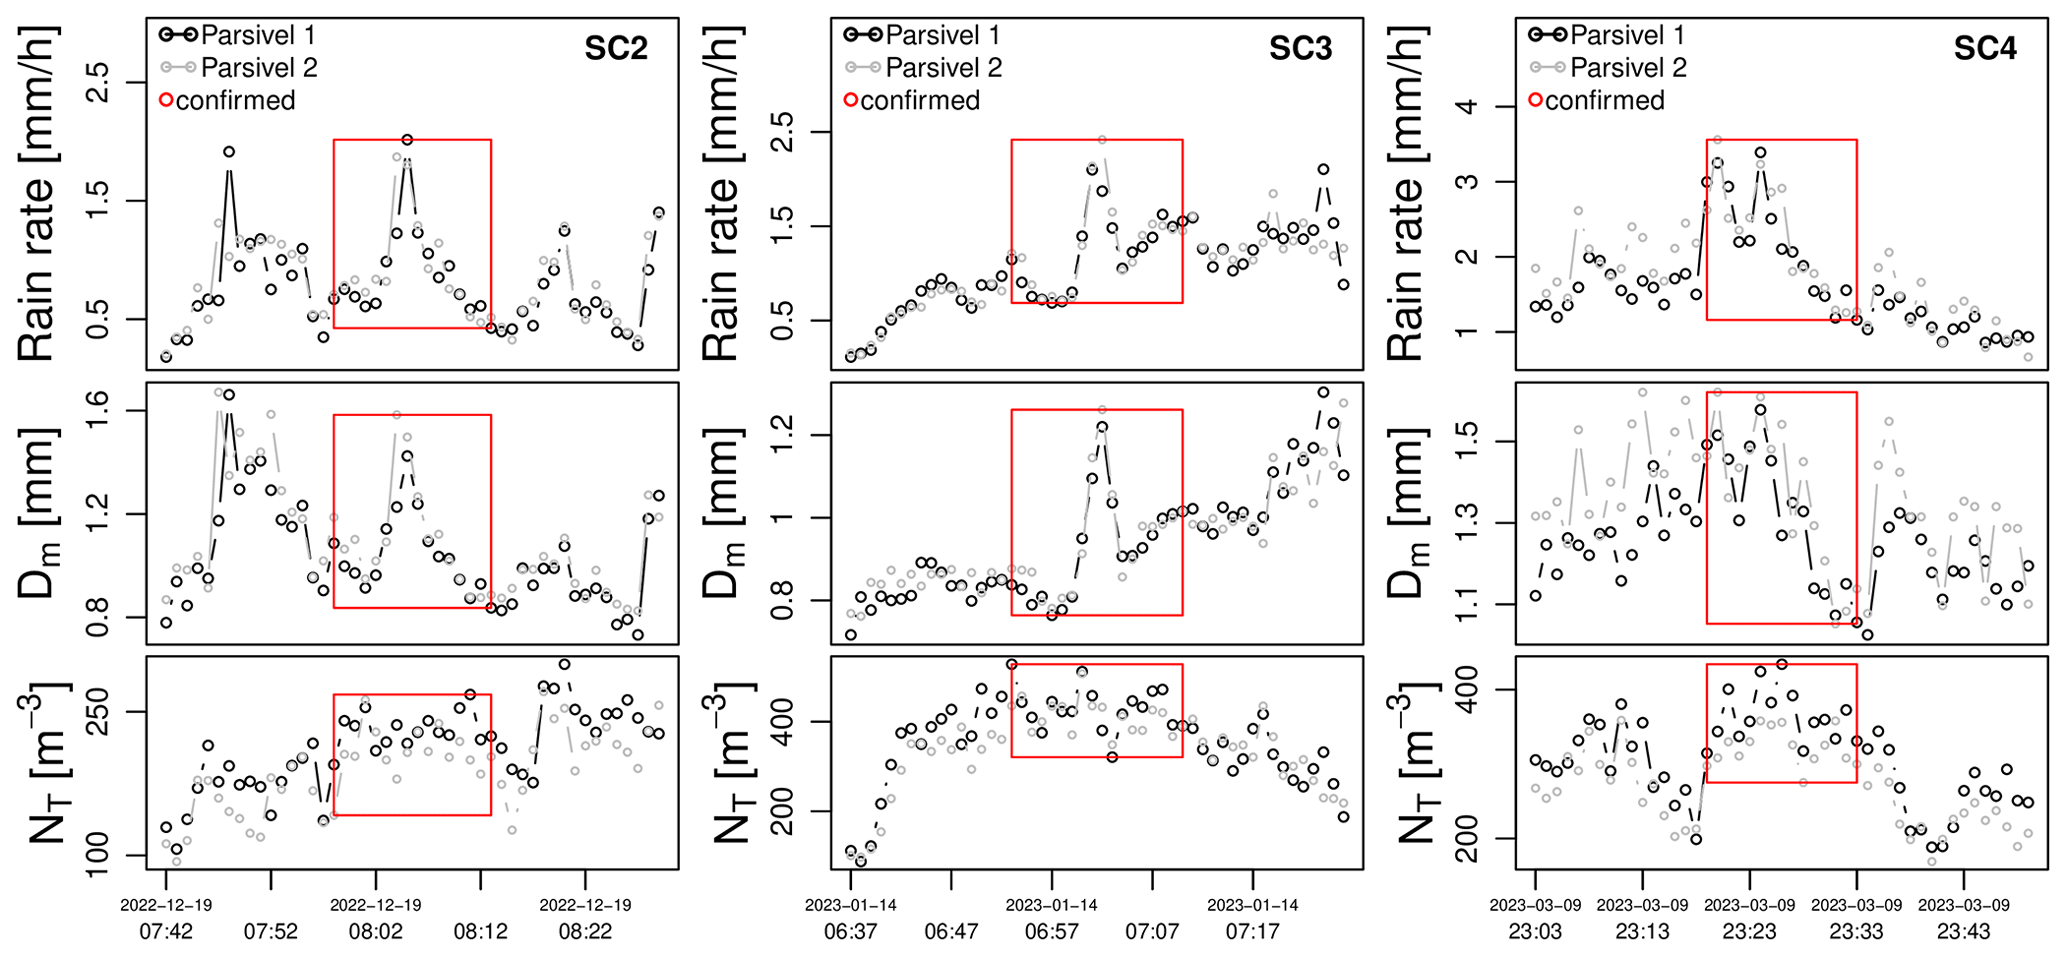
Figure 4Time series of R, Dm and NT for the second, third and fourth potential size-controlled regime (SC2–SC4).
4.1 Events with confirmed detections
Once the cross-checks were done, the 23 confirmed detections were grouped into distinct meteorological events (see Methods section). This resulted in four distinct events with number-controlled regimes and four events with size-controlled regimes. The characteristics of these events, such as the average rain rate, drop size, concentration, temperature and wind speed are summarized in Table 1. Figure 2 shows the time series of R, Dm and NT for the first event of each regime. The other time series for events 2, 3 and 4 can be found in Figs. 3 and 4.
Looking at Table 1, we can see that all four number-controlled regimes occurred within periods of low rainfall intensities in the order of 1–2 mm h−1. This is very surprising given that, in the literature, number-controlled regimes are predominantly associated with heavy, convective rain. We will come back to this issue shortly. Meanwhile, we can point out that three out of four number-controlled regimes were nocturnal events with small drop sizes and narrow size distributions ( between 0.61–0.87 mm). NC1–NC2 had relatively large drop number concentrations in the order of 2000 m−3, while NC3–NC4 had lower drop counts in the order of 350 m−3. No clear seasonal effects could be observed. The events are spread out over winter, spring and summer and cover a relatively broad range of temperatures (6.0–14.5 °C) and wind speeds (9.4–16.7 m s−1). In three out of four cases, the number-controlled regime coincided with the most intense part of the event, while for NC4 the regime occurred more toward the beginning of the event.
The four events with size-controlled regimes correspond to slightly higher rainfall intensities up to 7.41 mm h−1. Nonetheless, the average drop number concentrations remain quite low ( between 218 and 430 drops per cubic meter), and the mean drop sizes are low to moderate (0.94–1.64 mm). This aligns well with the theoretical expectations for size-controlled regimes in the literature and the notion that size-controlled regimes may occur during stratiform rain and drizzle. However, there was no discernable pattern in terms of the timing of the special regimes within the event. For SC1, the size-controlled regime was detected between two consecutive rainfall peaks. For SC2 and SC3, the regime coincided with the rainfall peak, while for SC4 it occurred shortly after the peak. Similarly, no specific seasonal pattern or correlation with temperature or wind speed could be observed.
4.2 Time–height profiles of MRR
Next, the vertical profiles of the micro-rain radar are used to get more insight into the rainfall types and space–time structures associated with the detected regimes. Figures 5 and 6 show the time–height profiles of reflectivity corresponding to the four number-controlled and four size-controlled regimes.
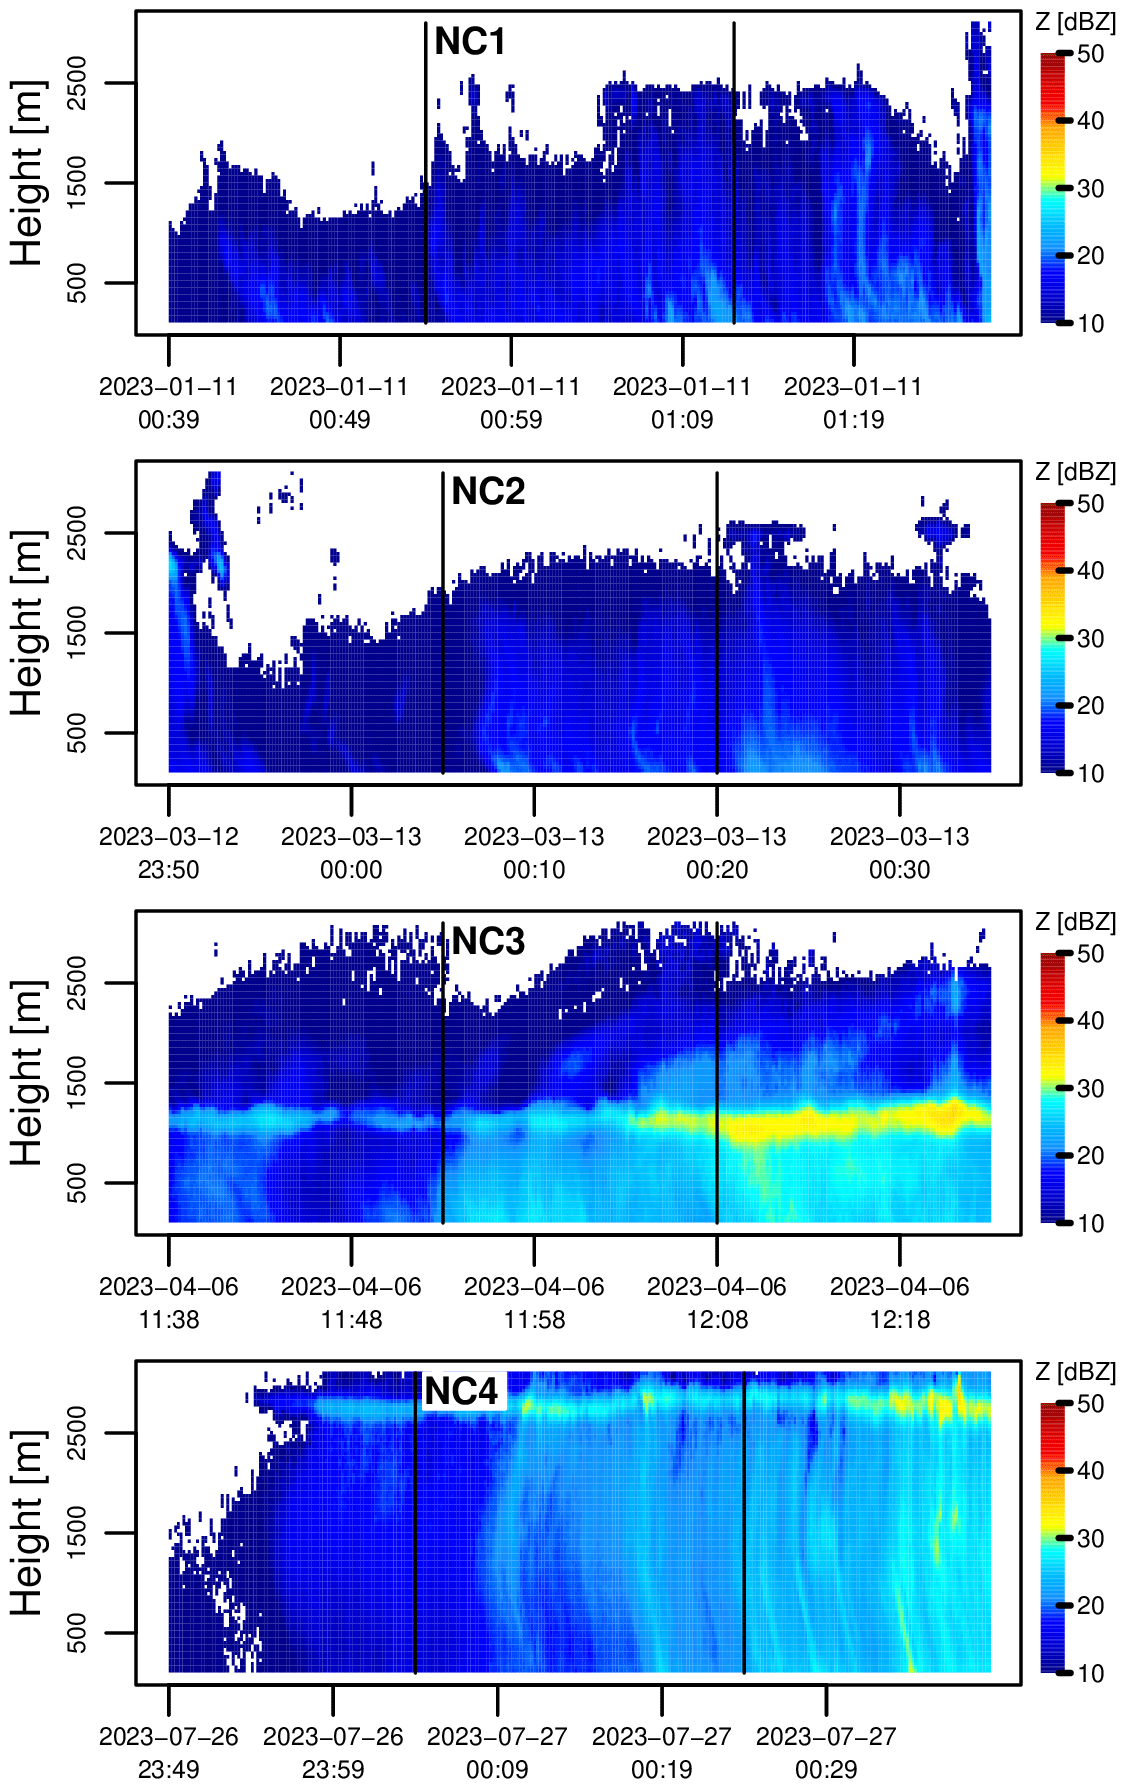
Figure 5Time–height profiles of (attenuation-corrected) reflectivity Z (in dBZ) from the micro-rain radar for the four number-controlled events identified by the Parsivel2 disdrometers. The black vertical lines represent the time intervals over which the confirmed detections occurred.
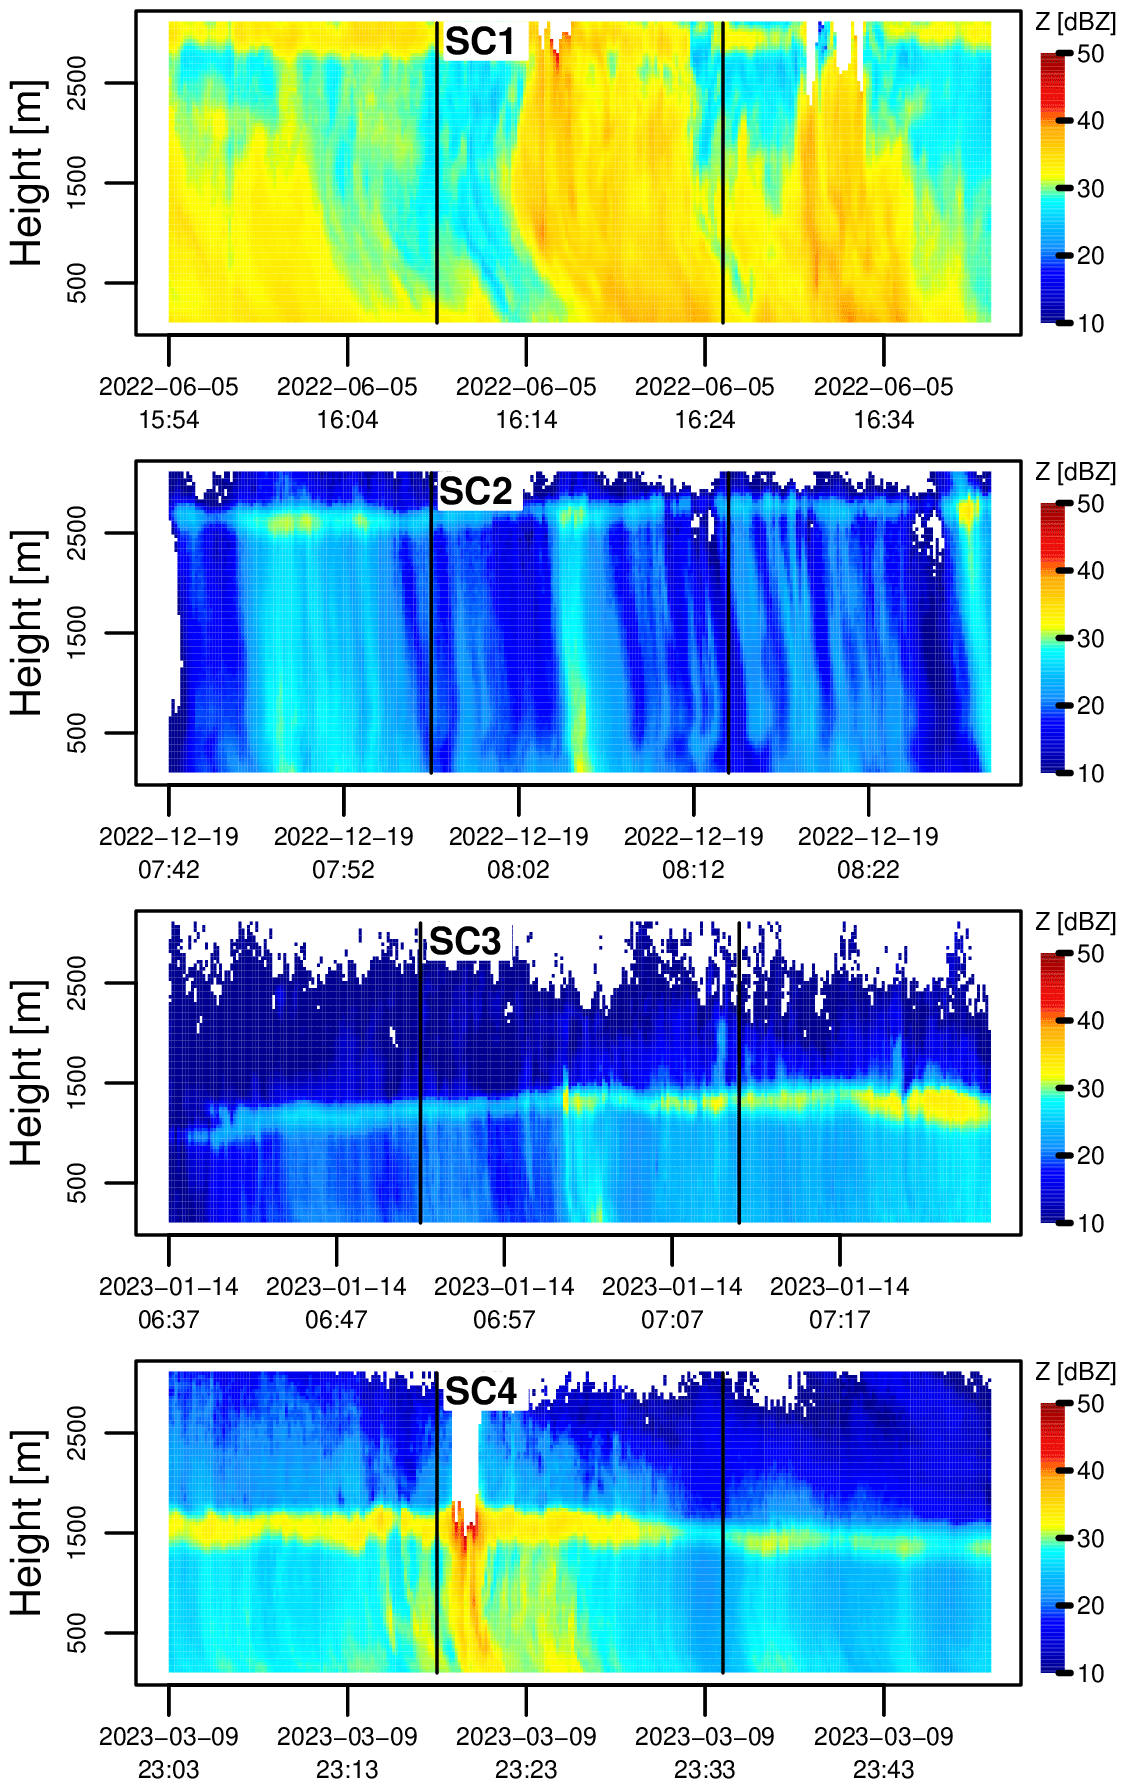
Figure 6Same as Fig. 5 but for the four size-controlled events identified by the Parsivel2 disdrometers.
One can see that with the exception of NC1–NC2, all identified events have a clear melting layer signature consistent with stratiform precipitation. As for NC1–NC2, they probably correspond to warm rain events in shallow cumulus clouds which are known to produce a large number of small drizzle droplets through collision–coalescence processes, as highlighted by the small values of Dm and high values of NT in Table 1. Interestingly, none of the eight time–height profiles of reflectivity show any distinct patterns that would suggest the presence of a special rainfall regime. However, since it can be rather difficult to conclude anything meaningful about DSD dynamics just by looking at time–height profiles of reflectivity, a more in-depth analysis of the MRR data was performed. To gain further insight, the Doppler velocity spectra from the MRR were used to retrieve the DSDs at specific heights, following the procedure described in Peters et al. (2005) and Reinoso-Rondinel and Schleiss (2021). The retrieved DSDs were then used to calculate key quantities such as Dm and NT at specific heights.
Unfortunately, the retrieved NT values from the MRR were too noisy and uncertain to be useful. This a common problem in radar-based DSD retrieval algorithms, and it can be explained by the fact that a radar mostly provides information about the higher-order moments of the DSD such as reflectivity (moment of order 6) and very little information about the lower-order moments such as NT (i.e., moment of order zero). Fortunately, the retrieved Dm values, which are independent of NT, were still reasonably good. While Dm alone is not sufficient to get a full picture of DSD variability, it can still be very useful to confirm the presence or absence of special rainfall dynamics. Indeed, for a number-controlled regime, the correlation between Dm and R should be zero, while it should be 1 for a size-controlled regime. Therefore, the Dm time series from the micro-rain radar can be used as an independent source of information to cross-check the special regimes detected by the disdrometers.
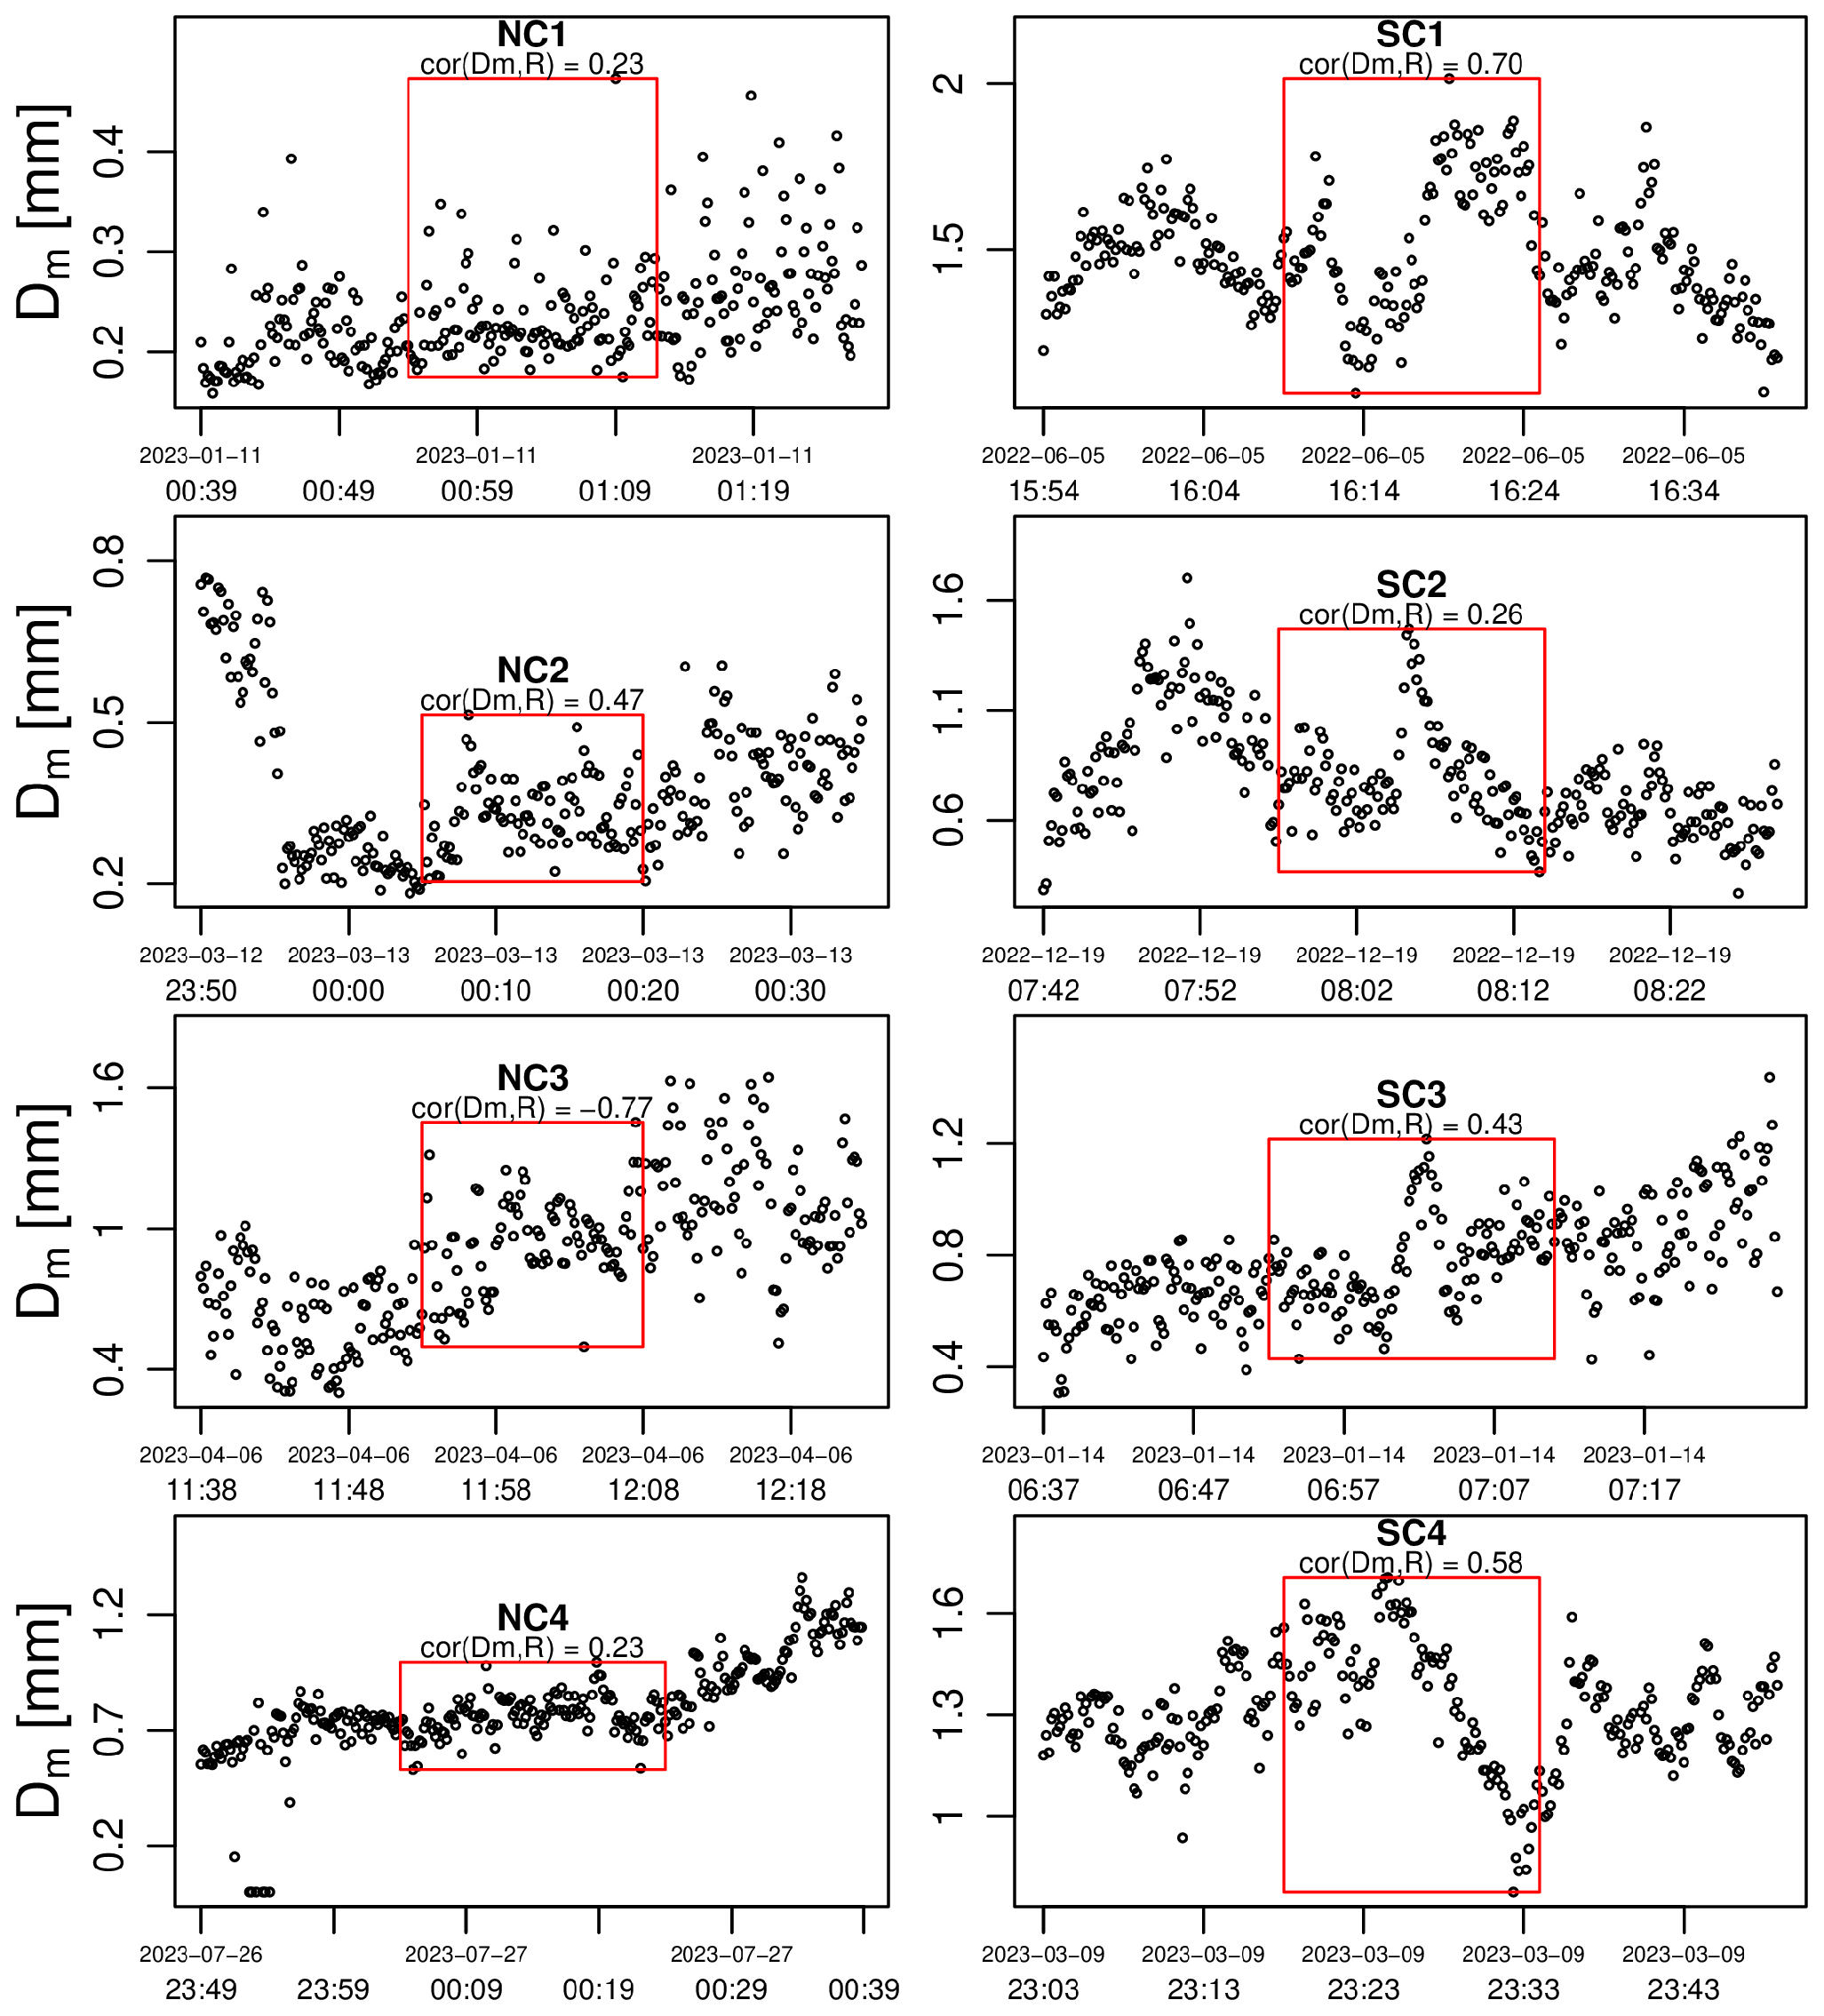
Figure 7Time series of mass-weighted mean drop diameter Dm (in mm) retrieved from the micro-rain radar at a height of 175 m above ground for the four number-controlled (NC) and size-controlled (SC) events identified by the Parsivel2 disdrometers. The red boxes represent the time intervals over which the Parsivel2 disdrometers detected a special regime.
Figure 7 shows the time series of retrieved Dm values from the MRR at a height of 175 for all eight events. The 175 m level corresponds to the fifth range gate in the MRR, which is the first range gate that is consistently free from ground clutter. The red boxes represent the time intervals over which the Parsivel2 detected a special regime. The micro-rain radar has a higher sensitivity to small drops than the Parsivel2, which means that the retrieved Dm values can be lower than the ones measured by the Parsivel2, especially during drizzle events such as NC1. The retrievals from the micro-rain radar also have higher temporal resolutions (i.e., 10 s compared to 60 s for the Parsivel2). Nonetheless, we can see that the Dm values retrieved from the micro-rain radar tend to be rather consistent with the ones measured by the Parsivel2 disdrometers. While this good agreement between the two sensors is encouraging, the correlation values between Dm and R in Fig. 7 clearly do not agree with the theoretical, expected values. For the number-controlled regimes, the correlation coefficient between Dm and R should be zero, while for the size-controlled events it should be 1. This is clearly not the case, except maybe for NC1 and NC4, where one could argue that the small correlation coefficient may be the result of random errors and uncertainties during the retrieval of Dm.
4.3 Z–R relations from MRR
Next, the diagnostic method proposed by Steiner et al. (2004) based on the relationship between the radar reflectivity Z and rain rate R is considered. Following the method, we calculated the exponents β in Z=αRβ for each event and compared them to the expected, theoretical values. According to theory, β should be equal to 1.0 for a number-controlled regime and 1.63 for a size-controlled regime.
Figure 8 shows the Z–R relations derived from the MRR measurements at a height of 175 m a.g. Note that the rain rate values used for this analysis were calculated based on the retrieved DSDs (see above). We can see that in three out of the four size-controlled events (i.e., SC2–SC4), the estimated β values agree rather well with the expected, theoretical value of 1.63. However, this result must be interpreted very carefully, since the estimated β values have large uncertainties in the order of ± 0.15 (see confidence intervals in Table 2 for more details). For the number-controlled events, on the other hand, none of the confidence intervals cover the theoretical value of 1.0. This, together with the previous analysis of Dm, casts substantial doubt on the physical reality of the special regimes identified by the disdrometers. It also underscores how different conclusions can be reached based on the choice of rainfall sensor or technique employed to identify the special regimes. Importantly, this conclusion is not limited to the 175 m height, and strong discrepancies between the detections from the MRR and the Parsivel2 disdrometer can be seen for the other range gates as well.
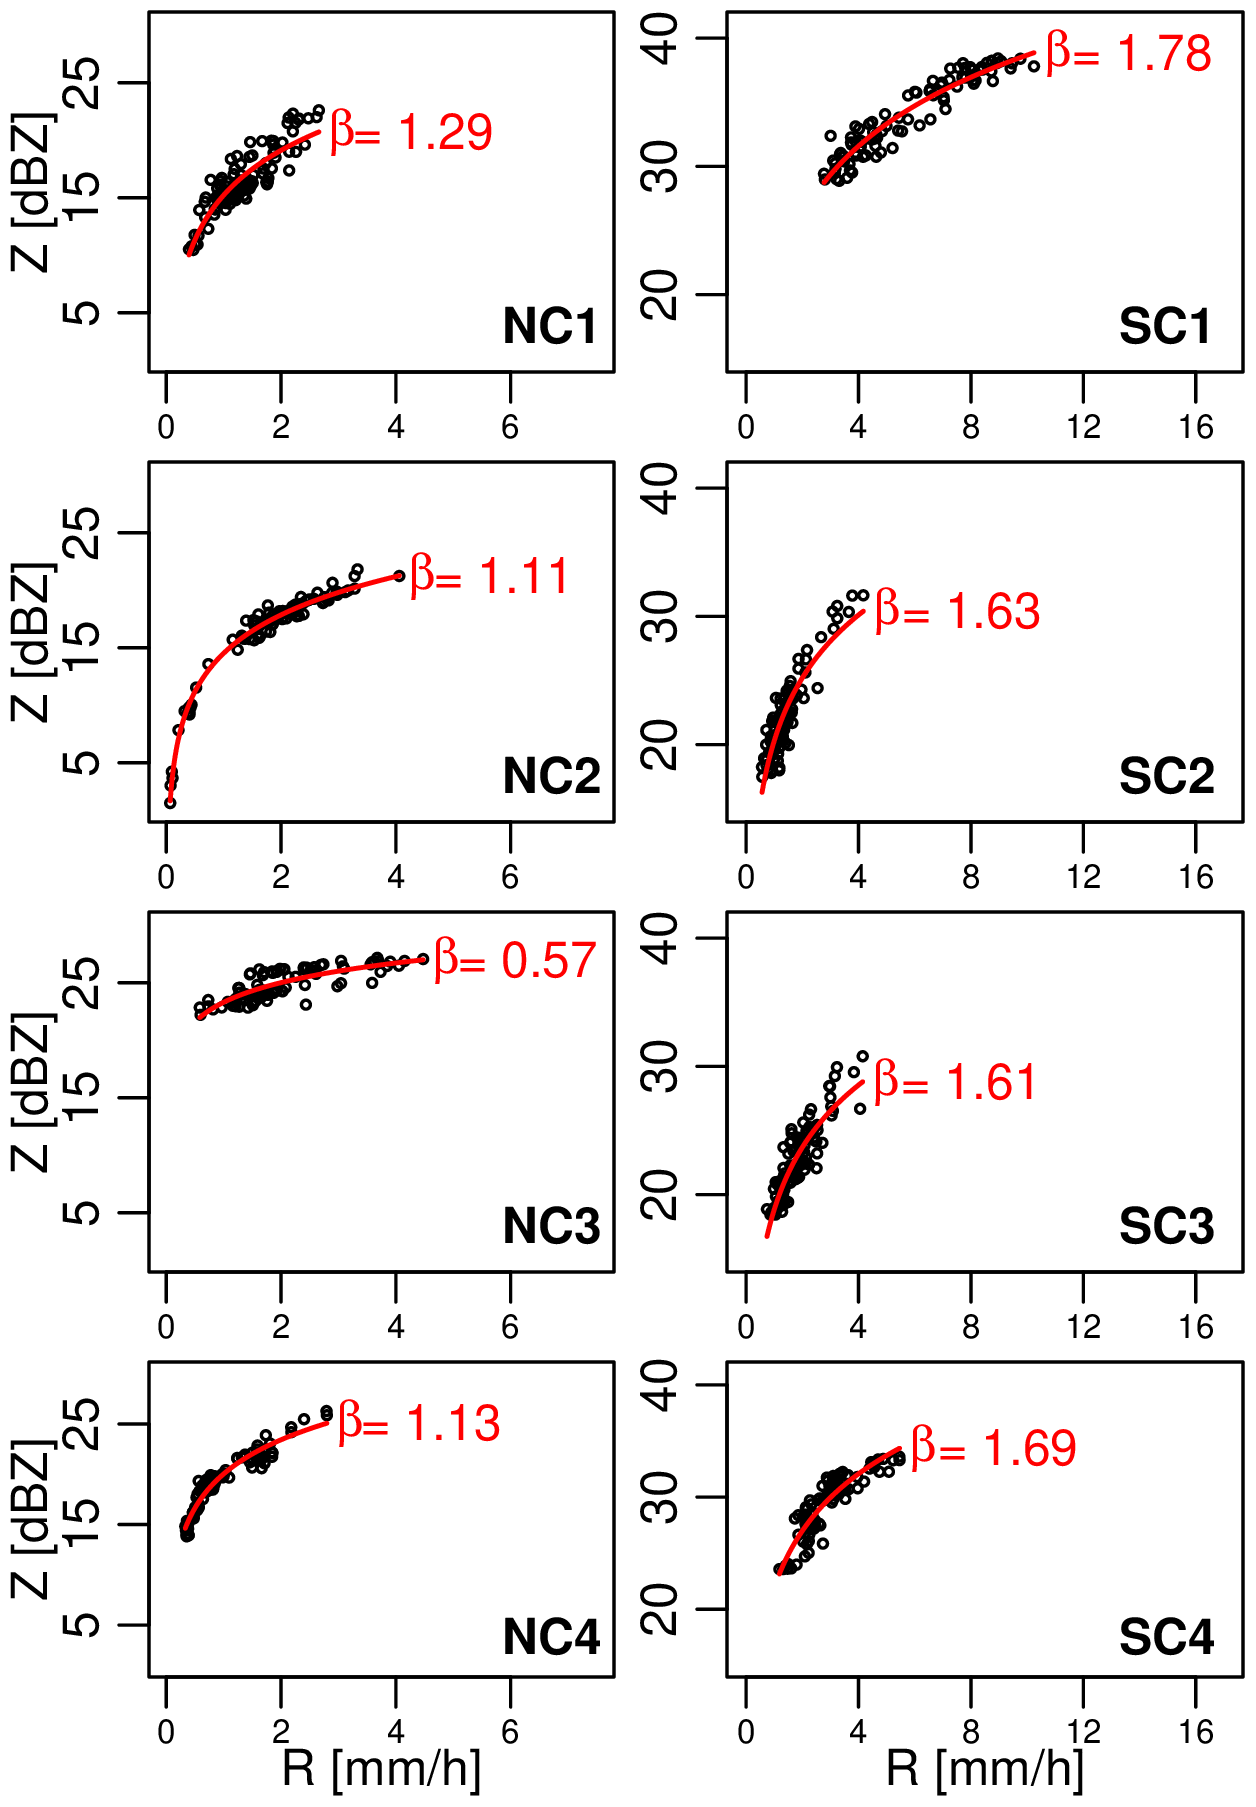
Figure 8Z–R relations at 175 m height for the eight potential special rainfall regimes. Note that only the Z and R values during the time interval of confirmed detections were taken.
4.4 Interpretation of results
The analyses presented above clearly show the limitations of detecting special regimes on the basis of in situ DSD measurements only. On the one hand, we can confidently say that, according to our definitions and from the perspective of a fixed observer on the ground, the eight events identified by the disdrometers technically qualify as number- and size-controlled regimes. However, the time–height profiles of the micro-rain radar clearly show that none of the eight identified events contain any special rainfall dynamics worth mentioning. For example, all four events with number-controlled events (NC1–NC4) identified by the disdrometers correspond to low-intensity rainfall (i.e., stratiform or drizzle), with extremely narrow size distributions centered around small raindrops. For these events, the drop sizes are close to the lower limit of what can be reliably measured with the Parsivel2 disdrometer. Consequently, the temporal variations in Dm are indistinguishable from measurement noise, which could explain why Dm appears to be uncorrelated with R. While such a situation technically qualifies as a number-controlled regime according to our definition, it is significantly different from the number-controlled regimes (and equilibrium DSDs) that have been theorized in the literature.
The four identified events with size-controlled regimes (SC1–SC4) revealed another important problem related to the choice of the reference framework used to define the special rainfall regimes. Because of the horizontal motion of the rainfall field, the temporal variability of the DSDs at the ground may not be representative of the variability within a given rain cell. For example, events SC1, SC2 and SC4 clearly show that whenever multiple rain cells with slightly different rainfall intensities move over the measurement area, the temporal fluctuations in Dm as seen by an observer on the ground might be enough to trigger the detection of a size-controlled regime, even if none of the individual cells actually contain any special rainfall dynamics.
4.5 Sensitivity to the choice of the time window
The final question we need to address is, do special rainfall regimes exist in the Netherlands? Just because we could not convincingly demonstrate their existence in this study does not mean that they do not exist. Another reason why we might not see any clear evidence of special regimes could be that the 15 min time window is simply too long. Indeed, D'Adderio et al. (2018) pointed out that most equilibrium DSDs only last for very short time intervals (i.e., 2 to 4 min). This also explains why the only special events detected by our method were long-lasting stratiform or drizzle events with low rainfall intensities and homogeneous spatial structures. To further investigate this, some additional experiments were conducted using shorter time windows of 10 and 5 min. Unfortunately, the use of a shorter time window did not really solve the detection problem. The shorter windows led to more events being detected, which makes sense given that it is more likely for NT or f(D) to remain constant over 5 min rather than 15 min. However, the cross-check with the MRR showed that none of the newly detected events contained any credible evidence of a special rainfall regime. It is also worth pointing out that none of the newly detected number-controlled regimes exceeded 8 mm h−1 and that the vast majority of the events were stratiform events and drizzle. This result holds regardless of the chosen time window and suggests that there is no clear benefit in using a smaller time window. On the contrary, the use of a shorter time window actually appears to be detrimental to the method, as it also leads to higher sampling uncertainty (especially when estimating the moving standard deviation) and false alarm rates overall. Overall, the results indicate that it does not appear to be possible to successfully and reliably detect special rainfall regimes using 1 min DSD data from Parsivel2 disdrometers, regardless of the time window used.
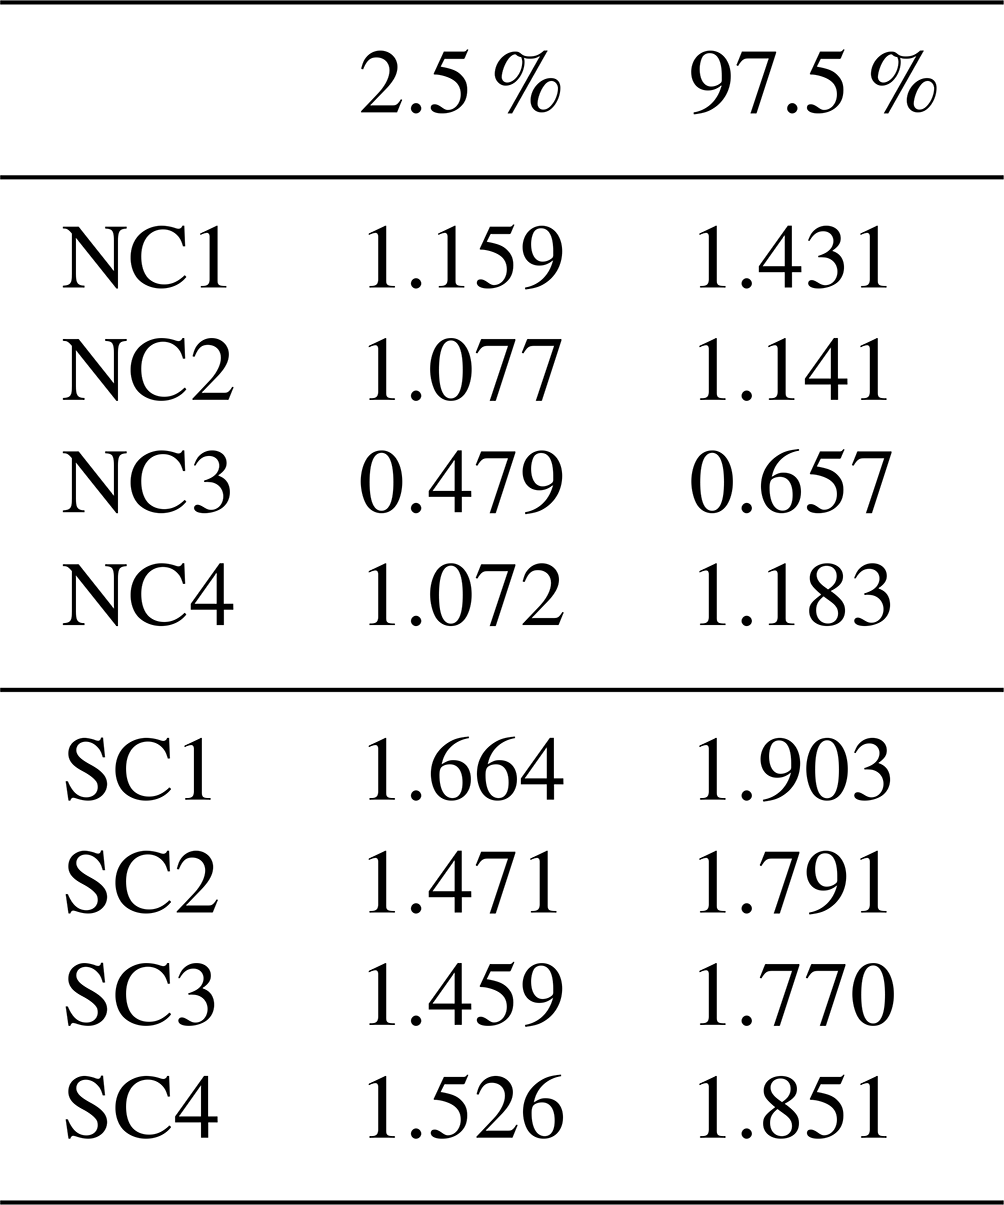
Table 2The 95 % confidence intervals for the estimated β values in Z–R relationship of the MRR data, at 175 , during the eight special regimes detected by the disdrometers.
4.6 Should the definition be changed?
Another issue that deserves attention but has never been mentioned so far is the fact that special rainfall regimes are defined with respect to the rain rate, which is a flux over a fixed area. The problem with this definition, as can be seen in Eq. (2), is that the rain rate actually depends on three quantities: NT, f(D) and v(D). Therefore, even if one of the two DSD components (e.g., f(D) or NT) were to be constant, the other component would not be enough to fully explain all the natural variability in R. The fall velocity v(D) of the raindrops, which depends on wind, pressure and temperature, would also have to be considered. This may sound like a minor issue given that in most rain events the fall velocity of raindrops is fairly well constrained by their diameter. However, it is a serious issue in heavy convective rain with strong updrafts and downdrafts. In addition to that, it should also be said that accurately measuring fall velocities using optical disdrometers is a challenge in itself, which results in additional uncertainty during the calculation of rain rates. Perhaps, a different definition of number- and size-controlled regimes that does not depend on the fall velocity should be considered, e.g., a definition that puts more emphasis on liquid water content rather than the rain rate. Liquid water content is proportional to the third-order moment of the DSD and closely related to the rainfall rate. However, it does not depend on the fall velocity and its fluctuations. The only factor that can influence liquid water content, apart from variations in DSD, is the mass density of liquid water, which is almost constant in rain. Another advantage of using liquid water content instead of rain rate is that it is less sensitive to microphysical processes such as drop breakup and collisional growth, which preserve the mass in a given volume but not the rain rate. In fact, one could even go as far as to say that many other reference variables besides rain rate and liquid water content could be used to define additional, special types of rainfall regimes, including higher moments such as the reflectivity Z. Such an approach bears a lot of similarities to the single-moment DSD normalization approach by Sempere-Torres et al. (1994) and double-moment normalization by Lee et al. (2004) in which key moments of the DSD are taken as a reference to study the variations of natural DSDs given some fixed physical quantities. However, while DSD normalization techniques are usually applied on a climatological timescale, by combining the properties of many different DSDs across multiple events, the scaling properties that are considered in this study only pertain to a short period of time (e.g., a few minutes) and a single rainfall cell.
A systematic search for size- and number-controlled rainfall regimes in the Netherlands was conducted based on 2.5 years of DSD data collected by two co-located Parsivel2 disdrometers in Cabauw. A total of eight promising events were identified. However, upon closer inspection, it became clear that none of these eight events contained clear, conclusive evidence of any special rainfall regime. Clearly, what constitutes a special regime lies in the eye of the beholder, and multiple answers are possible, depending on the definition and reference framework used to describe the regimes. While the eight events identified by the disdrometers technically qualify as number/size controlled from the perspective of a fixed observer on the ground, the MRR data clearly showed that they do not, in fact, correspond to any special microphysical regime.
Subsequent analyses using different thresholds and time windows did not change that conclusion. Based on this, we can confidently conclude that if special rainfall regimes exist, they likely occur on timescales that are beyond the detection capabilities of the Parsivel2 disdrometer. Another possibility could be that these special rainfall regimes only manifest at very high intensities (e.g., above 100 mm h−1), under specific atmospheric conditions that are not prevalent in the Netherlands, or possibly require a more extended period of observation.
In addition to the issue of insufficient temporal resolution, serious methodological challenges were highlighted. For example, we showed that because of horizontal motion, a fixed-observer on the ground is likely to have a very different opinion of what constitutes a number- or size-controlled regime compared to a moving observer. In theory, scanning dual-polarization weather radar could be used to retrieve DSD dynamics along moving reference frameworks. However, the retrieved DSDs would be affected by large uncertainties, which would make it difficult to derive accurate statistics about the temporal variation in NT and f(D). Moreover, a second radar would have to be available to rigorously cross-check and confirm all the regimes detected by the first radar to avoid any false positives.
That being said, the simple detection algorithm proposed in this work is not completely useless. It reliably identifies time intervals with slowly varying NT or f(D), as seen by a fixed observer on the ground. Such periods can be used to test the performance and stability of different DSD retrieval algorithms and radar-based rainfall estimation algorithms. The method also gives useful insight into the temporal dynamics of different DSD moments, their co-fluctuation and scaling properties with respect to the rainfall rate. Such statistics are useful for understanding storm dynamics and improving the modeling of drop size distributions across scales.
In the end, this study serves as a cautionary tale; it is a testament to how difficult it can be to empirically verify a seemingly easy question. The difficulty of the task also casts doubt on the reliability of previous studies that have claimed to see special regimes based on more rudimentary experimental setups and less rigorous data analyses. Our results show that even with a strict cross-check of disdrometer data, one can easily get fooled into seeing special patterns where there are none.
Clearly, more research is needed to understand all the intricacies behind the detection and validation of special rainfall regimes. For example, it would be valuable to also have reliable methods for detecting special regimes from the perspective of a moving observer. The latter is more difficult but also more promising since the detected regimes are more likely to be the result of special microphysical processes. Perhaps a more elaborated technique that combines polarimetric radar with high-resolution video disdrometers could provide the basis for such new detection algorithm at shorter timescales. Future research should also focus on gathering higher-resolution DSD data to shorten the length of the moving time window and better capture the temporal dynamics of DSDs in intense bursts of convective rain. This might unravel some previously unseen number-controlled regimes at higher rainfall intensities. Another interesting line of research could be to consider alternative ways of testing for constant f(D), without having to resort to drop size proxies such as Dm. Regardless of the used approach, measurement uncertainty will undoubtedly be a serious issue. Multiple safeguards such as significance testing, co-location and cross-checks between different sensors will have to be put in place to avoid falling into a statistical mirage.
Both the micro-rain radar data and weather data are part of the open-data catalog of KNMI and available for download through the KNMI Data Platform (https://dataplatform.knmi.nl/dataset/ruisdael-mrr-cabauw-2, KNMI Data Platform, 2022 and https://dataplatform.knmi.nl/dataset/cesar-tower-meteo-lb1-t10-v1-2, KNMI Data Platform, 2023). The Parsivel2 disdrometer data are not published yet but are available in monthly NetCDF files upon request to the author.
The author has declared that there are no competing interests.
Publisher's note: Copernicus Publications remains neutral with regard to jurisdictional claims made in the text, published maps, institutional affiliations, or any other geographical representation in this paper. While Copernicus Publications makes every effort to include appropriate place names, the final responsibility lies with the authors.
Special thanks go to the Dutch weather service KNMI for providing the Cabauw tower weather data. These data are provided under the open-data policy of the Dutch government through the KNMI Data Platform.
This work has been accomplished by using data from the Ruisdael Observatory, a scientific research infrastructure which is partly financed by the Dutch Research Council (NWO (grant number 184.034.015)).
This paper was edited by Gianfranco Vulpiani and reviewed by two anonymous referees.
Beard, K. V.: Terminal velocity and shape of cloud and precipitation drops aloft, J. Atmos. Sci., 33, 851–864, 1976. a, b
Beard, K. V.: Simple Altitude Adjustments to Raindrop Velocities for Doppler Radar Analysis, J. Atmos. Ocean. Tech., 2, 468–471, https://doi.org/10.1175/1520-0426(1985)002<0468:SAATRV>2.0.CO;2, 1985. a
Blanchard, D. C. and Spencer, A. T.: Experiments on the generation of raindrop-size distributions by drop breakup, J. Atmos. Sci., 27, 101–108, 1970. a
Brandes, E. A., Zhang, G., and Vivekanandan, J.: Drop Size Distribution Retrieval with Polarimetric Radar: Model and Application, J. Appl. Meteorol., 43, 461–475, https://doi.org/10.1175/1520-0450(2004)043<0461:DSDRWP>2.0.CO;2, 2004. a
Carbone, R. E. and Nelson, L. D.: The Evolution of Raindrop Spectra in Warm-Based Convective Storms as Observed and Numerically Modeled, J. Atmos. Sci., 35, 2302–2314, https://doi.org/10.1175/1520-0469(1978)035<2302:TEORSI>2.0.CO;2, 1978. a
D'Adderio, L. P., Porcù, F., and Tokay, A.: Evolution of drop size distribution in natural rain, Atmos. Res., 200, 70–76, https://doi.org/10.1016/j.atmosres.2017.10.003, 2018. a, b, c
Gunn, R. E. S. and Marshall, J. S.: The effect of wind shear on falling precipitation, J. Meteorol., 12, 339–349, 1955. a
Hudson, N. W.: Raindrop size distribution in high intensity storms, Rhod. J. Agr. Res., 1, 6–11, 1963. a
Kim, D.-K. and Lee, D.-I.: Raindrop size distribution properties associated with vertical air motion in the stratiform region of a springtime rain event from 1290 MHz wind profiler, micro rain radar and Parsivel disdrometer measurements, Meteorol. Appl., 23, 40–49, https://doi.org/10.1002/met.1518, 2016. a
KNMI Data Platform: Precipitation – 10 seconds measurements by Ruisdael Micro Rain Radar (Metek) in Cabauw, KNMI [data set], https://dataplatform.knmi.nl/dataset/ruisdael-mrr-cabauw-2 (last access: 13 August 2024), 2022. a
KNMI Data Platform: Meteo profiles – validated tower profiles of wind, dew point, temperature and visibility at 10 minute interval at Cabauw, KNMI [data set], https://dataplatform.knmi.nl/dataset/cesar-tower-meteo-lb1-t10-v1-2 (last access: 12 August 2024), 2023. a
Lee, G., Zawadzki, I., Szyrmer, W., Sempere-Torres, D., and Uijlenhoet, R.: A General Approach to Double-Moment Normalization of Drop Size Distributions, J. Appl. Meteorol., 43, 264–281, https://doi.org/10.1175/1520-0450(2004)043<0264:AGATDN>2.0.CO;2, 2004. a
List, R., Donaldson, N., and Stewart, R.: Temporal evolution of drop spectra to collisional equilibrium in steady and pulsating rain, J. Atmos. Sci., 44, 362–372, https://doi.org/10.1175/1520-0469(1987)044<0362:TEODST>2.0.CO;2, 1987. a
Löffler-Mang, M. and Joss, J.: An optical disdrometer for measuring size and velocity of hydrometeors, J. Atmos. Ocean. Tech., 17, 130–139, 2000. a
Peters, G., Fischer, B., and Andersson, T.: Rain observations with a vertically looking Micro Rain Radar (MRR), Boreal Environ. Res., 7, 353–362, 2002. a
Peters, G., Fischer, B., Munster, H., Clemens, M., and Wagner, A.: Profiles of raindrop size distributions as retrieved by micro-rain radars, J. Appl. Meteorol., 44, 1930–1949, https://doi.org/10.1175/JAM2316.1, 2005. a
R Core Team: R: A Language and Environment for Statistical Computing, R Foundation for Statistical Computing, Vienna, Austria, https://www.R-project.org/ (last access: 13 August 2024), 2023. a
Reinoso-Rondinel, R. and Schleiss, M.: Quantitative Evaluation of Polarimetric Estimates from Scanning Weather Radars Using a Vertically Pointing Micro Rain Radar, J. Atmos. Ocean. Tech., 38, 481–499, https://doi.org/10.1175/JTECH-D-20-0062.1, 2021. a
Rogers, R. R., Zawadzki, I. I., and Gossard, E. E.: Variation with altitude of the drop-size distribution in steady light rain, Q. J. Roy. Meteor. Soc., 117, 1341–1369, https://doi.org/10.1002/qj.49711750211, 1991. a
Sauvageot, H. and Lacaux, J. P.: The shape of averaged drop size distributions, J. Atmos. Sci., 52, 1070–1083, 1995. a
Sempere-Torres, D., Porrà, J. M., and Creutin, J.-D.: A General Formulation for Raindrop Size Distribution, J. Appl. Meteorol., 33, 1494–1502, https://doi.org/10.1175/1520-0450(1994)033<1494:AGFFRS>2.0.CO;2, 1994. a, b
Srivastava, R.: Size distributions of raindrops generated by their breakup and coalescence, J. Atmos. Sci., 28, 410–415, 1971. a, b
Steiner, M., Smith, J. A., and Uijlenhoet, R.: A Microphysical Interpretation of Radar Reflectivity-Rain Rate Relationships, J. Atmos. Sci., 61, 1114–1131, https://doi.org/10.1175/1520-0469(2004)061<1114:AMIORR>2.0.CO;2, 2004. a, b, c
Tokay, A., Wolff, D. B., and Petersen, W. A.: Evaluation of the New Version of the Laser-Optical Disdrometer, OTT Parsivel2, J. Atmos. Ocean. Tech., 31, 1276–1288, https://doi.org/10.1175/JTECH-D-13-00174.1, 2014. a
Uijlenhoet, R., Smith, J. A., and Steiner, M.: The microphysical structure of extreme precipitation as inferred from ground-based raindrop spectra, J. Atmos. Sci., 60, 1220–1238, https://doi.org/10.1175/1520-0469(2003)60<1220:TMSOEP>2.0.CO;2, 2003. a, b, c, d
Wang, H., Lei, H., and Yang, J.: Microphysical processes of a stratiform precipitation event over eastern China: analysis using micro rain radar data, Adv. Atmos. Sci., 34, 1472–1482, https://doi.org/10.1007/s00376-017-7005-6, 2017. a
Wen, L., Zhao, K., Zhang, G., Xue, M., Liu, B. Z., and Chen, X.: Statistical Characteristics of Raindrop Size Distributions Observed in East China during the Asian Summer Monsoon Season using 2D-Video Disdrometer and Micro-rain Radar Data, J. Geophys. Res.-Atmos., 121, 2265–2282, https://doi.org/10.1002/2015JD024160, 2016. a
Zawadzki, I. and De Agostinho Antonio, M.: Equilibrium Raindrop Size Distributions in Tropical Rain, J. Atmos. Sci., 45, 3452–3459, 1988. a, b