the Creative Commons Attribution 4.0 License.
the Creative Commons Attribution 4.0 License.
 | 27 Aug 2024
A comprehensive evaluation of enhanced temperature influence on gas and aerosol chemistry in the lamp-enclosed oxidation flow reactor (OFR) system
Tianle Pan
Andrew T. Lambe
Yicong He
Minghao Hu
Huaishan Zhou
Xinming Wang
Qingqing Hu
Hui Chen
Yuanlong Huang
Doug R. Worsnop
Melissa A. Morris
Douglas A. Day
Pedro Campuzano-Jost
Jose-Luis Jimenez
Shantanu H. Jathar
Oxidation flow reactors (OFRs) have been extensively utilized to examine the formation of secondary organic aerosol (SOA). However, the UV lamps typically employed to initiate the photochemistry in OFRs can result in an elevated reactor temperature when their implications are not thoroughly evaluated. In this study, we conducted a comprehensive investigation into the temperature distribution within an Aerodyne potential aerosol mass OFR (PAM-OFR) and then examined the subsequent effects on flow and chemistry due to lamp heating. A lamp-induced temperature increase was observed, which was a function of lamp-driving voltage, number of lamps, lamp types, OFR residence time, and positions within the PAM-OFR. Under typical PAM-OFR operational conditions (e.g., < 5 d of equivalent atmospheric OH exposure under low-NOx conditions), the temperature increase typically ranged from 1–5 °C. Under extreme (but less frequently encountered) conditions, the heating could reach up to 15 °C. The influences of the increased temperature over ambient conditions on the flow distribution, gas, and condensed-phase chemistry within PAM-OFR were evaluated. Our findings indicate that the increase in temperature altered the flow field, resulting in a diminished tail on the residence time distribution and corresponding oxidant exposure due to faster recirculation. According to simulation results from a radical chemistry box model, the variation in absolute oxidant concentration within PAM-OFR due to temperature increase was minimal (< 5 %). The temperature influences on seed organic aerosol (OA) and newly formed secondary OA were also investigated, suggesting that an increase in temperature can impact the yield, size, and oxidation levels of representative biogenic and anthropogenic SOA types. Recommendations for temperature-dependent SOA yield corrections and PAM-OFR operating protocols that mitigate lamp-induced temperature enhancement and fluctuations are presented. We recommend blowing air around the reactor's exterior with fans during PAM-OFR experiments to minimize the temperature increase within PAM-OFR. Temperature increases are substantially lower for OFRs utilizing less powerful lamps compared to the Aerodyne version.
- Article
(15921 KB) - Full-text XML
-
Supplement
(3296 KB) - BibTeX
- EndNote


Secondary organic aerosol (SOA) constitutes 60 %–95 % of organic aerosol (OA) and 10 %–75 % of submicrometer particles (Jimenez et al., 2009) and thus strongly impacts air quality (Huang et al., 2014), climate (Myhre et al., 2013; Poschl, 2005), and human health (Nel, 2005; Feng et al., 2016; Nault et al., 2021). Elucidating the formation mechanism of SOA is crucial for clarifying its environmental impact (Ziemann and Atkinson, 2012; Hallquist et al., 2009; Klyta and Czaplicka, 2020). To investigate SOA formation, chambers (Hildebrandt et al., 2009; Cocker et al., 2001; Paulsen et al., 2005; Wang et al., 2014; Carter et al., 2005; Martin-Reviejo and Wirtz, 2005; Rollins et al., 2009; White et al., 2018; Zong et al., 2023) and flow tubes (Cooper and Abbatt, 1996; George et al., 2007; Hanson and Lovejoy, 1995; Robbins and Cadle, 2002; Katrib et al., 2005; Knopf et al., 2005; Ezell et al., 2010) have been commonly used in the laboratory for investigating secondary formation in the early periods of past several decades. In the last decade, due to rapid advancements in online measurement techniques, various types of oxidation flow reactors (OFRs), which are portable and suitable for field studies to explore SOA formation under ambient conditions, have been developed and widely deployed (Kang et al., 2007; Watne et al., 2018; George et al., 2007; Peng and Jimenez, 2020; Lambe et al., 2011b; Shah et al., 2020; Saha et al., 2018; Xu and Collins, 2021; Chu et al., 2016; Simonen et al., 2017; Li et al., 2019; Keller et al., 2022, and references therein).
The potential aerosol mass (PAM) reactors, initially distributed by Bill Brune (the Penn State PAM) and later modified and commercialized by Aerodyne Research Inc., are the most extensively utilized OFRs for investigating SOA formation and evolution in ambient environments (Peng and Jimenez, 2020). The PAM reactor was first proposed and designed by Kang et al. (2007), leading to successful deployment across various field studies including forests (Hu et al., 2016; Palm et al., 2016, 2017, 2018; Sumlin et al., 2021), urban areas (Ortega et al., 2016; Liu et al., 2018; Chen et al., 2021; Hu et al., 2022; Sbai et al., 2021; Park and Kim, 2023; Xu et al., 2022; Park et al., 2019), rural sites (Ahlberg et al., 2019; Hodshire et al., 2018; Hu et al., 2016), tunnel and roadside studies (Liu et al., 2019; Liao et al., 2021; Tkacik et al., 2014; Saha et al., 2018), and numerous laboratory studies (Kang et al., 2007; Lambe et al., 2011b; Bahreini et al., 2012; Bruns et al., 2015; Sengupta et al., 2018; Kramer et al., 2019; Cheng et al., 2021; Lei et al., 2022; Srivastava et al., 2023, and references therein). In the PAM, high concentrations of the OH radicals, which are the major oxidant for SOA formation in ambient air, can be generated quickly by initiating the photochemistry of O3 and H2O with UV lamps (185 or 254 nm) mounted inside of a flow tube (Lambe et al., 2011b; Li et al., 2015; Peng et al., 2015).
Previous research utilizing the Penn State PAM reported a temperature elevation of 2 °C. However, several recent studies using the PAM have demonstrated that the UV lamps can augment the internal temperature of that reactor by 0–15 °C (up values are under extremely high-voltage conditions) above ambient temperature (Lambe et al., 2011a, 2019; Chen et al., 2013; Tkacik et al., 2014; Charnawskas et al., 2017). Despite this, a comprehensive investigation of the lamp heating effect on the temperature distribution within PAM-OFR and an elucidation of its influences on the flow distribution within PAM-OFR remain unreported. The temperature is a key parameter for gas diffusion and gas and aerosol partitioning (Pankow, 1994; Donahue et al., 2006). The increase in the temperature gradient caused by lamp heating inside an OFR can result in the formation or deepening of recirculating flow, leading to a shorter residence time and a broader residence time distribution (Huang et al., 2017; Lambe et al., 2019). Numerous chamber studies have determined that elevated temperatures can substantially reduce the SOA yield (Gao et al., 2022; Lamkaddam et al., 2017; Boyd et al., 2017; Price et al., 2016; Clark et al., 2016; Tillmann et al., 2010; Pathak et al., 2007) and influence SOA chemical composition (Jensen et al., 2021; Gao et al., 2022; Simon et al., 2020; J. Li et al., 2020; Kristensen et al., 2020; Quéléver et al., 2019; Denjean et al., 2015). Consequently, the increase in temperature within PAM-OFR, which could lead to extra uncertainty for SOA simulations and studies, should be further assessed and clarified.
In this study, we systemically investigate the effects of lamp-induced heating on PAM-OFR measurements. Based on computational fluid dynamics (CFD) simulations, we show how the temperature affects the flow and average OH exposure within the PAM-OFR. Two box models were applied to illustrate the influence of increased temperature on the chemistry of gas-phase reactions and SOA formation within the PAM-OFR. The model results can serve as a preliminary reference for correcting the related experimental results due to increased temperature. Finally, we suggest utilizing fans to cool the PAM-OFR and implementing an online sampling strategy that alternates between high and low driving voltages at varied lamp settings to reduce the uncertainty caused by the varied heating effect.
2.1 Oxidation flow reactor (OFR)
The PAM-OFR (Aerodyne Research, Inc., abbreviated as ARI) used in this study is a 13 L horizontal aluminum cylindrical chamber (46 cm long × 22 cm ID). Four low-pressure germicidal mercury (Hg) lamps are isolated from the sample flow by type 214 quartz tubes (Fig. S1 in the Supplement). The Hg UV fluorescent lamps used in this study are commercial products (GPH436T5VH/4 or GPH436T5L/4, Light Sources, Inc.), which are the default light bulbs selected by ARI for the OFR (Fig. S2). Additionally, the temperature within an OFR with the Penn State low-pressure Hg UV lamps (model no. 82-9304-03, BHK Inc.), which are also widely utilized in PAM-OFR (Khalaj et al., 2021; Xu and Collins, 2021; Lambe et al., 2011b; Siemens et al., 2022; Hu et al., 2016; Ortega et al., 2013; Link et al., 2016; Palm et al., 2016; Kang et al., 2018, 2007; Mitroo et al., 2018), are measured as well. For the Light Sources lamps, the light intensity of each lamp was adjusted via the AC voltage input to the lamp ballast, controlled by a computer with settings ranging from 0 V (minimum) to 10 V (maximum, full AC output). For the BHK lamps, the maximum setting voltage is 5 V (full AC output). At maximum voltage, the optimal estimation of supply power is 8.9 W (see Sect. S1 in the Supplement for details) to each lamp for the Light Sources lamp and 6.3 W for the BHK lamp. When the lamps are turned on, a pure nitrogen purge gas is introduced into the lamp sleeve at a flow rate of 0.2–0.3 L min−1. The lamp sleeve is defined as the space between the lamps and the quartz tube wall to prevent oxidation products from accumulating on the lamp surface and to slightly cool the UV lamps (minor effect, as discussed below). On the inner surface of the front plate of the PAM-OFR, a hexagon nut is attached to the center inlet. The side of the nut is drilled with holes to promote axial mixing of the sample flow and is hereafter referred to as an inlet diffuser (Fig. S1c) (Mitroo et al., 2018). Two mesh screens are installed inside the front and back plates to block debris and insects and to improve airflow uniformity (helping to break up eddies from outside) (Fig. S1b). A detailed schematic plot of the PAM-OFR used in this study is shown in Fig. 1.
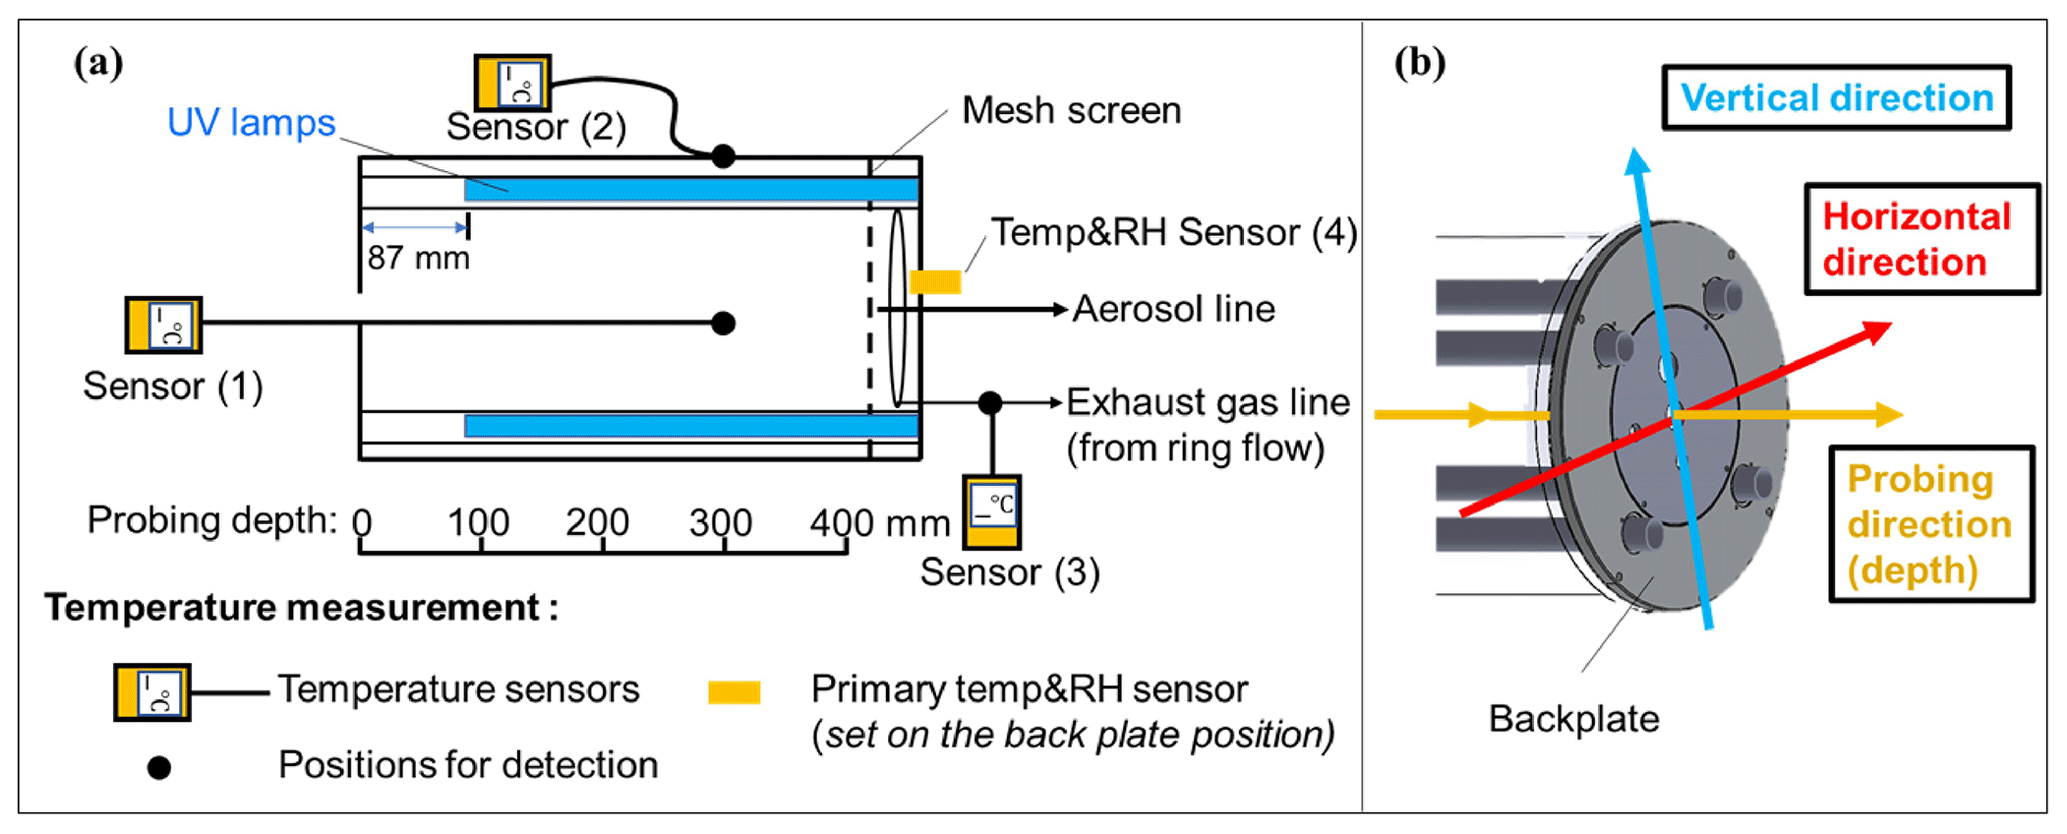
Figure 1(a) Schematic plot for temperature measurement in the oxidation flow reactor of this study and (b) directions for temperature measurement. The center inlet, nut, and mesh screen near the front plate were removed when the temperature sensor was probed in the front direction. The information of different temperature sensors used can be found in Table S1 in the Supplement.
2.2 Measurement of OFR temperature
The temperature distribution inside the PAM-OFR was measured with multiple temperature sensors. The types and models of temperature sensors used are listed in Table S1. To evaluate the accuracy of temperatures measured by different temperature sensors, a comparative experiment was conducted under different ambient environments. We observed a good agreement (within 2 °C) among the different temperature sensors, supporting the robustness of the temperatures measured in this study (Fig. S3). Detailed information on experimental settings for temperature measurements inside the PAM-OFR is summarized in Fig. 1 and Table S2. Briefly, we measured the air temperature inside PAM-OFR at varied positions (vertical and horizontal directions, as well as different depths from inlet; Fig. 1b) under different lamp configurations (e.g., number of lamps, types of lamps, intensity of lamps) and flow rates. For this purpose, an external temperature sensor was placed directly inside the PAM-OFR and was moved manually from outside. The values reported in this study were obtained after the internal temperature of the PAM-OFR stabilized for 20 min after switching the PAM-OFR configuration. During measurement, the inlet diffuser and the mesh screen on the front plate or back plate of the PAM-OFR needed to be removed to extend the thermocouple inside the PAM-OFR. We tested whether removing the mesh screen would affect the temperature field inside the PAM-OFR and found negligible effects as shown in Fig. S4 (removed the back plate mesh screen) vs. Fig. 5 (removed the inlet diffuser and front plate mesh screen). Additionally, we covered the sensor with shielding paper to prevent potential influences of optical radiation from UV lamps on temperature detection during this process. In addition to the internal temperature, the temperature of the inner or external surface and the temperature in the gas output of the PAM-OFR were also measured for comparison. A temperature and relative humidity (RH) sensor (referred to as a “primary T/RH sensor”, Sensirion SHT21, Sensirion AG) was mounted on the back plate at the factory. Consequently, the default primary T/RH sensor was utilized for temperature measurement in all the experiments. In addition to the temperature measurement in OFR, we measured the residence time distribution (RTD) at different voltages to explore the effect of temperature on RTD. Specifically, we first turned on the lights to make the temperature stable. Following this, a 2 s pulse of 50 ppm SO2 was injected into a 5 L min−1 carrier gas (N2) with RH < 10 %. N2 was selected as the carrier gas to prevent the reaction between SO2 and the generated oxidant when UV lamps were turned on. We measured the RTD with lamp-driving voltage set at 0, 5, and 10 V. Note that we only used the outlet for aerosol line for sampling (5 L min−1) during the RTD measurement for better comparison with simulation results in Sect. 2.3. Most of the temperature experiments were done with sampling exhaust line from the ring flow.
2.3 Model simulations on temperature distribution and flow field inside OFR
Computational fluid dynamics (CFD) simulations were performed using the ANSYS Fluent software (Version 14.5) in three dimensions to simulate the temperature distribution and flow field within the PAM-OFR. ANSYS has been used to simulate the flow field within flow reactors in past studies (Li et al., 2019; Ihalainen et al., 2019). The temperature distribution and flow field under unheated and heated conditions were both simulated with the CFD model. The simulated experimental condition was 5 L min−1 of air as the carrier gas and 0.3 L min−1 of SO2 which was injected for 2 s as the tracer gas. Note that during modeling, the airflow within OFR was only sampled through output for the aerosol line as considering the ring flow manifold for gas-phase sampling would significantly increase the complexity for modeling. The convergence of this model was defined when the residuals of physical quantities (e.g., pressure, temperature, velocity, density, and viscosity) were below 0.001.
For the unheated condition, the more advanced “realizable k-epsilon turbulence model” was employed (Shih et al., 1995). The simulation was solved using the pressure-based SIMPLEC algorithm, a prevalent method in CFD models for simulating incompressible flow problems (Patankar and Spalding, 1972). For the heated condition, the thermal boundary was set to a series of fixed temperatures, derived from direct measurements in the PAM-OFR. When the driving voltages of all the PAM-OFR lamps were set to be 5 V, the model settings applied were 55 °C for the quartz UV lamp sleeve surface, 35 °C for the inner wall surface, and 26 °C for the carrier gas. When the driving voltages of all the PAM-OFR lamps were set to 10 V, these values were adjusted to 62, 40.5, and 23 °C, respectively. The lower carrier gas temperature under 10 V conditions compared to 5 V was attributed to the variations in room temperatures across different real experiments. The viscosity and thermal conductivity of the mixing gas were calculated using the mass-weighted-mixing law (Ni et al., 2010). The least squares cell-based method and the species transport model were used for the solution (Ghia et al., 1982).
2.4 KinSim kinetic model for gas-phase reactions
The influence of temperature on gas-phase reactions was modeled using a box model (KinSim 4.14 in Igor Pro. 6.37), incorporating the OFR radical mechanisms as utilized by Li et al. (2015), Peng et al. (2015), and Peng et al. (2019). All gas-phase reactions were derived from the JPL chemical kinetic data evaluation, which incorporates temperature as a variable for reaction rate calculation (Burkholder et al., 2019). In the model, we assumed a mixing volume of 800 ppb SO2 injection into the PAM-OFR with a constant 2.2 % water vapor mixing ratio (RH = 70 % at 25 °C), based on calibration experiment settings. This corresponds to an OH reactivity (OHR) of the incoming air of 20 s−1. The simulated SO2 output concentration in the model was weighted by the measured residence time distribution (RTD) at a flow rate of 5 L min−1 (∼ 700 s). Good agreement between the modeled SO2 decay based on the KinSim model and the measured SO2 results has been demonstrated in Hu et al. (2022).
The OFR185 mode mechanism, which involves the generation of O3 and OH radicals via the photolysis of O2 and H2O within OFR, was incorporated into the model. Note that the photon flux ratio between 185 and 254 nm, derived from lamps manufactured by Light Sources Inc., remains constant regardless of their intensity (Rowe et al., 2020). However, these ratios exhibit variation with intensity for the BHK lamps (Li et al., 2015). In the model, the photon flux ratio of 185/254 nm was set to be constant (5 %). Results for 25 to 40 °C (binned with 5 °C) were modeled, which covers the typical temperature range within the PAM-OFR under most lamp settings. These simulations were conducted using residence time distribution (RTD) obtained under unheated conditions in the PAM-OFR (25 °C). Since the RTD inside OFR can also be influenced by temperature (Lambe et al., 2019), we also showed the model results with measured RTD at 40 °C.
2.5 Statistical Oxidation Model for SOA formation
The Statistical Oxidation Model (SOM) is a kinetic, process-level model designed to simulate the SOA formation. This model incorporates gas particle partitioning, multi-generational oxidation (fragmentation and functionalization), and autoxidation for highly oxygenated molecules (HOMs) (Cappa and Wilson, 2012; Eluri et al., 2018; He et al., 2021, 2022). The SOM model has been shown to successfully capture the evolution of SOA formation and oxidation in multiple laboratory and field studies (Cappa and Wilson, 2012; Jathar et al., 2015; Eluri et al., 2018; Akherati et al., 2020; He et al., 2021, 2022). In the SOM model, the oxidation of a volatile organic compound (VOC) precursor is tracked by its evolution within a carbon–oxygen grid. The volatilities and reactivity (kOH) of organic species in each grid are determined based on their carbon (NC) and oxygen numbers (NO) (Cappa and Wilson, 2012; Jathar et al., 2015; Eluri et al., 2018). In total, six adjustable parameters are used to determine the reaction probabilities and volatility of the grid species. Four parameters (p1–p4, Table S3) indicate the number of oxygen atoms added per functionalization reaction, and two other parameters describe the probability of fragmentation (mfrag, Table S3) and the reduction in vapor pressure (ΔLVP, Table S3) per oxygen atom added to the carbon backbone (Jathar et al., 2016; Akherati et al., 2019).
In this study, we employed the SOM model in conjunction with the TwO-Moment Aerosol Sectional model (TOMAS) (Adams and Seinfeld, 2002; Pierce et al., 2007) to simulate the temperature influences on the yield, oxidation state, and size distributions of newly formed SOA within the PAM-OFR. In the model, the temperature dependence is determined by the Clausius–Clapeyron equation:
where R (8.314 ) is the ideal gas constant and and (Pa) are the saturation pressure of species i at target temperature and reference temperature (298 K), respectively. The can be calculated based on Eq. (2):
where MWorg,i (g mole−1) is the molecular weight of organic species i and (µg m−3) is the saturation concentration at 298 K. The MWorg,i and are calculated based on the number of C (NC) and O (NO) and the ΔLVP of species i (Eluri et al., 2018). The (kJ mol−1) is the evaporation enthalpy of species i, calculated using Eq. (3) (Epstein et al., 2010):
In addition, constant of 80, 100, 120, and 150 kJ mol−1, derived from analysis of field data, was also tested in the model (Saha et al., 2017; Cappa and Jimenez, 2010; Louvaris et al., 2017).
In this study, SOA formation from four typical VOC precursors including dodecane, α-pinene, toluene, and m-xylene was modeled under different OA seed concentrations (1–80 µg m−3) and NOx conditions (low NOx vs. high NOx). We did not consider the evaporation and reaction of OA seed during the model simulation. Five temperature stages ranging from 20–40 °C were simulated. Similar to the gas-phase simulations, results were also calculated based on the measured RTD obtained at both ∼ 25 and ∼ 40 °C (for the modeled yields under 40 °C), with a total model time of 700 s. Additionally, we also considered the highly oxygenated organic molecules (HOMs) in this model that contribute to new particle formation (He et al., 2021; Bianchi et al., 2019). The HOM yields and other detailed information for input parameters can be found in Table S3. These parameters were obtained by fitting the simulated results to the measured chamber results under high- and low-NOx conditions, respectively (Eluri et al., 2018; Cappa et al., 2016). Thus, the exact NO concentration was not considered in the SOM model during the simulation.
3.1 Heating effect inside OFR
To characterize the temperature distribution within the PAM-OFR, we measured the temperature as a function of lamp-driving voltage, number of lamps, flow rate, lamp types, and different spatial positions.
3.1.1 Enhanced temperature vs. lamp-driving voltage (OH exposures) and flow rate
In general, a systematic temperature increase was observed within the PAM-OFR with Light Sources lamps. As shown in Fig. 2a, the temperature within the PAM-OFR increased as a function of lamp-driving voltage and hence OH exposures. When the driving voltage of the two-lamp setup was changed in increasing fashion (0 to 3 V, Light Sources lamp), the temperature increase within the PAM-OFR was generally less than 5 °C. A driving voltage of 3 V was approximately equivalent to a photochemical aging time of around 5 d (assuming the water mixing ratio was 1.88 %, RH = 60 %, external OH reactivity = 30 s−1). For a higher voltage range (3 to 10 V, which corresponds to a photochemical aging time from 5 d to 2 weeks), the temperature inside the PAM-OFR increased by 10 °C. Note that the relationship between the lamp-driving voltage and OH exposure varied depending on the number and type of UV lamps used and the operation mode of the PAM-OFR (Fig. S5). When four lamps were turned on and the lamp-driving voltage was increased from 2 to 10 V, the temperature inside the PAM-OFR increased by 5–20 °C for the laboratory tests (Figs. 2a and 3a). These results indicated that the temperature increase inside of the PAM-OFR was mainly due to the heat from the lamps, which was further confirmed by Fig. 3b, which showed that the temperature increase inside the PAM-OFR decreased as a function of the flow rate from 3 to 7 L min−1 (Fig. 3b). The anti-correlation between the temperature elevation and flow rate was mainly attributed to the larger gas mass provided by the increased airflow, meaning that a lower temperature increase was required to transfer excess heat from the lamps.
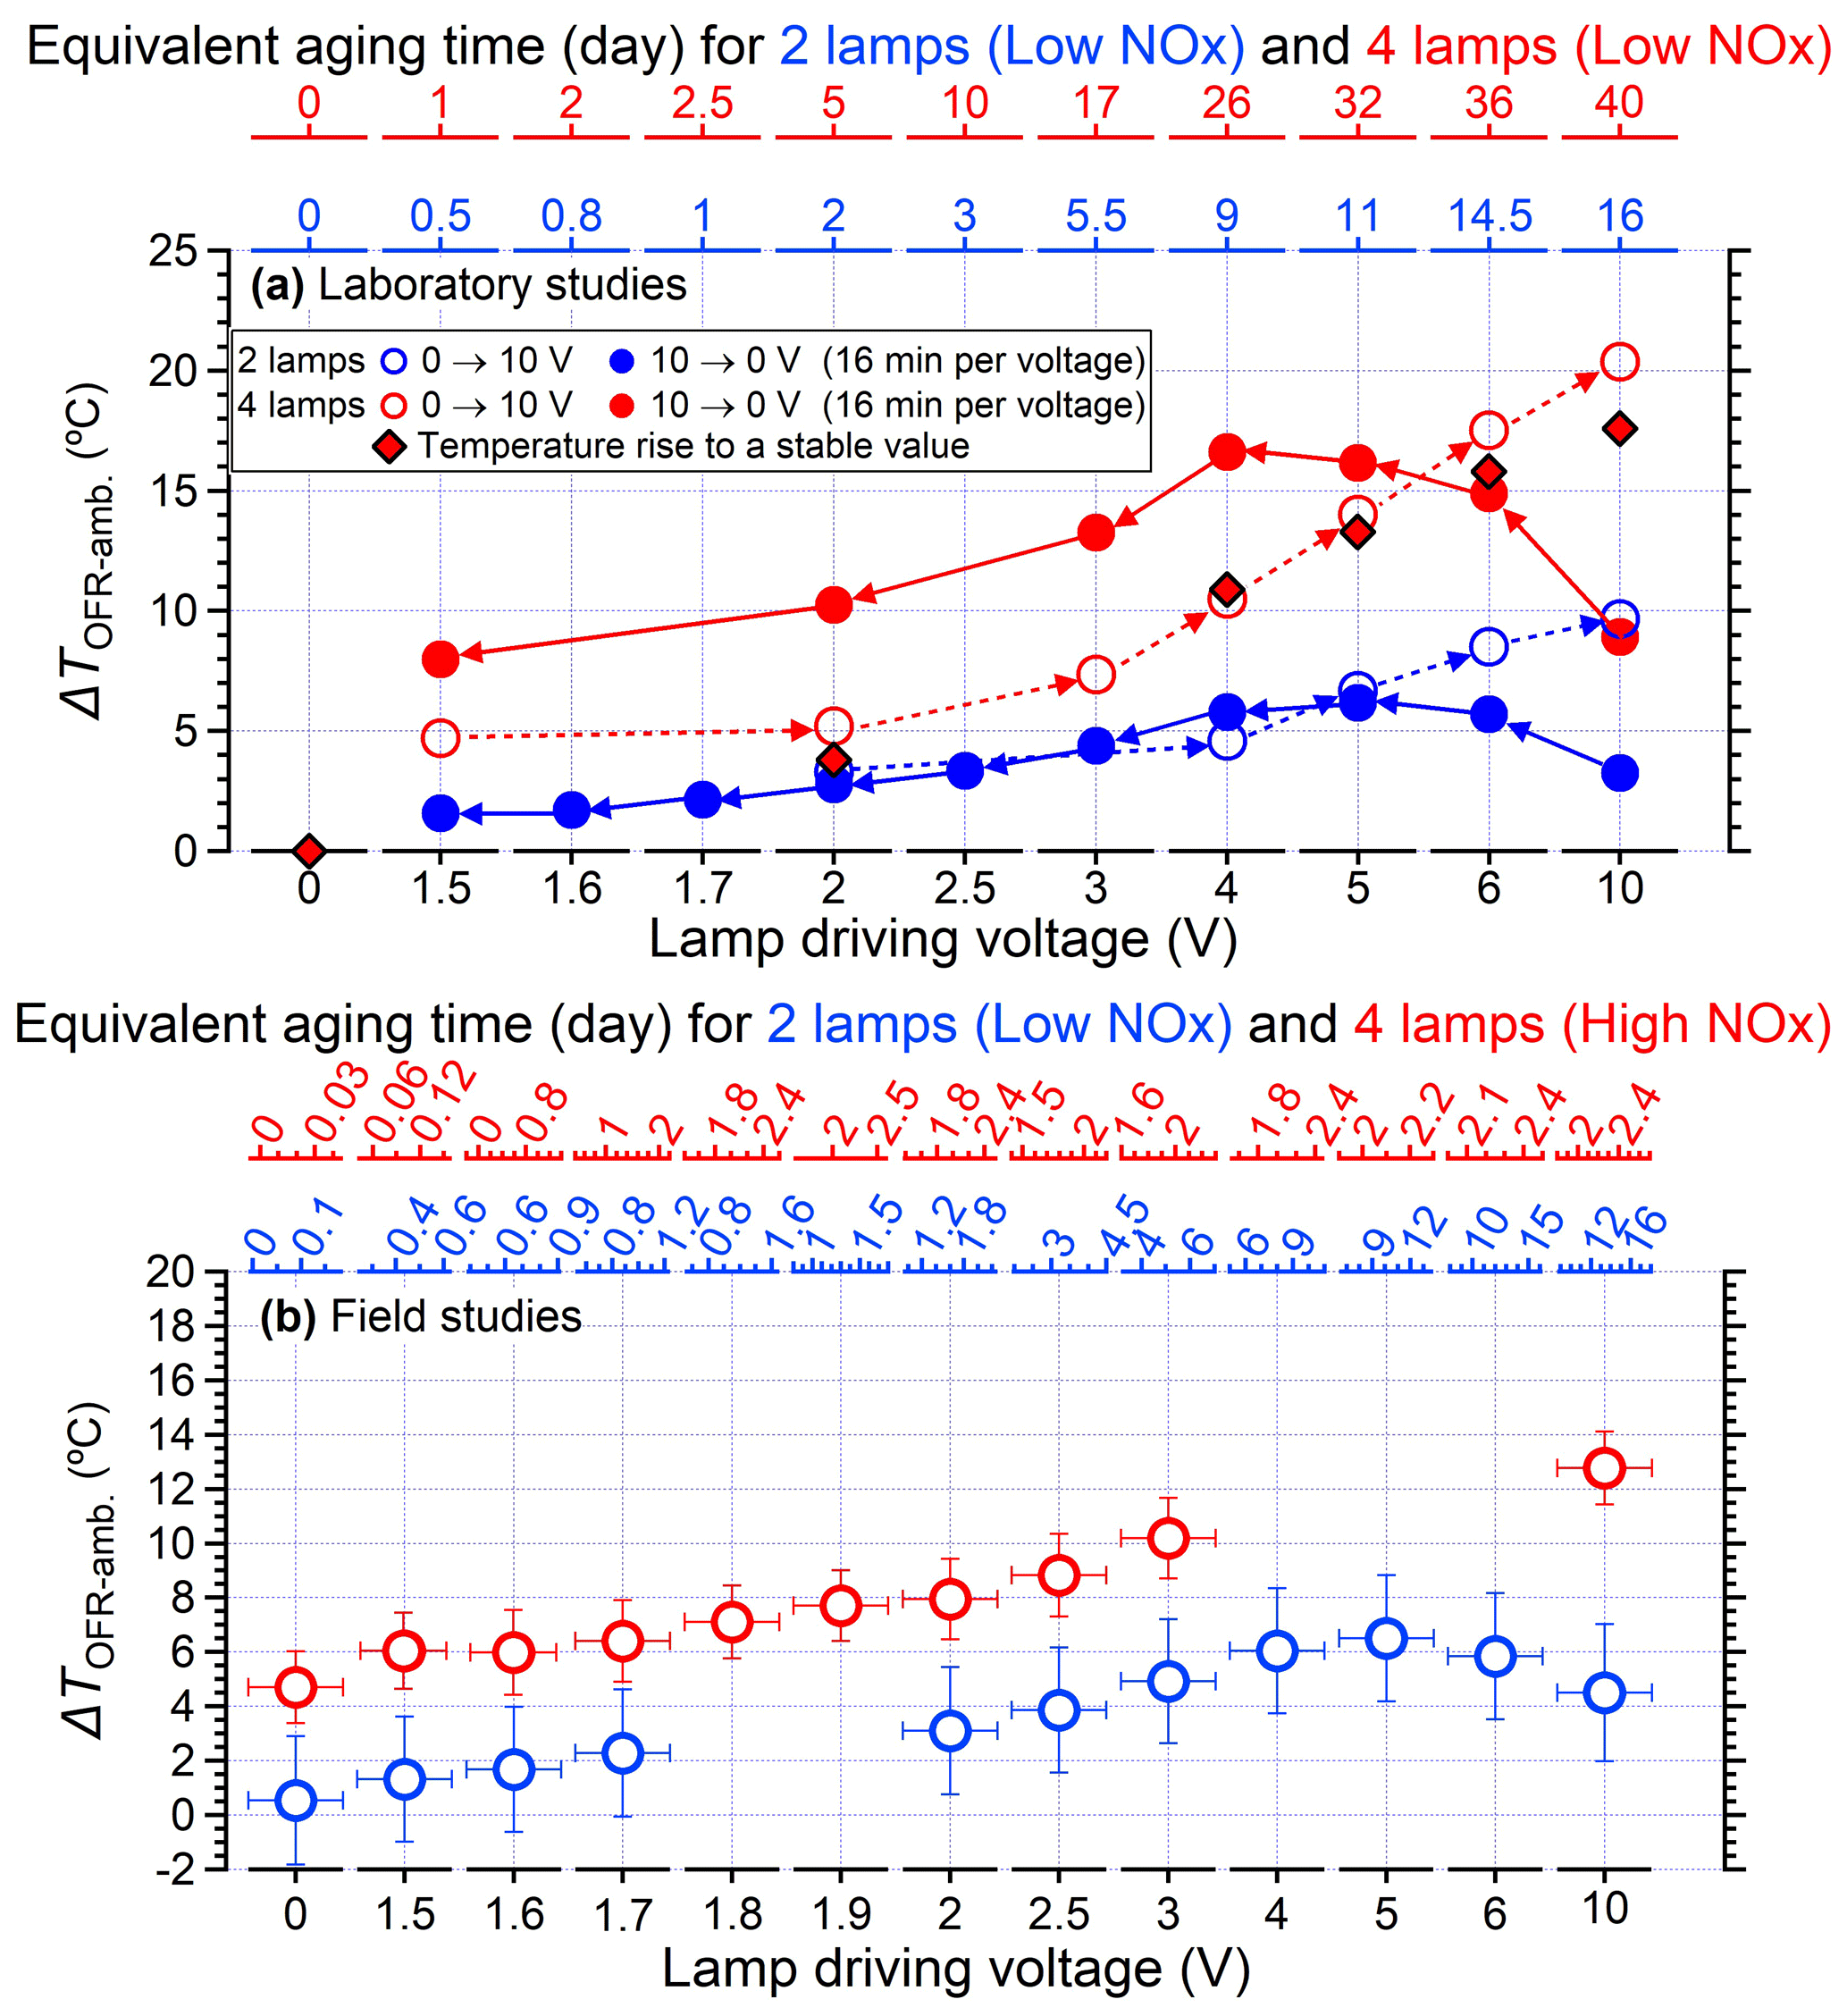
Figure 2(a) Temperature elevation inside the PAM-OFR (measured temperature in OFR minus ambient temperature) as a function of the lamp-driving voltage using two lamps and four lamps in the laboratory studies. Note that without specific notification, all the temperature measurement results shown in the main text are obtained with lamps produced by Light Sources Inc. The relationship between lamp-driving voltage and OH exposures for using two lamps and four lamps can be found in Fig. S5. The OH exposures were calculated based on the empirical parameters in Hu et al. (2022) assuming a mixing water ratio of 1.88 % and an external OH reactivity of 30 s−1. The equivalent aging days (top y axis) were estimated by assuming ambient OH concentration of 1.5 × 10⁶ (Mao et al., 2009). The lamp types applied here were uncovered for field studies with four lamps in Fig. 2b and 80 % covered for other conditions. The temperatures were measured at the centerline with a 300 mm probing. The flow rate was 5 L min−1. (b) Temperature elevation inside the PAM-OFR as a function of light settings in the field studies. Two lamps were applied for low-NOx conditions, while four lamps were used for high-NOx conditions. The high-NOx reaction regimes were achieved by the introduction of extra N2O as illustrated in Peng et al. (2018) and Lambe et al. (2017).
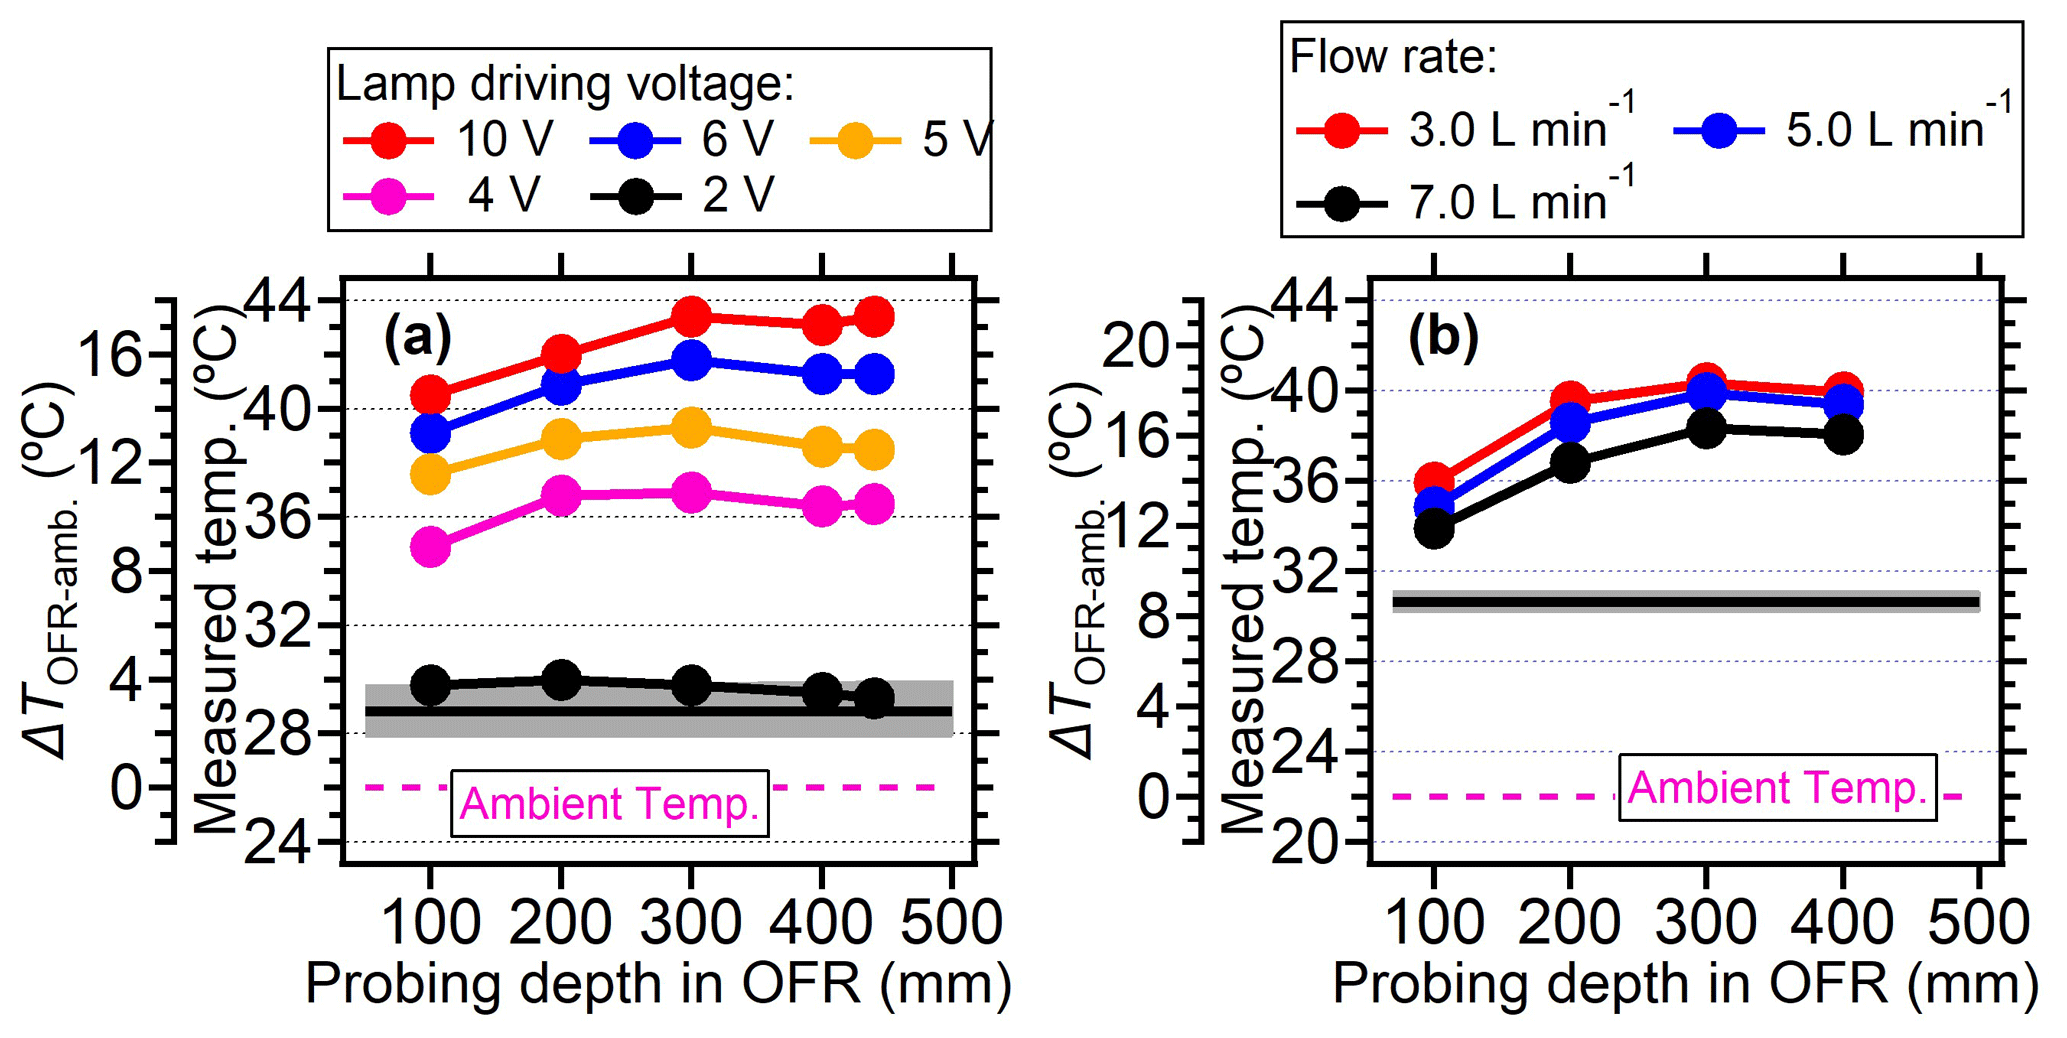
Figure 3(a) The measured temperature and the temperature elevation (measured temperature in OFR minus ambient temperature) under different lamp-driving voltage and (b) at different flow rates for Light Sources lamps. The temperature was measured in the centerline at different probing positions. Black lines and gray shadows represented the temperature measured by the primary T/RH sensor. For panel (a) four lamps were all turned on during measurement. The flow rate was 5 L min−1. For panel (b), four lamps were set at 5 V.
When the lamp-driving voltage was set in a monotonically decreasing fashion (e.g., from 10 to 0 V), the maximum temperature increase did not occur at the highest voltage setting of lamps (10 V) but in the range of 4–6 V, as shown in Fig. 2a and b. This discrepancy was primarily attributed to the fact that the lamps were initiated at 10 V under cooler conditions (e.g., room temperatures or lower voltage settings), while the OFR reactor had a thermal mass that required time to accumulate or dissipate heat. As depicted in Fig. 4, the entire system necessitated over 100 min to achieve a thermal steady state. However, a much shorter durations (15–24 min) were usually applied in the laboratory and field studies when voltages were systematically varied (Link et al., 2016; Murschell and Farmer, 2018; Hu et al., 2016, 2022; Ortega et al., 2016; Palm et al., 2016, 2018; Saha et al., 2018; Shah et al., 2020). These brief constant lamp power periods led to diminished temperature variation between different power settings, as well as inconsistencies between maximum temperature peak with maximum power setting. To elucidate, the time series of measured temperature when the lamp-driving voltage was set under a representative lamp voltage cycle (decreasing fashion: 10, 6, 5, 4, 2, and 0 V) were presented in Fig. 5. Two scenarios with two and four lamps being turned on were both shown. The reason for initiating the lamp voltage at 10 V in this typical setting was to optimize the efficiency of filament ignition in UV fluorescent lamps. Even though the thermal steady state was not achieved at each voltage, temperature increases of 2–8 °C for two lamps and 6–16 °C for four lamps were observed. In general, the temperature increase inside the PAM-OFR is a function of the voltage profile and the time spent at each voltage. The maximum SOA formation was typically observed after 1–2 d of equivalent age (Ortega et al., 2016; Palm et al., 2016; Hu et al., 2022). In most cases, the temperature increase inside the PAM-OFR was generally less than 5 °C below 5–7 d of equivalent atmospheric OH exposure in laboratory and field studies (Fig. 2a and b). The main exceptions were specific OFR modes that incorporate N2O or isopropyl nitrite precursors to establish high-NOx conditions (Lambe et al., 2017; Lambe et al., 2019). In these cases, four lamps were beneficial to compensate for the absorption of 185 nm radiation by N2O (Peng et al., 2018) that inhibited HOx production or the relatively weak absorption of UVA radiation by isopropyl nitrite. This also results in more uniform radiation within the OFR, as when only two lamps are used, the area with another two lamps off would be darker due to the absorption of radiation.
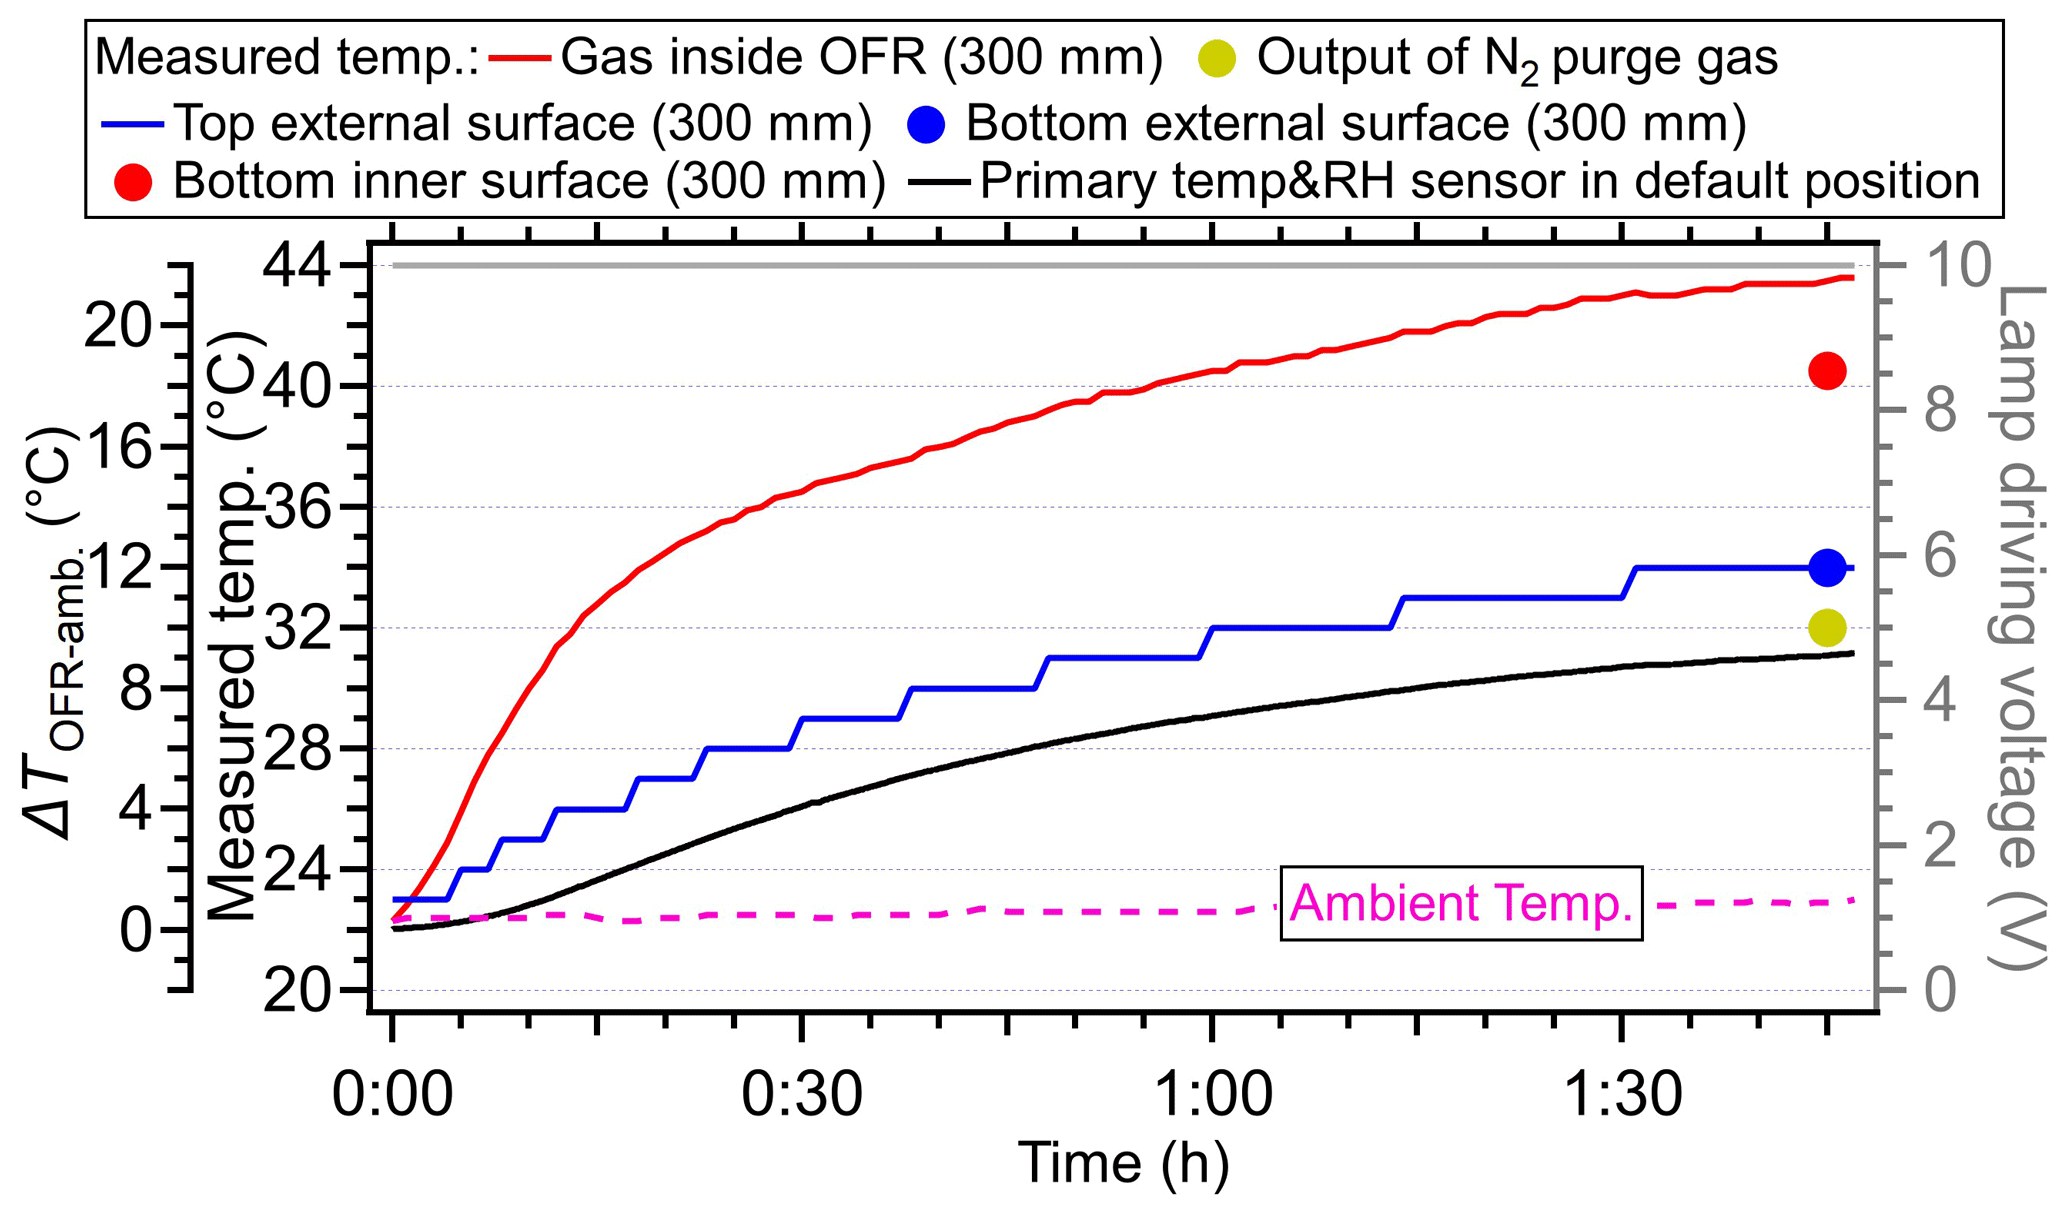
Figure 4The temperature variation under 10 V driving voltage for four lamps as a function of time. The starting time was defined as the moment when the lamps were turned on. The temperature sensors were set at a depth of 300 mm in the central line to measure the temperature inside the PAM-OFR. The flow rate was 5 L min−1. The temperature of the external surface of OFR was also measured at the top and bottom positions. The temperature measured by the default OFR sensor installed on the back plate was also shown as the black line. The dotted purple lines represent the ambient temperature.
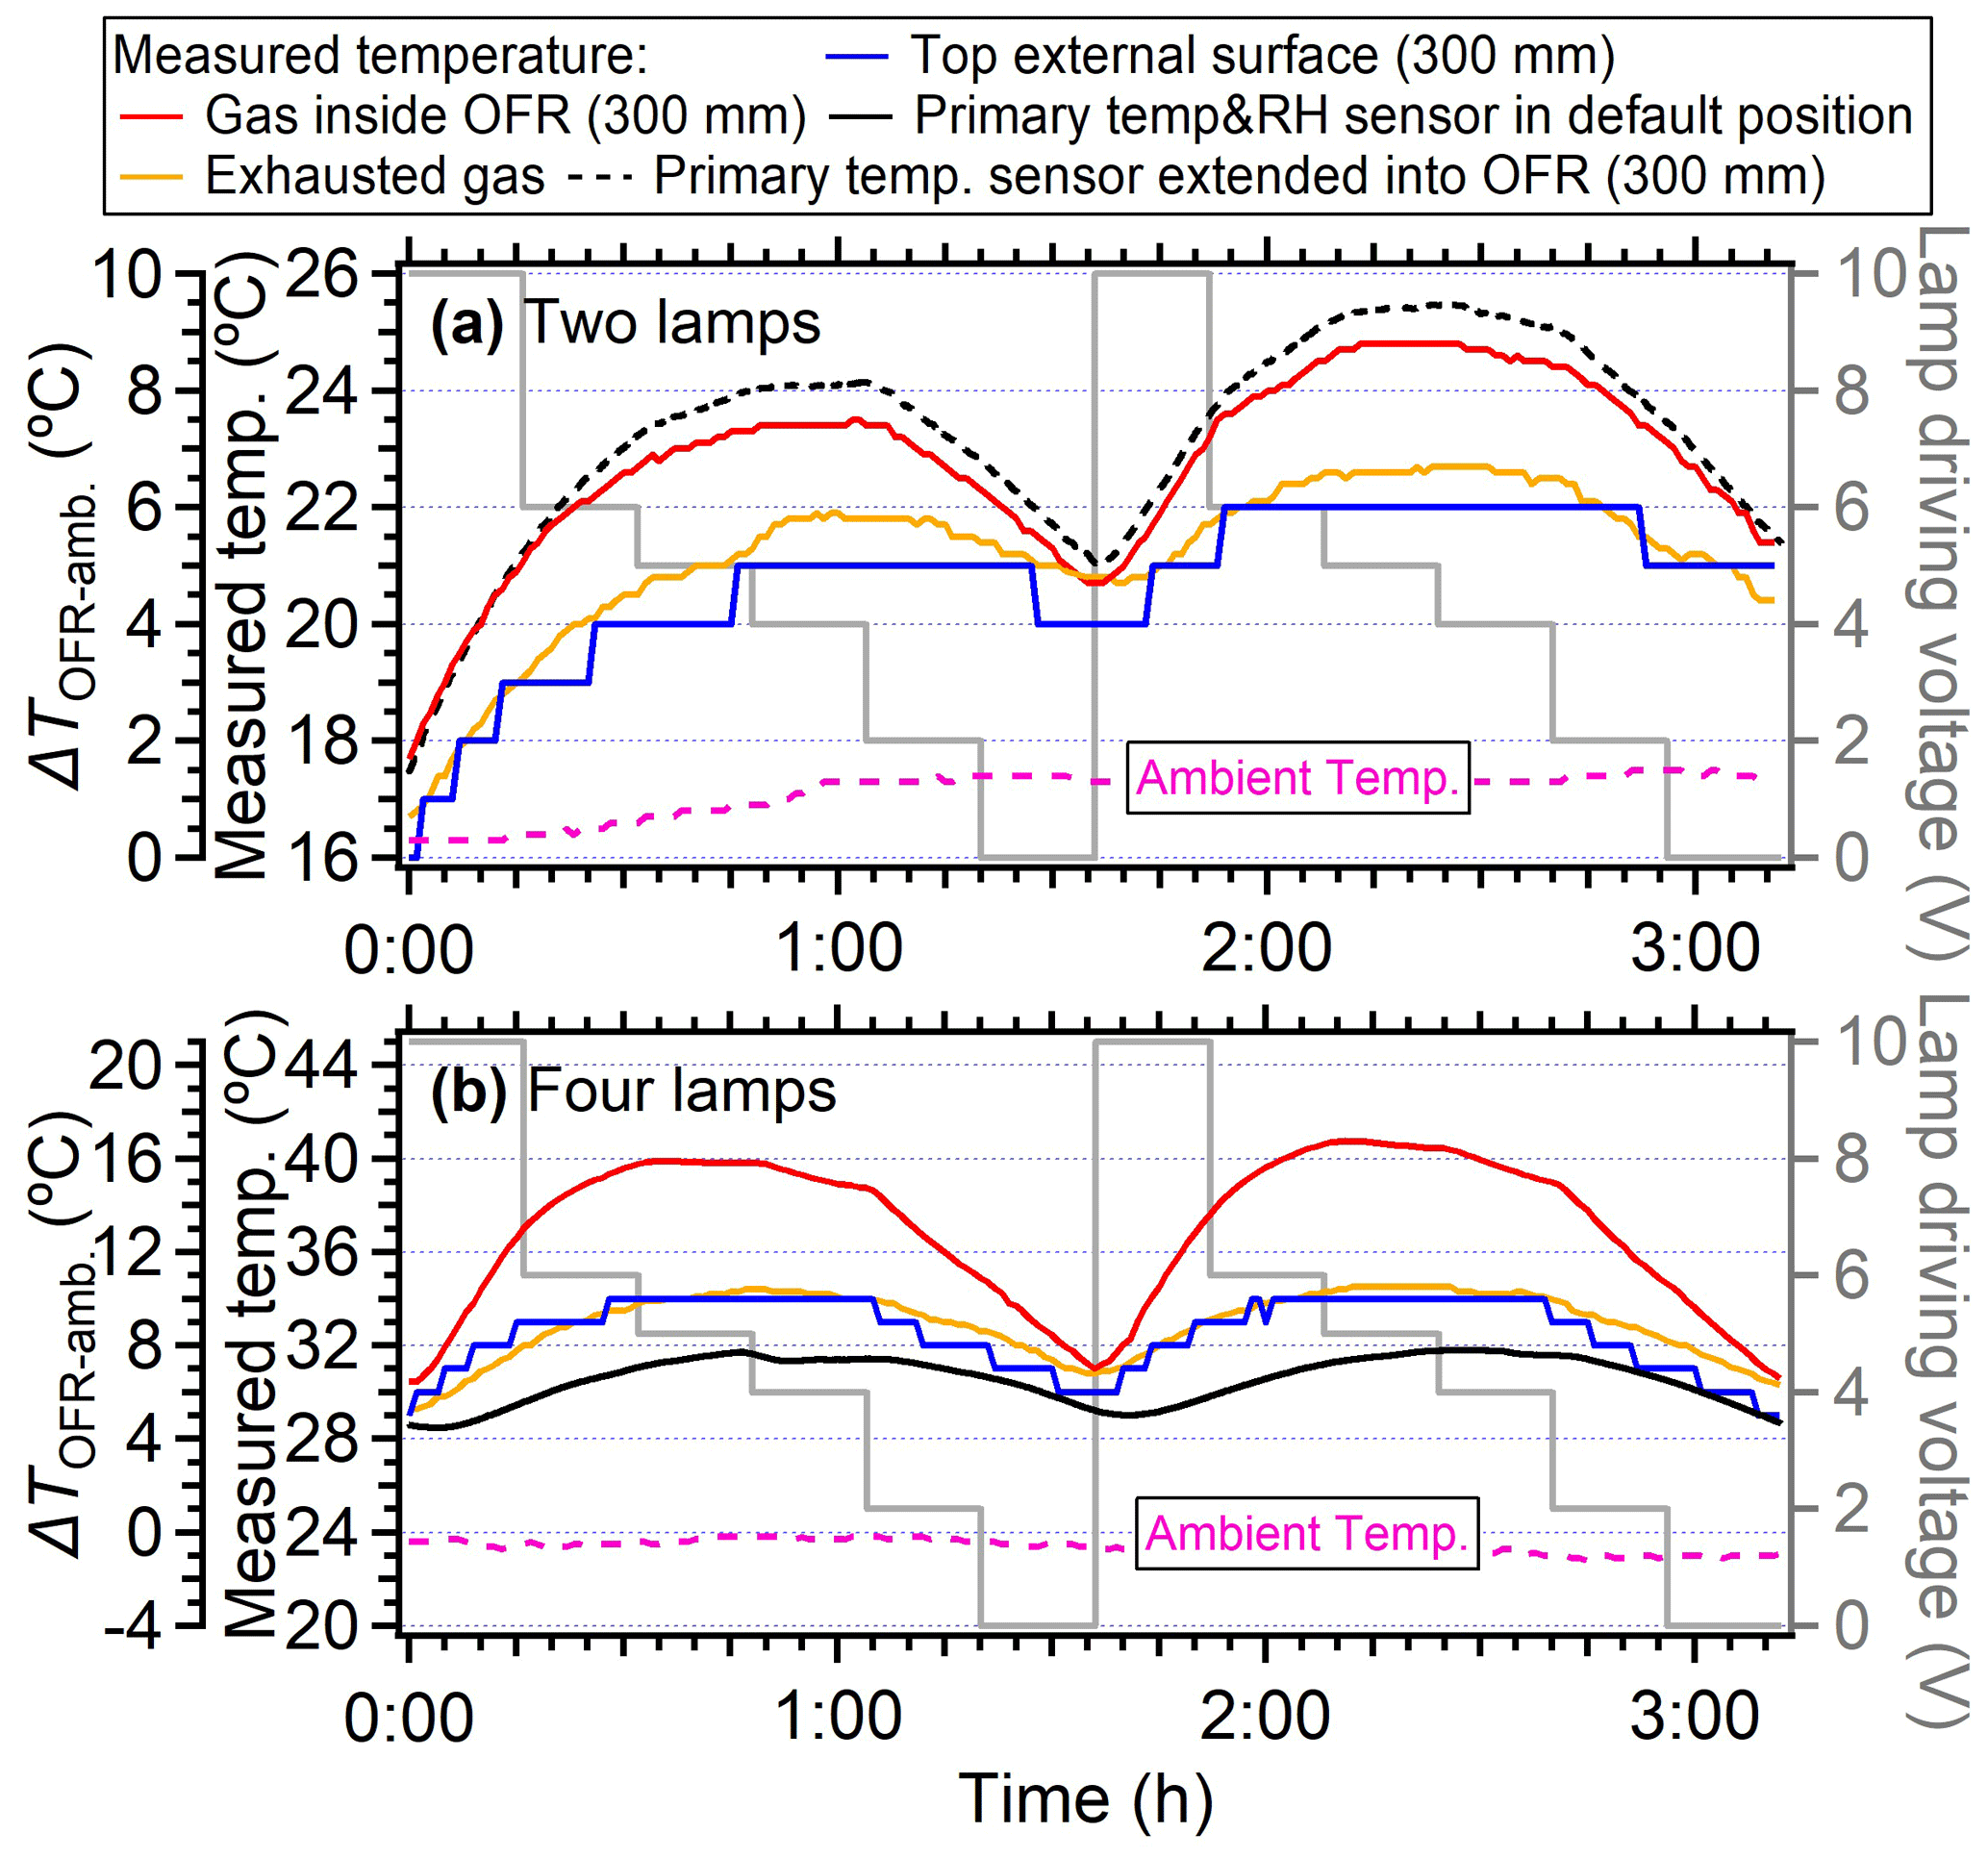
Figure 5Temperature variation under different lamp-driving voltage cycles of 10, 6, 5, 4, 2, and 0 V for systems where (a) two symmetrical lamps on the diagonal direction were used and the OFR back plate sensor was extended into the PAM-OFR (from the back plate) at a depth of 300 mm from the inlet and where (b) four lamps were used and the OFR sensor was set on the back plate. Each lamp setting was operated for a duration of 16 min. The flow rate of sampling air was 5 L min−1 (residence time of 167 s).
3.1.2 Temperature increase vs. lamp types
The temperature increase as a function of lamp types was also investigated. The four types of lamps tested were shown in Fig. S2. Figure S6 showed similar temperature distribution inside the PAM-OFR with both 80 % covered lamps or uncovered lamps and also showed similar temperature distribution when using lamps with only 254 nm light and lamps with both 254 and 185 nm lights. These results indicated that the heat transfer from the hot quartz sleeve (heated by the lamps) was the main source of heating inside the PAM-OFR, rather than their optical radiation. Therefore, different lamp types mainly impact OH exposures but not heating effects. All three lamps applied here were manufactured by Light Sources Inc., and they have similar power supplied to each lamp (8.9 W). In addition, we measured the temperature increase in the OFR with lamps from another manufacturer (BHK Inc.). A temperature increase of 6 °C inside the OFR was found at the centerline when two BHK lamps at full power (Fig. S7b) were used with a flow rate of 4.5 L min−1. The lower temperature increase with BHK lamps was due to the lower input heating energy (6.3 W per lamp) compared to the lamps from Light Sources. For the lower driving voltage of 0.95 V for BHK lamps during a field campaign, a temperature increase of 1–2 °C with an equivalent aging time of around 1.5 d was observed (Fig. S7a and b). During that campaign, the OFR was operated mostly continuously at ∼ 1.5 d equivalent aging, since most SOA formation is often observed at these moderate exposures and is low enough that heterogeneous oxidation is not yet significant (e.g., Palm et al., 2016; Ortega et al., 2016; Hu et al., 2016).
3.1.3 Mapping out the temperature increase inside the PAM-OFR
In this section, the temperature increase within the PAM-OFR as a function of position was explored. In our case, when the voltages of four lamps were set to be 5 V (∼ 30 d equivalent aging time and flow rate of 5 L min−1), the temperatures in the PAM-OFR were generally 9–15 °C higher (Fig. 6a) than the ambient (26 °C). Vertically, the temperature increase was higher at the top position (∼ 14 °C) compared to the bottom (∼ 9 °C) due to the warm air ascending in the PAM-OFR resulting from its lighter density. A similar conclusion was found for BHK lamps (Fig. S7) with a lower temperature increase and smaller temperature difference in the vertical direction for the same equivalent aging. Horizontally, the temperature distribution was symmetrical, with a slightly lower temperature value in the middle and an increased temperature on the edges (Fig. 6b). These temperatures values were measured until their reading varied no more than 0.1 °C. The lower center temperature could be attributed to the faster flow rate (shorter residence time) of air mass in the middle due to the removal of the inlet diffuser and the longer distance from the lamps. However, the largest temperature gradient at different horizontal axial positions was within 2–3 °C, indicating that the general temperature distribution measured here was comparable to that when the inlet diffuser was installed. For different probing depths, Fig. 3 generally showed that the temperature increase was lower near the inlet and higher from the middle position to the back in the central line, mainly due to the airflow flowing from the inlet to the outlet being warmed, as well as the set position of lamps having a gap with the front plate, as demonstrated in Fig. 1.
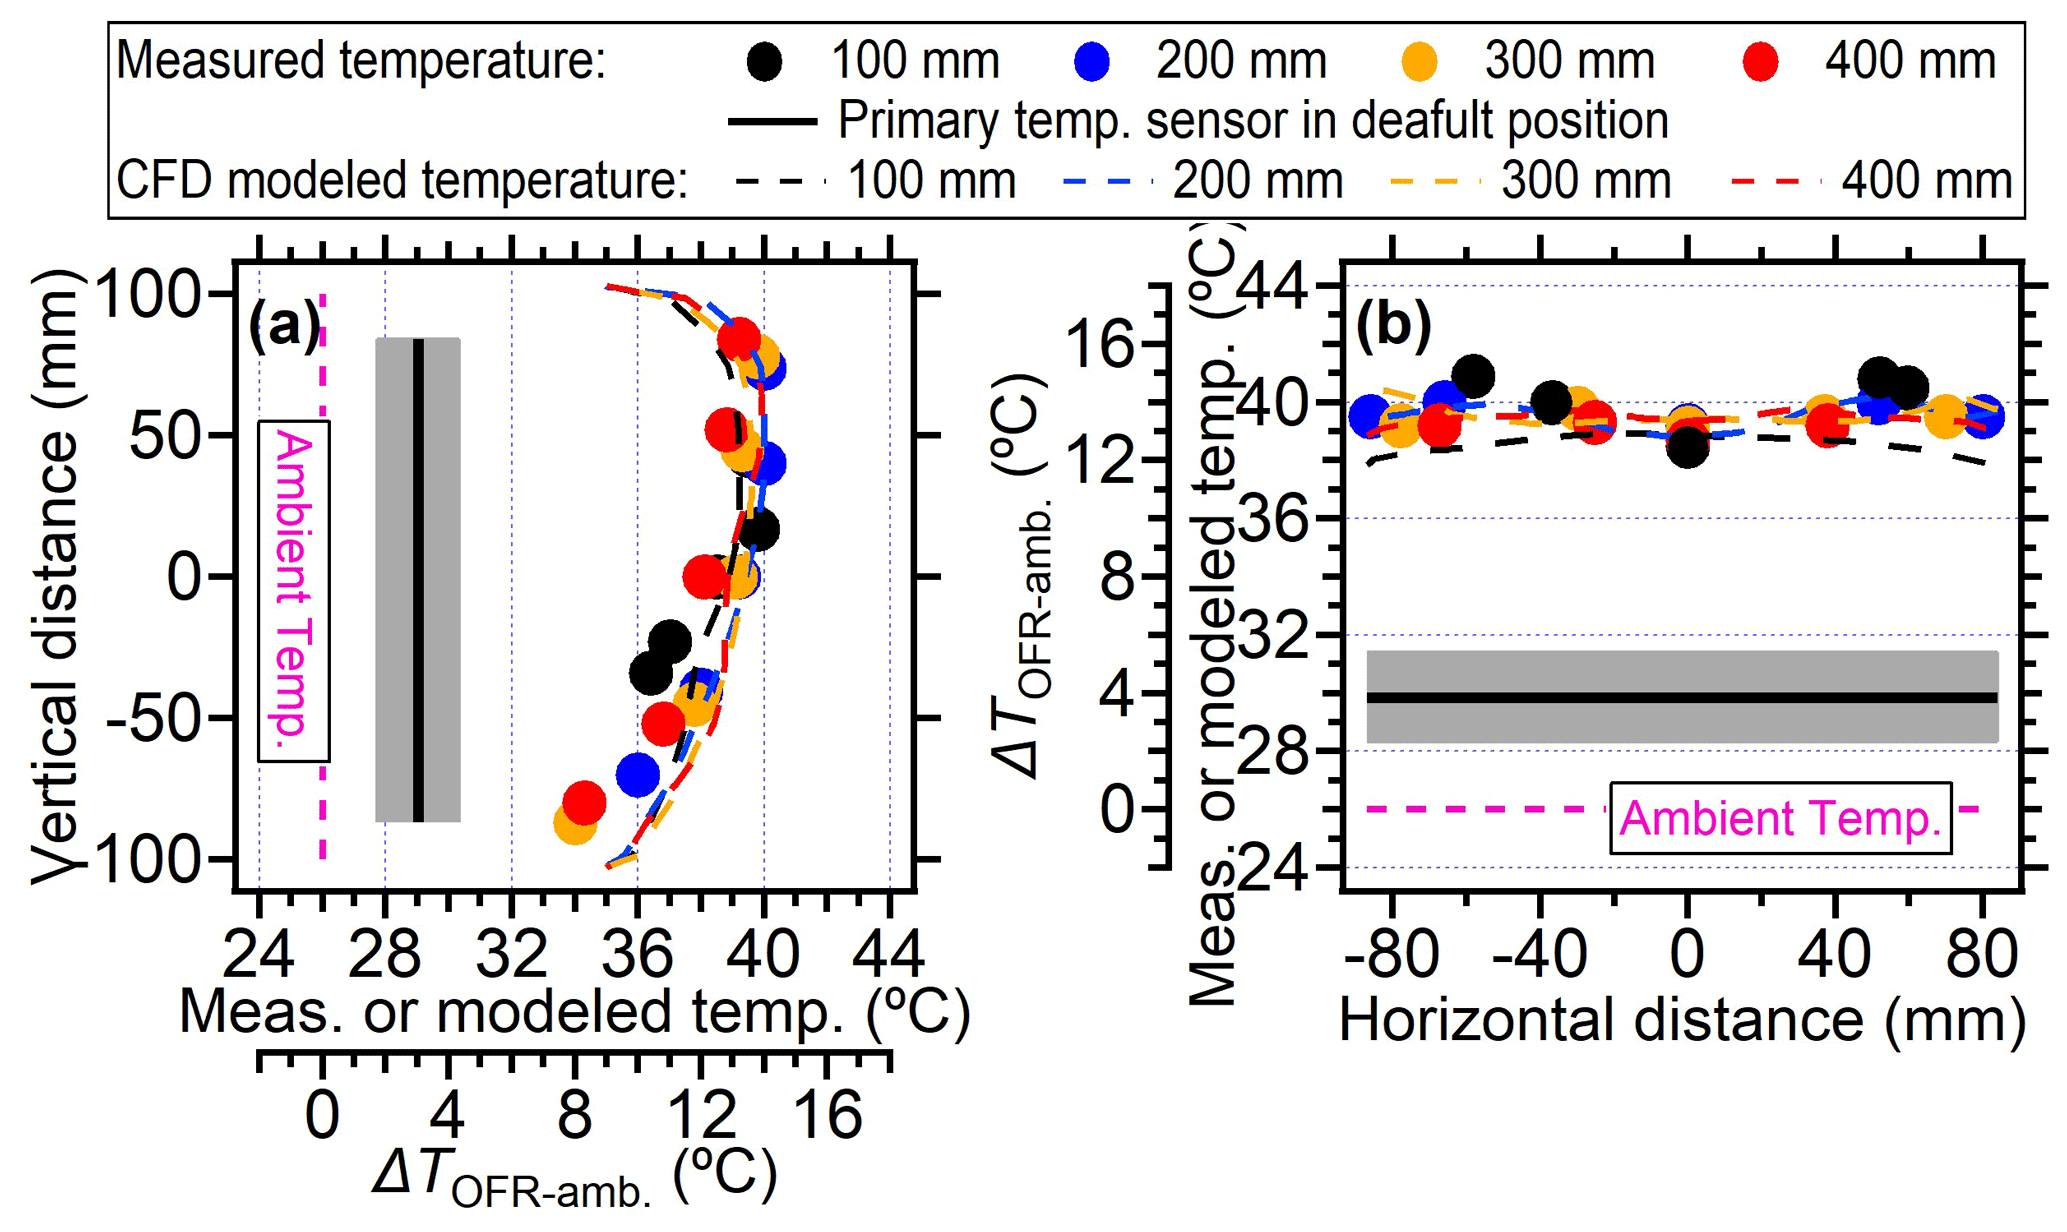
Figure 6The temperature measured by external temperature sensor at different positions within the PAM-OFR or under different settings: (a) the measured and CFD modeled temperatures on the vertical direction at different probing depths and (b) the measured and CFD modeled temperatures on the horizontal direction at different probing depths. All four lamps were turned on during measurement. The driving voltage of the four lamps was 5 V. The black lines and gray shadings were the average ± standard deviation for temperature measured by the back plate sensor.
3.1.4 Loss of heating energy in OFR
The gain of the heating energy inside the PAM-OFR generally comes from the UV lamps, while the energy loss inside the PAM-OFR is mainly through three pathways: (1) the dissipation of energy through the exhaust air (from the ring flow set in this study) from the PAM-OFR, (2) the convection and radiation-induced heat energy transfer from the PAM-OFR surface to the ambient air, and (3) the energy loss through the purge nitrogen between the lamps and quartz sleeves (Fig. S8).
To elucidate the energy balance across the three pathways, we measured the temperatures of the PAM-OFR enclosure, the purge nitrogen, and the exhaust air. Specifically, our findings were based on maximum lamp-driving voltages of four UV lamps (10 V) at a flow rate of 5 L min−1. Figure 4 displayed the measured temperature of the PAM-OFR enclosure as a function of time and at different positions (inner vs. external surface, bottom vs. top surface). The temperature at the top external surface increased as the gas temperature within the PAM-OFR rose, indicating that the PAM-OFR tube absorbed the heating energy from lamps. The temperature detected at the inner surface of the OFR (40.5 °C) was lower than that of gases (43.5 °C) but higher than that of the external tube surfaces (34 °C). The lower temperature of the external surface than the air masses inside the PAM-OFR could be attributed to (i) there being heat losses on the OFR tube surface as the ambient air temperature (23 °C) was substantially lower than that of the OFR enclosure, resulting in heat transfer. This heat transfer was also reflected by the diminishing temperature gradient between inner and external OFR tube surfaces (40.5 → 34 °C). We further measured the temperature of purged nitrogen at a default flow rate of 0.2 L min−1. In this case, the temperature of exhausted nitrogen was ∼ 32 °C (output), which was 9 °C higher than the temperature of input nitrogen (23 °C). (ii) When the temperature equilibrium between the air and OFR was not balanced, an additional reason will cause the lower temperature in OFR enclosure. The aluminum OFR enclosure has a higher thermal mass than the air. Although the specific heat capacity of metal (0.908 at 301.60 K) is similar to that of air (1.005 at 300 K) (Giauque and Meads, 2002; Kieffer, 1956), the flow tube is considerably heavier than the air due to its significantly higher density (2700 vs. 1.29 Kg m−3), resulting in a lower temperature for the OFR tube than the inner air.
In addition to the air inside the PAM-OFR, the temperature of exhausted air (from the ring flow, Fig. S1) was also examined closely. A temperature sensor was set in the Teflon Tee connector near the output of the PAM-OFR back plate. We found a slightly lower temperature increase (≤ 5 °C, Fig. 5a) in the exhausted air compared to the air measured directly inside the PAM-OFR. This discrepancy was probably due to the cooler surfaces of the fitting or sampling lines. Using these temperatures shown above, we roughly calculated the fraction of energy loss among three pathways. Detailed information of this calculation can be found in Sect. S2. Those model results indicated that after 105 min of heating, 51 % of the total power (35.6 W, 8.9 W for each lamp, four lamps in total) during the heating process was converted into energy causing the temperature increase of the PAM-OFR. The remaining 49 % of power was lost due to the conversion efficiency or converted into other energy that did not cause warming of airflow inside the PAM-OFR. For the fraction (51 %) of energy that causing warming, the energy loss fractions through purged nitrogen gas (at flow rate 0.2 L min−1), heated air, and OFR enclosure were 0.3 %, 9.8 %, and 89.9 %, respectively (Fig. S9a). This indicated that the dominant pathway for heat transfer was through the metal enclosure. Cooling the OFR enclosure was an effective method to maintain the PAM-OFR near ambient temperature. As shown in the following Sect. 3.5, with two fans blowing on the OFR tube, the heat dissipation of the OFR tube increases, resulting in a significantly lower temperature increase inside the PAM-OFR.
In some OFR systems, a higher flow rate of nitrogen-purged air was applied (Zhao et al., 2021; Bruns et al., 2015; Li et al., 2019). For example, Li et al. (2019) set the purged nitrogen flow rate at around 30 L min−1 for their custom-designed OFR system with exterior lamps to keep the temperature at around 25 °C. We attempted to introduce a nitrogen gas flow at 20 L min−1 through the lamps to increase the energy loss for the PAM-OFR. This was almost the maximum flow rate of purged nitrogen that could be tested due to the small inner diameter of the fitting connected to the lamp tubes. After nitrogen was injected at such a high flow rate, we found the temperature of the lamp sleeve, the inner surface of flow tube, and gas inside the PAM-OFR dropped from 62, 40.5, and 44 °C (four lamps at 10 V) to 42, 34 and 36.5 °C (36 %–51 % decreased in temperature increase, with ambient temperature at 23 °C), respectively. Based on the measured temperature, we found the energy loss fraction through purged nitrogen increased from 0.3 % to 32 % (Fig. S9b). This was helpful, but it still could not balance the heating energy input from the UV lamps. The temperatures of air in the PAM-OFR (36.5 °C) were still significantly higher than the room temperature (23 °C). The large consumption of pure nitrogen gas for running such a high flow rate would also pose a challenge for long-term experiments, especially for field studies.
3.1.5 Artificially low temperature measured by primary T/RH sensor in ARI OFR
During the experiment, we found that the primary T/RH sensor installed in the OFR back plate (see the sensor in Fig. S1) always showed a significantly lower temperature (by 1–14 °C) than the temperature sensor probed inside the PAM-OFR (Figs. 3–6). We hypothesized that the lower temperatures detected by the primary sensor at the default back plate position were mainly due to the direct contact of this sensor with the metal back plate, which was at lower temperatures. When the primary sensor was placed at 300 mm into the PAM-OFR from the back plate (closer to the lamps than the centerline, as the default location of the sensor on the back plate was not in the centerline, Fig. S1), a similar temperature was measured by the primary T/RH sensor and the one probed into the PAM-OFR (maximum difference of 1 °C), as shown in Fig. 5a. This indicated that the primary T/RH sensor in the back plate with default OFR settings led to underestimation of the temperature inside of the PAM-OFR, which should be verified and corrected by the users based on the configuration of their instrument.
3.2 Temperature influence on the flow field
In this section, we discuss the impact of elevated temperature on fluid dynamics within the PAM-OFR based on computational fluid dynamics (CFD) simulations. Detailed setting parameters were introduced in Sect. 2.3. The temperature field where the voltages of four UV lamps were all set to 5 V was tested here. As shown in Fig. 6a and b, the simulated temperature distribution generally showed good agreement with the values measured directly with the temperature sensor within the PAM-OFR, validating the reasonableness and reliability of both simulated and measured temperature distributions. In Fig. 7a, the simulated 2D temperature distributions revealed the hottest air (up to 45 °C) encircling the UV lamps. The rest of the air parcels exhibited a pronounced vertical axial temperature gradient (∼ 10 °C), with temperatures ranging from 35–45 °C persisting in the upper region of the flow tube. Such a pronounced temperature gradient was anticipated to induce significant recirculation within the PAM-OFR, as evidenced by the Richardson number calculation (Ri = 3974, which is far above 10 and indicates the existence of turbulence) (Huang et al., 2017; Holman, 2010). Details of the Ri calculation can be found in Sect. S3.
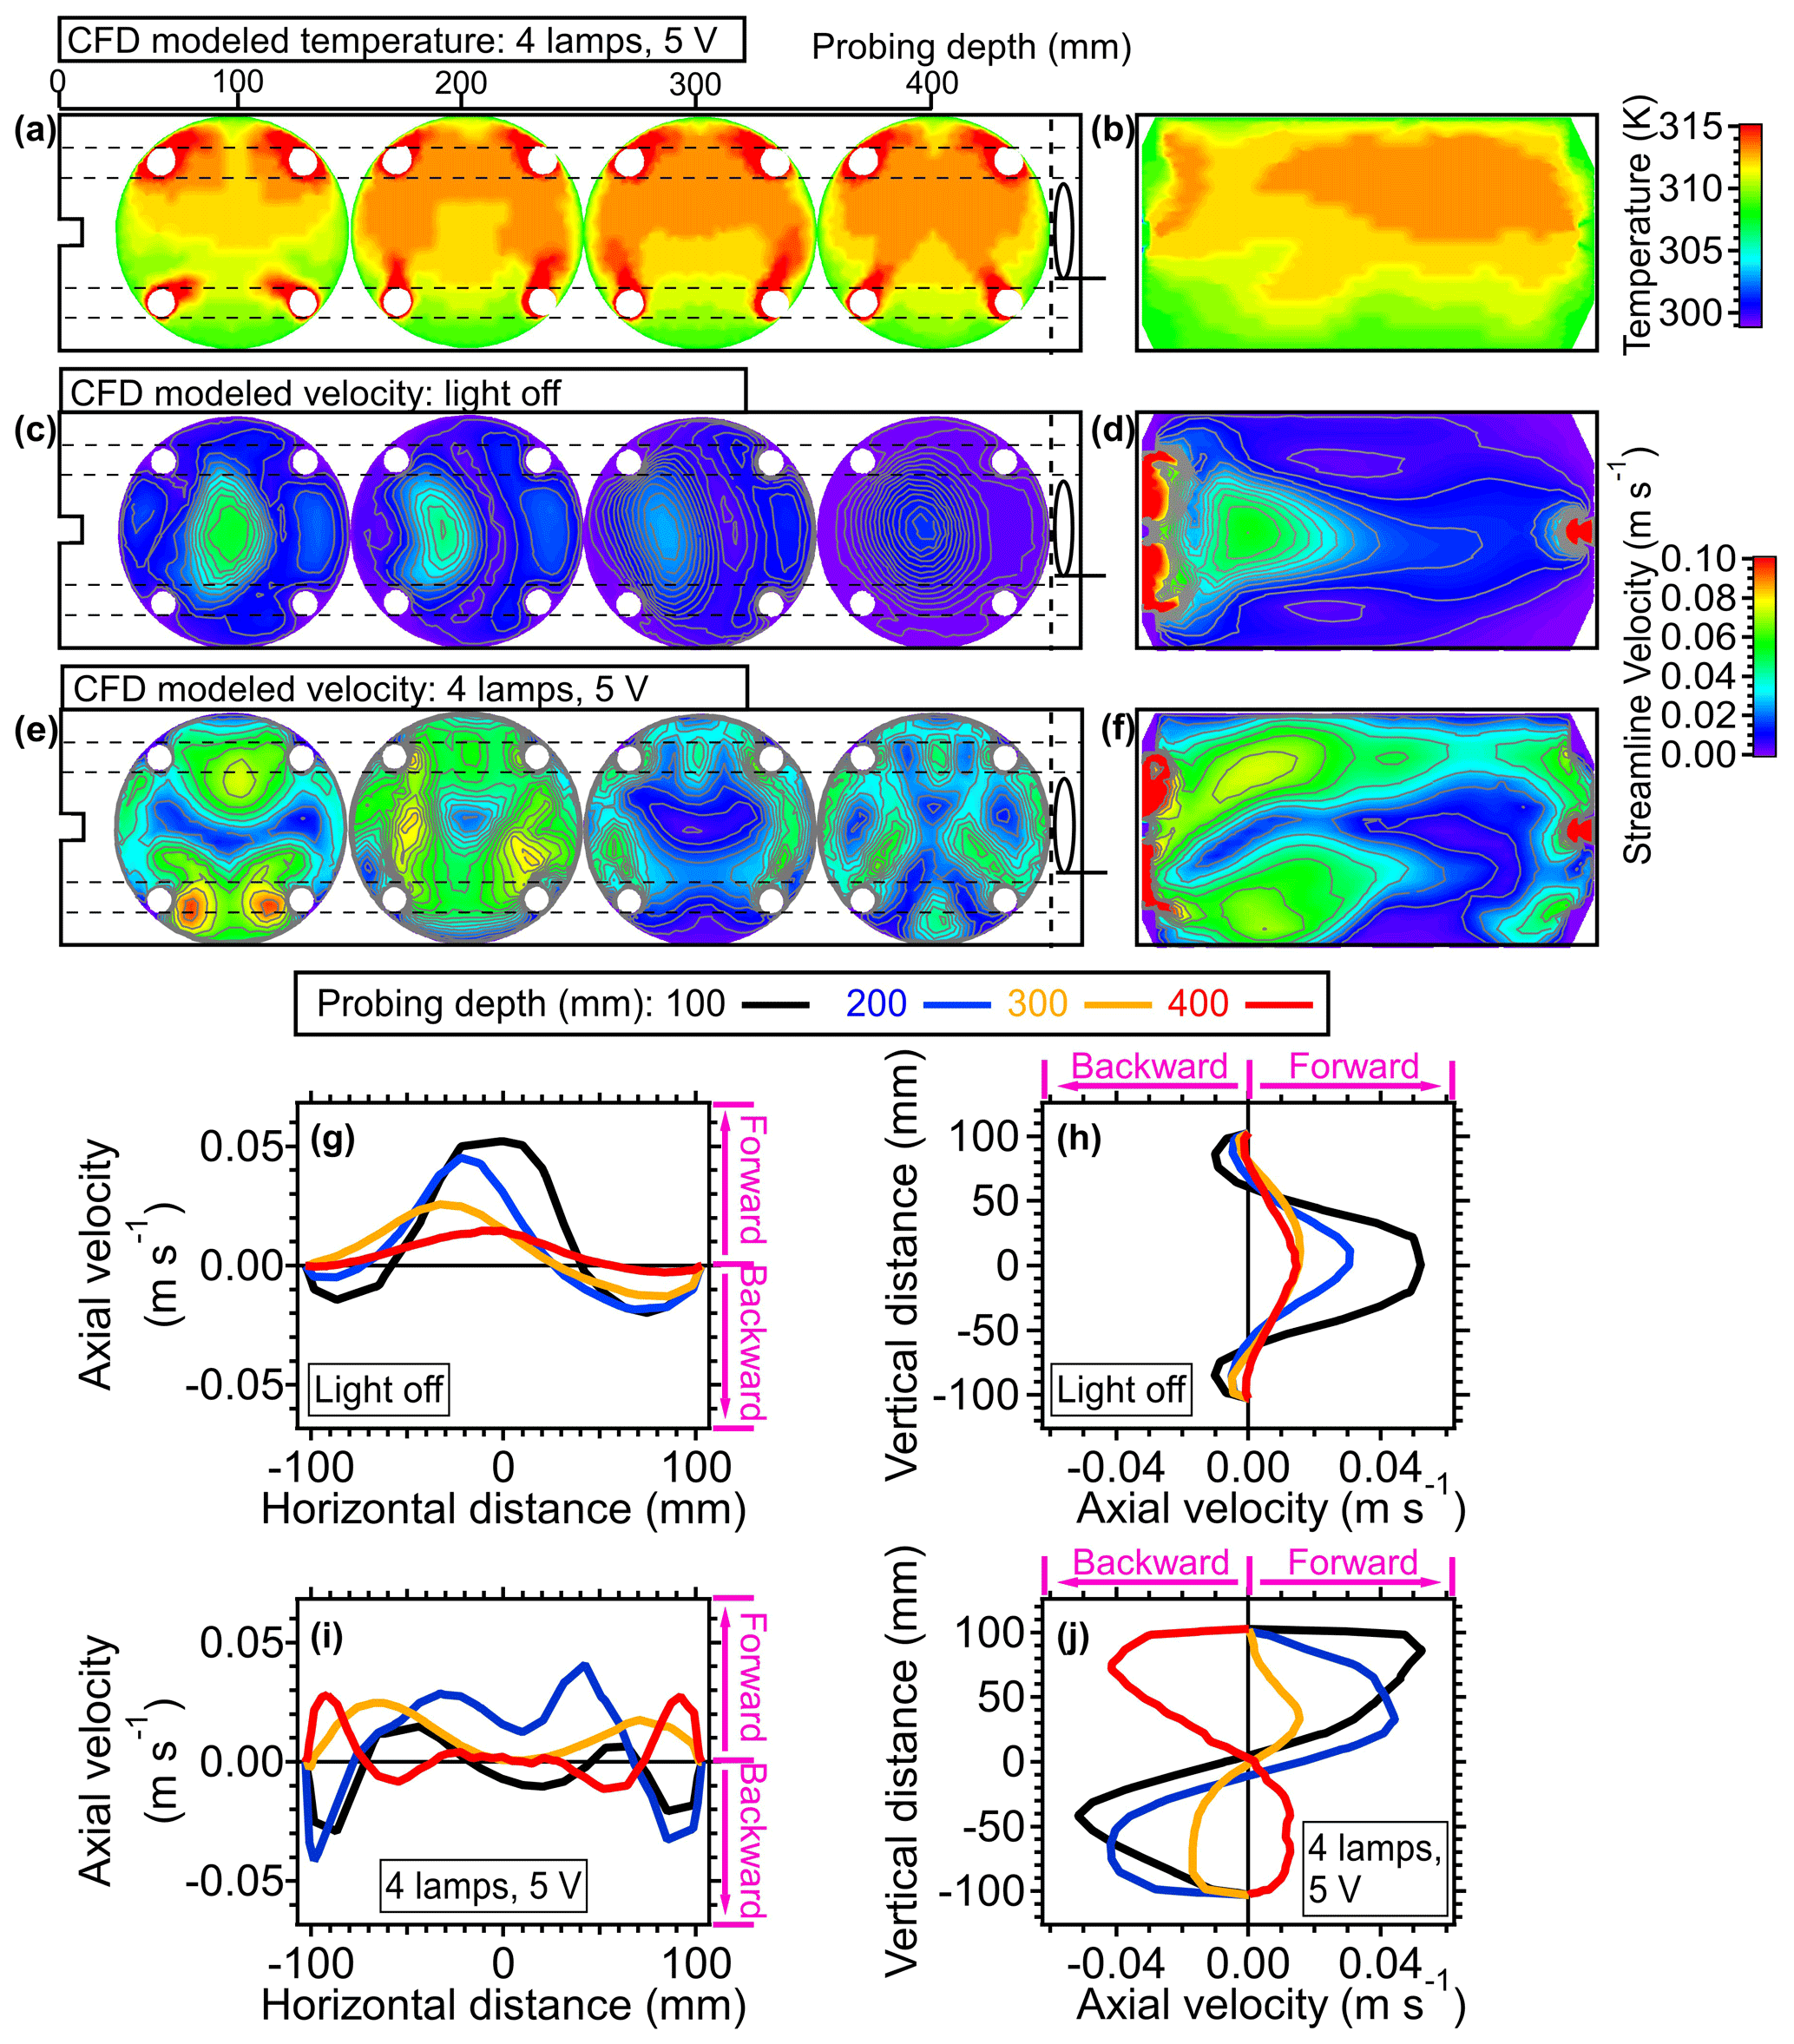
Figure 7(a) Three-dimensional simulation results demonstrating the cross-sectional temperature profiles. The four cross-sectional figures, from left to right, represent the results at probing depths of 100, 200, 300, and 400 mm for panels (a), (c), and (e). (b) Simulated lateral temperature profile inside of the OFR based on CFD simulation. Panels (a) and (b) were simulated with conditions that four lamps were set to be 5 V. (c) Three-dimensional simulation results illustrating cross-sectional velocity profiles and (d) lateral velocity profiles based on CFD simulation results. Panels (c) and (d) were simulated with conditions where the lamps were off (room temperature: 25 °C). Panels (e) and (F) show same plots as panels (c) and (d) with four lamps set to 5 V. One-dimensional axial velocity profiles at (g) horizontal and (h) vertical directions inside the OFR at room temperature are shown. One-dimensional axial velocity profiles at (i) horizontal and (j) vertical directions with four lamps set to 5 V are also given. The positive values indicate the velocity direction from inlet to outlet (forward) and the negative values represent the velocity direction from outlet to inlet (backward).
To investigate the non-isothermal effect on fluid dynamics within the PAM-OFR, the simulated flow distributions with and without heating effects are demonstrated in Fig. 7c–j. As illustrated in Fig. 7c and d, the flow velocity peaked following injection through an inlet diffuser, resulting in recirculation near the edge of the walls. The other place showing a higher air velocity was around the output of the exit (Figs. 7d and S10), which was generally used for particle output measurements. In addition to aerosol sampling, the air for gas-phase measurements is usually sampled through a perforated ring flow manifold in the back of the PAM-OFR to reduce wall effects and recirculation, which makes the airflow more stable and uniform (Fig. S1). Under the typical operating conditions, the flow distribution when both gas and aerosol are sampled is different from that when only the aerosol line is applied. However, incorporating the additional gas-phase output significantly increases the complexity of this CFD simulation. Thus, to simplify the simulation, we designated the airflow to be sampled solely through the exit port located at the center of the OFR back plate. Moreover, variations in the flow ratio between gas and aerosol lines would alter the flow distribution within the PAM-OFR.
Upon activation of the UV light, there was a significant alteration in flow distribution, characterized by an increased presence of flow bifurcation and recirculation, as shown in Fig. 7e and f. There was a pronounced recirculation in the lower region of the flow tube. This recirculation was further elucidated in Figs. 7g–j and S10. In the absence of heat effects within the PAM-OFR, the 1D flow profile generally exhibited symmetry in the vertical direction (Fig. 7h). A slight distortion on the 1D flow profile in the horizontal direction was reasonable due to the influence of the random motion and pressure gradient of gas (Fig. 7g). In the presence of a vertical axial temperature gradient, 1D flow profiles exhibited a skewed pattern due to the buoyancy of the warmer air. This recirculation effect manifested when the temperature gradient was larger, as well as when the flow rate was lower, leading to substantial alterations in both the residence time distribution (RTD) and the average residence time (τavg). Details of the τavg calculation can be found in Huang et al. (2017).
The average residence time (τavg) within the PAM-OFR under heat and non-heat scenarios were also measured and simulated in Fig. 8. Similar to the modeled results in Huang et al. (2017) and the measured results in Lambe et al. (2019), the measured RTDs under higher temperatures in this study exhibit shorter τavg (135–145 s at 5–10 V vs. 177 s at 0 V) due to the acceleration of air upon heating. This acceleration was mainly reflected in the early arrival time and shorter tails, as shown in Fig. 8. Huang et al. (2017) found that even minor temperature deviations (0.2 °C) in non-isothermal conditions could induce secondary flows, thereby significantly affecting the RTD and τavg. The RTD variation when lamps were turned on and off were also simulated in the CFD model, as shown in Fig. 8. Compared with the measured results, the simulated RTD generally exhibited an earlier arrival time and broader distribution at different light settings. The simulated τavg upon heating (173–180 s) exceeded the value when lights were off (167 s), indicating that the recirculation in the model introduced by heating prolonged the τavg rather than reducing it. This discrepancy from the observed trend in τavg (Huang et al., 2017; Lambe et al., 2019) could be attributed to the fact that the recirculation was weighted more in the simulation than the real conditions, which also underscored the complexities of accurately simulating the orthogonal forces induced by both pressure gradient-driven forced convection (horizontal) and buoyancy-induced free convection (vertical) (Huang et al., 2017). Note the simulated τavg under a lamp setting of 10 V (173 s) was lower than the τavg under 5 V (180 s). This trend aligned with the measured results, indicating the increased gas diffusion upon heating was properly considered except the recirculation.
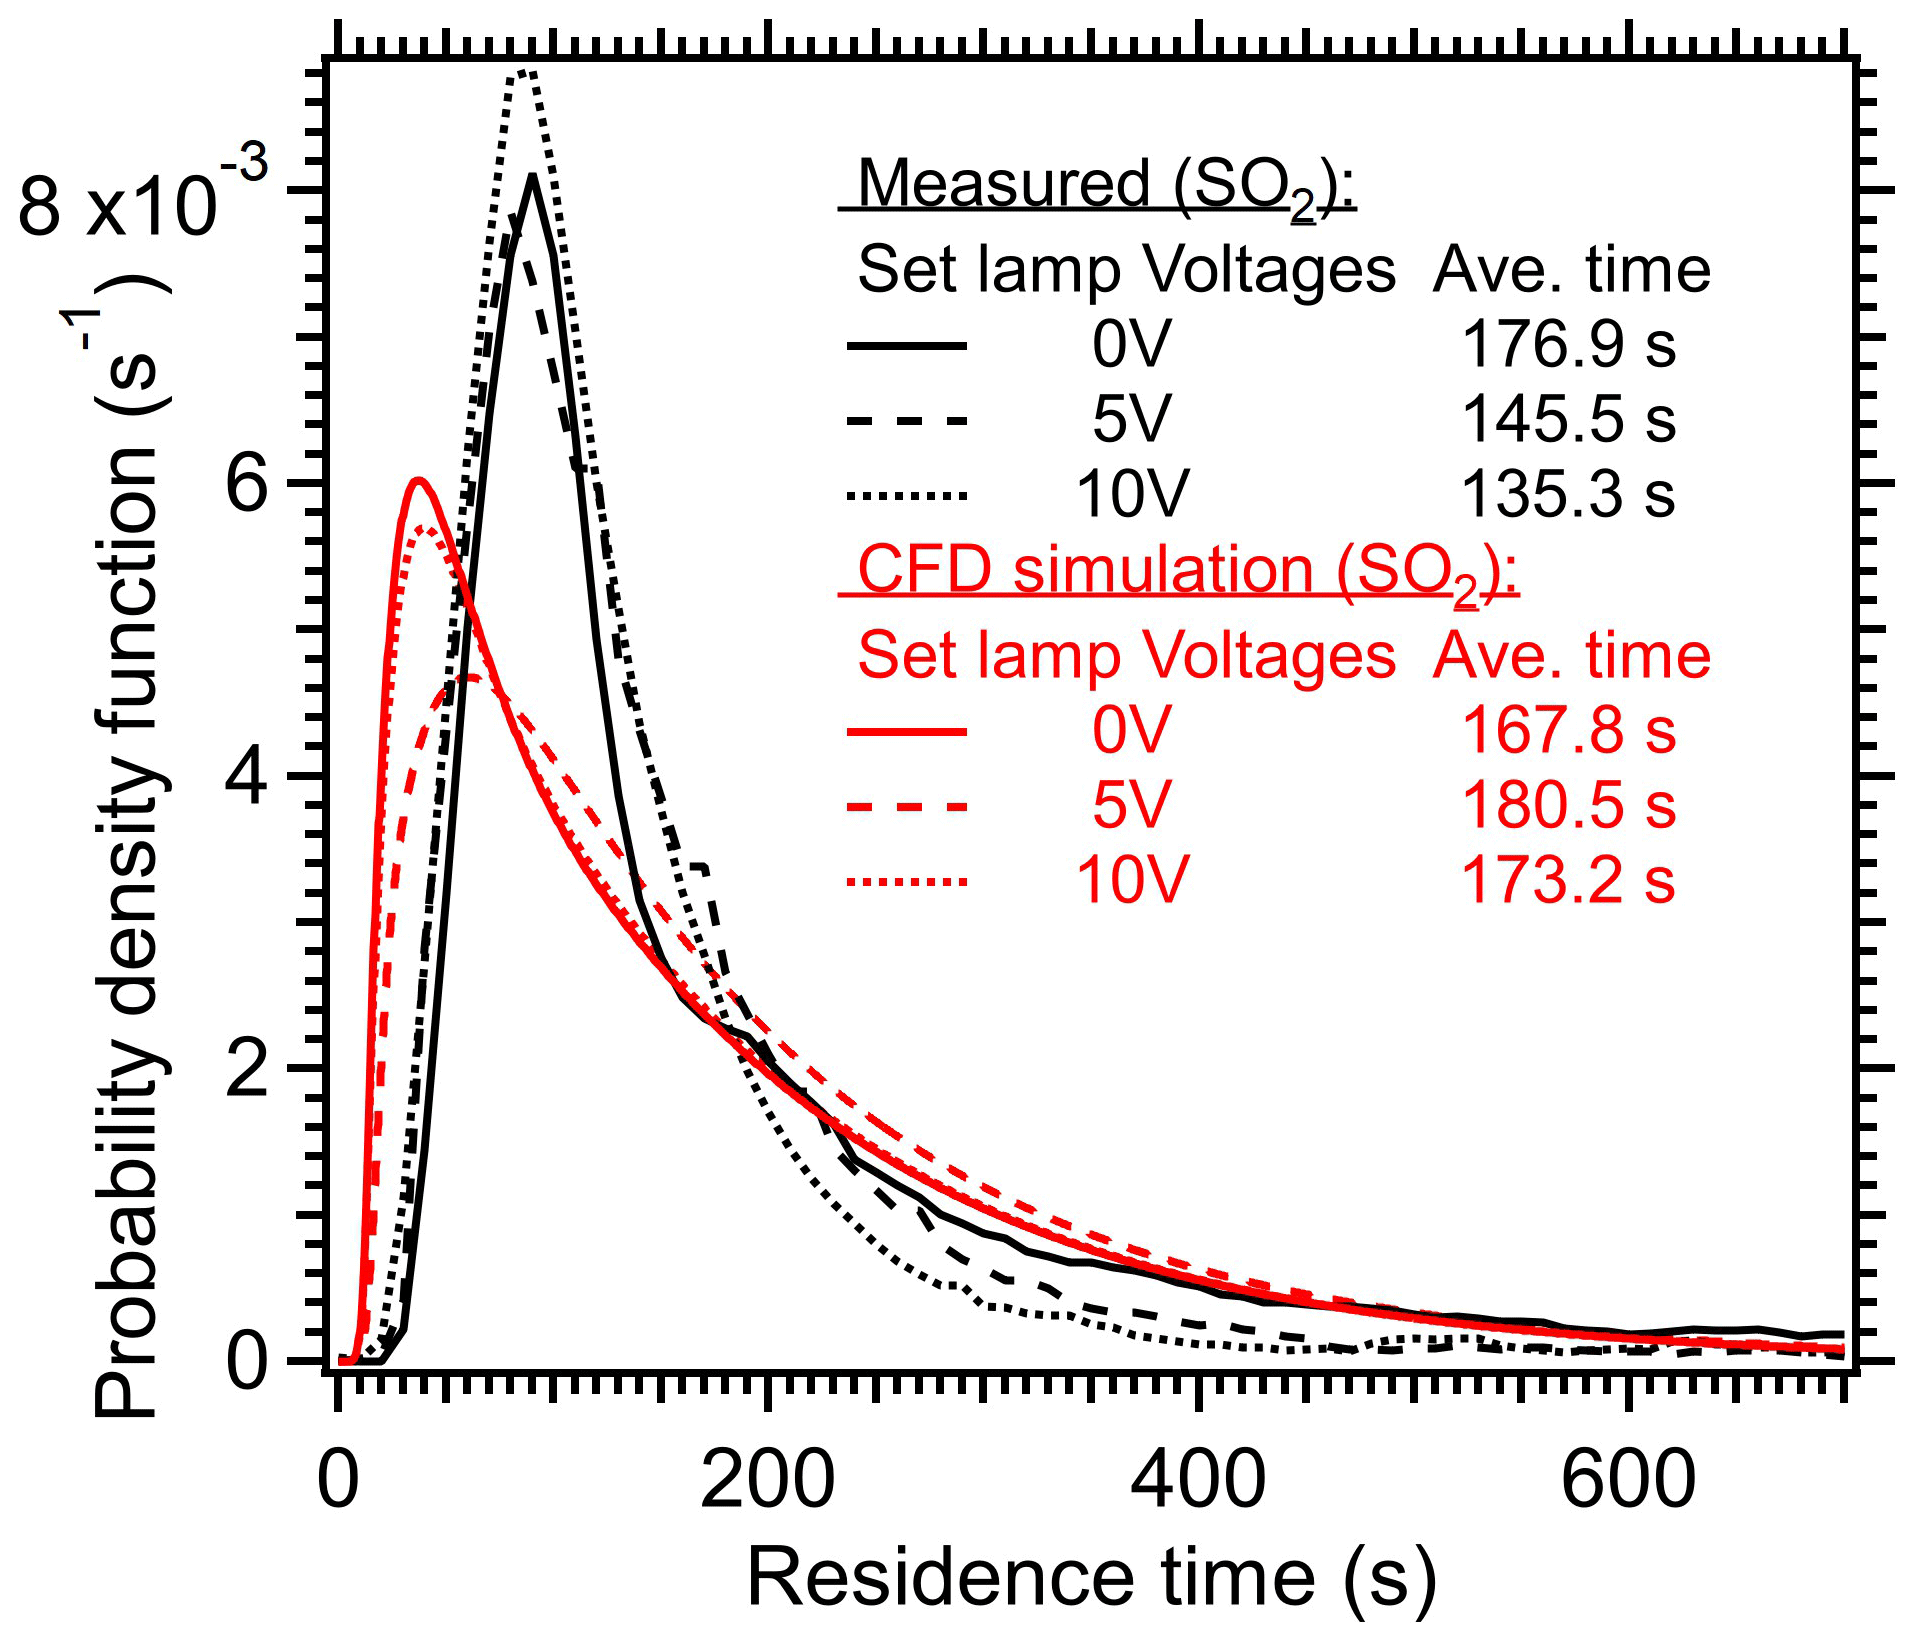
Figure 8Residence time distribution (RTD) of SO2 within the PAM-OFR under different lamp settings. A 2 s pulser of SO2 was injected into the OFR. The average residence times are also shown here. The simulated results from CFD model are shown as red lines.
In summary, the heating introduced from four lamps set to 5 V decreased τavg by 18 %–23 % in comparison to dark OFR experimental conditions. This was considered an upper limit variation on τavg for a typical OFR setting where the lamp voltages were usually below 3 V to obtain OH exposures of less than 5 d. The variation in RTD altered the exposure time of gas and aerosol species within the PAM-OFR, which could impact the gas and particle oxidation conditions. In the following sections, this impact will be systematically discussed.
3.3 Temperature influence on gas-phase reaction and OH exposure
In this section, the temperature influence on gas-phase reactions is systematically investigated. We take the oxidation of SO2 within OFR as an example to simulate its gas-phase reaction with oxidants (mainly OH) across a temperature range of 25 to 40 °C (binned with 5 °C) using the KinSim Model. The simulation at 25 °C emulates the typical laboratory conditions, while 40 °C simulation represents the approximate temperature observed at the upper limit of lamp voltage (5–10 V, corresponding to a photochemical age of ∼ 10–30 d, Fig. 2). In addition, to account for the RTD influences on gas-phase reactions under different temperatures, the scenarios with measured RTDs under 25 and 40 °C are both simulated here.
In general, when the temperature variation within OFR (the same RTD as measured at 25 °C being applied for cases at different temperatures) was considered, the influences of temperature increase due to lamp heating on the gas-phase reaction rates were minimal. The concentrations of OH, HO2, O3, and O(1D) all showed a maximum of ∼ 5 % increase at the highest photon flux, which was consistent with the simulated results using the same KinSim model in Li et al. (2015). The SO2 decay and OH exposure also showed negligible variations in the model (Fig. 9e and f). When the temperature influences on the RTD were taken into account, the variation trend of oxidant concentration was mixed due to the combined negative effect of the reduced average residence time (τavg) and the positive effect of temperature on oxidant concentration (Li et al., 2015). The parameter most influenced was OH exposure, which showed 18 %–20 % lower values at 40 °C than at 25 °C due to the shorter residence time (τavg) upon heating. Our results suggest that an increase in temperature within OFR due to lamp heating would have a minimal impact on gas-phase reactions, whereas parameters related to the RTD distribution (e.g., OH exposure) should be considered in the current and future experiments.
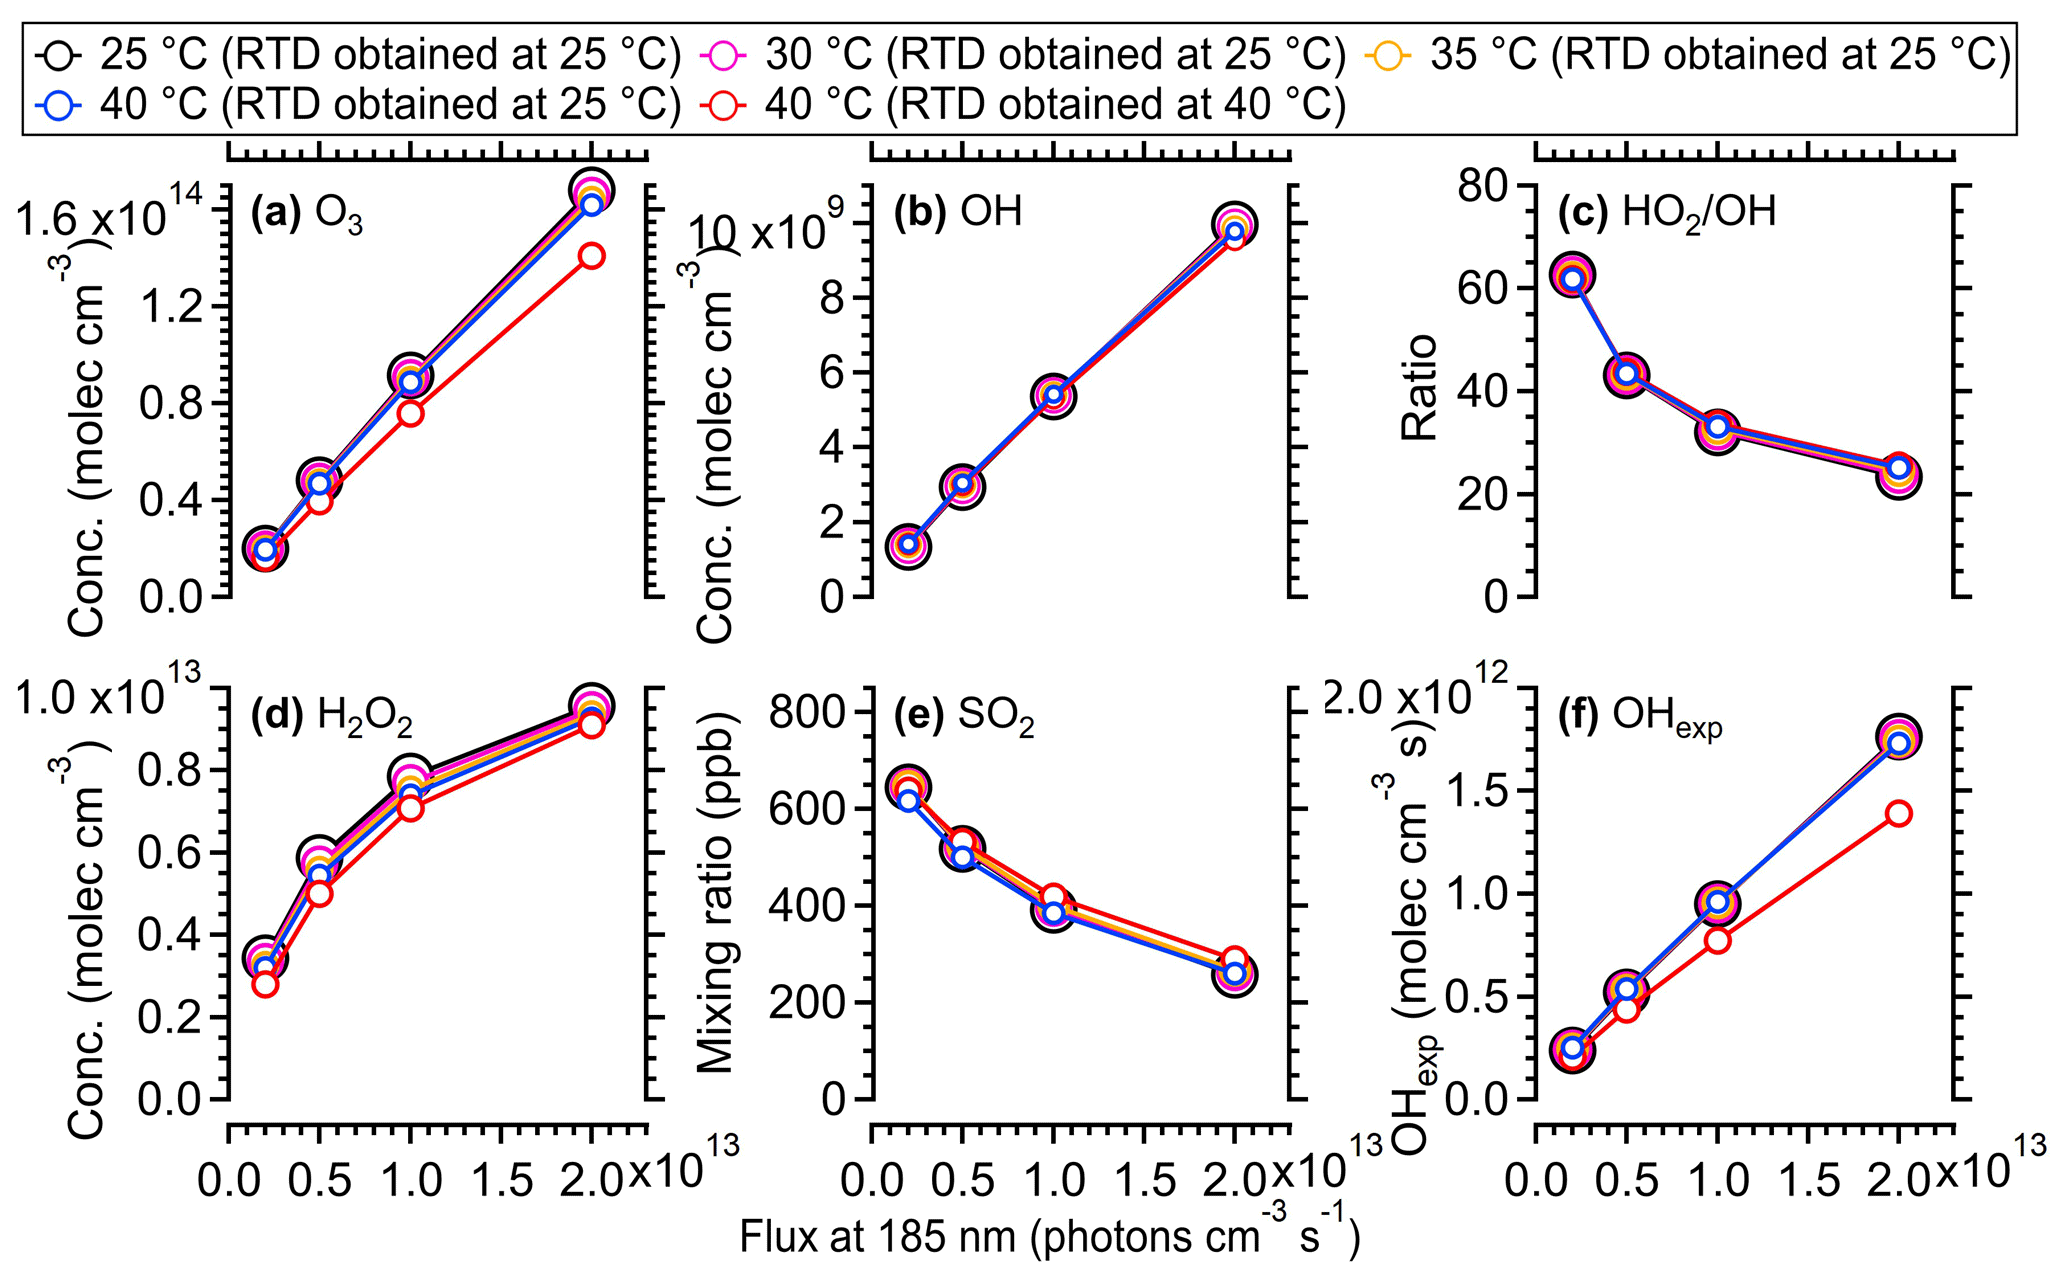
Figure 9Simulated concentrations of different oxidants from 25 to 40 °C within the OFR utilizing the radical mechanism of the KinSim model. A total of 800 ppb of initial SO2 and a 2.2 % water vapor mixing ratio (25 °C, 70 % RH) were used. The simulated results using measured RTD at 25 and 40 °C are both shown.
3.4 Temperature influence on the evaporation of ambient OA
Here, we estimated the potential losses of input ambient OA due to evaporation under enhanced temperature in OFR. This estimation is mainly based on literature results and modeling work. For the existing OA that is sampled into the OFR, the evaporation of input OA upon heating can be roughly estimated based on the results from thermal denuder (TD) experiments. These experiments involved heating aerosols from ambient or room temperatures (20–25 °C) to elevated temperatures (typically 60–200 °C) over a typical residence time of 10–60 s (typically ∼ 20 s) (Huffman et al., 2009; Xu et al., 2021; Hu et al., 2016; Saha et al., 2017; Kolesar et al., 2015; Saha and Grieshop, 2016; Lee et al., 2011). Previous studies suggest the evaporation of aerosol is kinetically limited, which varies with temperature, residence time, OA mass and volatility, phase state, and dissociation rates for oligomers (Cappa, 2010; Riipinen et al., 2010; Roldin et al., 2014; Schobesberger et al., 2018). Based on the previous TD studies, an evaporation rate of 1 × 10⁻⁴–2.5 × 10⁻⁴ was usually observed under 50 °C of TD for ambient OA (typical average mass concentration: 10–30 µg m−3) (Huffman et al., 2009; Feng et al., 2023; Paciga et al., 2016). In an OFR experiment conducted on an aircraft, Nault et al. (2018) found an average mass loss of ∼ 32 % for ambient OA due to increased temperature in a dark OFR compared to the unperturbed air sampled (+17 °C on average) at a residence time of 150 s. This OFR experiment showed an evaporation rate of 1.2 × 10⁻⁴ ), which was within the range of reported values obtained from the higher-temperature TD experiments (1 × 10⁻⁴–2.5 × 10⁻⁴ ). Theoretically, when the temperature enhancement was assumed to be ∼ 5 °C and a residence time of 160 s was applied, a mass loss of 8 %–20 % was estimated for ambient OA in OFR. The increased temperature within OFR would also impact other semi-volatile inorganic species, e.g., ammonium nitrate (Heim et al., 2020).
3.5 Temperature influence on the SOA formation
The temperature can influence the SOA formation through changing gas and particle partitioning and RO2 fate, thus affecting the SOA yield and chemical composition (Takekawa et al., 2003; Li et al., 2007; Zhang et al., 2015; Price et al., 2016; Quéléver et al., 2019; Kristensen et al., 2020; Atkinson et al., 1987).
The formation of SOA from the oxidation of different VOC precursors within OFR was simulated at different temperatures using the SOM model (He et al., 2022; Eluri et al., 2018). Specifically, the kinetic phase partitioning of SOA generated via OH oxidation of typical ambient VOCs was simulated (Figs. 10, 11, and S12–S17) as a function of OFR temperature ranging from 20–40 °C (binned in 5 °C) and OA seed mass concentration from 1–80 µg m−3. The evaporation and chemical reaction of existing OA seed under different temperatures were not considered in the model. Note that the results, including SOA yield, size distribution, and O:C ratio for n-dodecane (Figs. 10 and 11), α-pinene (Figs. S12 and S15), toluene (Figs. S13 and S16), and m-xylene (Figs. S14 and S17), were examined under both high-NOx and low-NOx conditions. For dodecane, the simulated temperature-dependent SOA under high-NOx conditions in the SOM model was generally consistent with the chamber results presented in Lamkaddam et al. (2017).
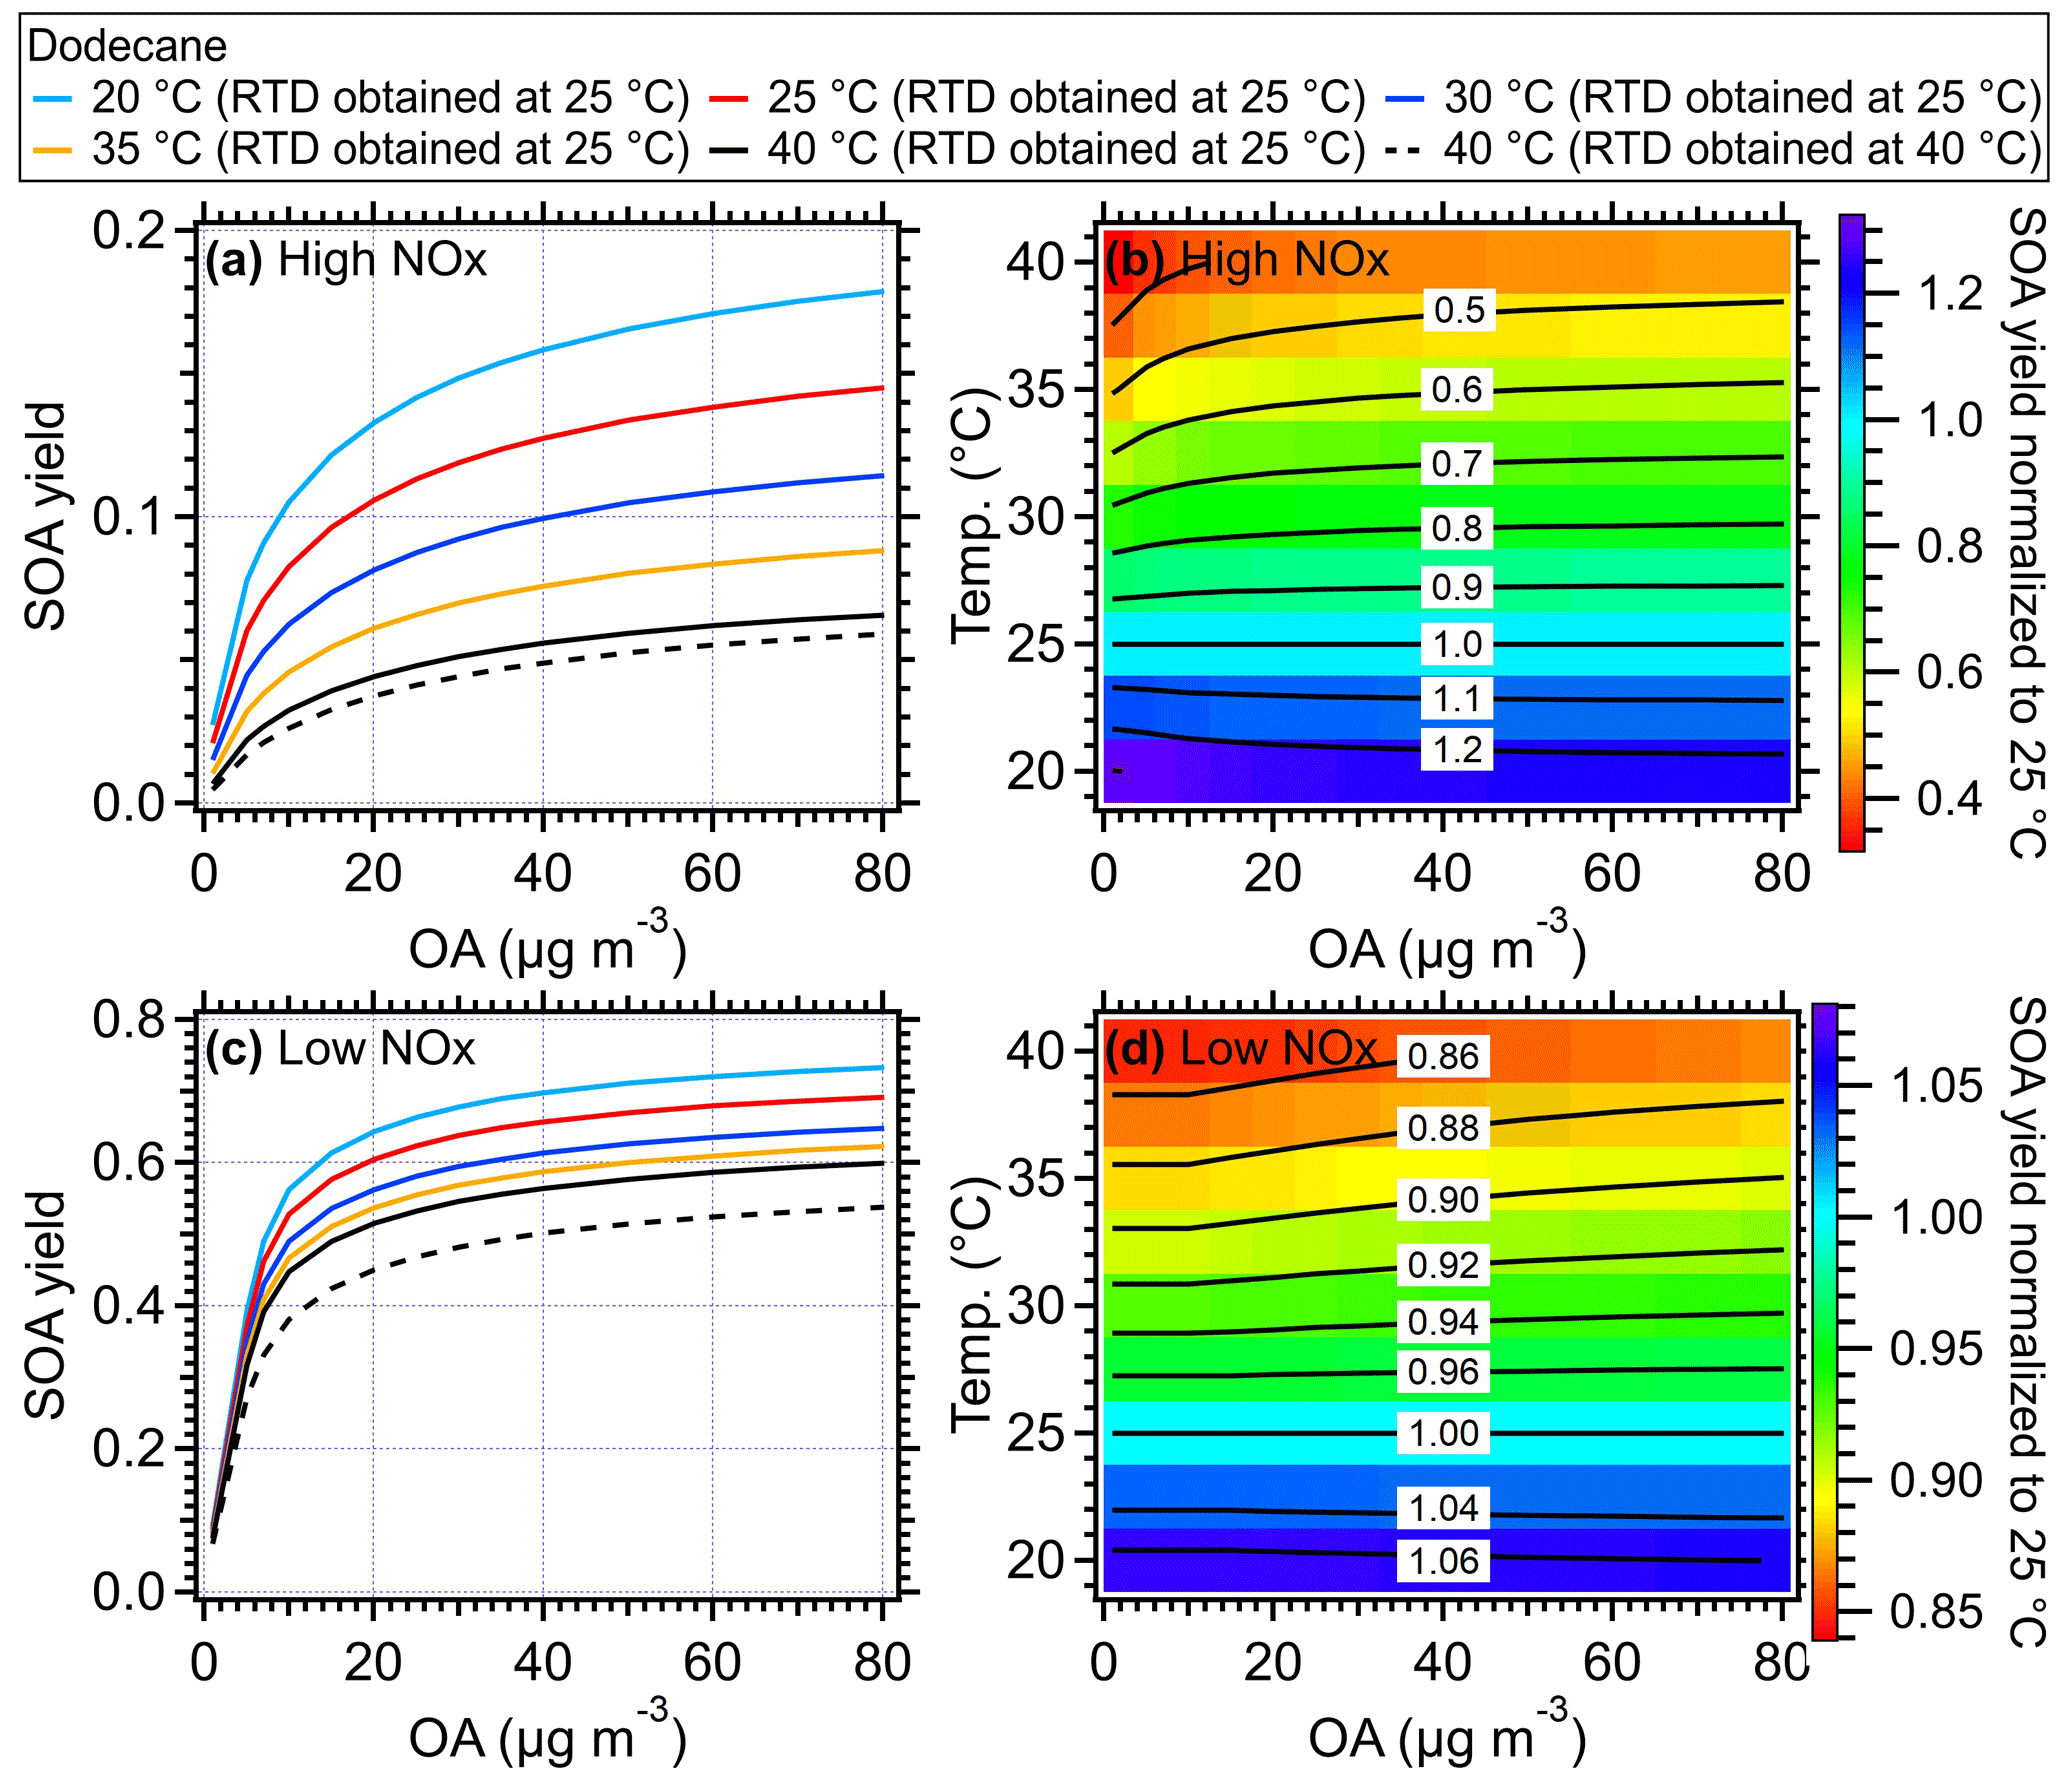
Figure 10Simulated SOA yield of dodecane as a function of mass concentration of OA seed (inlet mass concentration) and temperature within the OFR under (a) high-NOx and (c) low-NOx conditions, respectively. The simulated results using the measured RTD obtained at 40 °C were shown as dashed black lines. The ratio of SOA yield of dodecane from different temperatures compared to that of 25 °C under (b) high-NOx and (d) low-NOx conditions. The equivalent aging time was 1 d by assuming the ambient OH concentration equated to 1.5 × 10⁶ (Mao et al., 2009).
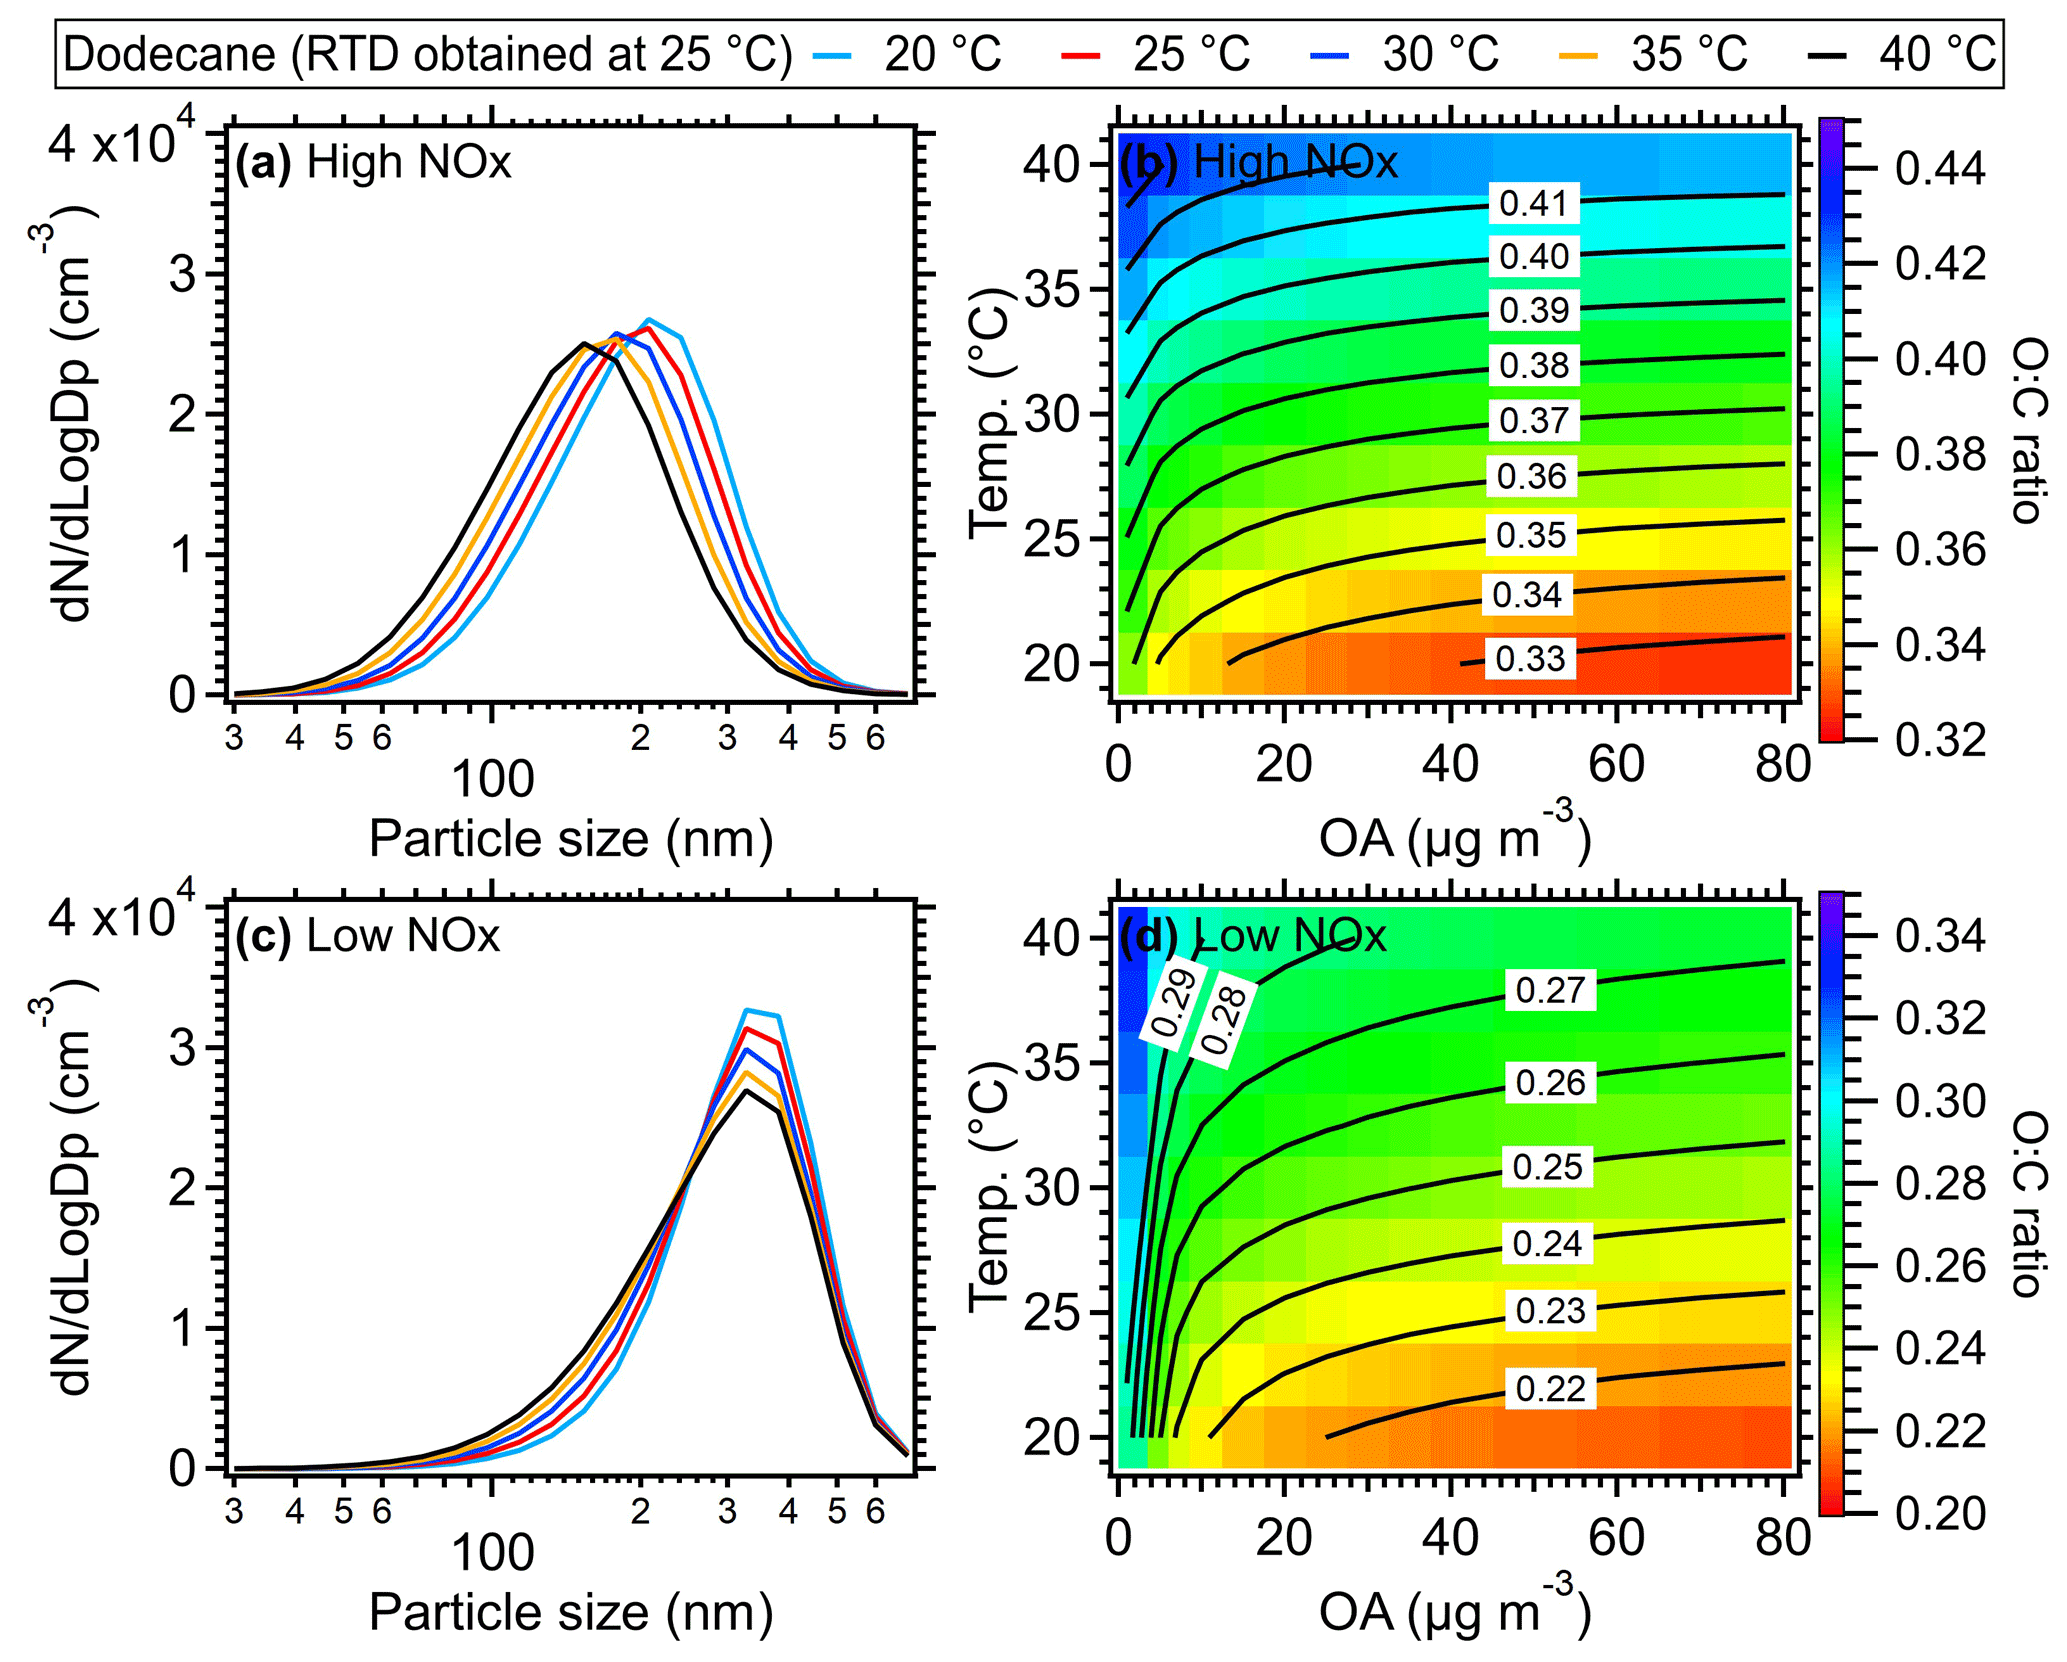
Figure 11Size distribution of dodecane SOA at different temperatures under (a) high-NOx and (c) low-NOx conditions, respectively. A mass concentration of 30 µg m−3 for OA seed (inlet mass concentration) was assumed for the size distribution simulation here. The O:C ratio of dodecane SOA as a function of temperature and mass concentration of the OA seed (inlet mass concentration) under (b) high- and (d) low-NOx conditions. The equivalent aging time of 1 d was found by assuming the ambient OH concentration equated to 1.5 × 10⁶ (Mao et al., 2009).
Generally, the higher temperatures result in lower SOA yields due to the increased partitioning of oxidation products in gas phase (Hildebrandt et al., 2009; Warren et al., 2009; Qi et al., 2010; Denjean et al., 2015). As shown in Figs. 10a and S12–S14, when RTD at 25 °C was used for different temperatures, the SOA yield of different VOC species including dodecane, α-pinene, toluene, and xylene could decrease by ∼ 20 % for a typical temperature increase of 5 °C in the OFR and by up to 40 %–50 % at 40 °C compared to the values at a typical 25 °C under high-NOx conditions. This decline in SOA yield indicated significant temperature effects on SOA formation within the OFR due to heating. To confirm the model results, we did a simple laboratory experiment and found the formed SOA masses were indeed substantially decreased in OFR due to the heating effect (Fig. S19), which is consistent with the simulated model results. The simulated particle size also showed decreases as the OFR temperature increased. The higher SOA mass and larger size of particles formed at lower temperatures were consistent with more gas-to-particle-phase partitioning and had also been observed in various temperature-controlled chamber studies (Clark et al., 2016; Lamkaddam et al., 2017; Boyd et al., 2017; Gao et al., 2022; Pathak et al., 2007; Tillmann et al., 2010; Price et al., 2016; Kristensen et al., 2020). When the measured RTD at 40 °C was applied in the model, an even lower SOA yield was achieved due to the shorter residence time of reactants. However, this influence was weaker than the direct influences caused by the temperature increase on SOA formation. A decrease of ∼ 8 % of dodecane SOA yield was found at 40 °C under high-NOx conditions and 10 % under low-NOx conditions compared to the results with RTD measured at 25 °C (Fig. 10). Under low-NOx conditions, a smaller reduction in size distribution (Figs. 11 and S15–S17) and SOA yield, which were 5 %–10 % for a temperature increase of 5 °C and up to 15 %–35 % for 15 °C, as shown in Figs. 10 and S12–S14, was found compared to high-NOx conditions. This smaller reduction was mainly due to the formation of more SOA with lower volatility under low-NOx conditions (e.g., acids, hydroperoxide) than under high-NOx conditions (Kroll and Seinfeld, 2008; Srivastava et al., 2022; Presto et al., 2005; Aruffo et al., 2022). The parameters of the SOM model were obtained based on fitting the results to the chamber results under high- and low-NOx conditions, respectively (Eluri et al., 2018; Cappa et al., 2016); thus, these parameters were set such that the volatility of SOA decreased more as a function of the functional groups added under low-NOx conditions than under high-NOx conditions (Cappa et al., 2013). Note that in the model we did not specifically treat the temperature effect on autoxidation reaction rate of RO2. For example, varied yields of highly oxygenated organic molecules (HOMs) from autoxidation were used at different temperatures, while constant yields for HOMs were used during the simulation in this study. The constant yields for HOMs used in the model could lead to a lower HOMs mass fraction in total SOA at high temperatures, which would result in an underestimation of the oxidation level and an overestimation of the volatility of SOA formed under low-NOx conditions (Bianchi et al., 2019). In addition, the wall loss was corrected in the SOM model with a constant wall loss rate of 2.5 × 10⁻³ s−1, which has been verified in the comparison of SOA model work between OFR and chamber studies (He et al., 2022). In theory, when the temperature of the OFR tube increased, the wall loss rate of low-volatility organic compounds should be smaller than under ambient temperature. Therefore, using a constant wall loss rate here would underestimate the SOA yield.
In previous studies, to correct the heating effects on SOA yield, Chen et al. (2013) and Lambe et al. (2015b) adjusted the SOA yield by 2 % K−1 of temperature increase relative to 298 K (Stanier et al., 2008). However, this is a rough correction, because the SOA yields of different precursors and reaction conditions are affected by temperature in varying degrees. For example, 0.41 % K−1–0.52 % K−1 was found for dodecane under high-NOx conditions based on the SOM model while 0.87 % K−1–0.89 % K−1 was found for α-pinene (Table S4). Note that in the OFR experiments, the reduction in SOA yield could be even larger due to the potential mass loss of seed OA upon heating in the OFR. The simulated results from the SOM model here provided an approximate reference to help recalibrate the SOA formation inside of OFRs. The detailed numbers calculated by the SOM model for different species under high- and low-NOx conditions can be seen in Table S4. For a specific recalibration, e.g., mixed precursors, a more detailed model or temperature-controlled experiments considering the mixing effect of precursors can be performed (Mcfiggans et al., 2019).
For the SOA chemical composition, the higher temperature within the OFR led to an increase in O:C ratios of SOA, e.g., ∼ 0.35 (25 °C) vs. ∼ 0.42 (40 °C) in dodecane experiments under high-NOx conditions and ∼ 0.23 (25 °C) vs. ∼ 0.28 (40 °C) under low-NOx conditions. The increased O:C ratio under higher temperatures was also found in the chamber results for m-xylene photooxidation in the presence of NOx in Qi et al. (2010) and O3 oxidation of α-pinene in Denjean et al. (2015). The higher O:C ratio at higher temperatures was probably caused by the less partitioning of semi-volatile and less-oxidized components into particle phase with increased temperatures (Clark et al., 2016; Gao et al., 2022).
In the model, the gas particle partitioning of oxidation products as a function of temperature was mainly determined by the enthalpy (), as described by the Clausius–Clapeyron equation (Eq. 1). A variable enthalpy dependent on saturation concentration (C∗, = −11 × ) was applied as the default setting based on Epstein et al. (2010). Various experimental studies using thermodenuders to measure OA volatility showed that the ambient for OA varied within a range of 50–150 kJ mol−1 (Epstein et al., 2010; Saha et al., 2017; Cappa and Jimenez, 2010). To further explore the sensitivity of temperature-dependent SOA formation to enthalpy, we demonstrated the SOA yield as a function of temperature under constant values in Figs. 12 and S18. The results indicated that the SOA yield obtained with varying was generally comparable to that when a constant of 100 kJ mol−1 was applied, which was the most commonly reported for ambient OA. Increasing increases the sensitivity of SOA formation to temperatures. When the upper (150 kJ mol−1) and lower limit (50 kJ mol−1) of were applied, the simulated results of SOA yield suggested a maximum of 22 % and 90 % variation, respectively, under high-NOx conditions and 18 % and 42 % variation, respectively, under low-NOx conditions. These variations were observed across different precursors and temperatures.
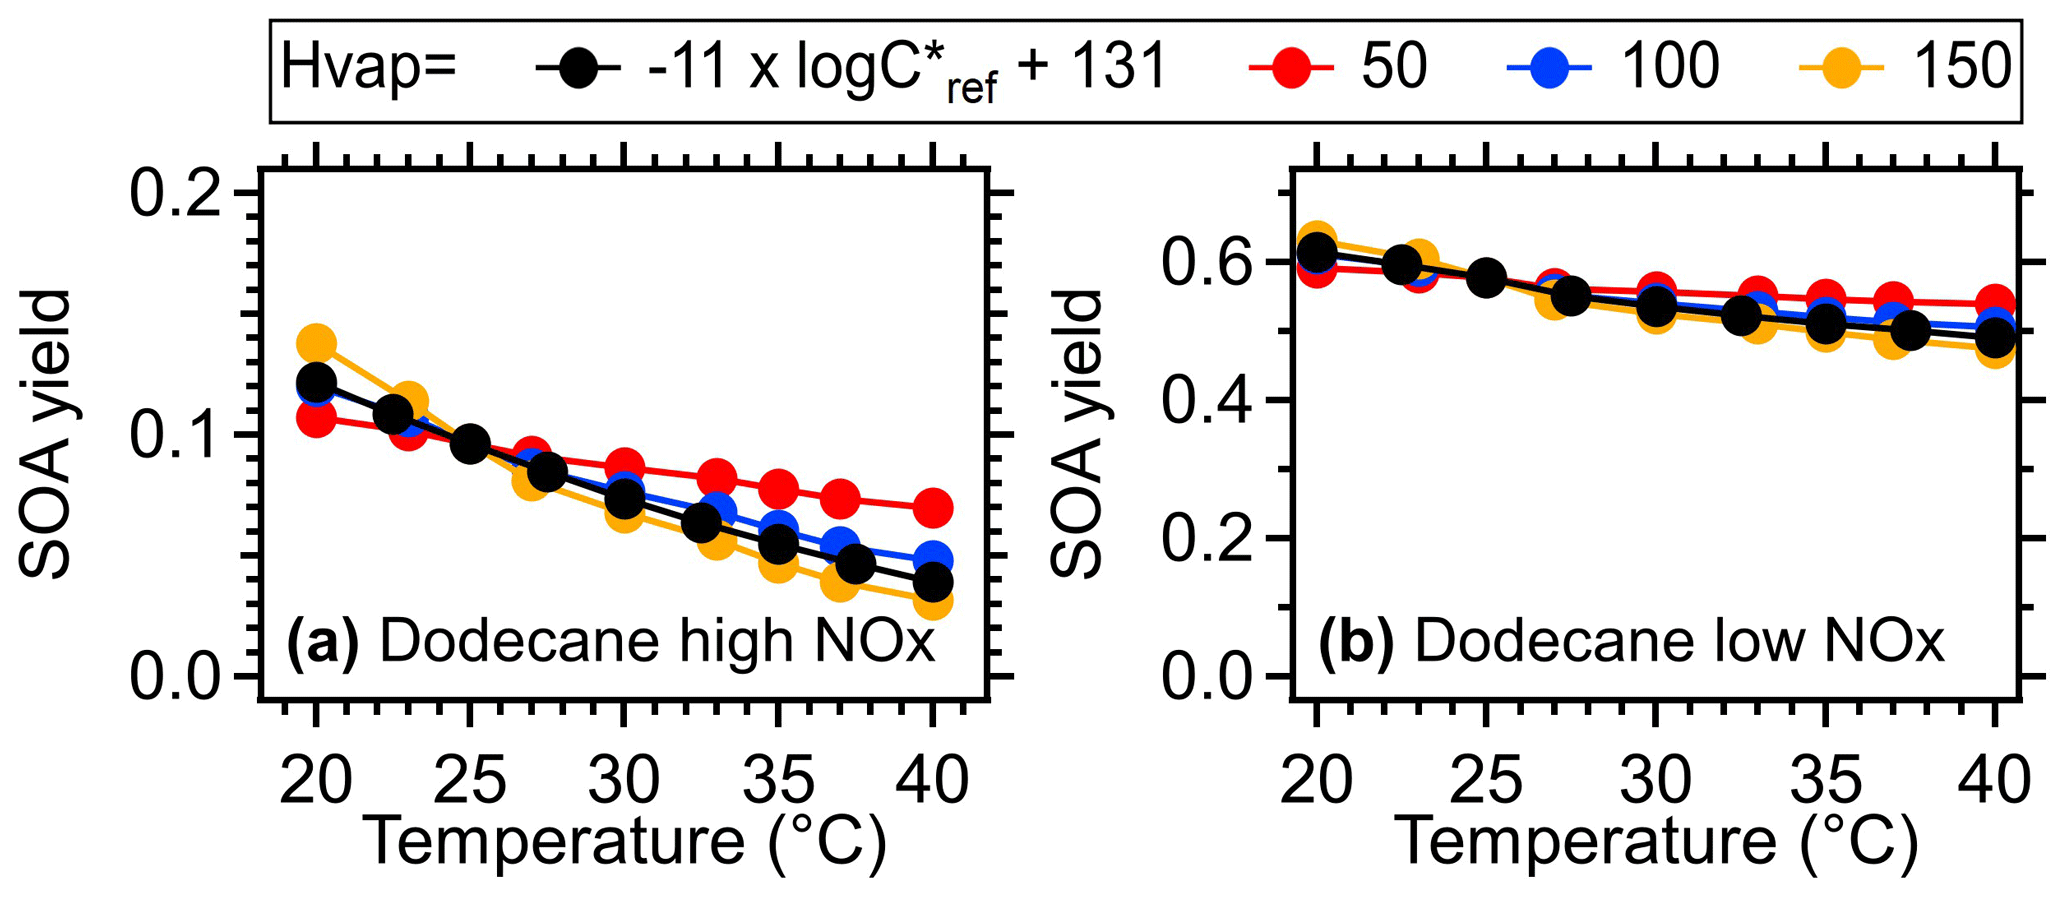
Figure 12SOA yield of dodecane as a function of temperature under different values (kJ mol−1). The mass concentration of OA seed (inlet mass concentration) was assumed to be 15 µg m−3. The equivalent aging time was 1 d by assuming the ambient OH concentration equated to 1.5 × 10⁶ (Mao et al., 2009).
In addition to the direct influences, the increase in temperature within OFR decreases the relative humidity (RH), which can also impact SOA formation. However, the literature shows that the impact of RH on SOA formation remains inconclusive. For example, Tillmann et al. (2010) found the SOA yield was higher at humid conditions (RH: 40 %–70 %) compared to dry conditions (RH: 0 %–10 %) as the RH influenced the formation of products in α-pinene ozonolysis experiments. In contrast, Zhang et al. (2019) found the SOA yield of m-xylene and OH oxidation decreased as RH increased in a chamber study, as the high RH led to less formation of oligomers and inhibited the reaction of RO2 autoxidation. Thus, elucidating the influence of humidity on various SOA formations is still a challenge and falls outside the purview of our research topic here. In addition, given the short residence time within OFR (seconds to minutes), the impact of liquid-phase reactions to SOA formation should be minimal.
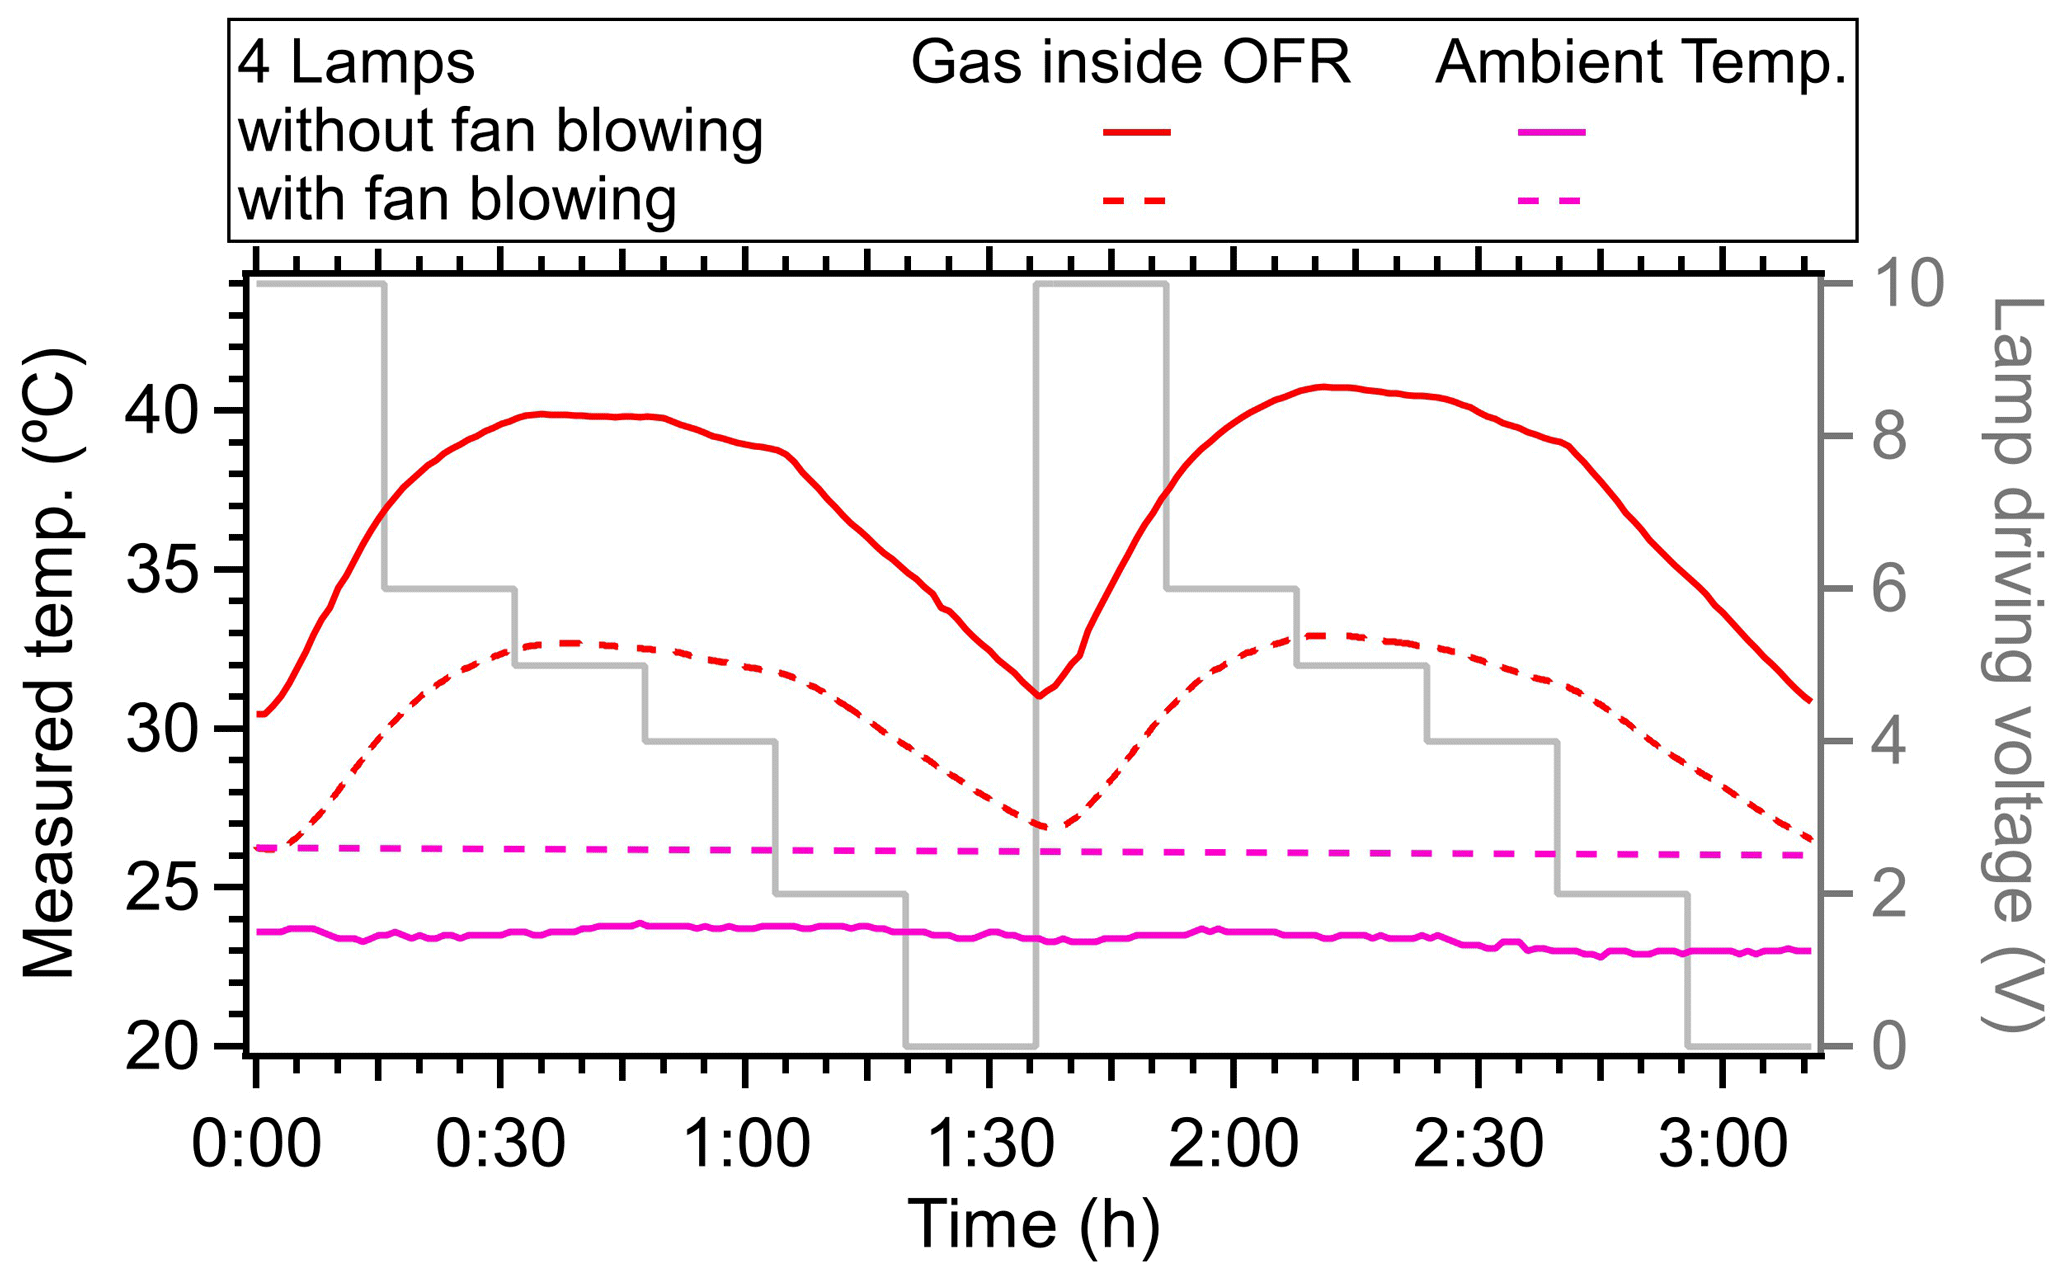
Figure 13The measured temperature in OFR with or without fan blowing on the flow tube in the laboratory. The ambient temperature is also shown. Two fans were used, with a diameter of 45 cm and a rotation rate of 1400 r min−1.
In summary, the heating effect induced by the lamps could significantly influence the SOA formation within OFR for certain high OH exposure applications. This impact of temperature varied depending on the specific precursors and reaction conditions. Simulation results suggested that the decreased ratio of SOA output to preexisting OA at higher OH exposures (e.g., equivalent aging time ≥ 5 d under low-NOx conditions) observed in previous studies (Hu et al., 2022; Lambe et al., 2015a; Ortega et al., 2016; Palm et al., 2016; Saha et al., 2018) may not only be due to heterogeneous reactions and/or enhanced gas-phase reaction. Instead, it could also be attributed to the lower SOA yield resulting from the temperature increase. However, the yield and ambient OFR results under equivalent aging time ≤ 4 d should remain valid (Palm et al., 2018). The temperature increase would also impact the phase of aerosols by changing the chemical composition of OA (viscosity, O:C, etc.), as the PAM-OFR temperature covered the usual range of glass transition temperatures of ambient OA (2–87 °C) (Y. Li et al., 2020; Derieux et al., 2018). The impact of temperature increases on the phase state (i.e., viscosity) of aerosol phases, wall loss, or other effects needs to be further studied.
3.6 Approaches to reduce the heating effect
In the PAM-OFR, one approach to reduce the heating influence of the lamps is to shorten the OFR residence time at the expense of decreasing the maximum achievable OH exposure and time available for low-volatility VOC (LVOC) condensation onto aerosols (Peng and Jimenez, 2020). Another method involves using fewer lamps with lower voltage settings; for example, using two lamps at less than 3 V maintains a temperature increase of less than 5 °C while still achieving OH exposures of up to 5 d under low-NOx conditions. In addition, it can also be useful to enhance heat transfer away from the PAM-OFR to reduce its operating temperature, e.g., blowing air with fans or air conditioners. To verify this, we used two large fans (45 cm in diameter at a distance of 30 cm from the PAM-OFR) directed towards the lower parts of the PAM-OFR. We found the maximum delta temperature (OFR minus ambient air) for a typical high-light setting decreased from 16 to 7 °C (44 % reduction), as shown in Fig. 13. This experiment demonstrated that blowing the flow tube with fans is an extremely effective way to compensate for the lamp heating and is simple without major trade-offs. Moving the UV lamps outside the tube and designing a cooling system on the outer surface of OFR with circulating water or cold air can also be effective ways to improve the temperature control inside of OFR (Watne et al., 2018; Xu and Collins, 2021; Huang et al., 2017; Liu et al., 2018; Chu et al., 2016; Zhao et al., 2021; Li et al., 2019); however, these will require a substantial redesign of the hardware of OFR enclosure and are beyond the scope of this paper. Mounting the lamps outside of the OFR limits the use of OFR185 mode due to the low transmission efficiency of quartz glass for light at 185 nm (Simonen et al., 2017). Thus, the OFR254 mode is usually used under this configuration. Cooling down the OFR would also affect RTD since the heater transfer occurs via convection inside of OFR, which needs to be further investigated in the future.
The voltage setting strategy in the PAM-OFR also can be improved. In most of the OFR laboratory and field studies, OFR users usually changed the light setting monotonously from 0 to 10 V or from 10 to 0 V, which resulted in a continuously changing temperature within the PAM-OFR (Figs. 2, 5 and S4), resulting in a variable SOA formation yield at different temperatures (Fig. 10). To mitigate the variable heating effect, we suggest alternating between high- and low-voltage settings to minimize the heat accumulation. Figure 14 showed an example of such a light setting cycle using a sequence of 10, 2, 6, 3, 5, and 0 V (16 min per voltage). In such a way, although the average temperature within the PAM-OFR was still higher than the ambient temperature, the variation in measured temperature within the PAM-OFR can be maintained within a narrow range, exhibiting a smaller temperature deviation (± 1.97 °C) compared to the usual settings (Fig. 14a, ± 4.76 °C). Furthermore, this method allowed for less uncertainty in the variation trend of SOA yield as a function of OH exposure compared to those performed under monotonically increasing or decreasing light settings. As shown in Fig. 15c, when using the measured temperature to simulate the SOA formation from toluene in the OFR, the SOA showed two different concentration curves (2 %–32 % differences) when monotonic and non-monotonic light setting cycles were applied. The SOA formed from the proposed non-monotonic lamp setting cycle showed better agreement on mass concentration variation (Fig. 15c) and mass ratio (Fig. S20) compared to the SOA formation at 25 °C (40.4 %–80.0 % for non-monotone setting vs. 32.9 %–87.3 % for monotone setting), which would introduce fewer uncertainties in the SOA yield and other aspects, e.g., chemical composition.
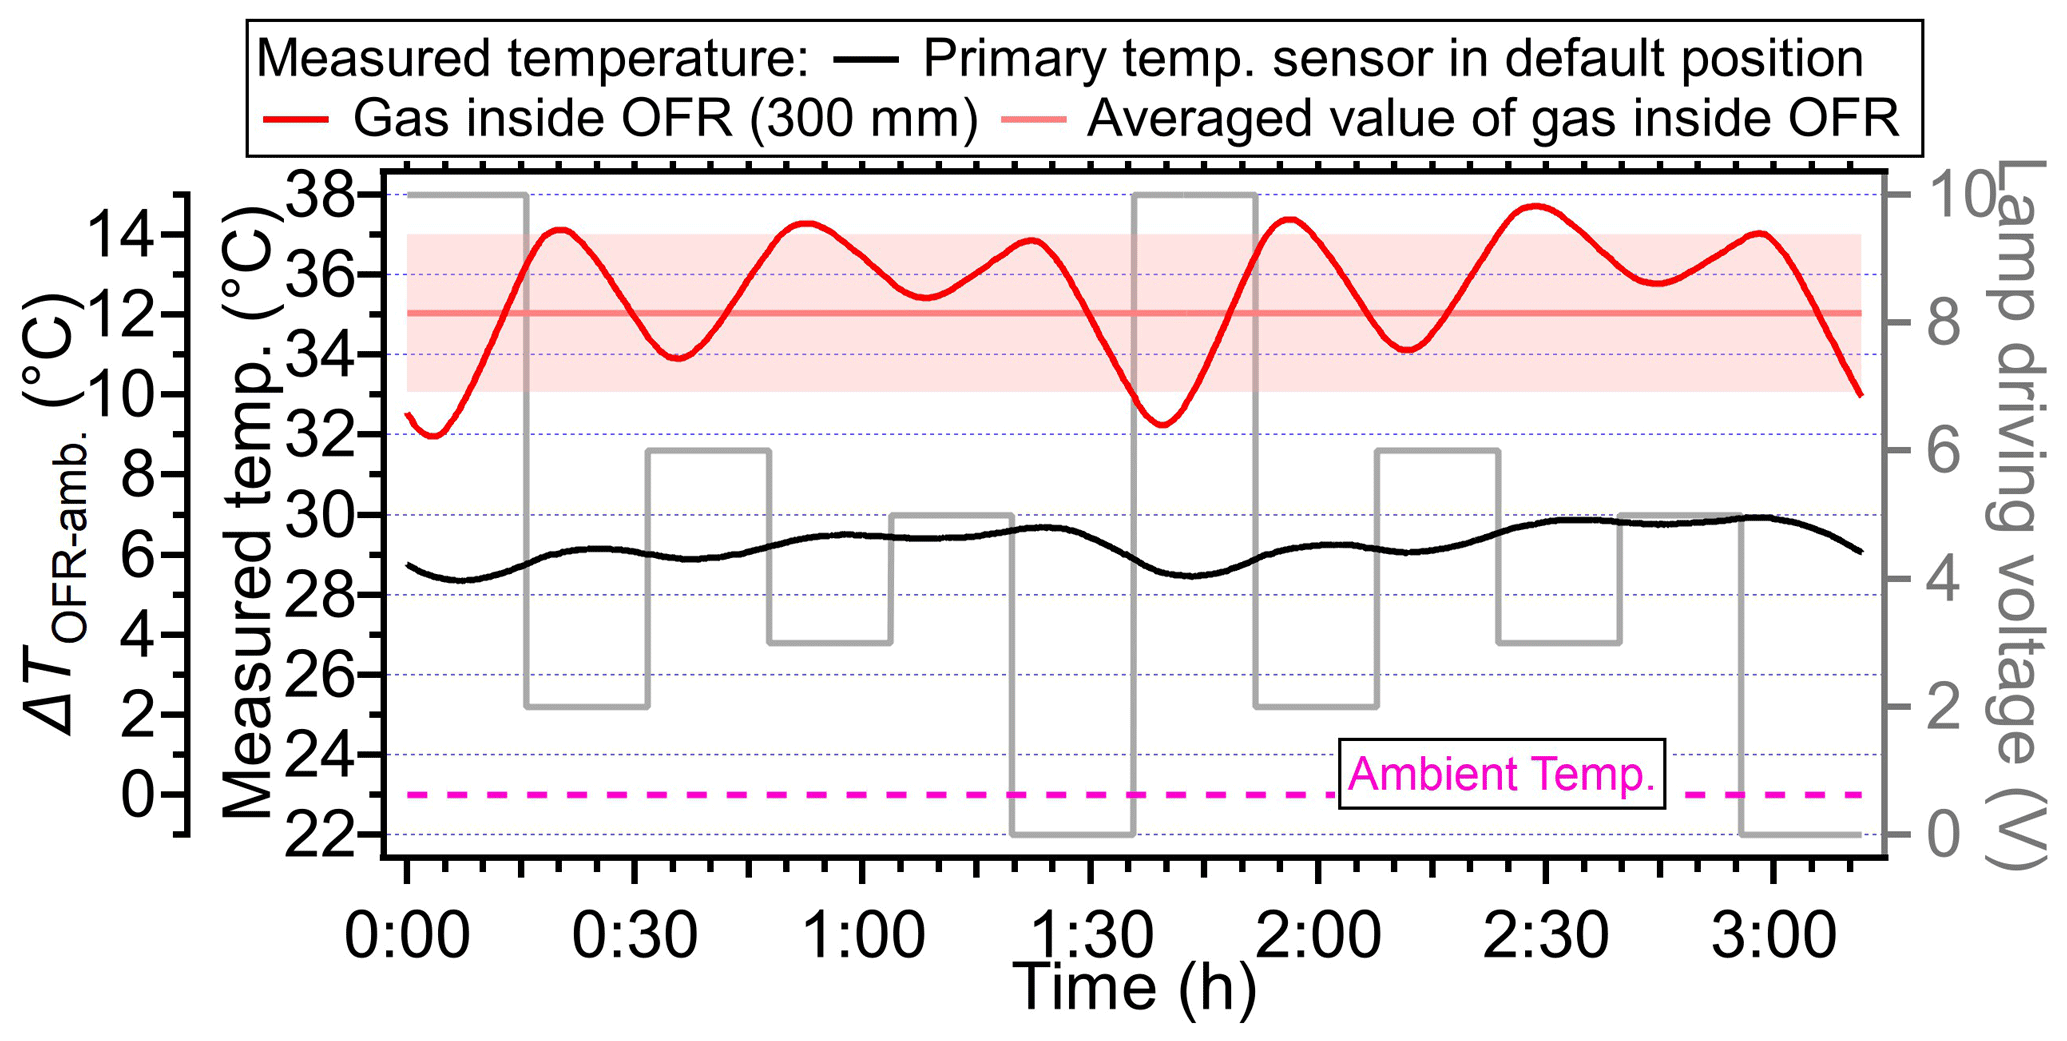
Figure 14The measured temperature variation when lamp-driving voltage cycles are set in a non-monotonic pattern (10, 2, 6, 3, 5, and 0 V for one cycle). The red line and shading are the average temperature and standard deviation (35.05± 1.97 °C), respectively, measured at the centerline (probing distance: 300 mm) inside the PAM-OFR. The dotted purple lines represent the ambient temperature. Each lamp voltage is set for 16 min.
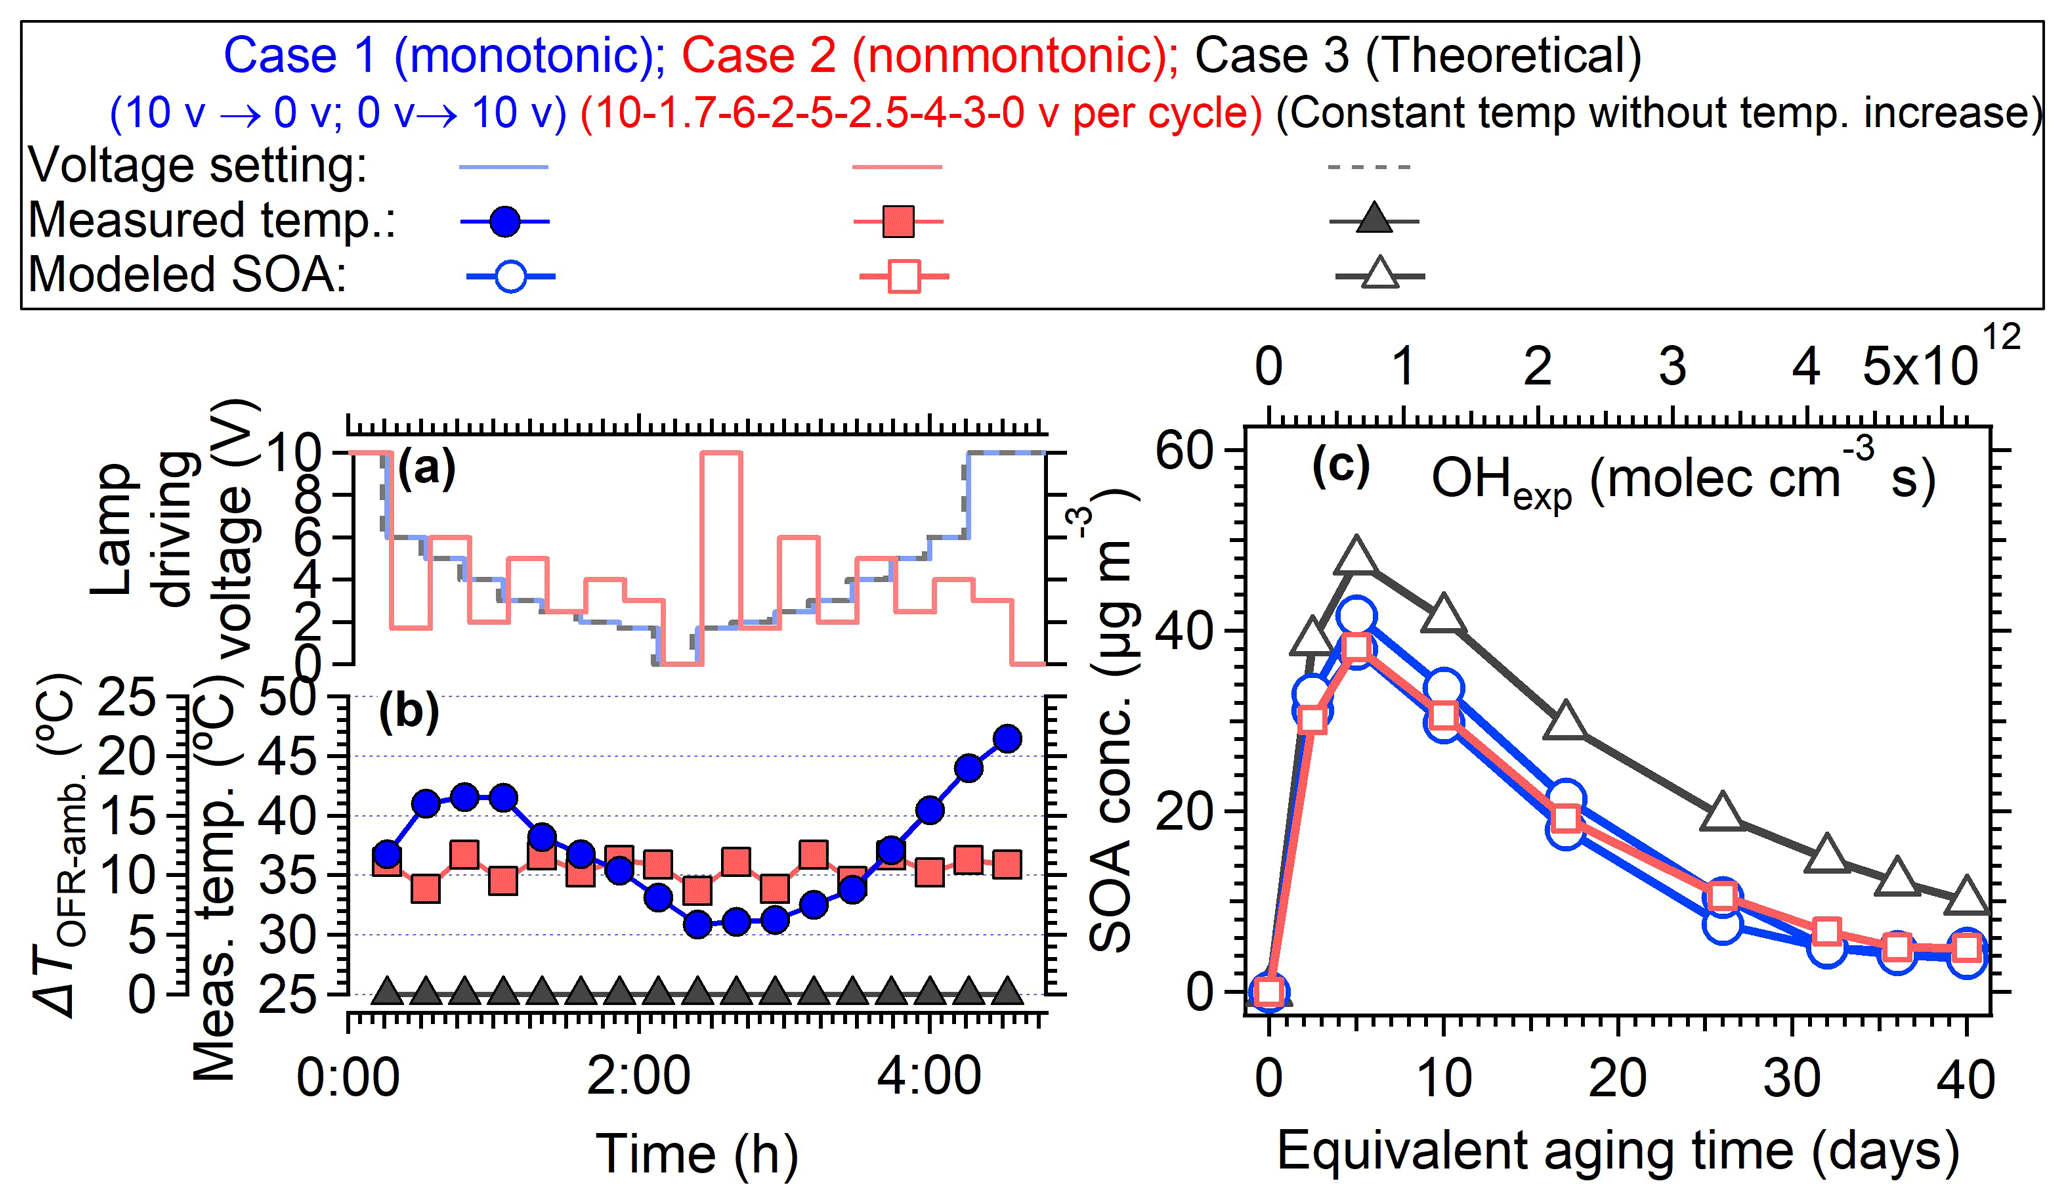
Figure 15(a, b) The temperature variation with lamp-driving voltage explored using a monotone (gradually decreased from 10 to 0 V and then increased from 0 to 10 V) and non-monotone pattern lamp power change pattern, respectively. (c) The modeled SOA formation from oxidation of 10 ppb toluene (OA seed = 30 µg m−3) with OH radicals as a function of OH exposure. The SOA formation under monotone and non-monotone scenarios were both simulated. The“theoretical” case 3 indicates the temperature was set to be constant (i.e., 25 °C).
We systematically measured the temperature distribution within the lamp-enclosed Aerodyne PAM oxidation flow reactor. Our findings indicated that the lamps within the PAM-OFR generated heating energy, thus leading to temperature increase within the PAM-OFR. A brief summary of the temperature increases and its influencing factors can be found in Table A1. The rise in air temperature was proportional to the lamp-driving voltage (OH exposures) and the number of lamps applied, while it decreased with increasing flow rate due to shorter residence times at higher flows. The distribution of this temperature increase varied depending on special positions, influenced by the complex interplay of thermal transfer and flow mixing. With default lamps from Light Sources Inc. installed, the temperature increase of the air in the PAM-OFR was generally below 5 °C (at central line) when the driving voltages of two lamps were below 3 V (typically < 5 d of equivalent atmospheric OH exposure under low-NOx conditions) and the flow rate was 5 L min−1 (average residence time, τavg = 150–180 s). The use of BHK lamps typically resulted in a smaller temperature increase in the PAM-OFR at the same OH exposure due to their lower power dissipation. The heating energy loss of the OFR system was mainly through the walls of the reaction chamber, followed by exiting air within the PAM-OFR and/or purged nitrogen.
The impact of temperature increase on the flow distribution, gas, and aerosol-phase chemistry within the PAM-OFR was systematically evaluated. The pulsed tracer measurements suggested that the increased temperature in the PAM-OFR induced the axial dispersion (Lambe et al., 2019), leading to a shorter average residence time (τavg). Although box model simulation results showed that the temperature increase in OFR had a negligible impact on gas-phase oxidant concentrations (< ∼ 5 %), it had a certain impact on the parameters related to τavg. For example, OH exposure (∼ 20 % decreased due to a temperature increase of 15 °C).
The increase in temperature has larger impacts on aerosol-phase chemistry than on gas-phase chemistry. When the temperature increase within the OFR was 5 °C at a flow rate of 5 L min−1, the evaporation loss of ambient OA was found to be 8 %–20 % based on thermodenuder and field experiments. The simulation from the SOM model showed the SOA yield from four typical precursors (n-dodecane, α-pinene, toluene, and m-xylene) could decrease < 20 % under high-NOx conditions and < 10 % under low-NOx conditions when the temperature in OFR increased by 5 °C. As temperature increased, the size distributions also showed a substantial decrease, while O:C ratios showed an increase. This work demonstrated the substantial influence of temperature on SOA formation and highlights the necessity of considering temperature effects when using the PAM-OFR for aerosol chemistry research. Based on the SOM model simulation results in Table S4, we recommend 0.19 % K−1–1.6 % K−1 and 0.26 % K−1–3 % K−1 for temperature effect correction for SOA yield from four typical precursors under high-NOx and low-NOx conditions, respectively.
In general, applying higher flow rate and lower lamp power and cooling the reactor with fans are recommended to keep the temperature increase low in the OFR system. In addition, to control the variation of enhanced temperature introduced by the monotonic trend for lamp settings (e.g., gradually decreased from 10 to 0 V and then increased from 0 to 10 V), we propose to set the voltage with high and low voltage alternatively (e.g., 10, 2, 6, 3, 5, and 0 V) to reduce the heating accumulation and keep the temperature variation within a narrow range. In summary, our evaluation of the temperature increase inside of lamp-enclosed OFR helps improve our understanding of flow distribution and chemistry inside this type of OFR, which can help to reduce the uncertainty of OFR usage in the future.
Table A1Summary of the effect of different dimensional factors on the temperature of air inside OFR and the impact of temperature enhancement on flow, gas, and aerosol chemistry inside OFR.
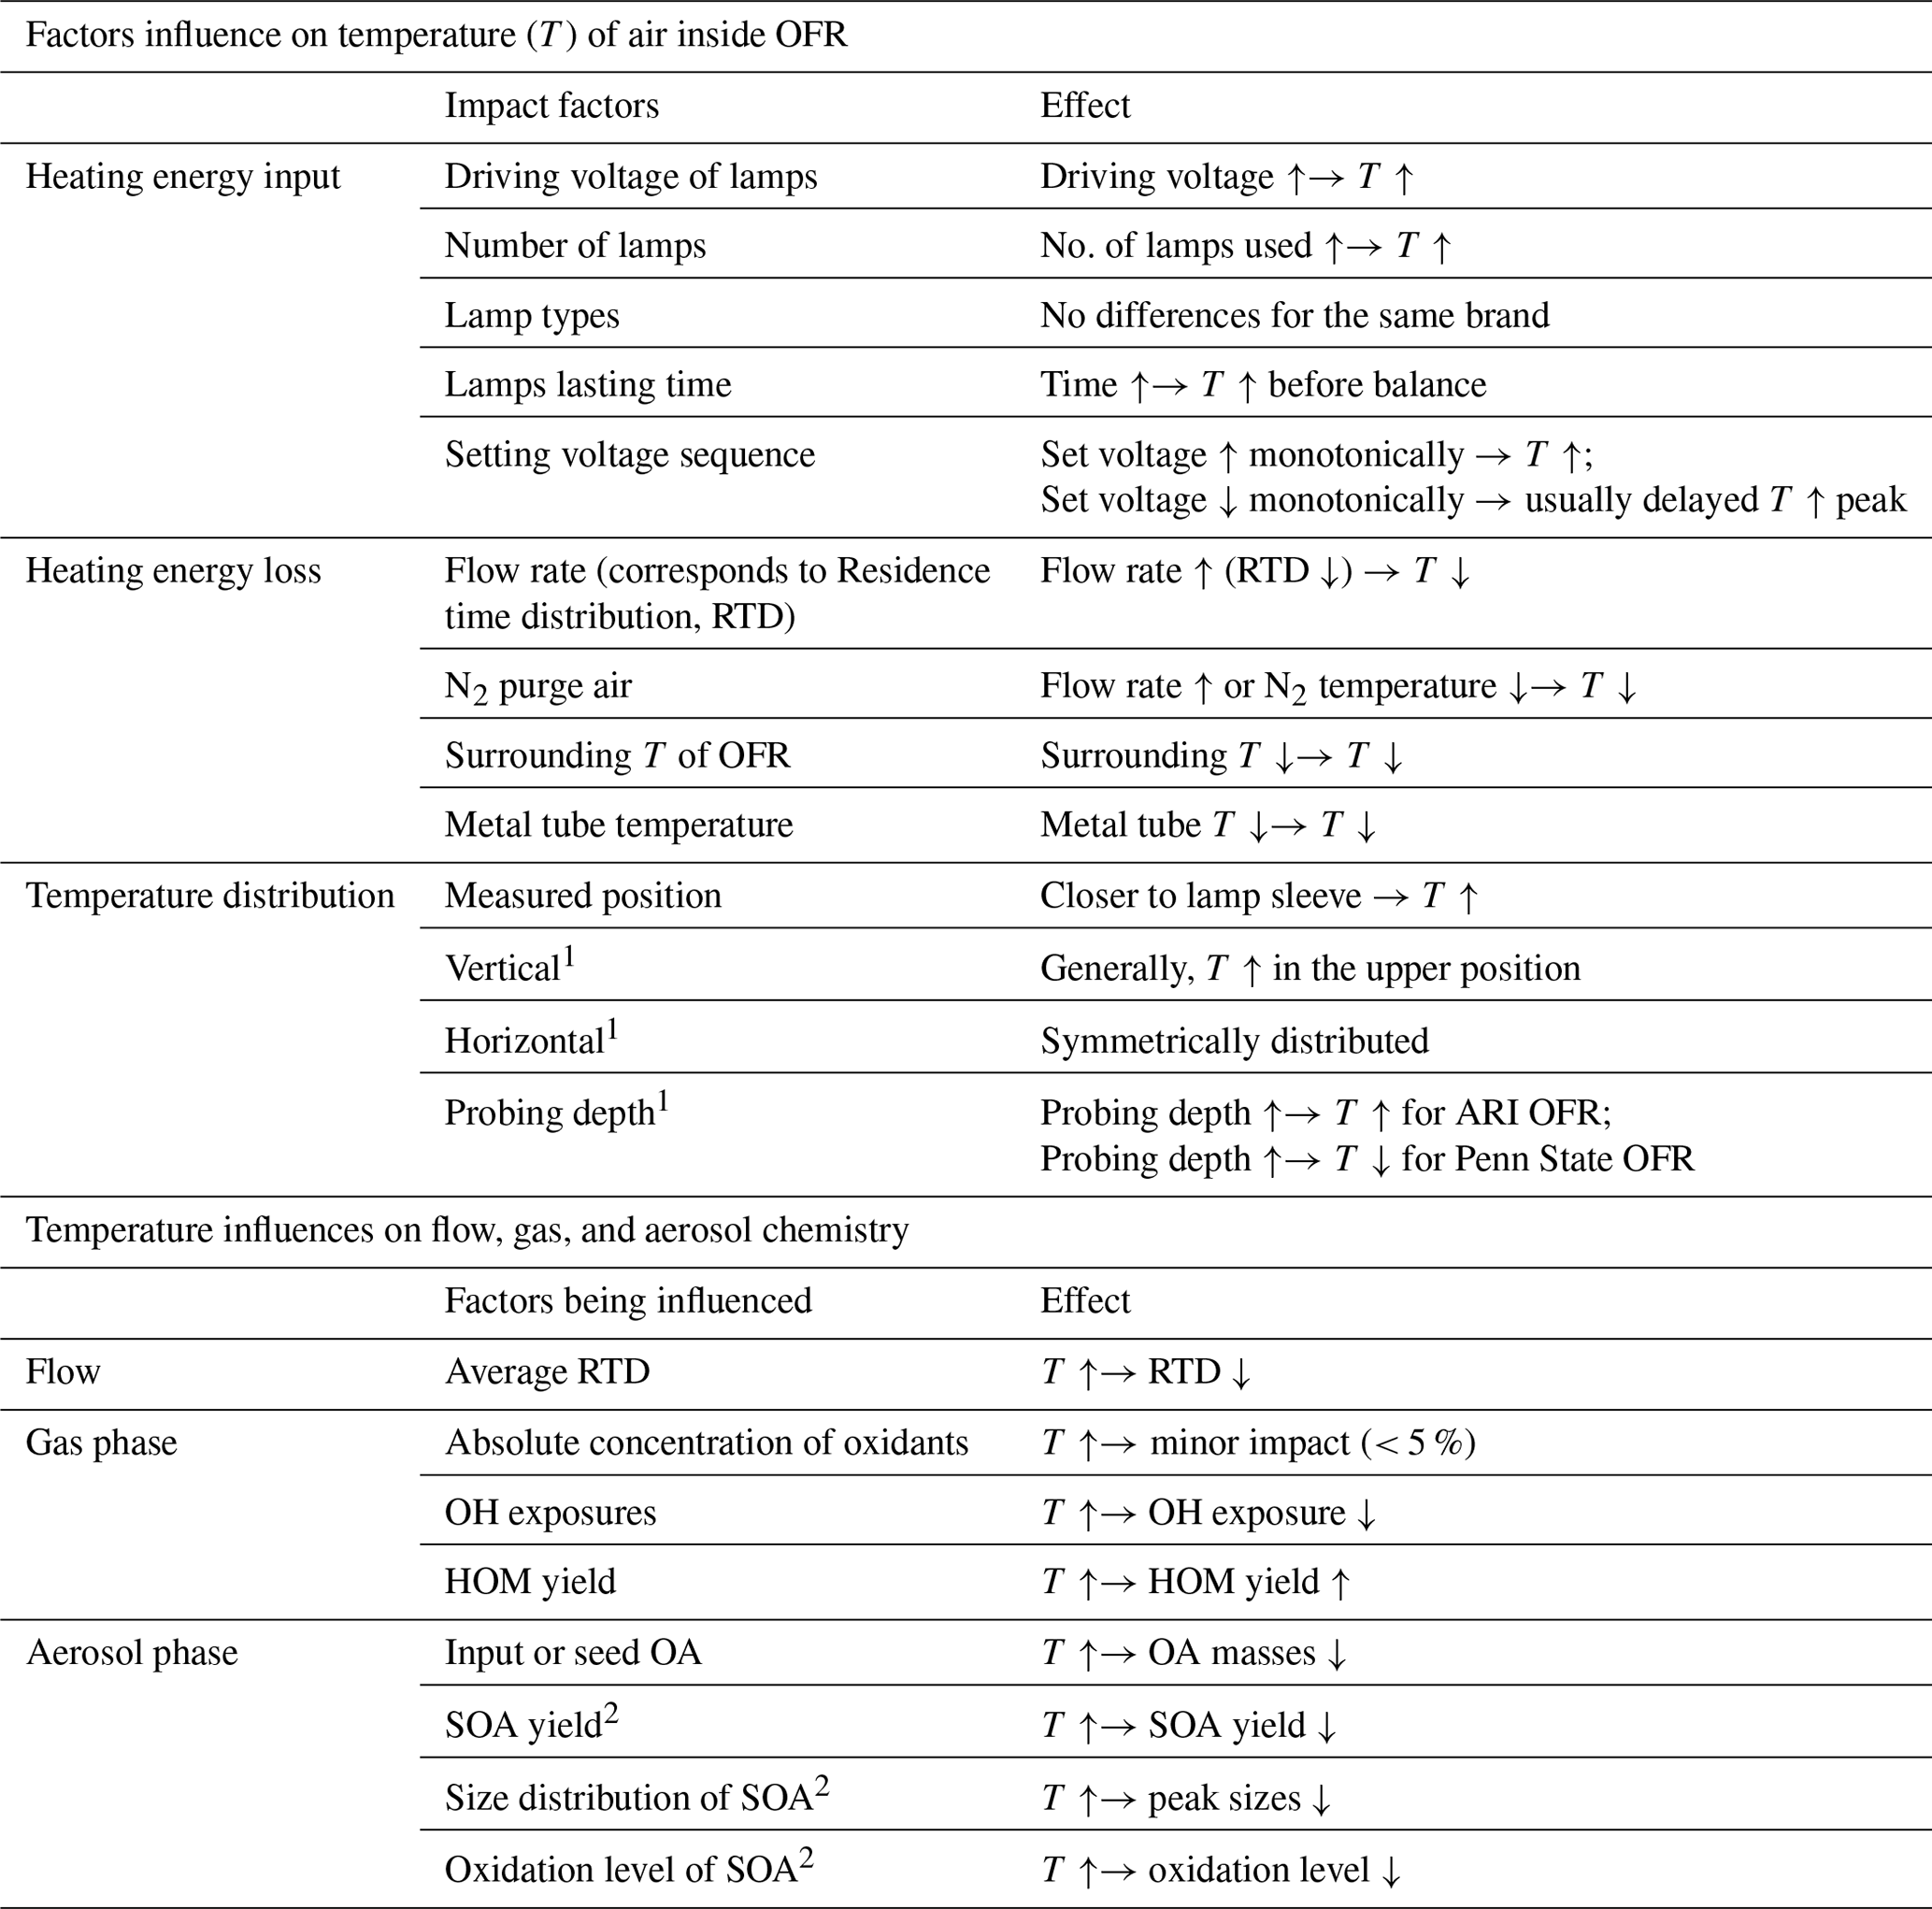
1 Vertical, horizontal and probing depth indicate the positions inside of the OFR as shown in Fig. 1. 2 More impact on high-NOx regime than low-NOx regime.
The data shown in the paper are available on request from the corresponding author (weiweihu@gig.ac.cn).
The supplement related to this article is available online at: https://doi.org/10.5194/amt-17-4915-2024-supplement.
WH, ATL, MAM, SHJ, YZ, ZP, YH, DAD, PCJ, and JLJ: conceptualization, methodology, investigation, and revision. MH: simulation of flow in OFR. QH and HC: design of OFR work. WH and XW: supervision, project administration, and funding acquisition. TP and WH: writing of the paper. All co-authors supported the interpretation of the results and contributed to improving the paper.
The contact author has declared that none of the authors has any competing interests.
Publisher's note: Copernicus Publications remains neutral with regard to jurisdictional claims made in the text, published maps, institutional affiliations, or any other geographical representation in this paper. While Copernicus Publications makes every effort to include appropriate place names, the final responsibility lies with the authors.
This work was supported by the National Key R&D Program of China, Young Scientist Program (grant no. 2021YFA1601800), the National Natural Science Foundation of China (grant nos. 42375105, 42275103, 42230701), Guangdong Pearl River Talents Program (grant no. 2019QN01L948), and the Guangdong Foundation for Program of Science and Technology Research (grant no. 2023B1212060049). Zhe Peng, Melissa A. Morris, Pedro Campuzano-Jost, Douglas A. Day, and Jose-Luis Jimenez were supported by NSF Atmospheric Chemistry (grant no. AGS 2206655). This publication was also partly developed under assistance agreement no. R840008 awarded by the U.S. Environmental Protection Agency to Colorado State University. It has not been formally reviewed by the EPA. The views expressed in this document are solely those of the authors and do not necessarily reflect those of the Agency. The EPA does not endorse any products or commercial services mentioned in this publication.
This research has been supported by the National Key Research and Development Program of China (grant no. 2021YFA1601800), the National Natural Science Foundation of China (grant nos. 42375105, 42275103, and 42230701), the Guangdong Pearl River Talents Program (grant no. 2019QN01L948), and the Guangdong Foundation for Program of Science and Technology Research (grant no. 2023B1212060049).
This paper was edited by Haichao Wang and reviewed by three anonymous referees.
Adams, P. J. and Seinfeld, J. H.: Predicting global aerosol size distributions in general circulation models, J. Geophys. Res.-Atmos., 107, AAC 4-1–AAC 4-23, https://doi.org/10.1029/2001jd001010, 2002.
Ahlberg, E., Ausmeel, S., Eriksson, A., Holst, T., Karlsson, T., Brune, W. H., Frank, G., Roldin, P., Kristensson, A., and Svenningsson, B.: No Particle Mass Enhancement from Induced Atmospheric Ageing at a Rural Site in Northern Europe, Atmosphere, 10, 408, https://doi.org/10.3390/atmos10070408, 2019.
Akherati, A., Cappa, C. D., Kleeman, M. J., Docherty, K. S., Jimenez, J. L., Griffith, S. M., Dusanter, S., Stevens, P. S., and Jathar, S. H.: Simulating secondary organic aerosol in a regional air quality model using the statistical oxidation model – Part 3: Assessing the influence of semi-volatile and intermediate-volatility organic compounds and NOx, Atmos. Chem. Phys., 19, 4561–4594, https://doi.org/10.5194/acp-19-4561-2019, 2019.
Akherati, A., He, Y., Coggon, M. M., Koss, A. R., Hodshire, A. L., Sekimoto, K., Warneke, C., de Gouw, J., Yee, L., Seinfeld, J. H., Onasch, T. B., Herndon, S. C., Knighton, W. B., Cappa, C. D., Kleeman, M. J., Lim, C. Y., Kroll, J. H., Pierce, J. R., and Jathar, S. H.: Oxygenated Aromatic Compounds are Important Precursors of Secondary Organic Aerosol in Biomass-Burning Emissions, Environ. Sci. Technol., 54, 8568–8579, https://doi.org/10.1021/acs.est.0c01345, 2020.
Aruffo, E., Wang, J., Ye, J., Ohno, P., Qin, Y., Stewart, M., McKinney, K., Di Carlo, P., and Martin, S. T.: Partitioning of Organonitrates in the Production of Secondary Organic Aerosols from alpha-Pinene Photo-Oxidation, Environ. Sci. Technol., 56, 5421–5429, https://doi.org/10.1021/acs.est.1c08380, 2022.
Atkinson, R., Aschmann, S., and Winer, A.: Alkyl nitrate formation from the reaction of a series of branched RO2 radicals with NO as a function of temperature and pressure, J. Atmos. Chem., 5, 91–102, https://doi.org/10.1007/bf00192505, 1987.
Bahreini, R., Middlebrook, A. M., Brock, C. A., de Gouw, J. A., McKeen, S. A., Williams, L. R., Daumit, K. E., Lambe, A. T., Massoli, P., Canagaratna, M. R., Ahmadov, R., Carrasquillo, A. J., Cross, E. S., Ervens, B., Holloway, J. S., Hunter, J. F., Onasch, T. B., Pollack, I. B., Roberts, J. M., Ryerson, T. B., Warneke, C., Davidovits, P., Worsnop, D. R., and Kroll, J. H.: Mass spectral analysis of organic aerosol formed downwind of the Deepwater Horizon oil spill: field studies and laboratory confirmations, Environ. Sci. Technol., 46, 8025–8034, https://doi.org/10.1021/es301691k, 2012.
Bianchi, F., Kurten, T., Riva, M., Mohr, C., Rissanen, M. P., Roldin, P., Berndt, T., Crounse, J. D., Wennberg, P. O., Mentel, T. F., Wildt, J., Junninen, H., Jokinen, T., Kulmala, M., Worsnop, D. R., Thornton, J. A., Donahue, N., Kjaergaard, H. G., and Ehn, M.: Highly Oxygenated Organic Molecules (HOM) from Gas-Phase Autoxidation Involving Peroxy Radicals: A Key Contributor to Atmospheric Aerosol, Chem. Rev., 119, 3472–3509, https://doi.org/10.1021/acs.chemrev.8b00395, 2019.
Boyd, C. M., Nah, T., Xu, L., Berkemeier, T., and Ng, N. L.: Secondary Organic Aerosol (SOA) from Nitrate Radical Oxidation of Monoterpenes: Effects of Temperature, Dilution, and Humidity on Aerosol Formation, Mixing, and Evaporation, Environ. Sci. Technol., 51, 7831–7841, https://doi.org/10.1021/acs.est.7b01460, 2017.
Bruns, E. A., El Haddad, I., Keller, A., Klein, F., Kumar, N. K., Pieber, S. M., Corbin, J. C., Slowik, J. G., Brune, W. H., Baltensperger, U., and Prévôt, A. S. H.: Inter-comparison of laboratory smog chamber and flow reactor systems on organic aerosol yield and composition, Atmos. Meas. Tech., 8, 2315–2332, https://doi.org/10.5194/amt-8-2315-2015, 2015.
Burkholder, J. B., Sander, S. P., Abbatt, J., Barker, J. R., Cappa, C., Crounse, J. D., Dibble, T. S., Huie, R. E., Kolb, C. E., Kurylo, M. J., Orkin, V. L., Percival, C. J., Wilmouth, D. M., and Wine, P. H.: Chemical Kinetics and Photochemical Data for Use in Atmospheric Studies, Evaluation No. 19, JPL Publication 19-5, Jet Propulsion Laboratory, Pasadena, http://jpldataeval.jpl.nasa.gov (last access: 7 December 2022), 2019.
Cappa, C. D.: A model of aerosol evaporation kinetics in a thermodenuder, Atmos. Meas. Tech., 3, 579–592, https://doi.org/10.5194/amt-3-579-2010, 2010.
Cappa, C. D. and Jimenez, J. L.: Quantitative estimates of the volatility of ambient organic aerosol, Atmos. Chem. Phys., 10, 5409–5424, https://doi.org/10.5194/acp-10-5409-2010, 2010.
Cappa, C. D. and Wilson, K. R.: Multi-generation gas-phase oxidation, equilibrium partitioning, and the formation and evolution of secondary organic aerosol, Atmos. Chem. Phys., 12, 9505–9528, https://doi.org/10.5194/acp-12-9505-2012, 2012.
Cappa, C. D., Zhang, X., Loza, C. L., Craven, J. S., Yee, L. D., and Seinfeld, J. H.: Application of the Statistical Oxidation Model (SOM) to Secondary Organic Aerosol formation from photooxidation of C12 alkanes, Atmos. Chem. Phys., 13, 1591–1606, https://doi.org/10.5194/acp-13-1591-2013, 2013.
Cappa, C. D., Jathar, S. H., Kleeman, M. J., Docherty, K. S., Jimenez, J. L., Seinfeld, J. H., and Wexler, A. S.: Simulating secondary organic aerosol in a regional air quality model using the statistical oxidation model – Part 2: Assessing the influence of vapor wall losses, Atmos. Chem. Phys., 16, 3041–3059, https://doi.org/10.5194/acp-16-3041-2016, 2016.
Carter, W., Cockeriii, D., Fitz, D., Malkina, I., Bumiller, K., Sauer, C., Pisano, J., Bufalino, C., and Song, C.: A new environmental chamber for evaluation of gas-phase chemical mechanisms and secondary aerosol formation, Atmos. Environ., 39, 7768–7788, https://doi.org/10.1016/j.atmosenv.2005.08.040, 2005.
Charnawskas, J. C., Alpert, P. A., Lambe, A. T., Berkemeier, T., O'Brien, R. E., Massoli, P., Onasch, T. B., Shiraiwa, M., Moffet, R. C., Gilles, M. K., Davidovits, P., Worsnop, D. R., and Knopf, D. A.: Condensed-phase biogenic–anthropogenic interactions with implications for cold cloud formation, Faraday Discuss., 200, 165–194, https://doi.org/10.1039/c7fd00010c, 2017.
Chen, S., Brune, W. H., Lambe, A. T., Davidovits, P., and Onasch, T. B.: Modeling organic aerosol from the oxidation of α-pinene in a Potential Aerosol Mass (PAM) chamber, Atmos. Chem. Phys., 13, 5017–5031, https://doi.org/10.5194/acp-13-5017-2013, 2013.
Chen, W., Ye, Y., Hu, W., Zhou, H., Pan, T., Wang, Y., Song, W., Song, Q., Ye, C., Wang, C., Wang, B., Huang, S., Yuan, B., Zhu, M., Lian, X., Zhang, G., Bi, X., Jiang, F., Liu, J., Canonaco, F., Prevot, A. S. H., Shao, M., and Wang, X.: Real-Time Characterization of Aerosol Compositions, Sources, and Aging Processes in Guangzhou During PRIDE-GBA 2018 Campaign, J. Geophys. Res.-Atmos., 126, e2021JD035114, https://doi.org/10.1029/2021jd035114, 2021.
Cheng, X., Chen, Q., Jie Li, Y., Zheng, Y., Liao, K., and Huang, G.: Highly oxygenated organic molecules produced by the oxidation of benzene and toluene in a wide range of OH exposure and NOx conditions, Atmos. Chem. Phys., 21, 12005–12019, https://doi.org/10.5194/acp-21-12005-2021, 2021.
Chu, B., Liu, Y., Ma, Q., Ma, J., He, H., Wang, G., Cheng, S., and Wang, X.: Distinct potential aerosol masses under different scenarios of transport at a suburban site of Beijing, J. Environ. Sci.-China, 39, 52–61, https://doi.org/10.1016/j.jes.2015.11.003, 2016.
Clark, C. H., Kacarab, M., Nakao, S., Asa-Awuku, A., Sato, K., and Cocker, D. R., 3rd: Temperature Effects on Secondary Organic Aerosol (SOA) from the Dark Ozonolysis and Photo-Oxidation of Isoprene, Environ. Sci. Technol., 50, 5564–5571, https://doi.org/10.1021/acs.est.5b05524, 2016.
Cocker, D. R., 3rd, Flagan, R. C., and Seinfeld, J. H.: State-of-the-art chamber facility for studying atmospheric aerosol chemistry, Environ. Sci. Technol., 35, 2594–2601, https://doi.org/10.1021/es0019169, 2001.
Cooper, P. L. and Abbatt, J. P. D.: Heterogeneous Interactions of OH and HO2 Radicals with Surfaces Characteristic of Atmospheric Particulate Matter, J. Phys. Chem., 100, 2249–2254, https://doi.org/10.1021/jp952142z, 1996.
Denjean, C., Formenti, P., Picquet-Varrault, B., Camredon, M., Pangui, E., Zapf, P., Katrib, Y., Giorio, C., Tapparo, A., Temime-Roussel, B., Monod, A., Aumont, B., and Doussin, J. F.: Aging of secondary organic aerosol generated from the ozonolysis of α-pinene: effects of ozone, light and temperature, Atmos. Chem. Phys., 15, 883–897, https://doi.org/10.5194/acp-15-883-2015, 2015.
DeRieux, W.-S. W., Li, Y., Lin, P., Laskin, J., Laskin, A., Bertram, A. K., Nizkorodov, S. A., and Shiraiwa, M.: Predicting the glass transition temperature and viscosity of secondary organic material using molecular composition, Atmos. Chem. Phys., 18, 6331–6351, https://doi.org/10.5194/acp-18-6331-2018, 2018.
Donahue, N. M., Robinson, A. L., Stanier, C. O., and Pandis, S. N.: Coupled partitioning, dilution, and chemical aging of semivolatile organics, Environ. Sci. Technol., 40, 2635–2643, https://doi.org/10.1021/es052297c, 2006.
Eluri, S., Cappa, C. D., Friedman, B., Farmer, D. K., and Jathar, S. H.: Modeling the formation and composition of secondary organic aerosol from diesel exhaust using parameterized and semi-explicit chemistry and thermodynamic models, Atmos. Chem. Phys., 18, 13813–13838, https://doi.org/10.5194/acp-18-13813-2018, 2018.
Epstein, S. A., Riipinen, I., and Donahue, N. M.: A semiempirical correlation between enthalpy of vaporization and saturation concentration for organic aerosol, Environ. Sci. Technol., 44, 743–748, https://doi.org/10.1021/es902497z, 2010.
Ezell, M. J., Johnson, S. N., Yu, Y., Perraud, V., Bruns, E. A., Alexander, M. L., Zelenyuk, A., Dabdub, D., and Finlayson-Pitts, B. J.: A New Aerosol Flow System for Photochemical and Thermal Studies of Tropospheric Aerosols, Aerosol Sci. Tech., 44, 329–338, https://doi.org/10.1080/02786821003639700, 2010.
Feng, S., Gao, D., Liao, F., Zhou, F., and Wang, X.: The health effects of ambient PM2.5 and potential mechanisms, Ecotox. Environ. Safe, 128, 67–74, https://doi.org/10.1016/j.ecoenv.2016.01.030, 2016.
Feng, T., Wang, Y., Hu, W., Zhu, M., Song, W., Chen, W., Sang, Y., Fang, Z., Deng, W., Fang, H., Yu, X., Wu, C., Yuan, B., Huang, S., Shao, M., Huang, X., He, L., Lee, Y. R., Huey, L. G., Canonaco, F., Prevot, A. S. H., and Wang, X.: Impact of aging on the sources, volatility, and viscosity of organic aerosols in Chinese outflows, Atmos. Chem. Phys., 23, 611–636, https://doi.org/10.5194/acp-23-611-2023, 2023.
Gao, L., Song, J., Mohr, C., Huang, W., Vallon, M., Jiang, F., Leisner, T., and Saathoff, H.: Kinetics, SOA yields, and chemical composition of secondary organic aerosol from β-caryophyllene ozonolysis with and without nitrogen oxides between 213 and 313 K, Atmos. Chem. Phys., 22, 6001–6020, https://doi.org/10.5194/acp-22-6001-2022, 2022.
George, I. J., Vlasenko, A., Slowik, J. G., Broekhuizen, K., and Abbatt, J. P. D.: Heterogeneous oxidation of saturated organic aerosols by hydroxyl radicals: uptake kinetics, condensed-phase products, and particle size change, Atmos. Chem. Phys., 7, 4187–4201, https://doi.org/10.5194/acp-7-4187-2007, 2007.
Ghia, U., Ghia, K. N., and Shin, C. T.: High-Resolutions for incompressible flow using the Navier-Stokes equations and a multigrid method, J. Computat. Phy., 48, 387–411, https://doi.org/10.1016/0021-9991(82)90058-4, 1982.
Giauque, W. F. and Meads, P. F.: The Heat Capacities and Entropies of Aluminum and Copper from 15 to 300 °K, J. Am. Chem. Soc., 63, 1897–1901, https://doi.org/10.1021/ja01852a027, 2002.
Hallquist, M., Wenger, J. C., Baltensperger, U., Rudich, Y., Simpson, D., Claeys, M., Dommen, J., Donahue, N. M., George, C., Goldstein, A. H., Hamilton, J. F., Herrmann, H., Hoffmann, T., Iinuma, Y., Jang, M., Jenkin, M. E., Jimenez, J. L., Kiendler-Scharr, A., Maenhaut, W., McFiggans, G., Mentel, Th. F., Monod, A., Prévôt, A. S. H., Seinfeld, J. H., Surratt, J. D., Szmigielski, R., and Wildt, J.: The formation, properties and impact of secondary organic aerosol: current and emerging issues, Atmos. Chem. Phys., 9, 5155–5236, https://doi.org/10.5194/acp-9-5155-2009, 2009.
Hanson, D. R. and Lovejoy, E. R.: The Reaction of CIONO2 with Submicrometer Sulfuric Acid Aerosol, Science, 267, 1326–1328, https://doi.org/10.1126/science.267.5202.1326, 1995.
He, Y., Akherati, A., Nah, T., Ng, N. L., Garofalo, L. A., Farmer, D. K., Shiraiwa, M., Zaveri, R. A., Cappa, C. D., Pierce, J. R., and Jathar, S. H.: Particle Size Distribution Dynamics Can Help Constrain the Phase State of Secondary Organic Aerosol, Environ. Sci. Technol., 55, 1466–1476, https://doi.org/10.1021/acs.est.0c05796, 2021.
He, Y., Lambe, A. T., Seinfeld, J. H., Cappa, C. D., Pierce, J. R., and Jathar, S. H.: Process-Level Modeling Can Simultaneously Explain Secondary Organic Aerosol Evolution in Chambers and Flow Reactors, Environ. Sci. Technol., 56, 6262–6273, https://doi.org/10.1021/acs.est.1c08520, 2022.
Heim, E. W., Dibb, J., Scheuer, E., Jost, P. C., Nault, B. A., Jimenez, J. L., Peterson, D., Knote, C., Fenn, M., Hair, J., Beyersdorf, A. J., Corr, C., and Anderson, B. E.: Asian dust observed during KORUS-AQ facilitates the uptake and incorporation of soluble pollutants during transport to South Korea, Atmos. Environ., 224, 117305, https://doi.org/10.1016/j.atmosenv.2020.117305, 2020.
Hildebrandt, L., Donahue, N. M., and Pandis, S. N.: High formation of secondary organic aerosol from the photo-oxidation of toluene, Atmos. Chem. Phys., 9, 2973–2986, https://doi.org/10.5194/acp-9-2973-2009, 2009.
Hodshire, A. L., Palm, B. B., Alexander, M. L., Bian, Q., Campuzano-Jost, P., Cross, E. S., Day, D. A., de Sá, S. S., Guenther, A. B., Hansel, A., Hunter, J. F., Jud, W., Karl, T., Kim, S., Kroll, J. H., Park, J.-H., Peng, Z., Seco, R., Smith, J. N., Jimenez, J. L., and Pierce, J. R.: Constraining nucleation, condensation, and chemistry in oxidation flow reactors using size-distribution measurements and aerosol microphysical modeling, Atmos. Chem. Phys., 18, 12433–12460, https://doi.org/10.5194/acp-18-12433-2018, 2018.
Holman, J. P.: Heat Transfer, 10th edn., McGraw-Hill, New York, USA, ISBN: 978-0-07-352936-3, 2010.
Hu, W., Palm, B. B., Day, D. A., Campuzano-Jost, P., Krechmer, J. E., Peng, Z., de Sá, S. S., Martin, S. T., Alexander, M. L., Baumann, K., Hacker, L., Kiendler-Scharr, A., Koss, A. R., de Gouw, J. A., Goldstein, A. H., Seco, R., Sjostedt, S. J., Park, J.-H., Guenther, A. B., Kim, S., Canonaco, F., Prévôt, A. S. H., Brune, W. H., and Jimenez, J. L.: Volatility and lifetime against OH heterogeneous reaction of ambient isoprene-epoxydiols-derived secondary organic aerosol (IEPOX-SOA), Atmos. Chem. Phys., 16, 11563–11580, https://doi.org/10.5194/acp-16-11563-2016, 2016.
Hu, W., Zhou, H., Chen, W., Ye, Y., Pan, T., Wang, Y., Song, W., Zhang, H., Deng, W., Zhu, M., Wang, C., Wu, C., Ye, C., Wang, Z., Yuan, B., Huang, S., Shao, M., Peng, Z., Day, D. A., Campuzano-Jost, P., Lambe, A. T., Worsnop, D. R., Jimenez, J. L., and Wang, X.: Oxidation Flow Reactor Results in a Chinese Megacity Emphasize the Important Contribution of S/IVOCs to Ambient SOA Formation, Environ. Sci. Technol., 56, 6880–6893, https://doi.org/10.1021/acs.est.1c03155, 2022.
Huang, R. J., Zhang, Y., Bozzetti, C., Ho, K. F., Cao, J. J., Han, Y., Daellenbach, K. R., Slowik, J. G., Platt, S. M., Canonaco, F., Zotter, P., Wolf, R., Pieber, S. M., Bruns, E. A., Crippa, M., Ciarelli, G., Piazzalunga, A., Schwikowski, M., Abbaszade, G., Schnelle-Kreis, J., Zimmermann, R., An, Z., Szidat, S., Baltensperger, U., El Haddad, I., and Prevot, A. S.: High secondary aerosol contribution to particulate pollution during haze events in China, Nature, 514, 218–222, https://doi.org/10.1038/nature13774, 2014.
Huang, Y., Coggon, M. M., Zhao, R., Lignell, H., Bauer, M. U., Flagan, R. C., and Seinfeld, J. H.: The Caltech Photooxidation Flow Tube reactor: design, fluid dynamics and characterization, Atmos. Meas. Tech., 10, 839–867, https://doi.org/10.5194/amt-10-839-2017, 2017.
Huffman, J. A., Docherty, K. S., Aiken, A. C., Cubison, M. J., Ulbrich, I. M., DeCarlo, P. F., Sueper, D., Jayne, J. T., Worsnop, D. R., Ziemann, P. J., and Jimenez, J. L.: Chemically-resolved aerosol volatility measurements from two megacity field studies, Atmos. Chem. Phys., 9, 7161–7182, https://doi.org/10.5194/acp-9-7161-2009, 2009.
Ihalainen, M., Tiitta, P., Czech, H., Yli-Pirilä, P., Hartikainen, A., Kortelainen, M., Tissari, J., Stengel, B., Sklorz, M., Suhonen, H., Lamberg, H., Leskinen, A., Kiendler-Scharr, A., Harndorf, H., Zimmermann, R., Jokiniemi, J., and Sippula, O.: A novel high-volume Photochemical Emission Aging flow tube Reactor (PEAR), Aerosol Sci. Tech., 53, 276–294, https://doi.org/10.1080/02786826.2018.1559918, 2019.
Jathar, S. H., Cappa, C. D., Wexler, A. S., Seinfeld, J. H., and Kleeman, M. J.: Multi-generational oxidation model to simulate secondary organic aerosol in a 3-D air quality model, Geosci. Model Dev., 8, 2553–2567, https://doi.org/10.5194/gmd-8-2553-2015, 2015.
Jathar, S. H., Cappa, C. D., Wexler, A. S., Seinfeld, J. H., and Kleeman, M. J.: Simulating secondary organic aerosol in a regional air quality model using the statistical oxidation model – Part 1: Assessing the influence of constrained multi-generational ageing, Atmos. Chem. Phys., 16, 2309–2322, https://doi.org/10.5194/acp-16-2309-2016, 2016.
Jensen, L. N., Canagaratna, M. R., Kristensen, K., Quéléver, L. L. J., Rosati, B., Teiwes, R., Glasius, M., Pedersen, H. B., Ehn, M., and Bilde, M.: Temperature and volatile organic compound concentrations as controlling factors for chemical composition of α-pinene-derived secondary organic aerosol, Atmos. Chem. Phys., 21, 11545–11562, https://doi.org/10.5194/acp-21-11545-2021, 2021.
Jimenez, J. L., Canagaratna, M. R., Donahue, N. M., Prevot, A. S., Zhang, Q., Kroll, J. H., DeCarlo, P. F., Allan, J. D., Coe, H., Ng, N. L., Aiken, A. C., Docherty, K. S., Ulbrich, I. M., Grieshop, A. P., Robinson, A. L., Duplissy, J., Smith, J. D., Wilson, K. R., Lanz, V. A., Hueglin, C., Sun, Y. L., Tian, J., Laaksonen, A., Raatikainen, T., Rautiainen, J., Vaattovaara, P., Ehn, M., Kulmala, M., Tomlinson, J. M., Collins, D. R., Cubison, M. J., Dunlea, E. J., Huffman, J. A., Onasch, T. B., Alfarra, M. R., Williams, P. I., Bower, K., Kondo, Y., Schneider, J., Drewnick, F., Borrmann, S., Weimer, S., Demerjian, K., Salcedo, D., Cottrell, L., Griffin, R., Takami, A., Miyoshi, T., Hatakeyama, S., Shimono, A., Sun, J. Y., Zhang, Y. M., Dzepina, K., Kimmel, J. R., Sueper, D., Jayne, J. T., Herndon, S. C., Trimborn, A. M., Williams, L. R., Wood, E. C., Middlebrook, A. M., Kolb, C. E., Baltensperger, U., and Worsnop, D. R.: Evolution of organic aerosols in the atmosphere, Science, 326, 1525–1529, https://doi.org/10.1126/science.1180353, 2009.
Kang, E., Root, M. J., Toohey, D. W., and Brune, W. H.: Introducing the concept of Potential Aerosol Mass (PAM), Atmos. Chem. Phys., 7, 5727–5744, https://doi.org/10.5194/acp-7-5727-2007, 2007.
Kang, E., Lee, M., Brune, W. H., Lee, T., Park, T., Ahn, J., and Shang, X.: Photochemical aging of aerosol particles in different air masses arriving at Baengnyeong Island, Korea, Atmos. Chem. Phys., 18, 6661–6677, https://doi.org/10.5194/acp-18-6661-2018, 2018.
Katrib, Y., Biskos, G., Buseck, P. R., Davidovits, P., Jayne, J. T., Mochida, M., Wise, M. E., Worsnop, D. R., and Martin, S. T.: Ozonolysis of mixed oleic-acid/stearic-acid particles: reaction kinetics and chemical morphology, J. Phys. Chem. A, 109, 10910–10919, https://doi.org/10.1021/jp054714d, 2005.
Keller, A., Kalbermatter, D. M., Wolfer, K., Specht, P., Steigmeier, P., Resch, J., Kalberer, M., Hammer, T., and Vasilatou, K.: The organic coating unit, an all-in-one system for reproducible generation of secondary organic matter aerosol, Aerosol Sci. Tech., 56, 947–958, https://doi.org/10.1080/02786826.2022.2110448, 2022.
Khalaj, F., Rivas-Ubach, A., Anderton, C. R., China, S., Mooney, K., and Faiola, C. L.: Acyclic Terpenes Reduce Secondary Organic Aerosol Formation from Emissions of a Riparian Shrub, ACS Earth and Space Chemistry, 5, 1242–1253, https://doi.org/10.1021/acsearthspacechem.0c00300, 2021.
Kieffer, W. F.: Tables of thermal properties of gases, J. Chem. Educ., 33, A477, https://doi.org/10.1021/ed033pA477.1, 1956.
Klyta, J. and Czaplicka, M.: Determination of secondary organic aerosol in particulate matter – Short review, Microchem. J., 157, 104997, https://doi.org/10.1016/j.microc.2020.104997, 2020.
Knopf, D. A., Anthony, L. M., and Bertram, A. K.: Reactive uptake of O3 by multicomponent and multiphase mixtures containing oleic acid, J. Phys. Chem. A, 109, 5579–5589, https://doi.org/10.1021/jp0512513, 2005.
Kolesar, K. R., Chen, C., Johnson, D., and Cappa, C. D.: The influences of mass loading and rapid dilution of secondary organic aerosol on particle volatility, Atmos. Chem. Phys., 15, 9327–9343, https://doi.org/10.5194/acp-15-9327-2015, 2015.
Kramer, A. L., Suski, K. J., Bell, D. M., Zelenyuk, A., and Massey Simonich, S. L.: Formation of Polycyclic Aromatic Hydrocarbon Oxidation Products in alpha-Pinene Secondary Organic Aerosol Particles Formed through Ozonolysis, Environ. Sci. Technol., 53, 6669–6677, https://doi.org/10.1021/acs.est.9b01732, 2019.
Kristensen, K., Jensen, L. N., Quéléver, L. L. J., Christiansen, S., Rosati, B., Elm, J., Teiwes, R., Pedersen, H. B., Glasius, M., Ehn, M., and Bilde, M.: The Aarhus Chamber Campaign on Highly Oxygenated Organic Molecules and Aerosols (ACCHA): particle formation, organic acids, and dimer esters from α-pinene ozonolysis at different temperatures, Atmos. Chem. Phys., 20, 12549–12567, https://doi.org/10.5194/acp-20-12549-2020, 2020.
Kroll, J. H. and Seinfeld, J. H.: Chemistry of secondary organic aerosol: Formation and evolution of low-volatility organics in the atmosphere, Atmos. Environ., 42, 3593–3624, https://doi.org/10.1016/j.atmosenv.2008.01.003, 2008.
Lambe, A., Massoli, P., Zhang, X., Canagaratna, M., Nowak, J., Daube, C., Yan, C., Nie, W., Onasch, T., Jayne, J., Kolb, C., Davidovits, P., Worsnop, D., and Brune, W.: Controlled nitric oxide production via O(1D) + N2O reactions for use in oxidation flow reactor studies, Atmos. Meas. Tech., 10, 2283–2298, https://doi.org/10.5194/amt-10-2283-2017, 2017.
Lambe, A. T., Onasch, T. B., Massoli, P., Croasdale, D. R., Wright, J. P., Ahern, A. T., Williams, L. R., Worsnop, D. R., Brune, W. H., and Davidovits, P.: Laboratory studies of the chemical composition and cloud condensation nuclei (CCN) activity of secondary organic aerosol (SOA) and oxidized primary organic aerosol (OPOA), Atmos. Chem. Phys., 11, 8913–8928, https://doi.org/10.5194/acp-11-8913-2011, 2011a.
Lambe, A. T., Ahern, A. T., Williams, L. R., Slowik, J. G., Wong, J. P. S., Abbatt, J. P. D., Brune, W. H., Ng, N. L., Wright, J. P., Croasdale, D. R., Worsnop, D. R., Davidovits, P., and Onasch, T. B.: Characterization of aerosol photooxidation flow reactors: heterogeneous oxidation, secondary organic aerosol formation and cloud condensation nuclei activity measurements, Atmos. Meas. Tech., 4, 445–461, https://doi.org/10.5194/amt-4-445-2011, 2011b.
Lambe, A. T., Ahern, A. T., Wright, J. P., Croasdale, D. R., Davidovits, P., and Onasch, T. B.: Oxidative aging and cloud condensation nuclei activation of laboratory combustion soot, J. Aerosol Sci., 79, 31–39, https://doi.org/10.1016/j.jaerosci.2014.10.001, 2015a.
Lambe, A. T., Chhabra, P. S., Onasch, T. B., Brune, W. H., Hunter, J. F., Kroll, J. H., Cummings, M. J., Brogan, J. F., Parmar, Y., Worsnop, D. R., Kolb, C. E., and Davidovits, P.: Effect of oxidant concentration, exposure time, and seed particles on secondary organic aerosol chemical composition and yield, Atmos. Chem. Phys., 15, 3063–3075, https://doi.org/10.5194/acp-15-3063-2015, 2015b.
Lambe, A. T., Krechmer, J. E., Peng, Z., Casar, J. R., Carrasquillo, A. J., Raff, J. D., Jimenez, J. L., and Worsnop, D. R.: HOx and NOx production in oxidation flow reactors via photolysis of isopropyl nitrite, isopropyl nitrite-d7, and 1,3-propyl dinitrite at λ = 254, 350, and 369 nm, Atmos. Meas. Tech., 12, 299–311, https://doi.org/10.5194/amt-12-299-2019, 2019.
Lamkaddam, H., Gratien, A., Pangui, E., Cazaunau, M., Picquet-Varrault, B., and Doussin, J. F.: High-NOx Photooxidation of n-Dodecane: Temperature Dependence of SOA Formation, Environ. Sci. Technol., 51, 192–201, https://doi.org/10.1021/acs.est.6b03821, 2017.
Lee, B.-H., Pierce, J. R., Engelhart, G. J., and Pandis, S. N.: Volatility of secondary organic aerosol from the ozonolysis of monoterpenes, Atmos. Environ., 45, 2443–2452, https://doi.org/10.1016/j.atmosenv.2011.02.004, 2011.
Lei, Z., Olson, N. E., Zhang, Y., Chen, Y., Lambe, A. T., Zhang, J., White, N. J., Atkin, J. M., Banaszak Holl, M. M., Zhang, Z., Gold, A., Surratt, J. D., and Ault, A. P.: Morphology and Viscosity Changes after Reactive Uptake of Isoprene Epoxydiols in Submicrometer Phase Separated Particles with Secondary Organic Aerosol Formed from Different Volatile Organic Compounds, ACS Earth and Space Chemistry, 6, 871–882, https://doi.org/10.1021/acsearthspacechem.1c00156, 2022.
Li, J., Wang, W., Li, K., Zhang, W., Peng, C., Zhou, L., Shi, B., Chen, Y., Liu, M., Li, H., and Ge, M.: Temperature effects on optical properties and chemical composition of secondary organic aerosol derived from n-dodecane, Atmos. Chem. Phys., 20, 8123–8137, https://doi.org/10.5194/acp-20-8123-2020, 2020.
Li, K., Liggio, J., Lee, P., Han, C., Liu, Q., and Li, S.-M.: Secondary organic aerosol formation from α-pinene, alkanes, and oil-sands-related precursors in a new oxidation flow reactor, Atmos. Chem. Phys., 19, 9715–9731, https://doi.org/10.5194/acp-19-9715-2019, 2019.
Li, Q., Hu, D., Leungsakul, S., and Kamens, R. M.: Large outdoor chamber experiments and computer simulations: (I) Secondary organic aerosol formation from the oxidation of a mixture of d-limonene and α-pinene, Atmos. Environ., 41, 9341–9352, https://doi.org/10.1016/j.atmosenv.2007.09.017, 2007.
Li, R., Palm, B. B., Ortega, A. M., Hlywiak, J., Hu, W., Peng, Z., Day, D. A., Knote, C., Brune, W. H., de Gouw, J. A., and Jimenez, J. L.: Modeling the radical chemistry in an oxidation flow reactor: radical formation and recycling, sensitivities, and the OH exposure estimation equation, J. Phys. Chem. A, 119, 4418–4432, https://doi.org/10.1021/jp509534k, 2015.
Li, Y., Day, D. A., Stark, H., Jimenez, J. L., and Shiraiwa, M.: Predictions of the glass transition temperature and viscosity of organic aerosols from volatility distributions, Atmos. Chem. Phys., 20, 8103–8122, https://doi.org/10.5194/acp-20-8103-2020, 2020.
Liao, K., Chen, Q., Liu, Y., Li, Y. J., Lambe, A. T., Zhu, T., Huang, R. J., Zheng, Y., Cheng, X., Miao, R., Huang, G., Khuzestani, R. B., and Jia, T.: Secondary Organic Aerosol Formation of Fleet Vehicle Emissions in China: Potential Seasonality of Spatial Distributions, Environ. Sci. Technol., 55, 7276–7286, https://doi.org/10.1021/acs.est.0c08591, 2021.
Link, M. F., Friedman, B., Fulgham, R., Brophy, P., Galang, A., Jathar, S. H., Veres, P., Roberts, J. M., and Farmer, D. K.: Photochemical processing of diesel fuel emissions as a large secondary source of isocyanic acid (HNCO), Geophys. Res. Lett., 43, 4033–4041, https://doi.org/10.1002/2016gl068207, 2016.
Liu, J., Chu, B., Chen, T., Liu, C., Wang, L., Bao, X., and He, H.: Secondary Organic Aerosol Formation from Ambient Air at an Urban Site in Beijing: Effects of OH Exposure and Precursor Concentrations, Environ. Sci. Technol., 52, 6834–6841, https://doi.org/10.1021/acs.est.7b05701, 2018.
Liu, T., Zhou, L., Liu, Q., Lee, B. P., Yao, D., Lu, H., Lyu, X., Guo, H., and Chan, C. K.: Secondary Organic Aerosol Formation from Urban Roadside Air in Hong Kong, Environ. Sci. Technol., 53, 3001–3009, https://doi.org/10.1021/acs.est.8b06587, 2019.
Louvaris, E. E., Karnezi, E., Kostenidou, E., Kaltsonoudis, C., and Pandis, S. N.: Estimation of the volatility distribution of organic aerosol combining thermodenuder and isothermal dilution measurements, Atmos. Meas. Tech., 10, 3909–3918, https://doi.org/10.5194/amt-10-3909-2017, 2017.
Mao, J., Ren, X., Brune, W. H., Olson, J. R., Crawford, J. H., Fried, A., Huey, L. G., Cohen, R. C., Heikes, B., Singh, H. B., Blake, D. R., Sachse, G. W., Diskin, G. S., Hall, S. R., and Shetter, R. E.: Airborne measurement of OH reactivity during INTEX-B, Atmos. Chem. Phys., 9, 163–173, https://doi.org/10.5194/acp-9-163-2009, 2009.
Martin-Reviejo, M. and Wirtz, K.: Is benzene a precursor for secondary organic aerosol?, Environ. Sci. Technol., 39, 1045–1054, https://doi.org/10.1021/es049802a, 2005.
McFiggans, G., Mentel, T. F., Wildt, J., Pullinen, I., Kang, S., Kleist, E., Schmitt, S., Springer, M., Tillmann, R., Wu, C., Zhao, D., Hallquist, M., Faxon, C., Le Breton, M., Hallquist, A. M., Simpson, D., Bergstrom, R., Jenkin, M. E., Ehn, M., Thornton, J. A., Alfarra, M. R., Bannan, T. J., Percival, C. J., Priestley, M., Topping, D., and Kiendler-Scharr, A.: Secondary organic aerosol reduced by mixture of atmospheric vapours, Nature, 565, 587–593, https://doi.org/10.1038/s41586-018-0871-y, 2019.
Mitroo, D., Sun, Y., Combest, D. P., Kumar, P., and Williams, B. J.: Assessing the degree of plug flow in oxidation flow reactors (OFRs): a study on a potential aerosol mass (PAM) reactor, Atmos. Meas. Tech., 11, 1741–1756, https://doi.org/10.5194/amt-11-1741-2018, 2018.
Murschell, T. and Farmer, D. K.: Atmospheric OH Oxidation of Three Chlorinated Aromatic Herbicides, Environ. Sci. Technol., 52, 4583–4591, https://doi.org/10.1021/acs.est.7b06025, 2018.
Myhre, G., Shindell, D., Bréon, F.-M., Collins, W., Fuglestvedt, J., Huang, J., Koch, D., Lamarque, J.-F., Lee, D., Mendoza, B., Nakajima, T., Robock, A., Stephens, G., Takemura, T., and Zhang, H.: Anthropogenic and Natural Radiative Forcing, in: Climate Change 2013: The Physical Science Basis. Contribution of Working Group I to the Fifth Assessment Report of the Intergovernmental Panel on Climate Change, edited by: Stocker, T. F., Qin, D., Plattner, G.-K., Tignor, M., Allen, S. K., Boschung, J., Nauels, A., Xia, Y., Bex, V., and Midgley, P. M., Cambridge University Press, Cambridge, United Kingdom and New York, NY, USA, United Kingdom and New York, NY, USA, p. 659, https://www.ipcc.ch/report/ar5/wg1/ (last access: 15 November 2022), 2013.
Nault, B. A., Campuzano-Jost, P., Day, D. A., Schroder, J. C., Anderson, B., Beyersdorf, A. J., Blake, D. R., Brune, W. H., Choi, Y., Corr, C. A., de Gouw, J. A., Dibb, J., DiGangi, J. P., Diskin, G. S., Fried, A., Huey, L. G., Kim, M. J., Knote, C. J., Lamb, K. D., Lee, T., Park, T., Pusede, S. E., Scheuer, E., Thornhill, K. L., Woo, J.-H., and Jimenez, J. L.: Secondary organic aerosol production from local emissions dominates the organic aerosol budget over Seoul, South Korea, during KORUS-AQ, Atmos. Chem. Phys., 18, 17769–17800, https://doi.org/10.5194/acp-18-17769-2018, 2018.
Nault, B. A., Jo, D. S., McDonald, B. C., Campuzano-Jost, P., Day, D. A., Hu, W., Schroder, J. C., Allan, J., Blake, D. R., Canagaratna, M. R., Coe, H., Coggon, M. M., DeCarlo, P. F., Diskin, G. S., Dunmore, R., Flocke, F., Fried, A., Gilman, J. B., Gkatzelis, G., Hamilton, J. F., Hanisco, T. F., Hayes, P. L., Henze, D. K., Hodzic, A., Hopkins, J., Hu, M., Huey, L. G., Jobson, B. T., Kuster, W. C., Lewis, A., Li, M., Liao, J., Nawaz, M. O., Pollack, I. B., Peischl, J., Rappenglück, B., Reeves, C. E., Richter, D., Roberts, J. M., Ryerson, T. B., Shao, M., Sommers, J. M., Walega, J., Warneke, C., Weibring, P., Wolfe, G. M., Young, D. E., Yuan, B., Zhang, Q., de Gouw, J. A., and Jimenez, J. L.: Secondary organic aerosols from anthropogenic volatile organic compounds contribute substantially to air pollution mortality, Atmos. Chem. Phys., 21, 11201–11224, https://doi.org/10.5194/acp-21-11201-2021, 2021.
Nel, A.: Atmosphere. Air pollution-related illness: effects of particles, Science, 308, 804–806, https://doi.org/10.1126/science.1108752, 2005.
Ni, J., Yu, G., Guo, Q., Liang, Q., and Zhou, Z.: Experimental and Numerical Study of the Flow Field and Temperature Field for a Large-Scale Radiant Syngas Cooler, Ind. Eng. Chem. Res., 49, 4452–4461, https://doi.org/10.1021/ie100014r, 2010.
Ortega, A. M., Day, D. A., Cubison, M. J., Brune, W. H., Bon, D., de Gouw, J. A., and Jimenez, J. L.: Secondary organic aerosol formation and primary organic aerosol oxidation from biomass-burning smoke in a flow reactor during FLAME-3, Atmos. Chem. Phys., 13, 11551–11571, https://doi.org/10.5194/acp-13-11551-2013, 2013.
Ortega, A. M., Hayes, P. L., Peng, Z., Palm, B. B., Hu, W., Day, D. A., Li, R., Cubison, M. J., Brune, W. H., Graus, M., Warneke, C., Gilman, J. B., Kuster, W. C., de Gouw, J., Gutiérrez-Montes, C., and Jimenez, J. L.: Real-time measurements of secondary organic aerosol formation and aging from ambient air in an oxidation flow reactor in the Los Angeles area, Atmos. Chem. Phys., 16, 7411–7433, https://doi.org/10.5194/acp-16-7411-2016, 2016.
Paciga, A., Karnezi, E., Kostenidou, E., Hildebrandt, L., Psichoudaki, M., Engelhart, G. J., Lee, B.-H., Crippa, M., Prévôt, A. S. H., Baltensperger, U., and Pandis, S. N.: Volatility of organic aerosol and its components in the megacity of Paris, Atmos. Chem. Phys., 16, 2013–2023, https://doi.org/10.5194/acp-16-2013-2016, 2016.
Palm, B. B., Campuzano-Jost, P., Ortega, A. M., Day, D. A., Kaser, L., Jud, W., Karl, T., Hansel, A., Hunter, J. F., Cross, E. S., Kroll, J. H., Peng, Z., Brune, W. H., and Jimenez, J. L.: In situ secondary organic aerosol formation from ambient pine forest air using an oxidation flow reactor, Atmos. Chem. Phys., 16, 2943–2970, https://doi.org/10.5194/acp-16-2943-2016, 2016.
Palm, B. B., Campuzano-Jost, P., Day, D. A., Ortega, A. M., Fry, J. L., Brown, S. S., Zarzana, K. J., Dube, W., Wagner, N. L., Draper, D. C., Kaser, L., Jud, W., Karl, T., Hansel, A., Gutiérrez-Montes, C., and Jimenez, J. L.: Secondary organic aerosol formation from in situ OH, O3, and NO3 oxidation of ambient forest air in an oxidation flow reactor, Atmos. Chem. Phys., 17, 5331–5354, https://doi.org/10.5194/acp-17-5331-2017, 2017.
Palm, B. B., de Sá, S. S., Day, D. A., Campuzano-Jost, P., Hu, W., Seco, R., Sjostedt, S. J., Park, J.-H., Guenther, A. B., Kim, S., Brito, J., Wurm, F., Artaxo, P., Thalman, R., Wang, J., Yee, L. D., Wernis, R., Isaacman-VanWertz, G., Goldstein, A. H., Liu, Y., Springston, S. R., Souza, R., Newburn, M. K., Alexander, M. L., Martin, S. T., and Jimenez, J. L.: Secondary organic aerosol formation from ambient air in an oxidation flow reactor in central Amazonia, Atmos. Chem. Phys., 18, 467–493, https://doi.org/10.5194/acp-18-467-2018, 2018.
Pankow, J. F.: An absorption model of gas/particle partitioning of organic compounds in the atmosphere, Atmos. Environ., 28, 185–188, https://doi.org/10.1016/1352-2310(94)90093-0, 1994.
Park, G., Kim, K., Kang, S., Park, T., Ban, J., and Lee, T.: The Chemical Characteristics and Formation of Potential Secondary Aerosol (PSA) using an Oxidation Flow Reactor (OFR) in the Summer: Focus on the Residential Area, Suwon, Journal of Korean Society for Atmospheric Environment, 35, 786–801, https://doi.org/10.5572/kosae.2019.35.6.786, 2019.
Park, Y. and Kim, H.: Real time measurements of the secondary organic aerosol formation and aging from ambient air using an oxidation flow reactor in seoul during winter, Environ. Pollut., 327, 121464, https://doi.org/10.1016/j.envpol.2023.121464, 2023.
Patankar, S. V. and Spalding, D. B.: A calculation procedure for heat, mass and momentum transfer in three-dimensional parabolic flows, Int. J. Heat Mass Tran., 15, 1787–1806, https://doi.org/10.1016/0017-9310(72)90054-3, 1972.
Pathak, R. K., Stanier, C. O., Donahue, N. M., and Pandis, S. N.: Ozonolysis of α-pinene at atmospherically relevant concentrations: Temperature dependence of aerosol mass fractions (yields), J. Geophys. Res., 112, D03201, https://doi.org/10.1029/2006jd007436, 2007.
Paulsen, D., Dommen, J., Kalberer, M., Prevot, A. S., Richter, R., Sax, M., Steinbacher, M., Weingartner, E., and Baltensperger, U.: Secondary organic aerosol formation by irradiation of 1,3,5-trimethylbenzene-NOx-H2O in a new reaction chamber for atmospheric chemistry and physics, Environ. Sci. Technol., 39, 2668–2678, https://doi.org/10.1021/es0489137, 2005.
Peng, Z. and Jimenez, J. L.: Radical chemistry in oxidation flow reactors for atmospheric chemistry research, Chem. Soc. Rev., 49, 2570–2616, https://doi.org/10.1039/c9cs00766k, 2020.
Peng, Z., Day, D. A., Stark, H., Li, R., Lee-Taylor, J., Palm, B. B., Brune, W. H., and Jimenez, J. L.: HOx radical chemistry in oxidation flow reactors with low-pressure mercury lamps systematically examined by modeling, Atmos. Meas. Tech., 8, 4863–4890, https://doi.org/10.5194/amt-8-4863-2015, 2015.
Peng, Z., Palm, B. B., Day, D. A., Talukdar, R. K., Hu, W., Lambe, A. T., Brune, W. H., and Jimenez, J. L.: Model Evaluation of New Techniques for Maintaining High-NO Conditions in Oxidation Flow Reactors for the Study of OH-Initiated Atmospheric Chemistry, ACS Earth and Space Chemistry, 2, 72–86, https://doi.org/10.1021/acsearthspacechem.7b00070, 2018.
Peng, Z., Lee-Taylor, J., Orlando, J. J., Tyndall, G. S., and Jimenez, J. L.: Organic peroxy radical chemistry in oxidation flow reactors and environmental chambers and their atmospheric relevance, Atmos. Chem. Phys., 19, 813–834, https://doi.org/10.5194/acp-19-813-2019, 2019.
Pierce, J. R., Chen, K., and Adams, P. J.: Contribution of primary carbonaceous aerosol to cloud condensation nuclei: processes and uncertainties evaluated with a global aerosol microphysics model, Atmos. Chem. Phys., 7, 5447–5466, https://doi.org/10.5194/acp-7-5447-2007, 2007.
Poschl, U.: Atmospheric aerosols: composition, transformation, climate and health effects, Angew. Chem. Int. Edit., 44, 7520–7540, https://doi.org/10.1002/anie.200501122, 2005.
Presto, A. A., Hartz, K. E., and Donahue, N. M.: Secondary organic aerosol production from terpene ozonolysis. 2. Effect of NOx concentration, Environ. Sci. Technol., 39, 7046–7054, https://doi.org/10.1021/es050400s, 2005.
Price, D. J., Kacarab, M., Cocker, D. R., Purvis-Roberts, K. L., and Silva, P. J.: Effects of temperature on the formation of secondary organic aerosol from amine precursors, Aerosol Sci. Tech., 50, 1216–1226, https://doi.org/10.1080/02786826.2016.1236182, 2016.
Qi, L., Nakao, S., Tang, P., and Cocker III, D. R.: Temperature effect on physical and chemical properties of secondary organic aerosol from m-xylene photooxidation, Atmos. Chem. Phys., 10, 3847–3854, https://doi.org/10.5194/acp-10-3847-2010, 2010.
Quéléver, L. L. J., Kristensen, K., Normann Jensen, L., Rosati, B., Teiwes, R., Daellenbach, K. R., Peräkylä, O., Roldin, P., Bossi, R., Pedersen, H. B., Glasius, M., Bilde, M., and Ehn, M.: Effect of temperature on the formation of highly oxygenated organic molecules (HOMs) from alpha-pinene ozonolysis, Atmos. Chem. Phys., 19, 7609–7625, https://doi.org/10.5194/acp-19-7609-2019, 2019.
Riipinen, I., Pierce, J. R., Donahue, N. M., and Pandis, S. N.: Equilibration time scales of organic aerosol inside thermodenuders: Evaporation kinetics versus thermodynamics, Atmos. Environ., 44, 597–607, https://doi.org/10.1016/j.atmosenv.2009.11.022, 2010.
Robbins, R. C. and Cadle, R. D.: Kinetics of the Reaction between Gaseous Ammonia and Sulfuric Acid Droplets in an Aerosol, J. Phys. Chem., 62, 469–471, https://doi.org/10.1021/j150562a025, 2002.
Roldin, P., Eriksson, A. C., Nordin, E. Z., Hermansson, E., Mogensen, D., Rusanen, A., Boy, M., Swietlicki, E., Svenningsson, B., Zelenyuk, A., and Pagels, J.: Modelling non-equilibrium secondary organic aerosol formation and evaporation with the aerosol dynamics, gas- and particle-phase chemistry kinetic multilayer model ADCHAM, Atmos. Chem. Phys., 14, 7953–7993, https://doi.org/10.5194/acp-14-7953-2014, 2014.
Rollins, A. W., Kiendler-Scharr, A., Fry, J. L., Brauers, T., Brown, S. S., Dorn, H.-P., Dubé, W. P., Fuchs, H., Mensah, A., Mentel, T. F., Rohrer, F., Tillmann, R., Wegener, R., Wooldridge, P. J., and Cohen, R. C.: Isoprene oxidation by nitrate radical: alkyl nitrate and secondary organic aerosol yields, Atmos. Chem. Phys., 9, 6685–6703, https://doi.org/10.5194/acp-9-6685-2009, 2009.
Rowe, J. P., Lambe, A. T., and Brune, W. H.: Technical Note: Effect of varying the λ = 185 and 254 nm photon flux ratio on radical generation in oxidation flow reactors, Atmos. Chem. Phys., 20, 13417–13424, https://doi.org/10.5194/acp-20-13417-2020, 2020.
Saha, P. K. and Grieshop, A. P.: Exploring Divergent Volatility Properties from Yield and Thermodenuder Measurements of Secondary Organic Aerosol from alpha-Pinene Ozonolysis, Environ. Sci. Technol., 50, 5740–5749, https://doi.org/10.1021/acs.est.6b00303, 2016.
Saha, P. K., Khlystov, A., Yahya, K., Zhang, Y., Xu, L., Ng, N. L., and Grieshop, A. P.: Quantifying the volatility of organic aerosol in the southeastern US, Atmos. Chem. Phys., 17, 501–520, https://doi.org/10.5194/acp-17-501-2017, 2017.
Saha, P. K., Reece, S. M., and Grieshop, A. P.: Seasonally Varying Secondary Organic Aerosol Formation From In-Situ Oxidation of Near-Highway Air, Environ. Sci. Technol., 52, 7192–7202, https://doi.org/10.1021/acs.est.8b01134, 2018.
Sbai, S. E., Li, C., Boreave, A., Charbonnel, N., Perrier, S., Vernoux, P., Bentayeb, F., George, C., and Gil, S.: Atmospheric photochemistry and secondary aerosol formation of urban air in Lyon, France, J. Environ. Sci.-China, 99, 311–323, https://doi.org/10.1016/j.jes.2020.06.037, 2021.
Schobesberger, S., D'Ambro, E. L., Lopez-Hilfiker, F. D., Mohr, C., and Thornton, J. A.: A model framework to retrieve thermodynamic and kinetic properties of organic aerosol from composition-resolved thermal desorption measurements, Atmos. Chem. Phys., 18, 14757–14785, https://doi.org/10.5194/acp-18-14757-2018, 2018.
Sengupta, D., Samburova, V., Bhattarai, C., Kirillova, E., Mazzoleni, L., Iaukea-Lum, M., Watts, A., Moosmüller, H., and Khlystov, A.: Light absorption by polar and non-polar aerosol compounds from laboratory biomass combustion, Atmos. Chem. Phys., 18, 10849–10867, https://doi.org/10.5194/acp-18-10849-2018, 2018.
Shah, R. U., Coggon, M. M., Gkatzelis, G. I., McDonald, B. C., Tasoglou, A., Huber, H., Gilman, J., Warneke, C., Robinson, A. L., and Presto, A. A.: Urban Oxidation Flow Reactor Measurements Reveal Significant Secondary Organic Aerosol Contributions from Volatile Emissions of Emerging Importance, Environ. Sci. Technol., 54, 714–725, https://doi.org/10.1021/acs.est.9b06531, 2020.
Shih, T.-H., Liou, W. W., Shabbir, A., Yang, Z., and Zhu, J.: A new k-? eddy viscosity model for high reynolds number turbulent flows, Comput. Fluids, 24, 227–238, https://doi.org/10.1016/0045-7930(94)00032-t, 1995.
Siemens, K., Morales, A., He, Q., Li, C., Hettiyadura, A. P. S., Rudich, Y., and Laskin, A.: Molecular Analysis of Secondary Brown Carbon Produced from the Photooxidation of Naphthalene, Environ. Sci. Technol., 56, 3340–3353, https://doi.org/10.1021/acs.est.1c03135, 2022.
Simon, M., Dada, L., Heinritzi, M., Scholz, W., Stolzenburg, D., Fischer, L., Wagner, A. C., Kürten, A., Rörup, B., He, X.-C., Almeida, J., Baalbaki, R., Baccarini, A., Bauer, P. S., Beck, L., Bergen, A., Bianchi, F., Bräkling, S., Brilke, S., Caudillo, L., Chen, D., Chu, B., Dias, A., Draper, D. C., Duplissy, J., El-Haddad, I., Finkenzeller, H., Frege, C., Gonzalez-Carracedo, L., Gordon, H., Granzin, M., Hakala, J., Hofbauer, V., Hoyle, C. R., Kim, C., Kong, W., Lamkaddam, H., Lee, C. P., Lehtipalo, K., Leiminger, M., Mai, H., Manninen, H. E., Marie, G., Marten, R., Mentler, B., Molteni, U., Nichman, L., Nie, W., Ojdanic, A., Onnela, A., Partoll, E., Petäjä, T., Pfeifer, J., Philippov, M., Quéléver, L. L. J., Ranjithkumar, A., Rissanen, M. P., Schallhart, S., Schobesberger, S., Schuchmann, S., Shen, J., Sipilä, M., Steiner, G., Stozhkov, Y., Tauber, C., Tham, Y. J., Tomé, A. R., Vazquez-Pufleau, M., Vogel, A. L., Wagner, R., Wang, M., Wang, D. S., Wang, Y., Weber, S. K., Wu, Y., Xiao, M., Yan, C., Ye, P., Ye, Q., Zauner-Wieczorek, M., Zhou, X., Baltensperger, U., Dommen, J., Flagan, R. C., Hansel, A., Kulmala, M., Volkamer, R., Winkler, P. M., Worsnop, D. R., Donahue, N. M., Kirkby, J., and Curtius, J.: Molecular understanding of new-particle formation from α-pinene between −50 and +25 °C, Atmos. Chem. Phys., 20, 9183–9207, https://doi.org/10.5194/acp-20-9183-2020, 2020.
Simonen, P., Saukko, E., Karjalainen, P., Timonen, H., Bloss, M., Aakko-Saksa, P., Rönkkö, T., Keskinen, J., and Dal Maso, M.: A new oxidation flow reactor for measuring secondary aerosol formation of rapidly changing emission sources, Atmos. Meas. Tech., 10, 1519–1537, https://doi.org/10.5194/amt-10-1519-2017, 2017.
Srivastava, D., Vu, T. V., Tong, S., Shi, Z., and Harrison, R. M.: Formation of secondary organic aerosols from anthropogenic precursors in laboratory studies, npj Climate and Atmospheric Science, 5, 22, https://doi.org/10.1038/s41612-022-00238-6, 2022.
Srivastava, D., Li, W., Tong, S., Shi, Z., and Harrison, R. M.: Characterization of products formed from the oxidation of toluene and m-xylene with varying NOx and OH exposure, Chemosphere, 334, 139002, https://doi.org/10.1016/j.chemosphere.2023.139002, 2023.
Stanier, C. O., Donahue, N., and Pandis, S. N.: Parameterization of secondary organic aerosol mass fractions from smog chamber data, Atmos. Environ., 42, 2276–2299, https://doi.org/10.1016/j.atmosenv.2007.12.042, 2008.
Sumlin, B., Fortner, E., Lambe, A., Shetty, N. J., Daube, C., Liu, P., Majluf, F., Herndon, S., and Chakrabarty, R. K.: Diel cycle impacts on the chemical and light absorption properties of organic carbon aerosol from wildfires in the western United States, Atmos. Chem. Phys., 21, 11843–11856, https://doi.org/10.5194/acp-21-11843-2021, 2021.
Takekawa, H., Minoura, H., and Yamazaki, S.: Temperature dependence of secondary organic aerosol formation by photo-oxidation of hydrocarbons, Atmos. Environ., 37, 3413–3424, https://doi.org/10.1016/s1352-2310(03)00359-5, 2003.
Tillmann, R., Hallquist, M., Jonsson, Å. M., Kiendler-Scharr, A., Saathoff, H., Iinuma, Y., and Mentel, T. F.: Influence of relative humidity and temperature on the production of pinonaldehyde and OH radicals from the ozonolysis of α-pinene, Atmospheric Chemistry and Physics, 10, 7057–7072, https://doi.org/10.5194/acp-10-7057-2010, 2010.
Tkacik, D. S., Lambe, A. T., Jathar, S., Li, X., Presto, A. A., Zhao, Y., Blake, D., Meinardi, S., Jayne, J. T., Croteau, P. L., and Robinson, A. L.: Secondary organic aerosol formation from in-use motor vehicle emissions using a potential aerosol mass reactor, Environ. Sci. Technol., 48, 11235–11242, https://doi.org/10.1021/es502239v, 2014.
Wang, X., Liu, T., Bernard, F., Ding, X., Wen, S., Zhang, Y., Zhang, Z., He, Q., Lü, S., Chen, J., Saunders, S., and Yu, J.: Design and characterization of a smog chamber for studying gas-phase chemical mechanisms and aerosol formation, Atmos. Meas. Tech., 7, 301–313, https://doi.org/10.5194/amt-7-301-2014, 2014.
Warren, B., Austin, R. L., and Cocker, D. R.: Temperature dependence of secondary organic aerosol, Atmos. Environ., 43, 3548–3555, https://doi.org/10.1016/j.atmosenv.2009.04.011, 2009.
Watne, A. K., Psichoudaki, M., Ljungstrom, E., Le Breton, M., Hallquist, M., Jerksjo, M., Fallgren, H., Jutterstrom, S., and Hallquist, A. M.: Fresh and Oxidized Emissions from In-Use Transit Buses Running on Diesel, Biodiesel, and CNG, Environ. Sci. Technol., 52, 7720–7728, https://doi.org/10.1021/acs.est.8b01394, 2018.
White, S., Angove, D., Li, K., Campbell, I., Element, A., Halliburton, B., Lavrencic, S., Cameron, D., Jamie, I., and Azzi, M.: Development of a new smog chamber for studying the impact of different UV lamps on SAPRC chemical mechanism predictions and aerosol formation, Environ. Chem., 15, 171–182, https://doi.org/10.1071/en18005, 2018.
Xu, N. and Collins, D. R.: Design and characterization of a new oxidation flow reactor for laboratory and long-term ambient studies, Atmos. Meas. Tech., 14, 2891–2906, https://doi.org/10.5194/amt-14-2891-2021, 2021.
Xu, W., Takeuchi, M., Chen, C., Qiu, Y., Xie, C., Xu, W., Ma, N., Worsnop, D. R., Ng, N. L., and Sun, Y.: Estimation of particulate organic nitrates from thermodenuder–aerosol mass spectrometer measurements in the North China Plain, Atmos. Meas. Tech., 14, 3693–3705, https://doi.org/10.5194/amt-14-3693-2021, 2021.
Xu, W., Li, Z., Lambe, A. T., Li, J., Liu, T., Du, A., Zhang, Z., Zhou, W., and Sun, Y.: Secondary organic aerosol formation and aging from ambient air in an oxidation flow reactor during wintertime in Beijing, China, Environ. Res., 209, 112751, https://doi.org/10.1016/j.envres.2022.112751, 2022.
Zhang, Q., Xu, Y., and Jia, L.: Secondary organic aerosol formation from OH-initiated oxidation of m-xylene: effects of relative humidity on yield and chemical composition, Atmos. Chem. Phys., 19, 15007–15021, https://doi.org/10.5194/acp-19-15007-2019, 2019.
Zhang, X., McVay, R. C., Huang, D. D., Dalleska, N. F., Aumont, B., Flagan, R. C., and Seinfeld, J. H.: Formation and evolution of molecular products in alpha-pinene secondary organic aerosol, P. Natl. Acad. Sci. USA, 112, 14168–14173, https://doi.org/10.1073/pnas.1517742112, 2015.
Zhao, R., Zhang, Q., Xu, X., Zhao, W., Yu, H., Wang, W., Zhang, Y., and Zhang, W.: Effect of experimental conditions on secondary organic aerosol formation in an oxidation flow reactor, Atmos. Pollut. Res., 12, 205–213, https://doi.org/10.1016/j.apr.2021.01.011, 2021.
Ziemann, P. J. and Atkinson, R.: Kinetics, products, and mechanisms of secondary organic aerosol formation, Chem. Soc. Rev., 41, 6582–6605, https://doi.org/10.1039/c2cs35122f, 2012.
Zong, T., Wu, Z., Wang, J., Bi, K., Fang, W., Yang, Y., Yu, X., Bao, Z., Meng, X., Zhang, Y., Guo, S., Chen, Y., Liu, C., Zhang, Y., Li, S.-M., and Hu, M.: A new smog chamber system for atmospheric multiphase chemistry study: design and characterization, Atmos. Meas. Tech., 16, 3679–3692, https://doi.org/10.5194/amt-16-3679-2023, 2023.