the Creative Commons Attribution 4.0 License.
the Creative Commons Attribution 4.0 License.
 | 16 Sep 2024
Increasing aerosol optical depth spatial and temporal availability by merging datasets from geostationary and sun-synchronous satellites
Robert C. Levy
Shana Mattoo
Lorraine A. Remer
Zhaohui Zhang
Virginia Sawyer
Jennifer Wei
Sally Zhao
Min Oo
V. Praju Kiliyanpilakkil
Xiaohua Pan
This comprehensive study analyzed aerosol products from six low-Earth orbit (LEO) and geostationary Earth orbit (GEO) sensors. LEO sensors like the MODerate resolution Imaging Spectroradiometer (MODIS) and VIsible InfraRed Suite (VIIRS) provide one to two daily global measurements, while GEO sensors (Advanced Himawari Imager: AHI, Advanced Baseline Imager: ABI) offer high-frequency data (∼ 10 min) over specific regions. The combination of LEO and GEO capabilities offers expanded coverage of the global aerosol system if aerosol retrievals are applied consistently across all sensors and packaged in an easy-to-use product. The Dark Target aerosol retrieval algorithm was applied to the six sensors, and the resulting Level 2 aerosol optical depth (AOD) products were gridded and merged into a Level 3 quarter-degree latitude–longitude grid with a 30 min temporal resolution, providing the necessary consistency and packaging. Validation of this packaged Level 3 AOD product against Aerosol Robotics NETwork (AERONET) measurements across global locations showcased the merged product's robustness with a correlation coefficient of 0.83, revealing a global mean bias of approximately ±0.05, with 65.5 % of retrievals falling within an expected uncertainty range, underlining the reliability of the dataset. The new gridded Level 3 dataset significantly improved daily global coverage to nearly 45 %, overcoming the limitations of individual sensors, which typically range from 12 % to 25 %. Furthermore, this merged dataset approximates the diurnal cycle of AOD observed by AERONET, thus offering insights into diurnal signatures retrieved elsewhere. The resulting dataset's high spatiotemporal resolution and improved global coverage, especially in regions covered by GEO sensors (Americas and Asia), make it a valuable tool for diverse applications. Tracking aerosol transport from phenomena like wildfires and dust storms is gaining precision, enabling enhanced air quality forecasting and hindcasting. Additionally, the study positions the merged dataset as a significant asset for evaluating and intercomparing regional or global model simulations, which was previously unattainable in such a gridded format. The dataset and fusion framework layout in this study have the potential to include data from recently (future) launched other GEO (FCI, AMI) and LEO (PACE, VIIRS-JPSS) sensors.
- Article
(10933 KB) - Full-text XML
-
Supplement
(52167 KB) - BibTeX
- EndNote


Operational satellite remote sensing of aerosol properties and the dissemination of standard aerosol products are entering their third decade. Beginning with the launch of Terra in December 1999, the research and applications communities have been able to access a robust daily representation of Earth's global aerosol system at a variety of georeferenced spatial resolutions or on a 1° global grid. In particular, the Dark Target (DT) aerosol algorithm (Remer et al., 2005; Levy et al., 2013) has been applied to observations from the MODerate resolution Imaging Spectroradiometer (MODIS) on the Terra and Aqua satellites (Kaufman et al., 2002) and later from the VIsible InfraRed Suite (VIIRS) on board the Suomi National Polar-orbiting Partnership (S-NPP) satellite (Sawyer et al., 2020) and now NOAA-20 (formerly known as JPSS-1). This algorithm introduced the research and applications communities to consistent, validated daily aerosol information. The information is provided as spectral aerosol optical depth (AOD) over dark, cloud-free, non-snowy, non-glint ocean and land surfaces as well as for ocean scenes only; there is also information on aerosol particle size (Levy et al., 2013). The DT standard products have become essential inputs to assimilation systems (Zhang et al., 2008; Benedetti et al., 2009; Gelaro et al., 2017), are used for climate model validation (Kinne et al., 2003; Bellouin et al., 2008; Chin et al., 2014) and estimates of intercontinental transport of particles (Kaufman et al., 2005b; Yu et al., 2012, 2019), and have provided new insight into aerosol–cloud processes (Kaufman et al., 2005a; Koren et al., 2007, 2008; Yuan et al., 2011a, b). The AOD products are used as a proxy for particulate matter (PM), an essential air quality parameter (Al-Saadi et al., 2005; Gupta and Christopher, 2009a, b; Xin et al., 2014). Thus, the daily DT AOD aids operational air quality forecasting and post-event analysis of exceptional poor-air-quality events.
While the DT aerosol products cover the globe every day over middle and high latitudes and ever 2 d over the tropics, clouds, glint, and bright surfaces prevent the datasets from being truly global in coverage. Analysis shows that over North America and adjoining oceans, only about a third of all available scenes (∼ 10 km × 10 km) produce an AOD product from a MODIS-like instrument on any given day (Remer et al., 2012). Having multiple polar-orbiting views of the same scene might increase data product availability, but not much if the two instruments pass close in time, such as Aqua and S-NPP in North America. However, a sensor in geostationary orbit (GEO) makes many observations of the same scenes during the day, which gives more opportunities to observe that scene in cloud-free and glint-free conditions and return an AOD value at least once per day. In fact, because a scene is rarely continually cloudy from sunrise to sunset, we see that geostationary sampling can find at least one cloud-free opportunity to make an aerosol retrieval on any day in its limited region of operations. This increases the probability of at least one aerosol retrieval sometime during the day to nearly 100 % (Remer et al., 2012). If the interest in AOD products is simply to have one good retrieval per day in a specific region, as offered by polar-orbiting satellites, then aerosol products from geostationary satellites will be sufficient to increase product availability and meet user needs. However, even though there will be once-per-day observations with a GEO satellite, unlike the LEO satellites, the time of that once-per-day retrieval can vary widely over daylight hours.
Using one retrieval, taken at any time of the day, to represent daily conditions assumes that there is no significant diurnal signal at that site. On a global scale, this may be true. However, aerosols are dependent on source emissions, cloud processing, and local weather patterns, all of which have diurnal signatures. Previous studies suggest that aerosol diurnal signatures exist prominently at the local scale and less so on regional scales (Kaufman et al., 2000, 2005c; Smirnov et al., 2002; Zhang et al., 2012; Arola et al., 2013). Therefore observing diurnal patterns is of interest to many research and applications communities. For example, the air quality community can use the information for improvements to forecasting and mitigating unhealthy PM levels. The climate and cloud communities are interested in aerosol diurnal patterns because of the convolution between how aerosol and clouds evolve together during the day and how aerosol influences cloud and precipitation processes. These previous studies that found no regional diurnal aerosol patterns used ground-based remote sensing observations from the Aerosol Robotics NETwork (AERONET) (Holben et al., 1998; Giles et al., 2019). AERONET observations are site-specific but globally distributed and report AOD every 5–15 min throughout the daylight hours. Using AERONET there have been several attempts to determine local, regional, and global aerosol diurnal patterns (Kaufman et al., 2000, 2005c; Smirnov et al., 2002; Zhang et al., 2012; Arola et al., 2013). Even though hundreds of AERONET stations went into the studies, the network still sparsely covers the globe compared to a satellite dataset. While polar-orbiting satellite sensors such as MODIS and VIIRS have succeeded in filling in spatial holes to produce global measures of AOD, they are inadequate for filling in temporal holes to resolve any aerosol diurnal cycles. One goal of producing aerosol products from geostationary satellite sensors will be the opportunity to determine possible aerosol diurnal signatures at a range of spatial scales globally.
One caveat to using geostationary satellite observations for aerosol datasets is the loss of the global picture. By definition, geostationary satellites are regional instruments hovering over a specific Equator position and imaging a circular portion of the Earth that covers roughly of the global surface area. Covering the globe with multiple geostationary sensors is not the same as viewing the entire globe using multiple orbits of a single MODIS-like sensor. Not all geostationary sensors are identical, as described in Sect. 3. Even if the sensors are built identically, they may not produce identical aerosol results (due to changes in sun–satellite geometry), as was seen with Terra-MODIS and Aqua-MODIS (Levy et al., 2018). Thus, the ideal strategy to realize the benefits of geostationary aerosol data, namely increased availability and temporal resolution, without losing the benefits of daily global sampling of polar orbiting sensors is to combine the aerosol products from both types of instruments. To do so, the strategy must be to maintain consistency in aerosol retrieval as it is applied to multiple sensors while accommodating the unique characteristics of each sensor.
In this paper, we report on a unique global dataset produced from merging aerosol products from three polar-orbiting satellites (Terra-MODIS, Aqua-MODIS, S-NPP-VIIRS) and three geostationary satellites (Advanced Himawari Imager (AHI) on Himawari-8, Advanced Baseline Imager (ABI) on GOES-16, ABI on GOES-17). All six aerosol databases were produced with adapted versions of the DT aerosol algorithm, thereby maintaining consistency in the aerosol algorithm. The result is a global gridded dataset at 0.25° latitude–longitude spatial resolution and 30 min temporal resolution that increases overall AOD availability with some ability to discern the diurnal cycle. We do not start from scratch to retrieve aerosol products from satellite-observed radiances but use already-retrieved aerosol products to create a joint global gridded dataset. Note that this is the first time that the DT aerosol product from multiple sensors has been gridded to a finer resolution than the MODIS 1° Level 3 operational product.
This dataset addresses two goals. First, it increases spatial coverage by filling in the holes caused by clouds and glint in the global aerosol product. Second, the dataset fills in the temporal holes in the diurnal signature caused by the once-per-day sampling of the polar-orbiting sensors. It is this synthesis of spatially and temporally rich data and the uniqueness of a fine-resolution global grid, easily ingested by global models and gridded data systems, that offers new value to the aerosol community.
The paper is organized as follows. In Sect. 2, we describe the DT algorithm and how it is adapted to different sensors and then describe how these individual datasets are gridded and integrated into a global grid. Section 3 demonstrates the increased availability of the aerosol product and expanded global coverage. This is followed by comparing retrievals from the geostationary sensors to those from the polar-orbiting sensors, illustrating global consistency in the product. The new gridded data are validated compared with AERONET, and then diurnal signatures are explored regionally and globally. We wrap up the paper with a discussion of the utility of the new product, a discussion of aerosol diurnal signatures, and the outlook moving forward. Throughout the paper we will refer to geostationary instruments as GEO satellites or sensors and polar-orbiting instruments that fly on low-Earth orbit satellites as LEO satellites or sensors.
The DT algorithm has been documented extensively in the reviewed literature (Kaufman et al., 1997; Tanré et al., 1997; Remer et al., 2005; Levy et al., 2013; Sawyer et al., 2020) and with a detailed description maintained online as an Algorithm Theoretical Basis Document (ATBD, 2023). Here we provide a summary of the algorithm and then discuss the need for adjustments to the basic algorithm because of specific characteristics of new sensors.
The basic DT aerosol algorithm uses a look-up table (LUT) structure to link measured top-of-atmosphere (TOA) reflectance to an AOD value given a specific sun–sensor geometry and assumptions about the aerosol properties and surface beneath. There are separate algorithm structures and assumptions for retrievals over the ocean versus those over land. Over ocean, the algorithm uses up to six measured reflectances from wavelengths that span the range from 0.5 to 2.3 µm. The ocean surface is modeled as a rough ocean surface with ancillary data determining the surface wind speed and a constant spectrally varying value used for water-leaving reflectance. The algorithm avoids clouds, sun glint, marine sediments, and other ocean areas that do not conform to expected spectral signatures of the ocean surface. The aerosol properties over the ocean are modeled as individual lognormal modes of spherical particles, some in the fine-mode range and some in the coarse-mode range. There is also a special nonspherical coarse mode for desert dust (Zhou et al., 2020a, b). The algorithm finds the best combination of fine and coarse modes, as well as the number of particles in each one that produces the TOA reflectances best matching the corresponding spectral reflectances measured by satellite for the selected scene. The result is a solution set of spectral AOD that represents the aerosol loading, the modes chosen, and the relative weight of each mode.
Over land the algorithm must address the complexity of a much more complicated surface than over ocean. The algorithm reduces uncertainties in the retrieval by choosing to retrieve only over “dark surfaces”, mainly dark vegetated surfaces. Thus, the DT algorithm avoids clouds, snow, ice, and non-vegetated deserts and other arid landscapes. Over the selected dark targets the DT land algorithm parameterizes the relationships between different wavelengths of surface reflectance using empirical constructs (Levy et al., 2007). There is a special empirical relationship used for urban surfaces (Gupta et al., 2016). Over land, aerosol properties are modeled by bimodal representations. One of the bimodal models is coarse-mode-dominated, while the other three are fine-mode-dominated but with different absorption properties. The algorithm assigns specific absorption properties by region and season and then allows the retrieval to mix the assigned fine mode and specific absorption with the generic coarse-mode model. Again, the aerosol loading is adjusted to match the measured TOA reflectances to results from the LUT. The primary result is the AOD at 0.55 µm.
Applied to each sensor separately, the results of the DT algorithm are denoted as Level 2 products. Each retrieval is tagged with a latitude–longitude, and the retrievals follow the shape of the instrument's scan. Level 3 products arise from aggregating Level 2 aerosol products onto regular spatial (e.g., equal latitude–longitude) and temporal grids. The DT algorithm was initially developed for MODIS on Terra and then applied to Aqua with no changes, as MODIS-Terra and MODIS-Aqua were designed as identical twins. Initial studies (e.g., Remer et al., 2006) suggested that the two MODIS products were statistically identical on the global scale. With the implementation of Collection 5 calibration and reprocessing that began in September 2006 the DT aerosol results from the two sensors began to diverge (Levy et al., 2018), with subsequent updates in calibration (e.g., Lyapustin et al., 2023) showing improvements. Although an offset remains (AOD from MODIS-Terra is higher than Aqua by about 10 %) between the two products for the current reprocessing known as Collection 6.1, they agree to within expected uncertainty.
However, when the DT algorithm was ported to VIIRS, its first non-MODIS application, changes had to be made to the algorithm a priori (Sawyer et al., 2020). VIIRS uses different wavelengths than MODIS, even if the two sensors cover the same range, and VIIRS and MODIS have different swath widths and native pixel resolutions. Thus, the DT algorithm required calculation of a specific LUT for VIIRS to match the new wavelengths and required other modifications because of the change in native pixel resolution (Sawyer et al., 2020). In this study we port the DT algorithm again to new sensors (ABI and AHI), which require similar adjustments to the basic DT algorithm described here. The details of the instrument specifics requiring algorithm adjustment are presented in Sect. 3.
3.1 Satellite aerosol datasets
The LEO sensors used in this study are two for MODIS, one on Terra, one on Aqua, and one VIIRS (on S-NPP). The three GEO sensors used are two ABIs (on GOES-16 and GOES-17) and AHI (on Himawari-08). For the period of this study (1 April 2019 to 31 March 2020), GOES-16 was located in the operational GOES-East position (° W), GOES-17 in the GOES-West position (° W), and Himawari-08 in the Himawari position (140.7° E). From each of these sensors, we use the Level 2 (L2) AOD retrieved by the DT algorithm and refer to the products as MODIS-T, MODIS-A, VIIRS-SNPP, ABI-G16, ABI-G17, and AHI-H08, respectively. Note that our starting point is Level 2, after single-sensor algorithms have produced aerosol products.
For MODIS, we used DT-retrieved AOD data at nominal 10 km×10 km spatial resolution, specifically the standard MOD04/MYD04 Collection 6.1 dataset available via the Level 1 and Atmosphere Archive & Distribution System Distributed Active Archive Center (LAADS DAAC). VIIRS AOD data used are retrieved at nominal 6 km×6 km, and we used V1.1 (also available from LAADS). Note that since October 2022, there has been a new version (V2.0) of VIIRS AOD retrievals, but they are not used here. The AOD data from all three GEO sensors (Gupta et al., 2019) are at nominal 10 km×10 km and produced as Version V0. From here on, we use the term “pixel” to refer to the size of a Level 2 retrieval box, noting that it varies between sensors and varies across the scan or swath of each sensor. A “native pixel” refers to the size of the original sensor observations (e.g., the Level 1 or L1 data).
Although the DT algorithm reports AODs in multiple wavelengths depending on individual sensors' available channels (Table 2), we focus on AOD at 0.55 µm in this analysis. Quality flags (QF = 0, 1, 2, 3) are produced with each retrieval, where 0 is marginal, 1 is good, 2 is moderate, and 3 is for the best-quality (highest confidence) data. We used each sensor's variable named “Optical_Depth_Land_And_Ocean”, which represents the science team's recommended method for data filtering of QA = 2 and 3 over land and QA = 1, 2, and 3 over the ocean. Specifically, scientific datasets (SDSs) in Table 1 from the Level 2 aerosol products from all six sensors are used in this study.
Table 1Level 2 aerosols scientific datasets used in the study.
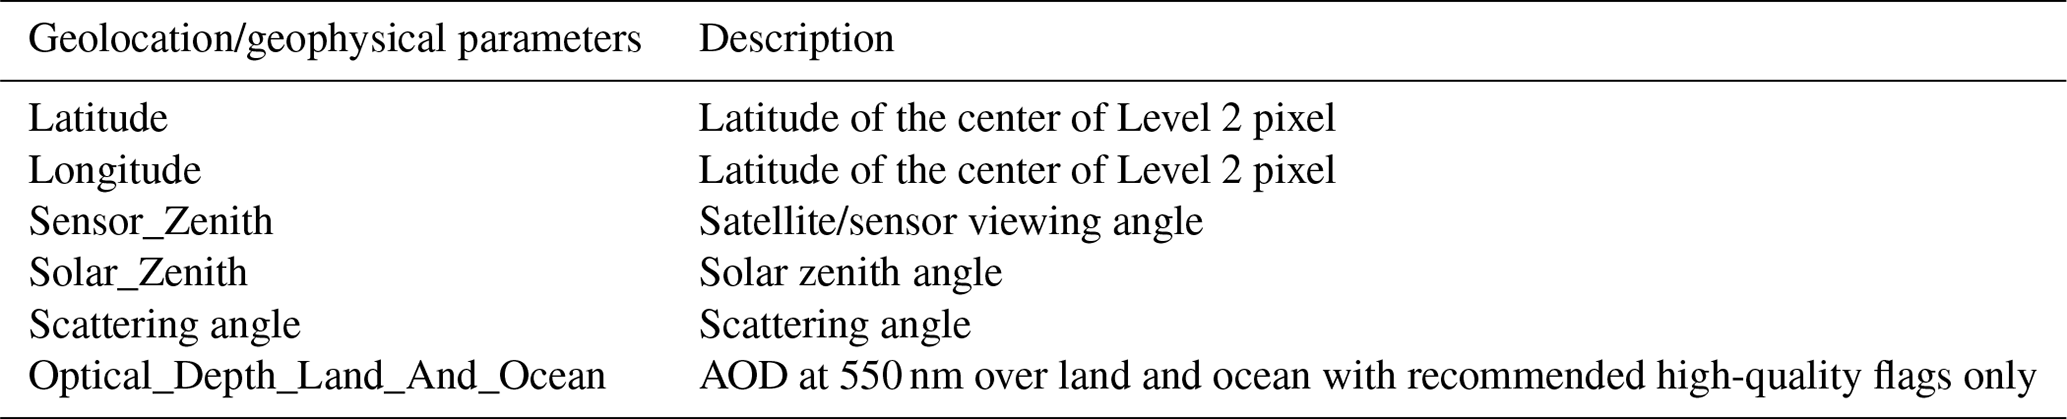
Table 2 provides details on each sensor, including channels, resolution, data version, and file specifications used in the current analysis. It is important to note that each sensor stores the Level 2 aerosol datasets in files covering different time windows. MODIS's L2 DT aerosol datasets come in 5 min files (known as granules) and VIIRS is in 6 min granules, whereas all three GEO sensors are in 10 min files that represent full-disk (FD) observations. The coverage of data reported in each file from the six sensors also varies. Figure 1 demonstrates an example of spatial coverage from the individual sensors on 7 September 2019. The map is produced by plotting every fifth pixel from MODIS, every 10th from VIIRS, and every third from GEO for better visuals of coverage from an individual sensor. In this figure, coverage by the GEO sensor for 10 min is shown, where one single orbit (about 90–100 min) from the LEO sensor is shown. The two ABIs cover the western hemisphere with some overlap such that ABI-G16 has more coverage over the Atlantic Ocean, whereas ABI-G17 extends its coverage west into to the Pacific Ocean. The AHI full disk mostly covers the Asia Pacific region with some overlap with ABI west in the Pacific Ocean. The central time of observations from various sensors corresponds to 12:00 UTC, which conveniently has Aqua and SNPP filling in over Africa. A few hours earlier or later, the LEO sensors would overlap with the GEO, and Africa would have no observations.
Table 2Satellite and/or sensor used in this study and their spectral bands, resolution, coverage, data version, and other characteristics. The wavelength and resolution are in micrometers (µm) and kilometers, respectively. The “–” represents a missing band in a particular sensor.
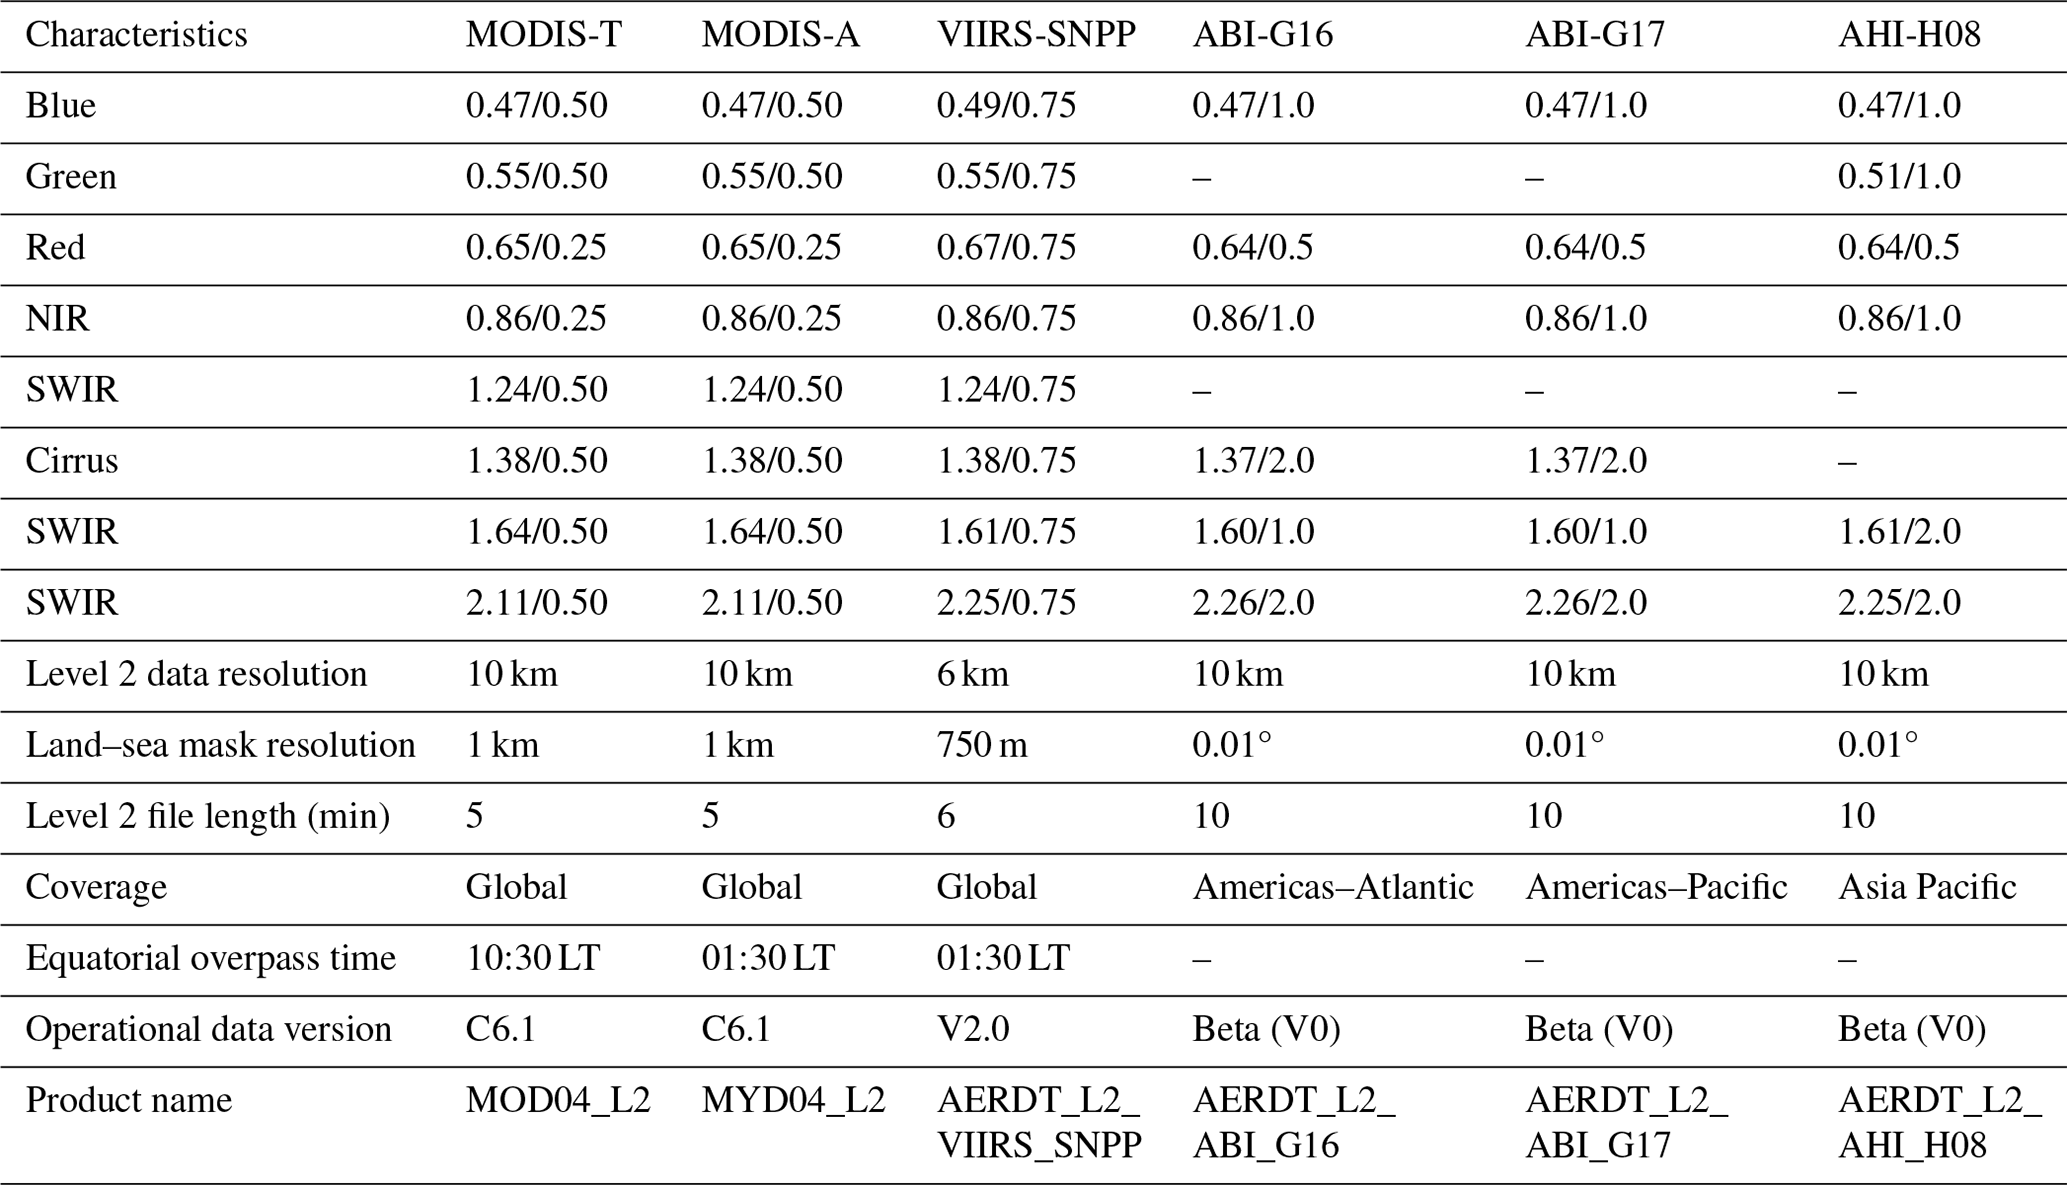
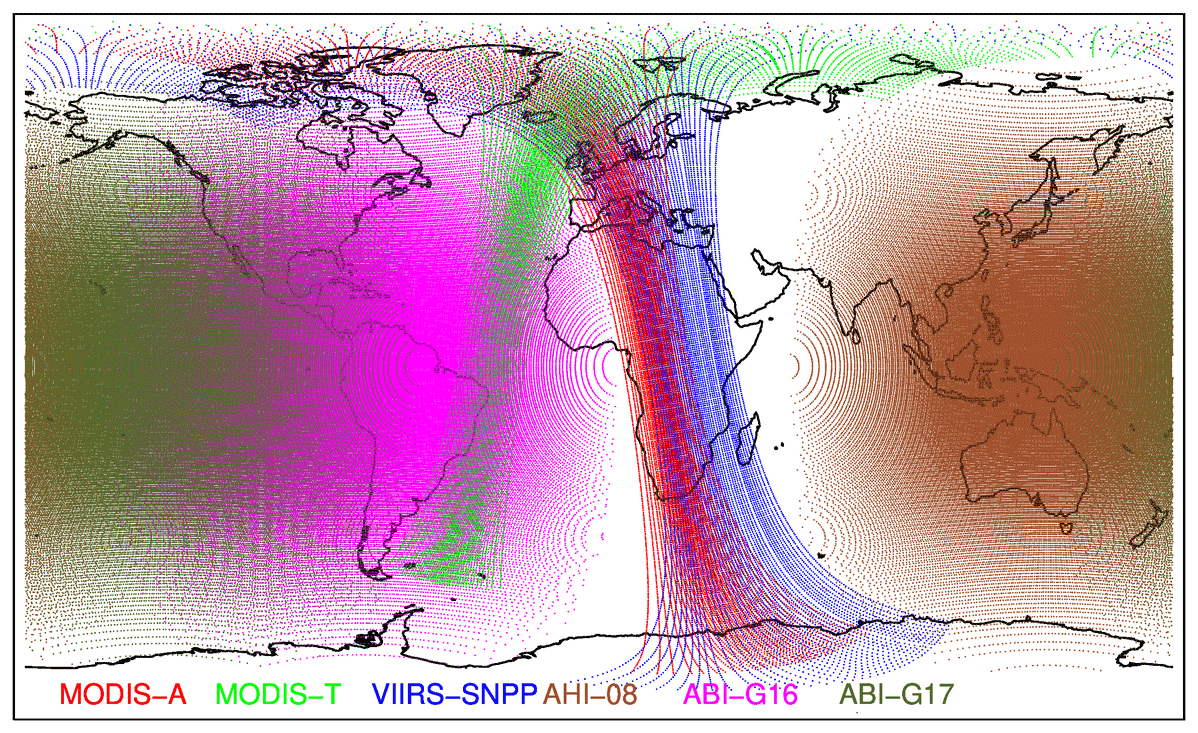
Figure 1An example of spatial coverage by six sensors used in the study using Level 2 data. The data from 7 September 2019, for varying time periods from each sensor, are plotted. The map only represents every 5th pixel from two MODIS, every 10th pixel from VIIRS, and every 3rd pixel from GEO sensors. The pixel omission is done to ensure visibility of each sensor's coverage on the map. We choose to show one orbit of LEO sensors and one full-disk image of GEO sensors. The purpose of the map is schematic to show relative spatial coverage by each sensor.
3.2 AERONET data
The Aerosol Robotics NETwork (AERONET) is NASA's global ground network of Cimel sun photometers that measure directly transmitted solar light during daylight hours (Holben et al., 1998; Giles et al., 2019). The direct-sun spectral measurements are used to derive aerosol optical depth at various wavelengths (340–1020 nm). The typical temporal resolution of AERONET is about every 15 min but varies with sun angles. Here we used Version 3.0, Level 2.0 (cloud-screened and quality-assured) AOD data. The Ångström exponent is used to interpolate AERONET AODs at 500 and 675 nm to match the satellite AODs at 550 nm. The uncertainty in AERONET AOD is of the order of 0.01–0.02. There are 387 global AERONET stations collocated with satellite retrievals. The number of AERONET stations varies with individual satellites and/or sensors due to regional vs. global coverage from LEO and GEO sensors.
3.3 Level 2 data gridding and integration
The primary goal of this study is to integrate the highest-quality AODs retrieved using the DT algorithm from six sensors on a unified high-resolution grid by using every 30 min of observations. The output is a global gridded aerosol dataset with spatiotemporal resolutions of a quarter degree (0.25°×0.25°) and 30 min. We are not trying to retrieve AODs using combined spectral radiances (Level 1 data) from six sensors. Instead we are combining already retrieved AODs (Level 2 data) from each sensor into a gridded dataset (Level 3).
The AODs from individual sensors are first gridded using the method developed for MODIS high-resolution gridded datasets (Gupta et al., 2020). In this method, we start with Level 2 satellite data files (MYD04, MOD04, etc.; Table 2) and first group them into the desired temporal resolution window (i.e., 30 min in this study; HH:00:00–HH:29:59 or HH:30:00–HH:59:59). In this way, the number of files that fall in the 30 min window will vary from three for GEO sensors to five for VIIRS and six for MODIS. The resulting 30 min files will also have different spatial coverage for LEO sensors, but the coverage will remain fixed for GEO sensors. It is important to note that the GEO sensors' aerosol dataset coverage will vary even though the field of view remains fixed because portions of the full disk will be in night and that dark portion advances diurnally. Similarly, the LEO sensors' aerosol retrieval coverage may also vary depending on whether they are observing the daytime or nighttime node of their orbits.
For a given sensor aggregated over the 30 min, we compute statistics for each of the Level 2 variables denoted in Table 1 on our global 0.25°×0.25° grid (or quarter-degree grid or QDG). The grids are identified by the latitude and longitude of the center of the grid cell. The gridding uses a box averaging method (Gupta et al., 2020) which accounts for the approximate size of the retrieval pixel (see Caveat 1 – below). The result, for each variable, includes the minimum, maximum, arithmetic average, standard deviation, and number of Level 2 pixels for each QDG. In this way, we store gridded AOD and solar and viewing angle statistics at each time stamp for any of the six sensors that have data in the 0.25°×0.25° grid square. The process is applied across the global grid. Thus, a grid square at a particular time stamp may hold competing AOD statistics from zero, one, two, three, or, in highly unlikely events, four different sensors.
For a given time stamp and grid square, AODs from available sensors are then used to derive a merged AOD. Merged AOD statistics include the simple mean (representing one or more sensors), the standard deviation, and the number of sensors available for the QDG. There are no weighting functions (see Caveat 2). Thus, the final output file from this gridding process contains gridded AOD statistics from the AODs of individual sensors plus merged AOD statistics calculated from the individual sensors for 30 min time windows globally. This way, we generate 48 files per day containing QDG global AOD datasets. Note that some variables (e.g., solar zenith angle) are relatively constant throughout the 30 min and are sensor-independent.
Caveat 1. A caveat of this simple gridding technique is related to the varying retrieval box sizes (pixels) of the different Level 2 products from the different sensors. Figure 2 shows examples of changes in pixel area as a function of satellite viewing zenith angles for MODIS (top), VIIRS (middle), and ABIs and AHI (bottom). The pixel area is calculated while considering Earth's sphericity and for the data presented in Fig. 1. The actual change in the pixel area from nadir to the edge of the swath will vary as a function of latitude. As demonstrated in the figure, the pixel growth rate for GEO sensors (ABI and AHI) is much higher (by a factor of 2–20) than for LEO sensors (by a factor of 2–5). It is important to note that VIIRS has onboard pixel aggregation (Gladkova et al., 2016), which mitigates pixel growth at the edge of the scan so that VIIRS pixels grow less than MODIS pixels at higher viewing angles. The consequence to the mitigation is the odd plot for VIIRS in Fig. 2, where three distinct regions are seen across the VIIRS swath, each following a different growth rate. MODIS and all GEO sensors do not have onboard aggregation to correct for bow-tie distortion (Sayer et al., 2015). Therefore, we are dealing with varying pixel sizes for each sensor with the added complexity of bow-tie distortion affecting each sensor differently. For this reason, a simple box averaging gridding process in which all the pixels with center latitude–longitude falling within the grid box are averaged can create artificial data gaps in the gridded data product compared to Level 2 swath data. Therefore, we use a spatial filling method (Gupta et al., 2020) by calculating pixel size as a function of viewing angle and filling all the empty grids within the satellite's original pixel with the same value. This additional step brings the spatial coverage of gridded data to that of Level 2 datasets.
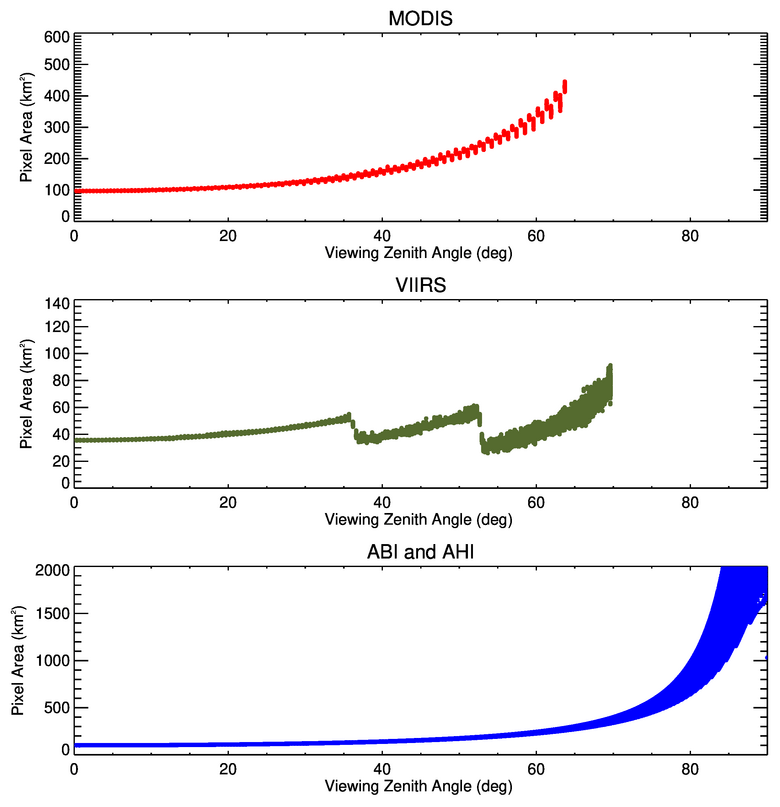
Figure 2Pixel area (km2) of Level 2 data as a function of sensor viewing geometry for all six sensors. The corresponding maps (Fig. 1) show the locations of the individual swath. The actual pixel area for LEO and GEO sensors is expected to vary in different parts of the world as a function of latitude. The figure uses the same data as visualized in Fig. 1.
Caveat 2. A second caveat is that in this implementation, there is no optimized weighting – in that there is no preference for using gridded AOD retrieved from one sensor over another. Whether there is one sensor, two, three, or more observing within a 0.25° grid or a 30 m time window, all individual sensor AODs are given the same weighting in the merge. A future version of this aggregation may include weights, with the weighting function based on validation (compared to AERONET), expected error based on uncertainty analysis, and/or another to-be-determined function.
The gridded AODs from six sensors plus the merged AODs are processed and stored in 30 min global files following the method described in Sect. 2. Figure 3 demonstrates an example of spatial coverage by each sensor and merged AOD for 30 min gridded AOD data for 26 March 2020 at 23:45 UTC (23:00–23:59 UTC). The top row shows three AOD maps for three GEO sensors, whereas the bottom row is for three LEO sensors. The light gray color on the map shows nighttime (SZA>90) during the time of observation. The GEO sensors provide full-disk coverage every 10 min; thus, the 30 min AOD maps show an average of the three 10 min full-disk AOD retrievals. The circular data gap over the ocean is due to sun glint restriction (40° from specular angle) on AOD retrievals. The 30 min coverage from LEO sensors (Fig. 3, bottom row) covers only about of a satellite orbit, and the vertical data gaps in the middle of the satellite swath (orbit) are due to sun glint restrictions. The middle panel shows the merged AODs from all the sensors. The merged AOD maps clearly show that the AOD retrieved from six sensors is smoothly fused, and qualitatively there is no visible discontinuity in the spatial pattern from one sensor to another. The big circular holes in individual GEO sensors from sun glint are partially filled with another GEO sensor or an LEO sensor. Similarly, the glint shields in individual LEO sensors are also partially filled in by other sensors. In this example, none of the individual sensors provide complete AOD coverage of the daylight portion of the Earth, but the fused dataset attempts to achieve that target limited by cloud and/or snow cover. The central map clearly demonstrates the first goal of this dataset of providing aerosol observations for nearly complete coverage of the daylight portion of the Earth. We will further evaluate the observed differences in AODs among sensors and with AERONET below.
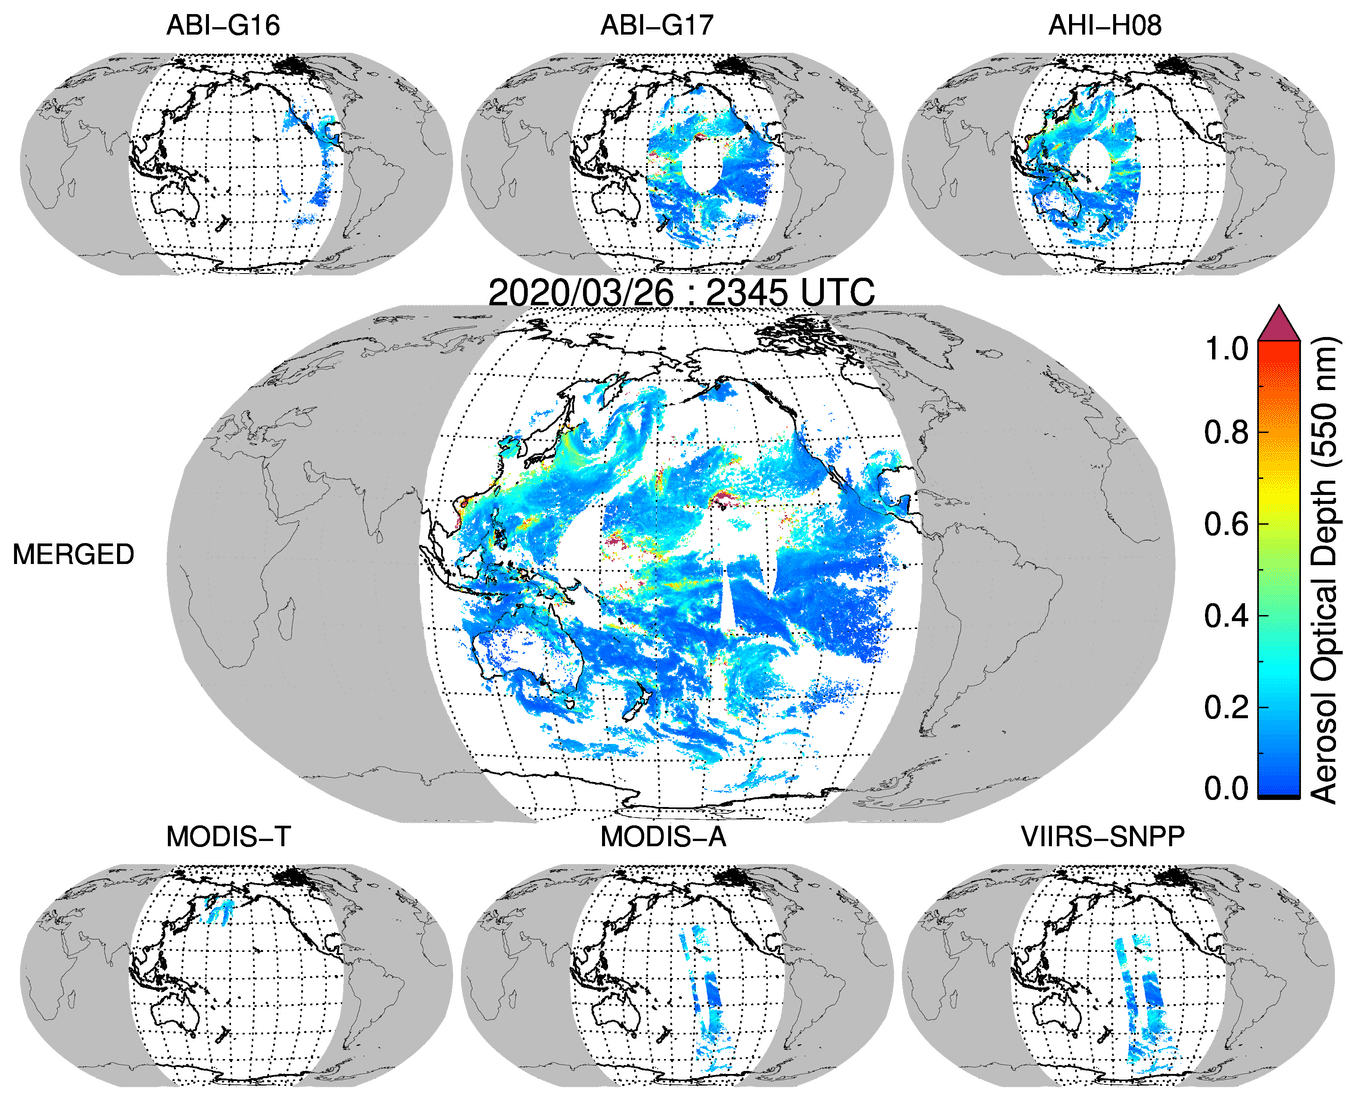
Figure 3Example of 30 min aerosol optical depth data coverage by each sensor and merged datasets on 26 March 2020 at 23:45 UTC.
We process 1 year of data products into a gridded dataset and then use this dataset for further analysis, including inter-satellite comparisons, validation against AERONET, spatiotemporal data availability, LEO–GEO comparisons, and evaluation of the diurnal cycle at the regional and global scale.
4.1 Inter-sensor and satellite comparisons
We use the 1-year, half-hourly (HH), 0.25°×0.25° quarter-degree (QD), gridded global data from three LEO and three GEO sensors to first intercompare the AODs from the individual sensors with each other. Figure 4 presents the density scatter plots comparing AODs from LEO and GEO sensors. The top row corresponds to AOD comparisons from MODIS-T with three GEOs. Similarly, the middle row is for MODIS-A, and the bottom row is for VIIRS-SNPP. We have selected AOD data for the first day of each month to manage the data volume for these intercomparisons. Based on a small sample of comparisons with sun photometers across different sensors, AOD uncertainty for the DT algorithm (applied to MODIS) varies for land (±0.05 ± 15 %AOD) and ocean (±0.03 ± 10 %AOD), although actual numbers can vary by sensor due to differences in sensor characteristics and calibrations (Levy et al., 2010; Gupta et al., 2018, 2019). In Fig. 4 we draw dotted lines to represent the uncertainty envelope, which may best represent land retrievals while being generous to ocean retrievals. It is important to note that the aerosol regimes observed by the three GEOs are different. The ABIs cover the western hemisphere with relatively moderate AOD values (∼ 0.1 to 0.5), whereas AHI covers Asia with high AODs (0.5 to 1.0). Meanwhile, ABI-G16 covers the generally wetter and darker eastern North and South America, while ABI-G17 covers mostly ocean and the drier and brighter western North America. The significant differences in surface type within any regional boundaries will affect the accuracy of the retrievals.
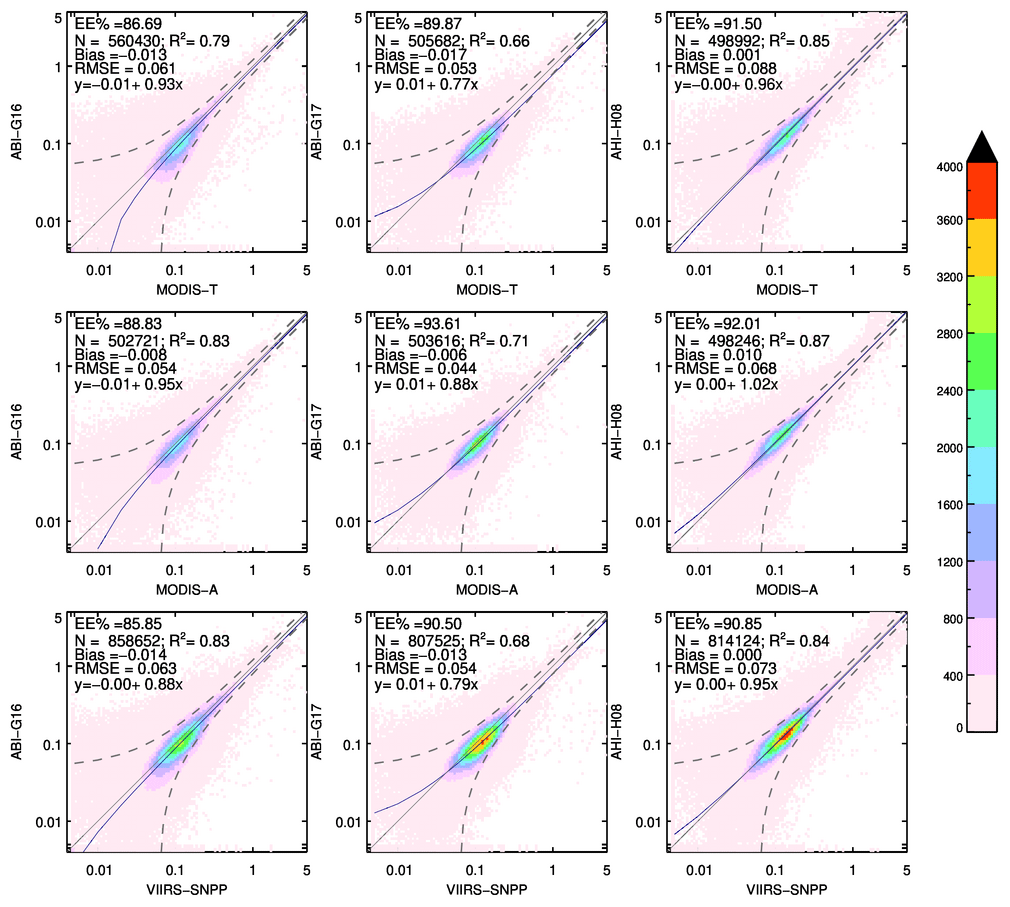
Figure 4The intercomparison of AOD (550 nm) from three LEO and three GEO sensors. The QD gridded AOD data from LEO and GEO sensors for 1 d of each month of the year are selected and used to intercompare coincident LEO and GEO AOD retrievals.
Another way to compare sensor AOD is to look at regional mean values. If we consider each GEO-defined disk as a region, we can compare the mean AOD reported in the GEO-defined region for each individual sensor. The regional mean technique combines differences resulting from collocated retrievals (captured in Fig. 4) and differences due to sampling by each individual sensor. For plotting purposes we normalize the AODs of each individual sensor in each grid box by the values of the merged AOD in that grid box and then calculate the daily regional mean normalized AOD within the GEO region. Figure 5 shows the time series of daily, regional, mean AOD normalized by the merged AODs for each GEO region. The normalized values closest to 1 indicate the primary contribution to merged regional mean AOD. Figure 5 shows that the GEO sensors in their respective region are the primary contributors to the merged AOD regional mean and datasets. The LEO sensors' deviation from the value of 1 is primarily due to the relatively poor spatial–temporal sampling of the these sensors within the specific GEO region. Note that only LEO sensors are plotted in Fig. 5 for simplicity, although some overlap between GEO sensors exists. For the regional mean, MODIS-T is consistently higher than MODIS-A, with VIIRS-SNP in between. The differences among MODIS-T, MODIS-A, and VIIRS-SNP are consistent with previous studies (Levy et al., 2018; Lyapustin et al., 2023; Schutgens et al., 2020; Sogacheva et al., 2020); they represent retrieval differences, mainly due to calibration that would be found in collocated comparisons, and are not primarily due to sampling.
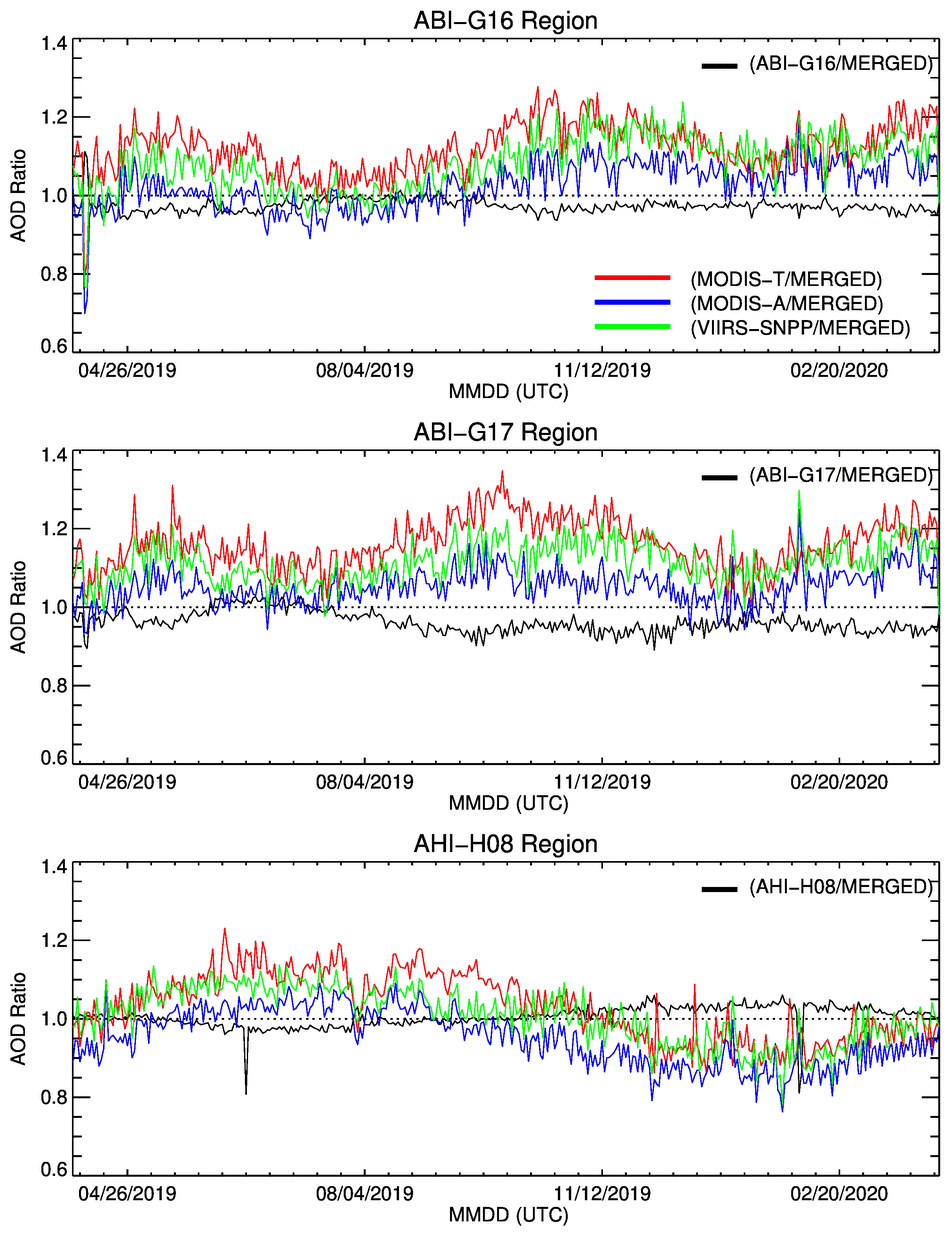
Figure 5The ratio of regional daily mean AOD for each sensor and coincident merged AODs. The three panels show data time series from three GEO regions. The black line is the ratio of GEO AODs to merged AODs, whereas red, blue, and green represent the ratio of MODIS-T, MODIS-A, and VIIRS-SNPP to merged AODs, respectively.
4.2 Spatial and temporal coverage
Figure 6 shows spatial coverage of the merged AOD product for each 30 min gridded data file for a single UTC day, 26 March 2020 (Julian day 86). The individual map shows the daylight portion of the Earth for a given UTC time with color-coded available AOD values mapped. In parts of the world with GEO sensors (Americas, East Asia), aerosol observations are available throughout the day under the cloud-free sky. The AOD data the from LEO sensors fill in some data gaps in these regions. The regions, including Africa, Europe, and part of Asia, have limited coverage provided by the LEO sensors alone. The high values of AOD over the Indian Ocean and Pacific are mainly due to pollution and smoke outflow from the continent. Southeast Asia also shows very high AODs associated with the active fire season.
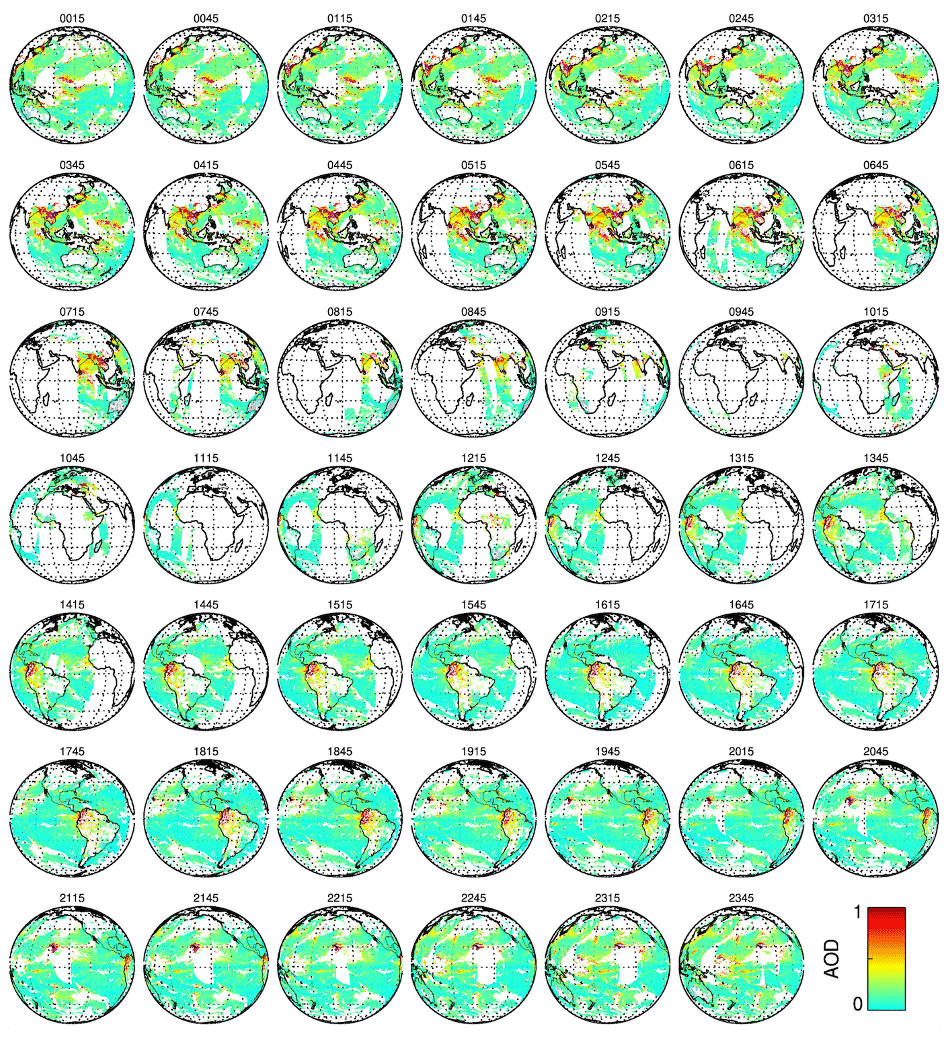
Figure 6Example of 30 min coverage of merged aerosol data for 1 entire day (26 March 2020, UTC). Each panel shows the daylight portion of Earth at a specific time (UTC) and available AOD retrieval from the six-sensor merged product.
These 30 min files are then aggregated to calculate daily mean AODs for each grid and saved as a daily (UTC day) global file. Daily means are simple averages of all available 30 min AODs for a given grid cell for a given day, and no additional data filtering is applied. In addition to the average AOD value, other statistics include the number of 30 min AOD values for the day, standard deviation, median, minimum, and maximum for each grid. The statistics can help further quality-control the data suitable to address specific research and/or application needs. Figure 7 shows an example of daily global coverage for 26 March 2020 from six individual sensors and merged datasets. Like 30 min data, daily AODs from GEO sensors have more complete regional coverage due to high measurement frequency. However, LEO provides global coverage with data gaps due to less frequent (one to a few depending on latitude) measurements; additional data gaps come from clouds, snow or ice surfaces, very bright surfaces, sun glint over the ocean, and other DT retrieval limitations. The merged map (Fig. 7) shows the daily mean AOD values for the global region with significant improvements in spatial coverage compared to any individual sensor.
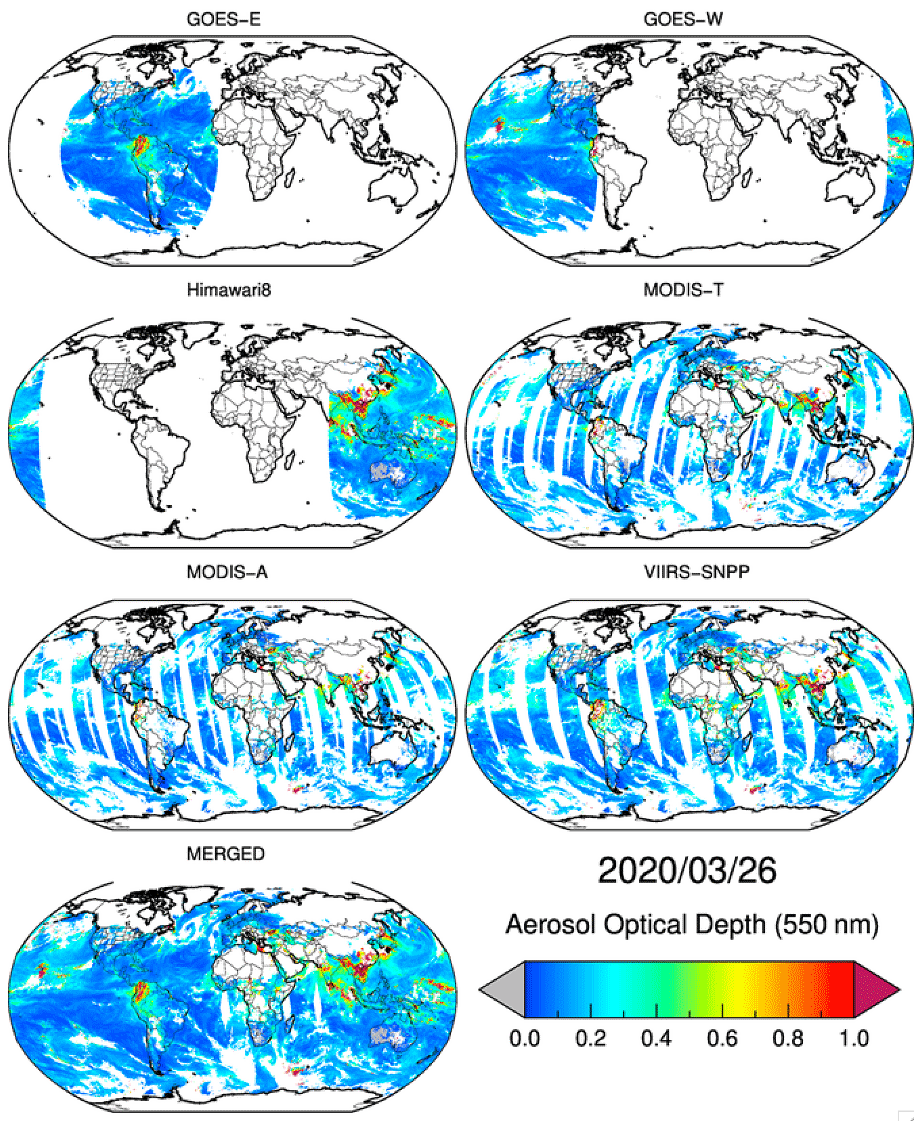
Figure 7Daily average aerosol optical depth (550 nm) on 26 March 2020, retrieved by six LEO and GEO sensors, as well as the merged quarter-degree product. The daily averages (daytime) are calculated using 48 of the 30 min quarter-degree gridded files.
We further quantify the spatiotemporal AOD data availability in the merged datasets and compare them with individual sensors. Figure 8 (top panel) shows a map of the average number of hours (per day) for which merged AOD data are available during the 1-year study period. The average hours are calculated for each quarter-degree grid cell using merged datasets. The map is clearly divided into low-temporal-coverage areas observed only by LEO sensors (i.e., Africa and Europe) and high-temporal-coverage areas observed by both LEO and GEO sensors (i.e., Americas, Asia). For regions only covered by LEO sensors, AOD datasets are available only between 1 and 3 h d−1. The areas with GEO sensor coverage have 5.6 ± 0.25, 5.6 ± 0.23, and 5.0 ± 0.28 average (±1 standard deviation) hours per day for ABI-G16, ABI-G17, and AHI-H08, respectively. Data availability is highest for regions of GEO sensor overlap (i.e., part of the Atlantic Ocean, western USA, and the Pacific Ocean). The regional variability in AOD data availability also depends on cloud and/or snow cover, length of daylight hours, and DT AOD retrieval limitations. For example, the white areas over the Saharan desert and Greenland are due to the DT algorithm not retrieving AODs over highly reflective surfaces (for any sensor). Another region with low data availability is around the Intertropical Convergence Zone (ITCZ), where there is consistent cloud cover throughout the year.
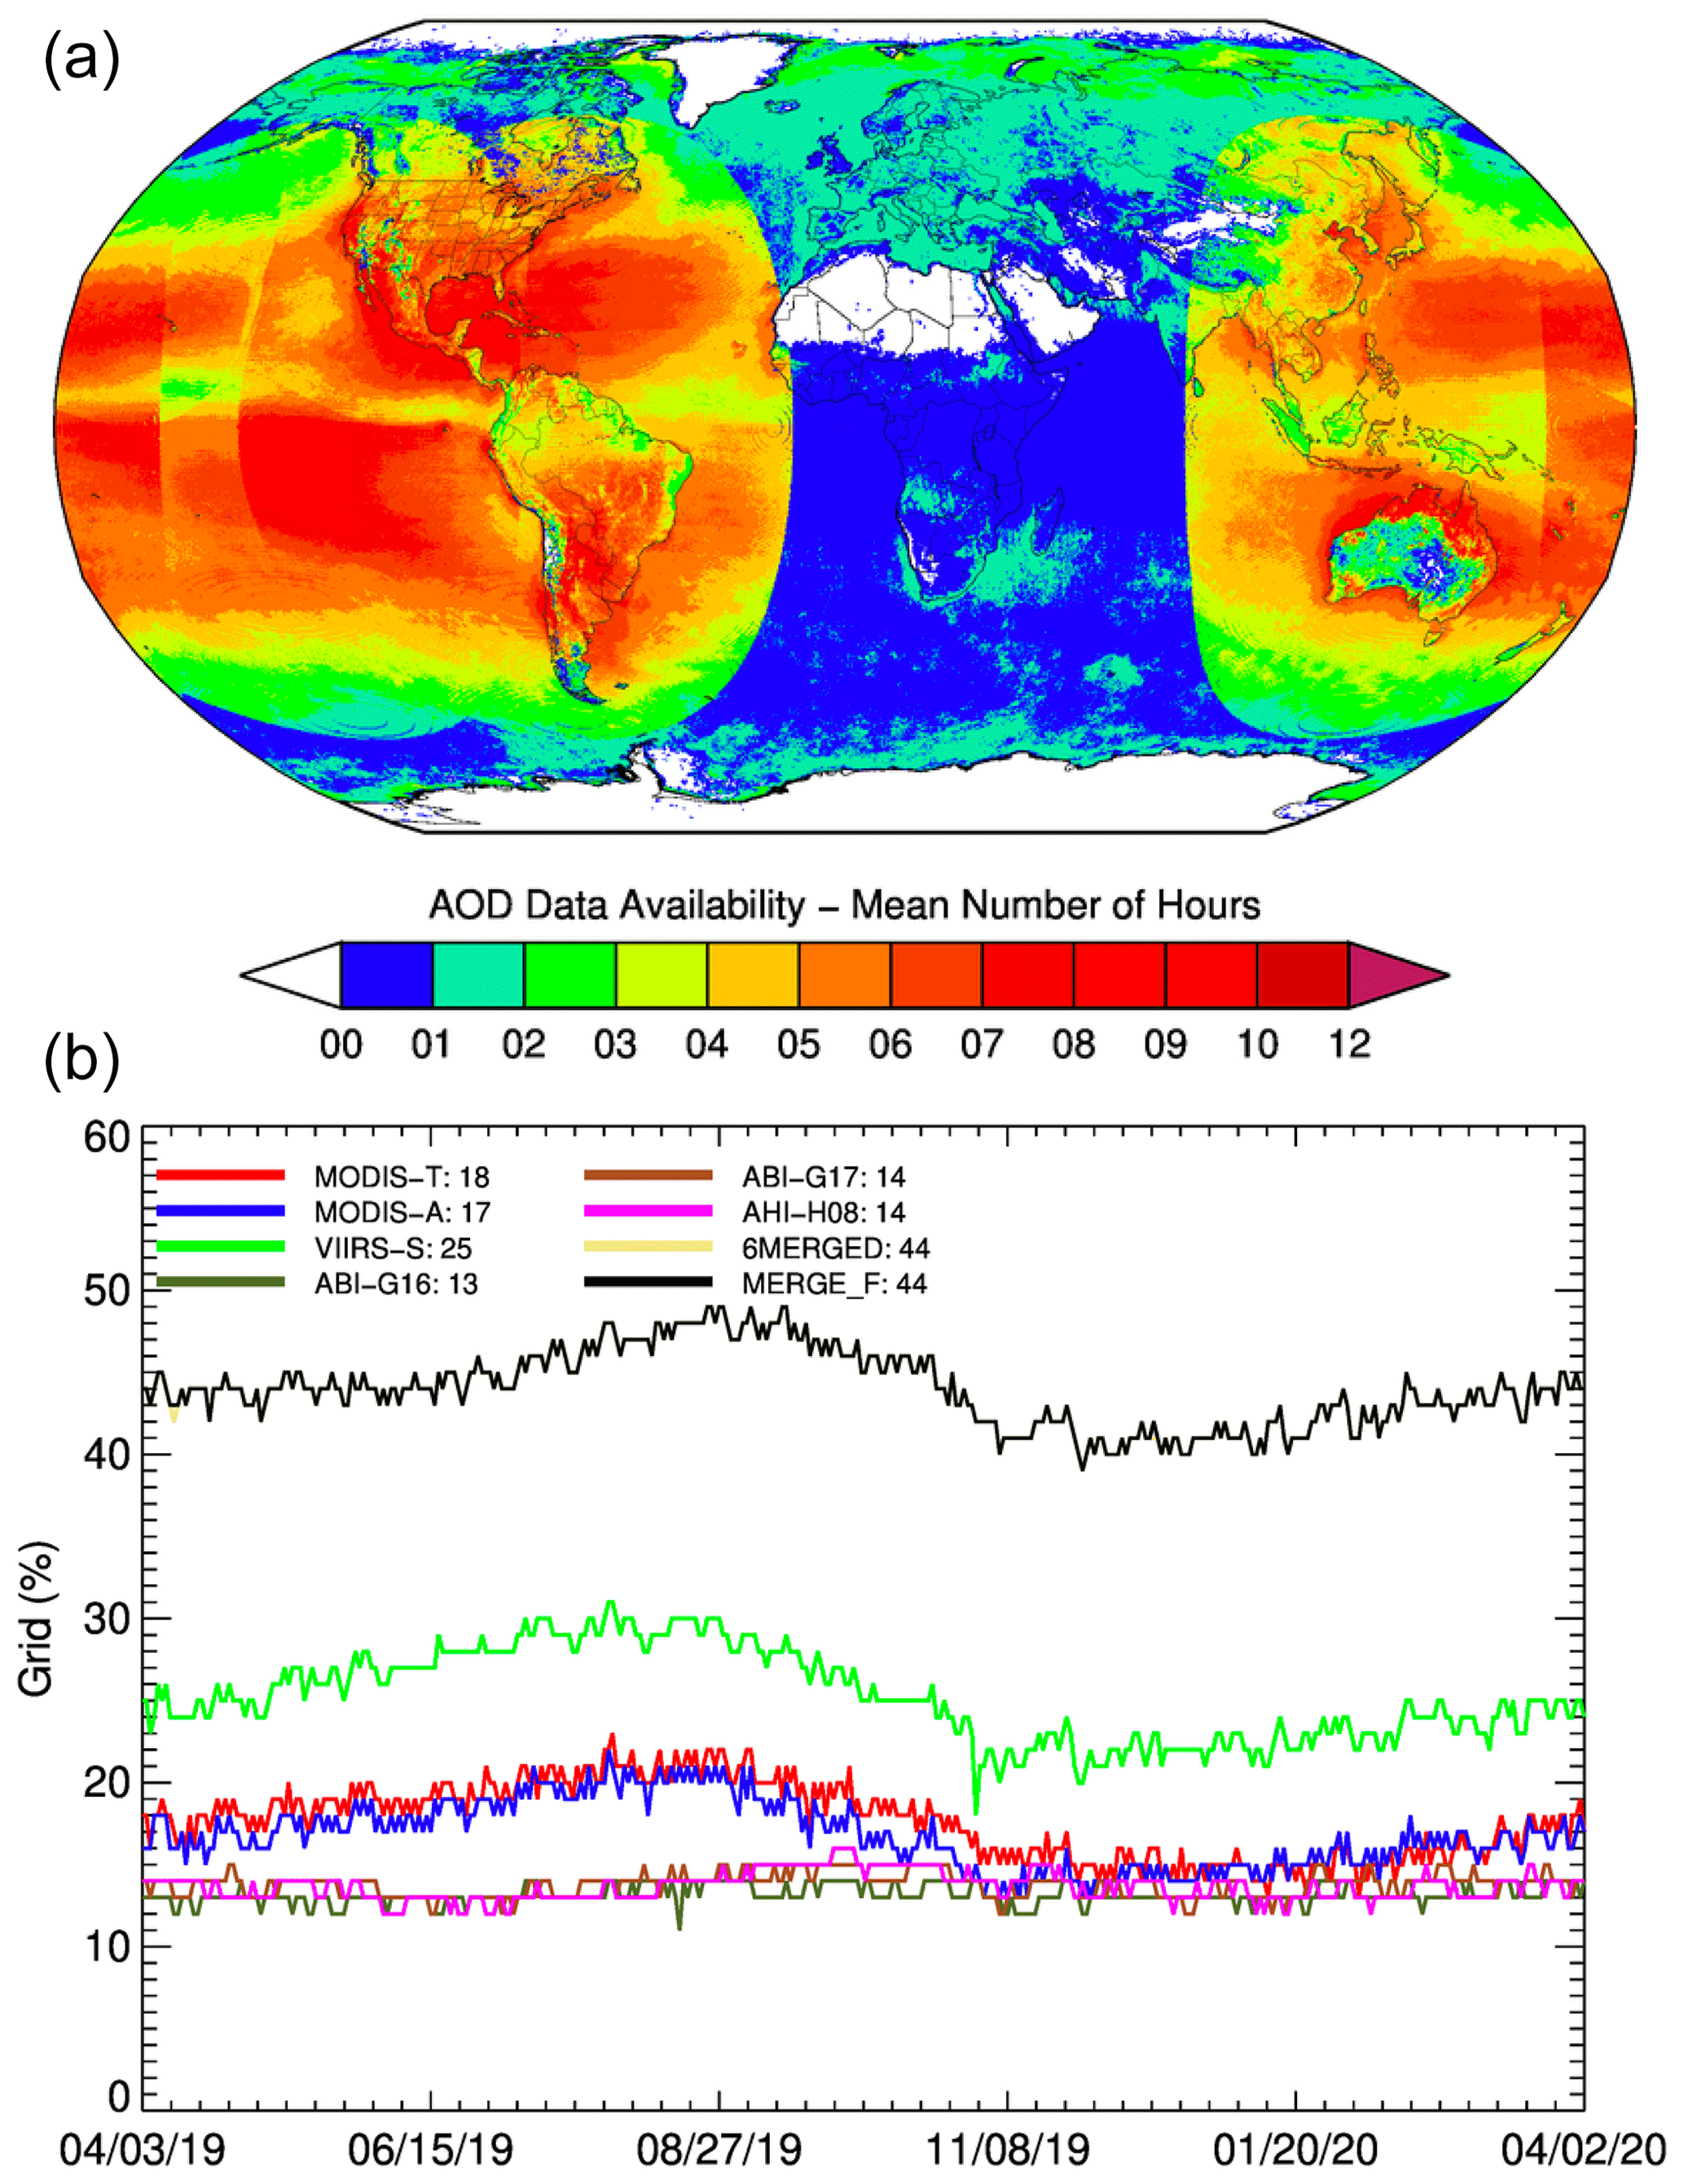
Figure 8Spatial and temporal AOD data availability for April 2019 to March 2020 using merged datasets. The top map (a) is the mean number of hours in a year for each grid. Panel (b) is the number of quarter-degree grids (%) where daily average AOD data are available from six sensors and in the merged dataset.
Figure 8 (bottom panel) shows the day-to-day variability of the available number of grids (%) for daily mean AOD datasets for six sensors and the merged product. The percentage of grids (y axis) is calculated for each day and each sensor by dividing available grids with valid AOD data by the total possible quarter-degree grids covering the entire globe. The numbers next to sensor names in the figure legend are mean percentage grids for which AOD data are available on any given day. The GEO sensors (i.e., ABIs, AHI) provide about 13 %–14 % daily spatial coverage at quarter-degree resolution as their observations are limited to a specific region. These numbers are about 17 %–18 % for two MODIS sensors and 25 % for VIIRS-SNPP due to its larger swath width and higher spatial resolution compared to MODIS. The advantage of merging six LEO and GEO sensors for the global AOD dataset is evident in the percentage (44 %) for the merged AOD dataset. Thus, it is safe to say that combining AODs from six sensors at quarter-degree resolution can provide AOD datasets covering half of the globe, which is otherwise restricted to one-fourth or less from any individual sensor. Another interesting trend in the data availability is the seasonal cycle; in general, LEO sensors show peak coverage in the northern summer months (July–August) when the broad northern land mass is snow-free, whereas GEO sensors provide almost the same spatial coverage with very little month-to-month variability as they are more tropically biased and are mostly missing the Eurasian land mass. The merged AOD dataset's daily coverage varies between 40 % and 50 %, with a minimum in December and a maximum in August.
The daily mean AODs for individual sensors and merged products are then averaged over a month to calculate monthly AOD statistics for each quarter-degree grid cell. Figure 9 shows an example of monthly mean AOD maps for March 2020 for each sensor and merged product. The maps from each GEO sensor show their respective regional coverage, and the LEO sensor provides global coverage. The six sensors and merged products qualitatively represent the spatial distribution of aerosols consistently on a monthly scale. The merged product does have some discontinuities in transition regions. For example, AHI coverage is limited to half of India, and a clear line is visible in AOD maps separating AHI AODs from those obtained by merging AODs from LEO sensors. A similar arc is visible over the Atlantic Ocean, showing boundaries of ABI-G16 coverage. These sensor transition regions have differences in AODs and may need further quantification if research and applications using merged AOD datasets are very sensitive to minor errors. The transition and overlap areas among GEO sensors are not apparent in monthly maps, and spatial distributions are homogeneous across sensors.
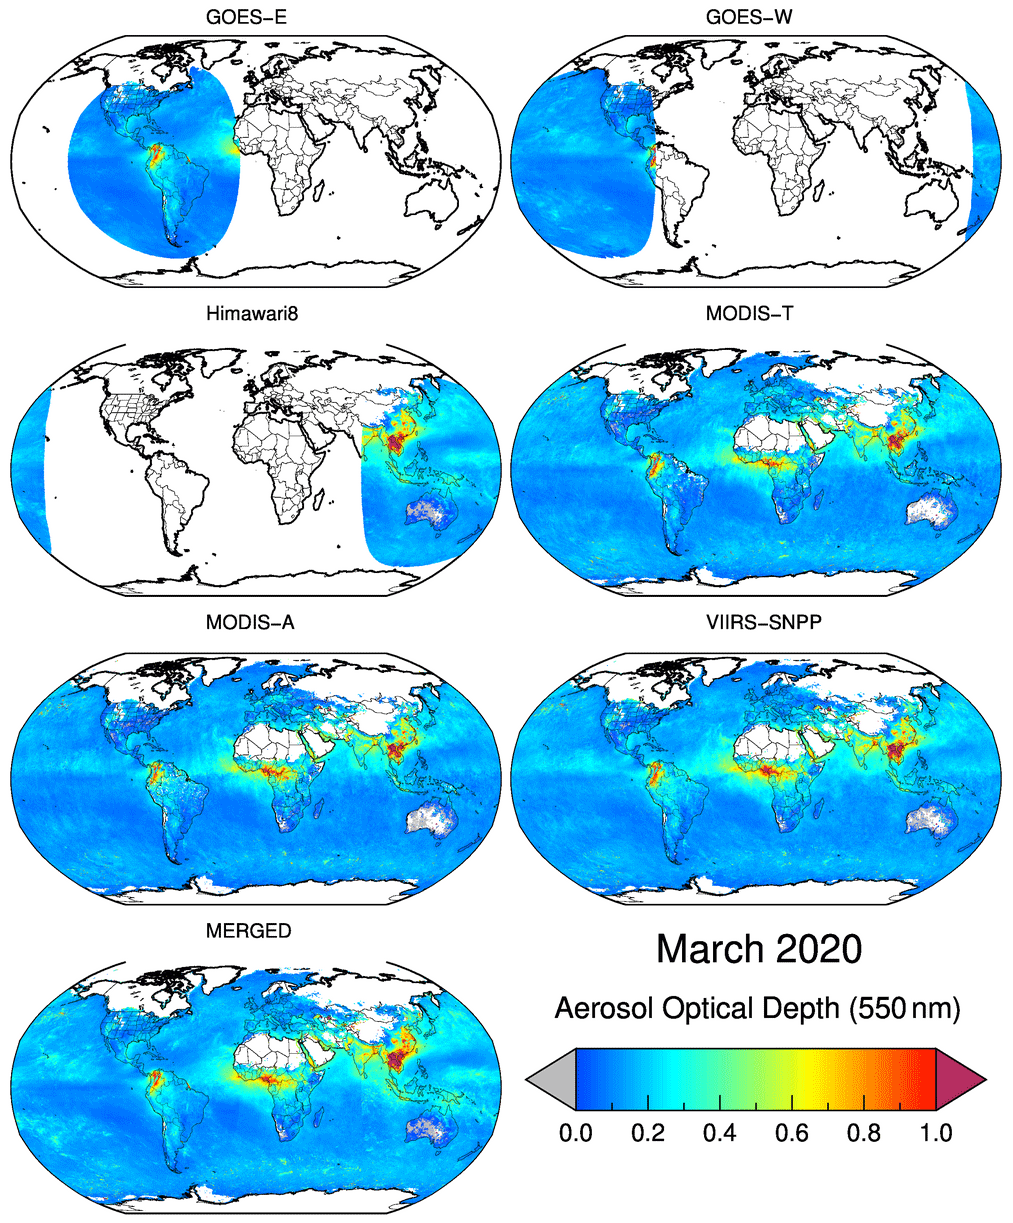
Figure 9Monthly average aerosol optical depth (550 nm) for March 2020, retrieved by six LEO and GEO sensors, as well as the merged quarter-degree product. The monthly averages (daytime) are calculated using daily average AOD values (shown in Fig. 7) from quarter-degree gridded files.
4.3 Validation against AERONET
The quarter-degree gridded AOD data from all six sensors and merged products are compared against measurements from AERONET. The spatiotemporal collocation of satellite AODs with AERONET over global locations is performed using standard validation practices (Ichoku et al., 2002; Gupta et al., 2018; Wei et al., 2020). We followed the method detailed by Gupta et al. (2020). In brief, we locate the 0.25° grid box that contains the AERONET station and match the satellite-derived AOD for that grid box to the temporal average of all AERONET-measured AOD within ±15 min of satellite overpass time. This is done for each diurnal time step in the satellite database. Thus, we are matching one gridded satellite AOD to the average of one, two, or three AERONET measurements time step by time step. The collocated data are then used to perform intercomparison analysis.
Figure 10 shows the intercomparison of satellite and AERONET AOD for the 1-year period over global locations, and Table 3 gives the standard statistical parameters such as correlation coefficient (r), root mean square error (RMSE), mean bias (Bias), slope, intercept, and DT error envelope (). In Fig. 10, the top three density scatter plots are for LEO sensors, the bottom three are for GEO, and the central one is for the merged product. Table 3 shows that the AODs from three LEO sensors each have a high correlation with AERONET (R = 0.83–0.88), whereas AODs from the GEO sensors have lower correlation (R = 0.66–0.82). For G17 the correlation is notably low (R = 0.655), but the correlation there is strongly influenced by a few outliers with high AOD. The DT algorithm has a multi-decadal history with the LEO sensors, allowing for the optimizing of the algorithm for LEO conditions. Applying the DT algorithm to the GEO sensors is still a work in progress, as the algorithm is facing the double challenge of previously unexplored retrieval geometry (Kim et al., 2024) and bootstrapped calibration updates with no reprocessing to date. Thus, the AOD retrieved from the LEO instruments more accurately represents AERONET values than the GEO products. For the LEO sensors, MODIS-A and MODIS-T have similar RMSE, regression slope, and EE%, but with an additional 0.01 bias for MODIS-T as expected (Levy et al., 2018). Also, as expected VIIRS-SNPP shows a larger bias with slightly increased RMSE and reduced EE% (Sawyer et al., 2020). The LEO sensor's validation statistics are consistent with those performed using Level 2 aerosol products (Sawyer et al., 2020; Wei et al., 2020; Levy et al., 2018; Gupta et al., 2020). Among GEO sensors, AHI has the largest mean bias (0.085) and RMSE (0.239), with the lowest EE value of 56.03 %. The overestimation by AHI is also clearly visible in the density scatter plot. The results for AHI are consistent with our earlier study (Gupta et al., 2019), where we used 2 months (May–June 2016) of AHI data during the KORUS-AQ field campaign to validate AHI AODs with AERONET. In Gupta et al. (2019), we reported the mean bias (0.09), RMSE (0.20), EE% (55 %), and R (0.84) for AHI. The MODIS validation during the same period in the region with AHI coverage also demonstrates similar validation statistics (Gupta et al., 2019). The current DT algorithm faces challenges in the Asian region due to complex and varying surfaces, as well as highly varying aerosol chemical composition. The point is that validation for GEO sensors combines sensor- and regional-specific uncertainties in the DT algorithm.
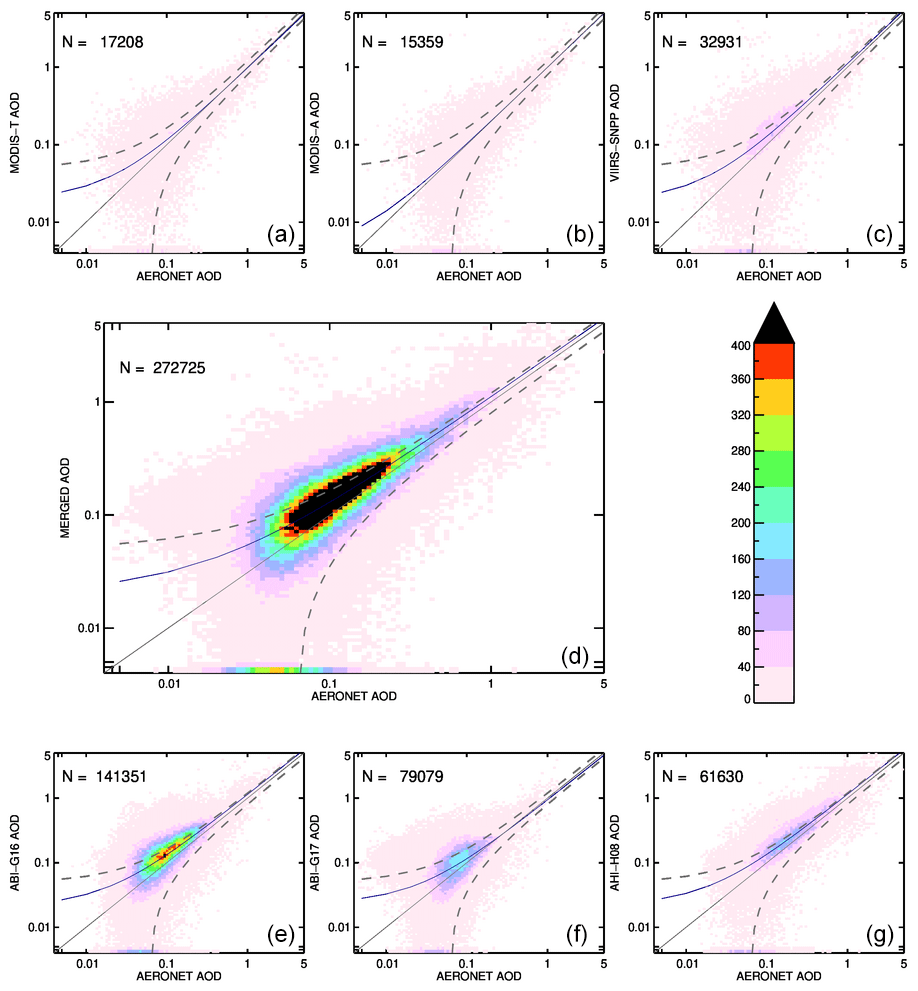
Figure 10Validation of quarter-degree grid (QDG) AODs from six sensors and merged datasets with AERONET measurements across the globe. The spatial match is done by picking the nearest QDG to the AERONET location, and AERONET AODs are temporally averaged for ±15 min around the satellite time. (a–c) MODIS-T, MODIS-A, and VIIRS-SNPP. (d) Merged product. (e–g) ABI-G16, ABI-G17, and AHI-H08.
Table 3Summary statistics of satellite–AERONET comparison for the global region.
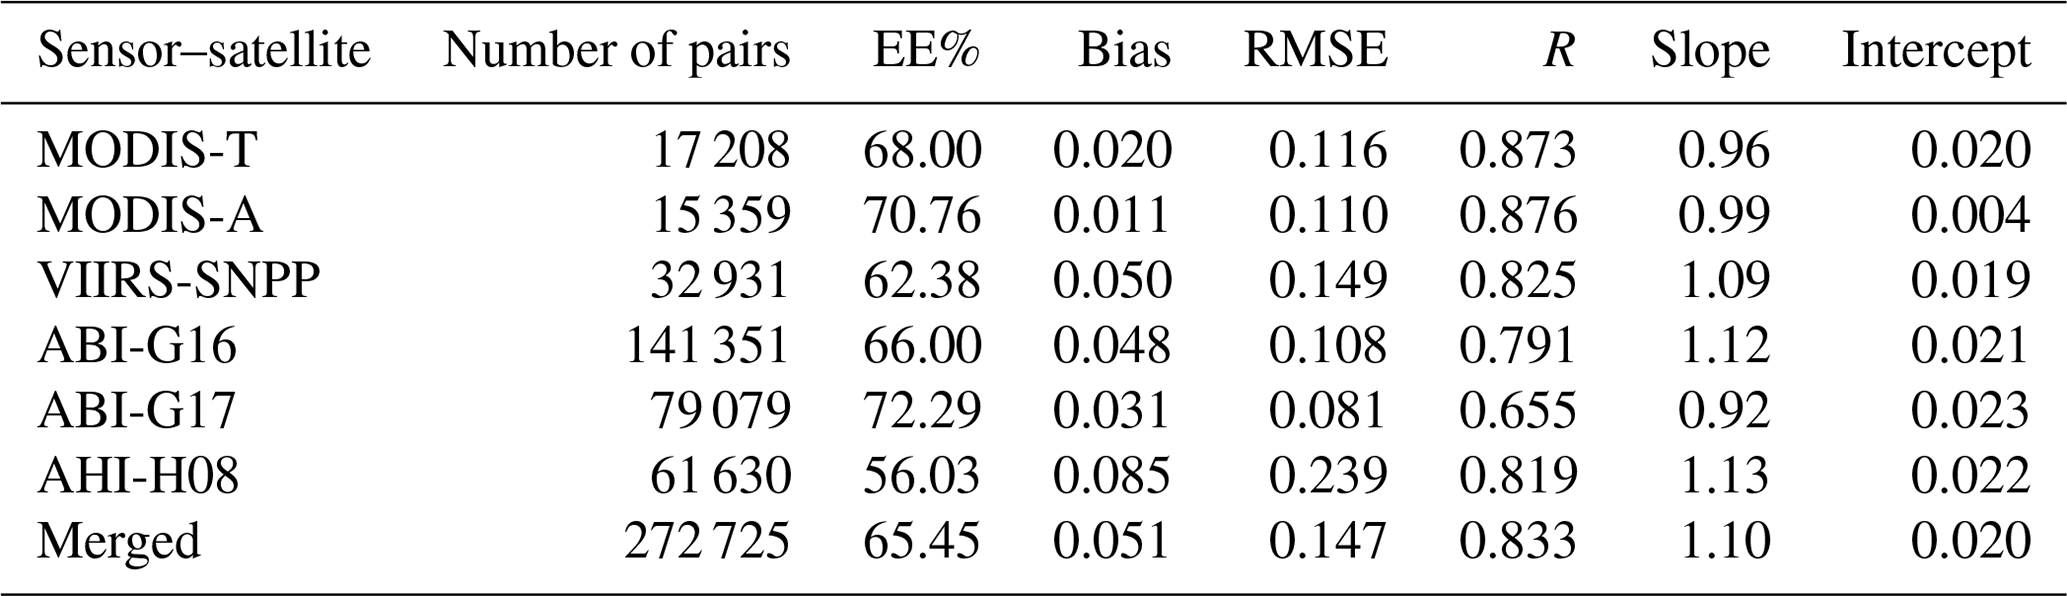
Because the merged product is dominated by the GEO retrievals (Fig. 5) and GEO retrievals represent 75 % of the AERONET collocations, we expect validation statistics to resemble those of the GEO instruments, especially ABI-G16 that by itself contributes more than 50 % of the collocations. The merged AOD has a correlation (r) of 0.83, mean positive bias of 0.051 with a slope value of 1.1, and an EE value of 65.45 %, mainly driven by the GEO retrievals.
Figure 11 presents the spatial distribution of the correlation coefficient (panel a), EE% (panel c), mean bias (panel b), and RMSE (panel d) calculated from the merged–AERONET collocation datasets at individual AERONET stations. The regional distribution of validation results can be critical for local and region-specific data applications. It is also important to note that atmospheric aerosols, including their types and sources, are highly variable in space and time. In addition, DT AODs have shown variability in uncertainties in different parts of the world due to changes in surface reflectance, topography, and varying aerosol properties. The correlation varies between 0.33 and 0.98, with 60 % of stations showing a value greater than 0.8. Only about 5 % of stations have a correlation value of 0.5 or smaller (black dots in Fig. 11a). The low value of correlation is typically visible in the western US, parts of South America, and some isolated stations in Asia. These results are consistent with previous validation studies (Levy et al., 2018; Wei et al., 2020; Gupta et al., 2019; Sawyer et al., 2020). There is a string of stations that begin in the Indo-Gangetic Plain and extend southeastward to Southeast Asia. These stations show overall poor validation statistics, which drive the poor performance of AHI in Table 2. In general, the EE% is greater than 80 % for 29 % of stations, and 58 % of stations have a value greater than 67 %.
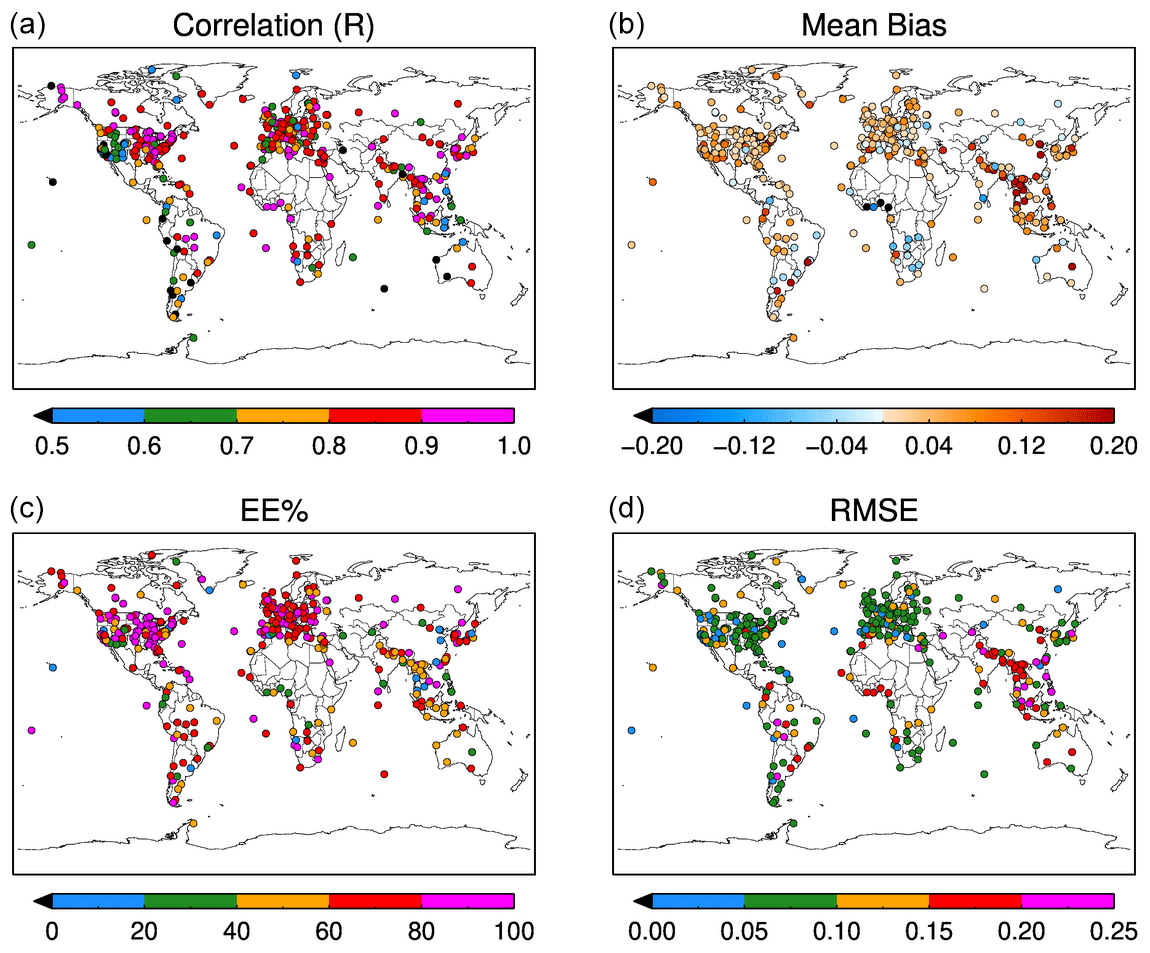
Figure 11Summary statistics of satellite–AERONET comparison for individual stations across the globe. The panels show the correlation coefficient (a), mean bias (b), (c) EE%, and (d) RMSE.
Figure 12 shows the global and seasonal mean diurnal cycle of AODs from AERONET and the merged product. The collocated datasets were used for diurnal cycle analysis. AODs from all the AERONET stations for each hour (in local solar time or LST) and for the season are averaged to generate these plots. We choose to use LST instead of UTC time to understand the patterns in AODs from morning to evening hours globally while keeping solar geometry similar. The AERONET AOD patterns are very similar in all seasons, with the peak around local noon and lower values in the morning and evening hours. These patterns in AERONET AODs are more prominent in northern hemispheric spring (AMJ) and summer (JAS), where the magnitude of the diurnal signature increases by 50 % and 15 %, respectively, from morning to midday. The AERONET diurnal AOD signatures are flatter in fall (OND) and winter (JFM). In all four seasons, merged AODs show positive bias against AERONET AODs, as expected from the scatter plots in Fig. 10. However, despite the bias, the merged satellite AODs follow the AERONET diurnal trend throughout the day except during early morning and late afternoon hours. The mismatch during those hours can be related to sampling inconsistency depending on AERONET station locations. It is important to note that the number of AOD samples used to get the mean AOD for each 30 min interval varies significantly (secondary y axis). The sampling is highest around local noon and significantly lower at the beginning and end of the day. Thus, we calculate the mean bias for each season while considering hours with only significant sampling (at least 1000 pairs; white dotted points in Fig. 12). The mean bias varies between 0.03 and 0.06, with the highest value in spring (AMJ) and summer (JAS) and the lowest in fall and winter.
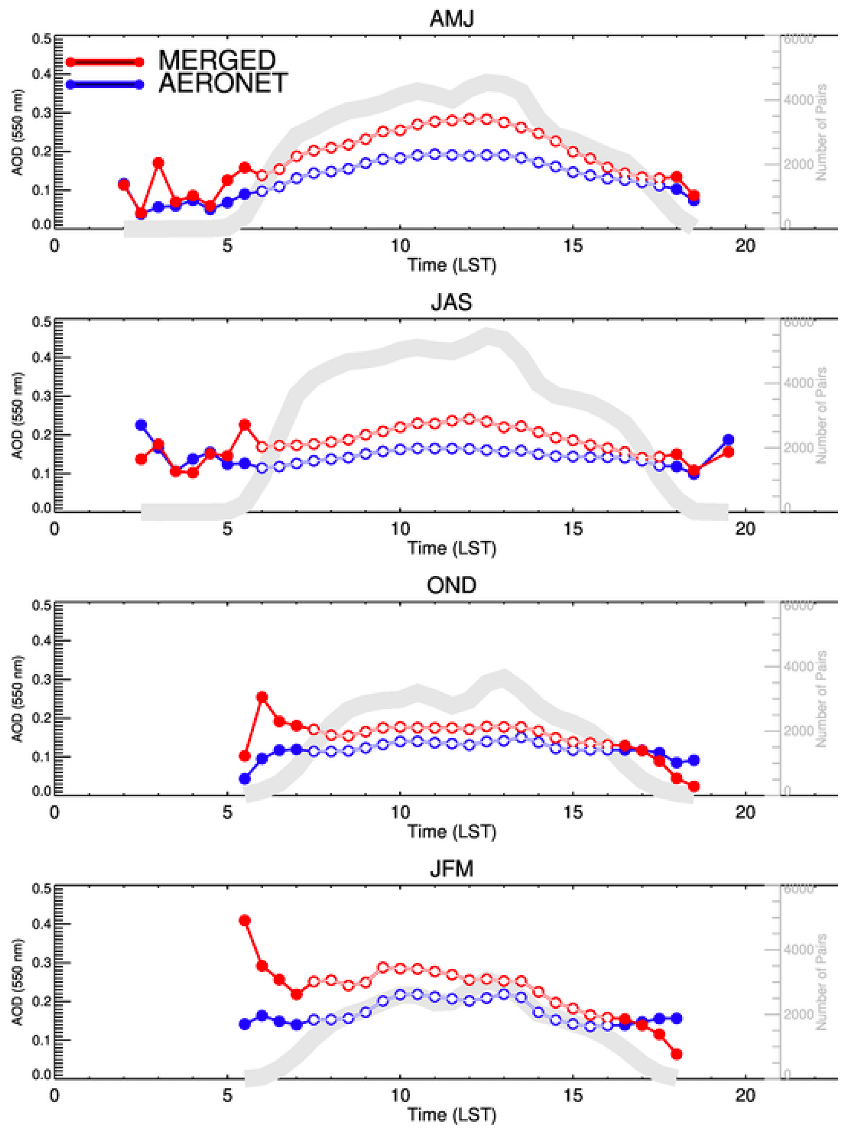
Figure 12Global diurnal cycle in local solar time as a function of season. The open circle shows hours with a minimum of 1000 samples to average. The number of samples used to get the average for every 30 min of data is shown on the secondary y axis. The solid circles in the morning and evening hours represent lower sampling and demonstrate more variability. Each panel represents seasons. AMJ: April–May–June, JAS: July–August–September, OND: October–Number–December, JFM: January–February–March. These are a bit different than most meteorological seasonal definitions.
The new merged data not only allow examination of global mean diurnal patterns but also provide an opportunity to analyze diurnal cycles at specific locations and regions. Therefore, we have included selected examples of diurnal cycles from individual AERONET stations. Figure 13 shows data from the Cape Fuguei AERONET station in Taiwan. The site is located on a peninsula so that the DT AODs in this QDB are dominated by over-ocean retrievals. This example illustrates a case where the merged and AERONET AODs exhibit excellent correlation, with significant trends observed in three out of four seasons. Note the differing AOD scales in each panel, which highlight the diurnal variability across seasons. During April–May–June, AODs range from 0.1 in the morning to 0.6 in the late afternoon, whereas October–November–December show relatively flat behavior.
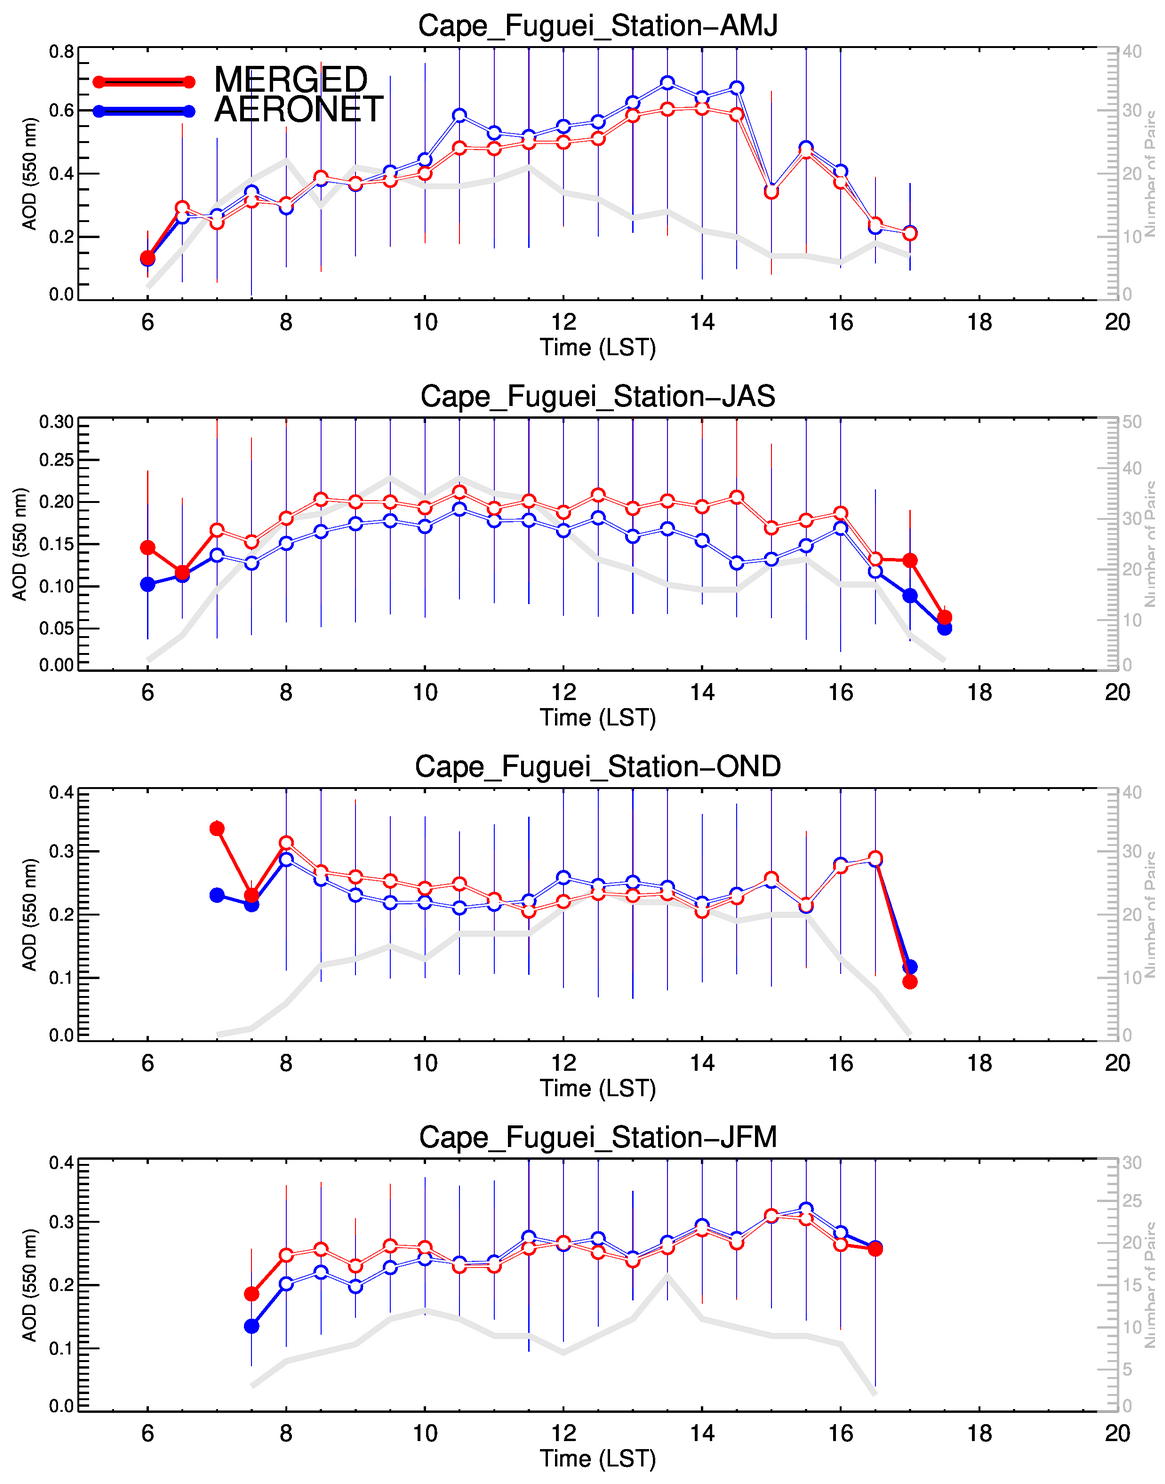
Figure 13Same as Fig. 12 but for the Cape Fuguei AERONET station in Taiwan. The vertical bar represents 1 standard deviation in AOD at 550 nm.
Figure 14 presents specific seasonal examples from Vienna (OND), Mexico City (AMJ), Dibrugarh University in India (OND), and EPA-NCU on the east coast of the United States (AMJ). Vienna is notable as it demonstrates the capability of LEO sensors alone to capture limited diurnal cycles, as it is a site not covered by any GEO sensor used in this study. Despite limited sampling (0–5 matches per hour), LEO sensors closely track AERONET AODs with a slight negative bias. Mexico City previously stood out as an AERONET station with a strong diurnal signature in previous studies (Zhang et al., 2012). Here we also see high diurnal variability at Mexico City, with AOD ranging from 0.2 in the morning to 0.5 in the late afternoon; merged DT AODs generally track AERONET readings but with some biases observed. Dibrugarh station exhibits less variability, yet the two datasets closely correspond. We note Dibrugarh's location at the edge of the AHI disk, but the retrieved product is still able to match AERONET. At the EPA-NCU AERONET site, merged data are predominantly influenced by ABI-G16 and show a significant positive bias compared to AERONET readings.
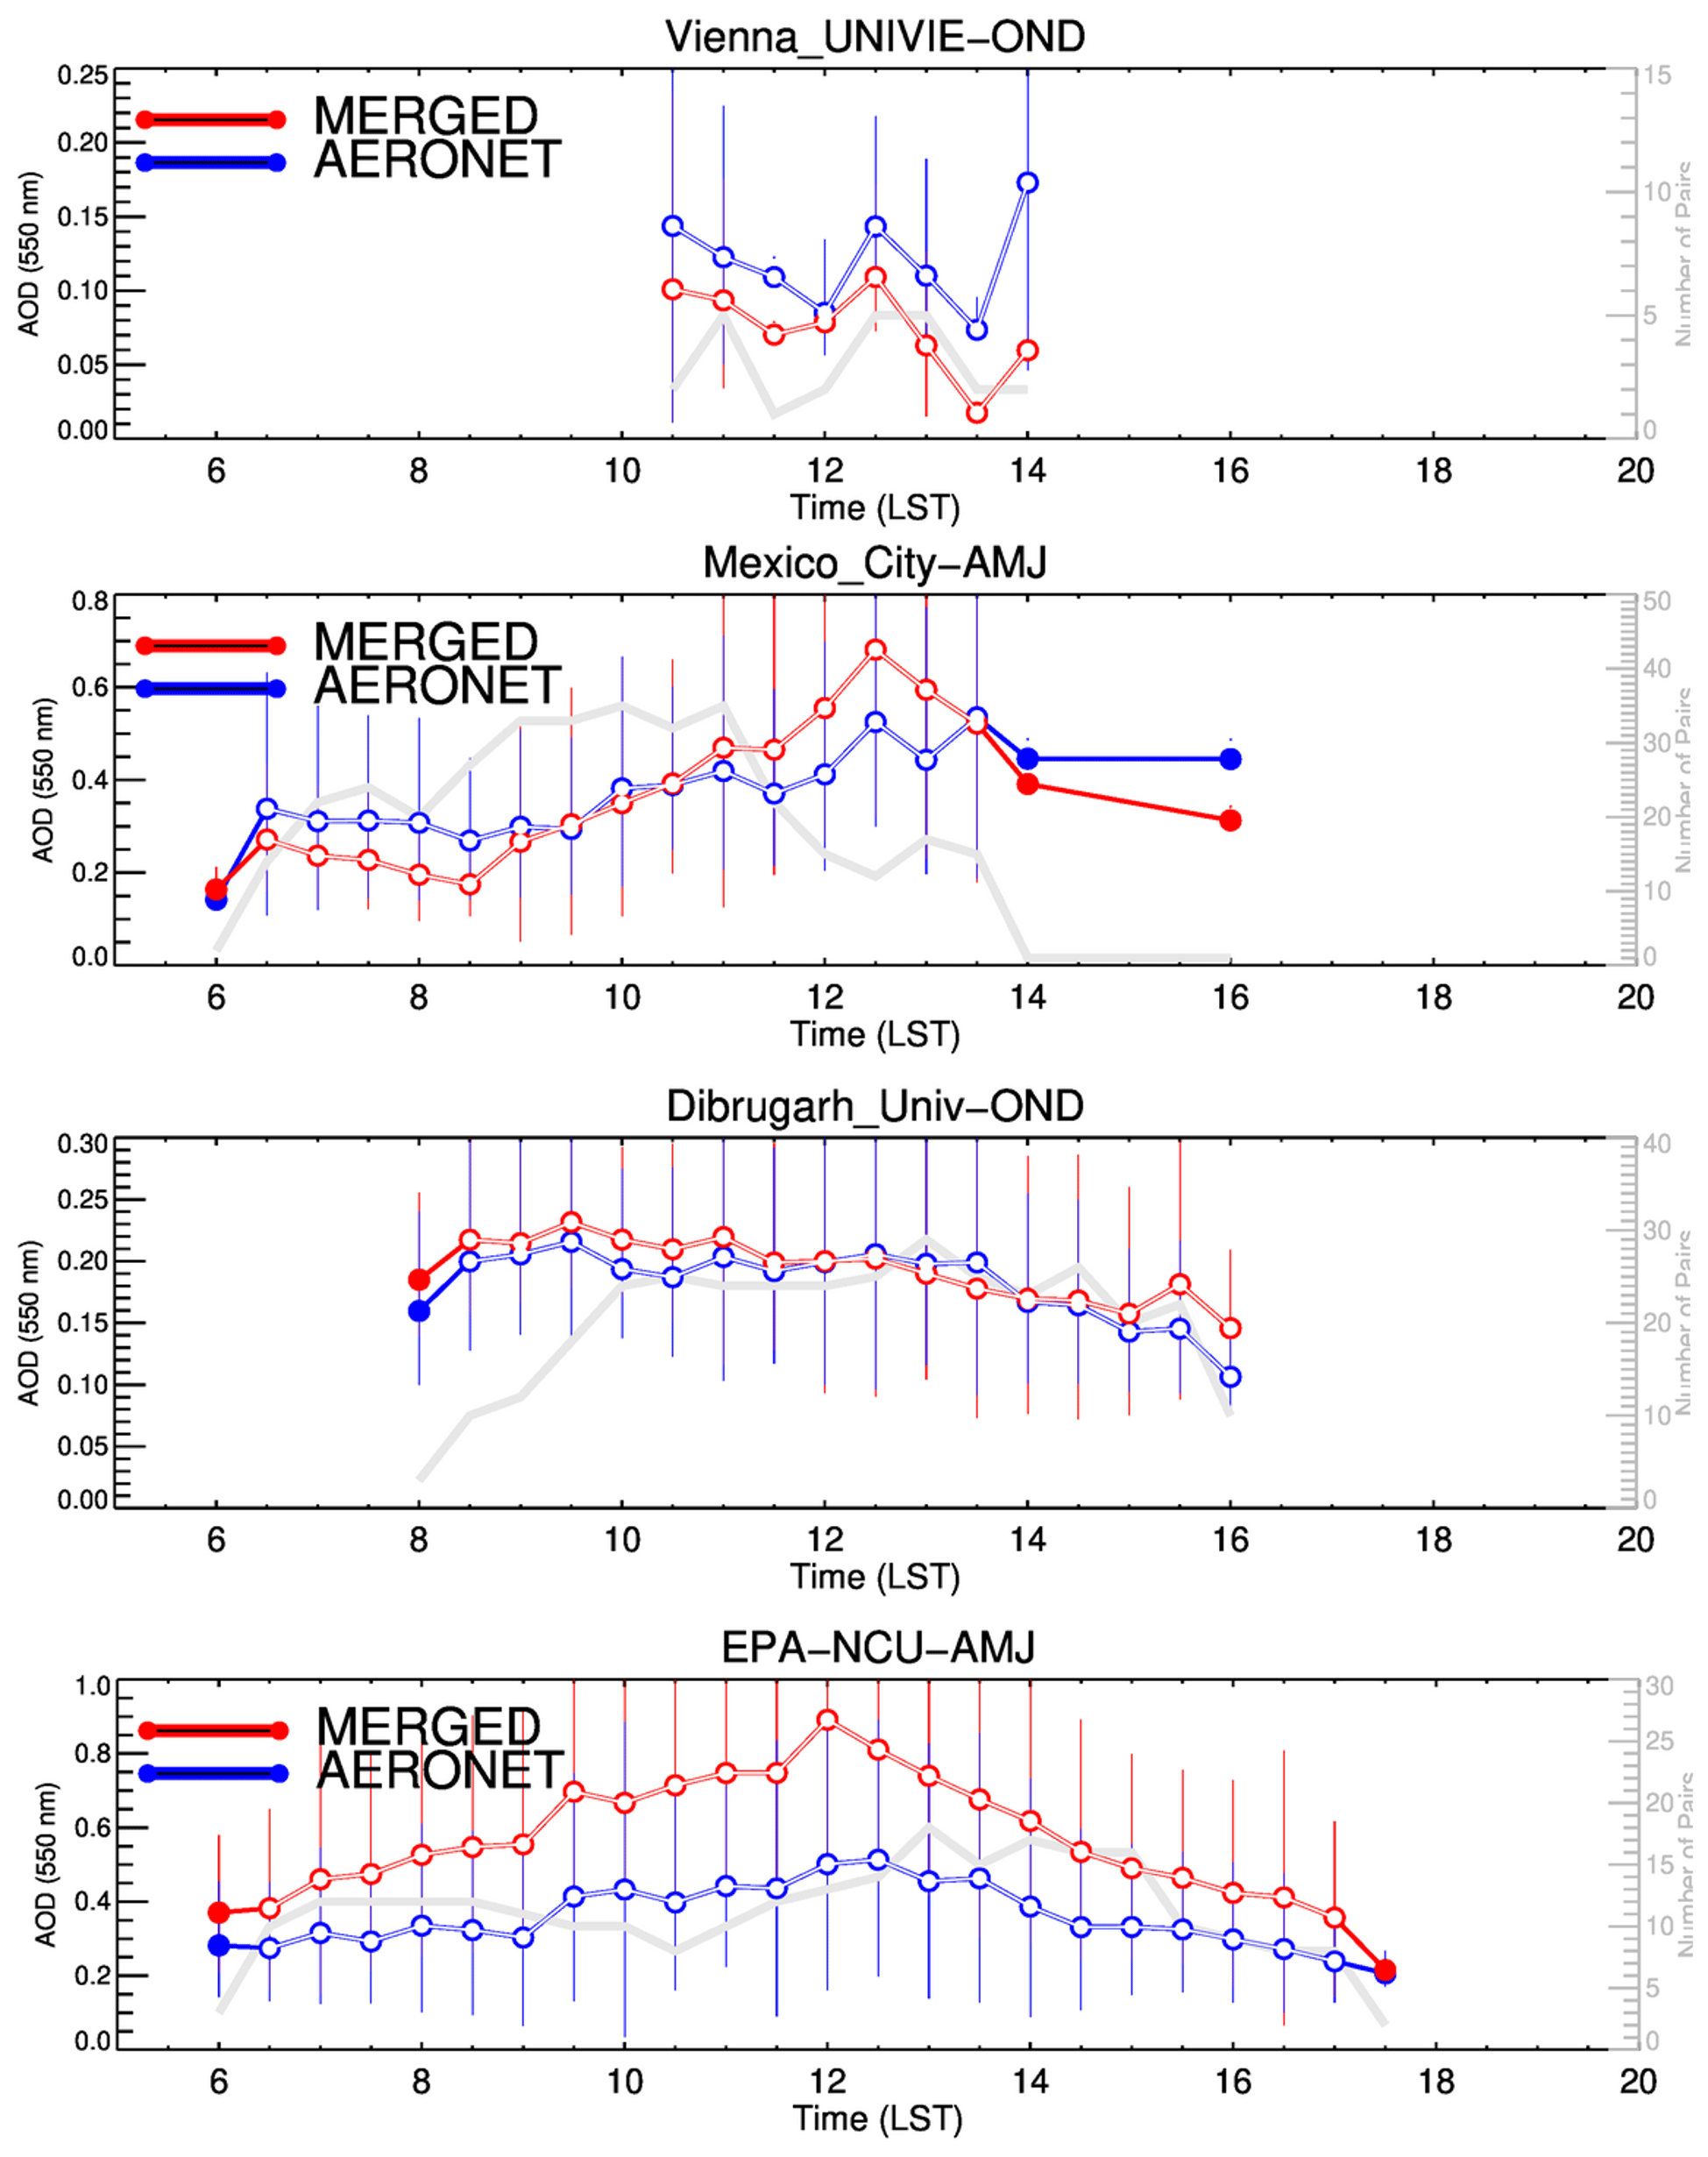
Figure 14Same as Fig. 12 but for four selected AERONET stations in different seasons. The vertical bar represents 1 standard deviation in AOD at 550 nm.
The merged datasets demonstrate the capability to capture diurnal cycles with known caveats and limitations. The diurnal cycle at each AERONET site has a unique feature and depends on many factors, including aerosol sources, meteorological conditions, AOD uncertainties, and sampling from both satellite and AERONET. These examples have been handpicked for various reasons including land or ocean domination, previous history of diurnal cycle, lack of GEO sensor, and variability in diurnal signatures. Many but not all collocated retrievals match AERONET as well. We provide diurnal cycles (the same as Fig. 13) for 157 selected AERONET sites in the Supplement.
For 2 decades, LEO sensors (MODIS on Aqua, MODIS on Terra, and VIIRS on Suomi-NPP) have been a source of high-quality aerosol observations with moderate spatial resolution from space. More recently, GEO sensors have been making similar observations with the launch of the AHI in 2014 aboard Himawari-8 and then continued by Himawari-9, GOES-16, GOES-17, and, more recently, GOES-18. The LEO sensors (i.e., MODIS, VIIRS) can provide one to two measurements per day across the globe, but GEO sensors provide high-frequency (∼ 10 min) data for full-disk imagery over a particular region.
In this study, we implemented the well-known Dark Target aerosol retrieval algorithm on three LEO and three GEO sensors and processed 1 year of Level 2 aerosol products from all sensors. The Level 2 aerosol optical depth at 550 nm from each sensor was then gridded into a quarter-degree grid for every 30 min of observations. The gridded individual sensors' AODs were then merged by averaging available AODs in each quarter-degree grid cell for a given 30 min time window. This way, we have created a gridded AOD product with spatial and temporal resolutions of a quarter degree and half an hour, respectively. The final gridded AODs from individual sensors and merged datasets are saved into a 30 min global file, thus making 48 files per day. The 30 min files were then used to estimate the daily mean AODs, and daily AODs were used to calculate monthly mean AOD datasets. This is the first moderate-resolution gridded AOD dataset merged from six separate sensors available globally at a temporal resolution that can discern diurnal signatures.
The gridded datasets from individual sensors have been compared against each other and validated against ground measurements over global locations, and errors are characterized. The merged product has a global mean bias of about +0.05, with 65 % of retrievals falling within and the majority of retrievals on the positive-biased side of the stated error bars.
The merge provides excellent global coverage with a high frequency of AOD measurements in the regions covered by GEO sensors (Americas and Asia). There are temporal data gaps in regions with no equivalent GEO sensors (i.e., Europe and Africa). The LEO sensors fill in some of the spatial data gaps in the GEO sensor's field of view due to cloud or retrieval limitations such as viewing angles and sun glint. The merged product provides almost 45 % global coverage on any given day, which is a significant improvement from the 12 %–30 % expected from any individual sensor used in this study.
Such merged gridded data can assist in tracking the aerosol transport resulting from wildfires and dust storms, allowing for better air quality forecasting and hindcasting. The high spatiotemporal resolution of new AOD datasets will help evaluate and intercompare regional or global model simulations and reanalysis products in ways previously unattainable in a gridded format.
The merged product is able to approximate the diurnal cycle of AERONET AODs, although with a positive bias. We note an unexpected strong diurnal signature from the global composite of AERONET AOD during northern spring. In this global composite mean AERONET AOD begins the morning with a value of 0.12 and reaches midday with a value of 0.19, which drops back down to 0.12 at sunset. That is a diurnal signal of 50 %. Previous studies using AERONET to determine the diurnal signal for AOD find diurnal signatures of that magnitude for individual sites or groups of similar sites, but when aggregated into larger composites of multiple disconnected stations those signatures flatten (Kaufman et al., 2000, 2005c; Smirnov et al., 2002; Zhang et al., 2012; Arola et al., 2013).
The Level 2 and merged Level 3 data presented in this study are prototypes of products proposed in response to NASA's Making Earth System Data Records for Use in Research Environments (MEaSUREs) program. The intention was to use a version of retrieval code, known as the Dark Target Package (DT-Package), that further homogenizes the Level 2 retrievals from the three LEO and three GEO sensors and leads to improved consistency. This effort has generated a “Version 1.0” product, which covers the years 2019–2022 and is now archived at NASA's LAADS DAAC. For AOD retrievals, the differences between the MODIS (C6.1), VIIRS (V1.1), and GEO retrievals (V0) used in this study are small; however, these archived products have improved diagnostic and quality flags as well as file structures and metadata. The MEaSUREs Level 3 products are not yet available but will also have differences, primarily in their diagnostics as well as file structure and metadata. We expect that the complete delivery of the GEO–LEO dataset will still be impacted by most of the same offsets and biases (compared to each other, and compared to AERONET) as presented here.
The intended MEaSUREs Level 3 products will also include some updates to both file usability and content. In addition to the best-quality AOD (the filtered Optical_Depth_Land_And_Ocean) at 550 nm, these Level 3 data will also include statistics-based all-quality AOD data (non-filtered Image_Optical_Depth_Land_And_Ocean). Thus a user will be able to consider an ensemble approach to estimating AOD. In addition, we will also provide QDG sun-satellite geometries for each sensor separately. The Level 3 data file will also have AOD values from each sensor at QDG along with merged AODs.
The adaptation of the unified DT-Package will enable systematic improvement. For example, Kim et al. (2024) are applying a new surface reflectance parameterization to the GEO retrievals that better accounts for the different GEO versus LEO observing geometry. This will help address some of the remaining diurnal biases, which will then help characterize the aerosol effect on radiative forcing, cloud development, and air quality. We expect that the merged satellite dataset presented here, and its future updates, will be a major asset in exploring the sources and consequences of aerosols' diurnal variability. This dataset could also evolve to include retrievals from other current or future sensors capable of accommodating the DT algorithm. Some examples include sensors in GEO (e.g., the European Flexible Combined Imager – FCI – or the Korean Advanced Meteorological Imager – AMI) as well as sensors in LEO with a different overpass time (e.g., NASA's Ocean Color Imager – OCI – on Plankton, Aerosol, Clouds, ocean Ecosystems – PACE). This GEO–LEO product could also include future sensors like the remaining VIIRS to be aboard the JPSS Series. These additional assets will provide better coverage of Africa, Europe, and Asia and move us even closer to a fully realized global dataset with an AOD product from sunrise to sunset.
The aerosol datasets from six sensors produced using the Dark Target algorithm have been part of NASA's MEaSUREs project (ROSES-2017; https://www.earthdata.nasa.gov/esds/competitive-programs/measures/leo-geo-synergy, Levy, 2024) and are publicly available from NASA LAADS (https://ladsweb.modaps.eosdis.nasa.gov/archive/allData/5019, last access: 9 September 2024). The AERONET direct-sun measurement data used in this study are available via the AERONET website (https://aeronet.gsfc.nasa.gov/new_web/download_all_v3_aod.html, NASA GSFC, 2024).
The supplement related to this article is available online at: https://doi.org/10.5194/amt-17-5455-2024-supplement.
PG, RCL, and LAR designed this study. SM, PG, ZZ, and VS developed codes and carried out the Level 2 retrievals. PG developed the Level 3 data processing algorithm and ran the experiment and analysis. SZ, PG, JW, XP, RCL, MO, and VPK developed and tested Level 3 operational code. PG, LAR, and RCL prepared the manuscript draft, and all authors reviewed it.
The contact author has declared that none of the authors has any competing interests.
Publisher's note: Copernicus Publications remains neutral with regard to jurisdictional claims made in the text, published maps, institutional affiliations, or any other geographical representation in this paper. While Copernicus Publications makes every effort to include appropriate place names, the final responsibility lies with the authors.
This work was supported by NASA's EOS program and the NASA ROSES program NNH17ZDA001N: Making Earth System Data Records for Use in Research Environments (MEaSUREs) managed by Lucia Tsaoussi. We thank the Space Science and Engineering Center (SSEC) at the University of Wisconsin-Madison for providing Himawari-8 data and NASA's MODIS Adaptive Processing System (MODAPS) services for providing access to NOAA's GOES-16 and GOES-17 data. We thank the MODIS and VIIRS calibration and support teams (MCST and VCST) for their efforts to maintain and improve the radiometric quality of MODIS and VIIRS data as well as MODAPS and LAADS for the continued processing and archiving of the MODIS products. The AERONET team (GSFC and site PIs) are thanked for the creation and continued stewardship of the sun photometer data record, which is available from http://aeronet.gsfc.nasa.gov (last access: 9 September 2024).
This research has been supported by the Goddard Space Flight Center (grant no. NNH17ZDA001N).
This paper was edited by Daniel Perez-Ramirez and reviewed by two anonymous referees.
Al-Saadi, J., Szykman, J., Pierce, R. B., Kittaka, C., Neil, D., Chu, D. A., Remer, L., Gumley, L., Prins, E., Weinstock, L., MacDonald, C., Wayland, R., Dimmick, F., and Fishman, J.: Improving National Air Quality Forecasts with Satellite Aerosol Observations, B. Am. Meteorol. Soc., 86, 1249–1262, https://doi.org/10.1175/BAMS-86-9-1249, 2005.
Arola, A., Eck, T. F., Huttunen, J., Lehtinen, K. E. J., Lindfors, A. V., Myhre, G., Smirnov, A., Tripathi, S. N., and Yu, H.: Influence of observed diurnal cycles of aerosol optical depth on aerosol direct radiative effect, Atmos. Chem. Phys., 13, 7895–7901, https://doi.org/10.5194/acp-13-7895-2013, 2013.
ATBD: Algorithm Theoretical Basis Document for the Dark Target Aerosol Retrieval Algorithm, https://darktarget.gsfc.nasa.gov/atbd/overview (last access: 9 September 2024), 2023.
Bellouin, N., Jones, A., Haywood, J., and Christopher, S. A.: Updated estimate of aerosol direct radiative forcing from satellite observations and comparison against the Hadley Centre climate model, J. Geophys. Res., 113, D10205, https://doi.org/10.1029/2007JD009385, 2008.
Benedetti, A., Morcrette, J. J., Boucher, O., Dethof, A., Engelen, R. J., Fisher, M., Flentje, H., Huneeus, N., Jones, L., Kaiser, J. W., and Kinne, S.: Aerosol analysis and forecast in the European centre for medium-range weather forecasts integrated forecast system: 2. Data assimilation, J. Geophys. Res.-Atmos., 114, D13205, https://doi.org/10.1029/2008JD011115, 2009.
Chin, M., Diehl, T., Tan, Q., Prospero, J. M., Kahn, R. A., Remer, L. A., Yu, H., Sayer, A. M., Bian, H., Geogdzhayev, I. V., Holben, B. N., Howell, S. G., Huebert, B. J., Hsu, N. C., Kim, D., Kucsera, T. L., Levy, R. C., Mishchenko, M. I., Pan, X., Quinn, P. K., Schuster, G. L., Streets, D. G., Strode, S. A., Torres, O., and Zhao, X.-P.: Multi-decadal aerosol variations from 1980 to 2009: a perspective from observations and a global model, Atmos. Chem. Phys., 14, 3657–3690, https://doi.org/10.5194/acp-14-3657-2014, 2014.
Gelaro, R., McCarty, W., Suárez, M. J., Todling, R., Molod, A., Takacs, L., Randles, C. A., Darmenov, A., Bosilovich, M.l G., Reichle, R., Wargan, K., Coy, L., Cullather, R., Draper, C., Akella, S., Buchard, V., Conaty, A., da Silva, A. M., Gu, W., Kim, Gi-K., Koster, R., Lucchesi, R., Merkova, D., Nielsen, J. E., Partyka, G., Pawson, S., Putman, W., Rienecker, M., Schubert, S. D., Sienkiewicz, M., and Zhao, B.: The Modern-Era Retrospective Analysis for Research and Applications, Version 2 (MERRA-2), J. Climate, 30, 5419–5454, https://doi.org/10.1175/JCLI-D-16-0758.1, 2017.
Giles, D. M., Sinyuk, A., Sorokin, M. G., Schafer, J. S., Smirnov, A., Slutsker, I., Eck, T. F., Holben, B. N., Lewis, J. R., Campbell, J. R., Welton, E. J., Korkin, S. V., and Lyapustin, A. I.: Advancements in the Aerosol Robotic Network (AERONET) Version 3 database – automated near-real-time quality control algorithm with improved cloud screening for Sun photometer aerosol optical depth (AOD) measurements, Atmos. Meas. Tech., 12, 169–209, https://doi.org/10.5194/amt-12-169-2019, 2019.
Gladkova, I., Ignatov, A., Shahriar, F., Kihai, Y., Hillger, D., and Petrenko, B.: Improved VIIRS and MODIS SST Imagery, Remote Sens., 8, 79, https://doi.org/10.3390/rs8010079, 2016.
Gupta, P. and Christopher, S. A.: Particulate matter air quality assessment using integrated surface, satellite, and meteorological products: Multiple regression approach, J. Geophys. Res., 114, D14205, https://doi.org/10.1029/2008JD011496, 2009a.
Gupta, P. and Christopher, S. A.: Particulate matter air quality assessment using integrated surface, satellite, and meteorological products: 2. A neural network approach, J. Geophys. Res., 114, D20205, https://doi.org/10.1029/2008JD011497, 2009b.
Gupta, P., Levy, R. C., Mattoo, S., Remer, L. A., and Munchak, L. A.: A surface reflectance scheme for retrieving aerosol optical depth over urban surfaces in MODIS Dark Target retrieval algorithm, Atmos. Meas. Tech., 9, 3293–3308, https://doi.org/10.5194/amt-9-3293-2016, 2016.
Gupta, P., Remer, L. A., Levy, R. C., and Mattoo, S.: Validation of MODIS 3 km land aerosol optical depth from NASA's EOS Terra and Aqua missions, Atmos. Meas. Tech., 11, 3145–3159, https://doi.org/10.5194/amt-11-3145-2018, 2018.
Gupta, P., Levy, R. C., Mattoo, S., Remer, L. A., Holz, R. E., and Heidinger, A. K.: Applying the Dark Target aerosol algorithm with Advanced Himawari Imager observations during the KORUS-AQ field campaign, Atmos. Meas. Tech., 12, 6557–6577, https://doi.org/10.5194/amt-12-6557-2019, 2019.
Gupta, P., Remer, L. A., Patadia, F., Levy, R. C., and Christopher, S. A.: High-Resolution Gridded Level 3 Aerosol Optical Depth Data from MODIS, Remote Sens., 12, 2847, https://doi.org/10.3390/rs12172847, 2020.
Holben, B. N., Eck, T. F., Slutsker, I., Tanre, D., Buis, J. P., Setzer, A., Vermote, E., Reagan, J. A., Kaufman, Y., Nakajima, T., Lavenu, F., Jankowiak, I., and Smirnov, A.: AERONET – A federated instrument network and data archive for aerosol characterization, Remote Sens. Environ., 66, 1–16, https://doi.org/10.1016/S0034-4257(98)00031-5, 1998.
Ichoku, C., Chu, D. A., Mattoo, S., Kaufman, Y. J., Remer, L. A., Tanré, D., Slutsker, I., and Holben, B. N.: A spatio-temporal approach for global validation and analysis of MODIS aerosol products, Geophys. Res. Lett., 29, MOD1-1–MOD1-4, https://doi.org/10.1029/2001GL013206, 2002.
Kaufman, Y. J., Tanré, D., Remer, L. A., Vermote, E., Chu, A., and Holben, B. N.: Operational remote sensing of tropospheric aerosol over land from EOS moderate resolution imaging spectroradiometer, J. Geophys. Res., 102, 17051–17067, https://doi.org/10.1029/96JD03988, 1997.
Kaufman, Y. J., Holben, B. N., Tanré, D., Slutsker, I., Smirnov, A., and Eck, T. F.: Will aerosol measurements from Terra and Aqua polar orbiting satellites represent the daily aerosol abundance and properties?, Geophys. Res. Lett., 27, 3861–3864, 2000.
Kaufman, Y. J., Tanré, D., and Boucher, O.: A satellite view of aerosols in the climate system, Nature, 419, 215–223, 2002.
Kaufman, Y. J., Koren, I., Remer, L. A., Rosenfeld, D., and Rudich, Y.: The effect of smoke, dust, and pollution aerosol on shallow cloud development over the Atlantic Ocean, P. Natl. Acad. Sci. USA, 102, 11207–11212, https://doi.org/10.1073/pnas.0505191102, 2005a.
Kaufman, Y. J., Koren, I., Remer, L. A., Tanré, D., Ginoux, P., and Fan, S.: Dust transport and deposition observed from the Terra-Moderate Resolution Imaging Spectroradiometer (MODIS) spacecraft over the Atlantic Ocean, J. Geophys. Res., 110, D10S12, https://doi.org/10.1029/2003JD004436, 2005b.
Kaufman, Y. J., Remer, L. A., Tanré, D., Li, R. R., Kleidman, R., Mattoo, S., Levy, R. C., Eck, T. F., Holben, B. N., Ichoku, C., and Martins, J. V.: A critical examination of the residual cloud contamination and diurnal sampling effects on MODIS estimates of aerosol over ocean, IEEE T. Geosci. Remote, 43, 2886–2897, 2005c.
Kim, M., Levy, R. C., Remer, L. A., Mattoo, S., and Gupta, P.: Parameterizing spectral surface reflectance relationships for the Dark Target aerosol algorithm applied to a geostationary imager, Atmos. Meas. Tech., 17, 1913–1939, https://doi.org/10.5194/amt-17-1913-2024, 2024.
Kinne, S., Lohmann, U., Feichter, J., Schulz, M., Timmreck, C., Ghan, S., Easter, R., Chin, M., Ginoux, P., Takemura, T., Tegen, I., Koch, D., Herzog, M., Penner, J., Pitari, G., Holben, B., Eck, T., Smirnov, A., Dubovik, O., Slutsker, I., Tanre, D., Torres, O., Mishchenko, M., Geogdzhayev, I., Chu, D. A., and Kaufman, Y.: Monthly averages of aerosol properties: A global comparison among models, satellite data, and AERONET ground data, J. Geophys. Res., 108, 4634, https://doi.org/10.1029/2001JD001253, 2003.
Koren, I., Remer, L. A., Kaufman, Y. J., Rudich, Y., and Martins, J. V.: On the twilight zone between clouds and aerosols, Geophys. Res. Lett., 34, L08805, https://doi.org/10.1029/2007GL029253, 2007.
Koren, I., Martins, J. V., Remer, L. A., and Afargan, H.: Smoke invigoration versus inhibition of clouds over the Amazon, Science, 321, 946–949, https://doi.org/10.1126/science.1159185, 2008.
Levy, R.: XAERDT aerosol products in support of MEaSUREs, Earthdata, https://www.earthdata.nasa.gov/esds/competitive-programs/measures/leo-geo-synergy, last access: 9 September 2024 (data available at: https://ladsweb.modaps.eosdis.nasa.gov/archive/allData/5019, last access: 9 September 2024).
Levy, R. C., Remer, L. A., Mattoo, S., Vermote, E. F., and Kaufman, Y. J.: Second-generation operational algorithm: Retrieval of aerosol properties over land from inversion of Moderate Resolution Imaging Spectroradiometer spectral reflectance, J. Geophys. Res., 112, D13211, https://doi.org/10.1029/2006JD007811, 2007.
Levy, R. C., Remer, L. A., Kleidman, R. G., Mattoo, S., Ichoku, C., Kahn, R., and Eck, T. F.: Global evaluation of the Collection 5 MODIS dark-target aerosol products over land, Atmos. Chem. Phys., 10, 10399–10420, https://doi.org/10.5194/acp-10-10399-2010, 2010.
Levy, R. C., Mattoo, S., Munchak, L. A., Remer, L. A., Sayer, A. M., Patadia, F., and Hsu, N. C.: The Collection 6 MODIS aerosol products over land and ocean, Atmos. Meas. Tech., 6, 2989–3034, https://doi.org/10.5194/amt-6-2989-2013, 2013.
Levy, R. C., Mattoo, S., Sawyer, V., Shi, Y., Colarco, P. R., Lyapustin, A. I., Wang, Y., and Remer, L. A.: Exploring systematic offsets between aerosol products from the two MODIS sensors, Atmos. Meas. Tech., 11, 4073–4092, https://doi.org/10.5194/amt-11-4073-2018, 2018.
Lyapustin, A., Wang, Y., Choi, M., Xiong, X., Angal, A., Wu, A., Doelling, D. R., Bhatt, R., Go, S., Korkin, S., Franz, B., Meister, G., Sayer, A. M., Roman, M., Holz, R. E., Meyer, K., Gleason, J., and Levy, R.: Calibration of the SNPP and NOAA 20 VIIRS sensors for continuity of the MODIS climate data records, Remote Sens. Environ., 295, 113717, https://doi.org/10.1016/j.rse.2023.113717, 2023.
NASA GSFC: AERONET direct-sun measurement data, https://aeronet.gsfc.nasa.gov/new_web/download_all_v3_aod.html, last access: 9 September 2024.
Remer, L. A., Kaufman, Y. J., Tanré, D., Mattoo, S., Chu, D. A., Martins, J. V., Li, R.-R., Ichoku, C., Levy, R. C., Kleidman, R. G., Eck, T. F., Vermote, E., and Holben, B. N.: The MODIS aerosol algorithm, products and validation, J. Atmos. Sci., 62, 947–973, 2005.
Remer, L. A., Kaufman, Y. J., and Kleidman, R. G.: Comparison of Three Years of Terra and Aqua MODIS Aerosol Optical Thickness Over the Global Oceans, IEEE Geosci. Remote S., 3, 537–540, https://doi.org/10.1109/LGRS.2006.879562, 2006.
Remer, L. A., Mattoo, S., Levy, R. C., Heidinger, A., Pierce, R. B., and Chin, M.: Retrieving aerosol in a cloudy environment: aerosol product availability as a function of spatial resolution, Atmos. Meas. Tech., 5, 1823–1840, https://doi.org/10.5194/amt-5-1823-2012, 2012.
Sawyer, V., Levy, R., Mattoo, S., Cureton, G., Shi, Y., and Remer, L. A.: Continuing the MODIS Dark Target aerosol time series with VIIRS, Remote Sens.-Basel, 12, 308, https://doi.org/10.3390/rs12020308, 2020.
Sayer, A. M., Hsu, N. C., and Bettenhausen, C.: Implications of MODIS bow-tie distortion on aerosol optical depth retrievals, and techniques for mitigation, Atmos. Meas. Tech., 8, 5277–5288, https://doi.org/10.5194/amt-8-5277-2015, 2015.
Schutgens, N., Sayer, A. M., Heckel, A., Hsu, C., Jethva, H., de Leeuw, G., Leonard, P. J. T., Levy, R. C., Lipponen, A., Lyapustin, A., North, P., Popp, T., Poulsen, C., Sawyer, V., Sogacheva, L., Thomas, G., Torres, O., Wang, Y., Kinne, S., Schulz, M., and Stier, P.: An AeroCom–AeroSat study: intercomparison of satellite AOD datasets for aerosol model evaluation, Atmos. Chem. Phys., 20, 12431–12457, https://doi.org/10.5194/acp-20-12431-2020, 2020.
Smirnov, A., Holben, B. N., Eck, T. F., Slutsker, I., Chatenet, B., and Pinker, R. T.: Diurnal variability of aerosol optical depth observed at AERONET (Aerosol Robotic Network) sites, Geophys. Res. Lett., 29, 30-1–30-4, 2002.
Sogacheva, L., Popp, T., Sayer, A. M., Dubovik, O., Garay, M. J., Heckel, A., Hsu, N. C., Jethva, H., Kahn, R. A., Kolmonen, P., Kosmale, M., de Leeuw, G., Levy, R. C., Litvinov, P., Lyapustin, A., North, P., Torres, O., and Arola, A.: Merging regional and global aerosol optical depth records from major available satellite products, Atmos. Chem. Phys., 20, 2031–2056, https://doi.org/10.5194/acp-20-2031-2020, 2020.
Tanré, D., Kaufman, Y. J., Herman, M., and Mattoo, S.: Remote sensing of aerosol properties over oceans using the MODIS/EOS spectral radiances, J. Geophys. Res., 102, 16971–16988, https://doi.org/10.1029/96JD03437, 1997.
Wei, J., Li, Z., Sun, L., Peng, Y., Liu, L., He, L., Qin, W., and Cribb, M.: MODIS Collection 6.1 3 km resolution aerosol optical depth product: Global evaluation and uncertainty analysis, Atmos. Environ., 240, 117768, https://doi.org/10.1016/j.atmosenv.2020.117768, 2020.
Xin, J., Zhang, Q., Wang, L., Gong, C., Wang, Y., Liu, Z., and Gao, W.: The empirical relationship between the PM2.5 concentration and aerosol optical depth over the background of North China from 2009 to 2011, Atmos. Res., 138, 179–188, https://doi.org/10.1016/j.atmosres.2013.11.001, 2014.
Yu, H., Remer, L. A., Chin, M., Bian, H.-S., Tan, Q., Yuan, T., and Zhang, Y.: Aerosols from Overseas Rival Domestic Emissions over North America, Science, 337, 566–569, https://doi.org/10.1126/science.1217576, 2012.
Yu, H., Tan, Q., Chin, M., Remer, L. A., Kahn, R. A., Bian, H., Kim, D., Zhang, Z., Yuan, T., Omar, A. H., Winker, D. M., Levy, R. C., Kalashnikova, O., Crepeau, L., Capelle, V., and Chédin, A.: Estimates of African dust deposition along the trans-Atlantic transit using the decadelong record of aerosol measurements from CALIOP, MODIS, MISR, and IASI, J. Geophys. Res.-Atmos., 124, 7975–7996, https://doi.org/10.1029/2019JD030574, 2019.
Yuan, T., Remer, L. A., and Yu, H.: Microphysical, macrophysical and radiative signatures of volcanic aerosols in trade wind cumulus observed by the A-Train, Atmos. Chem. Phys., 11, 7119–7132, https://doi.org/10.5194/acp-11-7119-2011, 2011a.
Yuan, T., Remer, L. A., Pickering, K. E., and Yu, H.-B.: Observational evidence of aerosol enhancement of lightning activity and convective invigoration, Geophys. Res. Lett, 38, L04701, https://doi.org/10.1029/2010GL046052, 2011b.
Zhang, J., Reid, J. S., Westphal, D. L., Baker, N. L., and Hyer, E. J.: A system for operational aerosol optical depth data assimilation over global oceans, J. Geophys. Res.-Atmos., 113, D10208, https://doi.org/10.1029/2007JD009065, 2008.
Zhang, Y., Yu, H., Eck, T. F., Smirnov, A., Chin, M., Remer, L. A., Bian, H., Tan, Q., Levy, R., Holben, B. N., and Piazzolla, S.: Aerosol daytime variations over North and South America derived from multiyear AERONET measurements, J. Geophys. Res.-Atmos., 117, D05211, https://doi.org/10.1029/2011JD017242, 2012.
Zhou, Y., Levy, R., Remer, L., Mattoo, S., and Espinosa, R.: Dust aerosol retrieval over the oceans with the MODIS/VIIRS Dark Target algorithm. Part II: Non-spherical dust model, Earth and Space Science, 7, e2020EA001222, https://doi.org/10.1029/2020EA001222, 2020a.
Zhou, Y., Levy, R., Remer, L., Mattoo, S., Shi, Y., and Wang, C.: Dust aerosol retrieval over the oceans with the MODIS/VIIRS Dark Target algorithm. Part I: Dust detection, Earth and Space Science, 7, e2020EA001221, https://doi.org/10.1029/2020EA001221, 2020b.