the Creative Commons Attribution 4.0 License.
the Creative Commons Attribution 4.0 License.
Total column optical depths retrieved from CALIPSO lidar ocean surface backscatter
Robert A. Ryan
Mark A. Vaughan
Sharon D. Rodier
Jason L. Tackett
John A. Reagan
Richard A. Ferrare
Johnathan W. Hair
John A. Smith
Brian J. Getzewich
This paper introduces the Ocean Derived Column Optical Depth (ODCOD) algorithm. ODCOD is now being used to retrieve full-column optical depths from the 532 nm measurements acquired by the Cloud-Aerosol Lidar with Orthogonal Polarization (CALIOP) aboard the Cloud-Aerosol Lidar Infrared Pathfinder Satellite Observations (CALIPSO) spacecraft. ODCOD uses the lidar integrated attenuated backscatter from the ocean surface, together with collocated wind speed estimates from Modern-Era Retrospective analysis for Research and Applications, Version 2 (MERRA-2), to estimate the full-column optical depths of particulates (i.e., clouds and aerosols) in the Earth's atmosphere. Unlike CALIOP's standard retrievals, which estimate optical depths only when particulate layers are detected, ODCOD retrievals deliver a comprehensive estimate that accounts for attenuation by all particulates present within the lidar profiles. This paper describes the ODCOD algorithm, develops random uncertainty estimates, and characterizes the systematic differences between ODCOD optical depths and those reported by previously validated data sets. This paper presents performance assessments of ODCOD cloud-free profiles to compare the ODCOD aerosol optical depth (AOD) retrievals to collocated measurements made by the airborne High Spectral Resolution Lidar (HSRL) instruments flown by NASA Langley Research Center (LaRC), to daytime estimates derived from the Moderate Resolution Imaging Spectroradiometer (MODIS), and to daytime and nighttime retrievals using the Synergized Optical Depth of Aerosols (SODA) algorithm. ODCOD AODs are biased high relative to LaRC HSRL AODs by 0.009 ± 0.043 (median ± median absolute deviation), with a correlation coefficient of 0.724, and biased low relative to MODIS by 0.009 ± 0.041, with a correlation coefficient of 0.834. Relative to SODA, which derives AOD from a combination of CALIOP and CloudSat ocean surface measurements, ODCOD is biased high in the daytime by 0.004 ± 0.035 and higher at night by 0.027 ± 0.034, with correlation coefficients of 0.887 and 0.891, respectively. Because ODCOD estimates are independent from the standard CALIOP optical depth retrievals, they offer potential for future advances in the CALIPSO data record, both in validating CALIOP's standard estimates and as a potential total column constraint to improve extinction coefficient retrievals.
- Article
(13284 KB) - Full-text XML
- BibTeX
- EndNote
The Cloud-Aerosol Lidar with Orthogonal Polarization (CALIOP) (Hunt et al., 2009) aboard the Cloud-Aerosol Lidar Infrared Pathfinder Satellite Observations (CALIPSO) spacecraft (Winker et al., 2010) acquired over 17 years of near-continuous observations beginning in June of 2006 and concluding in June 2023. CALIPSO's 98.2° orbit inclination yielded near-global coverage, allowing for measurements of the location, extent, and optical properties of clouds and aerosols from 82° S to 82° N. CALIOP transmits linearly polarized laser light at 1064 and 532 nm, with detectors for the total backscattered signal at 1064 nm and the parallel and perpendicular polarizations of the backscatter at 532 nm (Hunt et al., 2009). The calibrated perpendicular and parallel signals are summed to retrieve the total attenuated backscatter at 532 nm. Also, volume depolarization ratios are obtained by dividing the perpendicular signals by the parallel signals (Powell et al., 2009). The science data products retrieved from the CALIOP measurements are reported at three standard processing levels (Vaughan et al., 2024). Level 1 products report calibrated profiles of attenuated backscatter coefficients for all three measurement channels, along with instrument state parameters (e.g., viewing angle, laser energies, and calibration coefficients) and relevant ancillary data such as profiles of atmospheric temperature and pressure. Level 2 products report geophysical parameters derived from the level 1 calibrated measurements (Winker et al., 2009). These parameters include layer top and base altitudes for all atmospheric and surface features detected in the backscatter profiles (Vaughan et al., 2009), the identification of atmospheric layers according to type and subtype (Liu et al., 2019; Kim et al., 2018; Avery et al., 2020), and layer optical properties such as optical depths and vertically resolved profiles of particulate (i.e., cloud and/or aerosol) extinction and backscatter coefficients (Young et al., 2018). Additionally, when the lidar signal is not fully attenuated, a dedicated retrieval algorithm detects the Earth's surface over both land and ocean (Vaughan et al., 2017). Level 3 products report monthly averages of level 2 retrievals composited on uniform spatial grids (Tackett et al., 2018; Kar et al., 2018; Winker et al., 2024).
Among the primary science data reported in the CALIOP data products are vertically resolved estimates of particulate extinction coefficients, their associated layer optical depths, surface detection and altitude, and estimates of wind speeds obtained from MERRA-2. To retrieve extinction coefficients, CALIOP first uses a feature detection algorithm to identify regions of the vertical profile with elevated attenuated backscatter (Vaughan et al., 2009) and then prescribes an extinction-to-backscatter ratio (i.e., lidar ratio) for various aerosol types based on the CALIOP aerosol classification and cloud/aerosol discrimination algorithms (Liu et al., 2019; Avery et al., 2020; Kim et al., 2018; Young et al., 2018). These prescribed lidar ratios are among the largest sources of uncertainty and error in the particulate extinction retrieval, and they become increasingly significant lower in the atmosphere due to attenuation and rescaling errors inherited from overlying layers (Young et al., 2013). CALIOP also only retrieves extinction coefficients for regions of the vertical profile where the particulate attenuated backscatter signal rises above the layer detection thresholds (Young and Vaughan, 2009). Regions of faint scattering from diffuse particulates can fall below these limits and hence go undetected. This inherently means that a small fraction of the overall particulate extinction will not be included in CALIOP's column optical depth estimates. Kim et al. (2017) estimate CALIOP's undetected optical depth to be on the order of 0.030 ± 0.046. Based on comparisons to Moderate Resolution Imaging Spectroradiometer (MODIS) AODs, Toth et al. (2018) report similar low-bias estimates of 0.03 to 0.05 for daytime retrievals. Consequently, estimates of global mean aerosol direct radiative effect derived from CALIOP's standard aerosol optical depth (AOD) retrievals are biased low by ∼ 54 % (Thorsen et al., 2017).
The low bias of CALIOP's standard optical depth product highlights a need for improved lidar retrievals to estimate the optical depths of the full atmospheric column. Previous studies have estimated the ocean surface integrated backscatter coefficient using only surface wind speed and viewing angle (Barrick et al., 1968; Bufton et al., 1983; Menzies et al., 1998; Lancaster et al., 2005; Hu et al., 2008). Their works make it possible to estimate the optical depth of the atmospheric column when the lidar signal is detected from the ocean surface. These techniques can be applied without assuming lidar ratios and incurring the uncertainties associated with them. Reagan and Zielinskie (1991) recognized that column optical depths could be estimated using “the strong return signals from ground/sea reflections to improve upon information that can be retrieved from spaceborne lidar observations”. Leveraging the close formation flying of the A-Train satellite constellation, Josset et al. (2008) devised an innovative technique to retrieve column optical depths by synthesizing measurements from CALIOP, the Cloud Profiling Radar (CPR) aboard CloudSat, and the Advanced Microwave Scanning Radiometer (AMSR) aboard Aqua. Using only CALIOP and AMSR measurements, Venkata and Reagan (2016) (hereafter VR2016) developed a column AOD retrieval based on prelaunch laboratory characterizations of the CALIOP 532 nm detector system response. Using the same satellite measurements, He et al. (2016) formulated another approach for estimating clear-sky optical depths. Each of these ocean surface retrieval techniques require an accurate estimate of the ocean surface integrated attenuated backscatter (IAB). Josset et al. (2008), He et al. (2016), and others integrate height-resolved CALIOP measurements around the ocean surface. However, techniques which approximate an integral from discrete sampling can introduce truncation uncertainty if the original signal is undersampled. VR2016 chose to employ a novel technique of fitting a piecewise function to approximate the measured lidar pulse shape of the CALIOP post-detector electronics and integrating the fit function to estimate the ocean surface integrated attenuated backscatter. Applying this approach avoids the systematic uncertainties associated with discrete integration techniques and provides an accurate estimation of the surface IAB.
While these retrieval advances offer new ways to estimate column optical depths, one drawback is that each technique requires measurements from multiple instruments, which introduces collocation uncertainties along with random and systematic retrieval uncertainties from multiple sensors. A further impediment is that the requisite CPR and AMSR measurements are only available for parts of the CALIOP mission. By combining ideas from previously developed methods and replacing the AMSR wind measurements with wind data obtained from the Modern-Era Retrospective analysis for Research and Applications, Version 2 (MERRA-2) reanalysis (Gelaro et al., 2017), a new hybrid algorithm is constructed to estimate full-column particulate (i.e., cloud and/or aerosol) optical depths from the lidar ocean surface return over the entire CALIPSO mission. This new algorithm, called Ocean Derived Column Optical Depth or ODCOD, is implemented in the CALIOP version 4.51 (V4.51) release of the lidar level 2 (LL2) CALIPSO data products. ODCOD is developed primarily from the work of VR2016 but also incorporates techniques from Josset et al. (2008) and Hu et al. (2008). In contrast to previously developed methods, ODCOD estimates are based solely on CALIOP measurements and MERRA-2 wind data. MERRA-2 also provides the profiles of number density, temperature, and pressure profiles that are used to calculate molecular and ozone two-way transmittances between the top of the atmosphere and the ocean surface. ODCOD retrievals of 532 nm optical depths are reported wherever a qualified ocean surface return signal is available.
The remainder of the paper provides a comprehensive overview of the ODCOD retrieval. Section 2 reviews the theory underpinning the algorithm, describes the necessary inputs and associated profile selection process, and develops random uncertainty estimates. Section 3 characterizes ODCOD's performance and systematic errors relative to established existing data sets by comparing ODCOD retrievals in cloud-free conditions to collocated airborne High Spectral Resolution Lidar (HSRL) measurements and to the AODs reported by MODIS and the Synergized Optical Depth of Aerosols (SODA) data sets. In closing, Sect. 4 summarizes the performance of the ODCOD algorithm and provides some concluding remarks.
This section reviews the theoretical basis of the ODCOD technique, enumerates the required inputs, characterizes the associated random uncertainties, and describes the new ODCOD data sets reported in the CALIOP V4.51 LL2 data products.
2.1 Algorithm overview
The ODCOD algorithm uses the integrated attenuated backscatter (IAB) measurements of the 532 nm laser light backscattered from the ocean surface to estimate the particulate optical depth of the Earth's atmosphere. The particulate optical depth (τP(zs)) of both aerosols and hydrometeors is related to the particulate two-way transmittance () at the range from the receiver, zs, by the relationship . The total (i.e., molecular and particulate) two-way transmittance (T2(zs)) at the ocean surface is the fraction of the lidar light that is returned to the spacecraft receiver after being reflected 180° (i.e., backscattered) from the ocean and is the product of the molecular and ozone two-way transmittances () and the particulate two-way transmittance. The relationship of total two-way transmittance to the surface IAB and backscatter reflectance is represented by Eq. (1).
The attenuated backscatter integrated over the range of the detected surface return is IABsurf, and Rλ(ω,θ) is the ocean surface backscatter reflectance and is an estimate of the integrated backscatter coefficient with units of sr−1 (VR2016) over the range of the ocean surface pulse. The surface backscatter reflectance is modeled as a function of wind speed and viewing angle represented as ω and θ, respectively. Using the relationship , the particulate two-way transmittance can be found using Eq. (2).
Surface IAB estimates are reported by CALIOP's surface detection algorithm, which uses the trapezoid rule to numerically integrate the ocean surface return between the CALIOP-detected top and base altitudes (Vaughan et al., 2017). This approximation of surface IAB can suffer from underestimates of 3 % to overestimates of 2.5 % that arise from discrete integration of a “hard target” return like the ocean surface when recorded by CALIOP's receiver system (see Appendix A). In contrast, ODCOD uses a technique which is largely identical to the method described in VR2016. ODCOD constructs a model that approximates the CALIOP post-detector electronics response to a laser pulse, fits the attenuated backscatter measurements of the surface return to the modeled response shape, analytically integrates the model to solve for the area under the surface return pulse, and calculates the surface IAB.
CALIOP's onboard post-detector electronics employ third-order low-pass Bessel filters located downstream of the detectors in the 532 and 1064 nm channels (VR2016). An important feature of the Bessel low-pass filter is that it preserves the total energy of an incoming pulse. When a narrow lidar pulse enters the filter, its peak amplitude is reduced, but the pulse is transformed in the time-of-flight domain such that the area under the original pulse is preserved. Prior to launch, CALIOP instrument engineers characterized the shape of the Bessel filter response to a laser light pulse passed through the detector system. In laboratory experiments, laser pulses were measured at a sampling rate of 0.1 µs using the CALIOP engineering model receiver electronics and flight-qualified photomultipliers. A CALIOP response model (CRM) was built for ODCOD by fitting these laboratory measurements using a piecewise function consisting of a hyperbolic tangent function for the rising part of the system response and a Gaussian function after the peak to model the non-ideal transient response of the detectors (Hunt et al., 2009), as shown in Fig. 1.
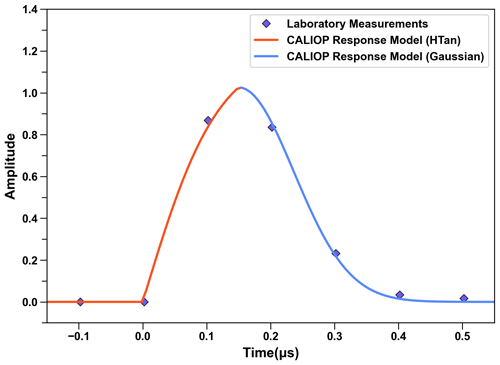
Figure 1The CALIOP CRM derived from laboratory measurements. The purple diamonds show laboratory measurements taken at intervals of 0.1 µs, while the solid red and solid blue lines show the analytic curve fit to the rising signal prior to the peak and the decaying signal following the peak, respectively.
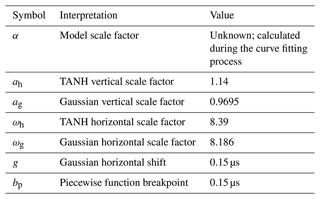
Figure 1 shows the digitizer readings of the laboratory experiments (purple diamonds) plotted as a function of elapsed time from the pulse onset. The CRM is shown as a function of the pulse onset time at t = 0 µs. All values prior to the pulse onset time are set to zero. The hyperbolic tangent part is shown in red and the Gaussian part in blue. The CRM is defined by Eq. (3), where t quantifies the elapsed time between the CRM model pulse onset and the data acquisition time of the measurements of the surface return.
The values listed in Table 1 define the parameters of the CRM.
It is possible to estimate the magnitude of the ocean surface return using ODCOD's CRM because a hard target largely preserves the shape of the laser pulse upon reflection. The reflected pulse is then recorded by the spacecraft receiver, having only been two-way-attenuated by the atmosphere. The Bessel filters modify the shape but preserve the total backscattered energy of the reflected pulse. After passing through the system electronics, digitized samples of the filter response are recorded. CALIOP's onboard sampling rate is 10 MHz, or every 0.1 µs, corresponding to a vertical sampling resolution of 15 m, which is identical to the sampling rate of the laboratory measurements used to build the CRM. However, because CALIOP employs onboard averaging to reduce data storage and downlink size (Hunt et al., 2009), the 532 nm samples acquired between 8.2 km above mean sea level and 0.5 km below are averaged over two onboard vertical bins, yielding a downlink resolution of 30 m. Once averaged, the original onboard samples are discarded, leaving only the averaged measurements for analysis.
Ideally, ODCOD would fit the 15 m ocean surface attenuated backscatter measurements to the 15 m resolution CRM and then integrate the piecewise model to retrieve the area under the CRM. Accomplishing this fit would align the surface return measurements with the model and then scale the model to best fit the measurements, thus solving for the scale factor (α). Unfortunately, implementing this CRM fitting procedure is considerably complicated by CALIOP's onboard averaging scheme. As illustrated in Fig. 2, the average of any two temporally consecutive 0.1 µs points from the CRM (circles lying along the aqua curve) yields a 0.2 µs resolution value (purple diamonds) that does not lie on the CRM. Consequently, applying the fitting procedure described requires a mapping from the CRM into a downlinked CALIOP response model (DCRM) that is defined at the same 30 m resolution as the downlinked data. This derivation of the DCRM from the CRM is given in Eq. (4).
The DCRM is created by averaging the CRM in the exact same way that the 0.1 µs (15 m) digitized samples are averaged aboard the spacecraft to create the downlinked measurements. As illustrated by the orange line in Fig. 2, an especially useful property of the DCRM is that the ratio of any two temporally consecutive samples taken at the CALIOP downlinked sample spacing is unique. While the CRM and DCRM are continuous functions, any single measurement or sample is one of a discrete set at times , where each is a function of some reference sample or measurement time . The relationship of the times is , where Rs is the sampling rate and the measurement index i is the number of measurements from the reference measurement at time . The measurement index may be positive or negative depending on if it falls before or after the reference measurement. Since the DCRM is mapped to the CRM, a sample time of one model also defines the samples on the other. Since the ratio of two consecutive DCRM samples is unique, the time of a selected downlinked reference measurement can be determined from the DCRM without first knowing the DCRM scale factor by ratioing the reference measurement with the following measurement. By locating the time of the ratio along the orange DCRM ratio curve in Fig. 2, is found, and the measurement times of all downlinked measurements can be sampled on the DCRM at their respective times.
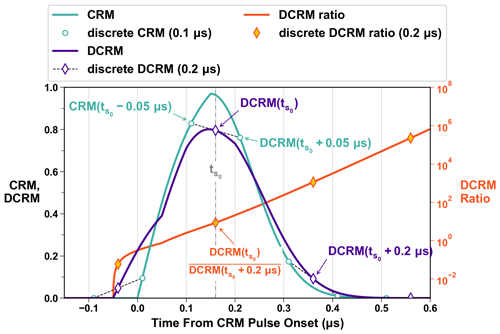
Figure 2The CALIOP CRM (aqua line) with one possible set of discrete samples (circles) and the resulting DCRM (purple) with the downlinked samples (purple diamonds) that result from the discrete samples of the CRM linked (dashed black line). Overplotted on the right axis is the ratio of the DCRM (orange) at time over the DCRM at time with the discrete ratios (orange diamonds). Highlighted by the annotations are the CRM, DCRM, and DCRM ratio for the reference time annotated and marked by the vertical line to show how all three tie together. The notable bend in the purple DCRM curve located at 0.05 µs is due to the sample averaging of the CRM. Since the CRM is zero before the surface onset time, before the DCRM time of 0.05 µs, only the second of the two averaged values is past the pulse onset time. At time 0.05 µs, the second of the two values begins to rise above zero, and the DCRM slope changes accordingly.
Figure 2 shows how two CRM samples, a reference DCRM sample and the ratio of the reference DCRM sample and the next, are all connected by . The aqua curve shows the CRM with a surface pulse onset time at 0 µs. Along the CRM curve, aqua circles mark a discrete set of samples taken at the same 0.1 µs sampling rate as the CALIOP onboard samples. The dashed black lines connect the pairs of the discrete CRM samples that are averaged to create the discrete DCRM samples, which are shown as purple diamonds on the purple curve. The DCRM sample at sample time , annotated by the vertical dashed gray line, shows how the reference DCRM sample time is related to the CRM sample times that make it up as well as the other discrete DCRM samples. As described earlier, the orange curve, plotted on the same time axis but on its own right-side y axis in log scale, shows the ratio of the DCRM reference time (numerator) and the next DCRM sample taken at µs (denominator), where 0.2 µs is the sampling rate of CALIOP's downlinked measurements. The orange diamonds mark the discrete ratios of the discrete samples shown on the DCRM.
The key takeaway from Fig. 2 is that the ratio of two consecutive DCRM samples is unique irrespective of their magnitude. Furthermore, is a function of that ratio, as are all the 's in the surface return. Using the ratio and time relationship as illustrated by the orange curve in Fig. 2, the time of the reference downlinked measurement and thus time of all downlinked measurements in the profile are found. Once the time of the measurements on the DCRM is known, the DCRM can be scaled by α to match the measurement's magnitudes. The CALIOP surface detection algorithm provides the downlinked measurements of attenuated backscatter of the ocean surface. The two largest consecutive measurements of the detected surface return are selected, and the first of the two is chosen as the reference measurement. The ratio of these measurements is compared to ratios of samples of the DCRM until a matching ratio is found to find the reference measurement time. The scale factor is found by minimizing the sum of squared errors (SSE) between the measurements and the aligned DCRM sampled at the measurement times. The relationship of the DCRM to the CRM allows the CRM to be properly scaled. Knowing the CRM scale factor allows the original onboard surface return pulse to be reconstructed and the CRM integrated to retrieve an accurate estimate of the area (ACRM) of the CRM and the surface IAB to be estimated.
With the scale factor determined, ACRM is the integral of the two parts of the CRM scaled by the scale factor, as shown in Eq. (5):
A factor of , where c is the speed of light, is required to convert from the time-of-flight domain area of the CRM to the range from receiver domain of IABsurf. Substituting into Eq. (2) provides Eq. (6).
The ocean surface backscatter reflectance Rλ(ω,θ) is estimated using the technique of VR2016 relating Rλ(ω,θ) to wind speed with a revised version of the ocean surface backscatter reflectance model developed by Lancaster et al. (2005) shown in Eq. (7):
W(ω) is the fraction of the surface covered with whitecaps, Fλ(ω,θ) is the Fresnel retro reflectance of ocean water, and the factor of 0.2 is the estimated Fresnel retro reflectance of ocean whitecaps (VR2016). The whitecap fraction model used by ODCOD is the empirical fit found in Lancaster et al. (2005) but with updated coefficients provided by VR2016 and is estimated by Eq. (8):
ODCOD adopts the estimate of Fλ(ω,θ) as a function of wind speed and off-nadir angle from Josset et al. (2010b). Using a formulation of Fλ(ω,θ) that varies as a function of off-nadir angle is relevant for CALIOP calculations. At launch, the CALIPSO off-nadir angle was fixed at 0.3°. However, in November 2007 the off-nadir angle was increased to 3.0° (Winker et al., 2009), where it remained as the nominal off-nadir angle until the end of the mission. Equation (9) shows the estimate of Fλ(ω,θ) as a function of wind speed and off-nadir angle:
Here, ξλ is the Fresnel coefficient at wavelength λ, which is estimated as 0.0213 at 532 nm (Vaughan et al., 2019), and 〈s(ω)〉2 is the wave slope variance, which is a function of wind speed. While VR2016 used the wave slope variance approximation proposed in Lancaster et al. (2005), ODCOD uses the piecewise approximation developed by Hu et al. (2008). This approximation was chosen because it was developed using CALIOP measurements and AMSR wind speeds and directly relates the two primary quantities used in the ODCOD retrieval and is shown in Eq. (10):
The final requisite inputs to the algorithm are the off-nadir angle, which is known from the spacecraft attitude data, and the horizontal wind speed magnitude at 10 m above the ocean surface, which is obtained from the MERRA-2 model. However, the MERRA-2 10 m winds over the ocean are biased low (Carvalho, 2019) and require a correction to obtain unbiased optical depth estimates. An in-depth discussion of the wind speed bias correction is given in Sect. 2.2.1.
While no attempt is made to report an estimated systematic bias in the ODCOD retrieval, it is pertinent to discuss two potential sources of systematic error related to the CRM and fitting the surface return measurements. The non-ideal transient recovery is an unwanted feature of the CALIOP onboard 532 nm photomultipliers which occurs after very strong backscatter signals (Hunt et al., 2009). This effect is a characteristic of the CALIOP onboard electronics and can be described as a ring in the 532 nm detectors. McGill et al. (2007) explain that, “following a strong impulse signal, such as from the Earth's surface or a dense cloud, the signal initially falls off as expected but at some point, begins decaying at a slower rate that is approximately exponential with respect to time”. However, since only the two largest measurements of the CALIOP-detected surface return are used in the CRM fitting process, the CRM overcomes possible effects from the non-ideal transient recovery as any enhancement in the tail of the return does not affect the scaling of the CRM and thus the estimated magnitude of the surface return.
Another source of systematic error that affects ODCOD retrievals is ocean subsurface scattering. VR2016 show that the 532 nm light is largely extinguished to less than 0.1 % within 45 m below the surface but will make a small contribution to the overall return. Due to the CALIOP onboard electronics system, subsurface scattering will effectively widen the surface pulse but does not introduce a uniform enhancement of the measurements. Some subsurface enhancement will occur in the individual measurements as a function of their respective pulse onset time delays, but fitting only the largest two points of the CRM means the magnitude of any enhancement will vary as a function of time delay. Attempts to correct for subsurface contribution using conventional theoretical corrections as proposed in VR2016 and Josset et al. (2010b) consistently underestimates the IAB, so ODCOD applies no such correction. The failure of the CRM to avoid the subsurface component of the ocean surface return introduces a small systematic error that needs additional study to fully understand and quantify before a correction is attempted.
2.2 Algorithm inputs and random uncertainty
This section examines the necessary inputs to the ODCOD algorithm, their random uncertainty, and how those uncertainties affect the uncertainty estimate of the retrieval. Ancillary inputs are also discussed along with their uses in data filtering.
Applying standard propagation of error (Bevington and Robinson, 1992), the estimated random variance in the ODCOD particulate two-way transmittance is shown in Eq. (11).
The standard deviation of the off-nadir angle is estimated from internal CALIPSO engineering documents as 0.16°, making its contribution to the overall uncertainty approximately 0.01 % of the uncertainty overall. Uncertainty in the MERRA-2 model temperature data used to estimate particulate and ozone two-way transmittance for ODCOD is estimated to be less than 1.5 K (Michele Rienecker, personal communication, 2013). Even assuming a uniform 4 K error in the MERRA-2 temperature profile, the fractional error in the molecular two-way transmittances is less than 0.004. Using this as an estimate of the random uncertainty, the contribution to the overall uncertainty should be less than 0.02 %. As these uncertainties are small compared to that of wind speed and area fit, they are not included in the ODCOD uncertainty estimates. Without the contributions of viewing angle and the molecular and ozone two-way transmittances, Eq. (11) simplifies to Eq. (12).
The two-way transmittance variance due to wind speed is comprised of multiple wind speed terms. Equation (12) is expanded as shown in Eq. (13) through Eq. (16):
The change in wave slope variance as a function of wind speed is derived from Eq. (10), as shown in the three parts of Eq. (17).
The partial derivative of two-way transmittance with respect to area under the CRM is provided by Eq. (18).
Finally, the uncertainty in optical depth can be calculated as
To estimate the variance in the ODCOD particulate two-way transmittance, estimates of the variance in wind speed and area of fitted CRM are required. These are discussed in detail in the next two sections.
From the wave slope variance in Eq. (10) there are two distinct discontinuities in the piecewise function at 7 and 13.3 m s−1. Due to these discontinuities, there are also discontinuities in the analytical estimation of the uncertainty in the optical depths retrieved by ODCOD. These discontinuities can be seen in the 5 km ODCOD estimation of standard deviation calculated by Eq. (19) when binned by wind speed (Fig. 3a).
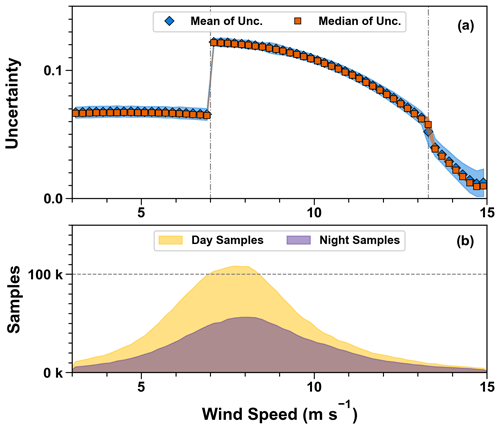
Figure 3Panel (a) shows ODCOD 5 km AOD uncertainty estimate means (blue diamonds) calculated by Eq. (19) with the standard deviation envelope (pale blue) and medians (orange squares) with the median absolute deviation (MAD) envelope (pale orange) binned by wind speed. Gray reference lines at 7 and 13.3 m s−1 coincide with the breakpoints in the wave slope variance model in Eq. (10). Panel (b) shows the number of samples for daytime (yellow) and nighttime (purple). Both panels represent the data for March 2008–February 2011.
Because the median of the distribution of optical depths shown in Fig. 3b is near the discontinuity at 7 m s−1 in Fig. 3a, the distribution of reported uncertainties will be distinctly bimodal. This reduces the utility of the uncertainties reported because retrievals with wind speed values near the discontinuities will make the uncertainty estimate less certain. Nonetheless, extensive comparisons of ODCOD AODs to other data sets demonstrate that, in general, ODCOD uncertainty estimates provide a reliable estimate of the overall random uncertainty in the ODCOD retrieval (Thorsen et al., 2024). Wind speed is the primary quantity to consider in understanding ODCOD's uncertainty estimates. The uncertainty due to ACRM only plays a minor role and is mostly responsible for the smaller fluctuations in the values in Fig. 3a but is valuable in separating CRM fitting errors from neighboring quality retrievals.
Figure 4 shows the same retrievals as Fig. 3 but binned by optical depth. The results of the bimodal distribution are seen in Fig. 4a and cause separation of the means and medians. Figure 4b shows that, generally, the median wind speeds fall between 5 and 8 m s−1, with only AOD values below zero and above about 1.1 being much outside this wind speed range. Figure 4c shows that the majority of ODCOD AOD retrievals fall below 0.5 optical depths.
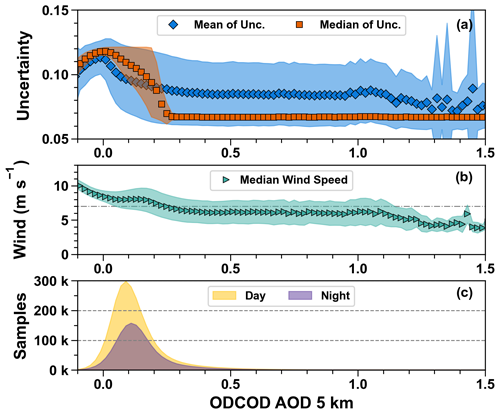
Figure 4Panel (a) shows ODCOD 5 km AOD uncertainty estimate means (blue diamonds) calculated by Eq. (19) with the standard deviation envelope (pale blue) and medians (orange squares) with the median absolute deviation (MAD) envelope (pale orange) and binned by ODCOD 5 km AOD. Panel (b) shows the median wind speed with the MAD envelope for the same data in panel (a) with a gray reference line at 7 m s−1. Panel (c) shows the number of samples in daytime (yellow) and nighttime (purple). All panels represent the data for March 2008–February 2011.
The increase in the median wind speeds for AOD near and below zero and the crossing of the means and medians of the uncertainties are mostly due to the sampling bias caused by detector saturation by the surface return. More specifically, since ODCOD retrievals are not performed for saturated surface returns and surface saturation occurs more frequently at lower wind speeds and lower optical depths, the returns that do qualify for quality ODCOD retrieval will have systematically higher wind speeds when optical depths are low. This surface-saturation sampling bias is discussed in more detail in Sect. 3.1.1.
In the CALIOP data products, ODCOD random uncertainty estimates are reported according to Eq. (19). In general, when filtered for wind speeds between 3 and 15 m s−1, ODCOD AODs have an uncertainty on the order of 0.11 ± 0.01 (75 ± 37 % relative) day and night. For the distribution of wind speeds found in nature, there will be a bimodal distribution of uncertainty estimates due to the mathematical propagation of errors of a piecewise model. Optical depths retrieved in profiles with wind speeds below 7 m s−1 will have a tight distribution around 0.065, and those with wind speeds above 7 m s−1 will have a wider distribution around 0.12.
2.2.1 Wind speed
Wind speed is the largest source of random uncertainty and a probable source of systematic error in the ODCOD algorithm; however, MERRA-2 does not provide uncertainty estimates for wind speed. Consequently, a global wind speed random uncertainty estimate is derived for ODCOD based on the available literature applicable to the ODCOD wind speed inputs. According to Archer and Jacobson (2005), “the global average 10 m wind speed over the ocean from measurements is 6.64 m s−1”. Similarly, Wentz et al. (2005) report a maximum standard deviation of Advanced Microwave Scanning Radiometer for Earth Observing System (AMSRE) wind speeds relative to ocean buoy measurements of less than 1.00 m s−1. An estimate of relative wind speed standard deviation is derived from these measurements as = 1.00 m s−1/6.64 m s−1 ≈ 0.151.
In addition to random uncertainties, possible systematic biases in the MERRA-2 winds at 10 m above the ocean surface must be considered. A low wind speed bias of −0.5 m s−1 will cause a high bias of approximately 0.02 in an ODCOD optical depth. Compared to buoy and other in situ measurements, Carvalho (2019) found a low bias in MERRA-2 winds from −0.16 to −0.83 m s−1 over ocean. Similarly, the authors' internal investigation found a similar bias of −0.52 ± 0.53 m s−1 (global average).
To assess potential biases in MERRA-2 wind speeds, medium frequency 10 m surface wind speeds reported by AMSRE aboard the NASA Aqua satellite and the Advanced Microwave Scanning Radiometer 2 (AMSR2) aboard the Global Change Observation Mission – Water (GCOM-W1) were analyzed. The AMSR data sets were chosen due to the respective spacecraft's approximately 90 s separation from the CALIPSO spacecraft. Their proximity allows for near-instantaneous coincident measurements between CALIOP and the AMSR instruments. AMSRE data from June 2006 to 4 October 2011 and AMSR2 data from May 2012 through December 2020 were used. The AMSRE and AMSR2 instruments are very similar in design, and no bias between their wind speed estimates was noted by a search of the available literature at the time of ODCOD development. The data sets were aggregated and collocated to the 333 m CALIOP footprint and compared to the GMAO MERRA-2 10 m surface wind speeds retrieved from the inst2d_met data parameters (GMAO, 2015c) reported in the CALIOP LL2 V4.51 data products. The median wind speed differences between the AMSR instruments and the MERRA-2 reported wind speeds were calculated for each month. Lookup tables were generated consisting of wind speed ranges from 1 to 41 m s−1 in 3 m s−1 increments. Each table is a three-dimensional lookup table comprised of 1° latitudes from 82° S to 82° N, 2° longitudes and month of the year for the respective wind speed range. Each grid box in the lookup table is required to have a minimum of five observations. If enough data were not available for any given grid box, the data were re-binned onto larger-sized grids until the minimum data requirement was met. This additive bias correction is applied to the MERRA-2 wind speed data and produces a more AMSR-like wind estimate.
Figure 5 shows the median corrections applied to the MERRA-2 wind speeds between 3 and 15 m s−1 used in ODCOD 5 km AOD retrievals and illustrates that in nearly all regions an addition is required to correct the low bias in MERRA-2 winds.
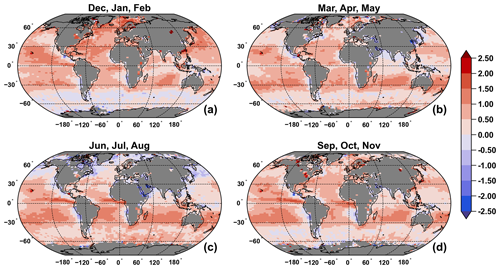
Figure 5MERRA-2 wind speed corrections applied to wind speeds between 3 and 15 m s−1 used in ODCOD 5 km AOD retrievals for each of the four seasons, March 2008 through February 2011.
To estimate the random uncertainty in the derived correction, analysis of the means and standard deviations in the AMSRE and AMSR2 data finds the mean relative standard deviation for the correction factors as = 0.2537. Since the correction factor is additive, the overall relative uncertainty in the wind speeds used for ODCOD is estimated by Eq. (20):
The variance is , where CA is the AMSR-derived wind speed bias correction.
Within the ODCOD algorithm, wind speed is also used as a filtering criterion. Profiles where the wind speed falls outside of the inclusive range (0.025–43) m s−1 are not attempted.
2.2.2 Surface return area
Another source of random uncertainty in the ODCOD algorithm comes from fitting the measured values of the surface return signal to the DCRM. This uncertainty arises from random noise in the measurements. The variance in the area is estimated from the differences between the surface return measurements and the fit DCRM samples. Since the area is the integral of the CRM multiplied by the scale factor determined by the retrieval, the variance of the area is given by Eq. (21).
The constants Ch and Cg are the integrals of the hyperbolic tangent and Gaussian portions of the CRM, respectively. The variance of the scale factor is the mean squared error of the fit of the measured points of the ocean surface to the DCRM.
2.2.3 Additional screening inputs
Other inputs to the algorithm include the depolarization ratio of the surface return, the negative signal anomaly flag, and the surface-saturation flags found in the CALIOP data products. ODCOD requires the surface depolarization ratio to be below 0.15 for a retrieval to be attempted. This threshold is meant to ensure that any retrievals from the ocean with significant sea ice or surface debris are not attempted (Lu et al., 2017). This threshold may also filter out some shallow water cases where ocean bottom return could contaminate the retrieval. Surface depolarization ratios are reported for all surfaces detected in the CALIOP V4.51 LL2 data products.
Other considerations are the negative signal anomaly (NSA) and surface saturation. The NSA occurs when an unusually large negative signal is measured in a range bin immediately preceding a very large positive backscatter return from a strongly scattering target such as Earth's surface (Tackett et al., 2018). Since it cannot be determined whether the NSA belong to the surface return or to the atmospheric return immediately above, ODCOD retrievals are not attempted when these events occur. Similarly, no retrieval is attempted where surface saturation is indicated by the surface-saturation flags. Surface saturation occurs when the magnitude of the signal received by the lidar detectors exceeds the maximum value the detectors can accurately measure. Surface saturation would lead to an improper fit of the CRM and a bias in the estimate of the surface IAB. Saturated surfaces are identified when the surface-saturation flags reported in the LL1 product indicate surface saturation or possibly saturated. However, onboard averaging makes complete detection of saturation difficult, so additional quality filtering is recommended.
2.3 ODCOD output products
CALIPSO V4.51 LL2 data products report 532 nm ODCOD full-column optical depth estimates and uncertainties at 333 m, 1 km, and 5 km resolution as well as the MERRA-2 10 m wind speed components, the wind speed correction values, and an ODCOD quality control (QC) flag. To calculate the wind speed used by ODCOD from these data products, a user must calculate the wind speed magnitude from the components and add the reported correction value.
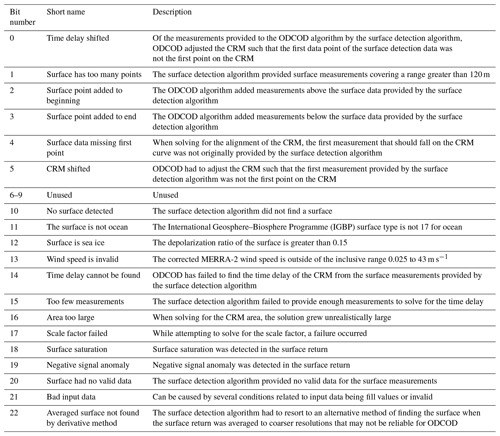
The ODCOD QC flag is a 32-bit unsigned integer where each bit used has a specific meaning, as described in Appendix B. The flag is designed such that when interpreted as an integer value, any QC flag value below 64 is an attempted retrieval and the data could conceivably be used, although further quality filtering as described in Sect. 3.1.1 should be considered.
In this section ODCOD retrievals are assessed by restricting profiles to cloud-free, aerosol-only optical depths (AOD) compared to collocated AOD measurements acquired by airborne High Spectral Resolution Lidar (HSRL) measurements and to seasonally averaged AOD from two independent satellite-based retrieval techniques. To facilitate comparisons that are meaningful for scientific interpretation, data quality filtering is applied to each of the data sets to exclude suspected poor quality and anomalous data. The data selection procedure is described first for all data sets in Sect. 3.1, followed by the comparison analysis in Sect. 3.2.
3.1 Data selection
Unless otherwise stated, all ODCOD data in the comparisons in Sect. 3.2 are from March 2008 through February 2011 and are the latest version 4.51 lidar level 1 (LL1) and V4.51 LL2 data products.
3.1.1 ODCOD data selection
To assess ODCOD AOD retrievals, profiles in which CALIOP has not detected clouds at any resolution are selected. This is important because ODCOD always provides a full-column optical depth estimate with no way to isolate contributions from different feature types within the vertical profile. To select the highest-quality ODCOD retrievals, the limitations of the ODCOD models and the CALIOP instrument are considered to guide filtering criteria. Unless otherwise stated, the following data quality filters are applied to all data in the comparisons in this paper. Selecting retrievals within the AMSR-corrected wind speed range 3–15 m s−1 avoids less confident ocean backscatter reflectance estimates; to minimize potential contamination by saturated samples, require daytime 532 nm surface integrated attenuated backscatter (SIAB) < 0.0413 sr−1 and nighttime SIAB < 0.0353 sr−1; and to better reject sea ice and contamination by seafloor backscatter in shallow waters, require 532 nm surface integrated depolarization ratio (SIDR) < 0.05.
Requiring wind speeds to fall inside 3–15 m s−1 will retain approximately 91 % of retrievals and provide ocean reflectivity estimates where the reflectivity model is mostly in the less complex ocean water regime. Only a small fraction of the total reflectivity will be attributed to white caps with a maximum of ∼ 20 % at 15 m s−1.
The ODCOD ocean surface reflectance model, described by Eq. (7) and shown in Fig. 6, increases rapidly when the wind speed drops below 3 m s−1. The large change with small variations in wind speed makes the estimate of surface reflectivity below 3 m s−1 less certain. Filtering profiles with wind speeds less than 3 m s−1 removes on the order of 7 % to 8 % of profiles and avoids highly variable surface reflectivity estimates. As wind speeds increase much above 8 m s−1, the contribution of whitecaps to ocean reflectance increases. Because instantaneous white cap reflectivity is known to be a complex amalgam of multiple factors in addition to wind speed (Dierssen, 2019), ODCOD's ocean surface reflectivity estimate becomes increasingly less certain at higher wind speeds due to a larger contribution from the whitecap reflectance. Filtering profiles with wind speeds greater than 15 m s−1 removes on the order of 1 % to 2 % of retrievals and avoids surface reflectivity estimates with large contribution from whitecaps.
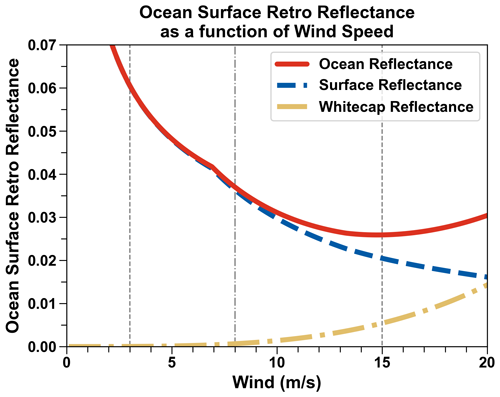
Figure 6The ODCOD ocean surface retro reflectance model at 532 nm and off-nadir angle of 3° as a function of wind speed with markers at 3, 8, and 15 m s−1 as reference for possible filter thresholds.
ODCOD does not attempt a retrieval when the CALIOP surface-saturation flags show saturated or possibly saturated surface data. However, because of CALIOP's onboard averaging, single 15 m range bins that are saturated can still go undetected. In this study, profiles with SIAB > 0.0413 sr−1 in the daytime and > 0.0353 sr−1 in the nighttime are filtered out, which removes approximately 20 % of ODCOD profiles day or night but captures capture approximately 98 % of profiles in which surface saturation has been flagged by level 1 processing (Fig. 7). The upper panels of Fig. 7 show distributions of SIAB versus wind speed for aerosol-only profiles having valid ODCOD retrievals. The lower panels show SIAB versus wind speed for surface-saturated cloud-free profiles for which no ODCOD retrieval was attempted. The horizontal red lines seen in all four panels represent the SIAB threshold above which ODCOD retrievals are considered less confident due to possible undetected surface saturation.
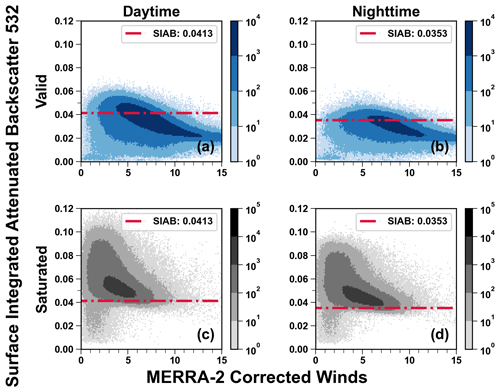
Figure 7Panels (a) and (b) show SIAB at 532 nm as a function of wind speed for CALIOP-determined aerosol-only 5 km ODCOD valid retrievals for daytime (a, c) and nighttime (b, d) measurements; distributions on panels (c) and (d) show SIAB as a function of wind speed for surface-saturated aerosol-only 5 km profiles for which ODCOD retrievals are not attempted. The dashed red line shows the proposed thresholds for day and night.
The magnitude of the surface return signal that will saturate the detectors is different in the day and night due to the difference in CALIOP variable gain amplifier settings (Hostetler et al., 2005). High, and highly variable, solar background signals during daytime operations dictate the use of lower amplifier gains to minimize digitizer overflows in the daytime measurements. Daytime gains are lower by a factor of approximately 6.5, which accounts for the difference in the day and night SIAB thresholds and explains why different distributions can be seen day (Fig. 7a and c) and night (Fig. 7b and d). On the order of 27 % of daytime aerosol-only profiles over ocean are rejected for ODCOD retrieval due to flagged surface saturation, and that number increases to 43 % at night. Using the median and MAD of the SIAB distribution of saturated profiles shown in Fig. 7c and d, the thresholds for the SIAB filter are calculated from the median of the SIAB (0.0543 daytime and 0.0457 nighttime) minus 2 times the MAD.
ODCOD retrievals are not attempted when the SIDR is greater than 0.15 to avoid retrievals over ocean covered by ice. However, small amounts of sea ice, surface debris, and ocean bottom returns in shallow water are all places where the SIDR might be elevated and the ODCOD retrieval would be attempted but may be lower in confidence. In this study, profiles with SIDR greater than 0.05 are also filtered out. This threshold removes 1 % to 2 % of the ODCOD profiles. Figure 8 shows the distribution of SIDR for CALIOP-determined aerosol-only profiles for valid ODCOD retrievals as a function of wind speed.
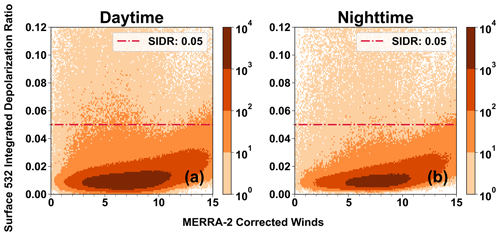
Figure 8SIDR as a function of wind speed for CALIOP-determined aerosol-only 5 km ODCOD valid retrievals in daytime (a) and nighttime (b) with the SIDR filtering threshold of 0.05 marked with a dashed red line.
Figure 8 shows a tight distribution of SIDR values around the median of approximately 0.01 for valid aerosol-only ODCOD retrievals. The 0.05 SIDR threshold is used to remove the larger outliers from the distribution.
3.1.2 Airborne HSRL data selection
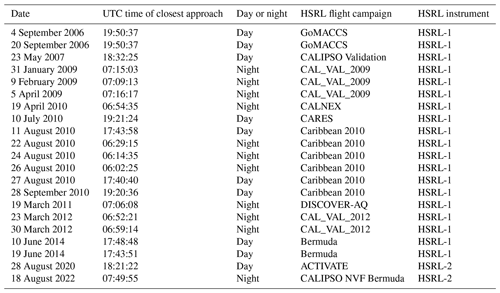
To assess how well ODCOD performs relative to airborne HSRL measurements, ODCOD 5 km AOD retrievals are compared to collocated AODs measured by Langley Research Center's High Spectral Resolution Lidar (HSRL-1) (Hair et al., 2008) and High Spectral Resolution Lidar version 2 (HSRL-2) (Burton et al., 2018; Ferrare et al., 2023). The HSRL instruments provide high-quality atmospheric measurements from high-altitude aircraft. HSRL-1 and its successor HSRL-2 have been operating in various field campaigns since 2006. The dates and HSRL field campaigns during which these CALIPSO underflights occurred can be found in Appendix C.
The comparison data are selected from 152 CALIPSO underflights conducted by the Langley Research Center HSRL team. The selection process is performed by considering the time and distance of each measurement to the coincident CALIPSO overpass 5 km footprint. The selection criteria require the HSRL measurement and associated ODCOD 5 km retrieval midpoint to have a time difference of less than 60 min and a spatial offset of less than 5 km. ODCOD 5 km profiles are chosen because the ocean surface attenuated backscatter measurements are averaged horizontally before the ODCOD retrieval is performed, providing a more consistent retrieval over the scene. The ODCOD filters described in Sect. 3.1.1 for aerosol-only profiles are applied. Once collocated and filtered, a minimum of four matching ODCOD 5 km retrievals are required in the flight. To ensure that both instruments are measuring the same aerosol loading, it is further required that no aerosol layers be reported in CALIOP's LL2 vertical feature mask above the HSRL data top altitude (approximately 8.5 km) of the matching points. Due to the locations of available underflights that satisfy these conditions, the scenes used occur exclusively in the North American and Venezuelan basins of the Atlantic Ocean, as shown in Fig. 9.
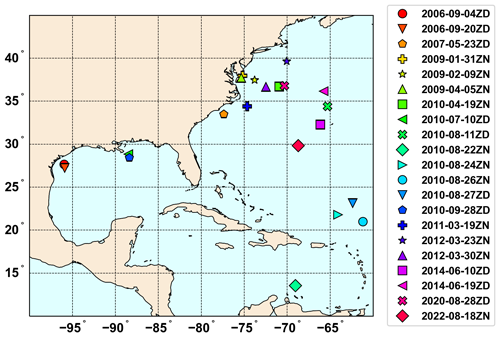
Figure 9Locations of the HSRL underflights used in the comparisons to ODCOD 5 km. Marker legend labels denote the approximate CALIPSO overpass time, and the D or N at the end denotes a daytime or nighttime overpass.
The HSRL processing calculates AOD for a given profile directly from the measured molecular channel and estimated molecular backscatter coefficients of the atmosphere computed from reanalysis model temperature and pressure data (Hair et al., 2008). Rogers et al. (2009) compared HSRL profiles of aerosol extinction and AOD results to established measurements and found agreement within 0.01 km−1 for extinction and 6 % for AOD (532 nm). Sawamura et al. (2017) also found that HSRL-2 532 nm AODs agree well with ground-based AERONET measurements, having correlation coefficients of approximately 0.98. The HSRL aircraft generally fly at approximately 9 km, so when comparing AODs it is important to consider attenuation above the altitude at which the HSRL measurements begin. Even if no layers are detected by CALIOP above the aircraft, there are still undetected background particulates (e.g., stratospheric aerosols), and thus the HSRL AOD measurements are expected to be slightly lower than the estimates from ODCOD.
To correct for the AOD from undetected particulates above the aircraft, the CALIOP profile measurements in the stratosphere and upper troposphere are used to estimate a background particulate optical depth for each scene. This process is initiated by averaging the CALIOP level 1 532 nm attenuated backscatter profiles over a 240 km along-track segment (720 single-shot profiles) centered above the aircraft. For each level 1 profile, any range bins identified as containing clouds or aerosols in the CALIOP level 2 analyses are excluded from the average, as are all range bins at lower altitudes. A Fernald retrieval (Fernald et al., 1972), coupled with an a priori stratospheric aerosol lidar ratio of 50 sr (Kar et al., 2018), is then used to derive a profile of aerosol extinction coefficients. Integrating this extinction profile from 30.1 km (i.e., the uppermost altitude in the CALIOP level 2 profiles) down to the aircraft altitude yields estimates of the overlying AOD due to background aerosols in the stratosphere and upper troposphere. Using a lidar ratio of 50 sr provides a median AOD correction of 0.018 ± 0.005 with a median HSRL data top altitude of 8.54 ± 0.18 km. In contrast, using a lidar ratio of 28.75 sr (Kim et al., 2017) would provide a median correction of 0.009 ± 0.003, which sets the lower bound on the uncertainty in this correction estimate.
The HSRL AOD measurements are adjusted in these HSRL and ODCOD comparisons by adding the estimated background AOD above the aircraft. Each HSRL measurement is matched to the closest in distance ODCOD 5 km retrieval and averaged to provide one HSRL comparison value and a standard deviation for each ODCOD 5 km estimate. The results of the comparisons are presented in Sect. 3.2.3.
3.1.3 MODIS data selection
To assess how well ODCOD performs on a global scale, ODCOD 5 km AOD retrievals are compared to collocated and interpolated MODIS AODs reported in MODIS MYD04 (Levy and Hsu, 2015). The collocations are determined by the Collopak software suite provided by the University of Wisconsin (Nagle and Holz, 2009) and utilize CALIPSO's version 4.51 LL1 and LL2 products, the Collection 6.1 MODIS MYD03 1 km product, and the Collection 6.1 MODIS MYD04 10 km product. The data found in the MODIS science data set (SDS) Effective_Optical_Depth_Average_Ocean at wavelengths 470 and 550 nm are interpolated in latitude and longitude to the midpoint of each ODCOD 5 km sample and in wavelength to 532 nm. MODIS only uses cloud-free pixels for the optical depth estimates, so no further cloud screening is applied for the MODIS data. The MODIS quality assurance ocean SDS is used for MODIS data quality screening. This SDS is a 5-byte composite informational flag that includes a retrieval quality assurance confidence (QAC) flag and a quality assurance usefulness (QAU) flag (Levy et al., 2009). The possible QAC flag values are 0 to 3 and indicate confidence levels that are poor, marginal, good, and very good, respectively. The QAU flag values can be either 0 or 1 and indicate not useful and useful data. MODIS data are chosen such that the QAC flag is marginal or better and the QAU flag indicates a useful retrieval (Levy et al., 2009). The ODCOD filters described in Sect. 3.1.1 for aerosol-only profiles are also applied. All data are compared one to one such that both data sets require a valid retrieval to be used. The results of the comparisons are presented in Sect. 3.2.4.
3.1.4 SODA data selection
To assess ODCOD's performance relative to another established method of estimating optical depth from the ocean surface return, ODCOD single-shot (333 m) AOD retrievals are compared to corresponding Synergized Optical Depth of Aerosols (SODA) retrievals. While similar, there are some distinct differences between the algorithms. SODA CPR (Cloud Profiling Radar) uses the surface return from CALIOP, the surface return from CloudSat's CPR, and the wind speeds from AMSRE to make a multi-instrument estimate of the total column effective optical depth (Josset et al., 2008, 2012). SODA also implements an additional procedure to correct lidar and radar calibration biases. Using only nighttime lidar profiles having total atmospheric integrated attenuated backscatter of 0.1 sr−1 or less (i.e., exceptionally clear skies), SODA constructs fourth-order polynomials linking the radar normalized surface scattering cross section to the lidar ocean integrated attenuated surface backscatter (Josset et al., 2010a, 2015). These polynomials are constructed on a monthly basis and then used to identify lidar and radar calibration biases by flagging those clear air data segments for which the lidar and/or radar measurements do not lie sufficiently close to the polynomial fit. SODA computes the surface signal magnitude by integrating the attenuated backscatter signal over a fixed range about the ocean surface, from a variable upper limit of two bins above the ocean surface peak signal to a fixed lower limit at CALIOP range bin number 572. Typically, these limits span altitudes from 0.053 to −0.277 km when CALIOP is pointed 3° off nadir and 0.058 to −0.272 km when CALIOP is pointed 0.3° off nadir. Because the integration extends below the ocean surface, the SODA technique also applies a subsurface correction to estimate and remove scattering contributions from phytoplankton and other in-water suspended particulate matter. These algorithm differences introduce different uncertainties and systematic biases into the SODA results from those found in the ODCOD retrievals. SODA 333 m version 2.30 and 2.31 was compared with ODCOD 333 m retrievals using the ODCOD filters described in Sect. 3.1.1 for aerosol-only profiles. Since SODA and ODCOD use the same CALIOP profiles, no collocation is necessary. The SODA scene flag and QA flag SDSs are informational and quality assurance flags reported in the SODA data products. They are used to retain only (a) valid scenes (b) located over ocean that (c) are wholly free of sea ice and for which the surface signals (d) are not close to the total attenuation threshold and (e) are not saturated in either 532 nm channel, (f) CloudSat data are not missing, (g) AMSR data are not missing, and (h) AMSR sea surface temperature and liquid water path are valid. All data are compared one to one such that both data sets require a valid retrieval to be used in the analysis. The results of the comparisons are presented in Sect. 3.2.5.
3.2 Results
This section reports comparisons of daytime and nighttime ODCOD 5 km retrievals to one another, comparisons of ODCOD retrievals at different averaging resolutions, comparisons to the measurements acquired by the NASA LaRC airborne HSRL instrument, and comparisons to MODIS and SODA retrievals. The section concludes with a summary of all comparisons done in this section.
3.2.1 ODCOD
The near-global coverage of ODCOD for both day and night provides an opportunity for studying the regional distribution of aerosol optical depths. Figures 10 and 11 show seasonal 5 km ODCOD AODs in profiles filtered as described in Sect. 3.1.1. Qualitatively, elevated values exist in regions where high aerosol loading is expected: in the tropical Atlantic Ocean during June–August, consistent with Saharan dust outflow (e.g., Ridley et al., 2012); over the northern Pacific Ocean during March–May, consistent with Asian dust outflow (e.g., Liu et al., 2013); and off the southwest Africa coast during September–November, consistent with outflow of smoke from biomass burning (e.g., Sinha et al., 2004; Yu et al., 2012).
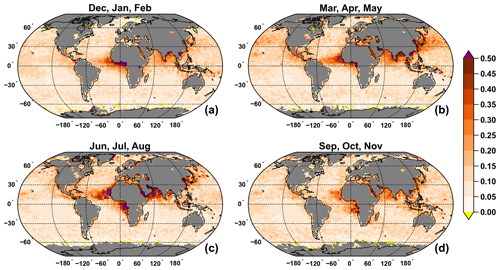
Globally, the average optical depth reported by ODCOD is higher at night compared to the day (Fig. 12). This is in part due to the sampling bias caused by the greater occurrence of surface saturation at night, which in turn is due to differences in CALIOP's daytime and nighttime detector gains (Hunt et al., 2009). Surface saturation occurs preferentially in low-optical-depth scenes because the laser light is not as attenuated and thus a stronger reflection from the ocean is returned. The average nighttime optical depth is higher because the lower-optical-depth columns are not represented. The median gridded optical depth difference is on the order of 0.03 ± 0.07 higher at nighttime with a relative difference of around 22 % globally and a 95 % confidence interval for night minus day of approximately 0.026. Regionally some differences are much greater.
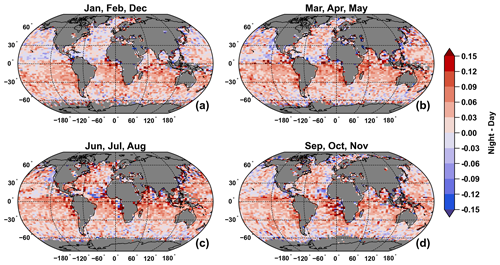
Figure 12Nighttime median minus daytime median seasonal ODCOD aerosol optical depth differences, March 2008 through February 2011.
While some of the day–night AOD difference could be due to true natural variation in daytime versus nighttime aerosol loading or an unaccounted-for bias in the wind speed data from day to night, a large portion is due to this saturated surface sampling bias, which is especially acute when averaging cloud-free columns. The absence of solar background noise during nighttime observations allows optically thin clouds to be detected much more often at night. This will also cause a sampling bias when attempting to study aerosol-only profiles because fewer profiles in general will be considered aerosol-only at night and more clouds will go undetected in the daytime (Liu et al., 2019).
Figure 12 shows regional 5 km ODCOD nighttime median minus daytime median AOD differences. The data for Fig. 12 have been filtered as described in Sect. 3.1.1 with separate SIAB thresholds used for day and night.
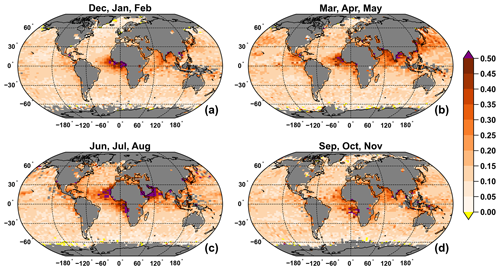
To demonstrate the impact of the surface-saturation sampling bias, the surface-saturation filter described in Sect. 3.1.1 is experimentally modified in Fig. 13 to use the nighttime SIAB threshold of 0.0353 sr−1 for both day observations and night observations. It is important to understand that by applying the same SIAB threshold filter, good-quality low-optical-depth daytime data will be removed. However, if the retrieval were from a nighttime scene, the surface return would likely be saturated. Since these removed profiles will no longer be represented in the average, a more nighttime-like distribution of daytime retrievals is sampled.
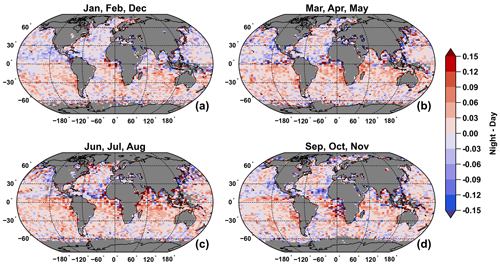
Figure 13Nighttime median minus daytime median seasonal ODCOD aerosol optical depth differences with daytime SIAB filter applied to both day and night, March 2008 through February 2011.
The median night minus day differences for the experimentally filtered data (Fig. 13) show that the difference drops to 0.010 ± 0.006, or about 7 % relatively. A slight difference is still found between night and day, but the 95 % confidence interval drops to approximately 0.004 to 0.005. This experiment confirms that the sampling bias from surface-saturation differences for day and night is a major contributor to the day to night differences in ODCOD retrievals.
It is worth noting that solar background noise could introduce another source of day–night bias. In columns with high particulate optical depths, detection of the surface returns used by ODCOD requires distinguishing a strongly attenuated surface peak from the ambient background noise. In cloud-free skies over oceans, CALIOP's daytime signal-to-noise ratio (SNR) is, conservatively, a factor of 6 lower than at night, resulting in a much broader daytime background noise envelope in the region of tenuous surface returns. This large noise enhancement impedes the detection of attenuated surface peaks and thus truncates the high end of the daytime ODCOD distribution at a substantially lower value than at night. However, the fraction of ODCOD aerosol-only profiles that have an optical depth greater than 1.0 at both day and night is less than 0.1 %, and they thus have little effect on AOD statistics.
3.2.2 ODCOD at different spatial averaging resolutions
ODCOD is reported in the CALIOP LL2 data products at the standard CALIOP horizontal averaging resolutions of single-shot (333 m), 1 km, and 5 km resolutions. For the coarser-resolution products (1 and 5 km), the retrieval is applied to the surface return detected in the horizontally averaged level 1 profiles. Because the position of the ocean surface is relatively constant from shot to shot, this average-then-retrieve approach is expected to increase the SNR of the surface return data and hence yield more confident fits of the DCRM to the surface data points. A retrieve-then-average schemes can offer an alternative to the average-then-retrieve approach. However, care must be taken not to bias the estimate by assuming missing retrievals are like surrounding retrievals or worse an optical depth of zero. A common reason for a missing ODCOD retrieval is no surface return detected due to high optical depths. Assuming a value for these missing retrievals will bias the average.
Figure 14 shows a daytime and nighttime scene selected for having many consecutive AOD ODCOD retrievals with filtering according to Sect. 3.1.1.
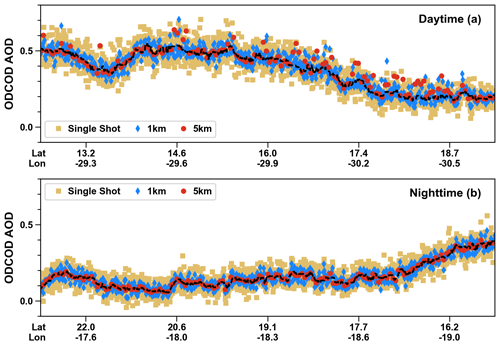
Figure 14ODCOD retrievals of AOD profiles as determined by CALIOP at single-shot (333 m) (yellow squares), 1 km (blue diamonds), and 5 km (red circles) resolutions for a daytime and nighttime scene in panels (a) and (b), respectively, with the sliding window fit in dashed black. The daytime scene is over the international atomic times 15:33:30 to 15:35:24 on 5 May 2008, and the nighttime scene is over the international atomic times 03:08:19 to 03:10:18 on 28 May 2008.
In general, the retrievals show that 5 km retrievals display less variability and fall on top of the 1 km retrievals, which are again less noisy and fall on top of the single-shot retrievals. After applying a 31-profile sliding window fit to the single-shot data, the noise for each resolution is estimated by calculating the mean squared error (MSE) between the fit (dashed black line, Fig. 14) and the data for each resolution. In the daytime, the estimated MSE for single-shot, 1 km, and 5 km is 0.0031, 0.0016, and 0.0024, respectively. In this scene, the effects of the solar background radiation can be seen from the larger spread of the data compared to night. The MSE at 5 km is worse than the 1 km due to the occasional outliers of the retrieved optical depth at coarser resolutions from the neighboring retrievals. These deviations occur due to poor fit of the measurements to the CRM. The poor fit is due to averaging of neighboring profiles which do not have the same altitude bin registration (Hostetler et al., 2005). Differences in altitude registration yield surface returns with peak altitudes that can be shifted up or down relative to one another in the vertical column. Averaging these mismatched profiles thus distorts the true shape of the mean surface signal. The estimated MSE for nighttime single-shot, 1 km, and 5 km resolutions are 0.0020, 0.00078, and 0.00015, respectively, and show over an order of magnitude improvement between the single-shot and 5 km resolutions.
3.2.3 Comparisons to airborne HSRL
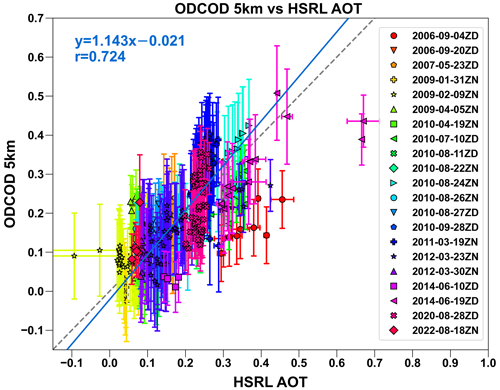
In general, ODCOD 5 km retrievals show little to no bias compared to HSRL aerosol optical depth retrievals when day and night are considered together. The median difference is 0.009 ± 0.043 (6 ± 28 % relative difference; N = 395), with ODCOD higher than the HSRL and a correlation coefficient of 0.724 and a 95 % confidence interval for the mean difference of −0.005 to 0.014. Separately, ODCOD estimates are relatively lower in the daytime and relatively higher at night than the HSRL but with uncertainties larger than the difference in either. The median difference in the daytime is −0.037 ± 0.052 (−12 ± 25 %; N = 149), with ODCOD lower than the HSRL and a correlation coefficient of 0.775. The median difference at night is 0.021 ± 0.032 (14 ± 25 %; N = 246), with ODCOD higher than the HSRL and a correlation coefficient of 0.721.
Figure 15 shows the collocated and quality-filtered 5 km ODCOD AOD retrievals as a function of the corresponding adjusted HSRL AOD measurements from the 21 CALIPSO underflights that met the selection criteria outlined in Sect. 3.1.2. The adjusted HSRL data are mean values computed over the ODCOD 5 km averaging interval, with the standard deviations shown as the error bars. The ODCOD error bars are the ODCOD uncertainty estimates reported in the LL2 data products. Spatial and temporal collocation differences will introduce some uncertainties into these one-to-one comparisons. Nevertheless, Fig. 15 shows that while there are differences, when considered over multiple flights and during both day and night, there is relatively strong agreement between ODCOD and the HSRL measurements even over a variety of optical thickness scenes.
3.2.4 Comparisons to MODIS
In general, the global median difference between ODCOD 5 km daytime retrievals and MODIS interpolated 532 nm AOD is −0.009 ± 0.041 (8 ± 35 %; N = 1 999 068), with ODCOD lower than MODIS and with a correlation coefficient of 0.834. Regionally, ODCOD tends to report higher aerosol optical depths in the southern oceans from March through August and seems to show lower optical depths in December through February. ODCOD also tends to report higher aerosol optical depths north of 30° N from September through February, but the difference is less during March through August.
Table 2 and Fig. 16 show how ODCOD 5 km daytime estimates compare to MODIS retrievals for data acquired by both instruments from March 2008 through February 2011.
Table 2Statistics summarizing the comparison results. Each row summarizes the seasonal sets of months designated by the first letter of the months in question, such as December, January, and February as DJF, with the final row labeled “Yearly” as the total statistics for all data from March 2008 through February 2011.

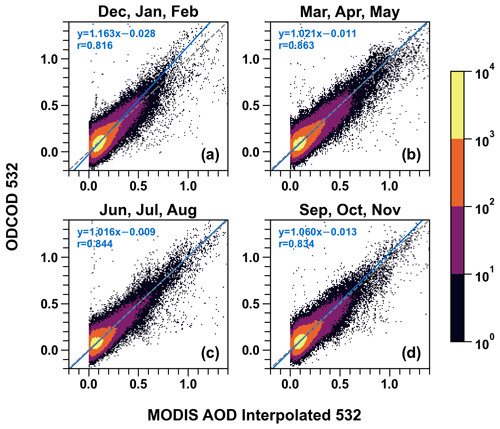
Figure 16Collocated ODCOD aerosol optical depth at 5 km resolution on the y axis and MODIS effective optical depth average ocean collocated and interpolated in latitude, longitude, and wavelength to the midpoint of the CALIOP 5 km profile and 532 nm wavelength, March 2008 through February 2011.
Unlike ODCOD, which permits negative optical depths, the MODIS algorithm reports an optical depth of zero when the observed top of the atmosphere signal is not greater than or equivalent to the Rayleigh plus surface signal. While negative optical depths are non-physical, they arise due to random noise in the original CALIOP measurements and thus should be retained when computing statistics. Since excluding them will introduce additional biases when estimating means, medians, and correlations, MODIS AOD retrievals that report zero are included in these comparisons but will bias MODIS higher compared to ODCOD, which permits negative values.
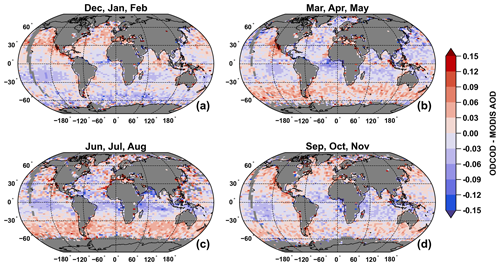
The maps in Fig. 17 provide seasonal differences between daytime AOD retrieved by MODIS and 5 km ODCOD. The data are the same as those shown in Fig. 16, with the difference of the medians of each bin presented regionally. Figure 16b and c show notable differences, with ODCOD higher than MODIS on the order of 0.03 to 0.06 in the Southern Ocean from March through August. These differences largely disappear from September through February. For all regions, it is also important to consider data filtering in the results. While cloudy pixels are screened by the MODIS algorithm and ODCOD has been screened for clouds along the 5 km track, regions where thin cirrus clouds are frequently found have a higher chance of undetected clouds in the ODCOD retrieval and cloud contamination in the MODIS retrieval. Cloud contamination could be a source of bias in this comparison as it is known that cloud contamination can bias MODIS high (Spencer et al., 2019; Reid et al., 2022). Also, regions where clouds are detected more frequently will be sampled less often. Additionally, the larger 10 km MODIS pixel compared to the ODCOD 5 km swath will introduce artifacts into the comparison due to the difference in sampling.
3.2.5 Comparisons to SODA
In general, daytime ODCOD 333 m retrievals show relatively small differences globally compared with SODA 333 m aerosol optical depth retrievals. The daytime median difference is 0.004 ± 0.035 (1 ± 34 % relative difference; N = 21 270 202), with ODCOD higher than SODA and with a correlation coefficient of 0.887. At nighttime, the median difference is 0.027 ± 0.034 (20 ± 33 % relative difference; N = 10 536 357), with ODCOD higher than SODA and with a correlation coefficient of 0.879. Unexpectedly, SODA reports similar values for both day and night with global median values of 0.102 ± 0.045 for daytime and 0.105 ± 0.045 for nighttime. Statistically higher optical depths are expected at night for both SODA and ODCOD because the sampling strategy used for both is susceptible to the bias caused by the greater occurrence of surface saturation at night (Sect. 3.1.1). Both data sets are filtered one to one, ODCOD requires a valid surface detection, both are the same footprint, and both use CALIOP data as an input. Due to the higher occurrence of surface saturation at night, higher-AOD scenes are preferentially sampled at night for both data sets, and it is expected that both algorithms' nighttime retrievals should be on the order of 0.02 higher compared to daytime as demonstrated in Sect. 3.1.1. The unexpected agreement for day and night SODA is not explained by changes in CALIOP level 1 data. Even though SODA uses version 4.1 CALIOP data as input rather than version 4.51 used by ODCOD, the surface saturation does not change between versions, and the sampling bias remains.
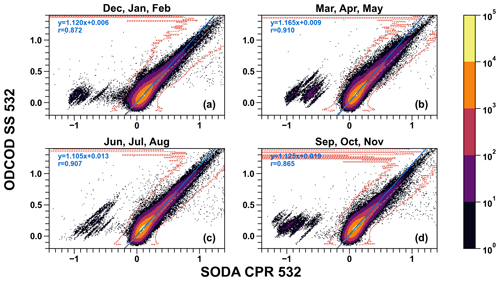
SODA has occasional anomalous data that are not filtered by the SODA scene or quality assurance flags. This artifact becomes apparent when plotting ODCOD as a function of SODA, as the anomalous points form striated lines in what appear to be somewhat quantized groupings, many of which are relatively large negative values in Figs. 18 and 19. Preliminary investigations indicate that one primary cause of these SODA outliers is the inadvertent use by the SODA algorithm of CPR data acquired during CPR calibration maneuvers (Tanelli et al., 2008).
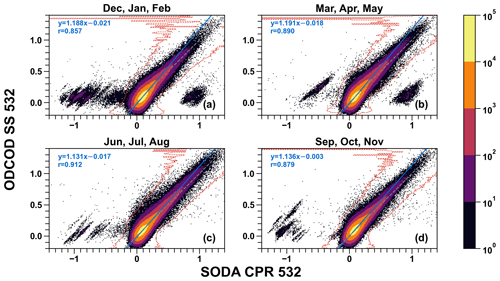
Figure 18Daytime ODCOD aerosol optical depth at single-shot resolution as a function of SODA CPR effective optical depth with the orthogonal distance fit line in solid blue and the one-to-one line in dashed gray for March 2008 through February 2011. The dashed red lines show the extreme outer Tukey fence envelope used to filter anomalous data as described in this section. The fit parameters and lines shown on the plots are only for the data found inside the envelopes.
To separate the anomalous data from nominal data, the SODA data are binned by the matching ODCOD data in 0.01 optical depth bins, and Tukey fences are calculated for each bin. Carling (2000) defines Tukey's rule for identifying outliers in a data set as and , where “q1 and q3 are the sample quartiles […] and k1 is a constant selected to meet a pre-specified outside rate under some model” and clow and chigh are, respectively, the cutoff points beyond which points in the lower and upper tails of the distribution are deemed to be outliers. In this case the pre-specified constant is set to k1 = 4.5 based on visual inspection of the joint distribution (e.g., Figs. 18 and 19). This value retains approximately 99.8 % to 99.9 % of data and clearly labels the anomalous distributions.
Table 3 and Figs. 18 and 19 show how ODCOD at single-shot resolution compares to SODA CPR during the day and night for all CALIOP data acquired from March 2008 through February 2011 that fall within the described outlier envelope.
Table 3Statistics summarizing the data used in the fits for Figs. 18 and 19. Each row summarizes one of the seasonal sets of months designated by the first letter of the months in question, such as December, January, and February as DJF, and either daytime or nighttime data.

Due to the CloudSat battery anomaly that occurred in April 2011, CloudSat nighttime data and subsequently SODA CPR retrievals at night are not available after that time. The ODCOD algorithm itself makes no distinction between day and night, and there are no algorithm differences in the inputs to the algorithm for day versus night. CALIOP's version 4.1 calibration has been extensively validated during both nighttime operations and daytime operations (Kar et al., 2018; Getzewich et al., 2018). It is noted that SODA incorporates its own calibration adjustments to the input data (Josset, 2010a). The reasons for the nighttime differences between the ODCOD and SODA CPR retrieval are not well enough understood to comment further.
3.2.6 Performance assessment summary
The results of all comparisons performed are summarized in Table 4, which shows that even among established data sets the agreement can vary, but ODCOD agrees well on most accounts, especially in the daytime. At nighttime, ODCOD tends to trend slightly higher than the data sets examined, but the lack of well-validated nighttime data makes comparisons to ODCOD more difficult.
Table 4Summary results of day and night for all comparisons performed in this paper showing median and median absolute deviation (MAD).

Compared to 10 airborne HSRL collocated underflights, ODCOD 5 km retrievals show a correlation of 0.775 computed over 149 samples. Compared to 3 years of collocated daytime MODIS AODs interpolated to 532 nm, ODCOD 5 km retrievals show a correlation of 0.834 computed over 1 999 068 samples. One-to-one comparisons of daytime ODCOD and SODA 333 m retrievals show a correlation coefficient of 0.887 computed over 21 270 392 samples. For nighttime comparisons, the correlation coefficient for 11 airborne HSRL underflights compared to ODCOD 5 km retrievals is 0.721 computed over 246 samples. For 3 years of 333 m SODA retrievals compare to 333 m ODCOD retrievals, and the correlation coefficient is 0.891 computed over 10 550 975 samples.
Because retrievals are attempted whenever CALIOP detects the ocean surface, ODCOD has the potential to be used for studying cirrus and water clouds as well as aerosols. However, clouds are not the focus of the performance assessment in this paper. For studies of cirrus clouds, CALIOP's standard cirrus retrievals have already been well validated with airborne lidar (Hlavka et al., 2012) and MODIS (Holz et al., 2016) and thus can be used confidently. While ODCOD also provides a column optical depth estimate when transparent water clouds are present, a large effort remains to quantify potential artifacts introduced into the surface returns by the non-ideal transient response of the photomultipliers and to understand the multiple scattering effects of water clouds on ODCOD and the significance of their impact on the reported cloud optical depths.
CALIPSO's version 4.51 lidar level 2 data products report a new estimate of full-column effective optical depth retrieved from the ocean surface lidar backscatter return by the Ocean Derived Column Optical Depth (ODCOD) algorithm. Accurate estimates of the ocean surface integrated attenuated backscatter (IAB) are obtained by fitting a model of CALIOP's expected ocean surface return shape to the 532 nm surface return measurements. Particulate two-way transmittances, from which optical depths are derived, are retrieved by scaling the estimated IAB to an unattenuated modeled surface reflectance that has been corrected for molecular and ozone two-way transmittances. ODCOD total column optical depth estimates are derived for the entire CALIPSO data record wherever qualified ocean surface detections are made.
Relative to daytime retrievals, ODCOD nighttime AOD estimates tend to be higher; however, in-depth global comparisons are hindered by the lack of well-understood and validated nighttime data derived from other sensors. ODCOD retrievals in the daytime were compared to 10 collocated airborne HSRL underflights, 3 years of MODIS AODs interpolated to 532 nm and the ODCOD retrieval location, and 3 years of collocated SODA 333 m retrievals. The median daytime differences found were −0.037 ± 0.052, with ODCOD lower than HSRL; −0.010 ± 0.041, with ODCOD lower than MODIS; and 0.004 ± 0.035, with ODCOD higher than SODA. Correlation coefficients were found to be 0.775, 0.834, and 0.887, respectively. Nighttime retrievals of 11 HSRL underflights and 3 years of SODA data showed median differences of 0.021 ± 0.032 and 0.027 ± 0.034, both with ODCOD higher and correlation coefficients of 0.721 and 0.891, respectively. However, the expected sampling bias between daytime and nighttime data, inherent in all CALIOP-based surface return optical depth estimates and seen in ODCOD, is not found in the SODA data sets. This apparent bias in the SODA data may explain the larger differences between the two techniques. Different CALIOP amplifier gains during the daytime and nighttime portion of the orbit cause the lidar surface return to saturate more frequently at night; however, the lack of solar background also allows the surface to be detected more readily when the surface return is very small. Since ODCOD requires unsaturated surface detections, both effects will cause sampling biases where aggregated average ODCOD optical depths are typically higher at night than day. However, these sampling biases do not account for differences between data sets when compared on a profile-by-profile basis.
Aggregated over 3 full years of measurements and the full range of measured AOD, the median uncertainty in ODCOD's 5 km AOD is 0.11 ± 0.01 (82 ± 42 % relative), with considerably lower relative values at higher optical depths. The most significant source of uncertainty in the ODCOD retrieval is wind speed. Through an AMSR-derived wind speed correction applied to the MERRA-2 winds, the ODCOD algorithm attempts to reduce wind speed biases in the retrieval.
Unlike CALIOP's standard total column optical depth estimates, ODCOD retrievals do not suffer from potential low biases due to missing optical depth from undetected layers. Instead, because the light backscattered from the ocean surface is attenuated by all the particulates in the column, ODCOD estimates are unaffected by potential failures of CALIOP's layer detection scheme and the biases they cause. That said, it remains important to be cognizant of the differences in the two data products. In particular, ODCOD retrieves effective column optical depths that are not corrected for multiple scattering effects within layers. The standard retrieval explicitly accounts for multiple scattering as a function of layer type. Consequently, ODCOD estimates cannot be directly compared to standard retrieval quantities in columns that contain clouds, for which CALIOP's measured backscatter is strongly affected by multiple scattering. However, because the standard retrieval assumes multiple scattering effects are negligible in aerosol layers, direct comparisons are possible in columns containing only aerosols.
ODCOD is a single instrument technique that does not depend on collocated measurements from other sensors and hence is consistently available throughout the entire CALIPSO mission. Beginning with CALIPSO's version 4.51 data release, ODCOD retrievals are bundled as an integral part of the lidar level 2 data products that are freely and publicly distributed at three different horizontal averaging resolutions: km (i.e., single-shot retrievals), 1 km, and 5 km.
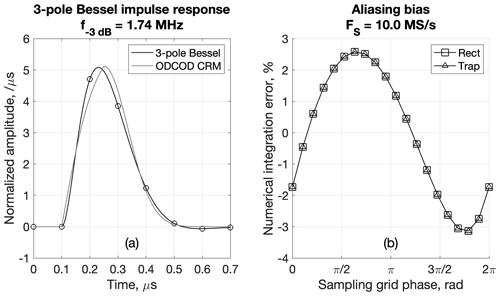
Figure A1(a) Impulse response for a three-pole Bessel filter with a 1.74 MHz −3 dB cutoff frequency overlaid with the ODCOD CRM. (b) Numerical integration of the 10 MS s−1 sampled impulse response for different phases of the sampling grid relative to the impulse using rectangular (square marker) and trapezoidal (triangle marker) numerical integration techniques. One sample period (0.1 µs) is 2π radians.
The surface integrated attenuated backscatter (IAB) is traditionally computed from a numerical integration of the samples proximal to the surface. Call x(t) the impulse response function (IRF). Assume that the sampling of this function satisfies the Nyquist–Shannon sampling criteria, i.e., that the sample rate is at least twice the maximum analog bandwidth of the signal. In this case, the IRF signal can be recovered exactly and expressed as follows.
where T is the sampling period, which is assumed to be uniform, and sinc (normalized) is defined here as . Equation (A2) is the Whittaker–Shannon interpolation formula. Integrating both sides of Eq. (A1) across time gives
Note that Eq. (A2) indicates that a rectangular numerical integration of the sampled IRF will provide the exact integral if the Nyquist–Shannon sampling criteria are satisfied. However, these criteria could never be exactly satisfied with a window of finite width or filter with finite attenuation beyond the Nyquist frequency, and there will therefore be aliasing that biases the IAB estimate, with the degree of bias depending on the ratio of the sample rate to the signal bandwidth. To determine the aliasing bias for CALIOP, numerical integration is applied to the samples of CALIOP's impulse response function across different phases of the sampling grid (Fig. A1).
The 2.44 MHz bandwidth assumed by VR2016 for the three-pole Bessel filter, which is based on MATLAB's bandwidth definition, corresponds to a −3 dB power cutoff frequency of 1.74 MHz. For CALIOP's three-pole Bessel impulse response and 10 MS s−1 sampling rate, underestimates of 3 % or overestimates of 2.5 % in IAB can result from numerical integration, depending on the phase of the sampling grid. This is true whether rectangular or trapezoidal numerical integration techniques are employed. For CALIOP, the grid phase may vary slowly from one laser shot to the next due to surface geolocation errors. This would result in a bias in IAB and attenuated surface reflectivity if not properly accounted for. Fitting of ODCOD's CALIOP response model avoids aliasing bias by effectively providing both the grid phase and the pulse magnitude, thus ensuring that the IAB is unbiased.
The following CALIPSO data products were used in this study: the V4.50 CALIPSO level 1 profile product (https://doi.org/10.5067/CALIOP/CALIPSO/CAL_LID_L1-Standard-V4-51; NASA/LARC/SD/ASDC, 2024a), the V4.51 CALIPSO level 2 5 km merged layer product (https://doi.org/10.5067/CALIOP/CALIPSO/CAL_LID_L2_05kmMLay-Standard-V4-51; NASA/LARC/SD/ASDC, 2024b), and the V4.51 CALIPSO level 2 vertical feature mask product (https://doi.org/10.5067/CALIOP/CALIPSO/CAL_LID_L2_VFM-Standard-V4-51; NASA/LARC/SD/ASDC, 2024c).
MERRA-2 wind speed data are reproduced in the CALIPSO level 2 5 km merged layer product and are used from within that data product but can be accessed at https://doi.org/10.5067/3Z173KIE2TPD (GMAO, 2015a) and https://doi.org/10.5067/WWQSXQ8IVFW8 (GMAO, 2015b), managed by the NASA Goddard Earth Sciences (GES) Data and Information Services Center (DISC).
CALIPSO Night Validation Flights High Spectral Resolution Lidar (HSRL-2) Data (https://doi.org/10.5067/SUBORBITAL/CALIPSO-NVF/DATA001; NASA/LARC/SD/ASDC, 2023), NASA Langley Atmospheric Science Data Center DAAC data, and additional HSRL data are available by request from the NASA Langley HSRL team (John Hair at johnathan.w.hair@nasa.gov).
The SODA product used is developed at the ICARE Data and Services Center (https://www.icare.univ-lille.fr, last access: 28 July 2023) in Lille (France) in the frame of the CALIPSO mission and supported by CNES and is available through their website (https://doi.org/10.1109/LGRS.2009.2030906; Josset, 2008).
MODIS data are produced by the MODIS Characterization Support Team (MCST, 2017) and available at https://doi.org/10.5067/MODIS/MYD03.061. The MODIS Atmosphere L2 Aerosol Product is available at https://doi.org/10.5067/MODIS/MYD04_L2.061 (Levy and Hsu, 2015).
AMSRE (https://doi.org/10.56236/RSS-bm, Wentz et al., 2014) and AMSR2 (https://doi.org/10.56236/RSS-bq, Wentz et al., 2021) data are available from the Microwave Climate Data Center Remote Sensing Systems (https://www.remss.com/missions/amsr/, last access: 28 October 2024).
All coauthors have contributed to the paper, and the order in which they are listed is the primary author's best estimate as to their level of contribution. RAR prepared the manuscript with contributions from all coauthors, developed and implemented the algorithm from existing works, and performed comparison analysis. MAV provided technical expertise and performed comparison analysis, SDR developed the algorithm wind speed corrections tables, JLT provided technical expertise and authored sections on aerosol type analysis, JAR provided technical expertise on ocean surface retrievals, RAF and JWH provided technical expertise and analysis on HSRL, JAS provided technical expertise and analysis on the CALIOP detector system, and BJG processed analysis data.
The contact author has declared that none of the authors has any competing interests.
Publisher's note: Copernicus Publications remains neutral with regard to jurisdictional claims made in the text, published maps, institutional affiliations, or any other geographical representation in this paper. While Copernicus Publications makes every effort to include appropriate place names, the final responsibility lies with the authors.
We would like to thank the NASA EVS-3 ACTIVATE project for their efforts to collect HSRL-2 data under CALIOP overpasses as well as the entire Langley Research Center HSRL team for their collaboration.
This paper was edited by Edward Nowottnick and reviewed by two anonymous referees.
Archer, C. L. and Jacobson, M. Z.: Evaluation of global wind power, J. Geophys. Res., 110, D12110, https://doi.org/10.1029/2004JD005462, 2005.
Avery, M. A., Ryan, R. A., Getzewich, B. J., Vaughan, M. A., Winker, D. M., Hu, Y., Garnier, A., Pelon, J., and Verhappen, C. A.: CALIOP V4 cloud thermodynamic phase assignment and the impact of near-nadir viewing angles, Atmos. Meas. Tech., 13, 4539–4563, https://doi.org/10.5194/amt-13-4539-2020, 2020.
Barrick, D.: Rough Surface Scattering Based on the Specular Point Theory, IEEE T. Antenn. Propag., 16, 449–454, https://doi.org/10.1109/TAP.1968.1139220, 1968.
Bevington, P. R. and Robinson, D. K.: Data Reduction and Error Analysis for the Physical Sciences, 2nd edn., McGraw-Hill, Boston, 328 pp., ISBN 0-07-911243-9, 1992.
Bufton, J. L., Hoge, F. E., and Swift, R. N.: Airborne measurements of laser backscatter from the ocean surface, Appl. Optics, 22, 2603–2618, https://doi.org/10.1364/AO.22.002603, 1983.
Burton S. P., Hostetler C. A., Cook A. L., Hair, J. W., Seaman, S. T., Scola, S., Harper, D. B., Smith, J. A., Fenn, M. A., Ferrare, R. A., Saide, P. E., Chemyakin, E. V., and Müller, D.: Calibration of a high spectral resolution lidar using a Michelson interferometer, with data examples from ORACLES, Appl. Optics, 57, 6061–6075, https://doi.org/10.1364/AO.57.006061, 2018.
Carling, K.: Resistant outlier rules and the non-Gaussian case, Comput. Stat. Data An., 33, 249–258, https://doi.org/10.1016/S0167-9473(99)00057-2, 2000.
Carvalho, D.: An Assessment of NASA's GMAO MERRA-2 Reanalysis Surface Winds, J. Climate, 32, 8261–8281, https://doi.org/10.1175/JCLI-D-19-0199.1, 2019.
Dierssen, H.: Hyperspectral Measurements, Parameterizations, and Atmospheric Correction of Whitecaps and Foam from Visible to Shortwave Infrared for Ocean Color Remote Sensing, Front. Earth Sci., 7, 14, https://doi.org/10.3389/feart.2019.00014, 2019.
Fernald, F. G., Herman, B. M., and Reagan, J. A.: Determination of Aerosol Height Distributions by Lidar, J. Appl. Meteorol. Clim., 11, 482–489, https://doi.org/10.1175/1520-0450(1972)011<0482:DOAHDB>2.0.CO;2, 1972.
Ferrare, R., Hair, J., Hostetler, C., Shingler, T., Burton, S. P., Fenn, M., Clayton, M., Scarino, A. J., Harper, D., Seaman, S., Cook, A., Crosbie, E., Winstead, E., Ziemba, L., Thornhill, L., Robinson, C., Moore, R., Vaughan, M., Sorooshian, A., Schlosser, J. S., Liu, H., Zhang, B., Diskin, G., DiGangi, J., Nowak, J., Choi Y., Zuidema, P., and Chellappan, S.: Airborne HSRL-2 measurements of elevated aerosol depolarization associated with non-spherical sea salt, Front. Remote Sens., 4, 1143944, https://doi.org/10.3389/frsen.2023.1143944, 2023.
Gelaro, R., McCarty, W., Suárez, M. J., Todling, R., Molod, A., Takacs, L., Randles, C. A., Darmenov, A., Bosilovich, M. G., Reichle, R., Wargan, K., Coy, L., Cullather, R., Draper, C., Akella, S., Buchard, V., Conaty, A., da Silva, A. M., Gu, W., Kim, G., Koster, R., Lucchesi, R., Merkova, D., Nielsen, J. E., Partyka, G., Pawson, S., Putman, W., Rienecker, M., Schubert, S. D., Sienkiewicz, M., and Zhao, B.: The Modern-Era Retrospective Analysis for Research and Applications, Version 2 (MERRA-2), J. Climate, 30, 5419–5454, https://doi.org/10.1175/JCLI-D-16-0758.1, 2017.
Getzewich, B. J., Vaughan, M. A., Hunt, W. H., Avery, M. A., Powell, K. A., Tackett, J. L., Winker, D. M., Kar, J., Lee, K.-P., and Toth, T. D.: CALIPSO lidar calibration at 532 nm: version 4 daytime algorithm, Atmos. Meas. Tech., 11, 6309–6326, https://doi.org/10.5194/amt-11-6309-2018, 2018.
GMAO (Global Modeling and Assimilation Office): MERRA-2 inst1_2d_asm_Nx: 2d,1-Hourly,Instantaneous,Single-Level,Assimilation,Single-Level Diagnostics V5.12.4, Goddard Earth Sciences Data and Information Services Center (GES DISC) [data set], Greenbelt, MD, USA, https://doi.org/10.5067/3Z173KIE2TPD, 2015a.
GMAO (Global Modeling and Assimilation Office): MERRA-2 inst3_3d_asm_Nv: 3d,3-Hourly, Instantaneous, Model-Level, Assimilation, Assimilated Meteorological Fields V5.12.4, Goddard Earth Sciences Data and Information Services Center (GES DISC) [data set], Greenbelt, MD, USA, https://doi.org/10.5067/WWQSXQ8IVFW8, 2015b.
GMAO (Global Modeling and Assimilation Office): MERRA-2 tavg1_2d_slv_Nx: 2d,1-Hourly,Time-Averaged,Single-Level,Assimilation,Single-Level Diagnostics V5.12.4, Goddard Space Flight Center Distributed Active Archive Center (GSFC DAAC) [data set], Greenbelt, MD, USA, https://doi.org/10.5067/VJAFPLI1CSIV, 2015c.
Hair, J. W., Hostetler, C. A., Cook, A. L., Harper, D. B., Ferrare, R A., Mack, T. L., Welch, W., Izquierdo, L. R., and Hovis, F. E.: Airborne High Spectral Resolution Lidar for profiling aerosol optical properties, Appl. Optics., 47, 6734–6752, https://doi.org/10.1364/AO.47.006734, 2008.
He, M., Hu, Y., Huang, J. P., and Stamnes, K.: Aerosol optical depth under “clear” sky conditions derived from sea surface reflection of lidar signals, Opt. Express, 24, A1618–A1634, https://doi.org/10.1364/OE.24.0A1618, 2016.
Hlavka, D. L., Yorks, J. E., Young, S. A., Vaughan, M. A., Kuehn, R. E., McGill, M. J., and Rodier, S. D.: Airborne validation of cirrus cloud properties derived from CALIPSO lidar measurements: Optical properties, J. Geophys. Res., 117, D09207, https://doi.org/10.1029/2011JD017053, 2012.
Holz, R. E., Platnick, S., Meyer, K., Vaughan, M., Heidinger, A., Yang, P., Wind, G., Dutcher, S., Ackerman, S., Amarasinghe, N., Nagle, F., and Wang, C.: Resolving ice cloud optical thickness biases between CALIOP and MODIS using infrared retrievals, Atmos. Chem. Phys., 16, 5075–5090, https://doi.org/10.5194/acp-16-5075-2016, 2016.
Hostetler, C. A., Liu, Z., Reagan, J. A., Vaughan, M. A., Winker, D. M., Osborn, M. T., Hunt, W. H., Powell, K. A., and Trepte, C. R.: CALIPSO algorithm theoretical basis document, PC-SCI-201, http://www-calipso.larc.nasa.gov/resources/project_documentation.php (last access: 27 November 2023), 2005.
Hu, Y., Stamnes, K., Vaughan, M., Pelon, J., Weimer, C., Wu, D., Cisewski, M., Sun, W., Yang, P., Lin, B., Omar, A., Flittner, D., Hostetler, C., Trepte, C., Winker, D., Gibson, G., and Santa-Maria, M.: Sea surface wind speed estimation from space-based lidar measurements, Atmos. Chem. Phys., 8, 3593–3601, https://doi.org/10.5194/acp-8-3593-2008, 2008.
Hunt, W. H., Winker, D. M., Vaughan, M. A., Powell, K. A., Lucker, P. L., and Weimer, C.: CALIPSO Lidar Description and Performance Assessment, J. Atmos. Ocean. Tech., 26, 1214–1228, https://doi.org/10.1175/2009JTECHA1223.1, 2009.
Josset, D., Pelon, J., Protat, A., and Flamant, C.: New approach to determine aerosol optical depth from combined CALIPSO and CloudSat ocean surface echoes, Geophys. Res. Lett., 35, L10805, https://doi.org/10.1029/2008GL033442, 2008.
Josset, D., Pelon, J., and Hu, Y.: Multi-Instrument Calibration Method Based on a Multiwavelength Ocean Surface Model, IEEE Geosci. Remote S., 7, 195–199, https://doi.org/10.1109/LGRS.2009.2030906, 2010a.
Josset, D., Zhai, P., Hu, Y., Pelon, J., and Lucker, P. L.: Lidar equation for ocean surface and subsurface, Opt. Express, 18, 20862–20875, https://doi.org/10.1364/OE.18.020862, 2010b.
Josset, D., Pelon, J., Garnier, A., Hu, Y., Vaughan, M., Zhai, P.-W., Kuehn, R., and Lucker, P.: Cirrus optical depth and lidar ratio retrieval from combined CALIPSO-CloudSat observations using ocean surface echo, J. Geophys. Res., 117, D05207, https://doi.org/10.1029/2011JD016959, 2012.
Josset, D., Hou, W., Pelon, J., Hu, Y., Tanelli, S., Ferrare, R., Burton, S., and Pascal, N.: Ocean and polarization observations from active remote sensing: atmospheric and ocean science applications, in: Proc. SPIE 9459, Ocean Sensing and Monitoring VII, SPIE Defense + Security, 2015, Baltimore, MD, United States, SPIE Digital Library, 94590N, https://doi.org/10.1117/12.2181544, 2015.
Kar, J., Vaughan, M. A., Lee, K.-P., Tackett, J. L., Avery, M. A., Garnier, A., Getzewich, B. J., Hunt, W. H., Josset, D., Liu, Z., Lucker, P. L., Magill, B., Omar, A. H., Pelon, J., Rogers, R. R., Toth, T. D., Trepte, C. R., Vernier, J.-P., Winker, D. M., and Young, S. A.: CALIPSO lidar calibration at 532 nm: version 4 nighttime algorithm, Atmos. Meas. Tech., 11, 1459–1479, https://doi.org/10.5194/amt-11-1459-2018, 2018.
Kim, M.-H., Omar, A. H., Vaughan, M. A., Winker, D. M., Trepte, C. R., Hu, Y., Liu, Z., and Kim, S.-W.: Quantifying the low bias of CALIPSO's column aerosol optical depth due to undetected aerosol layers, J. Geophys. Res. Atmos., 122, 1098–1113, https://doi.org/10.1002/2016JD025797, 2017.
Kim, M.-H., Omar, A. H., Tackett, J. L., Vaughan, M. A., Winker, D. M., Trepte, C. R., Hu, Y., Liu, Z., Poole, L. R., Pitts, M. C., Kar, J., and Magill, B. E.: The CALIPSO version 4 automated aerosol classification and lidar ratio selection algorithm, Atmos. Meas. Tech., 11, 6107–6135, https://doi.org/10.5194/amt-11-6107-2018, 2018.
Lancaster, R. S., Spinhirne, J. D., and Palm, S. P.: Laser pulse reflectance of the ocean surface from the GLAS satellite lidar, Geophys. Res. Lett., 32, L22S10, https://doi.org/10.1029/2005GL023732, 2005.
Levy, R. and Hsu, C.: MODIS Atmosphere L2 Aerosol Product, NASA MODIS Adaptive Processing System, Goddard Space Flight Center [data set], USA, https://doi.org/10.5067/MODIS/MOD04_L2.061, 2015.
Levy, R., Remer, L., Tanré, D., Mattoo, S., and Kaufman, Y.: Algorithm for Remote Sensing of Tropospheric Aerosol Over Dark Targets from MODIS, https://atmosphere-imager.gsfc.nasa.gov/sites/default/files/ModAtmo/ATBD_MOD04_C005_rev2_0.pdf (last access: 5 June 2024), 2009.
Liu, Z., Fairlie, T., Uno, I., Huang, J., Wu, D., Omar, A., Kar, J., Vaughan, M., Rogers, R., Winker, D., Trepte, C., Hu, Y., Sun, W., Lin, B., and Cheng, A.: Transpacific Transport and Evolution of the Optical Properties of Asian Dust, J. Quant. Spectrosc. Ra., 116, 24–33, https://doi.org/10.1016/j.jqsrt.2012.11.011, 2013.
Liu, Z., Kar, J., Zeng, S., Tackett, J., Vaughan, M., Avery, M., Pelon, J., Getzewich, B., Lee, K.-P., Magill, B., Omar, A., Lucker, P., Trepte, C., and Winker, D.: Discriminating between clouds and aerosols in the CALIOP version 4.1 data products, Atmos. Meas. Tech., 12, 703–734, https://doi.org/10.5194/amt-12-703-2019, 2019.
Lu, X., Hu, Y., Liu, Z., Rodier, S., Vaughan, M., Trepte, C., and Pelon, J.: Observations of Arctic snow and sea ice cover from CALIOP lidar measurements, Remote Sens. Environ., 194, 248–263, https://doi.org/10.1016/j.rse.2017.03.046, 2017.
McGill, M. J., Vaughan, M. A., Trepte, C. R., Hart, W. D., Hlavka, D. L., Winker, D. M., and Kuehn, R.: Airborne validation of spatial properties measured by the CALIPSO lidar, J. Geophys. Res., 112, D20201, https://doi.org/10.1029/2007JD008768. 2007.
MCST (MODIS Characterization Support Team): MODIS Geolocation Fields Product, NASA MODIS Adaptive Processing System, Goddard Space Flight Center [data set], USA, https://doi.org/10.5067/MODIS/MYD03.061, 2017.
Menzies, R. T., Tratt, D. M., and Hunt, W. H.: Lidar In-space Technology Experiment measurements of sea surface directional reflectance and the link to surface wind speed, Appl. Optics., 37, 5550–5559, 1998.
Nagle, F. W. and Holz, R. E.: Computationally Efficient Methods of Collocating Satellite, Aircraft, and Ground Observations, J. Atmos. Ocean. Tech., 26, 1585–1595, https://doi.org/10.1175/2008JTECHA1189.1, 2009.
NASA/LARC/SD/ASDC: CALIPSO Night Validation Flights High Spectral Resolution Lidar (HSRL-2) Data, NASA Langley Atmospheric Science Data Center DAAC [data set], https://doi.org/10.5067/SUBORBITAL/CALIPSO-NVF/DATA001, 2023.
NASA/LARC/SD/ASDC: CALIPSO Lidar Level 1B profile data, V4-51, NASA Langley Atmospheric Science Data Center DAAC [data set], https://doi.org/10.5067/CALIOP/CALIPSO/CAL_LID_L1-Standard-V4-51, 2024a.
NASA/LARC/SD/ASDC: CALIPSO Lidar Level 2 5 km Merged Layer, V4-51, NASA Langley Atmospheric Science Data Center DAAC [data set], https://doi.org/10.5067/CALIOP/CALIPSO/CAL_LID_L2_05kmMLay-Standard-V4-51, 2024b.
NASA/LARC/SD/ASDC: CALIPSO Lidar Level 2 Vertical Feature Mask (VFM), V4-51, NASA Langley Atmospheric Science Data Center DAAC [data set], https://doi.org/10.5067/CALIOP/CALIPSO/CAL_LID_L2_VFM-Standard-V4-51, 2024c.
Powell, K. A., Hostetler, C. A., Vaughan, M. A., Lee, K., Trepte, C. R., Rogers, R. R., Winker, D. M., Liu, Z., Kuehn, R. E., Hunt, W. H., and Young, S. A.: CALIPSO Lidar Calibration Algorithms. Part I: Nighttime 532-nm Parallel Channel and 532-nm Perpendicular Channel, J. Atmos. Ocean. Tech., 26, 2015–2033, https://doi.org/10.1175/2009JTECHA1242.1, 2009.
Reagan, J. A. and Zielinskie, D. A.: Spaceborne lidar remote sensing techniques aided by surface returns, Opt. Eng., 30, 96–102, https://doi.org/10.1117/12.55776, 1991.
Reid, J. S., Gumber, A., Zhang, J., Holz, R. E., Rubin, J. I., Xian, P., Smirnov, A., Eck, T. F., O'Neill, N. T., Levy, R. C., Reid, E. A., Colarco, P. R., Benedetti, A., and Tanaka, T. A.: Coupled Evaluation of Operational MODIS and Model Aerosol Products for Maritime Environments Using Sun Photometry: Evaluation of the Fine and Coarse Mode, Remote Sens.-Basel, 14, 2978, https://doi.org/10.3390/rs14132978, 2022.
Ridley, D. A., Heald, C. L., and Ford, B.: North African dust export and deposition: A satellite and model perspective, J. Geophys. Res., 117, D02202, https://doi.org/10.1029/2011JD016794, 2012.
Rogers, R. R., Hair, J. W., Hostetler, C. A., Ferrare, R. A., Obland, M. D., Cook, A. L., Harper, D. B., Burton, S. P., Shinozuka, Y., McNaughton, C. S., Clarke, A. D., Redemann, J., Russell, P. B., Livingston, J. M., and Kleinman, L. I.: NASA LaRC airborne high spectral resolution lidar aerosol measurements during MILAGRO: observations and validation, Atmos. Chem. Phys., 9, 4811–4826, https://doi.org/10.5194/acp-9-4811-2009, 2009.
Sinha, P., Jaeglé, L., Hobbs, P. V., and Liang, Q.: Transport of biomass burning emissions from southern Africa, J. Geophys. Res., 109, D20204, https://doi.org/10.1029/2004JD005044, 2004.
Spencer, R. S., Levy, R. C., Remer, L. A., Mattoo, S., Arnold, G. T., Hlavka, D. L., Meyer, K. G., Marshak, A., Wilcox, E. M., and Platnick, S. E.: Exploring aerosols near clouds with high-spatial-resolution aircraft remote sensing during SEAC4RS, J. Geophys. Res.-Atmos., 124, 2148–2173, https://doi.org/10.1029/2018JD028989, 2019.
Sawamura, P., Moore, R. H., Burton, S. P., Chemyakin, E., Müller, D., Kolgotin, A., Ferrare, R. A., Hostetler, C. A., Ziemba, L. D., Beyersdorf, A. J., and Anderson, B. E.: HSRL-2 aerosol optical measurements and microphysical retrievals vs. airborne in situ measurements during DISCOVER-AQ 2013: an intercomparison study, Atmos. Chem. Phys., 17, 7229–7243, https://doi.org/10.5194/acp-17-7229-2017, 2017.
Tackett, J. L., Winker, D. M., Getzewich, B. J., Vaughan, M. A., Young, S. A., and Kar, J.: CALIPSO lidar level 3 aerosol profile product: version 3 algorithm design, Atmos. Meas. Tech., 11, 4129–4152, https://doi.org/10.5194/amt-11-4129-2018, 2018.
Tanelli, S., Durden, S. L., Im, E., Pak, K. S., Reinke, D. G., Partain, P., Haynes, J. M., and Marchand, R. T.: CloudSat's Cloud Profiling Radar After Two Years in Orbit: Performance, Calibration, and Processing, IEEE T. Geosci. Remote, 46, 3560–3573, https://doi.org/10.1109/TGRS.2008.2002030, 2008.
Thorsen, T. J., Ferrare, R. A., Hostetler, C. A., Vaughan, M. A., and Fu, Q.: The impact of lidar detection sensitivity on assessing aerosol direct radiative effects, Geophys. Res. Lett., 44, 9059–9067, https://doi.org/10.1002/2017GL074521, 2017.
Thorsen, T. J., Ryan, R. A., and Vaughan, M. A.: Validation of Aerosol Optical Depth Retrieved from CALIPSO Lidar Ocean Surface Backscatter, in preparation, 2024.
Toth, T. D., Campbell, J. R., Reid, J. S., Tackett, J. L., Vaughan, M. A., Zhang, J., and Marquis, J. W.: Minimum aerosol layer detection sensitivities and their subsequent impacts on aerosol optical thickness retrievals in CALIPSO level 2 data products, Atmos. Meas. Tech., 11, 499–514, https://doi.org/10.5194/amt-11-499-2018, 2018.
Vaughan, M., Garnier, A., Tackett, J., Avery, M., Young, S., Kar, J., Getzewich, B., Omar, A., Liu, Z., Lee, K., Cai, X., Zeng, S., Hu, Y., Lambeth, J., Ryan, R., Magill, B., Rodier, S., Murray, T., Beaumont, K., and Trepte, C.: Introducing CALIPSO's Version 4 Level 2 Lidar Data Products, in: 28th International Laser Radar Conference (ILRC), Bucharest, Romania, June 2017, 25–30, 2017.
Vaughan, M., Garnier, A., Josset, D., Avery, M., Lee, K.-P., Liu, Z., Hunt, W., Pelon, J., Hu, Y., Burton, S., Hair, J., Tackett, J. L., Getzewich, B., Kar, J., and Rodier, S.: CALIPSO lidar calibration at 1064 nm: version 4 algorithm, Atmos. Meas. Tech., 12, 51–82, https://doi.org/10.5194/amt-12-51-2019, 2019.
Vaughan, M., Pitts, M., Trepte, C., Winker, D., Getzewich, B., Tackett, J., Cai, X., Garnier, A., Ker, J., Lee, K.-P., Lucker, P., Detweiler, P., Lambeth, J., Murray, T., Rodier, S., Ryan, R., Tremas, T., Pelon, J., and Flamant, C.: Cloud-Aerosol LIDAR Infrared Pathfinder Satellite Observations (CALIPSO) data management system data products catalog, Release 4.97, NASA Langley Research Center Document PC-SCI-503, https://www-calipso.larc.nasa.gov/products/CALIPSO_DPC_Rev4x97.pdf (last access: 28 June 2024), 2024.
Vaughan, M. A., Powell, K. A., Winker, D. M., Hostetler, C. A., Kuehn, R. E., Hunt, W. H., Getzewich, B. J., Young, S. A., Liu, Z., and McGill, M. J.: Fully Automated Detection of Cloud and Aerosol Layers in the CALIPSO Lidar Measurements, J. Atmos. Ocean. Tech., 26, 2034–2050, https://doi.org/10.1175/2009JTECHA1228.1, 2009.
Venkata, S. L. and Reagan, J. A.: Aerosol Retrievals from CALIPSO Lidar Ocean Surface Returns, Remote Sens.-Basel, 8, 1006, https://doi.org/10.3390/rs8121006, 2016.
Wentz, F. J., Gentemann C. L., and Hilburn K.: Three years of ocean products from AMSR-E: Evaluation and applications, in: Proceedings. 2005 IEEE International Geoscience and Remote Sensing Symposium, 2005, IGARSS '05, Seoul, South Korea, 29–29 July 2005, IEEE, 4929–4932, https://doi.org/10.1109/IGARSS.2005.1526780, 2005.
Wentz, F. J., Meissner, T., Gentemann, C., and Brewer, M.: RSS AQUA AMSR-E Daily Environmental Suite on 0.25 deg grid, Version 7, Remote Sensing Systems [data set], Santa Rosa, CA, USA, https://doi.org/10.56236/RSS-bm, 2014.
Wentz, F. J., Meissner, T., Gentemann, C., Hilburn, K. A., and Scott, J.: RSS GCOM-W1 AMSR2 Daily Environmental Suite on 0.25 deg grid, Version 8.2, Remote Sensing Systems [data set], Santa Rosa, CA, USA, https://doi.org/10.56236/RSS-bq, 2021.
Winker, D., Cai, X., Vaughan, M., Garnier, A., Magill, B., Avery, M., and Getzewich, B.: A Level 3 monthly gridded ice cloud dataset derived from 12 years of CALIOP measurements, Earth Syst. Sci. Data, 16, 2831–2855, https://doi.org/10.5194/essd-16-2831-2024, 2024.
Winker, D. M., Vaughan, M. A., Omar, A., Hu, Y., Powell, K. A., Liu, Z., Hunt, W. H., and Young, S. A.: Overview of the CALIPSO Mission and CALIOP Data Processing Algorithms, J. Atmos. Ocean. Tech., 26, 2310–2323, https://doi.org/10.1175/2009JTECHA1281.1, 2009.
Winker, D. M., Pelon, J., Coakley Jr., J. A., Ackerman, S. A., Charlson, R. J., Colarco, P. R., Flamant, P., Fu, Q., Hoff, R. M., Kittaka, C., Kubar, T. L., Le Treut, H., McCormick, M. P., Mégie, G., Poole, L., Powell, K., Trepte, C., Vaughan, M. A., and Wielicki, B. A.: The CALIPSO Mission, B. Am. Meteorol. Soc., 91, 1211–1230, https://doi.org/10.1175/2010BAMS3009.1, 2010.
Young, S. A. and Vaughan, M. A.: The Retrieval of Profiles of Particulate Extinction from Cloud-Aerosol Lidar Infrared Pathfinder Satellite Observations (CALIPSO) Data: Algorithm Description, J. Atmos. Ocean. Tech., 26, 1105–1119, https://doi.org/10.1175/2008JTECHA1221.1, 2009.
Young, S. A., Vaughan, M. A., Kuehn, R. E., and Winker, D. M.: The Retrieval of Profiles of Particulate Extinction from Cloud–Aerosol Lidar and Infrared Pathfinder Satellite Observations (CALIPSO) Data: Uncertainty and Error Sensitivity Analyses, J. Atmos. Ocean. Tech., 30, 395–428, https://doi.org/10.1175/JTECH-D-12-00046.1, 2013.
Young, S. A., Vaughan, M. A., Garnier, A., Tackett, J. L., Lambeth, J. D., and Powell, K. A.: Extinction and optical depth retrievals for CALIPSO's Version 4 data release, Atmos. Meas. Tech., 11, 5701–5727, https://doi.org/10.5194/amt-11-5701-2018, 2018.
Yu, H., Zhang, Y., Chin, M., Liu, Z., Omar, A., Remer, L., Yang, Y., Yuan, T., and Zhang, J.: An integrated analysis of aerosol above clouds from A-Train multi-sensor measurements, Remote Sens. Environ., 121, 125–131, https://doi.org/10.1016/j.rse.2012.01.011, 2012.


