the Creative Commons Attribution 4.0 License.
the Creative Commons Attribution 4.0 License.
Retrieval of cloud fraction and optical thickness of liquid water clouds over the ocean from multi-angle polarization observations
Veronika Pörtge
Mihail Manev
Bernhard Mayer
We introduce a novel method to retrieve the cloud fraction and the optical thickness of liquid clouds over a water surface based on polarimetry. The approach is well suited for satellite observations providing multi-angle polarization measurements, in particular those of the Hyper-Angular Rainbow Polarimeter #2 (HARP2). Unlike commonly used methods to derive cloud fractions, our method does not depend on the spatial resolution of observations, and it does not require any threshold values for cloud detection. Based on radiative transfer simulations, we show that the cloud fraction and the cloud optical thickness can be derived from measurements at two viewing angles: one within the cloudbow and one in the sun glint region. In the cloudbow, the degree of polarization mainly depends on the cloud optical thickness. Conversely, for a viewing direction in the sun glint region, the degree of polarization depends on the clear fraction of the pixel, because here the radiation scattered by cloud droplets is almost unpolarized, whereas radiation reflected by the surface is highly polarized. Utilizing these dependencies, we developed a retrieval using a simple lookup table approach. Based on sensitivity studies, we show that prior information about wind speed and aerosol optical thickness improves the accuracy of the cloud fraction retrieval. Prior information about the cloud droplet size distribution can reduce the uncertainty of the cloud optical thickness retrieval. The prior information should be obtained by combining our method with already existing aerosol and cloud retrieval algorithms. We performed 3D radiative transfer simulations and found that the cloud optical thickness is generally underestimated due to neglect of 3D scattering effects. The cloud fraction is overestimated in cloud shadows and underestimated in in-scattering regions.
As a demonstration, we apply the methodology to airborne observations from polarization cameras of the Munich Aerosol Cloud Scanner (specMACS) instrument. The high-spatial-resolution data (10–20 m) have been averaged to a spatial resolution of approximately 2.5 km to mimic satellite observations. From the average linear polarization at scattering angles of 140 and 110°, we derive continuous cloud fraction values and the corresponding cloud optical thicknesses. Comparison for cases including low, medium, and high cloud fractions shows that the retrieval, using only reflected polarized radiances at two scattering angles, provides accurate estimates of the cloud fraction for observations with coarse spatial resolution.
- Article
(9941 KB) - Full-text XML
- BibTeX
- EndNote
Clouds influence local weather conditions as well as Earth's climate system. They affect the energy balance and play a large role in the planet's long-term climate. According to the latest IPCC assessment report, AR6 (Intergovernmental Panel On Climate Change, 2023), there have been major advances in the understanding of cloud processes over the last decade that have decreased the uncertainty range for cloud feedback by about 50 % compared to AR5 (Intergovernmental Panel On Climate Change, 2014), but nevertheless clouds remain the largest contributors to the overall uncertainty in climate feedbacks.
In order to further improve the representation of clouds in climate models, observations are required for model validation. The Cloud Assessment Group of the GEWEX (Global Energy and Water Exchanges) programme gathers cloud products derived from active and passive satellite observations in the solar and thermal spectral regions (Stubenrauch et al., 2024) and provides a database of publicly available, global cloud products at a spatial resolution of 1° latitude × 1° longitude. They also provide recommendations for how satellite-retrieved cloud properties may be used in climate studies and climate model evaluation. One important parameter is the global cloud fraction, for which they obtain an average of 0.66 ± 0.04 from 11 participating datasets. The standard method to derive cloud fraction from space is to calculate the fraction of image pixels that contain some clouds. For example, for MODIS, which has a relatively high spatial resolution of about 1 × 1 km2, the cloud fraction is retrieved at a spatial resolution of 5 × 5 km2 by computing the ratio of pixels where clouds have been detected and clear pixels for this larger region, including 25 individual MODIS pixels (Platnick et al., 2017). The determination of cloud fraction from satellite measurements is problematic for various reasons. First, there is no quantitative cloud definition, e.g. a lower liquid water content limit. Second, most cloud detection methods rely on thresholds, which depend on instrument and algorithm performance as well as on cloud assumptions and the background. Third, the definition of cloud fraction based on the fraction of cloudy pixels in an image depends on the viewing direction and strongly on the spatial resolution of the observations (e.g. Wielicki and Parker, 1992).
Di Girolamo and Davies (1997) developed a pattern recognition approach to correct for the spatial distribution error. Dutta et al. (2020) applied this method to correct for the spatial resolution error in Multi-angle Imaging SpectroRadiometer (MISR) observations and found cloud fraction reductions of more than 0.4 in regions dominated by shallow cumulus clouds. They validated the resolution-corrected cloud product by comparison to Advanced Spaceborne Thermal Emission and Reflection Radiometer (ASTER) observations of 15 m resolution and showed that the 50° N–50° S cloud fraction, which is in accordance with the GEWEX assessment of about 0.65 in the uncorrected MISR cloud product, is reduced to 0.47 in the resolution-corrected cloud product.
An alternative resolution-independent cloud fraction retrieval approach is implemented in the aerosol retrieval algorithm based on the optimal estimation method of Hasekamp (2010), which provides, in addition to aerosol optical properties, the cloud fraction from POLarization and Directionality of the Earth's Reflectances (POLDER) measurements with a spatial resolution of about 7 × 6 km2. In a validation study for partially cloudy scenes based on simulated data, Stap et al. (2016a, b) showed that the retrieved cloud fraction correlates well with the cloud fraction used as input for radiative transfer simulations to produce the simulated data. Similarly, Van Diedenhoven et al. (2007) developed a retrieval method for cloud parameters from satellite-based reflectance measurements (Global Ozone Monitoring Experiment and Scanning Imaging Absorption Spectrometer for Atmospheric Chartography) in the ultraviolet and the oxygen A band. Based on an optimal estimation approach, they derived the cloud fraction, cloud optical thickness, and cloud top pressure. The oxygen A band contains information about cloud optical thickness and cloud top pressure. The UV spectral region is also sensitive to the cloud fraction, since the Rayleigh scattering contribution to the reflectance increases with the clear fraction of the pixel. Recently, another cloud fraction algorithm for POLDER data based on a neural network was developed. The training data include variations in aerosol and surface properties as well as ice and liquid clouds, and therefore they can be applied globally (Yuan et al., 2024). Note that these algorithms do not rely on thresholds for cloud detection because the cloud fraction is not defined by a fraction of cloudy pixels but is solely derived from the observed reflected radiation, and it is therefore a resolution-independent continuous quantity.
In this study, we propose a similar method to estimate the cloud fraction of liquid water clouds over the ocean. It makes use of the angular dependence of the degree of linear polarization of reflected radiation. For clouds, it becomes large in the cloudbow region, whereas for clear sky above the ocean it becomes large in the sun glint region. Therefore, we suggest measuring the degree of linear polarization at two angles, one in the cloudbow region to retrieve the vertical cloud optical thickness of the cloudy part and one in the sun glint region to retrieve the cloud fraction.
The global cloud cover cannot be obtained using our method because it is only developed for liquid clouds over the ocean. Since ice clouds do not produce a cloudbow, the methodology cannot be applied directly to determine the cloud fraction and the optical thickness of ice clouds. However, it would be possible to replace the degree of linear polarization in the cloudbow region with an intensity observation at the same angle to retrieve the ice cloud optical thickness. For retrievals over land, polarization due to surface reflection is too small to be used for a cloud fraction retrieval. Therefore, an additional method needs to be developed which could use the strong polarization caused by Rayleigh scattering between the clouds to obtain information about the cloud fraction. This method should use shorter wavelengths which are mostly insensitive to surface properties and for which the Rayleigh scattering contribution is much higher.
The resolution-independent cloud fraction retrieval method could be a valuable addition to operational cloud retrieval algorithms for upcoming satellite instruments providing multi-angle polarization observations. The NASA Plankton, Aerosol, Cloud, ocean Ecosystem (PACE) mission (https://pace.oceansciences.org, last access: 12 November 2024), which was successfully launched on 8 February 2024, includes two polarimeters, the Spectro-polarimeter for Planetary Exploration (SPEXone) and the Hyper-Angular Rainbow Polarimeter #2 (HARP2) (Remer et al., 2019). SPEXone provides hyper-spectral polarized radiances in the spectral range from 385 to 770 nm in five viewing directions for a narrow swath of 100 km at nadir. The spatial resolution is about 5 km, and the global coverage is obtained after approximately 30 d. HARP2 is a hyper-angular instrument, with four spectral bands between 440 and 870 nm, and it observes a wide swath of 1555 km at nadir. For the 669 nm band, HARP2 includes 60 viewing angles spaced over 114°. The spatial resolution is approximately the same as that of SPEXone. The Multi-Viewing Multi-Channel Multi-Polarisation Imaging (3MI) instrument is an optical radiometer dedicated to aerosol and cloud characterization (Fougnie et al., 2018). It is one of the missions of the EUMETSAT Polar System Second Generation (EPS-SG) programme planned for launch in 2025. It will provide a multi-spectral (from 410 to 2130 nm), multi-polarization (−60, 0, and +60°), and multi-angular (14-view) image of the outgoing radiance at the top of the atmosphere. The spatial resolution is 4 km at nadir, and the swath width is 2200 km.
Since cloud structures change rapidly, observations at the two suggested scattering angles should ideally be made nearly simultaneously. HARP2 is designed to provide such observations, so it is ideally suited to our proposed method. For SPEXone and 3MI, further investigations of the collocation of the observations would be required.
The paper is structured as follows. In Sect. 2 the setup of the radiative transfer model for 1D and 3D simulations is described. In Sect. 3 the dependence of the degree of polarization on cloud optical thickness and cloud fraction is investigated, and retrieval lookup tables for different atmosphere and surface conditions are constructed. In Sect. 4 3D scattering effects on the cloud fraction and cloud optical thickness retrieval are investigated. In Sect. 5 we apply the retrieval method to airborne observations of the Munich Aerosol Cloud Scanner (specMACS) instrument. The final Sect. 6 includes a brief summary, discusses limitations, and provides an outlook for future work.
For all the simulations, we used the radiative transfer model MYSTIC (Monte Carlo code for the phYsically correct Tracing of photons In Cloudy atmospheres; Mayer, 2009; Emde et al., 2010) implemented in the libRadtran package (Mayer and Kylling, 2005; Emde et al., 2016). MYSTIC is a comprehensive vector radiative transfer model that can be run in 1D, 3D, plane-parallel, or spherical geometries. It has been extensively validated in various model intercomparison studies (e.g. Emde et al., 2015, 2018).
The general setup for all the simulations is as follows: we take the US standard atmosphere from Anderson et al. (1986) to set up the profiles of pressure, temperature, and trace gas concentrations. As incoming solar irradiance, we use the extraterrestrial spectrum of Kurucz and Bell (1995). We enable the polarization mode (Emde et al., 2010) to compute the complete Stokes vector and the variance reduction methods (Buras and Mayer, 2011) for accurate simulations including cloud scattering. We perform monochromatic simulations at 667 nm, approximately the centre wavelength of the HARP2 instrument, where 60 scattering angles are observed simultaneously. The solar zenith angle is set to 50°. The simulations are performed for viewing angles from −60 to +60° in steps of 1° in the solar principal plane, and thus we obtain the Stokes vector for scattering angles Θ from 70 to 180°. The scattering angle is defined as the angle between the Sun's position vector (incident direction) and the viewing direction vector (i.e. the Sun is behind the observer at 180°). As we will show later (see Fig. 4g), the retrieval performs best for observations in the solar principal plane that include the maximum of the sun glint.
The components of the Stokes vector I (W (m2 nm sr)−1) are defined as time averages of linear combinations of the electromagnetic field vector (e.g. Chandrasekhar, 1950; Hansen and Travis, 1974):
Here, E∥ and E⟂ are the components of the electromagnetic field vector parallel and perpendicular to the reference plane. I is the intensity of the radiation, Q and U give the state of linear polarization, and V gives the circular polarization. We will neglect V in the following because circular polarization is several orders of magnitude smaller than linear polarization (e.g. Emde et al., 2018). In the solar principal plane, U is exactly 0 for plane-parallel geometry by definition. Therefore, the signed degree of linear polarization is given by
A negative (positive) P means that the radiation is predominantly polarized perpendicular (parallel) to the scattering plane. Note that P is a dimensionless quantity which can be measured without absolute calibration. For 3D geometry, U can be non-zero, and we use the following equation to calculate the signed degree of linear polarization:
The negative sign indicates that the radiation is predominantly polarized in the direction perpendicular to the scattering plane. That is, P has the same sign as Q and I in the solar principal plane.
In the following, we call the directional dependence of radiance on the scattering angle I(Θ) the “phase curve” and the directional dependence of the degree of polarization P(Θ) the “polarized phase curve”.
The polarized bi-directional reflectance distribution matrix of the ocean surface is modelled using the reflectance matrix based on the Fresnel equations convolved with a Gaussian kernel to account for the ocean waves (Mishchenko and Travis, 1997; Tsang et al., 1985; Cox and Munk, 1954a, b). Water surface reflection causes very strong polarization in the sun glint. The wind speed which determines the spread of the sun glint region is set to 5 m s−1 if not specified otherwise. In this study, land surfaces are assumed to be Lambertian reflectors. That is, reflected radiation is completely unpolarized.
2.1 Model setup for 1D radiative transfer simulations and independent pixel approximation
All 1D simulations are performed for a clear-sky atmosphere and for a liquid cloud layer with a geometrical thickness of 1 km and a cloud top height of 3 km, respectively. The optical thickness of the cloud is varied between 1 and 50 (the values are set to 1, 3, 5, 10, 20, and 50). Cloud droplet sizes are gamma-distributed with an effective radius of 10 µm and an effective variance of 0.1. Cloud optical properties were calculated using the Mie program included in libRadtran (Mie, 1908; Wiscombe, 1980). Note that this simple setup is only used to illustrate the main sensitivities to cloud fraction and cloud optical thickness. Sensitivity studies with different model parameters are performed later in Sect. 3.2 and 3.3.
In order to calculate the Stokes vector for a partially cloudy pixel, we combine the clear-sky and cloudy simulations, in what is commonly called independent pixel approximation (IPA):
Here, c is the cloud fraction of the pixel, Iclear is the Stokes vector simulated for clear sky, and Icloudy is the Stokes vector simulated for cloudy sky. The degree of linear polarization of a partially cloudy pixel in the principal plane is
Note that this cannot be calculated as a linear combination of the individual degrees of polarization.
2.2 Model setup for 3D radiative transfer simulations
2.2.1 Two-dimensional cloud scene with a sharp cloud edge
In order to quantify the impact of 3D cloud scattering systematically, we define a scene where half of the domain is cloud-covered and the other half is clear sky. In this case, we can distinguish between the two basic 3D effects: in-scattering, when the cloudy side is illuminated, and shadowing, when the cloud casts a shadow on the surface. Such a sharp cloud edge is of course an extreme case for which we may expect the most significant 3D effects.
The 2D cloud is included in the same background atmosphere that is used for the 1D simulations (Sect. 2.1). The cloud height is between 1 and 2 km. As before, the effective radius of the cloud droplets is set to 10 µm and the vertical optical thickness is varied between 1 and 50. The wind speed is set to 5 m s−1 and the simulations are performed without aerosols. The domain size is set to 100 km with the cloud edge in the centre. We simulate polarized observations of the step cloud at the top of the atmosphere at a spatial resolution of 500 m in the x direction.
2.2.2 Randomly distributed box clouds
The second scenario should resemble shallow cumulus cloud fields with different cloud fractions. We define 5 × 5 pixels with a spatial resolution of 500 × 500 m2 and randomly fill the pixels with clouds. In this way we get cloud fields with cloud fractions of . The geometrical thickness of the clouds is 100 m, which is typical of shallow cumulus fields (e.g. Zhan et al., 2021). MYSTIC applies periodic boundary conditions, which means that the same clouds are repeated horizontally in the x and y directions. The background atmosphere and cloud microphysical properties are the same as for the 2D cloud edge (Sect. 2.2.1). We include an ocean surface, and as before the wind speed is set to 5 m s−1. We sample polarized radiances at the top of the atmosphere at a spatial resolution of 500 × 500 m2.
In this section we analyse the sensitivity of the polarized phase curve to the cloud fraction and cloud optical thickness based on 1D radiative transfer simulations and the IPA. In addition, we investigate the impact of wind speed, aerosols, and cloud altitude.
3.1 Phase curves for broken liquid clouds above an ocean surface
The results of the 1D simulations including an ocean surface and a cloud layer as defined in Sect. 2.1 are shown in the left column of Fig. 1. The blue line corresponds to the clear-sky simulation. The top row shows the total intensity I, the middle row the linearly polarized intensity which is equal to the Q component of the Stokes vector in the solar principal plane, and the bottom row the degree of linear polarization . The U component of the Stokes vector is zero in the principal plane. The images clearly show the broad sun glint region at scattering angles around 100°. The degree of linear polarization of the sun glint is close to 1 for clear sky (see the blue line in panel e). The Q component (panel c) is negative, which means that the polarization direction is perpendicular to the scattering plane.
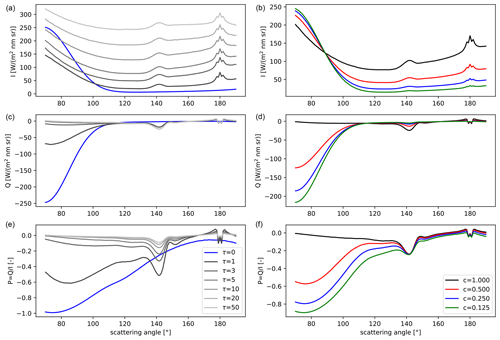
Figure 1(a, c, e) Sensitivity of the phase curve to cloud optical thickness τ at 667 nm. (b, d, f) Phase curve for fixed τ = 5 for various cloud fractions. All the simulations are for an ocean surface, a wind speed of 5 m s−1, and a solar zenith angle of 50°. The cloud droplet sizes are modelled using a gamma distribution with an effective radius of 10 µm and an effective variance of 0.1.
The grey lines in the left panels correspond to various cloud optical thicknesses from 1 (dark grey) to 50 (light grey). The intensity (unpolarized radiance I) increases with increasing cloud optical thickness since more radiation is reflected. The linearly polarized radiance Q saturates relatively quickly around τ = 5. All the curves show two distinct features, the cloudbow at scattering angles around 140° and the backscatter glory around 180°. In particular, the cloudbow is highly polarized. Looking at the Q results, we find that the linear polarization predominantly emerges from surface reflection at scattering angles around 80° and mainly from cloud scattering at angles around 140°.
We then calculate the Stokes vector for a fixed cloud optical thickness of 5 for cloud fractions between and 1 (fully cloudy). The results are shown in the right panels of Fig. 1. The black line corresponds to full cloud cover (c = 1) and is identical to the line for τ = 5 in the left panels. When we focus on the degree of linear polarization , we see that it does not depend on cloud fraction in the cloudbow region, whereas there is a strong dependence on cloud fraction in the glint region. The reason is that surface reflection causes strong polarization for angles smaller than about 110°. For partly cloudy pixels a part of the surface is seen by the observer, and therefore the degree of polarization is increased in glint directions compared to fully cloudy pixels. In the cloudbow region, only the cloud contributes to the degree of linear polarization. Therefore, the degree of linear polarization is not changed when a part of the surface becomes visible.
Using these dependencies allows us to generate a retrieval lookup table as illustrated in Fig. 2. Here, we plotted the degree of polarization at Θ = 140° (P(140°)) on the x axis and the degree of polarization at Θ = 90° (P(90°)) on the y axis. The blue lines correspond to constant cloud fraction values. That is, the upper light-blue line is for a cloud fraction of 1.0 (fully cloudy) and the lower dark-blue line is for a cloud fraction of 0.1. The grey lines correspond to constant cloud optical thickness values between 1 (dark grey) and 50 (light grey). The lookup table plot illustrates that cloud fraction and cloud optical thickness can be retrieved from the degree of linear polarization observed at the two viewing angles since the blue and grey lines separate nicely. Note that, since the cloud fraction is derived from the observation in the sun glint, the retrieved cloud fraction corresponds to the cloud fraction of the pixel observing the glint.
3.2 Retrieval lookup tables for various scenarios
Figure 3 shows polarized phase curves and the corresponding lookup tables for various scenarios. The upper row (a) corresponds to the scenario presented in the previous section, with an ocean surface and a wind speed of 5 m s−1.
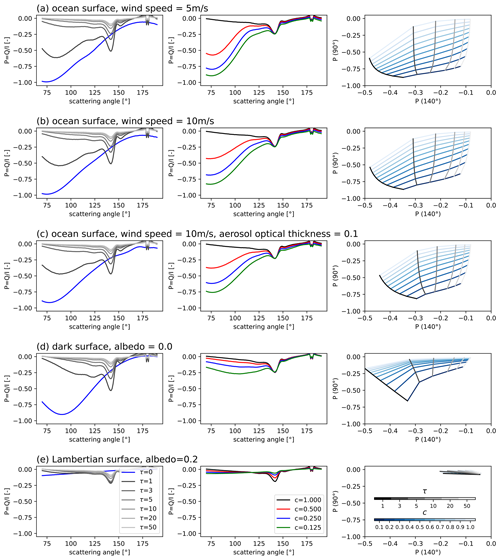
Figure 3Polarized phase curves and retrieval lookup tables for various scenarios. The left panels show simulations for a homogeneous cloud layer, and the grey lines correspond to different cloud optical thicknesses. The blue lines correspond to the clear-sky simulation. The middle panels show the polarized phase curves for partially cloudy pixels. The right panels show the corresponding retrieval lookup tables, with the line colours corresponding to Fig. 2.
To investigate the influence of wind speed on the polarized phase curve, we conducted identical simulations with a wind speed of 10 m s−1 (scenario b). We find that the maximum of for partially cloudy pixels is decreased, and the slope of is also smaller for scattering angles between 90 and 110°. The lookup table generated for higher wind speeds looks similar to that of the previous case and is just as good for retrieving optical thickness and cloud fraction.
The presence of aerosols also modifies the polarization state. Therefore, we repeated the simulations with additional aerosols corresponding to the mixture “maritime clean” as defined in the OPAC (Optical Properties of Aerosols and Clouds) database (Hess et al., 1998; Emde et al., 2016) with an aerosol optical thickness set to 0.1 (scenario c). Compared to the results without aerosols, we find that the degree of polarization is slightly decreased due to increased multiple scattering, as expected. Furthermore, the polarized phase curves closely follow the same pattern as scenario (a), and the lookup table also appears to be nearly identical.
Finally, we test whether the methodology would also work for land surfaces. We use a Lambertian surface as an approximation which depolarizes the reflected light completely. This is a realistic approximation as the largest polarized reflectances1 observed by the POLDER instrument over land are in the range between 0.02 and 0.04 (Maignan et al., 2009). Row (d) of Fig. 3 shows the simulations for a dark surface (albedo = 0.0, scenario d). The blue line in the left panel of row (d) shows the simulation for clear sky, and we see a high degree of polarization around the 90° scattering angle. When a cloud is added, the degree of polarization is smaller than for the corresponding cases over the ocean, because the polarized reflectance from Rayleigh scattering is much lower than from reflection in the sun glint, and the signal of the cloud dominates. The lookup table plot indicates that, for small cloud optical thicknesses and low cloud fractions, the lines are distinct, but as the cloud optical thickness increases, the lines converge. This convergence may lead to less accurate retrieval results for the same measurement accuracy. If the surface albedo is non-zero, this situation becomes worse. Row (e) of Fig. 3 shows the results for a surface albedo of 0.2. In this case the surface depolarizes and the entire lookup table is compressed, making retrieval impossible.
3.3 Dependence on various parameters, e.g. wind speed, aerosol properties, and cloud microphysics
To assess the robustness of the retrieval method, we performed additional sensitivity studies which are presented in Fig. 4. The base case for all the simulations is defined as follows: ocean surface, cloud layer at 2–3 km altitude with an optical thickness of τc = 5, cloud droplet effective radius 10 µm, wind speed 5 m s−1, aerosol optical thickness τa = 0.1, and solar zenith angle 50°. Starting from the base case, one of the parameters is varied, whereas all the other parameters are kept constant. We also include results for a scattering angle of 110°, i.e. not in the maximum of the sun glint. The panels in the left column of Fig. 4 show the sensitivities for P(140°), the middle ones correspond to P(110°), and those in the right column are for P(90°).
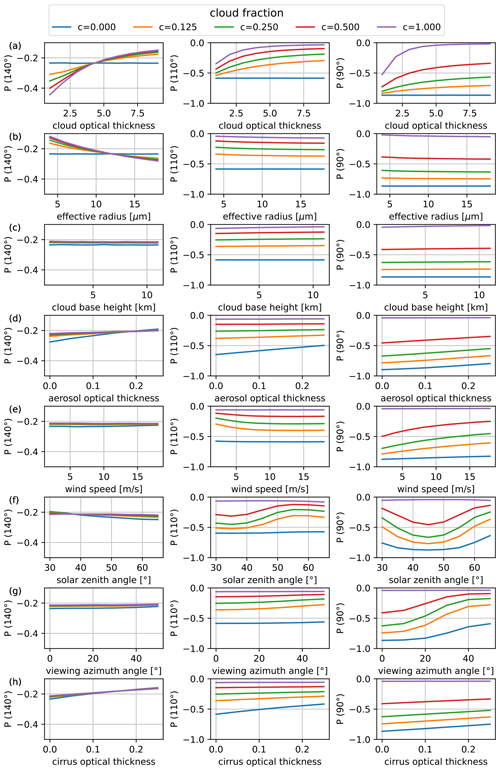
Figure 4Dependencies of the degree of polarization P = at scattering angles of 140° (left), 110° (middle), and 90° (right) on cloud optical thickness, cloud droplet effective radius, cloud base height, aerosol optical thickness, wind speed, solar zenith angle, and viewing azimuth angle. The colours correspond to cloud fractions between 0 and 1 (see the legend). All the simulations are for an ocean surface.
In scenario (a) the cloud optical thickness τc is varied: as shown before, decreases with increasing τc for all cloud fractions c. For τc ≲ 4, the lines corresponding to different cloud fractions separate, whereas, for larger τc, P(140°) is almost independent of cloud fraction. For P(110°) and P(90°) the lines corresponding to different cloud fractions are clearly separated. In scenario (b) the droplet effective radius is varied: here increases with increasing effective radius. This implies that, in order to retrieve an accurate optical thickness, the retrieval lookup table needs to be generated for the correct effective radius. Therefore, it makes sense to combine the retrieval with an effective radius retrieval based on the cloudbow signature. P(110°) and P(90°) are almost independent of the effective radius, and therefore the cloud fraction retrieval does not require prior information about the droplet size. In scenario (c) the cloud top height is varied, whereas the geometrical thickness of the cloud is kept constant at 1 km. P(140°), P(110°), and P(90°) are almost independent of cloud top height. This is a favourable outcome, suggesting that the retrieval process does not need prior information regarding cloud top height. In scenario (d) the aerosol optical thickness is varied: P(140°) remains constant, while and slightly decrease with increasing aerosol optical thickness τa. These findings indicate that having prior information about τa would enhance the accuracy of the cloud fraction retrieval. In scenario (e) the wind speed is varied: P(140°) is not impacted by the sun glint, and therefore it is independent of wind speed. P(90°) is independent of wind speed for clear-sky pixels and for fully cloudy pixels but not for partially cloudy pixels. Therefore, prior information about wind speed from independent observations should be taken into account. P(110°), at a scattering angle not in the centre of the sun glint, depends much less on wind speed. This shows that, if there is no prior knowledge of wind speed, it may be better to use P(110°) instead of P(90°), although the polarization signal is weaker. In scenario (f) the solar zenith angle is varied: again, P(140°) is constant but P(90°) and P(110°) vary, because the position of the glint depends on the solar zenith angle. The maximum of the glint is always at the mirror reflection angle. That is, it moves towards a larger scattering angle as the solar zenith angle increases. For a solar zenith angle of 45° the maximum of the sun glint is at a 90° scattering angle. In scenario (g) the viewing azimuth angle is varied, which does not have an impact on P(140°). For P(90°) the impact is quite large, because as the viewing azimuth angle changes, the observing direction moves away from the centre of the sun glint. For P(110°) this dependence is much weaker, as the viewing direction is not close to the centre of the sun glint. In order to test how much the retrieval is influenced by sub-visible cirrus clouds above the liquid clouds, we add an optically thin cirrus layer with a cloud top height of 11 km and a geometrical thickness of 1 km (scenario h). The effective radius of the crystals is set to 30 µm, and the parameterization of Baum et al. (2014) is applied to obtain the ice cloud optical properties. Generally we see, as expected, a decrease in the degree of polarization with increasing cirrus optical thickness at all the scattering angles. This means that with increasing cirrus optical thickness the retrieved liquid water cloud optical thickness will slightly decrease and the retrieved cloud fraction will slightly increase. The sub-visible cirrus layer does not block the glint. Therefore, the retrieved cloud fraction corresponds approximately to that of the liquid clouds.
In summary, the simulations suggest that the retrieval method is expected to deliver accurate cloud fractions and cloud optical thicknesses over the ocean, provided there is approximate prior information about wind speed and effective radius.
In this section we apply the retrieval to the polarized radiances obtained for the 3D model setups defined in Sect. 2.2.
4.1 Two-dimensional scene with a sharp cloud edge
Figure 5 shows a sketch of the 2D cloud scene, including relevant photon paths to explain the 3D effects. Photon 1 reaches the surface without interaction, then becomes highly polarized by reflection at the ocean surface, and afterwards passes through the cloud towards the observer. From the observer's perspective there is a cloud in the field of view, but the sun glint polarization is still partly visible. Photon 2 is similar, but the path through the cloud is shorter at the cloud edge, and therefore the polarization is less decreased. Photons 3 and 4 pass the cloud and are reflected by the ocean surface towards the observer. However, far fewer photons will reach the surface directly compared to clear-sky conditions. Therefore, from the observer's perspective, the degree of polarization in this clear-sky pixel will be reduced. Photons 5 and 6 are scattered on the cloudy side towards the observer at a scattering angle of 140°, i.e. in the cloudbow region. Due to the geometry of the cloud, additional photons are reflected on the cloudy side towards the observer, which results in an increase in intensity and polarization at the cloud edge. For photons 7 and 8 the optical thickness of the cloud is reduced compared to a 1D layer, reducing the probability of scattering in the cloud. Photon 8 passes through the cloud and is eventually scattered by a molecule.
Figure 6 shows polarized radiances computed for the 2D cloud as defined in Sect. 2.2.1 for the in-scattering geometry. The upper panels are for a scattering angle of 140° (cloudbow) and the lower panels for a scattering angle of 90° (sun glint). The simulations were performed at a spatial resolution of 500 m and averaged to obtain polarized radiances at a spatial resolution of 2.5 km (solid lines shown in Fig. 6). At the cloud edge we average over cloudy and clear-sky sub-pixels. In this way, we obtain results for cloud fractions of , , , and . The dashed lines show the corresponding 1D simulations where we combine clear-sky and cloudy simulation results using the IPA (Eq. 7). In the cloudbow we find as expected an increase in the absolute values of I and Q close to the cloud edge compared to the 1D simulations (see photon paths 5 and 6 in Fig. 5). On the clear-sky side (0–10 km), the magnitude of the degree of polarization is decreased compared to 1D. On the cloudy side (10–20 km) it is increased, which means that the retrieval will underestimate the optical thickness. In the sun glint, we find the most obvious differences for Q, with much higher absolute values compared to the 1D simulations. This is due to photons that reach the surface directly on the clear side of the domain, are reflected at the ocean surface, and traverse the cloud towards the observer at the top of the atmosphere (see photon paths 1 and 2 in Fig. 5). For these cases the retrieval will underestimate the cloud fraction.
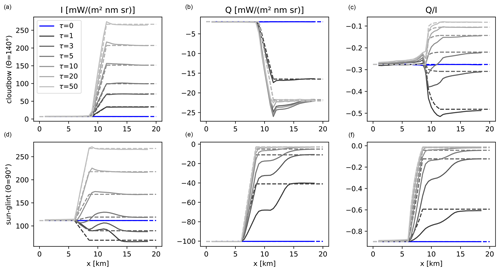
Figure 6In-scattering results for a sharp cloud edge: the solid lines show polarized radiances for in-scattering geometry averaged over a region of 2.5 km width. Panels (a), (b), and (c) are for a scattering angle of 140° (cloudbow), and panels (d), (e), and (f) are for a scattering angle of 90° (sun glint). The dashed lines correspond to 1D simulations combined by the IPA for partly cloud-covered pixels around the cloud edge. The blue lines correspond to clear sky and the grey lines to cloudy simulations with various optical thicknesses between 1 and 50.
Figure 7 presents the results for the cloud shadow geometry. Here the cloud is located between x = 0 km and x = 10 km. In the cloudbow, I is decreased at the cloud edge compared to 1D approximations because the optical thickness is apparently smaller (see photon paths 7 and 8 in Fig. 5). For Q the differences between 1D and 3D are relatively small. The magnitude of the degree of polarization is increased on the cloudy side and decreased on the clear side. In the sun glint geometry we find very large differences between 3D and 1D simulations in the cloud shadow. Naturally, I is decreased in the cloud shadow compared to clear sky. The magnitude of the degree of polarization is much smaller in the cloud shadow, which can be seen in Q and , obviously because photons cannot reach the surface directly (see photon paths 3 and 4 in Fig. 5). Due to the decreased degree of polarization, the retrieval will detect clouds in the cloud shadow region.
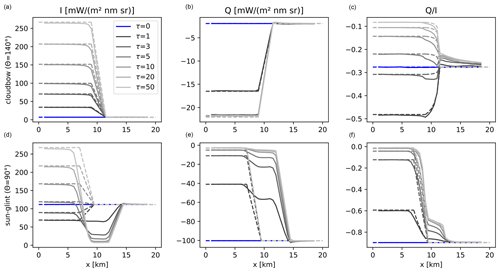
Figure 7Results in the cloud shadow geometry for a sharp cloud edge: the solid lines show polarized radiances for shadowing geometry averaged over a region of 2.5 km width. Panels (a), (b), and (c) are for a scattering angle of 140° (cloudbow), and panels (d), (e), and (f) are for a scattering angle of 90° (sun glint). The dashed lines correspond to 1D simulations combined with the IPA for partly cloud-covered pixels around the cloud edge. The blue lines correspond to clear sky and the grey lines to cloudy simulations with various optical thicknesses between 1 and 50.
Figure 8 shows the retrieval lookup table derived in Sect. 3 that includes all the results of the 3D simulations for the 2D step cloud. For better interpretation, we mark all results obtained for in-scattering geometry as circles and all results obtained for shadowing geometry as crosses. In the left panel, the colours of the points correspond to the cloud fraction of the region over which we have averaged (i.e. the input geometrical cloud fraction), and in the right panel the colours correspond to the vertical optical thickness of the cloud. We can check in these plots which of the retrieval points are correct and where the retrieval does not work correctly just by comparing the colours of the points to the colours of the lines in the lookup table plots. For the in-scattering, we see that fully cloud-covered pixels (light-blue circles) lie in the lookup table between the cloud fractions 0.8 and 1.0. The dark-blue crosses correspond to the points in the clear region, but many of these points lie on a vertical line along the τ = 3 isoline: these points correspond to simulations in the cloud shadow where a cloud is erroneously detected. The points corresponding to an optical thickness of 1 (black points in the right panel) lie outside the lookup table because in the cloudbow the magnitude of the degree of polarization in 3D is larger than in 1D for in-scattering and shadowing.
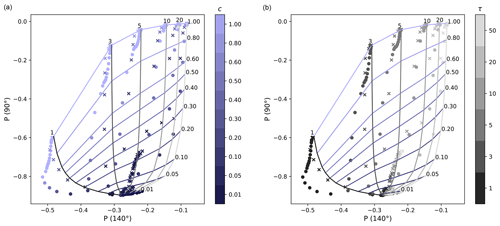
Figure 8Retrieval lookup table derived in Sect. 3 (Fig. 2), including the results of the 3D simulations for the 2D cloud with a sharp edge. The circles are for in-scattering and the crosses for shadowing. (a) The colours of the points correspond to the input cloud fraction, and (b) the colours correspond to the input vertical optical thickness.
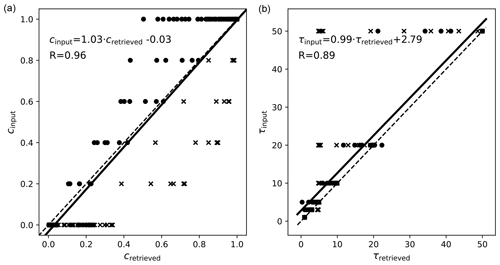
Figure 9Scatterplots of the retrieved and input cloud fractions (a) and optical thicknesses (b). The circles correspond to in-scattering and the crosses to shadowing. (b) Points with a retrieved cloud fraction smaller than 0.1 have been filtered out. The solid black line shows the linear regression line, and the dashed line is the 1:1 line. The equation of the linear regression lines and the correlation coefficient R are included in the figure.
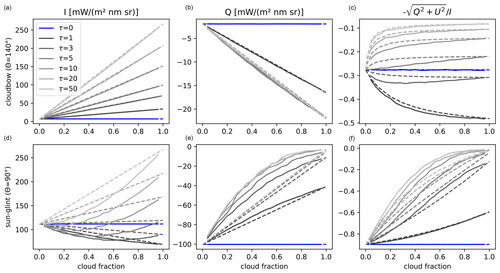
Figure 10Polarized radiance (I and Q) and degree of polarization P as a function of cloud fraction. The solid lines are for randomly distributed box clouds, and the dashed lines are IPA calculations. The spatial resolution of the individual grid boxes is 500 m2, and the vertical geometrical thickness of the cloud boxes is 100 m.
Figure 8 shows that 3D scattering effects cause significant biases in the retrieval results for cloud fraction and optical thickness. In order to validate these biases more quantitatively, we show the retrieved data against the input data as scatterplots in Fig. 9. In the scatterplots, the data points are located on horizontal lines because the input cloud fraction and optical thickness values are discretized. The left panel shows the retrieved cloud fraction against the input cloud fraction (vertical geometrical cloud fraction). The dots marked by filled circles correspond to the values obtained for the in-scattering geometry. As already discussed above, we find an underestimation of the cloud fraction, because in this geometry the degree of polarization for the 2D cloud scene is higher than for the corresponding 1D cloud layer. For the shadowing geometry (marked by crosses), the cloud fraction is overestimated because the degree of polarization is decreased in the shadow. Underestimation and overestimation can both become quite large for the extreme case of a sharp cloud edge. For example, for an input cloud fraction of 0.4, the retrieved cloud fractions are in the range between 0.2 and 0.9. The slope of the linear regression line is 1.03 and the correlation coefficient is 0.96. These values show that, although there is a large spread in the retrieved cloud fraction, the biases from in-scattering and shadowing almost cancel each other out in this particular case. The right panel shows the scatterplot for the optical thickness retrieval. Here we filtered out the points for which the retrieved cloud fraction is smaller than 0.1, because for very small cloud fractions the retrieval becomes insensitive to optical thickness. Generally, we find a good correlation between input and retrieved optical thickness, but there is a significant bias towards overly small retrieved optical thicknesses (the regression line is shifted to the left compared to the 1:1 line). This is the expected result, because we have seen for in-scattering and shadowing that the absolute value of the degree of polarization is larger in the 3D results than in the corresponding 1D results. The underestimation of the cloud optical thickness due to the neglect of 3D cloud scattering has also been observed for other cloud optical thickness retrieval methods (e.g. Zinner et al., 2010; Alexandrov et al., 2024). Note that we still look at the extreme case of a very sharp cloud edge, for which we expect very strong 3D scattering effects.
4.2 Randomly distributed box clouds
In the following, we present the results for the randomly distributed box clouds which resemble a shallow cumulus field (Fig. 10). In the cloudbow, I is only weakly influenced by 3D scattering effects. That is, the solid lines for the broken cloud fields lie on top of the dashed lines showing the IPA calculations. , which saturates quickly for τ ≥ 3, is slightly larger for 3D compared to IPA. This difference is enhanced in the degree of polarization shown in the right panels. In the sun glint, I is lower for 3D than for IPA due to cloud shadowing. Note that the apparent noise of the curves is due to the random cloud field generation, not Monte Carlo noise, which is less than 1 %. is decreased significantly in 3D compared to 1D, also due to cloud shadowing. Since the effect of shadowing is the same for I and Q, it partly cancels out in the degree of polarization, but still, is smaller in 3D compared to 1D. This effect will cause a systematic overestimation of the retrieved cloud fractions.
Figure 11 shows the retrieval lookup table that includes the results of the 3D simulations for the randomly distributed box clouds. The points corresponding to constant optical thickness values align next to the isolines of constant optical thickness but shifted to the left. This shows again that neglect of 3D scattering yields an underestimation of cloud optical thickness. The colours of the dots correspond to the geometrical cloud fraction of the model input. They roughly match the colours of the lines, indicating that the cloud fraction retrieval will yield reasonable results.
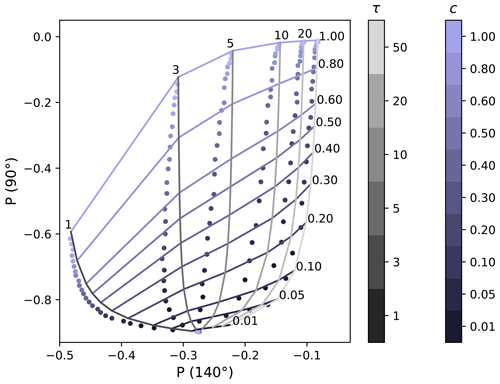
Figure 11Lookup table including the results of the 3D simulations for the randomly distributed box clouds. The colours of the dots correspond to the input geometrical cloud fraction.
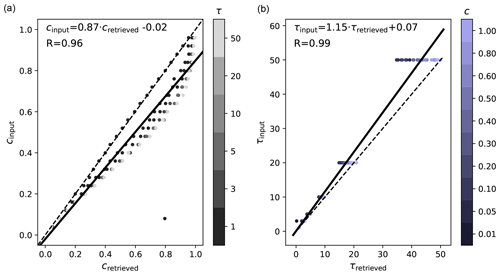
Figure 12Retrieval results for randomly distributed shallow clouds. Panel (a) shows the cloud fraction retrieval. The colours of the dots correspond to the input optical thicknesses. Panel (b) shows the optical thickness retrieval, and the colours of the dots correspond to the input cloud fraction. The solid black line shows the linear regression line, and the dashed black lines are the 1:1 lines. The equation of the linear regression line and the correlation coefficient R are included in the figures.
More quantitatively, Fig. 12 presents the retrieval results as scatterplots. The left panel shows the cloud fraction retrieval. As expected, we find a systematic overestimation of the retrieved cloud fraction, because the cloud shadows decrease the degree of polarization in the sun glint region. The error becomes larger for larger input optical thicknesses, as the colours of the dots indicate. Only the points corresponding to a cloud fraction of 1 (fully cloudy) lie exactly on the 1:1 line. Note that, for our specific case of shallow broken cloud fields, we do not get an underestimation of the cloud fraction due to in-scattering. The right panel shows the vertical optical thickness retrieval, which is biased towards overly small values and which is consistent with the cloud edge case. The underestimation increases with decreasing cloud fraction, as indicated by the colours of the dots in the right panel. There is one outlier for which the retrieved optical thickness is very small, and the cloud fraction is then largely overestimated. Overall, we obtain a very good correlation between the retrieval results and the input data for both the cloud fraction (R = 0.95) and the cloud optical thickness (R = 0.99).
All the results presented in this section are for a solar zenith angle of 50°. We have run the same simulations for solar zenith angles of 30 and 70° and found a similar performance of the retrieval. Generally, with increasing solar zenith angle the overestimation of cloud fraction increases. The underestimation of cloud optical thickness on the other hand decreases with increasing solar zenith angle.
In this section we test the retrieval method using airborne observations made by specMACS on the HALO (High Altitude and LOng Range research) aircraft during the EUREC4A (ElUcidating the RolE of Cloud-Circulation Coupling in ClimAte) measurement campaign (Stevens et al., 2021).
The specMACS instrument (Ewald et al., 2016) consists of two hyperspectral line cameras covering the spectral range from 400 to 2500 nm and two identical polarization-sensitive imaging cameras (Pörtge et al., 2023; Weber et al., 2024). The two polarization-sensitive cameras have a combined maximum field of view of about ±91° × ±117° (along track × across track). This results in a horizontal resolution of 10–20 m at the ground when the flight altitude is around 10 km. The cameras take images at an acquisition frequency of 8 Hz. The sensors include on-chip directional polarizing filters which allow us to measure the intensity and the linear polarization, i.e. the Stokes vector components I, Q, and U. These are geometrically and radiometrically calibrated (Weber et al., 2024). The central wavelengths (bandwidths) of the three channels of specMACS are approximately 621 nm (66 nm), 547 nm (117 nm), and 468 nm (82 nm). In the following we use data that were measured during the EUREC4A field campaign, which took place in January and February 2020 with a base in Barbados. All observations during the EUREC4A campaign were made over the ocean.
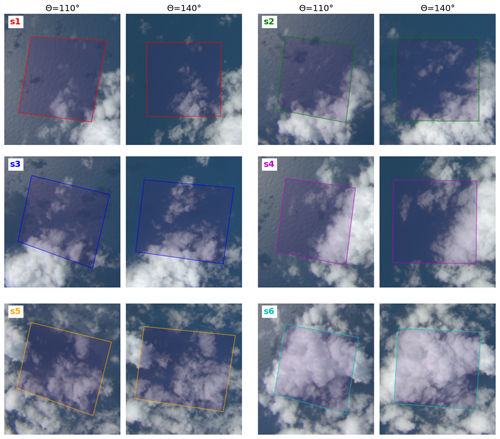
Figure 13Six selected cloud scenes s1 to s6 observed by specMACS over the ocean. The size of the shaded area in each image is approximately 2.5 × 2.5 km2. For each of the scenes, the cloud field is observed from different viewing directions during the overflight. In the left images of each scene, the average scattering angle over the shaded region is 110°, and in the right images it is 140°.
We selected six scenes including shallow cumulus clouds observed on 28 January 2020. These contain various cloud fractions, from almost clear to almost fully cloud-covered. The size of the scenes is approximately 2.5 × 2.5 km2, equivalent to the pixel size of e.g. HARP2, and the spatial resolution of the data is approximately 10 m. The images corresponding to the selected scenes s1 to s6 are presented in Fig. 13, where each cloud scene is shown at scattering angles around 110° (left) and at scattering angles around 140° (right). Note that, in the left images, the ocean surface is clearly brighter than in the right images due to the sun glint, whereas the brightness of the clouds is similar in both images. Across an image the scattering angle is not constant. Since we require observations at particular scattering angles, we use the geo-localization as described in Kölling et al. (2019) and Pörtge et al. (2023) in order to obtain all pixels in the chosen region for a given scattering angle. Pixels obtained using this method are averaged to get the Stokes vector of a selected scene for a given scattering angle. Combining all the scattering angles results in the phase curves which are shown in Fig. 14 for the selected scenes for the red channel of specMACS centred at 621 nm. Since the observations are not made exactly in the solar principal plane, the U component of the Stokes vector becomes non-zero, and we use Eq. (6) to calculate the signed degree of linear polarization. As expected, we find that decreases with increasing cloud amount in the scenes (s1 is the scene including very few clouds, and s6 is almost fully cloud-covered).
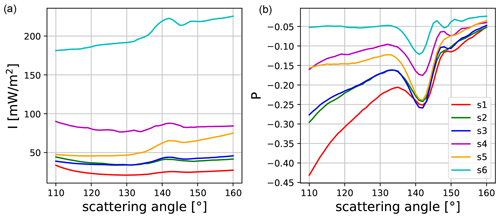
Figure 14Phase curves of I and P observed by specMACS in the red channel centred at 621 nm for the selected scenes, which are shown in the images of Fig. 13.
In order to retrieve cloud fraction and cloud optical thickness from specMACS data, we generate a lookup table for the specific time and conditions when the observations were made. We performed monochromatic simulations for the centre wavelength of the red channel (621 nm). The solar zenith angle was 46.5°, and we know that the total column aerosol optical thickness on this particular day was about 0.08 (Chazette et al., 2022). For simplicity, we use a typical wind speed of 5 m s−1, which is in agreement with Special Sensor Microwave Imager Sounder (SSMIS) observations (Wentz et al., 2012). We also applied standard values for the water cloud droplet size distribution: an effective radius of 10 µm and an effective variance of 0.1. The results of the cloudbow retrieval (Pörtge et al., 2023) show that these values are reasonable (Table 1). As we demonstrated in the sensitivity analysis in Sect. 3.2, inaccurate assumptions about cloud size distribution parameters produce errors in the retrieval of cloud optical thickness, while the cloud cover retrieval is not affected much. For the selected scenes, we also generated lookup tables using the cloud size distribution parameters from the cloudbow retrieval. Of course, it would make sense to combine the method with further retrieval algorithms, e.g. with the simultaneous aerosol and ocean glint retrieval of Knobelspiesse et al. (2011). When accurate a priori information about wind speed and aerosol optical thickness is included, one should also take into account the filter function of the instrument rather than run monochromatic simulations to generate the lookup table. These improvements are not necessarily needed to demonstrate the method for a few specific cases, which is the purpose of this study. With specMACS we also cannot obtain scattering angles of 140 and 90° for the same region, and therefore we use 140 and 110° to generate the lookup table shown in Fig. 15. The lookup table based on 140 and 110° that we use for the specMACS data is slightly more tilted compared with the lookup table based on 140 and 90° that was mainly presented until now (Fig. 2). Nevertheless, the lookup table for the specMACS data still appears to be well suited to applying the method. The coloured dots plotted on top of the lookup table correspond to the observational data of the six selected scenes. The grey dots show all the other data points that were measured with specMACS. Using a bi-linear interpolation between the simulated grid points of the lookup table, we retrieve the values for cloud optical thickness τ and cloud fraction c as included in the legend of Fig. 15.
Table 1Retrieval results for the selected scenes. τ1 and c1 are the cloud optical thickness and the cloud fraction derived from the degree of linear polarization at 110 and 140° assuming constant values of reff = 10 µm and veff = 0.01. τ2 and c2 correspond to the retrieval results, taking into account reff and veff from the cloudbow retrieval (last two columns). c3 is the fraction of cloudy pixels in a scene, which is determined by applying a cloud detection algorithm to the high-spatial-resolution data.
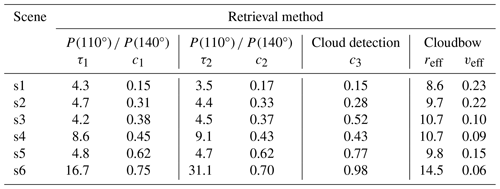
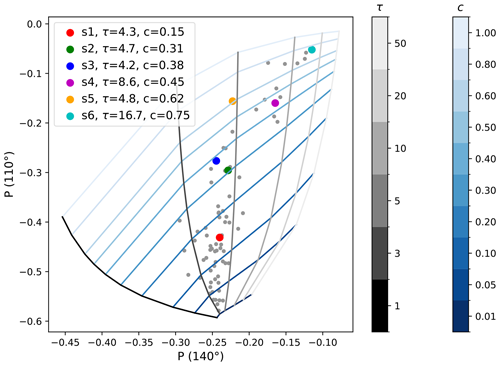
Figure 15Retrieval lookup table and observational data. The coloured dots represent the observed values of the six selected scenes shown in Fig. 13. The legend includes the retrieved optical thickness and the cloud fraction values for these points. The grey dots are all data points gathered during one research flight on 28 January 2020 (observations averaged to 2.5 km spatial resolution).
We also employed the cloud detection method outlined in Pörtge et al. (2023) for the images of the selected scenes to determine the geometrical cloud fraction of the scenes at the original (high) resolution of the images. The method is based on the algorithm described in Otsu (1979), which determines a threshold to separate the pixels of an image into two classes (here, cloudy versus non-cloudy) based on a brightness histogram. Such threshold-based cloud detection algorithms often struggle with the bright sun glint reflection. Our algorithm uses the parallel component of polarized light in which the reflectance of the sun glint is reduced, which in turn reduces the number of incorrect classifications in (clear-sky) sun glint areas. The algorithm distinguishes between cloud-free coverage, low to medium cloud coverage, and high cloud coverage. For cloud-free scenes it uses the data of the blue channel, for scenes with low to medium cloud coverage the data of the red channel, and otherwise the normalized red (r) to blue (b) ratio (). This procedure was performed by tuning the cloud mask for many different scenes (over both land and water). Figure 16 shows two example measurements with contour lines of the calculated cloud mask in light green. This figure illustrates that the algorithm correctly identifies the large cloud structures but misses some of the smaller and optically thinner clouds. Until now, the cloud detection method has mainly been used to identify measurements that are suitable for the microphysical cloudbow retrieval of Pörtge et al. (2023). Therefore, the algorithm was tuned to minimize the number of falsely classified clouds (e.g. due to the sun glint).
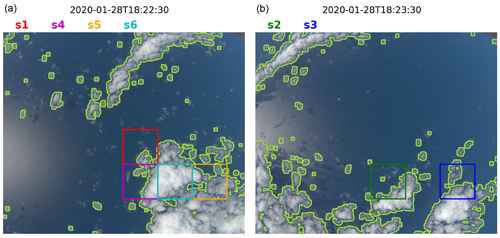
Figure 16RGB images at two times (a: 18:22:30 and b: 18:23:30 UTC) with a cloud mask as light-green lines. The regions of the selected scenes s1 to s6 are indicated as coloured boxes.
The coloured boxes in Fig. 16 indicate the positions of the six scenes (s1 to s6) from which the (pixel-based) cloud fraction is calculated. It should be noted that, using this approach, the cloud fraction depends on the viewing angle, but this dependence is relatively small for shallow clouds. Again, please note the difference between the two approaches: the threshold-based results correspond to a pixel-by-pixel cloud fraction and the lookup table allows a retrieval of the cloud fraction, which is independent of spatial resolution and does not rely on thresholds.
The results for the selected scenes are included in Table 1: τ1 and c1 are, respectively, the optical thickness and the cloud fraction obtained from the lookup table retrieval using constant cloud size distribution parameters as input. τ2 and c2 are obtained when the retrieval is combined with the cloudbow retrieval, taking into account the retrieved effective radius reff and effective variance veff, which are also given in the table. c3 is the (threshold-based) cloud fraction, which is defined as the ratio of the number of cloudy pixels to the total number of pixels in the high-spatial-resolution image. For scene s1 we obtain τ1 = 4.3 and c1 = 0.15 from the lookup table using constant cloud size distribution parameters. When the retrieved size distribution parameters from the cloudbow retrieval are used, the optical thickness is reduced to τ1 = 3.5 and the cloud fraction is slightly increased to c2 = 0.17. The threshold-based cloud fraction for this case is c3 = 0.15, which agrees very well with the lookup-table-based results. For scene s2 the lookup table yields optical thicknesses of τ1 = 4.7 and τ2 = 4.4 and cloud fractions of c1 = 0.31 and c2 = 0.33, which are slightly larger than the threshold-based cloud fraction c3 = 0.28. For scene s3 the threshold-based cloud fraction of c3=0.52 is much larger than that of scene s2, which is not so clearly visible when comparing the images in Fig. 13. Looking at the contours of the cloud mask in Fig. 16, we see that for s3 a large region including thin clouds is marked as cloudy, whereas in s2 several thin clouds are not detected. The lookup-table-based cloud fraction values are smaller (c1 = 0.38 and c2 = 0.37) and therefore only slightly larger than those derived for s2. The cloud optical thickness values (τ1 = 4.2 and τ2 = 4.5) are also similar to s2. For s4, all retrieved cloud fractions agree well (c1 = 0.45, c2 = 0.43, and c3 = 0.43). The optical thicknesses are larger than in the previous scenes (τ1 = 8.6 and τ2 = 9.1). For scene s5 the lookup table retrievals yield the same cloud fraction of c1,2 = 0.62. The threshold-based cloud fraction is significantly higher at c3 = 0.77. The cloud optical thickness for s5 is relatively small (τ1 = 4.8 and τ2 = 4.7). For all the scenes discussed so far, the error due to the assumption of constant size distribution parameters was relatively small. This is different in the last scene, s6, for which the cloudbow retrieval yields a significantly larger effective radius of 14.5 µm. Here, the retrieved optical thickness is almost doubled (τ1 = 16.7 and τ2 = 31.1) when the correct size distribution is used to generate the lookup table. The impact on the cloud fraction retrieval is relatively small (c1= = 0.75 and c2 = 0.70). The cloud detection algorithm classifies almost all the pixels in s6 as cloudy, resulting in a cloud cover of c3 = 0.98. Looking at the images in Fig. 13, it seems that there are some clear-sky areas in the lower-right parts which are classified as cloudy by the cloud detection algorithm. However, visually the cloud fraction looks larger than 0.75, so we cannot clearly conclude which of the methods performs better for the specific scene s6.
The grey dots included in the lookup table in Fig. 15 correspond to all specMACS observations made during a 1 h period of the research flight on 28 January 2020, for which the viewing azimuth angle is not more than 40° away from the principal plane, making sure that the sun glint is contained. In this range, P(110°) does not depend much on the viewing azimuth angle (Fig. 4). All the dots are within the lookup table grid, which means that the retrieval yields values for each observation. The retrieved cloud fractions and optical thicknesses are shown as histograms in Fig. 17. The EUREC4A campaign focused on shallow cumulus clouds which were also observed on 28 January 2020. The optical thickness of this type of cloud is usually quite small, which can also be seen in the cloud optical thickness histogram that we obtain for this particular flight, showing an optical thickness below 10 for the majority of the points. A large range of cloud fraction values between 0 and 0.8 is covered by the observations when the cloud detection algorithm is evaluated over areas of 2.5 × 2.5 km2. The majority of the points have relatively low cloud fractions (i.e. smaller than 0.2). In Fig. 18, the retrieved cloud fractions obtained through the lookup table method are plotted on the x axis against the retrieved cloud fractions obtained through the threshold method on the y axis. The linear regression line has a slope of 0.87, and the correlation coefficient is 0.79. The scatterplot demonstrates that the threshold-based retrieval often results in larger cloud fractions compared to the lookup-table-based retrieval, a pattern consistently observed in the selected scenes s5 and s6. The strong correlation confirms that the straightforward lookup table retrieval method provides reasonable cloud fraction values for the observations from the entire flight.
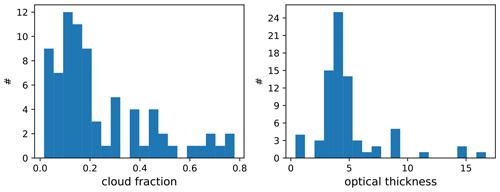
Figure 17Histogram of retrieved cloud fractions and optical thicknesses using the lookup table method.
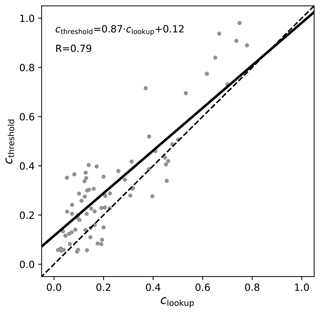
Figure 18Scatterplot of the retrieved cloud fractions: clookup is the cloud fraction derived using the lookup table method from the polarized reflectance at two viewing angles. cthreshold is the ratio of cloudy pixels to the total number of pixels within an area of size 2.5 ×2.5 km2 contained in a specMACS image with a spatial resolution of about 10 m. The equation of the linear regression line (black line) is included in the figure together with the regression coefficient R.
We have presented an innovative approach to retrieve the cloud fraction and optical thickness of liquid clouds over the ocean from multi-angle polarization observations over the ocean. This retrieval method could be a valuable addition, for instance, to the cloud retrieval chain for the PACE mission that includes the polarimeters HARP2 and SPEXone. Here it should be combined with other retrieval methods to obtain required a priori information about aerosol optical thickness, wind speed, and cloud droplet size distribution. Given the typical spatial resolution of upcoming polarized satellite-based measurements of approximately 2–3 km, this technique becomes particularly valuable for acquiring sub-pixel information about clouds. Unlike most other cloud fraction retrieval methods, our approach does not depend on the spatial resolution of the observations, and it also does not require any thresholds for cloud detection. The fundamental principle of this method lies in the angular polarization patterns generated by the interaction of radiation with the liquid water clouds and water surface. Specifically, cloud scattering generates polarization at cloudbow scattering angles, while ocean surface reflection results in the strongly polarized sun glint around the mirror reflection angle. Consequently, by analysing the angular polarization pattern, we can separate the contributions of clouds and the surface to the observed polarized intensity. Our sensitivity study reveals that a complete angular pattern of polarized intensity is not required. Instead, two specific scattering angles – one within the cloudbow and one within the sun glint – are sufficient. Utilizing a 1D vector radiative transfer code, we generated the retrieval lookup tables that include the simulated degree of polarization at 140 and 90° scattering angles for various cloud optical thicknesses between 0 and 50. To calculate polarized intensities for partially cloudy pixels, we employed the independent pixel approximation. We also generated lookup tables using scattering angles of 140 and 110° and again obtained a well-separated lookup table grid. This demonstrates that it is not important to choose exact scattering angles to set up the retrieval: one only has to make sure that one angle includes the cloudbow and that the second angle is a part of the sun glint.
We examined the influence of cloud droplet size, cloud top height, aerosol optical thickness, and wind speed on retrieval accuracy. We found that the retrieval results are almost independent of cloud top height. The cloud fraction retrieval depends slightly on aerosol optical thickness and wind speed. Therefore, prior knowledge of these parameters is advantageous. The retrieval of cloud optical thickness depends on droplet radius. Hence, deriving this parameter, for instance, through methods like cloudbow retrieval can significantly enhance accuracy.
We investigated the impact of 3D cloud scattering by generating synthetic observations for simple cloud cases. The first is a 2D scene, which is clear in one half of the domain and cloudy in the other half. At such a sharp cloud edge we expect strong 3D effects, i.e. shadowing on the one side and in-scattering on the other side. We find that shadowing leads to a systematic overestimation of the cloud fraction, whereas in-scattering leads to a systematic underestimation. The cloud optical thickness is generally underestimated due to the neglect of 3D cloud scattering. In a second setup, we generated random cloud fields consisting of box clouds with various cloud fractions. This setup resembles a shallow cumulus cloud field, and it allows us to systematically investigate the impact of 3D cloud scattering as a function of cloud cover. For this setup we found that the retrieval systematically overestimates the cloud fraction and underestimates the cloud optical thickness, similar to the cloud edge case. The cloud fraction underestimation is not observed in this scenario. The value of the bias depends on many characteristics of the cloud field, in particular the horizontal and vertical distributions of the clouds. In addition, the geometrical thickness of the clouds plays a significant role since it directly determines the size of the cloud shadows.
We tested the method using specMACS observations conducted on board the HALO aircraft during the EUREC4A campaign, focusing on shallow cumulus clouds over the ocean. Operating at a high spatial resolution of approximately 10–20 m, specMACS data were averaged over domains of approximately 2.5 × 2.5 km2 to emulate satellite observations. Subsequently, the retrieval method was applied to the resulting degree of polarization at scattering angles of 140 and 110°. The retrieved optical thicknesses were typically below 10, a realistic range for the observed cloud type, and cloud fractions in the range between 0 and 0.8 were retrieved. We selected six scenes representing low, medium, and high cloud fractions. We analysed the high-resolution images to visually verify the consistency between the retrieved cloud fraction and the images. Additionally, we applied another cloud fraction retrieval method based on (automatically determined) intensity thresholds (Pörtge et al., 2023; Otsu, 1979). We find a good correlation between the results of the two cloud fraction retrieval methods, providing further evidence of the performance of the straightforward lookup table retrieval approach.
In a subsequent study, we intend to further evaluate the accuracy of the retrieval method using synthetic data based on more realistic clouds generated using a large eddy simulation (LES). As we know the true optical thicknesses and cloud fractions for the synthetic dataset, assessing the retrieval accuracy becomes straightforward by comparing the obtained results with the model input. This approach will enable us to quantify the effects of 3D cloud scattering, including in-scattering and shadowing, on the retrieval results. We have successfully applied this methodology to validate the accuracy of the cloud microphysics retrieval (Volkmer et al., 2024) and to investigate the impact of 3D cloud scattering on trace gas retrievals (Emde et al., 2022; Yu et al., 2022; Kylling et al., 2022). In this paper we have presented 3D effects based on simplified cloud scenes. For the case with the cloud edge, we found large underestimations of the cloud fractions on the in-scattering side and large overestimations on the shadowing side. Realistic cloud scenes include shadowing and in-scattering simultaneously, and the extent to which these two effects cancel out should be investigated.
The methodology could be applied to the satellite observations, e.g. HARP2 data. The cloud fraction retrieval should be compared to the obtained pixel-by-pixel cloud fraction of images captured by the Ocean Color Instrument (OCI) on board PACE, which operates at a higher spatial resolution of 1.2 × 1.2 km2. When applied to satellite observations, the coverage for nearly simultaneous measurements of two scattering angles (glint and cloudbow) must be evaluated. The retrieved cloud fraction corresponds to that of the pixel observing the sun glint. Since the viewing direction of the corresponding pixels is not constant, the retrieved cloud fraction will be biased compared to the vertically projected cloud fraction, which is commonly used as a model diagnostic. This bias will vary regionally and seasonally. A detailed investigation of the distribution of this bias should be performed, and based on this a bias correction method needs to be developed.
The derived cloud fraction of shallow cumulus clouds over the ocean should be compared to the results of Dutta et al. (2020), who found cloud fraction reductions of more than 0.4 when the spatial-resolution error is corrected. For climate and weather model validation, the global cloud fraction is an important quantity. The method we have presented provides the cloud fraction only for liquid water clouds over the ocean. Therefore, our method needs to be adapted for ice clouds, which should be relatively straightforward by replacing the degree of polarization in the cloudbow with the intensity at a scattering angle outside the sun glint region. The development of a cloud fraction retrieval over land surfaces is more challenging because land surface reflection causes only weak polarization. However, the Rayleigh scattering in clear regions between the clouds produces a strong polarization signal that should contain information about the cloud fraction and could be used similarly to the glint polarization in the retrieval method presented here.
The 1D version of the MYSTIC code that has been applied for most radiative transfer simulations in this study is part of the libRadtran library for radiative transfer (Emde et al., 2016, https://doi.org/10.5194/gmd-9-1647-2016; Mayer and Kylling, 2005, https://doi.org/10.5194/acp-5-1855-2005), which can be obtained from https://www.libradtran.org (last access: 18 November 2024). The 3D version of MYSTIC is not publicly available but is available on request in joint projects.
The specMACS data used in this study are available upon request from Veronika Pörtge (veronika.poertge@physik.uni-muenchen.de).
CE carried out the sensitivity studies, set up the retrieval method, performed the tests on specMACS observations, and wrote the manuscript. VP provided the specMACS data, including the observed polarized radiances and the retrieval results (cloud fraction and cloud microphysics). This study was inspired by MM's work on cloud fraction retrieval for exoplanets using polarized observations. MM and BM helped to set up and improve the retrieval methodology. All the authors contributed to the interpretation of the results and helped to improve the manuscript.
At least one of the (co-)authors is a member of the editorial board of Atmospheric Measurement Techniques. The peer-review process was guided by an independent editor, and the authors also have no other competing interests to declare.
Publisher’s note: Copernicus Publications remains neutral with regard to jurisdictional claims made in the text, published maps, institutional affiliations, or any other geographical representation in this paper. While Copernicus Publications makes every effort to include appropriate place names, the final responsibility lies with the authors.
We thank two reviewers for valuable comments that helped to improve the manuscript.
This paper was edited by Andrew Sayer and reviewed by Babak Jahani and one anonymous referee.
Alexandrov, M. D., Cairns, B., Emde, C., and Van Diedenhoven, B.: Correction of cloud optical thickness retrievals from nadir reflectances in the presence of 3D radiative effects. Part I: concept and tests on 3D RT simulations, Frontiers in Remote Sensing, 5, 1397631, https://doi.org/10.3389/frsen.2024.1397631, 2024. a
Anderson, G., Clough, S., Kneizys, F., Chetwynd, J., and Shettle, E.: AFGL atmospheric constituent profiles (0–120 km), Tech. Rep. AFGL-TR-86-0110, Air Force Geophys. Lab., Hanscom Air Force Base, Bedford, MA, NTIS Issue Number: 198707, https://ntrl.ntis.gov/NTRL/dashboard/searchResults/titleDetail/ADA175173.xhtml (last access: 18 November 2024), 1986. a
Baum, B. A., Yang, P., Heymsfield, A. J., Bansemer, A., Merrelli, A., Schmitt, C., and Wang, C.: Ice cloud bulk single-scattering property models with the full phase matrix at wavelengths from 0.2 to 100 µm, J. Quant. Spectrosc. Ra., 146, 123–139, https://doi.org/10.1016/j.jqsrt.2014.02.029, 2014. a
Buras, R. and Mayer, B.: Efficient unbiased variance reduction techniques for Monte Carlo simulations of radiative transfer in cloudy atmospheres: The solution, J. Quant. Spectrosc. Ra., 112, 434–447, 2011. a
Chandrasekhar, S.: Radiative Transfer, Oxford University Press, UK, ISBN: 9780486605906 1950. a
Chazette, P., Baron, A., and Flamant, C.: Mesoscale spatio-temporal variability of airborne lidar-derived aerosol properties in the Barbados region during EUREC4A, Atmos. Chem. Phys., 22, 1271–1292, https://doi.org/10.5194/acp-22-1271-2022, 2022. a
Cox, C. and Munk, W.: Measurement of the roughness of the sea surface from photographs of the sun's glitter, J. Opt. Soc. Am., 44, 838–850, 1954a. a
Cox, C. and Munk, W.: Statistics of the sea surface derived from sun glitter, J. Mar. Res., 13, 198–227, 1954b. a
Di Girolamo, L. and Davies, R.: Cloud fraction errors caused by finite resolution measurements, J. Geophys. Res.-Atmos., 102, 1739–1756, https://doi.org/10.1029/96JD02663, 1997. a
Dutta, S., Di Girolamo, L., Dey, S., Zhan, Y., Moroney, C. M., and Zhao, G.: The Reduction in Near-Global Cloud Cover After Correcting for Biases Caused by Finite Resolution Measurements, Geophys. Res. Lett., 47, e2020GL090313, https://doi.org/10.1029/2020GL090313, 2020. a, b
Emde, C., Buras, R., Mayer, B., and Blumthaler, M.: The impact of aerosols on polarized sky radiance: model development, validation, and applications, Atmos. Chem. Phys., 10, 383–396, https://doi.org/10.5194/acp-10-383-2010, 2010. a, b
Emde, C., Barlakas, V., Cornet, C., Evans, F., Korkin, S., Ota, Y., Labonnote, L. C., Lyapustin, A., Macke, A., Mayer, B., and Wendisch, M.: IPRT polarized radiative transfer model intercomparison project - Phase A, J. Quant. Spectrosc. Ra., 164, 8–36, https://doi.org/10.1016/j.jqsrt.2015.05.007, 2015. a
Emde, C., Buras-Schnell, R., Kylling, A., Mayer, B., Gasteiger, J., Hamann, U., Kylling, J., Richter, B., Pause, C., Dowling, T., and Bugliaro, L.: The libRadtran software package for radiative transfer calculations (version 2.0.1), Geosci. Model Dev., 9, 1647–1672, https://doi.org/10.5194/gmd-9-1647-2016, 2016. a, b
Emde, C., Barlakas, V., Cornet, C., Evans, F., Wang, Z., Labonotte, L. C., Macke, A., Mayer, B., and Wendisch, M.: IPRT polarized radiative transfer model intercomparison project – Three-dimensional test cases (phase B), J. Quant. Spectrosc. Ra., 209, 19–44, https://doi.org/10.1016/j.jqsrt.2018.01.024, 2018. a, b
Emde, C., Yu, H., Kylling, A., van Roozendael, M., Stebel, K., Veihelmann, B., and Mayer, B.: Impact of 3D cloud structures on the atmospheric trace gas products from UV–Vis sounders – Part 1: Synthetic dataset for validation of trace gas retrieval algorithms, Atmos. Meas. Tech., 15, 1587–1608, https://doi.org/10.5194/amt-15-1587-2022, 2022. a
Ewald, F., Kölling, T., Baumgartner, A., Zinner, T., and Mayer, B.: Design and characterization of specMACS, a multipurpose hyperspectral cloud and sky imager, Atmos. Meas. Tech., 9, 2015–2042, https://doi.org/10.5194/amt-9-2015-2016, 2016. a
Fougnie, B., Marbach, T., Lacan, A., Lang, R., Schlüssel, P., Poli, G., Munro, R., and Couto, A. B.: The multi-viewing multi-channel multi-polarisation imager – Overview of the 3MI polarimetric mission for aerosol and cloud characterization, J. Quant. Spectrosc. Ra., 219, 23–32, https://doi.org/10.1016/j.jqsrt.2018.07.008, 2018. a
Hansen, J. E. and Travis, L. D.: Light scattering in planetary atmospheres, Space Sci. Rev., 16, 527–610, 1974. a
Hasekamp, O. P.: Capability of multi-viewing-angle photo-polarimetric measurements for the simultaneous retrieval of aerosol and cloud properties, Atmos. Meas. Tech., 3, 839–851, https://doi.org/10.5194/amt-3-839-2010, 2010. a
Hess, M., Koepke, P., and Schult, I.: Optical Properties of Aerosols and Clouds: The Software Package OPAC, B. Am. Meteorol. Soc., 79, 831–844, 1998. a
Intergovernmental Panel On Climate Change: Technical Summary, in: Climate Change 2013 – The Physical Science Basis, Cambridge University Press, 1st edn., 31–116, https://doi.org/10.1017/CBO9781107415324.005 ISBN 9781107057999, 9781107661820, 9781107415324, 2014. a
Intergovernmental Panel On Climate Change: Climate Change 2021 – The Physical Science Basis: Working Group I Contribution to the Sixth Assessment Report of the Intergovernmental Panel on Climate Change, Cambridge University Press, 1st edn., https://doi.org/10.1017/9781009157896, ISBN 9781009157896, 2023. a
Knobelspiesse, K., Cairns, B., Redemann, J., Bergstrom, R. W., and Stohl, A.: Simultaneous retrieval of aerosol and cloud properties during the MILAGRO field campaign, Atmos. Chem. Phys., 11, 6245–6263, https://doi.org/10.5194/acp-11-6245-2011, 2011. a
Kölling, T., Zinner, T., and Mayer, B.: Aircraft-based stereographic reconstruction of 3-D cloud geometry, Atmos. Meas. Tech., 12, 1155–1166, https://doi.org/10.5194/amt-12-1155-2019, 2019. a
Kurucz, R. and Bell, B.: Extraterrestrial solar spectrum from 200–200 000 nm, Smithonian Astrophys. Obs., CD Rom No. 23, https://doi.org/10.17616/R34W7N, 1995. a
Kylling, A., Emde, C., Yu, H., van Roozendael, M., Stebel, K., Veihelmann, B., and Mayer, B.: Impact of 3D cloud structures on the atmospheric trace gas products from UV–Vis sounders – Part 3: Bias estimate using synthetic and observational data, Atmos. Meas. Tech., 15, 3481–3495, https://doi.org/10.5194/amt-15-3481-2022, 2022. a
Maignan, F., Bréon, F.-M., Fédèle, E., and Bouvier, M.: Polarized reflectances of natural surfaces: Spaceborne measurements and analytical modeling, Remote Sens. Environ., 113, 2642–2650, https://doi.org/10.1016/j.rse.2009.07.022, 2009. a
Mayer, B.: Radiative transfer in the cloudy atmosphere, Eur. Physical J. Conf., 1, 75–99, 2009. a
Mayer, B. and Kylling, A.: Technical note: The libRadtran software package for radiative transfer calculations - description and examples of use, Atmos. Chem. Phys., 5, 1855–1877, https://doi.org/10.5194/acp-5-1855-2005, 2005. a
Mie, G.: Beiträge zur Optik trüber Medien, speziell kolloidaler Metallösungen, Ann. Phys., 330, 377–445, https://doi.org/10.1002/andp.19083300302, 1908. a
Mishchenko, M. I. and Travis, L. D.: Satellite retrieval of aerosol properties over the ocean using polarization as well as intensity of reflected sunlight, J. Geophys. Res., 102, 16989–17013, 1997. a
Otsu, N.: A Threshold Selection Method from Gray-Level Histograms, IEEE T. Syst. Man Cyb., 9, 62–66, https://doi.org/10.1109/TSMC.1979.4310076, 1979. a, b
Platnick, S., Meyer, K. G., King, M. D., Wind, G., Amarasinghe, N., Marchant, B., Arnold, G. T., Zhang, Z., Hubanks, P. A., Holz, R. E., Yang, P., Ridgway, W. L., and Riedi, J.: The MODIS Cloud Optical and Microphysical Products: Collection 6 Updates and Examples From Terra and Aqua, IEEE T. Geosci. Remote, 55, 502–525, https://doi.org/10.1109/TGRS.2016.2610522, 2017. a
Pörtge, V., Kölling, T., Weber, A., Volkmer, L., Emde, C., Zinner, T., Forster, L., and Mayer, B.: High-spatial-resolution retrieval of cloud droplet size distribution from polarized observations of the cloudbow, Atmos. Meas. Tech., 16, 645–667, https://doi.org/10.5194/amt-16-645-2023, 2023. a, b, c, d, e, f
Remer, L. A., Knobelspiesse, K., Zhai, P.-W., Xu, F., Kalashnikova, O. V., Chowdhary, J., Hasekamp, O., Dubovik, O., Wu, L., Ahmad, Z., Boss, E., Cairns, B., Coddington, O., Davis, A. B., Dierssen, H. M., Diner, D. J., Franz, B., Frouin, R., Gao, B.-C., Ibrahim, A., Levy, R. C., Martins, J. V., Omar, A. H., and Torres, O.: Retrieving Aerosol Characteristics From the PACE Mission, Part 2: Multi-Angle and Polarimetry, Frontiers in Environmental Science, 7, 94, https://doi.org/10.3389/fenvs.2019.00094, 2019. a
Stap, F., Hasekamp, O., Emde, C., and Röckmann, T.: Influence of 3D effects on 1D aerosol retrievals in synthetic, partially clouded scenes, J. Quant. Spectrosc. Ra., 170, 54–68, https://doi.org/10.1016/j.jqsrt.2015.10.008, 2016a. a
Stap, F. A., Hasekamp, O. P., Emde, C., and Rockmann, T.: Multiangle photopolarimetric aerosol retrievals in the vicinity of clouds: Synthetic study based on a large eddy simulation, J. Geophys. Res., 121, 12914–12935, https://doi.org/{10.1002/2016JD024787}, 2016b. a
Stevens, B., Bony, S., Farrell, D., Ament, F., Blyth, A., Fairall, C., Karstensen, J., Quinn, P. K., Speich, S., Acquistapace, C., Aemisegger, F., Albright, A. L., Bellenger, H., Bodenschatz, E., Caesar, K.-A., Chewitt-Lucas, R., de Boer, G., Delanoë, J., Denby, L., Ewald, F., Fildier, B., Forde, M., George, G., Gross, S., Hagen, M., Hausold, A., Heywood, K. J., Hirsch, L., Jacob, M., Jansen, F., Kinne, S., Klocke, D., Kölling, T., Konow, H., Lothon, M., Mohr, W., Naumann, A. K., Nuijens, L., Olivier, L., Pincus, R., Pöhlker, M., Reverdin, G., Roberts, G., Schnitt, S., Schulz, H., Siebesma, A. P., Stephan, C. C., Sullivan, P., Touzé-Peiffer, L., Vial, J., Vogel, R., Zuidema, P., Alexander, N., Alves, L., Arixi, S., Asmath, H., Bagheri, G., Baier, K., Bailey, A., Baranowski, D., Baron, A., Barrau, S., Barrett, P. A., Batier, F., Behrendt, A., Bendinger, A., Beucher, F., Bigorre, S., Blades, E., Blossey, P., Bock, O., Böing, S., Bosser, P., Bourras, D., Bouruet-Aubertot, P., Bower, K., Branellec, P., Branger, H., Brennek, M., Brewer, A., Brilouet , P.-E., Brügmann, B., Buehler, S. A., Burke, E., Burton, R., Calmer, R., Canonici, J.-C., Carton, X., Cato Jr., G., Charles, J. A., Chazette, P., Chen, Y., Chilinski, M. T., Choularton, T., Chuang, P., Clarke, S., Coe, H., Cornet, C., Coutris, P., Couvreux, F., Crewell, S., Cronin, T., Cui, Z., Cuypers, Y., Daley, A., Damerell, G. M., Dauhut, T., Deneke, H., Desbios, J.-P., Dörner, S., Donner, S., Douet, V., Drushka, K., Dütsch, M., Ehrlich, A., Emanuel, K., Emmanouilidis, A., Etienne, J.-C., Etienne-Leblanc, S., Faure, G., Feingold, G., Ferrero, L., Fix, A., Flamant, C., Flatau, P. J., Foltz, G. R., Forster, L., Furtuna, I., Gadian, A., Galewsky, J., Gallagher, M., Gallimore, P., Gaston, C., Gentemann, C., Geyskens, N., Giez, A., Gollop, J., Gouirand, I., Gourbeyre, C., de Graaf, D., de Groot, G. E., Grosz, R., Güttler, J., Gutleben, M., Hall, K., Harris, G., Helfer, K. C., Henze, D., Herbert, C., Holanda, B., Ibanez-Landeta, A., Intrieri, J., Iyer, S., Julien, F., Kalesse, H., Kazil, J., Kellman, A., Kidane, A. T., Kirchner, U., Klingebiel, M., Körner, M., Kremper, L. A., Kretzschmar, J., Krüger, O., Kumala, W., Kurz, A., L'Hégaret, P., Labaste, M., Lachlan-Cope, T., Laing, A., Landschützer, P., Lang, T., Lange, D., Lange, I., Laplace, C., Lavik, G., Laxenaire, R., Le Bihan, C., Leandro, M., Lefevre, N., Lena, M., Lenschow, D., Li, Q., Lloyd, G., Los, S., Losi, N., Lovell, O., Luneau, C., Makuch, P., Malinowski, S., Manta, G., Marinou, E., Marsden, N., Masson, S., Maury, N., Mayer, B., Mayers-Als, M., Mazel, C., McGeary, W., McWilliams, J. C., Mech, M., Mehlmann, M., Meroni, A. N., Mieslinger, T., Minikin, A., Minnett, P., Möller, G., Morfa Avalos, Y., Muller, C., Musat, I., Napoli, A., Neuberger, A., Noisel, C., Noone, D., Nordsiek, F., Nowak, J. L., Oswald, L., Parker, D. J., Peck, C., Person, R., Philippi, M., Plueddemann, A., Pöhlker, C., Pörtge, V., Pöschl, U., Pologne, L., Posyniak, M., Prange, M., Quiñones Meléndez, E., Radtke, J., Ramage, K., Reimann, J., Renault, L., Reus, K., Reyes, A., Ribbe, J., Ringel, M., Ritschel, M., Rocha, C. B., Rochetin, N., Röttenbacher, J., Rollo, C., Royer, H., Sadoulet, P., Saffin, L., Sandiford, S., Sandu, I., Schäfer, M., Schemann, V., Schirmacher, I., Schlenczek, O., Schmidt, J., Schröder, M., Schwarzenboeck, A., Sealy, A., Senff, C. J., Serikov, I., Shohan, S., Siddle, E., Smirnov, A., Späth, F., Spooner, B., Stolla, M. K., Szkółka, W., de Szoeke, S. P., Tarot, S., Tetoni, E., Thompson, E., Thomson, J., Tomassini, L., Totems, J., Ubele, A. A., Villiger, L., von Arx, J., Wagner, T., Walther, A., Webber, B., Wendisch, M., Whitehall, S., Wiltshire, A., Wing, A. A., Wirth, M., Wiskandt, J., Wolf, K., Worbes, L., Wright, E., Wulfmeyer, V., Young, S., Zhang, C., Zhang, D., Ziemen, F., Zinner, T., and Zöger, M.: EUREC4A, Earth Syst. Sci. Data, 13, 4067–4119, https://doi.org/10.5194/essd-13-4067-2021, 2021. a
Stubenrauch, C. J., Kinne, S., Mandorli, G., Rossow, W. B., Winker, D. M., Ackerman, S. A., Chepfer, H., Di Girolamo, L., Garnier, A., Heidinger, A., Karlsson, K.-G., Meyer, K., Minnis, P., Platnick, S., Stengel, M., Sun-Mack, S., Veglio, P., Walther, A., Cai, X., Young, A. H., and Zhao, G.: Lessons Learned from the Updated GEWEX Cloud Assessment Database, Surv. Geophys., https://doi.org/10.1007/s10712-024-09824-0, 2024. a
Tsang, L., Kong, J. A., and Shin, R. T.: Theory of Microwave Remote Sensing, John Wiley, New York, ISBN 10: 0471888605, 1985. a
Van Diedenhoven, B., Hasekamp, O. P., and Landgraf, J.: Retrieval of cloud parameters from satellite‐based reflectance measurements in the ultraviolet and the oxygen A‐band, J. Geophys. Res.-Atmos., 112, D15208, https://doi.org/10.1029/2006JD008155, 2007. a
Volkmer, L., Pörtge, V., Jakub, F., and Mayer, B.: Model-based evaluation of cloud geometry and droplet size retrievals from two-dimensional polarized measurements of specMACS, Atmos. Meas. Tech., 17, 1703–1719, https://doi.org/10.5194/amt-17-1703-2024, 2024. a
Weber, A., Kölling, T., Pörtge, V., Baumgartner, A., Rammeloo, C., Zinner, T., and Mayer, B.: Polarization upgrade of specMACS: calibration and characterization of the 2D RGB polarization-resolving cameras, Atmos. Meas. Tech., 17, 1419–1439, https://doi.org/10.5194/amt-17-1419-2024, 2024. a, b
Wentz, F. J., Hilburn, K., and Smith, D. K.: RSS SSMIS OCEAN PRODUCT GRIDS DAILY FROM DMSP F17 NETCDF V7, NASA Global Hydrometeorology Resource Center DAAC [data set], Huntsville, Alabama, U.S.A., https://doi.org/10.5067/MEASURES/DMSP-F17/SSMIS/DATA301, 2012. a
Wielicki, B. A. and Parker, L.: On the determination of cloud cover from satellite sensors: The effect of sensor spatial resolution, J. Geophys. Res.-Atmos., 97, 12799–12823, https://doi.org/10.1029/92JD01061, 1992. a
Wiscombe, W.: Improved Mie scattering algorithms, Appl. Optics, 19, 1505–1509, 1980. a
Yu, H., Emde, C., Kylling, A., Veihelmann, B., Mayer, B., Stebel, K., and Van Roozendael, M.: Impact of 3D cloud structures on the atmospheric trace gas products from UV–Vis sounders – Part 2: Impact on NO2 retrieval and mitigation strategies, Atmos. Meas. Tech., 15, 5743–5768, https://doi.org/10.5194/amt-15-5743-2022, 2022. a
Yuan, Z., Fu, G., van Diedenhoven, B., Lin, H. X., Erisman, J. W., and Hasekamp, O. P.: Cloud detection from multi-angular polarimetric satellite measurements using a neural network ensemble approach, Atmos. Meas. Tech., 17, 2595–2610, https://doi.org/10.5194/amt-17-2595-2024, 2024. a
Zhan, Y., Yi, F., Liu, F., Zhang, Y., Yu, C., and Zhou, J.: Convective Boundary Layer Clouds as Observed with Ground-Based Lidar at a Mid-Latitude Plain Site, Remote Sens.-Basel, 13, 1281, https://doi.org/10.3390/rs13071281, 2021. a
Zinner, T., Wind, G., Platnick, S., and Ackerman, A. S.: Testing remote sensing on artificial observations: impact of drizzle and 3-D cloud structure on effective radius retrievals, Atmos. Chem. Phys., 10, 9535–9549, https://doi.org/10.5194/acp-10-9535-2010, 2010. a
In the solar principal plane the polarized reflectance is defined as , where E0 is the extraterrestrial solar irradiance and θ0 is the solar zenith angle.
- Abstract
- Introduction
- Methodology
- Setup of the retrieval
- Investigation of 3D scattering effects
- Testing the retrieval method on high-spatial-resolution aircraft data
- Conclusions and outlook
- Code availability
- Data availability
- Author contributions
- Competing interests
- Disclaimer
- Acknowledgements
- Review statement
- References


