the Creative Commons Attribution 4.0 License.
the Creative Commons Attribution 4.0 License.
Assessing the ducting phenomenon and its potential impact on Global Navigation Satellite System (GNSS) radio occultation refractivity retrievals over the northeast Pacific Ocean using radiosondes and global reanalysis
Thomas E. Winning Jr.
Feiqin Xie
Kevin J. Nelson
In this study, high-resolution radiosondes from the Marine Atmospheric Radiation Measurement (ARM) Global Energy and Water Experiment (GEWEX) Cloud System Study (GCSS) Pacific Cross-section Intercomparison (GPCI) Investigation of Clouds (MAGIC) field campaign and ECMWF Reanalysis version 5 (ERA5) global reanalysis data are used to assess characteristics of the elevated ducting layer along a transect over the northeastern Pacific Ocean from Los Angeles, California, to Honolulu, Hawaii. The planetary boundary layer (PBL) height (PBLH) increases as the strength of the refractivity gradient decreases westward along the transect. The thickness of the prevailing ducting layer remains remarkably consistent (∼ 110 m) in the radiosonde data. On the other hand, the ERA5 reanalysis generally resolves the ducting features well, but it underestimates the ducting height and strength, especially over the trade cumulus region near Hawaii. A simple two-step end-to-end simulation is used to evaluate the impact of the elevated ducting layer on radio occultation (RO) refractivity retrievals. A systematic negative refractivity bias (N bias) below the ducting layer is observed throughout the transect, peaking (−5.42 %) slightly below the PBLH and gradually decreasing towards the surface (−0.5 %). The N bias shows a strong positive correlation with the ducting strength. The ERA5 data underestimate the N bias, with the magnitude of the underestimation increasing westward along the transect.
- Article
(4532 KB) - Full-text XML
- BibTeX
- EndNote
The troposphere, where most weather occurs, consists of two main layers: the planetary boundary layer (PBL) and the free atmosphere (FA) (Garratt, 1994). The PBL characteristics change frequently on both spatial and temporal scales, and the PBL height (PBLH) can impact the exchange of heat, momentum, and particulate matter with the FA, making it a critical factor in global energy balances and water cycling (Stull, 1988; Ramanathan et al., 1989; Klein and Hartmann, 1993). Regular PBL observations are mainly limited to in situ measurements from surface stations and radiosondes. However, spatially and temporally dense in situ PBL observations are typically only available from field campaigns such as the Boundary Layer Experiment 1996 (BLX96; Stull et al., 1997), the Variability of the American Monsoon Systems (VAMOS) Ocean–Cloud–Atmosphere–Land Study Regional Experiment (VOCALS-REx; Wood et al., 2011), and the Marine Atmospheric Radiation Measurement (ARM) Global Energy and Water Experiment (GEWEX) Cloud System Study (GCSS) Pacific Cross-section Intercomparison (GPCI) Investigation of Clouds (MAGIC; Zhou et al., 2015). Satellite observations of the PBL are also limited due to signal attenuation of the conventional infrared sounder in the lower troposphere and the low vertical resolution of microwave sounding instruments. Additionally, while the depth of the PBLH can vary from a couple hundred meters to a few kilometers (Ao et al., 2012; von Engeln and Teixeira, 2013), the transition layer from the PBL to the FA is typically on the order of tens to hundreds of meters thick (Maddy and Barnet, 2008), rendering PBL sensing from the low-vertical-resolution passive infrared and microwave sounders ineffective.
On the other hand, Global Navigation Satellite System (GNSS) radio occultation (RO) provides global atmospheric soundings with a vertical resolution of approximately 100 m in the lower troposphere under all weather conditions (Kursinski et al., 1997, 2000; Gorbunov et al., 2004). Some of the recent major GNSS RO missions are the FORMOSAT-3/Constellation Observing System for Meteorology, Ionosphere, and Climate (COSMIC), later referred to as COSMIC-1 (Anthes et al., 2008), and its follow-on mission COSMIC-2 (Schreiner et al., 2020). Numerous studies have documented the high value of GNSS RO for profiling the PBL and determining the PBLH (Ao et al., 2008; Xie et al., 2008; Basha and Ratnam, 2009; Guo et al., 2011; Ao et al., 2012; Ho et al., 2015; Winning et al., 2017; Nelson et al., 2021).
The advancement of the GNSS RO technique with open-loop tracking (Ao et al., 2003; Beyerle et al., 2003; Sokolovskiy et al., 2006) along with the implementation of radio-holographic retrieval algorithms (Gorbunov, 2002; Jensen et al., 2003, 2004) has led to much-improved PBL sounding quality. However, probing the marine PBL remains challenging, as systematic negative biases are frequently seen in RO refractivity retrievals (Xie et al., 2010; Feng et al., 2020). One major cause of refractivity bias (hereafter N bias) is the RO retrieval error due to elevated atmospheric ducting often seen near the PBLH (Sokolovskiy, 2003; Ao et al., 2003; Xie et al., 2006; Ao, 2007). This elevated ducting is found primarily over the subtropical eastern oceans (von Englen et al., 2003; Lopez, 2009; Feng et al., 2020), and the horizontal extent of ducting in these regions can be on the order of thousands of kilometers (Xie et al., 2010; Winning et al., 2017). In the presence of ducting, the vertical refractivity gradient exceeds the critical refraction threshold for L-band frequencies (i.e., −157 N units km−1). The steep negative refractivity gradient is often observed in the vicinity of the PBLH, which is typically caused by an atmospheric temperature inversion, a sharp decrease in moisture, or a combination of both. When ducting is present, the Abel inversion (e.g., Fjeldbo et al., 1971) in the standard RO retrieval process encounters a non-unique inversion problem due to a singularity in the bending angle, resulting in a large, systematic underestimation of refractivity (N) below the ducting layer (Ao et al., 2003; Sokolovskiy, 2003; Xie et al., 2006). The large uncertainty in RO refractivity coupled with the singularity in bending angle hinders the assimilation of RO observations into numerical weather models, resulting in the rejection of a significant percentage of RO measurements inside the PBL (Healy, 2001).
To comprehensively assess the potential impact of ducting on GNSS RO retrievals, we begin by constructing a detailed ground truth of PBL ducting statistics. This is derived from an extensive set of high-resolution radiosonde data over the northeastern Pacific Ocean, a region known for prevailing ducting conditions. Subsequently, we conduct a simulation study using the radiosonde data to evaluate the N biases caused by varying ducting characteristics. Section 2 provides details of the two data sets used for this study: high-resolution radiosondes over the northeastern Pacific Ocean and the colocated ECMWF Reanalysis version 5 (ERA5; Hersbach et al., 2020) profiles. Additionally, we discuss the colocation criteria and the detection method for the ducting layer and the corresponding PBLH. Section 3 presents the ducting statistics for key variables, such as ducting height, PBLH, minimum refractivity gradient, and sharpness parameter. The characteristics of ducting including the thickness and strength along the cross section are also shown. Furthermore, we evaluate the ducting-induced N bias in GNSS RO refractivity retrievals by carrying out a two-step end-to-end simulation. Section 4 summarizes the findings and discusses the direction of future research.
2.1 MAGIC radiosonde and colocated ERA5 data
A collection of high-resolution radiosondes from the Marine Atmospheric Radiation Measurement (ARM) Global Energy and Water Experiment (GEWEX) Cloud System Study (GCSS) Pacific Cross-section Intercomparison (GPCI) Investigation of Clouds (MAGIC) are utilized as the primary data set in this analysis (Zhou et al., 2015; Lewis, 2016). The MAGIC field campaign took place from 26 September 2012 to 2 October 2013 as part of the U.S. Department of Energy ARM Program Mobile Facility 2 (AMF2) on board the Horizon Lines container ship Spirit, which completed 20 round-trip passes between Los Angeles, California, and Honolulu, Hawaii, during the yearlong data collection period (Painemal et al., 2015; Zhou et al., 2015). During each transit, radiosondes were launched at 6 h intervals from the beginning of the program through the end of June 2013; the observation frequency increased to every 3 h from July 2013 through the end of the campaign (Zhou et al., 2015). A total of 583 MAGIC radiosonde profiles were collected during the field campaign (Zhou et al., 2015), all with a vertical sampling frequency of 0.5 Hz (2 s), which provides an average vertical resolution of ∼ 8 m below 3 km but varies due to local vertical motion.
The use of this data set has multiple benefits. First, the northeast Pacific transitions from a shallow stratocumulus-topped PBL to a deeper, trade cumulus boundary layer regime along the GPCI transect shown in Fig. 1 (Garratt, 1994). Second, the large number of observations over a 12-month time frame provides high temporal (diurnal- and seasonal-scale) and spatial profiling of the PBL along the GPCI transect (Fig. 1). Finally, ducting is prevalent throughout the domain over which the observations were captured, creating an opportunity to perform an analysis over a natural cross section of X (zonal) and Z (vertical) dimensions.
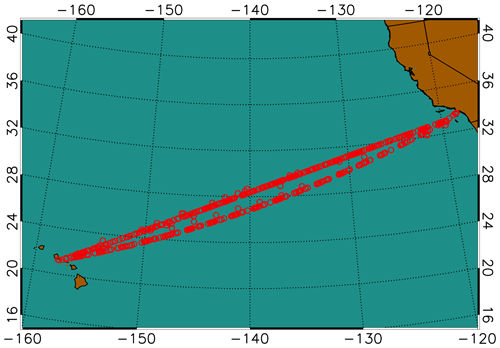
Figure 1Location of radiosonde observations from the MAGIC field campaign from October 2012–September 2013.
The radiosonde profiles are colocated with ERA5 model profiles for this analysis. The ERA5 data have a horizontal resolution of 0.25° × 0.25°, 137 non-equidistant vertical model levels from the surface to 0.01 hPa, and 1 h temporal resolution. The model level density decreases with height: on average, there are 19 model levels below 1 km (10–100 m resolution), which reduces to 8 levels between 1 and 2 km (100–160 m resolution) and further reduces to 5 levels between 2 and 3 km (160–200 m resolution). Each MAGIC radiosonde profile was colocated with the nearest ERA5 grid point that is within 1.5 h of the closest 3-hourly model profile.
2.2 PBLH detection with the minimum gradient method
At GNSS L-band frequencies, the atmospheric refractivity (N in N units) is derived from the refractive index n, where and, in the neutral atmosphere (Kursinski et al., 1997), is a function of the atmospheric pressure (P in mb), temperature (T in K), and partial pressure of water vapor (Pw in mb) as seen in Eq. (1) from Smith and Weintraub (1953):
Over the subtropical eastern oceans, a sharp decrease in moisture is often associated with a strong temperature inversion marking a clear transition from the PBL to the FA. The distinct decrease in moisture and the temperature inversion lead to a sharp negative refractivity gradient which can be precisely detected from GNSS RO. Numerous studies have implemented the simple gradient method to detect the PBLH, i.e., the height of the minimum refractivity gradient (Xie et al., 2006; Seidel et al., 2010; Ao et al., 2012). To assess the robustness of the PBLH detection with the gradient method, Ao et al. (2012) introduced the sharpness parameter () to measure the relative magnitude of the minimum gradient, which is defined as the ratio of the minimum vertical refractivity gradient () to the root mean square () of the refractivity gradient profile from the surface to 5 km as follows:
In this study, the MAGIC radiosonde refractivity profiles were first interpolated to a uniform 10 m vertical grid and then smoothed by a 100 m boxcar window to reduce the noise in the gradient profile resulting from the high sampling rate. Moreover, the 100 m smoothed radiosonde will be more consistent with the vertical resolution of GNSS RO measurements (e.g., Gorbunov et al., 2004). Colocated ERA5 data were also vertically interpolated to the same 10 m grid but not smoothed as these data do not contain the inherent noise like the radiosonde observations. In the case of both data sets, quadratic interpolation is used to translate the refractivity profiles from their native height values to a uniform height. Finally, as the elevated ducting layer is the focus of this study, the lowest 0.3 km above mean sea level of the N profile is excluded (e.g., Xie et al., 2012). Subsequently, the height of the minimum refractivity gradient (within 0.3 and 5 km) will be identified as the PBLH.
2.3 Ducting layers
The refractivity gradient profile is calculated by differentiating the 10 m interpolated refractivity profile with respect to height. When the vertical refractivity gradient is less than the critical refraction threshold for radio waves ( < −157.0 N units km−1), ducting occurs (Sokolovskiy, 2003). A ducting layer is identified as any interval of continuous points with a vertical refractivity gradient equal to or less than the critical refraction threshold. Instances of multiple ducting layers occurring within a profile are present for both the MAGIC (31.5 %) and ERA5 (6.7 %) data sets. In this study, we only recognize one dominant “ducting layer” in each profile where the minimum vertical gradient is located. The ducting layer thickness (Δh) is defined as the interval between the top and bottom of the ducting layer where the refractivity gradients reach critical refraction. Similarly, the strength of each ducting layer (ΔN) is defined as the refractivity difference between the bottom and top of the ducting layer. The ducting layer height is defined as the height of the top of the ducting layer (Ao, 2007), which is generally slightly above the PBLH.
Figure 2 shows vertical profiles of refractivity (N in daN-units), temperature (T in °C), and specific humidity (q in grams per kilogram) along with their respective vertical gradients (, , and ) from a representative MAGIC radiosonde (Fig. 2a, b) case located at 23.69°, −150.02° and its colocated ERA5 (Fig. 2c, d) profile at 23.75°, −150.00°. The PBLH of the radiosonde (2.10 km) is almost identical to the colocated ERA5 height (2.14 km), and the “dominant” ducting layer near the PBLH demonstrates similar thickness. However, a second, weaker ducting layer seen in the radiosonde above the PBLH was not captured by ERA5. It should be noted that the weak “saw-tooth-like” gradients seen above the minimum in the ERA5 refractivity gradient (Fig. 2d) are a result of the vertical derivative being calculated from the interpolated ERA5 refractivity profile. When interpolating the relatively coarse-vertical-resolution ERA5 profile (up to 200 m in the lowest 3 km) into 10 m vertical sampling, the higher-order interpolation could lead to a fine structure in the first-order derivative. However, these minor gradients only marginally affect the estimates of minimum gradient and associated heights from ERA5 and are most often overshadowed by the PBLH gradient.
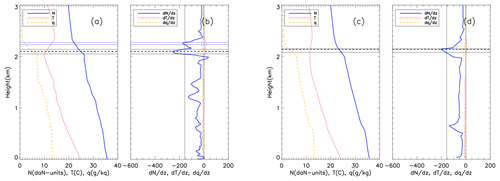
Figure 2Vertical profiles of refractivity (N in daN-units, solid blue), temperature (T in °C, dotted red), and specific humidity (q in grams per kilogram, dashed gold) for (a) the radiosonde at 23.69°, −150.02° launched on 2 October 2013 at 05:30 UTC and (c) colocated ERA5 data at 23.75°, −150.00°, as well as the associated gradient profiles for radiosonde (b) and ERA5 (d). The horizontal dashed line highlights the height of the minimum gradient, i.e., PBLH. The paired horizontal dotted lines represent the bottom and top of any ducting layers.
2.4 Evaluation of GNSS RO N bias resulting from ducting
In order to estimate the systematic negative N bias in GNSS RO observations in the presence of ducting, we use an end-to-end simulation on the radiosonde and ERA5 refractivity profiles. The simulation consists of a two-step process adapted from Xie et al. (2006). The first step is to simulate the 1-dimensional GNSS RO bending angle as a function of impact parameter (i.e., the product of refractive index and the radius of the Earth's curvature) by forward Abel integration of an input refractivity profile assuming a spherically symmetric atmosphere (Fjeldbo and Eshleman, 1968; Eshleman, 1973; Sokolovskiy, 2001). The second step is to simulate the spaceborne GNSS RO refractivity retrieval by applying the Abel inversion on the simulated bending angle from step one. In the absence of ducting, the impact parameter increases monotonically with height, allowing a unique solution to the inverse Abel retrieval that is the same as the original refractivity profile input. However, in the presence of an elevated ducting layer, the Abel retrieval systematically underestimates the refractivity profile due to the non-unique Abel inversion problem resulting from the singularity in bending angle across the ducting layer (Sokolovskiy, 2003; Xie et al., 2006). It should be noted that after the 100 m vertical smoothing on radiosonde (no smoothing is performed on ERA5) profiles as described in Sect. 2.2, an additional 50 m vertical smoothing has been applied to the simulated bending angle profiles of both radiosonde and ERA5 data sets to alleviate the challenge of integration through the very sharp bending angle resulting from ducting in the inverse Abel integration procedure (Feng et al., 2020).
Figure 3 shows the end-to-end simulation results for the same radiosonde (a–d) and the colocated ERA5 (e–h) cases from Fig. 2. Figure 3a and e show refractivity profiles from the radiosonde (NMAGIC) and the colocated ERA5 (NERA5) data as well as their corresponding Abel refractivity retrievals (NAbel). The refractivity gradients are shown in Fig. 3c and g. The derived PBLH is marked by a horizontal dotted line in the refractivity space. The peak bending angles in Fig. 3d and h are consistent with the corresponding sharp refractivity gradient. Figure 3b shows the fractional N bias between the simulated Abel-retrieved RO refractivity profile and the radiosonde, whereas Fig. 3f shows the same for the ERA5 profile. Considering the significant spatial and temporal variations of ducting height along the transect, each N bias profile is displayed as a function of an adjusted height, which is the height minus the corresponding PBLH for the purposes of profile intercomparison. For example, the zero-adjusted height refers to the PBLH for each individual profile. The systematic negative N bias is shown below the ducting layer marked by the PBLH in both cases, with the biases decreasing at lower altitudes, the largest magnitude bias (−5 % for radiosonde; −2.5 % for ERA5) being close to the ducting height, and a minimum magnitude approaching zero near the surface.
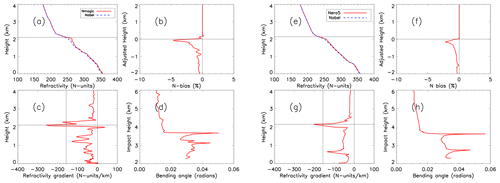
Figure 3End-to-end simulation results for a MAGIC radiosonde launched at 05:30 UTC on 2 October 2013 showing (a) NMAGIC (solid red) and NAbel (dashed blue) from the surface to 4 km, (b) PBLH-adjusted N bias, (c) vertical refractivity gradient, and (d) bending angle vs. impact parameter. Panels (e)–(h) show end-to-end simulation results for the colocated ERA5 profile.
Quality control for radiosonde (and colocated ERA5) profiles was based on five key criteria. First, a total of 19 radiosonde and 24 ERA5 profiles near the southern California coast were removed due to their positions east of −120° or their anomalously high PBL (PBLH > 3.0 km) with no distinct minimum refractivity gradient. The remaining profiles in the easternmost portion of the domain were too few in number to calculate meaningful statistics. Second, any profile lacking critical refraction (i.e., < −157 N units km−1) points was excluded from the analysis, which resulted in the removal of 47 radiosonde and 176 ERA5 profiles. Third, an anomalously noisy bending angle profile could result in errors in the Abel refractivity retrieval and cause positive N bias. Therefore, the profiles with N bias greater than +0.5 % are excluded, resulting in the removal of 61 MAGIC profiles and 16 ERA5 profiles. Fourth, the profiles with only surface ducting, i.e., below 300 m threshold, are discarded. Finally, 25 radiosonde profiles and 2 ERA5 profiles were removed due to the Abel retrieval failure. After implementing all quality control measures, the number of radiosonde and ERA5 profiles used for the N-bias analysis is reduced to 396 and 319 profiles, respectively, across the MAGIC transect.
3.1 PBL analysis
To evaluate the ducting properties along the transect from the coast of southern California to Hawaii, we group the MAGIC radiosonde and the colocated ERA5 profiles into eight 5° longitude bins between −160.0 and −120.0°, which allows the assessment of the spatial variation in the PBL, ducting layer, and the associated properties along the transect to be easily illustrated. Figure 4 shows the median value of PBLH (a), minimum gradient (b), and sharpness parameter (c) along the transect. The median absolute deviation (MAD) for each parameter is also shown.
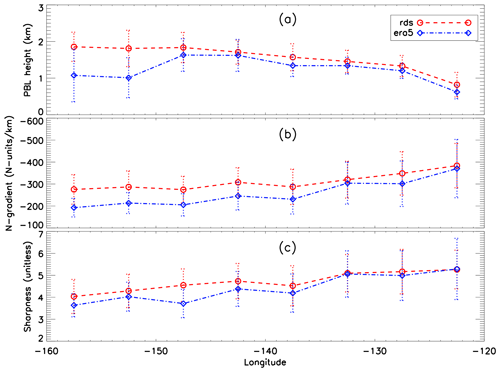
Figure 4Zonal transect of 5° binned MAGIC and ERA5 PBLH (a), minimum refractivity gradient (b), and sharpness parameter (c) for MAGIC (median in red circle and dashed line, MAD in dotted red error bars) and ERA5 (median in blue diamond and dot-dashed line, MAD in dotted blue error bars).
In Fig. 4a, the MAGIC radiosondes (RDSs) clearly show a gradual increase in the PBLH along the transect from the shallow stratocumulus-topped PBL (∼ 800 m) near the southern California coast westward to the much deeper trade cumulus regime (∼ 1.8 km) near Hawaii. A similar structure is seen in the colocated ERA5 data but with an average low bias of 165 m below the radiosonde. Additionally, a nearly 800 m ERA5 underestimation in the PBLH over the two westernmost bins near Hawaii is also seen; this is consistent with what is found over the equivalent trade cumulus region of the subtropical southeast Pacific Ocean (Xie et al., 2012). Such a discrepancy could be due to the sensitivity of the gradient method to the vertical resolution of the data. Over the western segment of the transect (near Hawaii), two major gradient layers (one at ∼ 1 km and the other at ∼ 2 km) with comparable refractivity gradients are often observed (e.g., Fig. 2) in the ERA5 data. The gradient layer near 2 km is well-known as the trade-wind inversion (Riehl, 1979; Ao et al., 2012; Xie et al., 2012), while the lower-level gradient layer at ∼ 1 km is generally called a mixing layer (Xie et al., 2006). Due to the differences in vertical sampling noted in Sect. 2.1, the ERA5 data are more likely to resolve the sharp gradient structure below 1 km than the one at higher altitude. This could result in resolving the mixing layer (below 1 km) with the sharpest refractivity gradient instead of the trade-wind inversion near 2 km in the ERA5 data. Note that the larger median absolute deviation for the westernmost bins compared to the rest of the transect illustrates the existence of greater PBLH variability closer to the trade cumulus boundary layer regime. The westward decreasing magnitude of the minimum refractivity gradient (Fig. 4b) and sharpness parameter (Fig. 4c) indicates the westward weakening of moisture lapse rate and/or temperature inversion across the PBL top, which is consistent with the decreasing synoptic-scale subsidence from the California coast to Hawaii (Riehl, 1979).
It is also notable that ERA5 systematically underestimates not only the PBLH but also the magnitude of the minimum gradient across the entire transect. This can also be seen in the sharpness parameter west of −132.5°. This discrepancy could be partially attributed to the decrease in vertical sampling in ERA5 profiles compared to the radiosondes, the result of which leads to a weaker PBL refractivity gradient and coincides with an increasing PBLH. Therefore, the underestimation of the ERA5 minimum refractivity gradient increases in magnitude from east to west and becomes most prominent near Hawaii where the PBLH reaches the maximum over the region.
3.2 Ducting characteristics
As introduced in Sect. 2.3, the key characteristics of the ducting layer along the transect will be investigated. These characteristics include the ducting layer height, ducting layer thickness (Δh), and ducting strength (ΔN), as well as the average refractivity gradient within the ducting layer (). The ducting layer heights from both radiosondes and ERA5 show a westward increase along the transect, as seen in Fig. 5a. Note again that ERA5 shows a systematic ∼ 100–200 m low bias when compared to the radiosondes between −122.5 and −147.5°, with the difference increasing to more than 500 m near Hawaii. The ducting layer thickness is the median height from the bottom of the ducting layer to the top and is expressed in kilometers (Fig. 5b). Ducting thickness (Δh) for MAGIC shows a near-constant value of 110 m across the entire transect with only a slight increase to 130 m at −122.5°, consistent with Ao et al. (2003). Conversely, ERA5 shows a constant but slightly thicker ducting layer to the east of −137.5° and then a decreasing thickness to the west of −137.5° (Fig. 5b). It should be noted that the estimated thicknesses of the ducting layers, especially for ERA5, may be affected by the chosen interpolation method.
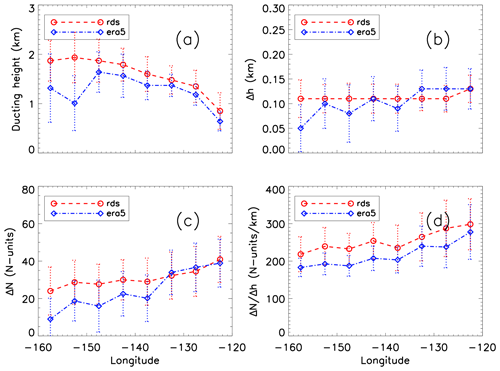
Figure 5Zonal transect of 5° binned median (a) ducting height, (b) ducting layer thickness (Δh), (c) ducting layer strength (ΔN), and (d) average ducting layer gradient for MAGIC (median in red circle and dashed red line, MAD in dotted red error bars) and ERA5 (median in blue diamond and dot-dashed line, MAD in dotted blue error bars).
The ducting layer strength is the decrease in refractivity from the bottom of the ducting layer to the top (Fig. 5c), and the ratio reflects the average gradient of the ducting layer (Fig. 5d). The ducting strength (ΔN) for the radiosondes generally ranges from 25 N units near Hawaii to 40 N units near the coast of California. Both ΔN and show an overall westward decreasing trend along the transect which is consistent with the decrease in magnitude of the refractivity gradient (Fig. 4b). Note that MAGIC and ERA5 show similar ducting strength in the eastern part of the region but diverge near −137.5° with ERA5 10–20 N units weaker than the MAGIC profiles. On the other hand, ERA5 shows a systematically lower average refractivity gradient () than MAGIC throughout the transect, indicating the challenge for ERA5 to consistently resolve the sharp vertical structure in refractivity – and likewise in temperature and moisture profiles – across such a thin ducting layer. The problem becomes acutely clear near the trade cumulus region.
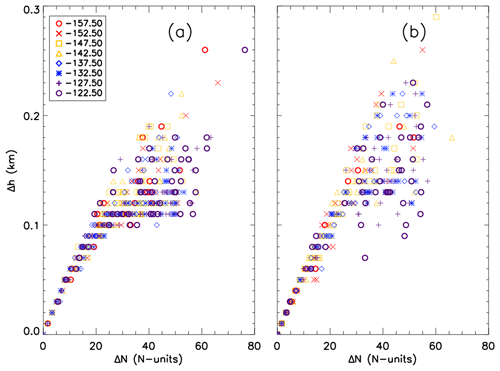
Figure 6 shows individual ducting layer thicknesses as a function of ducting layer strength. The shape and color of each data point are used to identify its respective longitude bin. The relationship between Δh and ΔN is not longitude-dependent for either data set, but a linear trend is evident for thinner ducting layers (Δh < 0.1 km) with weaker ducting strength (ΔN < ∼ 25 N units). However, for the ducting layers thicker than 0.1 km, such a trend becomes less identifiable, and the ducting strength ΔN begins to show more variability toward larger values.
3.3 Ducting-induced GNSS RO N-bias statistics
To estimate the systematic negative N bias in GNSS RO observations due to ducting, we have applied the end-to-end simulation described in Sect. 2.4 to all radiosonde and ERA5 refractivity profiles with at least one elevated ducting layer detected. The N bias along the transect and its relationship to the ducting properties are presented below.
3.3.1 Assessing ducting-induced N bias
Figure 7 shows a composite of both MAGIC (396 profiles) and ERA5 (319 profiles) N-bias profiles which have been displayed as a function of their zero-adjusted height. The median N bias and MAD are also shown. The systematic negative N-bias peaks at approximately 100 m below the PBLH and decreases at lower relative altitudes. The peak median value of the N bias for radiosondes is −5.42 % (MAD, 2.92 %), nearly twice the ERA5 value of −2.96 % (MAD, 2.59 %), indicating the significant underestimation of ducting strength in ERA5 data. However, the MADs of the radiosonde and ERA5 data are within 0.33 % of each other, indicating that ERA5 data successfully capture the variations in ducting features seen in the radiosondes. It is worth noting that many radiosonde profiles show small negative N biases above the PBLH (i.e., positive zero-adjusted height), which is the result of a secondary ducting layer above the major ducting layer near the PBLH. Few ERA5 profiles show the presence of the secondary ducting layer above the PBLH.
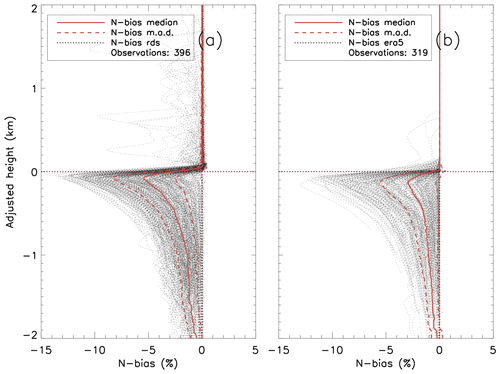
Figure 7Fractional refractivity difference (N bias) between the simulated Abel-retrieved refractivity profile and the original observed refractivity profile for all individual observations (dotted gray): (a) MAGIC radiosondes (396 total profiles) and (b) ERA5 (319 total profiles) with population median (solid red) ± MAD (dashed red). Note the zero value in the adjusted height refers to the detected PBLH for each individual N-bias profile.
3.3.2 Zonal variation in the N bias along the transect
To illustrate the large variation in the N-bias vertical structure resulting from the spatial variations in ducting height and strength, Fig. 8 shows the median N-bias profiles (±MAD) for each 5° bin, replacing the zero-adjusted height with the median PBLH for each bin. The zonal radiosonde composite (Fig. 8a) illustrates the westward transition of the median N-bias profiles from the largest peak N bias at ∼ 0.8 km near the coast of Los Angeles, California, to a much-reduced peak N bias but higher altitude of ∼ 1.8 km at Honolulu, Hawaii. Table 1 lists detailed statistics of the peak N-bias values at each bin for both radiosonde and ERA5 data seen in Fig. 8. Although the vertical structures of the N-bias profiles along the transect are consistent, as seen in Fig. 7, significant changes in the N-bias magnitude and its peak height along the transect are seen.
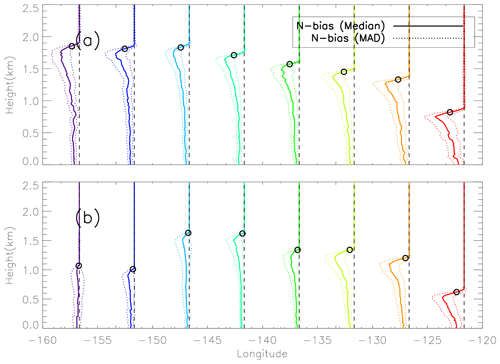
Figure 8Median N bias (solid) ±MAD (dotted) N bias along the north Pacific transect for MAGIC radiosondes (a) and ERA5 (b). Open circles represent the median PBLH for each 5° bin. Vertical dashed line represents the location of each 5° grid bin. See Table 1 for corresponding values of median and MAD peak N bias.
Table 1Peak values of median N bias and corresponding MAD (%) values for MAGIC radiosondes (RDSs) and ERA5 for each 5° bin seen in Fig. 8.
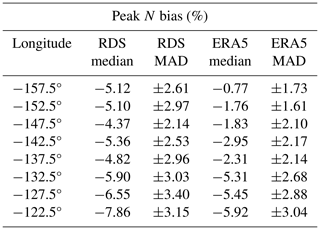
The maximum peak N bias (−7.86 %) in the radiosonde data is located at the easternmost parts of the transect near California (−122.5°), whereas the minimum peak N bias (−4.37 %) is located near the center of the transect (−147.5°). Similarly, ERA5 also shows the maximum peak N bias (−5.92 %) near California (−122.5°). However, the minimum peak N bias (−0.77 %) is found near Hawaii (−157.5°). Overall, the N-bias values for the ERA5 data set are less than the N-bias values calculated from the radiosonde data set for each longitude bin. However, a noticeable difference exists between the ERA5 and radiosonde profiles for the two westernmost longitude bins (−157.5 and −152.5°) where ERA5 reveals a much lower and weaker N bias than the MAGIC data.
The PBLH is above the height of the peak N bias for both data sets. The MAGIC data show a maximum difference of 100 m (−157.5°) and a minimum difference of ∼ 70 m (−142.5°), while the ERA5 PBLH shows greater values for maximum difference (140 m at −132.5°) and minimum difference (60 m at −157.5°).
Figure 9 further illustrates the peak N bias, median PBL N bias (0.3 km to PBLH), and the near-surface N bias (at 0.3 km) at each bin along the transect. Note the median PBL N bias refers to the median value from the near surface (0.3 km) to the PBLH. Contrary to the general trend of the westward decrease in magnitude of the minimum refractivity gradient (Fig. 4b) and ducting strength (Fig. 5c), the radiosonde peak N bias (median: −8.10 %; MAD: 3.26 %) occurs near California (−122.5°) and the minimum (median: −4.85 %; MAD: 2.18 %) occurs over the transition region (−147.5°). There is also a slight increase in peak N bias to a secondary maximum (median: −6.11 %; MAD: 2.85 %) near Hawaii (−157.5°). The median PBL N bias and the near-surface N bias also show a similar pattern. However, the median N bias demonstrates a sharp decrease in the eastern half of the domain from −5.25 % (MAD: 2.71 %) at −122.5° to −1.71 % (MAD: 1.26 %) at −137.5° and then remains relatively constant over the western half of the domain. Similarly, the near-surface N bias reaches a maximum magnitude of −3.54 % (MAD: 2.11 %), sharply decreases to −1.06 % (MAD: 0.85 %) at −137.5°, and then remains relatively constant over the western half of the domain. Note that normalizing each N-bias profile to the PBLH preserves the magnitude of the N bias with various heights. Therefore, the relatively large, normalized N biases observed near Hawaii indicate more persistent ducting over the trade cumulus boundary layer regime compared to the transition region in the middle of the transect at −147.5° (Fig. 8a).
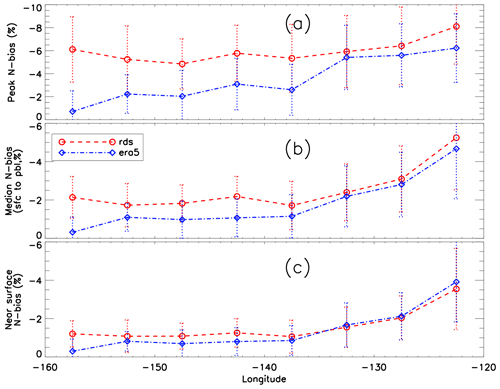
Figure 9Zonal transect of 5° binned (a) peak N bias, (b) median PBL N bias (0.3 km to PBLH), and (c) near-surface N bias at 0.3 km for MAGIC (median in red circle and dashed red line, MAD in dotted red error bar) and ERA5 (median in blue diamond and dot-dashed line, MAD in dotted blue error bar).
On the other hand, the ERA5 data show a westward decrease in all three N biases, systematically underestimating all three compared to the radiosondes. This is expected as the decrease in ERA5 vertical resolution at higher altitude leads to a weaker PBL N-gradient observation (Fig. 4b) and thus weaker ducting and a smaller ducting-induced N bias. Such an underestimation of the N bias in the ERA5 reanalysis minimizes near California where the PBLH is lowest but becomes more severe westward with an increase in height, reaching a maximum-magnitude N-bias difference near Hawaii. In this case, the peak N bias is merely −0.71 % (MAD: 1.80 %) compared to −6.23 % (MAD: 2.98 %) at −122.5° (Fig. 9a). The large difference seen in the N bias along the transect strongly indicates the challenges for the ERA5 data to resolve the sharp gradient across the ducting layer, resulting in a large variation in the PBLH of the ERA5 data in the western segment of the region. The increasing difference between the radiosonde and ERA5 data from east to west is most pronounced in the peak N-bias cross section (Fig. 9a) but is also evident in both the median N bias (Fig. 9b) and the near-surface N bias (Fig. 9c).
In this study, radiosonde profiles from the MAGIC field campaign have been analyzed to investigate ducting characteristics and the induced systematic refractivity biases in GNSS RO retrievals over the northeastern Pacific Ocean between Hawaii and California. Colocated ERA5 model reanalysis data were used as a secondary comparison to the radiosonde observations.
The nearly 1-year high-resolution MAGIC radiosonde data set reveals the frequent presence of ducting marked by a sharp refractivity gradient resulting from the large moisture lapse rate across a strong temperature inversion layer. The PBLH increases by more than 1 km along the transect from California to Hawaii, while the magnitude of the refractivity gradient decreases by 100 N units km−1. The zonal gradient of both variables illustrates the transition of the PBL from shallow stratocumulus adjacent to the California coast to deeper trade-wind cumulus that are prevalent near the Hawaiian Islands.
End-to-end simulations on all radiosonde and ERA5 refractivity profiles have been conducted to estimate the systematic negative N bias in GNSS RO observations. The ducting layer maintains remarkably consistent thickness (∼ 110 m) along the transect with westward decreasing strength and increasing height. ERA5 slightly underestimates both the height and strength of the ducting layer as well as the PBLH. A systematic negative N bias below the ducting layer is observed throughout the transect, peaking (−5.42 %) slightly below the PBLH and gradually decreasing towards the surface (−0.5 %).
MAGIC radiosondes indicate larger values of both ducting strength (ΔN) and thickness (Δh) than ERA5 in the western half of the transect. The opposite is true in the eastern portion of the domain and is likely associated with the transition of the cloud layer from open-cell cumulus in the west to stratocumulus and stratus in the east (Wood et al., 2011; Bretherton et al., 2019). ERA5 systematically underestimates the average ducting layer gradient ( compared to the radiosondes. The largest N bias is found over the region with the strongest ducting and largest sharpness parameter. It is worth noting that the PBL over the western portion of the transect near Hawaii frequently shows two major gradient layers (a mixing layer at ∼ 1 km and the trade inversion at ∼ 2 km), with comparable N gradients (e.g., Fig. 2). The much lower PBLH seen in ERA5 in this region is likely due, in part, to the decreasing number of model levels in ERA5 at higher altitude, which could lead to a higher possibility of identifying the lower gradient layer as the PBLH. However, the impact of the vertical resolution on the performance of the gradient method for PBLH detection has not been analyzed in this study. Further, the ERA5 results may be affected by the interpolation resolution and gradient calculation. Both warrant a more comprehensive study in the future.
Data for the Marine Atmospheric Radiation Measurement (ARM) GCSS Pacific Cross Section Intercomparison (GPCI) Investigation of Clouds (MAGIC; https://doi.org/10.5439/1595321, Keeler et al., 2013; https://doi.org/10.1175/JCLI-D-14-00320.1, Zhou et al., 2015) can be accessed through the U.S. Department of Energy's Office of Science https://www.arm.gov/research/campaigns/amf2012magic (last access: 3 October 2024).
Data for the ECMWF Reanalysis version 5 (ERA5; https://doi.org/10.24381/cds.143582cf, Hersbach et al., 2017) can be accessed at https://www.ecmwf.int/en/forecasts/dataset/ecmwf-reanalysis-v5 (last access: 29 August 2024).
TEW Jr. is responsible for all original text, data analysis, and production of graphics. KJN contributed by providing updated data processing and end-to-end simulation code, colocation of ERA5 data with MAGIC observations, and manuscript edits. FX is the academic advisor of the primary author and also provided draft edits and paper organization and writing guidance.
The contact author has declared that none of the authors has any competing interests.
Kevin J. Nelson acknowledges this work was done as a private venture and not in the author's capacity as an employee of the Jet Propulsion Laboratory, California Institute of Technology.
Publisher’s note: Copernicus Publications remains neutral with regard to jurisdictional claims made in the text, published maps, institutional affiliations, or any other geographical representation in this paper. While Copernicus Publications makes every effort to include appropriate place names, the final responsibility lies with the authors.
This article is part of the special issue “Observing atmosphere and climate with occultation techniques – results from the OPAC-IROWG 2022 workshop”. It is a result of the International Workshop on Occultations for Probing Atmosphere and Climate, Leibnitz, Austria, 8–14 September 2022.
Authors Thomas E. Winning Jr. and Kevin J. Nelson were partially supported by research assistantships from the Coastal Marine System Science Program at Texas A&M University – Corpus Christi. The high-resolution ERA5 reanalysis data were acquired from ECMWF and the Climate Data Service (CDS). The MAGIC radiosonde data were provided by the Atmospheric Radiation Measurement program (ARM) Climate Research Facility sponsored by the U.S. Department of Energy (DOE).
This research has been supported by the National Aeronautic and Space Administration (NASA) (grant no. NNX15AQ17G). Authors Thomas E. Winning Jr. and Kevin J. Nelson were partially supported by research assistantships from the Coastal Marine System Science Program at Texas A&M University – Corpus Christi.
This paper was edited by Kent B. Lauritsen and reviewed by two anonymous referees.
Anthes, R. A., Bernhardt, P. A., Chen, Y., Cucurull, L., Dymond, K. F., Ector, D., Healy, S. B., Ho, S.-P., Hunt, D. C., Kuo, Y.-H., Liu, H., Manning, K., McCormick, C., Meehan, T. K., Randel, W. J., Rocken, C., Schreiner, W. S., Sokolovskiy, S. V., Syndergaard, S., Thompson, D. C., Trenberth, K. E., Wee, T.-K., Yen, N. L., and Zeng, Z.: The COSMIC/FORMOSAT-3 Mission: Early Results, B. Am. Meteorol. Soc., 89, 313–334, https://doi.org/10.1175/bams-89-3-313, 2008.
Ao, C. O.: Effect of Ducting on Radio Occultation Measurements: An Assessment Based on High-resolution Radiosonde Soundings, Radio Sci., 42, RS2008, https://doi.org/10.1029/2006RS003485, 2007.
Ao, C. O., Meehan T. K., Hajj, G. A., Mannucci, A. J., and Beyerle, G.: Lower Troposphere Refractivity Bias in GPS Occultation Retrievals, J. Geophys. Res., 108, 4577, https://doi.org/10.1029/2002JD003216, 2003.
Ao, C. O., Chan, T. K., Iijima, A., Li, J.-L., Mannucci, A. J., Teixeira, J., Tian, B., and Waliser, D. E.: Planetary Boundary Layer Information from GPS Radio Occultation Measurements, in: Proceedings of the GRAS SAF Workshop on Applications of GPSRO Measurements, Reading, United Kingdom, 16–18 June 2008, ECMWF and EUMETSAT, 5, 123–131, https://www.ecmwf.int/sites/default/files/elibrary/2008/7459- planetary-boundary-layer-information-gps-radio-occultation-measurements.pdf (last access: 8 November 2024), 2008.
Ao, C. O., Waliser, D. E., Chan, S. K., Li, J.-L., Tian, B., Xie, F., and Mannucci, A. J.: Planetary boundary layer heights from GPS radio occultation refractivity and humidity profiles, J. Geophys. Res., 117, D16117, https://doi.org/10.1029/2012JD017598, 2012.
Basha, G. and Ratnam, M. V.: Identification of atmospheric boundary layer height over a tropical station using high-resolution radiosonde refractivity profiles: Comparison with GPS radio occultation measurements, J. Geophys. Res., 114, D16101, https://doi.org/10.1029/2008JD011692, 2009.
Beyerle, G., Gorbunov, M. E., and Ao, C. O.: Simulation studies of GPS radio occultation measurements, Radio Sci., 38, 1084, https://doi.org/10.1029/2002RS002800, 2003.
Bretherton, C. S., McCoy, I. L., Mohrmann, J., Wood, R., Ghate, V., Gettelman, A., Bardeen, C. G., Albrecht, B. A., and Zuidema, P.: Cloud, Aerosol, and Boundary Layer Structure across the Northeast Pacific Stratocumulus–Cumulus Transition as Observed during CSET, Mon. Weather Rev., 147, 2083–2102, https://doi.org/10.1175/MWR-D-18-0281.1, 2019.
Eshleman, V. R.: The radio occultation method for the study of planetary atmospheres, Planet. Space Sci., 21, 1521–1531, https://doi.org/10.1016/0032-0633(73)90059-7, 1973.
Feng, X., Xie, F., Ao, C. O., and Anthes, R. A.: Ducting and Biases of GPS Radio Occultation Bending Angle and Refractivity in the Moist Lower Troposphere, J. Atmos. Ocean. Tech., 37, 1013–1025, https://doi.org/10.1175/JTECH-D-19-0206.1, 2020.
Fjeldbo, G. and Eshleman, V. R.: The Atmosphere of Mars Analyzed by Integral Inversion of the Mariner IV Occultation Data, Planet. Space Sci., 16, 1035–1059, https://doi.org/10.1016/0032-0633(68)90020-2, 1968.
Fjeldbo, G., Kliore, A. J., and Eshleman, V. R.: The Neutral Atmosphere of Venus as Studied with the Mariner V Radio Occultation Experiment, Astron. J., 76, 123–140, https://doi.org/10.1086/111096, 1971.
Garratt, J. R.: Review: the atmospheric boundary layer, Earth-Sci. Rev., 37, 89–134, 1994.
Guo, P., Kuo, Y. H., Sokolovskiy, S. V., and Lenschow, D. H.: Estimating Atmospheric Boundary Layer Depth Using COSMIC Radio Occultation Data, J. Atmos. Sci., 68, 1703–1713, https://doi.org/10.1175/2011jas3612.1, 2011.
Gorbunov, M. E.: Canonical transform method for processing radio occultation data in the lower troposphere, Radio Sci., 37, 1076, https://doi.org/10.1029/2000RS002592, 2002.
Gorbunov, M. E., Benzon, H. H., Jensen, A. S, Lohmann, M. S., and Nielsen, A. S.: Comparative analysis of radio occultation processing approaches based on Fourier integral operators, Radio Sci., 39, RS6004, https://doi.org/10.1029/2003RS002916, 2004.
Healy, S. B.: Radio occultation bending angle and impact parameter errors caused by horizontal refractive index gradients in the troposphere: A simulation study, J. Geophys. Res., 106, 11875–11889, https://doi.org/10.1029/2001JD900050, 2001.
Hersbach, H., Bell, B., Berrisford, P., Hirahara, S., Horányi, A., Muñoz-Sabater, J., Nicolas, J., Peubey, C., Radu, R., Schepers, D., Simmons, A., Soci, C., Abdalla, S., Abellan, X., Balsamo, G., Bechtold, P., Biavati, G., Bidlot, J., Bonavita, M., De Chiara, G., Dahlgren, P., Dee, D., Diamantakis, M., Dragani, R., Flemming, J., Forbes, R., Fuentes, M., Geer, A., Haimberger, L., Healy, S., Hogan, R. J., Hólm, E., Janisková, M., Keeley, S., Laloyaux, P., Lopez, P., Lupu, C., Radnoti, G., de Rosnay, P., Rozum, I., Vamborg, F., Villaume, S., and Thépaut, J.-N.: The ERA5 Global Reanalysis, Q. J. Roy. Meteor. Soc., 146, 1999–2049, https://doi.org/10.1002/qj.3803, 2020.
Hersbach, H., Bell, B., Berrisford, P., Hirahara, S., Horányi, A., Muñoz‐Sabater, J., Nicolas, J., Peubey, C., Radu, R., Schepers, D., Simmons, A., Soci, C., Abdalla, S., Abellan, X., Balsamo, G., Bechtold, P., Biavati, G., Bidlot, J., Bonavita, M., De Chiara, G., Dahlgren, P., Dee, D., Diamantakis, M., Dragani, R., Flemming, J., Forbes, R., Fuentes, M., Geer, A., Haimberger, L., Healy, S., Hogan, R. J., Hólm, E., Janisková, M., Keeley, S., Laloyaux, P., Lopez, P., Lupu, C., Radnoti, G., de Rosnay, P., Rozum, I., Vamborg, F., Villaume, S., and Thépaut, J-N.: Complete ERA5 from 1940: Fifth Generation of ECMWF Atmospheric Reanalyses of the Global Climate, version 5, Copernicus Climate Change Service (C3S) Data Store (CDS) [data set], https://doi.org/10.24381/cds.143582cf, 2017.
Ho, S.-P., Peng, L., Anthes, R. A., Kuo, Y.-H., and Lin, H.-C.: Marine boundary layer heights and their longitudinal, diurnal and inter-seasonal variability in the southeast Pacific using COSMIC, CALIOP, and radiosonde data, J. Climate, 28, 2856–2872, https://doi.org/10.1175/JCLI-D-14-00238.1, 2015.
Jensen, A. S., Lohmann, M. S., Benzon, H.-H., and Nielsen, A. S.: Full spectrum inversion of radio occultation signals, Radio Sci., 38, 1040, https://doi.org/10.1029/2002RS002763, 2003.
Jensen, A. S., Lohmann, M. S., Nielsen, A. S., and Benzon, H.-H.: Geometrical optics phase matching of radio occultation signals, Radio Sci., 39, RS3009, https://doi.org/10.1029/2003RS002899, 2004.
Keeler, E., Burk, K., and Kyrouac, J.: Marine ARM GPCI Investigation of Clouds (MAGIC) Radiosonde Dataset, Atmospheric Radiation Measurement (ARM) user facility [data set], https://doi.org/10.5439/1595321, 2013.
Klein, S. A. and Hartmann, D. L.: The seasonal cycle of low stratiform clouds, J. Climate, 6, 1587–1606, https://doi.org/10.1175/1520-0442(1993)006<1587:TSCOLS>2.0.CO;2, 1993.
Kursinski, E. R., Hajj, G. A., Schofield, J. T., Linfield, R. P., and Hardy, K. R.: Observing Earth's atmosphere with radio occultation measurements using the Global Positioning System, J. Geophys. Res.-Atmos., 102, 23429–23465, https://doi.org/10.1029/97JD01569, 1997.
Kursinski, E. R., Hajj, G. A., Leroy, S. S., and Herman, B.: The GPS Radio Occultation Technique, Terr. Atmos. Ocean. Sci. (TAO), 11, 53–114, 2000.
Lewis, E. R.: Marine ARM GPCI Investigation of Clouds (MAGIC) Field Campaign Report, U.S. Department of Energy, https://doi.org/10.2172/1343577, 2016.
Lopez, P.: A 5-yr 40-km-Resolution Global Climatology of Superrefraction for Ground-Based Weather Radars, J. Appl. Meteorol. Clim., 48, 89–110, https://doi.org/10.1175/2008JAMC1961.1, 2009.
Maddy, E. S. and Barnet, C. D.: Vertical resolution estimates in version 5 of AIRS operational retrievals, IEEE T. Geosci. Remote, 46, 2375–2384, https://doi.org/10.1109/TGRS.2008.917498, 2008.
Nelson, K. J., Xie, F., Ao, C. O., and Oyola-Merced, M. I.: Diurnal Variation of the Planetary Boundary Layer Height Observed from GNSS Radio Occultation and Radiosonde Soundings over the Southern Great Plains, J. Atmos. Ocean. Tech., 38, 2081–2093, https://doi.org/10.1175/jtech-d-20-0196.1, 2021.
Painemal, D., Minnis, P., and Nordeen, M.: Aerosol variability, synoptic-scale processes, and their link to the cloud microphysics over the northeast Pacific during MAGIC, J. Geophys. Res.-Atmos., 120, 5122–5139, https://doi.org/10.1002/2015JD023175, 2015.
Ramanathan, V., Cess, R. D., Harrison, E. F., Minnis, P., Barkstrom, B. R., Ahmad, E., and Hartmann, D.: Cloud-radiative forcing and climate: Results from the Earth Radiation Budget Experiment, Science, 243, 57–63, https://doi.org/10.1126/science.243.4887.57, 1989.
Riehl, H.: Climate and weather in the tropics, Academic Press, London, 611 pp., ISBN 0.12.588180.0, 1979.
Schreiner, W. S., Weiss, J. P., Anthes, R. A., Braun, J., Chu, V., Fong, J., Hunt, D., Kuo, Y.-H., Meehan, T., Serafino, W., Sjoberg, J., Sokolovskiy, C., Talaat, E., Wee, T. K., and Zeng, Z.: COSMIC-2 Radio Occultation Constellation: First Results, Geophys. Res. Lett., 47, e2019GL086841, https://doi.org/10.1029/2019GL086841, 2020.
Seidel, D. J., Ao, C. O., and Li, K.: Estimating climatological planetary boundary layer heights from radiosonde observations: Comparison of methods and uncertainty analysis, J. Geophys. Res., 115, D16114, https://doi.org/10.1029/2009JD013680, 2010.
Smith, E. K. and Weintraub, S.: The Constants in the Equation for Atmospheric Refractivity Index at Radio Frequencies, P. IRE, 41, 1035–1037, https://doi.org/10.1109/JRPROC.1953.274297, 1953.
Sokolovskiy, S. V.: Modeling and Inverting Radio Occultation Signals in the Moist Troposphere, Radio Sci., 36, 441–458, https://doi.org/10.1029/1999RS002273, 2001.
Sokolovskiy, S. V.: Effect of super refraction on inversions of radio occultation signals in the lower troposphere, Radio Sci., 38, 1058, https://doi.org/10.1029/2002RS002728, 2003.
Sokolovskiy, S. V., Kuo, Y.-H., Rocken, C., Schreiner, W. S., Hunt, D., and Anthes, R. A.: Monitoring the atmospheric boundary layer by GPS radio occultation signals recorded in the open-loop mode, Geophys. Res. Lett., 33, L12813, https://doi.org/10.1029/2006GL025955, 2006.
Stull, R., Santoso, E., Berg, L. K., and Hacker, J.: Boundary Layer Experiment 1996 (BLX96), B. Am. Meteorol. Soc., 78, 1149–1158, https://doi.org/10.1175/1520-0477(1997)078<1149:BLEB>2.0.CO;2, 1997.
Stull, R. B.: An Introduction to Boundary Layer Meteorology, Kluwer Academic Publishers, 666 pp., ISBN 90-277-2768-6, 1988.
von Engeln, A. and Teixeira, J.: A Planetary Boundary Layer Height Climatology Derived from ECMWF Reanalysis Data, J. Climate, 26, 6575–6590, https://doi.org/10.1175/jcli-d-12-00385.1, 2013.
Von Engeln, A., Nedoluha, G., and Teixeira, J.: An analysis of the frequency and distribution of ducting events in simulated radio occultation measurements based on ECMWF fields, J. Geophys. Res., 108, 2002JD003170, https://doi.org/10.1029/2002JD003170, 2003.
Winning, T. E., Chen, Y.-L., and Xie, F.: Estimation of the marine boundary layer height over the central North Pacific using GPS radio occultation, Atmos. Res., 183, 362–370, https://doi.org/10.1016/j.atmosres.2016.08.005, 2017.
Wood, R., Mechoso, C. R., Bretherton, C. S., Weller, R. A., Huebert, B., Straneo, F., Albrecht, B. A., Coe, H., Allen, G., Vaughan, G., Daum, P., Fairall, C., Chand, D., Gallardo Klenner, L., Garreaud, R., Grados, C., Covert, D. S., Bates, T. S., Krejci, R., Russell, L. M., de Szoeke, S., Brewer, A., Yuter, S. E., Springston, S. R., Chaigneau, A., Toniazzo, T., Minnis, P., Palikonda, R., Abel, S. J., Brown, W. O. J., Williams, S., Fochesatto, J., Brioude, J., and Bower, K. N.: The VAMOS Ocean-Cloud-Atmosphere-Land Study Regional Experiment (VOCALS-REx): goals, platforms, and field operations, Atmos. Chem. Phys., 11, 627–654, https://doi.org/10.5194/acp-11-627-2011, 2011.
Xie, F., Syndergaard, S., Kursinski, E. R., and Herman, B. M.: An Approach for Retrieving Marine Boundary Layer Refractivity from GPS Occultation Data in the Presence of Super-refraction, J. Atmos. Ocean. Tech., 23, 1629–1644, https://doi.org/10.1175/JTECH1996.1, 2006.
Xie, F., Haase, J. S., and Syndergaard, S.: Profiling the Atmosphere Using the Airborne GPS Radio Occultation Technique: A Sensitivity Study, IEEE T. Geosci. Remote., 46, 3424–3435, https://doi.org/10.1109/tgrs.2008.2004713, 2008.
Xie, F., Wu, D. L., Ao, C. O., Kursinski, E. R., Mannucci, A. J., and Syndergaard, S.: Super-refraction effects on GPS radio occultation refractivity in marine boundary layers, Geophys. Res. Lett., 37, L11805, https://doi.org/10.1029/2010GL043299, 2010.
Xie, F., Wu, D. L., Ao, C. O., Mannucci, A. J., and Kursinski, E. R.: Advances and limitations of atmospheric boundary layer observations with GPS occultation over southeast Pacific Ocean, Atmos. Chem. Phys., 12, 903–918, https://doi.org/10.5194/acp-12-903-2012, 2012.
Zhou, X., Kollias, P., and Lewis, E.: Clouds, precipitation and marine boundary layer structure during MAGIC, J. Climate, 28, 2420–2442, https://doi.org/10.1175/JCLI-D-14-00320.1, 2015.


