the Creative Commons Attribution 4.0 License.
the Creative Commons Attribution 4.0 License.
 | 08 Feb 2024
Design and rocket deployment of a trackable pseudo-Lagrangian drifter-based meteorological probe into the Lawrence/Linwood EF4 tornado and mesocyclone on 28 May 2019
Reed Timmer
Mark Simpson
Sean Schofer
Curtis Brooks
A custom lightweight, miniaturized, and trackable meteorological probe was launched by a model rocket into the inflow region of an EF4, long-tracked tornado south of Lawrence, Kansas, on 28 May 2019 and sampled tornado core flow. The rocket reached apogee at 439 m a.g.l., releasing the “pseudo-Lagrangian drifter” by parachute directly into the tornado vortex. The probe reached a three-dimensional (3D) speed of 85.1 m s−1 in the first revolution around the tornado, measured an altitude-corrected pressure deficit of −113.5 hPa at 475 m a.s.l., and sampled a tornadic updraft speed of 65.0 m s−1. The probe then transitioned to an environment exhibiting a more tilted ascent above an altitude of 4300 m a.s.l. at speeds up to 84.0 m s−1 to a maximum altitude of 11 914 m a.s.l. 1 Hz pressure, temperature, relative humidity, GPS, acceleration, gyroscope, and magnetometer data for the flight were transmitted in real time to a ground station until 10 680 m a.s.l. and the probe landed 51 km northeast of the launch position. The probe was recovered without damage, which is attributed to the pseudo-Lagrangian drifter design, and then higher-resolution and complete 10 Hz data were downloaded for the flight. This novel deployment method and design facilitate data collection in real time from within tornadoes, the mesocyclone, and downdraft without requiring the probes to be recovered or for researchers to enter the circulation to deploy equipment.
- Article
(13076 KB) - Full-text XML
- BibTeX
- EndNote


Supercell tornadoes are among the most damaging local severe weather phenomena capable of producing wind speeds greater than 100 m s−1 and atmospheric pressure deficits greater than 100 hPa (Blair et al., 2008; Karstens et al., 2010). The strongest, most damaging winds of a tornado typically occur within the core flow or radius of maximum winds (RMW) along the outer boundary of the tornado core of low atmospheric pressure (Karstens et al., 2010; Wurman et al., 2013). This ring of maximum winds of a tornado is driven by strong horizontal and vertical pressure gradients at the outer periphery of the inner core near and just above the surface (Snow et al., 1980; Lewellen et al., 2000; Fiedler, 2009; Wurman et al., 2013). Direct measurements of aboveground winds and thermodynamics from within the core flow of a tornado had not been accomplished until the present study due to the extreme atmospheric conditions prevalent within the RMW (Wurman et al., 2013) and the relative danger of this environment.
The authors and others (Snow et al., 1980; Lewellen et al., 1997, 2000; Fiedler, 2009; Karstens et al., 2010; Wurman et al., 2013) theorize that the most significant pressure deficits in tornadoes occur in the core within the RMW very near and just above the ground, often exciting strong, jet-like updrafts that are capable of causing intense, localized damage. High-resolution cameras (Wakimoto et al., 2016) and drones (Groenemeijer, 2022) have documented these damaging updrafts of tornadoes in recent years, but direct observations are essential to determine the conditions responsible for the structural damage and human impact. However, these observations are rare and relatively limited.
Direct measurements of atmospheric conditions from inside tornadoes have been limited to ground-based instrumentation (Samaras and Lee, 2004; Blair et al., 2008; Karstens et al., 2010; Kosiba and Wurman, 2013; Wurman et al., 2013). The first ground-based, deployable instrument pack or probe for in situ measurements of meteorological data inside tornadoes was constructed in 1980 and called the TOtable Tornado Observatory (TOTO) (Bedard and Ramzy, 1983; Bluestein, 1983, 1999). The usage of TOTO was abandoned when it was determined that placing it directly into the path of a tornado was challenging (Bluestein, 1999).
Tim Samaras recorded a pressure deficit of 100 hPa inside an F4 tornado in Manchester, South Dakota, on 24 June 2003 using the Hardened In Situ Tornado Pressure Recorder (HITPR) (Samaras and Lee, 2004; Karstens et al., 2010). In Tulia, Texas, on 21 April 2007, a mobile mesonet vehicle was struck by an EF2 tornado and recorded a pressure deficit of 194 hPa along with a maximum wind velocity of 50.4 m s−1 (Blair et al., 2008). However, ground-based measurements alone do not provide information on the three-dimensional (3D) wind, thermodynamics, or structure of tornadoes.
Stirling Colgate of Los Alamos National Laboratory was the first to attempt measurements of meteorological data aboveground and inside tornadoes with instrumented lightweight (0.45 kg) rockets launched from a small aircraft (Colgate, 1982). The rocket was fired horizontally at a velocity close to Mach 1 to transect the tornado at altitude while measuring pressure, temperature, ionization, and electric field at 1 m intervals. During over 120 h of flying, only one tornado was observed, and the four rocket launches missed the target. Additionally, it was determined that the equipment needed to be hardened and engineering improved.
Over the past 3 decades, field experiments such as VORTEX, VORTEX2, and TORUS have improved the understanding of supercells, tornadoes, and particularly tornado environments using mobile Doppler radar (X-, W-, Ka-band), in situ ground-based probes, balloons, mobile mesonets, and uncrewed aerial systems (UASs) (Straka et al., 1996; Bluestein et al., 2003; Wakimoto et al., 2003; Bluestein et al., 2004; Samaras and Lee, 2004; Blair et al., 2008; Weiss and Schroeder, 2008; Karstens et al., 2010; Kosiba and Wurman, 2010, 2013; Wakimoto et al., 2011; Wurman et al., 2012; Tanamachi et al., 2013; Winn et al., 1999; Samaras, 2004; Pazmany et al., 2013; Frew et al., 2020; Houston et al., 2020; Markowski et al., 2018). Mobile radars are mainly limited to measuring horizontal wind of storms and tornadoes, with the vertical component being inferred due to inclined measurements unless the measurements are taken vertically from dangerous positions inside a tornado. Multiple-elevation mobile radar data coupled with photogrammetry techniques and or ground-based wind measurements have successfully derived information on the 3D winds of tornadoes (Wakimoto et al., 2011; Kosiba and Wurman, 2010, 2013; Tanamachi et al., 2013). However, mobile radar-based analyses of winds inside tornadoes using multiple elevations are limited in spatial and temporal resolution as well as range and provide limited information on the thermodynamics of tornadoes (Markowski et al., 2018). Additionally, the UAS technology deployed in the TORUS project is not intended for direct measurements inside a tornado core flow (Frew et al., 2020; Houston et al., 2020).
A pseudo-Lagrangian drifter is a sufficiently miniaturized, instrumented probe that is intended to move along with the wind flow such that the speed of the probe is very close to the wind speed of the air in which it is embedded. Using pseudo-Lagrangian drifters for infiltrating thunderstorms and supercells with sensors has been accomplished using a dual-balloon approach (Markowski et al., 2018) and a single-balloon approach where the balloon is filled with helium during flight (Swenson et al., 2019). The thermodynamics of supercell storms (and tornadoes) are essential to understand because wind accelerations and storm morphology are driven primarily by pressure gradient and buoyancy forces (Markowski et al., 2018; Bartos et al., 2022). The wind speeds and accelerations inside a tornado should also be driven by pressure gradient and buoyancy forces. A tornado has yet to be directly sampled by the dual-balloon deployments of Markowski et al. (2018) and Bartos et al. (2022).
Given the abovementioned studies, it is clear that there is a notable lack of direct observations inside or near the tornado vortex and mesocyclone. To address this observational need, the present study describes a new, miniaturized, pseudo-Lagrangian sensor deployed from a low-cost surface-based model rocket that is capable of obtaining these observations inside the circulation. The design of this sensor and a case study showing its use are presented here. This novel methodology is presented as a solution to directly measure the 3D wind and thermodynamics inside a tornado.
2.1 Probe design
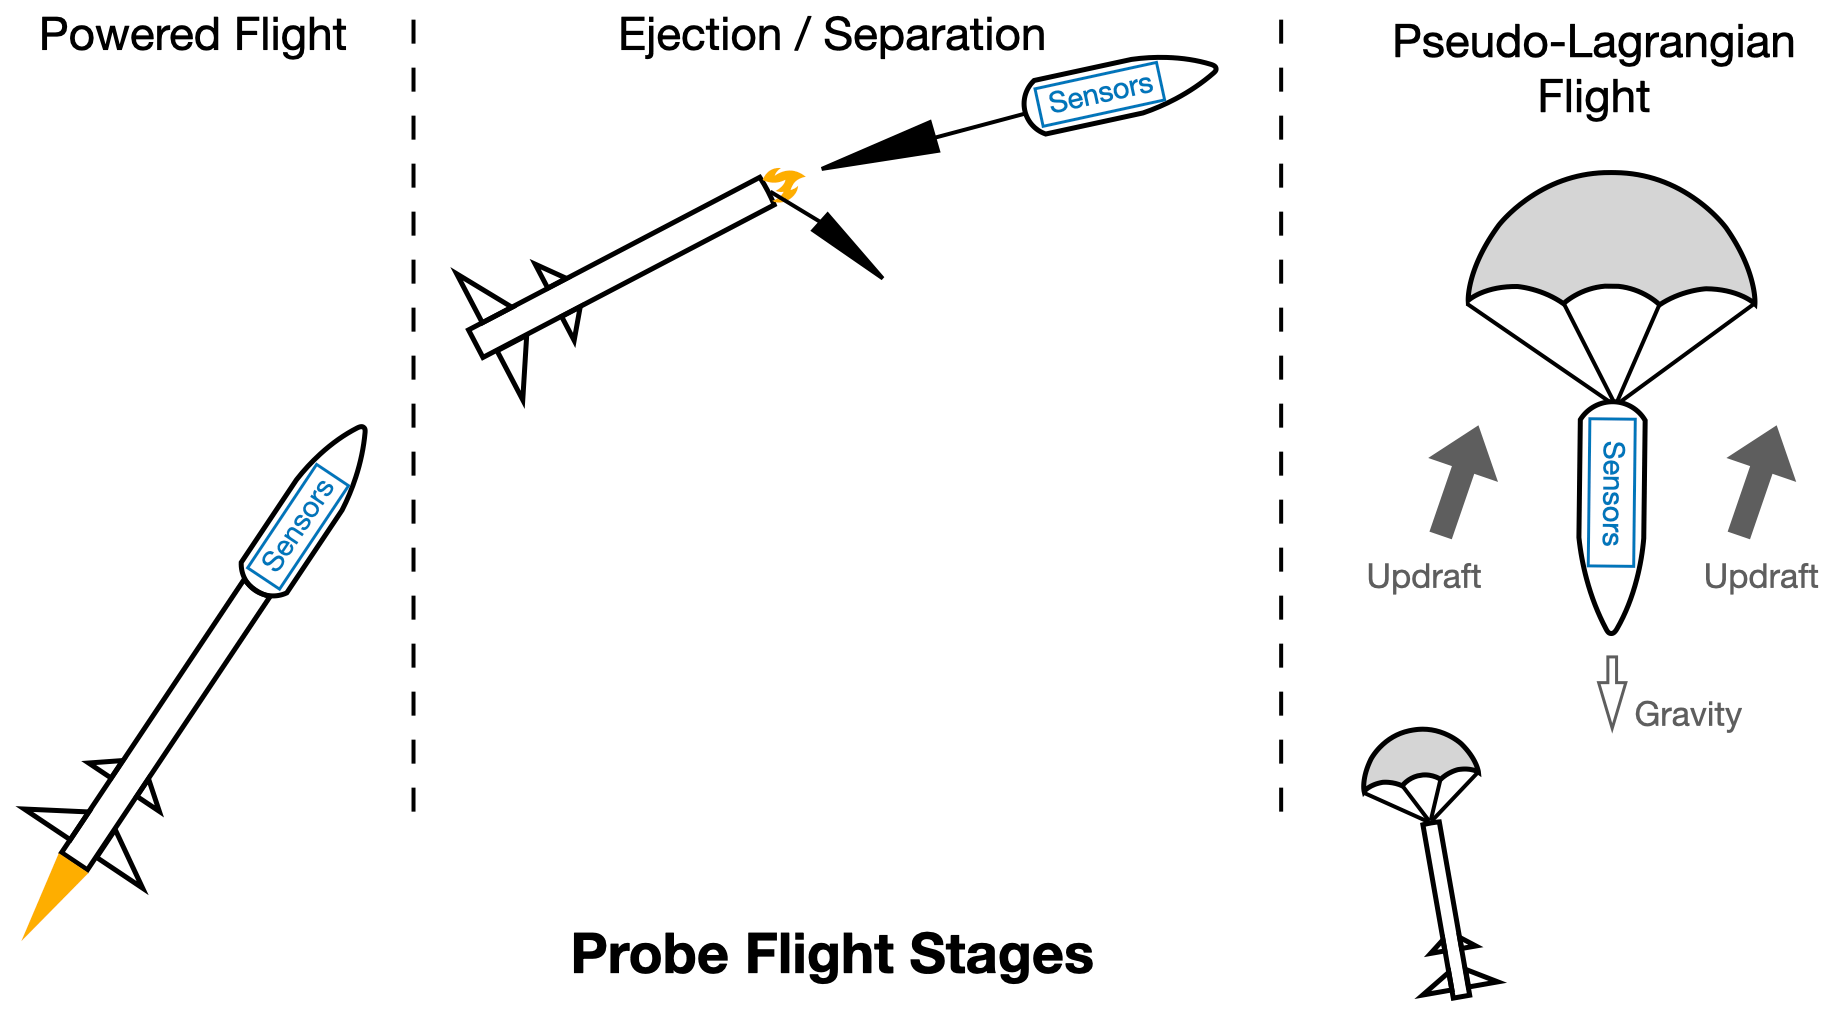
The present study's authors have tested many airborne delivery mechanisms for deploying meteorological sensors into tornado core flows over the past 2 decades. These include air cannons, parachuted sensor packs dropped by remote-controlled aircraft, and ground-deployed inflatable plastic bubbles to be ingested by the surface inflow of a tornado. After experimenting with many different delivery methods, it was theorized that to obtain meteorological data by a sensor from within a tornado core flow, the speed of model rockets would be required to penetrate subsiding air that is often proximal to a mature tornado (Lemon and Doswell, 1979). Descending air is often near or even surrounding a supercell tornado because these tornadoes most often occur near strong gradients of vertical velocity (Lemon and Doswell, 1979).
To address the needed observations, the authors designed and built a custom-engineered probe (Fig. 1) and firmware for the present study. Real-time data reception and location tracking were deemed necessary to ensure that the loss of the probe, due to the hostile environment or inability to recover, did not impact data collection. The software was designed to permit multiple probes to be airborne concurrently.
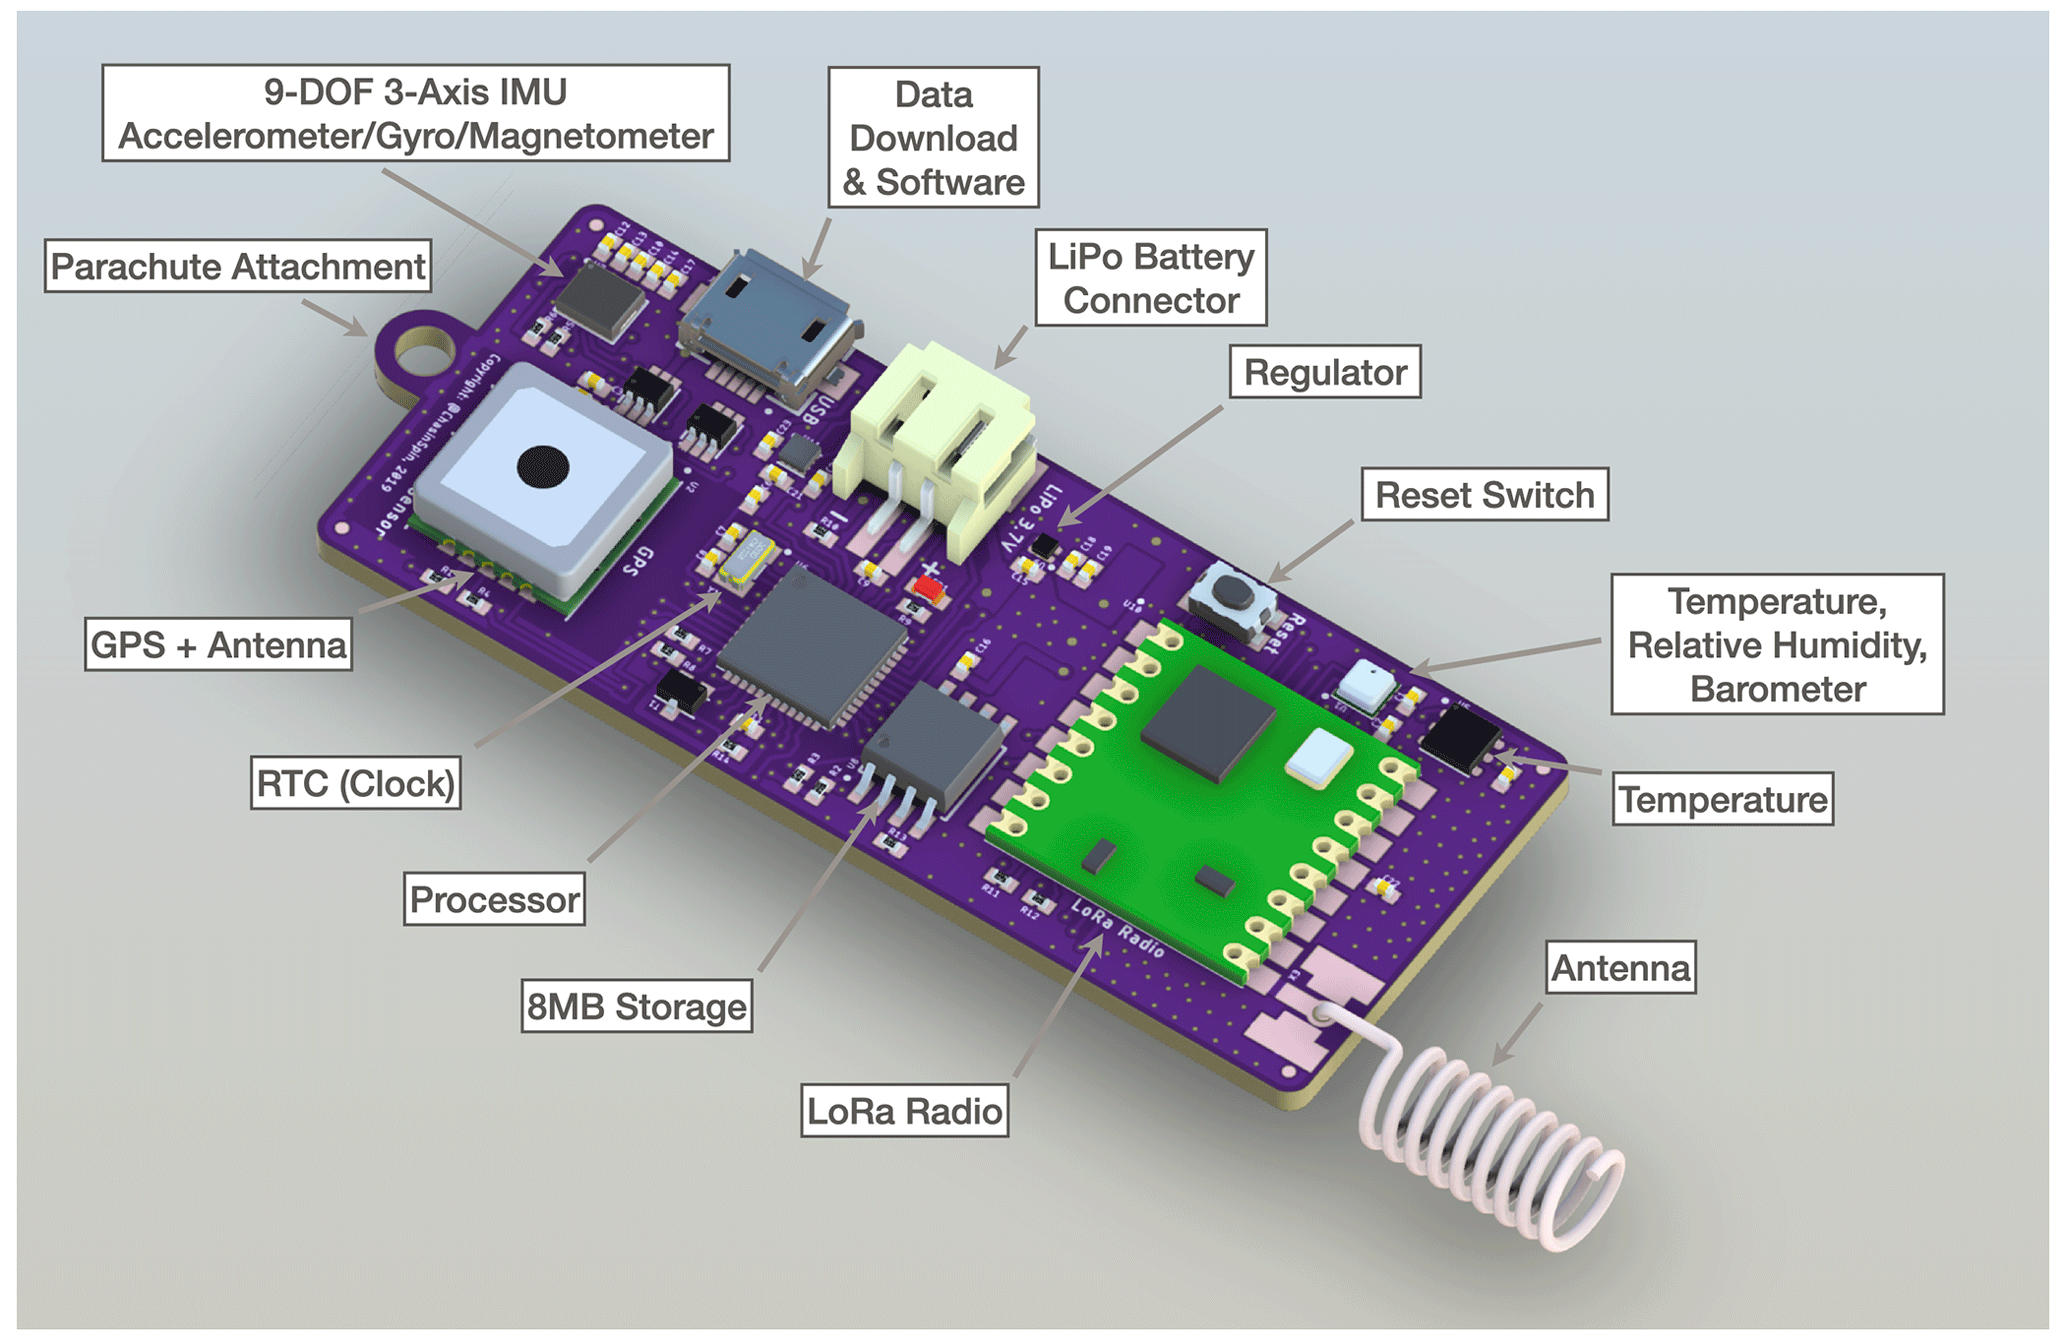
Figure 13D render of a custom-engineered probe showing the sensors and major electronic components used in the design.
This lightweight probe has onboard miniaturized sensors for pressure, temperature, humidity, GPS, and a three-axis inertial measurement unit (IMU). The rocket's pseudo-Lagrangian flight characteristic and small payload capacity necessitated a compact surface-mount design (2.5 × 7.6 cm) with a total mass of 30 g (17 g plus 13 g battery). The probe's onboard sensors were carefully selected based on criteria for wide environmental operating ranges, sampling rates, accuracy, mass, and power efficiency (Table 1). A high sampling rate of 10 Hz was compatible with all sensors, excluding the GPS, which has a maximum rate of 5 Hz.
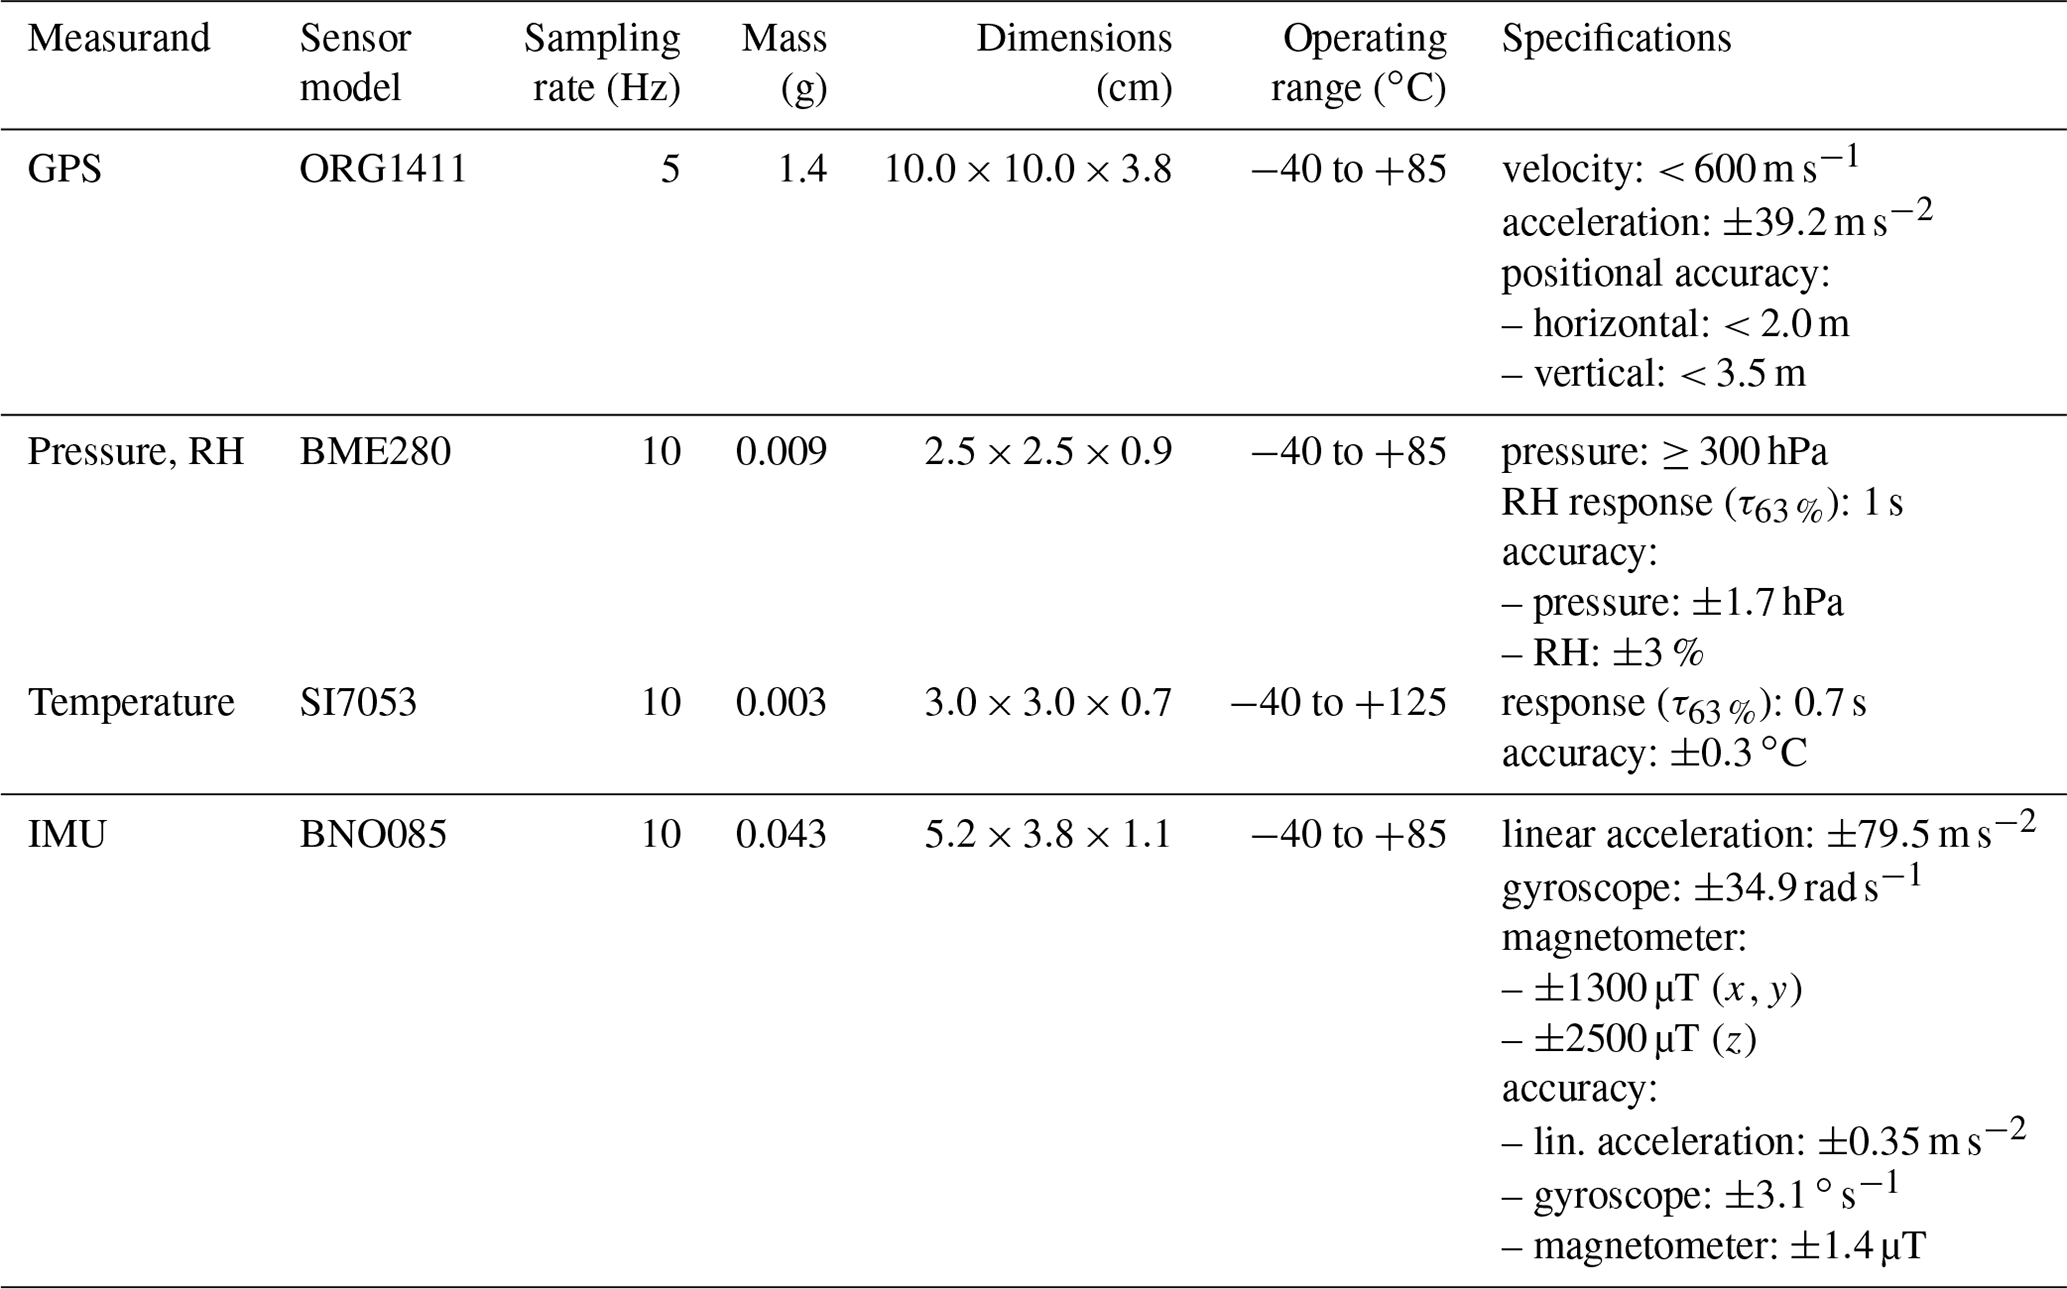
The GPS sensor selected for the probe was the ORG1411 “Nano Hornet” by OriginGPS. This device has a small form factor and mass while maintaining a GPS fix in accelerations of up to 39.2 m s−2. This sensor has an inbuilt patch antenna which provides weight savings compared to an external antenna.
Similarly, the BME280 sensor by Bosch Sensortec was determined to be an ideal barometric pressure and humidity sensor, given its small mass, size, and performance. The higher pressure sampling rate was advantageous for detecting gravity waves or other fine-scale pressure oscillations within the tornado and parent mesocyclone by comparing GPS altitude to pressure. However, it was determined that the temperature measurement could be improved with the addition of the SI7053 temperature sensor by Silicon Labs. This provided improvements in accuracy and thermodynamic response time (τ63 %) over the BME280 (Table 1).
An IMU was included on the probe to measure the forces and accelerations experienced inside the tornado and the probe's orientation. The nine-axis BNO085 is a miniature IMU by Hillcrest Labs that provides these data from an incorporated three-axis magnetometer, accelerometer, and gyroscope. The miniature size and mass of the BNO085 are ideal for flight within a tornado. Using the IMU sensor-fusion of the magnetometer, accelerometer, and gyroscope, the pitch, yaw, and roll angles were derived. Information about orientation and forces imparted on the probe helps identify turbulence and transitions between shear layers. After manufacturing, a software routine was developed to calibrate the IMU and store the data on the electrically erasable, programmable read-only memory (EEPROM), as stresses built up in the soldering process can offset the factory calibration of micro-electromechanical system (MEMS) sensors on the die.
The probe used long-range (LoRa) radio transmission to transmit and receive data to and from a ground station. LoRa is a spread spectrum technology that can still work even when the signal is below the noise floor. The power required is also minimal compared to other technologies, and throughput is traded against range, with longer distances requiring less throughput (Augustin et al., 2016; Noreen et al., 2017). Transmission occurs in the industrial, scientific, and medical band (ISM) at 915 MHz and does not require licensing. Point-to-point LoRa was chosen over the more commonly used wide-area star-of-stars topology long-range wide-area network (LoRaWAN) (Semtech, 2019) due to the increased throughput and ability to maintain transmission in sparsely populated areas. A star-of-stars topology is one in which gateways relay messages between devices and a centralized network server.
Time-division multiple access (TDMA) was implemented with regular framing pulses from a ground station, allowing multiple probes to be tracked simultaneously. 1 Hz data transmissions allow the complete sensor data to be transmitted concurrently over LoRa for nine airborne sensors for distances of up to 100 km. The TDMA protocol was modified such that non-reception of the framing pulse did not result in an immediate loss of synchronization and that opportunistic reception could continue in the event of a loss of synchronization.
A wave monopole antenna was chosen for the probe and coiled to reduce size. This antenna configuration allowed for an omnidirectional radiation pattern such that the probe's orientation in flight would not impact the communication range.
The electronics were waterproofed using a silicone conformal coating to protect from unpredictable behavior due to current leakage attributable to moisture. The BME280 and SI7053 sensors were protected from this coating during assembly to avoid damaging the BME280 polymer due to volatile chemicals and a reduction of the thermal response on both sensors due to the insulation of the coating. A permeable polytetrafluoroethylene (PTFE) barrier was placed over the port on the BME280 to avoid damage from water and condensing moisture during flight as is typically applied to relative humidity polymer-based MEMS sensors. Power was provided by a small rechargeable 350 mA h−1 lithium-ion polymer (LiPo) battery.
2.2 Ground station design
The mobile ground station consisted of a Raspberry Pi Zero W and a custom LoRa daughterboard with an inter-integrated circuit (I2C) organic light-emitting diode (OLED) display and antenna. A wave monopole omnidirectional antenna was used instead of an increased-range directional antenna to simplify tracking the probe in a severe weather environment.
The station contained custom software on an SD card and provided a web server over a Wi-Fi network. In addition, the station broadcasted the TDMA framing pulse, handled the communication, stored data from the sensors, and provided the user interface for monitoring the sensors in real time.
Accessing the interface was via a web browser on a mobile device or computer, and an Apple iPad was used for this purpose. The bearing and distance were calculated from the chase vehicle to the probe by comparing the onboard GPS location of the iPad to the GPS location received from the probe. A 10 A h−1 rechargeable battery pack provided power.
2.3 Rocket and launcher design
A custom-modified Magnum Sport Loader dual-motor model rocket from Quest Aerospace was used to launch the probe into the tornado (Fig. 2) with a pseudo-Lagrangian drifter deployment (Fig. 3). The dual-motor design enhanced thrust, range, and payload capacity.
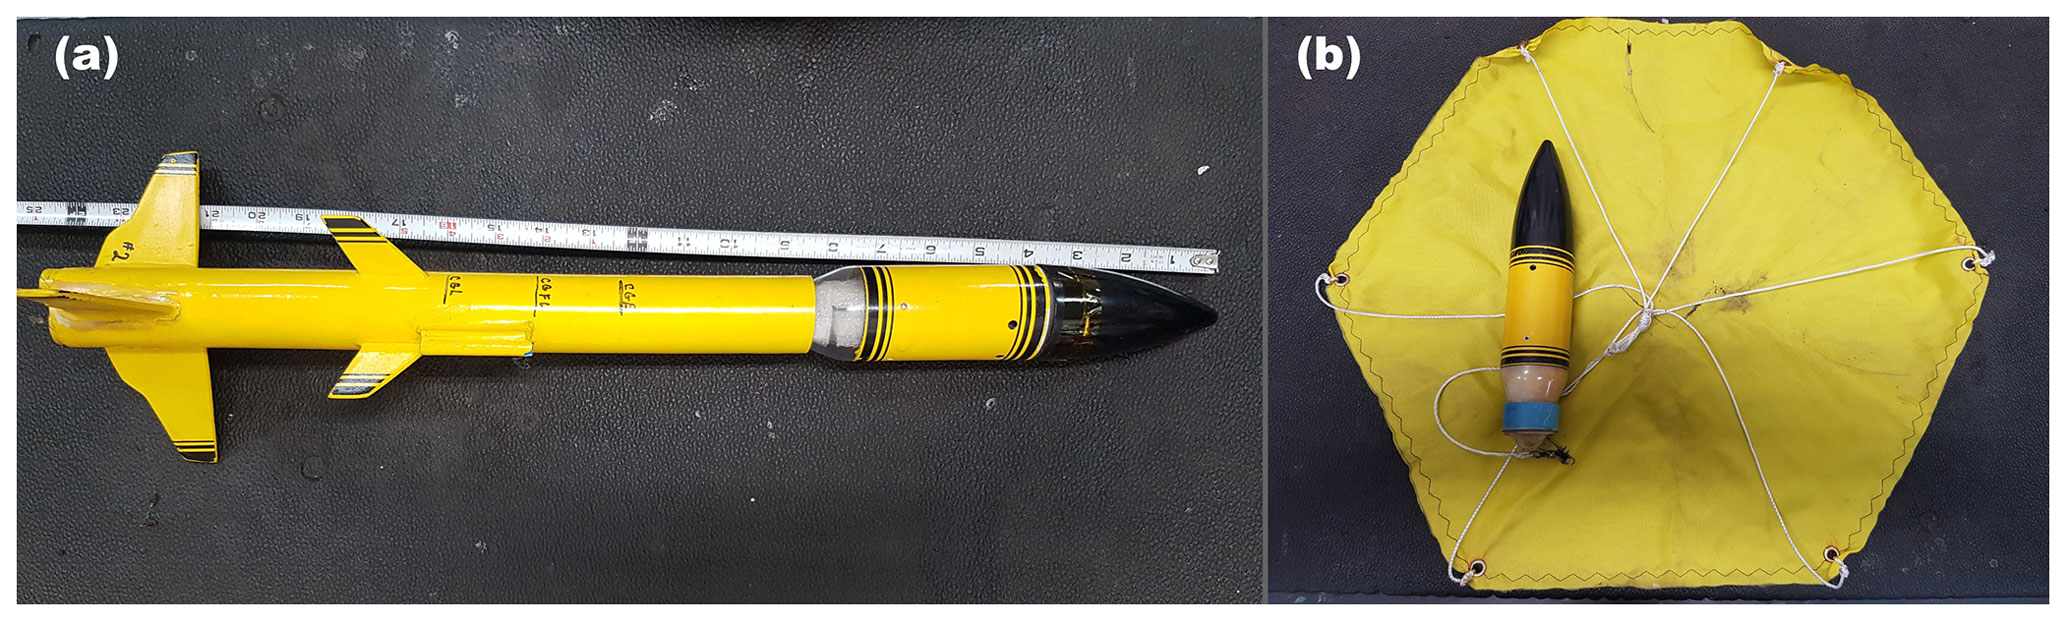
High velocity was required to pass through the subsidence often situated near an occluded tornado (Lemon and Doswell, 1979); therefore, higher-thrust class-D ammonium perchlorate motors (Aerotech D21-7T 18 mm) were used for each of the dual motors. The motor uses Blue Thunder propellant, has a mass of 25 g, and has a peak thrust of 32.1 N. Due to a long 7 s delay between engine burnout and the parachute ejection charge, the rocket coasts further and can cover the distance required to transit into the tornado. The upper three stabilization fins were raised higher on the rocket body to improve stability in high winds. A single hand-sewn nylon parachute with an outside diameter of 0.61 m was used to provide resistance to debris and damage from the ejection charge while lofting in vertical high-velocity winds.
Rocket flight simulator software (RockSim Version 9) was used to optimize the center of pressure and achieve maximum flight range without tumbling. Simulations also tested how the rocket would respond to substantial winds and atmospheric conditions found in the inflow zone of a tornado. The maximum payload capacity of this customized design was determined to be 50 g with a parachute descent rate of approximately 4–6 m s−1, depending on air density. The probe was housed within the nose cone compartment with expanded polystyrene foam plugs at both ends to constrain the movement of the probe within the enclosure during flight and for thermal protection of the battery, while still permitting airflow across the sensors.
A mobile rocket launcher (Fig. 4) with pan-and-tilt capability was engineered and mounted to the roof of the armored chase vehicle Dominator 3 (Fig. 5). The motor and gears of the launcher were derived from the automated window lift system of a junkyard vehicle. The design incorporated a substantial blast plate and two 0.91 m launch rods to launch multiple rockets. The potential exists for a return lightning strike from a rocket's ionization trail, so a custom control panel was designed inside the Dominator 3 to aim and launch the rockets from within the protective armor (Fig. 6).
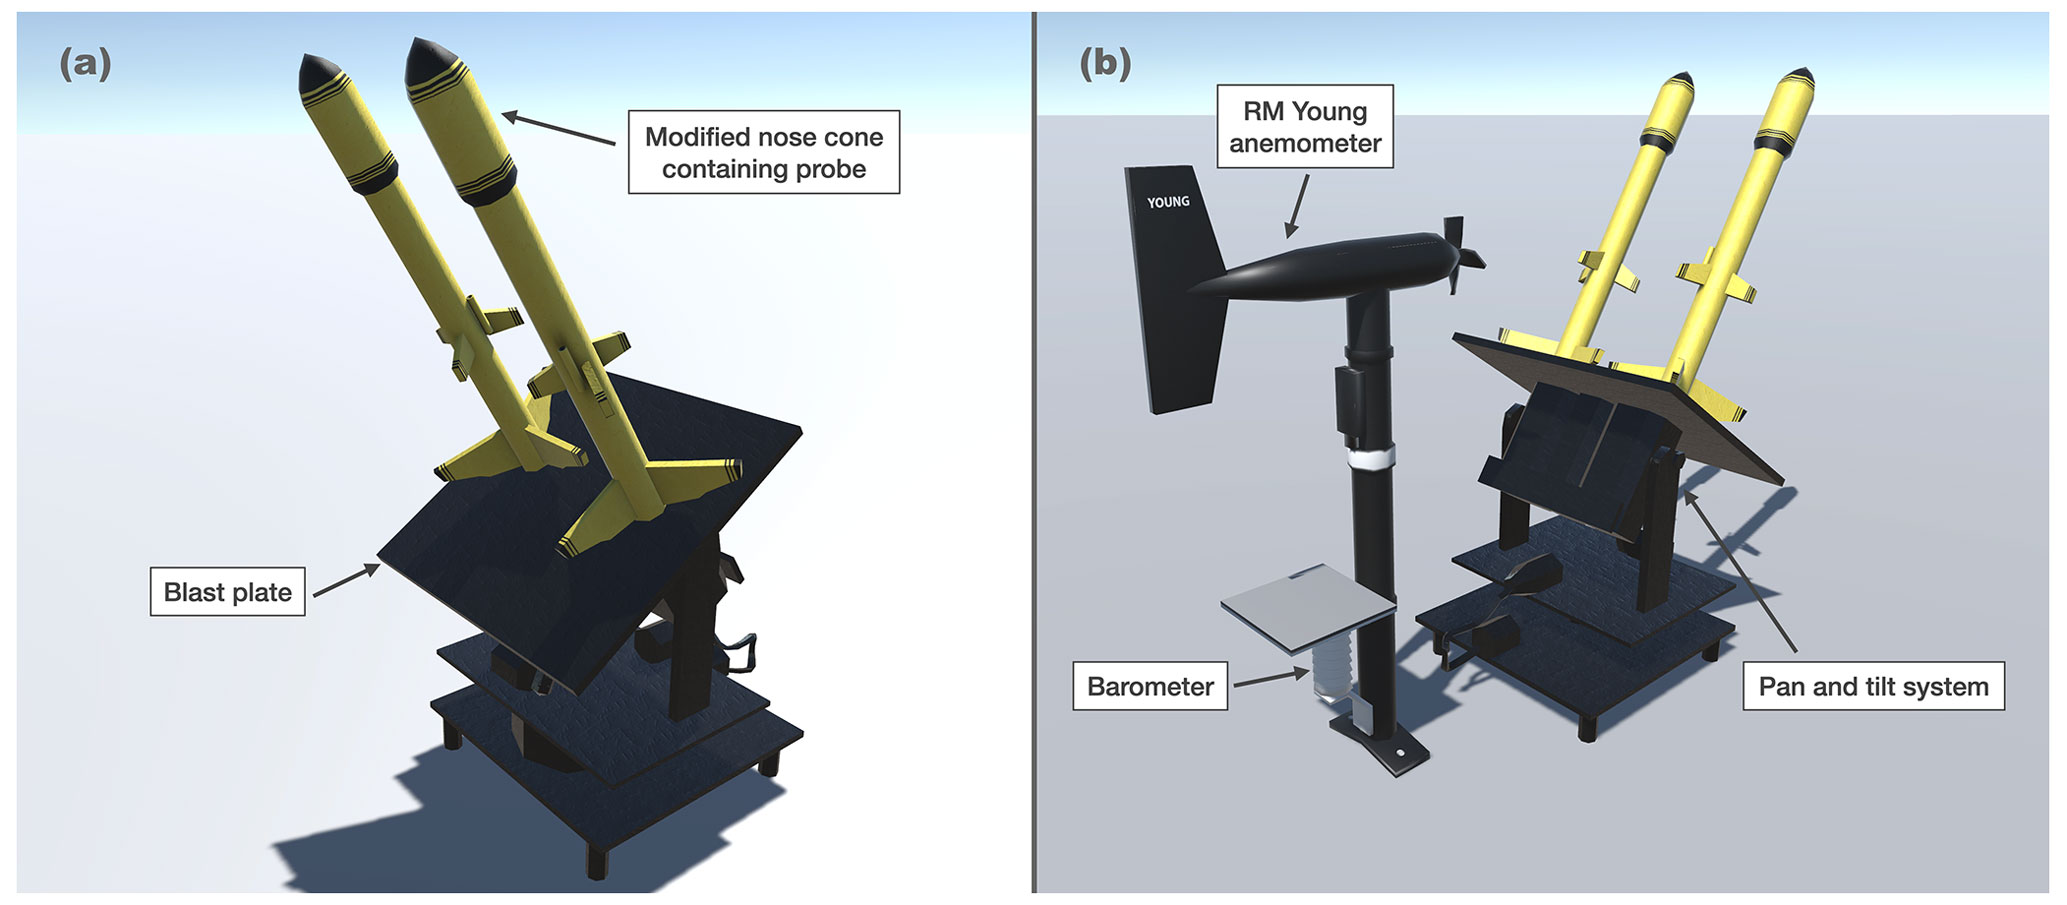
Figure 43D render of rooftop rocket launcher (credit: OUTBRK). Rockets and blast plate (a); weather station and rocket launcher pan–tilt mechanism (b).
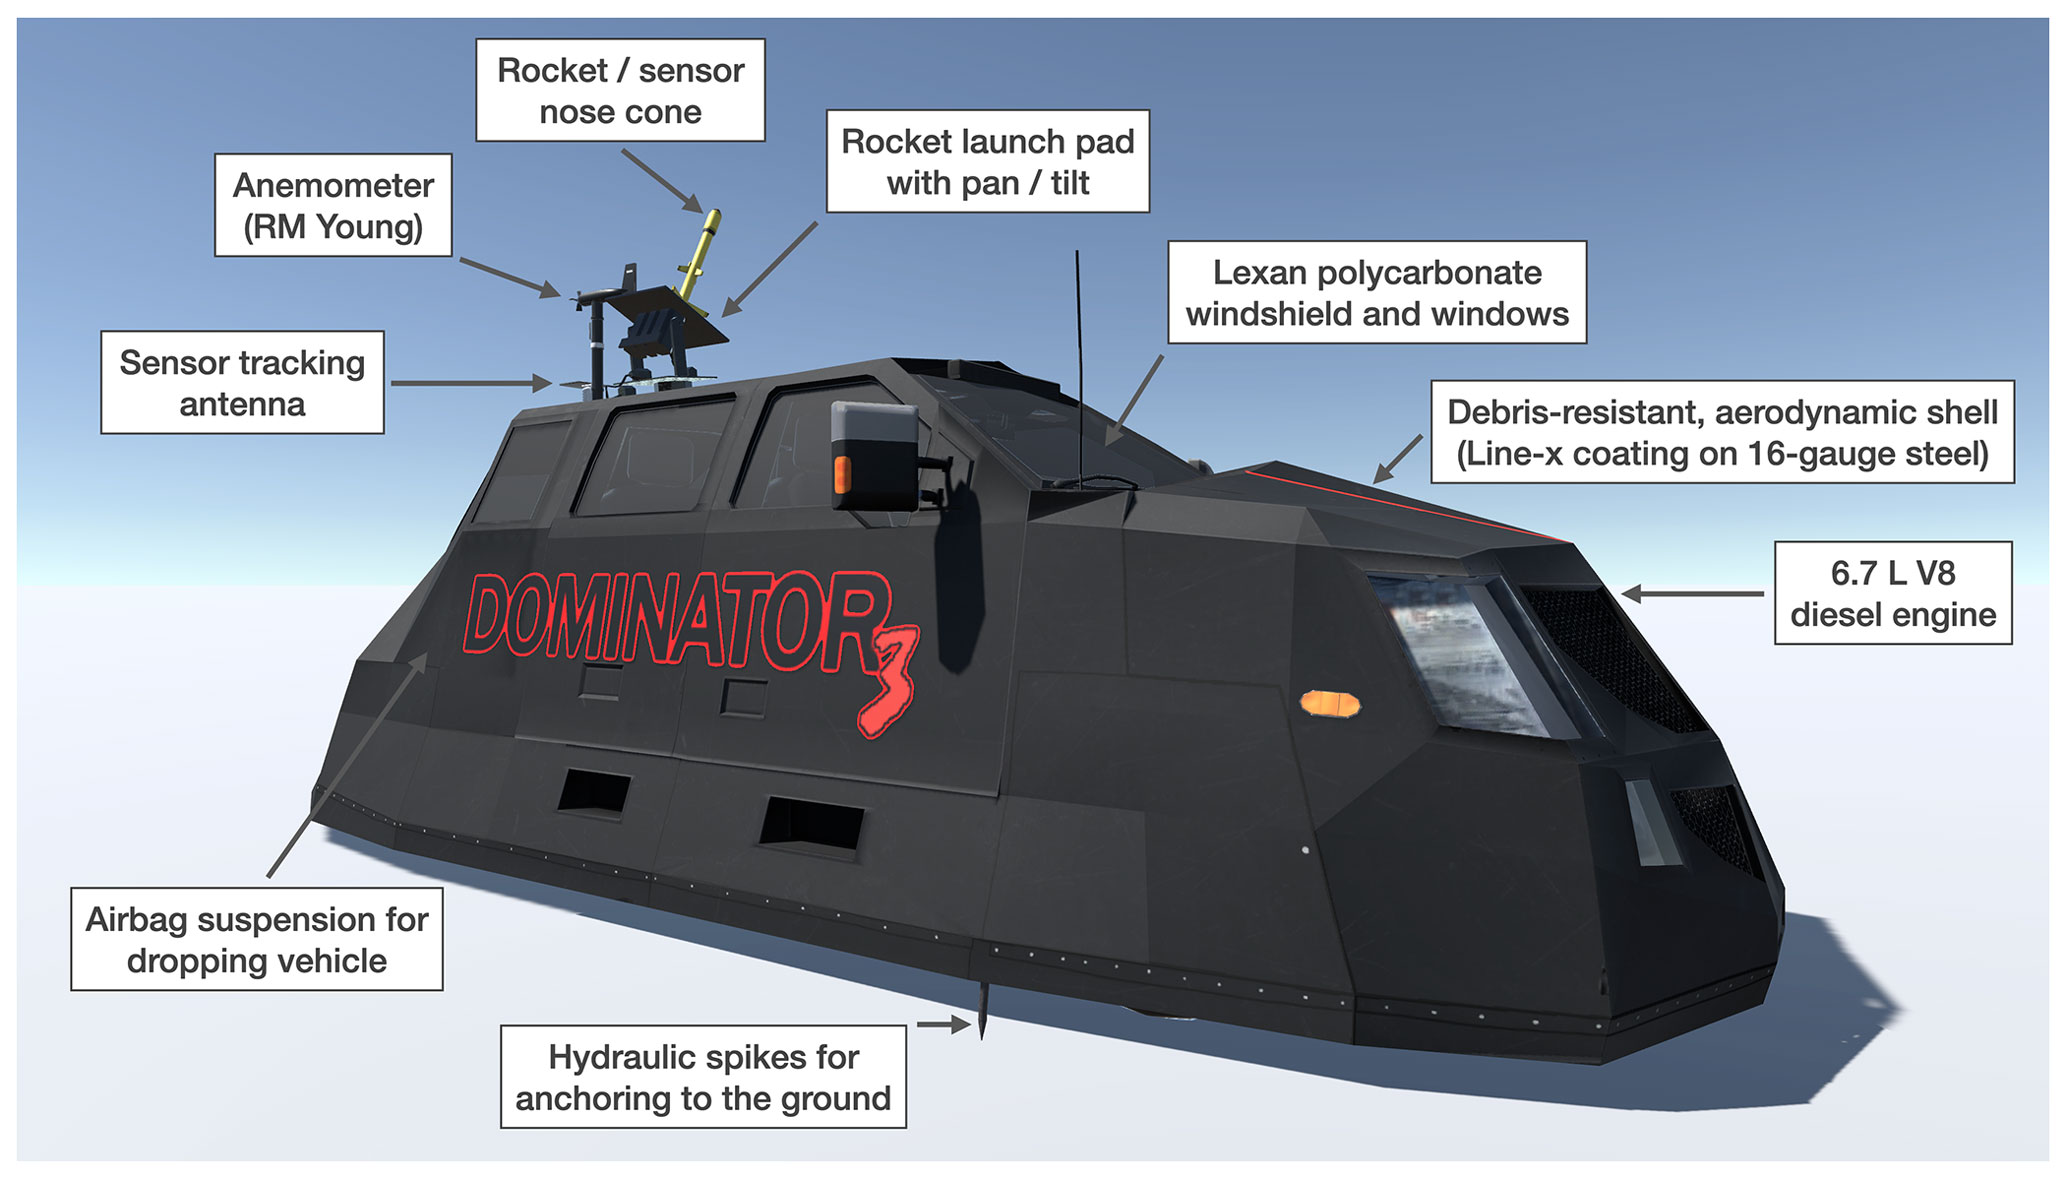
Figure 5Dominator 3 storm-chasing vehicle (credit: OUTBRK).
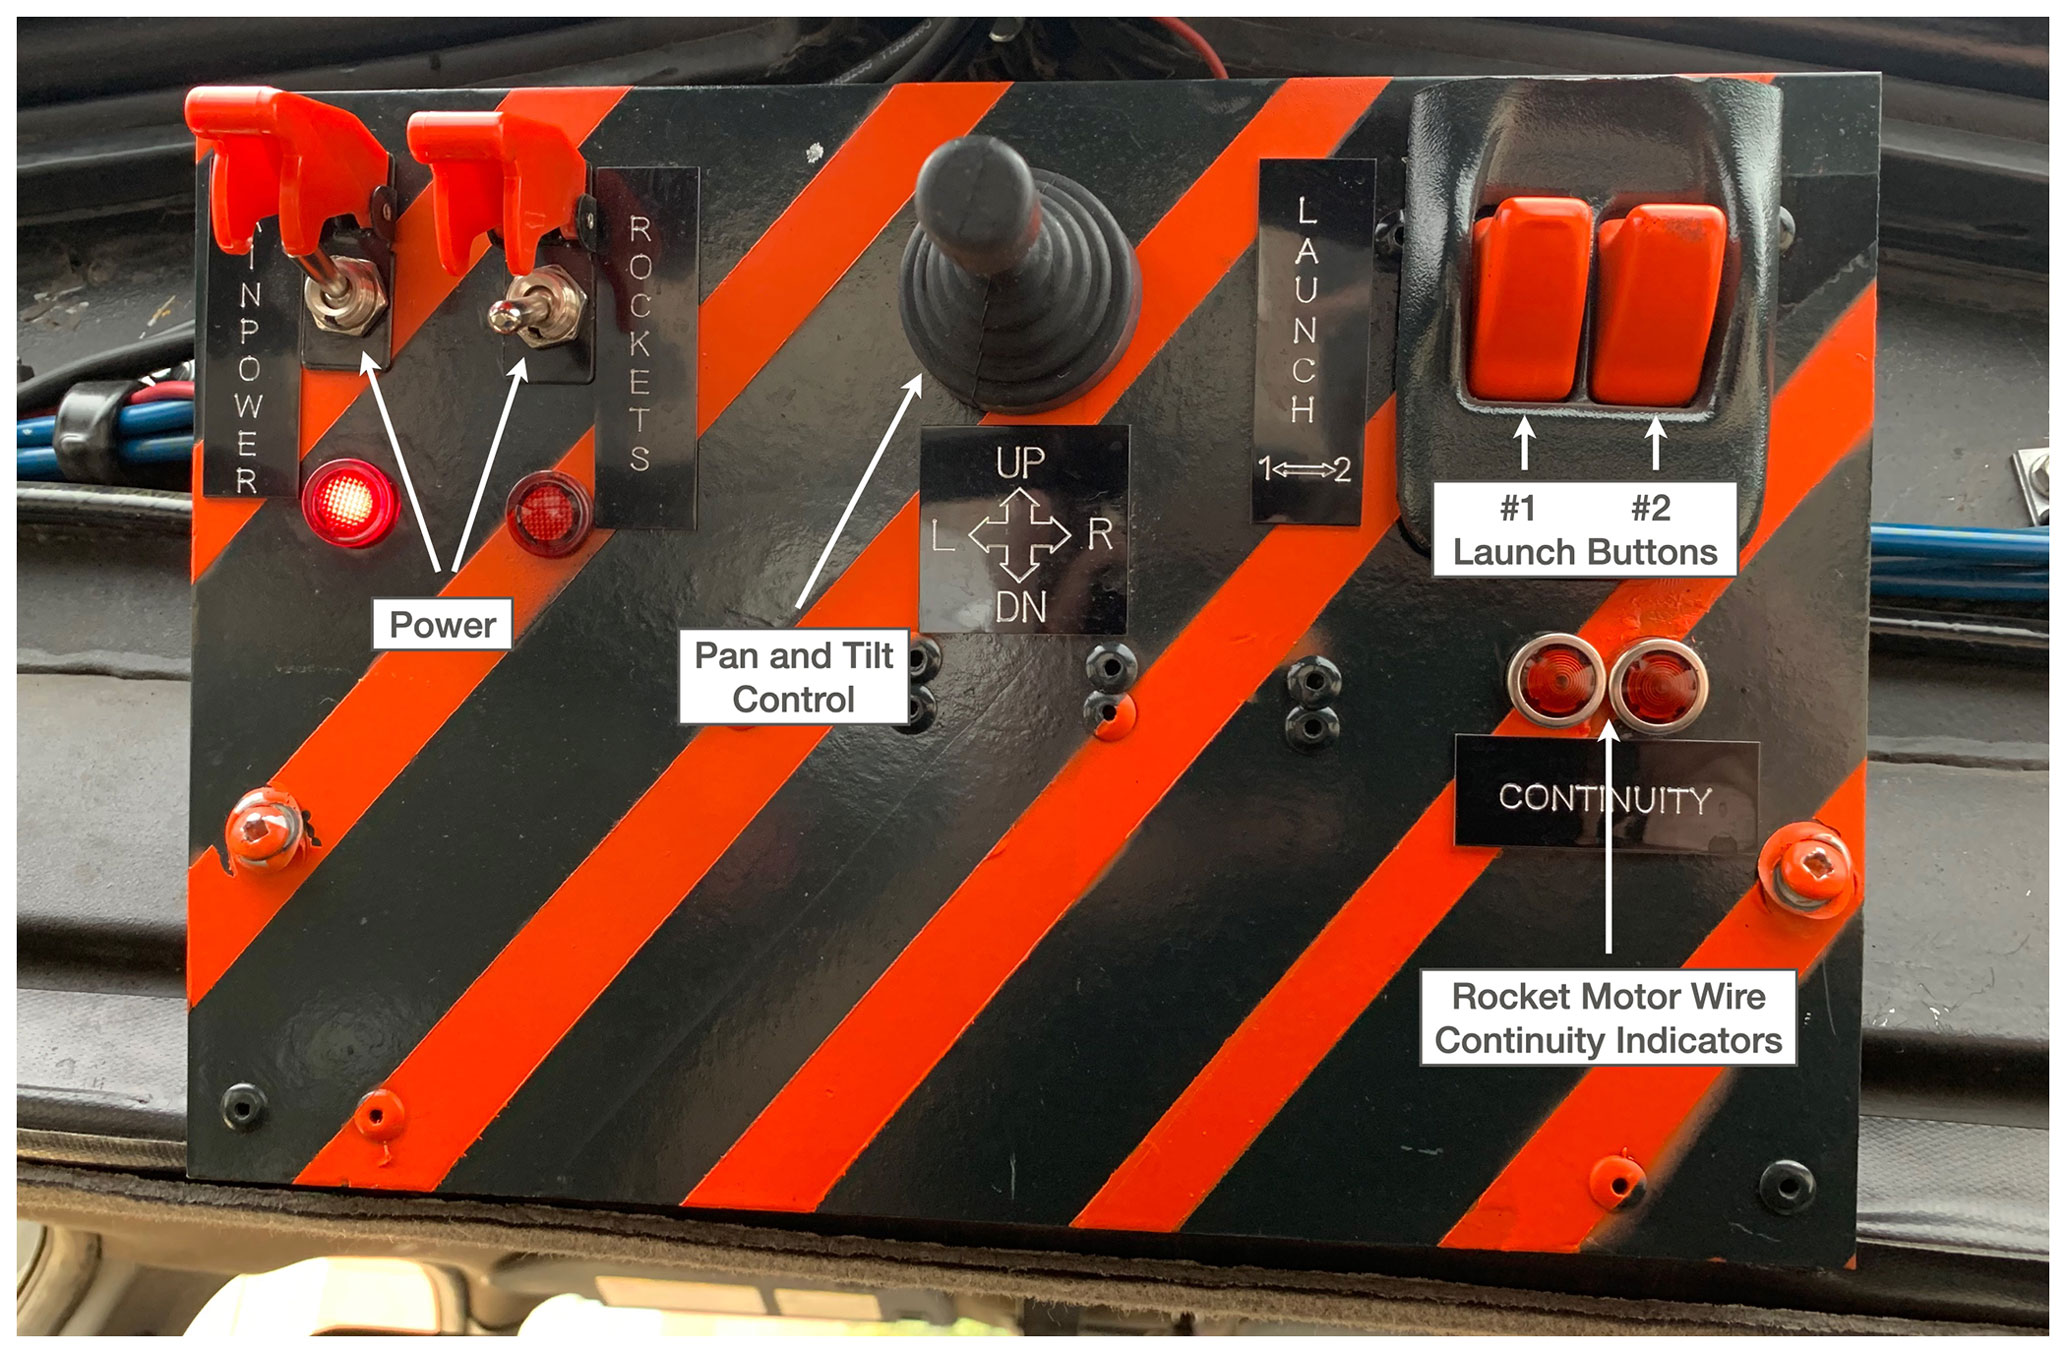
Figure 6Custom control panel for launching rockets.
2.4 Launch safety
The low mass of the rocket, propellent, and payload, combined with the engine size selection, results in a Federal Aviation Administration (FAA) Class 1 amateur model rocket designation (Federal Aviation Administration, 2022). Regulations and recommendations for Class 1 rockets in the USA are governed by the FAA, National Fire Protection Association (NFPA), and National Association of Rocketry (NAR). These regulations specify that a Class 1 amateur rocket must not be launched within a prohibited or restricted area unless permission is obtained, which is determined with aviation maps (Federal Aviation Administration, 2022). Additionally, the rocket must be suborbital, not cross into a foreign nation, be uncrewed, and “not create a hazard to persons, property, or other aircraft”.
The NFPA recommendations are adopted at a state level by most states. The minimum site dimension for a class-D motor is 152 m and should be “in a cleared area, free of tall trees, power lines, buildings, and dry brush and grass”. A launch of this small size requires a spectator distance of 9 m (National Fire Protection Association, 2018). NAR summarizes the NFPA recommendations and specifies that the site “must be free of tall trees, power lines, buildings, and dry brush and grass. The launcher can be anywhere on this site, and the site can include roads. Site dimensions are not tied to the expected altitude of the rockets' flights” (National Association of Rocketry, 2022a, b).
The risk to aviation is negligible as pilots avoid tornadoes and thunderstorms. The low payload mass of 30 g after deployment is less than a North American robin, so the impact would be similar to a small bird strike in the improbable event of a collision. After payload separation, the probe and parachute behave similarly to other lightweight debris lofted in a tornado at the same altitude. The descent phase is controlled by a parachute and does not present an impact hazard. Prior to payload separation, the total mass of the rocket, engines, parachute, and payload is 140 g. Comparatively, a typical radiosonde weighs 250 to 500 g (National Weather Service, 2023) and poses a greater risk to aviation.
FAA, NFPA, and NAR have accounted for the risk to people, property, and aviation according to the class definitions they have applied to the hobby and have defined regulations appropriate for safety. Many amateur rocket launches of considerably larger sizes occur daily in the USA, and model rocketry has an excellent safety record. Hitting a vehicle or person is unlikely, and damage at this size and mass is expected to be negligible.
In addition to fulfilling the legal requirements for rocket launches, we also model, sufficiently test, and inspect rockets before launch. The authors keep fire extinguishers available, team members include a firefighter and a fire marshal, and launch site safety is assessed.
2.5 Deployment safety
The deployment of rocket-borne sensors into tornadoes from the inflow region of supercells is associated with a heightened safety risk, as the path of the tornado often must be traversed to attain an ideal launch position (Fig. 9). The authors followed an intensive safety protocol during this field project, in addition to adhering to all model rocket launch regulations. These safety measures included the use of a custom armored vehicle (Fig. 5) to provide protection from the environment and a trained spotter in the vehicle for visual observation of the tornado and assessment of its motion prior to deployment. In order to maximize safety during field operations, the authors did not deploy from the direct path of the tornado and debris field and remained inside the vehicle when near the storm to minimize lightning danger. The team extensively rehearsed the deployment procedure prior to this field project, realizing that any inefficiencies or mistakes can have serious consequences near the path of a tornado.
3.1 Synopsis
The period between 17 May and 30 May 2019 was a prolific period for severe weather across the United States, with 456 tornadoes (NOAA National Centers for Environmental Information, 2019b) and three tornado outbreaks (NOAA National Centers for Environmental Information, 2019a). A total of 22 were rated EF3, and two were rated EF4, including the Lawrence/Linwood tornado (NOAA National Centers for Environmental Information, 2019b).
On the morning of 28 May, a robust upper-level trough with 500 hPa temperatures below −20 ∘C covered a large portion of the Mountain West region of North America. A strong southwesterly mid- and upper-level jet stream extended downstream over the Southern Great Plains. The southerly low-level jet stream (LLJ) of greater than 20 m s−1 (40 kn) maintained deep low-level moisture up to a stationary front across northern Kansas and Missouri. An outflow boundary (OFB) from a nocturnal mesoscale convective system (MCS) was draped from northwest to southeast across northeastern Kansas through peak heating (Fig. 7) (Storm Prediction Center, 2019).
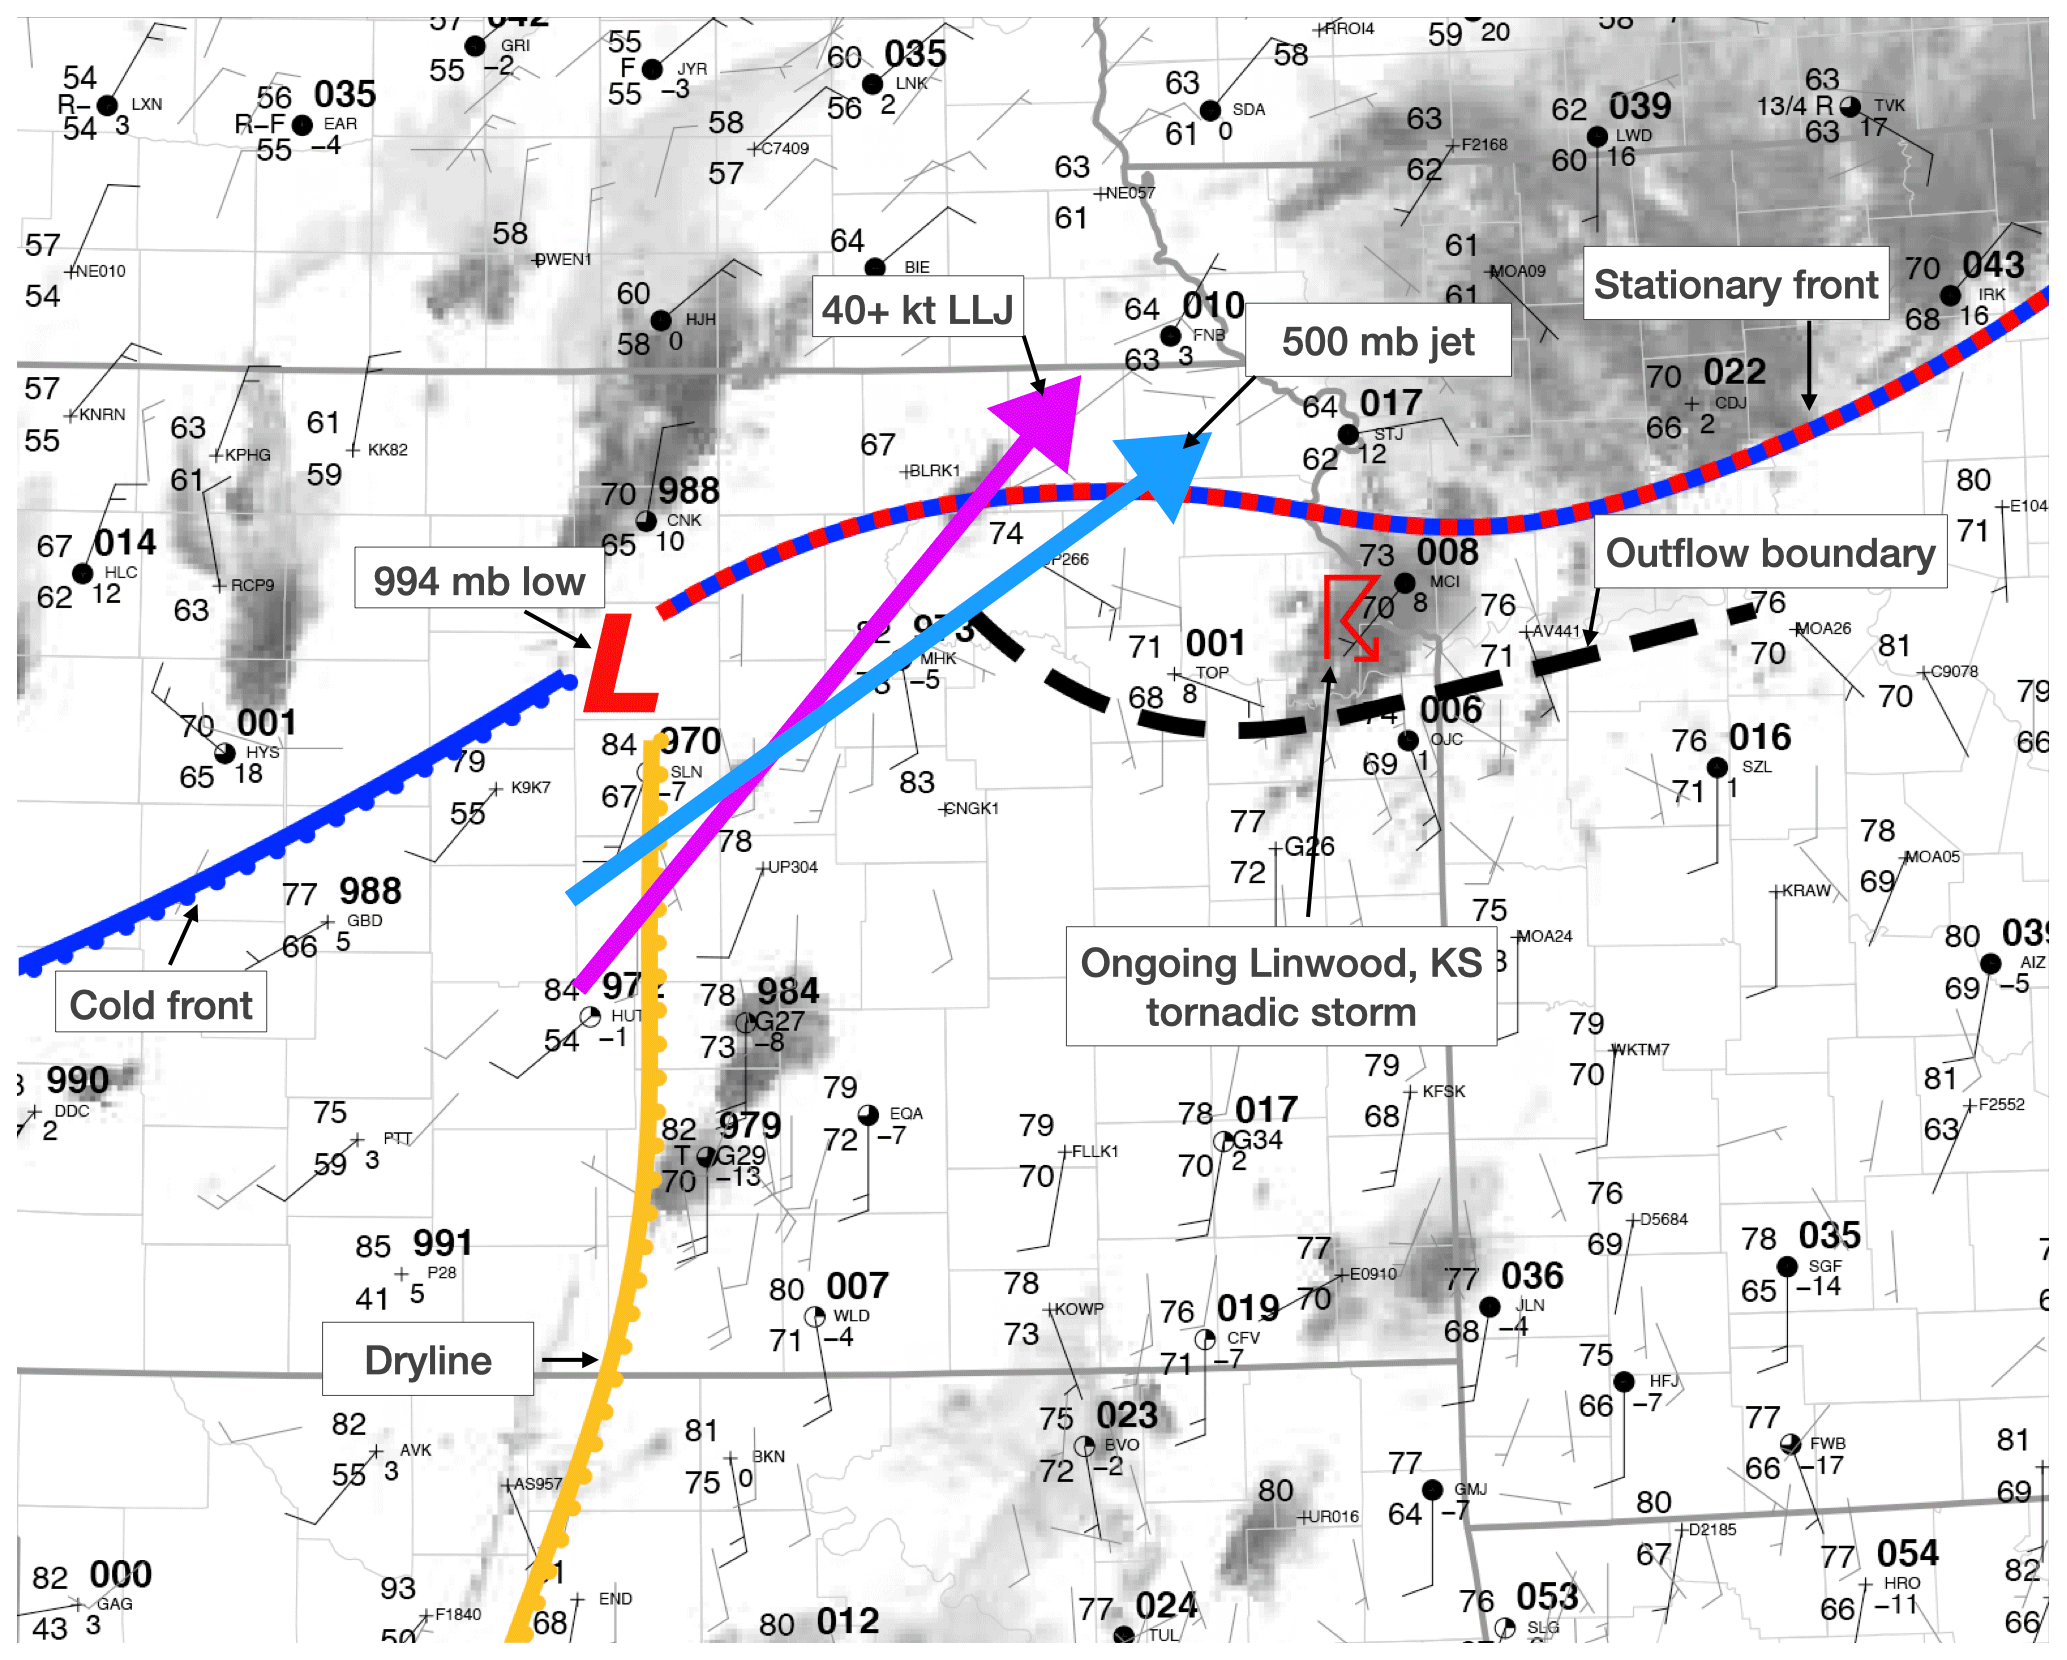
Figure 7Meteorological synopsis for the 28 May 2019 tornado event.
Throughout the day a dryline would advance east to central Kansas and Oklahoma as an additional focus for supercell development by late afternoon. Beneath the strengthening LLJ, the backed surface winds associated with the OFB in a narrow zone between Kansas City and Topeka would enhance 0–1 km storm-relative helicity to greater than 230 m2 s−2; this environment was conducive to violent tornadoes during late afternoon and evening (Fig. 7). NOAA's Storm Prediction Center upgraded portions of northeastern Kansas and northern Missouri to a moderate risk for convective storms in the 13:00 UTC day 1 convective outlook with the potential for strong to violent tornadoes (Storm Prediction Center, 2019). An enhanced risk area for convective storms was active to the west and southwest of the moderate risk area for a dryline supercell mode but with lower tornado probabilities given weaker low-level wind shear. A total of 25 tornadoes occurred in the United States on 28 May 2019, 10 of which were in Kansas.
3.2 Tornado event
The parent supercell of the Lawrence/Linwood tornado initiated in the open warm sector over the elevated terrain of the Flint Hills at around 20:00 UTC and organized on approach to the OFB located just southwest of Kansas City. The first mesocyclone occlusion yielded a brief EF2 tornado at 22:55 UTC, followed immediately by the rapid development of a more significant, stronger tornado that began in southwestern Douglas County at 23:05 UTC.
The tornado quickly grew to over 1 km wide, producing EF3 damage within 10 min of tornadogenesis along United States Highway 59 just south of Lawrence. The National Weather Service damage survey confirmed a 51.2 km long track through Douglas and Leavenworth Counties. Peak EF4 damage occurred in Linwood, with maximum winds estimated at 76 m s−1 (National Weather Service, 2019) and a damage path width of over 1.6 km (Fig. 8). The tornado dissipated near the town of Bonner Springs, just west of the Kansas City International Airport.
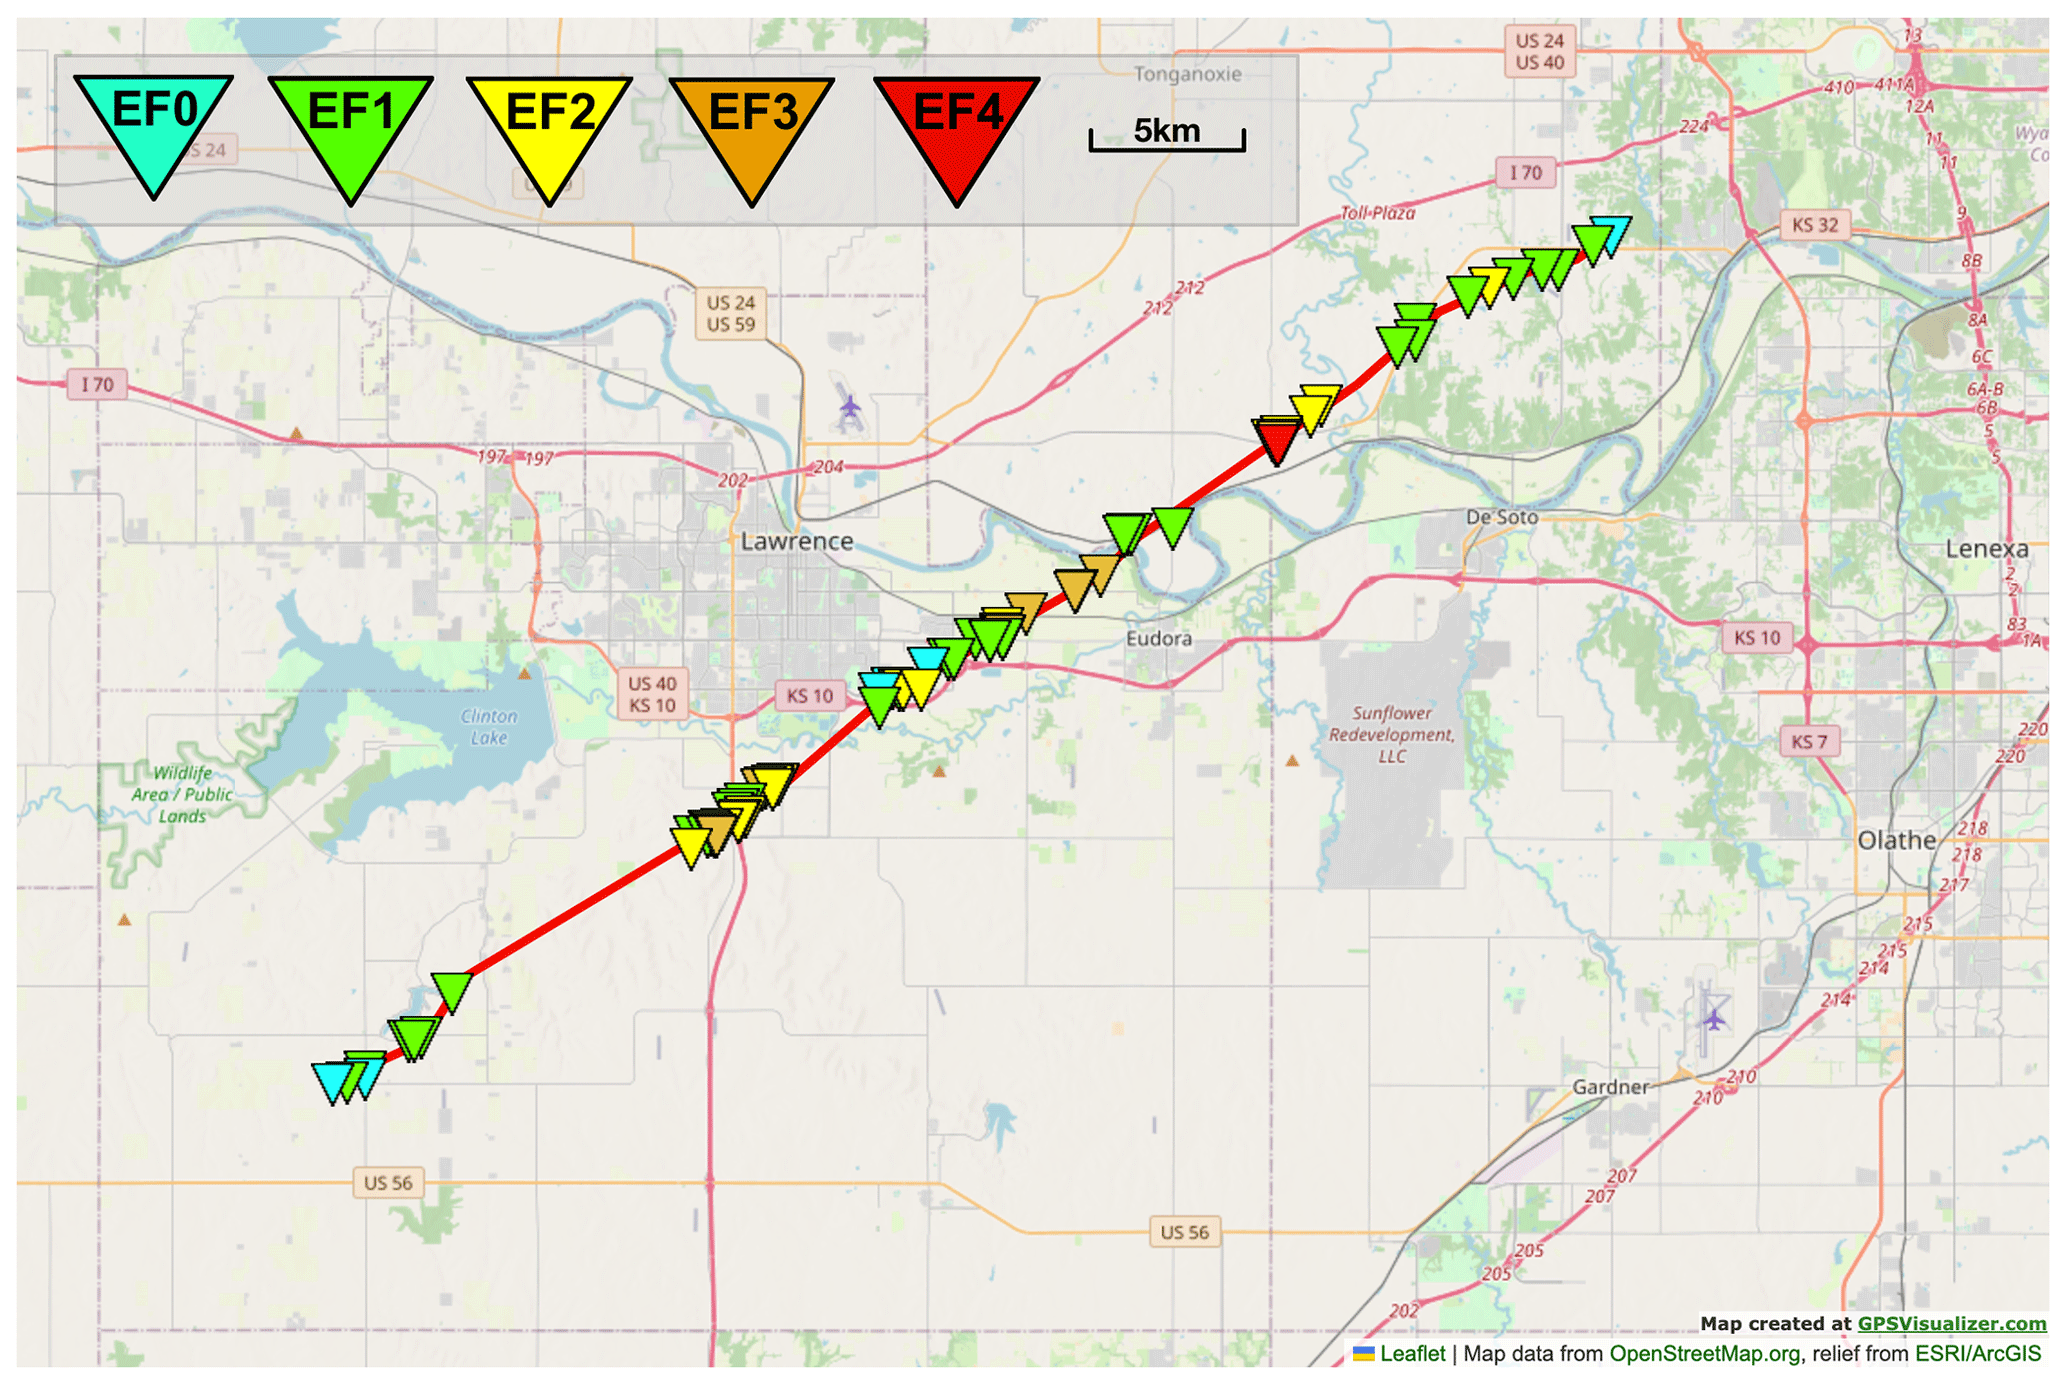
Figure 8Damage and intensity track of the Lawrence/Linwood tornado (credit: NWS).
The supercell was of the high-precipitation (HP) class. Previous experience has demonstrated that a narrow zone of inflow into the northeast quadrant of a tornado is often free of destructive hail which would damage the rocket (Fig. 9). The ideal launch location is also just ahead of the wind shift of the RFD gust front to ensure relatively calmer launch conditions (Lemon and Doswell, 1979; Beck and Weiss, 2013). The easterly and northeasterly inflow winds at this location were more likely to transport the pseudo-Lagrangian drifter into a tornado.
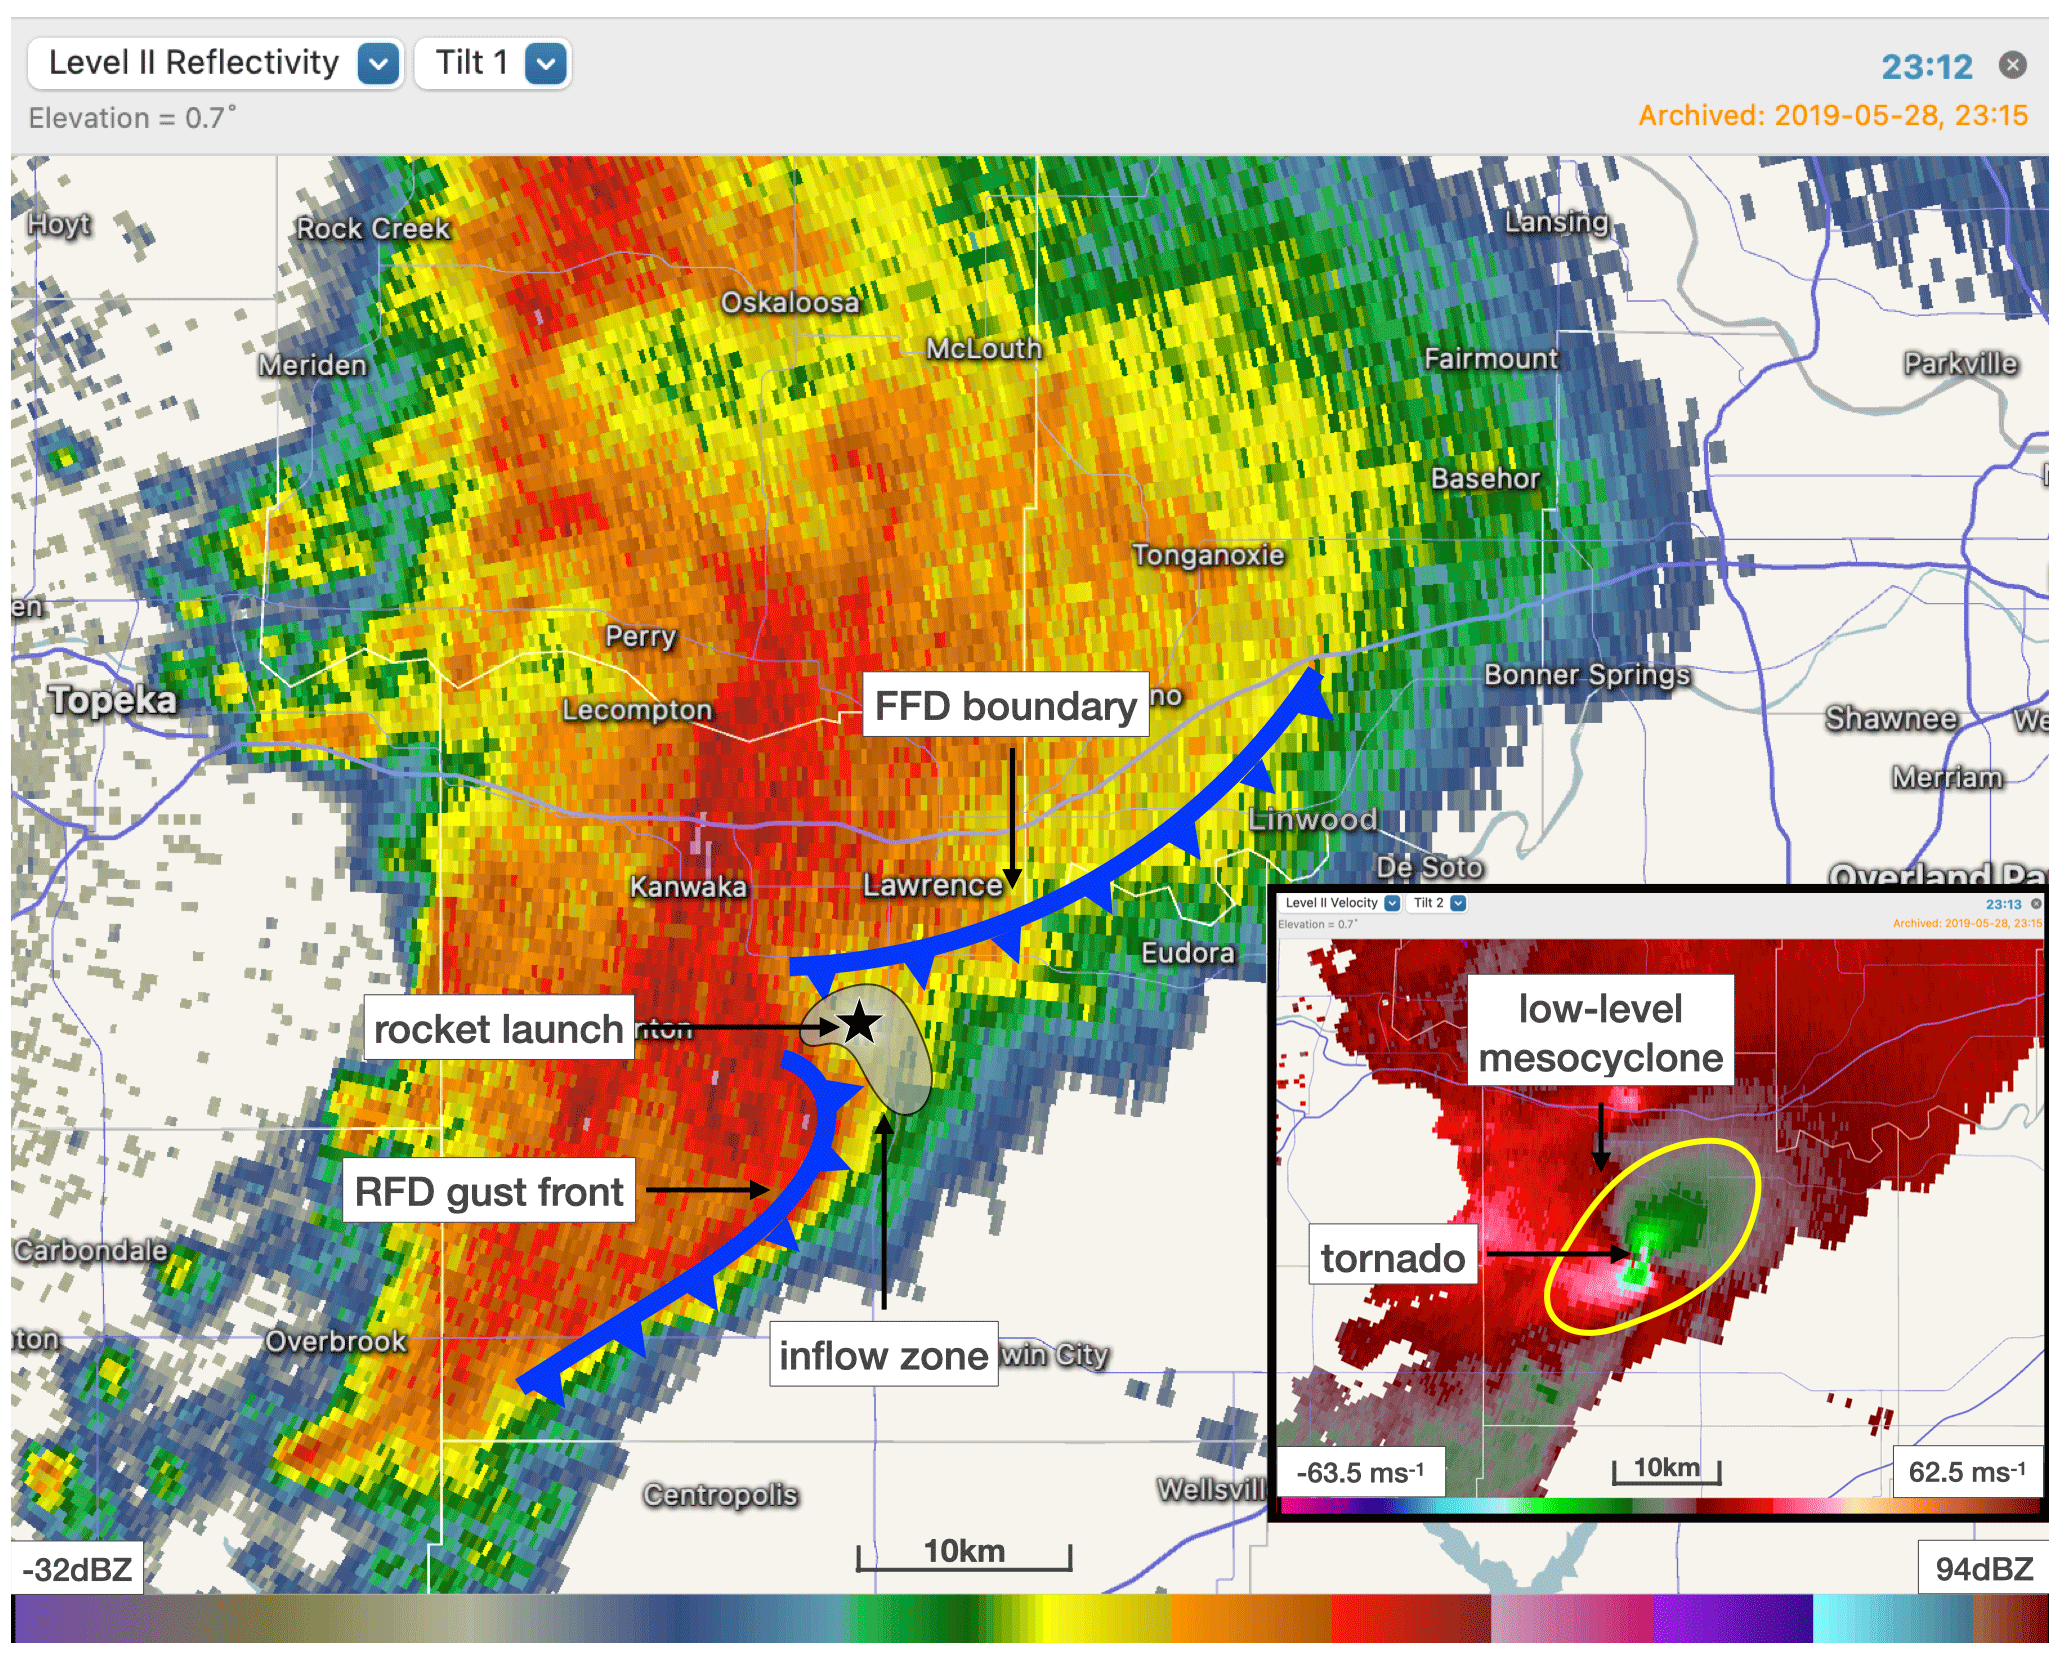
Figure 9NWS Topeka radar (KTWX) at 23:12 UTC; elevation 0.7∘; county and state boundaries, rivers, and major roads are depicted; reflectivity and velocity at the bottom right (Lemon and Doswell, 1979; Beck and Weiss, 2013) (credit: RadarScope/DTN).
Dominator 3 was positioned at the location of the marked star (38.898911∘ N, 95.260437∘ W, and 258 m a.s.l.) in Fig. 9, and the rocket launcher was aimed into the inflow region. At 23:17:33 UTC, the authors launched the rocket, and the payload was deployed. After launch, the tornado passed south of the launch location, with structural debris visible within the condensation funnel.
3.3 Rocket and probe flight
At 7.9 s after launch, 1 Hz real-time data revealed that the probe parachute deployed at 437 m a.g.l. and entered the northwest side of the tornado. The crew then continued north on Highway 59 in Dominator 3 to maintain communication with the probe as it ascended in the tornado and mesocyclone. At 23:25:09 UTC, communication was lost as the probe approached the tropopause (horizontal distance from the launch of 10.4 km and 10 680 m a.s.l.).
The probe continued the flight and was recovered the next day on the grounds of a church in Leavenworth, KS (39.19∘ N, 94.94∘ W), having traveled 51.5 km northeast of the launch location. Subsequently, the authors downloaded the 10 Hz data from the onboard EEPROM for the entire flight.
4.1 GPS and pressure
The probe recorded 5 Hz 3D GPS data for time, horizontal position, altitude, speed, and heading. The GPS velocity data recorded by the probe resolve the in situ wind speeds during the 30.2 min flight inside the tornado and parent mesocyclone with the assumption that the pseudo-Lagrangian drifter follows the flow with minimal probe-induced motion following the parachute deployment phase. The GPS trajectory of the probe's flight superimposed on the NWS damage track provides valuable data that could be used for insight into the 3D structure of the violent tornado and its parent mesocyclone (Fig. 10). It depicts the rotation of the probe inside the tornado and then entrainment into the tilted updraft of the mesocyclone. Ascent time was rapid with a duration of 10 min from launch to the apex of the flight.
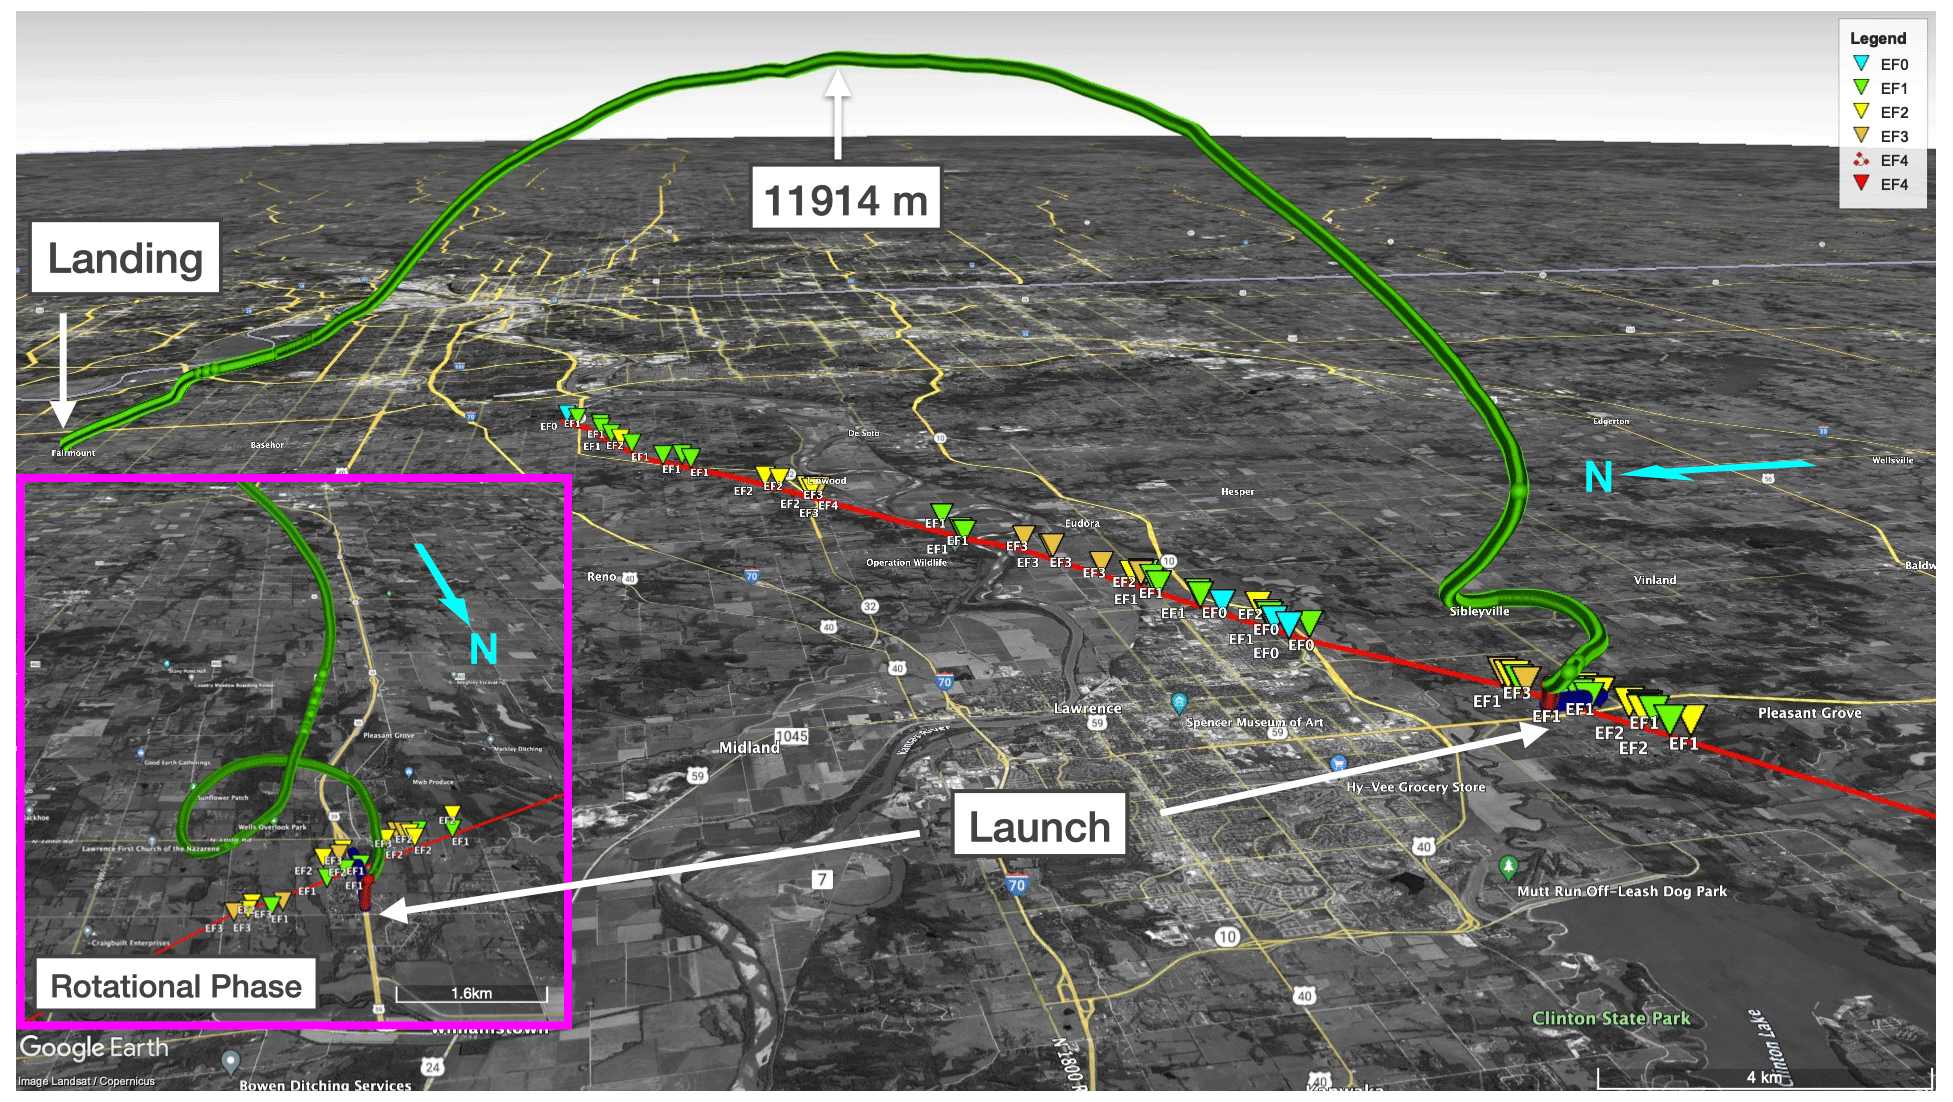
Figure 10The probe GPS trajectory retrieved from the 10 Hz data combined with the NWS damage track is superimposed on top of a Google Earth map. The section of flight within the tornado is displayed as a close-up (left panel) (Timmer et al., 2023) (© Google Earth).
Owing to the availability of altitude data from the GPS and pressure data from the onboard sensor, it was possible to derive a launch-referenced and altitude-corrected pressure perturbation metric to measure the pressure deficit between the ambient pressure and pressures inside the tornado vortex and mesocyclone (Fig. 11e). The GPS data recorded maxima for the 3D speed of 85.1 m s−1 (Fig. 11b) and vertical velocity (w) of 65.0 m s−1 (Fig. 11c) at 858 and 2172 m a.s.l., respectively. Additionally, the maximum horizontal speed component of 83.9 m s−1 at 856 m a.s.l. (Fig. 11c) was consistent with the 3D speed maxima, indicating that it consisted of mainly a horizontal component. A maximum of 11 914 m a.s.l. was also recorded (Fig. 11a). The GPS heading showed rotation within the tornado (Fig. 11d).
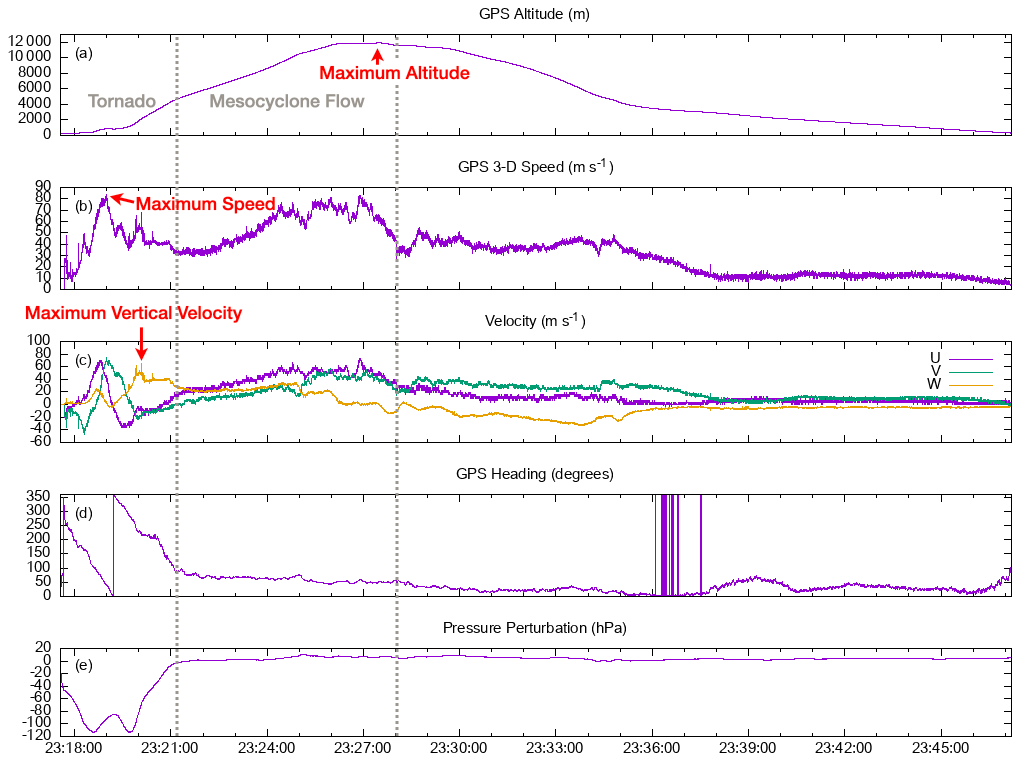
Figure 11GPS data and pressure perturbation sensor. The dotted lines separate tornado and mesocyclone flow from the remainder of the flight.
A storm motion of 21 m s−1 from 220∘ was derived from radar and subtracted from the GPS position referenced to the launch location to produce an position relative to the storm. This was then used to plot storm relative GPS 3D velocity and pressure perturbation (Fig. 12). The probe completed 1.5 revolutions around the tornado in nearly circular movement with a diameter of 1.6 km (Fig. 12a), which is in agreement with the estimated maximum damage width of 1.6 km (National Weather Service, 2019). The 85.1 m s−1 wind speed measured by the probe is in accordance with the 76 m s−1 wind speed estimated by the damage survey (National Weather Service, 2019), and the pressure perturbation (Fig. 12b) indicates a deficit in the range of 80 to 113.5 hPa, which concurs with surface pressure deficits measured in other tornadoes (Samaras and Lee, 2004; Karstens et al., 2010; Blair et al., 2008). Additionally, the wind speed is greater in the southeast portion of the tornado and lower in the northwest, which is attributed to the northeasterly storm motion (Fig. 12a).
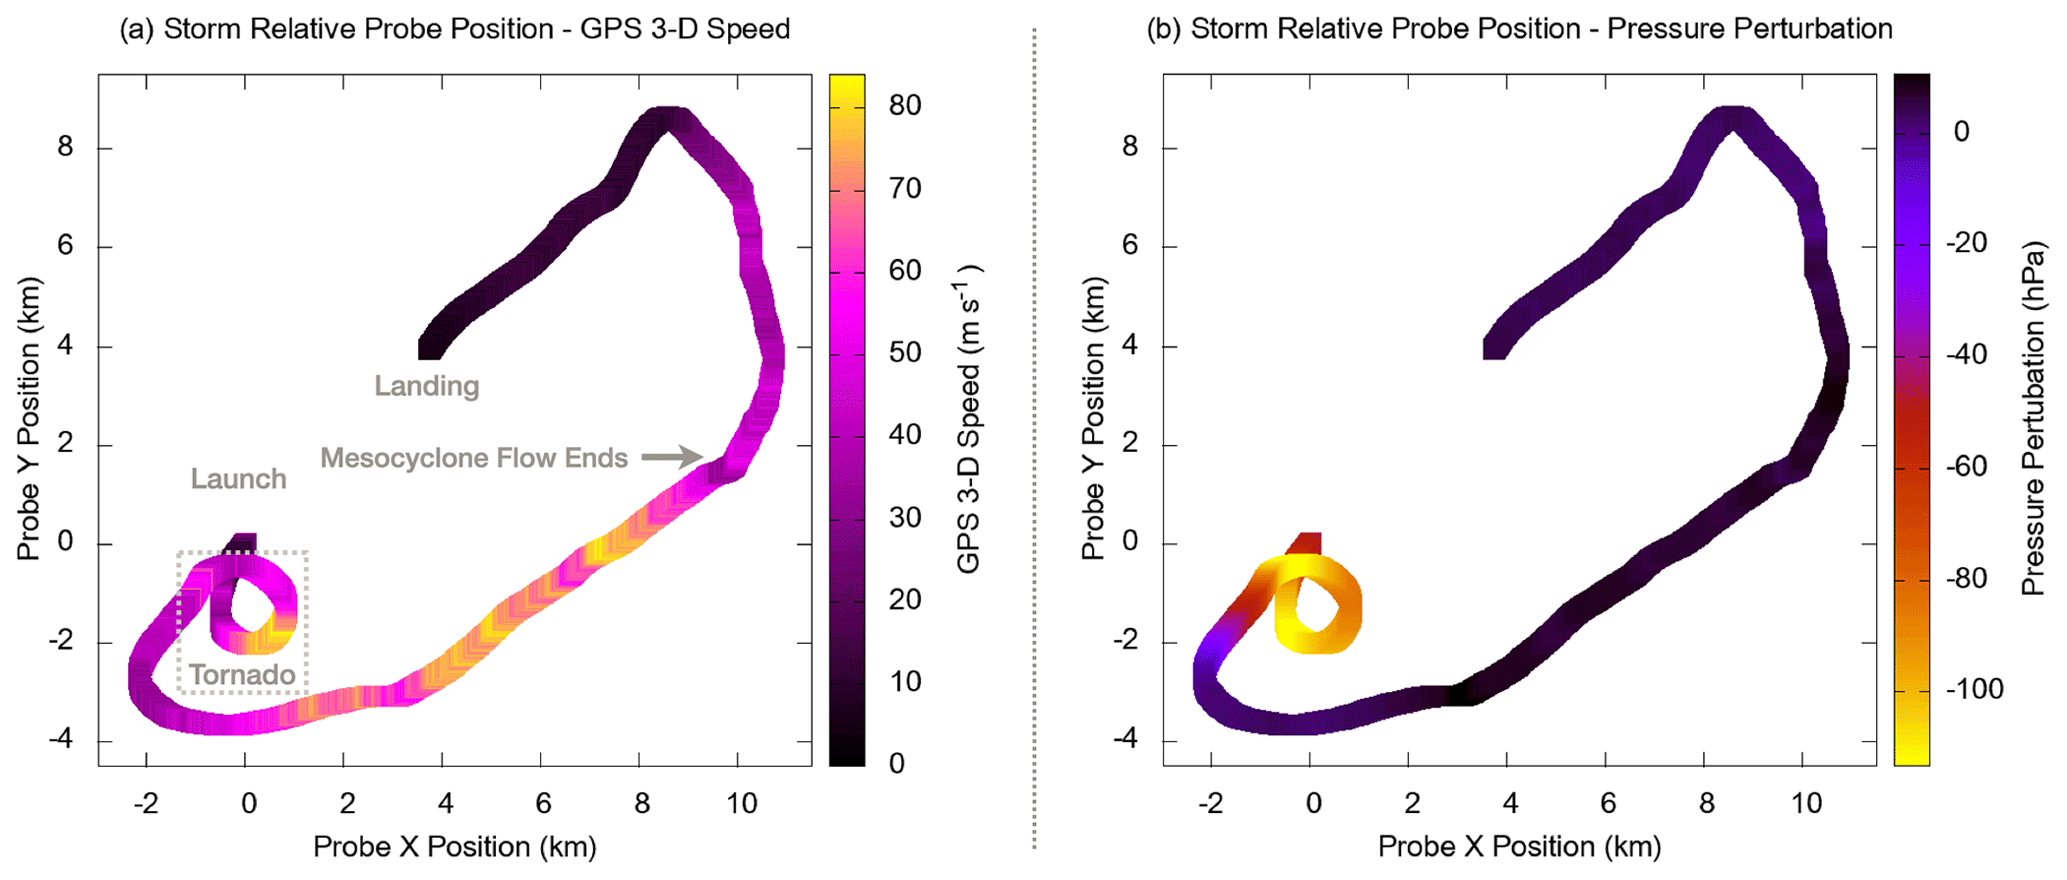
Figure 12Storm relative probe position for the flight with GPS 3D speed (a) and pressure perturbation (b).
The 39.2 m s−2 acceleration limit of the ORG1411 was surpassed for a short period during the powered rocket flight phase, which led to a loss of fix in two-dimensional position for 5 s and accuracy in altitude for 60 s. However, this still allowed valuable data to be recorded in the near-ground layer of the tornado, and the data and figures include this phase of the flight.
The operating range of the BME280 for barometric pressure extends down to 300 hPa per the Bosch datasheet; however, this flight reached a pressure altitude of 208 hPa. Subsequent cross-analysis between the GPS data and the Topeka 00Z meteorological balloon sounding confirmed the validity of barometric pressure readings below 300 hPa – due to the closeness of the Topeka sounding combined with minimal and consistent pressure perturbation at the top of the storm and for the descent. It should be noted that during the launch of the rocket prior to pseudo-Lagrangian flight the pressure was impacted by Bernoulli's principle due to the high velocity of the rocket flight.
4.2 LoRa
During the probe flight, the ground station was handheld external to the side window of Dominator 3, and the vehicle resumed highway speeds. Due to debris falling outside the tornado circulation, safety concerns necessitated bringing the ground station back inside the vehicle for periods.
The ground station lost communication with the probe at a range of 14.5 km; however, later recovery of the probe and stored data demonstrated that the probe was still transmitting throughout the entire flight. The authors determined that the shorter-than-expected radio frequency range was due to the proximity of the 16-gauge ballistic steel shell of Dominator 3 and was caused by obstruction of the signal and the Faraday cage behavior.
4.3 Temperature and relative humidity
Holes were punched into the nose cone compartment of the rocket to promote airflow across the temperature and relative humidity sensors during flight, as pseudo-Lagrangian drifting within the tornado limits the airflow relative to the probe. Additionally, with minimal probe-relative airflow, the effect of the electrical self-heating from the radio transceiver needed to be modeled. Other considerations were that the temperature within Dominator 3 before launch was higher than the external temperature and the probe's thermal mass was moved from inside the vehicle to outside for launch.
Due to operational and time constraints prior to launch, a thermal analysis of the enclosure was completed after recovery. Treatments for thermal response exist for radiosondes that exhibit similar concerns where slower ascent rates result in a lack of airflow past the sensors contained within (Mahesh et al., 1997; Miloshevich et al., 2004).
Controlled experiments (Fig. 13) were conducted to compute the thermal time constant (τ) of the probe within the enclosure, the probe outside the enclosure, and the self-heating effect. A fan, handheld anemometer, deep freezer, and ice-bath calibrated thermocouple were used for this purpose. Data from these controlled experiments, including additional documentation as to the processes used in testing, can be found in Simpson and Timmer (2019).
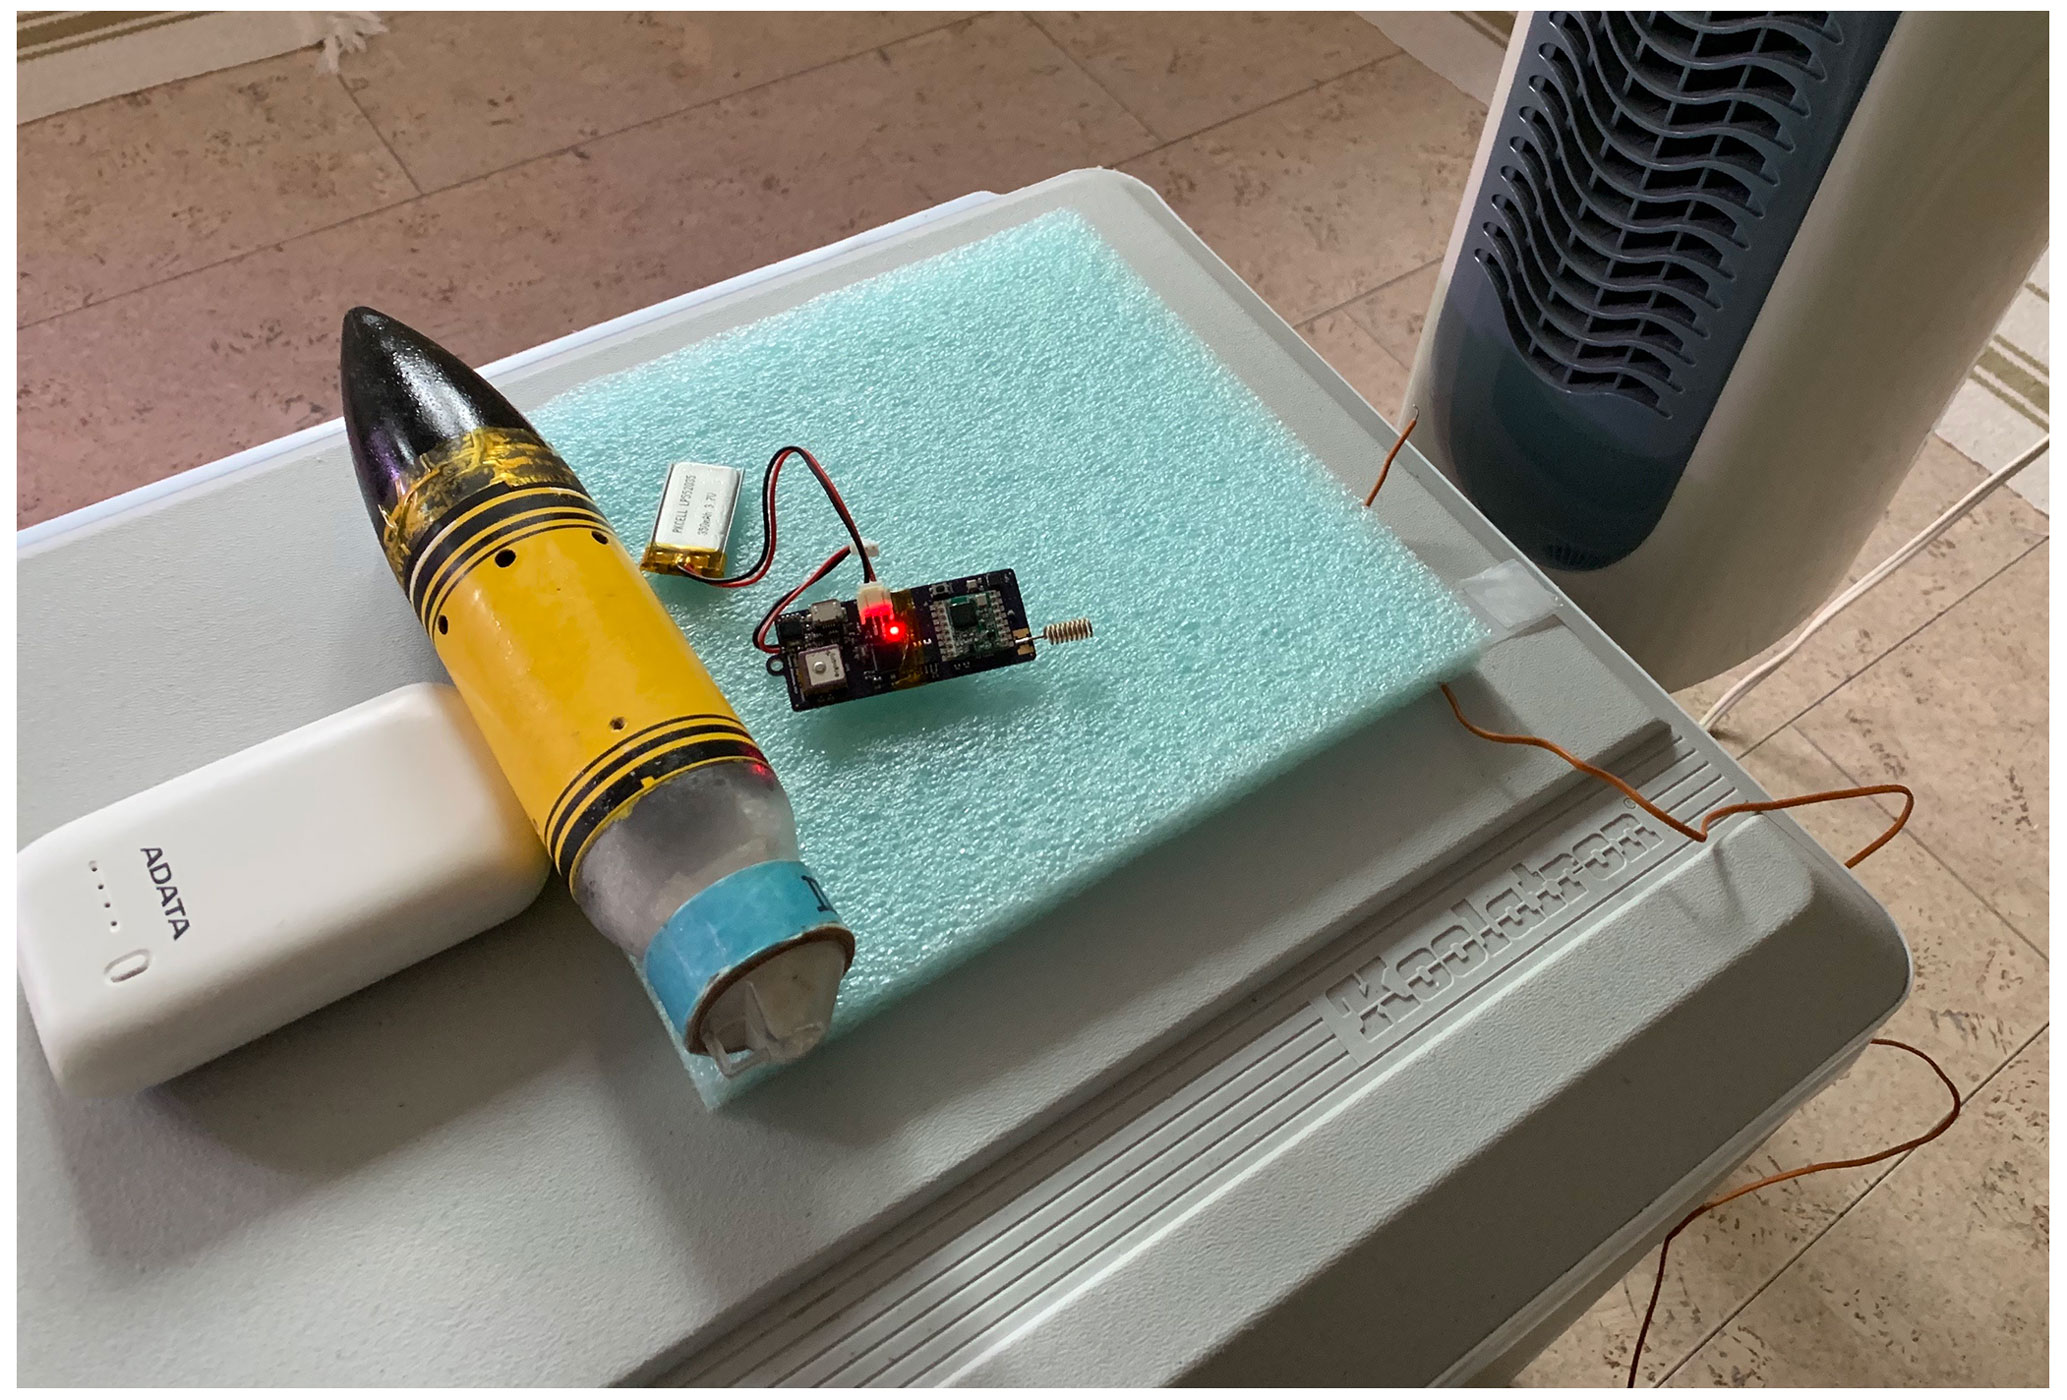
Figure 13Measuring the thermal time constant after removal from a deep freezer with a linear fan.
These experiments identified constants for thermal response (τ) and self-heating (S) to correct the temperature profile as measured by the probe. Additionally, the exact temperature was known at two points in time: at launch (due to the calibrated weather station on the roof of Dominator 3) and at a point in the descent where the air temperature external to the enclosure of the probe was equal to the measured temperature within the enclosure of the probe, and therefore no heat transfer was occurring to or from the sensor internal to the probe (Fig. 14).
Equation (1) was derived to correct the thermal data based on Newton's law of cooling (Miloshevich et al., 2004; Mahesh et al., 1997; Nash, 2015; World Meteorological Organization, 2017). Although the descent rate of the payload was known when moving as a pseudo-Lagrangian drifter, the unknown airflow around the sensor (v) could be determined to lie within a range of possible values. The sensor airflow (v) must be less than the descent rate due to the enclosure having venting but not being completely open to the environment. A meteorological balloon sounding (Topeka 00Z) was used as a reference for the environmental temperature profile by mapping the interpolated altitude in the sounding to the GPS altitude recorded by the sensor. It was found that there was a minimal range of plausible values for (v) that did not cause the corrected temperature to overshoot (v=0.07 m s−1) the Topeka profile or undershoot (v=0.27 m s−1). A midpoint value for (v) was chosen of 0.17 m s−1 (Fig. 14), which provided the best curve fit between the corrected temperature and Topeka profiles.
where τ is the time constant (Eq. 2), Tt is the sensor temperature at time t (∘C), Tenv is the temperature of the environment (∘C), T0 is the sensor temperature at time 0 (∘C), Δt is the delta time tt−t0 (seconds), and S is the self-heating constant (4.18 ∘C).
where τ0 is the time constant at zero air velocity (seconds), ρ is the air density (Eq. 3), v is the air velocity in relation to the sensor (m s−1), and n is the constant ranging from 0.4 (laminar air) to 0.8 (turbulent air); 0.8 is used.
where p is the sensor pressure (pascals), R is the 287.058 (gas constant for dry air), and T is the 00Z Topeka sounding temperature (K).
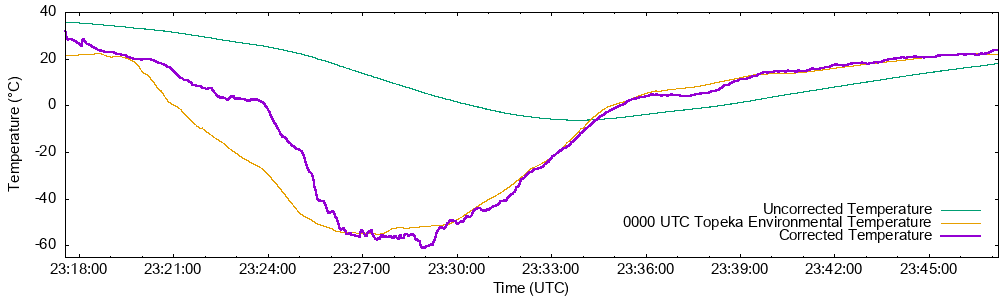
Figure 14Thermal correction comparison from launch showing uncorrected temperature (∘C), corrected temperature (∘C), and the 00Z Topeka sounding environmental temperature profile (∘C).
Due to the complexities and cost (> USD 15 000) of the experimental setup to categorize the response for relative humidity in the enclosure, the authors decided to forego response time correction for these data; consequently, this necessitated using temperature instead of virtual temperature for the ideal gas equation (Eq. 3). This impact was deemed negligible for this study as condensing moisture was not encountered by the sensor. Additionally, this data component could be categorized later if required and budget permitted. The effect of direct solar radiation (Wang et al., 2013) on the thermal correction was considered; however, as most of the flight was within cloud and the sensor was shielded from direct solar radiation by the enclosure, it was concluded that any impacts from this would be negligible.
The authors have since switched to a GPS receiver with a high-dynamics mode for future deployments to reduce the reacquisition time for the GPS position immediately after the rocket launch. This improvement enables the acquisition of a 3D fix within 2 s following the rocket launch.
The design has since been improved to eliminate the requirement for the thermal response data treatment by mounting the temperature and relative humidity sensors on a small thermally isolated daughterboard on the exterior of the rocket nose cone. This approach provides similar thermal response times to the specifications for these sensors. Additionally, the design has been modified to include an additional onboard pressure sensor with an operating range extending down to 100 hPa to serve as a second source of pressure data that is specified into the stratosphere.
Although direct solar radiation did not impact the present study, two identical external temperature sensors, one black and one gold, have been added so that the probe can also be used for balloon deployments. An omnidirectional rooftop antenna is now used on the chase vehicle to improve radio reception distance, with the metal roof of the vehicle serving as a ground plane. This configuration has demonstrated a line-of-sight range of 26 km horizontally and an airborne range of over 100 km.
While thermodynamic gradients are difficult to diagnose from the data of a single pseudo-Lagrangian trajectory, the success of the present study in capturing direct measurements of wind, pressure, and temperature inside a tornado will set the stage for future deployments of multiple simultaneous probes and chase vehicles. The authors believe this will provide more insight into the 3D structure and processes within tornadoes.
Multiple pseudo-Lagrangian probes collecting high-resolution meteorological data inside a tornado would allow a better understanding of pressure gradient and buoyancy forces. These forces drive the winds and behavior of tornadoes and supercells (Markowski et al., 2018; Bartos et al., 2022).
The authors launched a lightweight real-time trackable meteorological probe by model rocket into an EF4 tornado. Kinematic and thermodynamic data were obtained from inside a tornado and associated mesocyclone. The high velocity of the model rocket successfully passed through any sinking air between the launch position and the tornado, and the probe was deployed by the parachute and pulled inside the tornado. Three-dimensional direct measurements of wind, pressure, and temperature within a tornado, including updraft, had yet to be accomplished until the present study.
The ground-based launch of a rocket into the inflow region of a supercell proved effective in deploying a parachuted probe into the tornado while avoiding the largest hydrometeors. The pseudo-Lagrangian trajectory of the probe allowed for the recording of 3D wind speed through high-resolution 5 Hz GPS data.
The probe transmitted high-resolution 1 Hz data in real time from inside the tornado and provided 10 Hz (5 Hz GPS) data upon recovery. A flight time of 30 min sampled high 3D wind speeds of up to 85.1 m s−1 as well as an updraft velocity of 65.0 m s−1 and reached the upper troposphere at 11 914 m a.s.l. before descending. The probe completed 1.5 revolutions around the tornado in nearly axisymmetric flow during the 3 min within the tornado with a maximum updraft velocity of 65.0 m s−1. The substantial pressure deficit during the tornado phase of the probe trajectory and the lack thereof during the mesocyclone are expected due to tornadic winds being driven by tornado-scale gradients in pressure.
The 65.0 m s−1 updraft velocity is the first direct measurement of vertical wind from inside a tornado. A maximum pressure deficit of −113.5 hPa was recorded at an altitude of 475 m a.s.l. within the tornado and dropped to less than −20 hPa by an altitude of 3760 m a.s.l. in the mesocyclone. The most significant pressure deficit being located just above the ground in this tornado would excite strong vertical velocities like those measured (65.0 m s−1). Additionally, the maximum GPS 3D speed of 85.1 m s−1 at an altitude of 858 m a.s.l. concurs with the surface wind of 76 m s−1 estimated by the NWS damage survey; the trajectory within the tornado was nearly circular, and the diameter of the probe's flight was in agreement with the damage survey of 1.6 km.
The sharp transition of the probe trajectory over 10 s from a closed rotational path to pure updraft with negligible curvature starting at 23:19:40 UTC and an altitude of 1128.7 m a.s.l. (Fig. 15f), along with a significant pressure deficit of −113.3 hPa (Fig. 15g), is supportive of the probe sampling the RMW and the core of the tornado. The cessation of the rotational path of the probe is determined by the termination of the 90∘ phase difference between the u and v GPS sinusoidal velocity components that indicate circular rotation together with a sudden increase in the updraft speed. The pressure deficit was still significant (−66.7 hPa) when the maximum updraft of 65.0 m s−1 was recorded at an altitude of 2171.3 m a.s.l., with near-zero curvature evident in the probe trajectory.
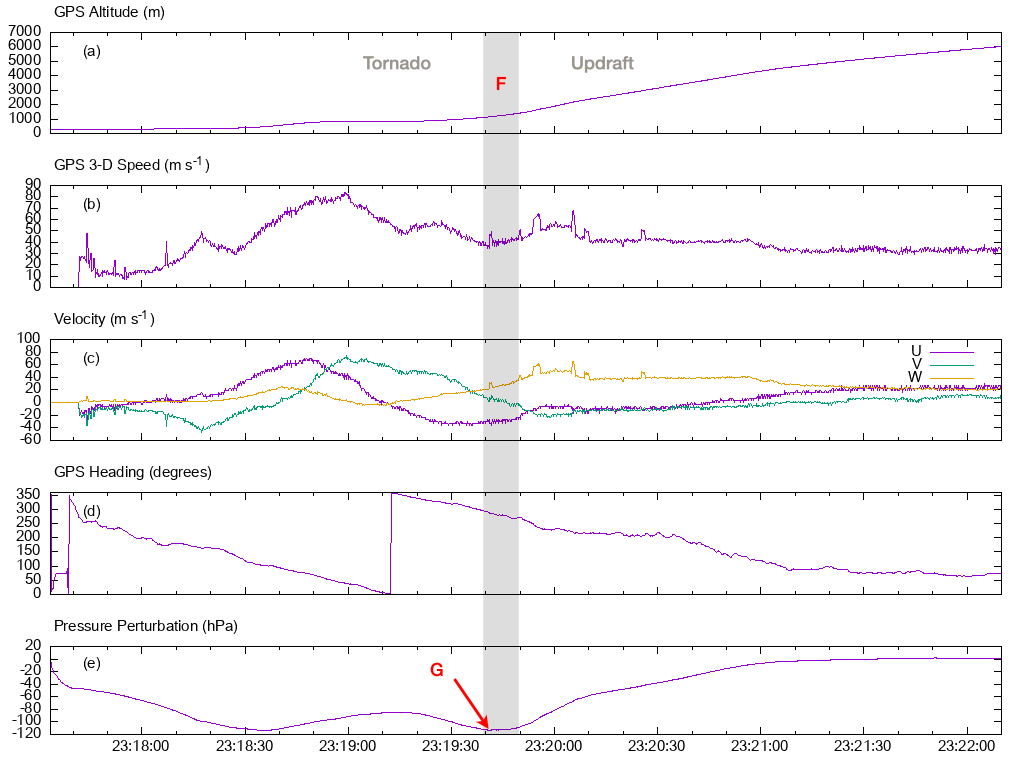
Figure 15GPS data and pressure perturbation sensor data for the tornado and updraft portion of the probe flight.
Previous studies involving radar observations, real ground measurements of wind and pressure, laboratory experiments, and computer simulations have shown that the inner core of a tornado inside the core flow and RMW is comprised of a consistently large pressure deficit with relatively minimal pressure variation within the core (Snow et al., 1980; Lewellen et al., 1997, 2000; Karstens et al., 2010; Wurman et al., 2013). The high-resolution modeling of tornadoes (Lewellen et al., 1997, 2000) shows a relatively consistent pressure deficit within the tornado core for both one- and two-celled vortices. A secondary maximum in pressure deficit as the rotational path of the probe abruptly ended is supportive of the transition of the probe from the RMW to the tornado's inner core. Therefore, the miniaturized pseudo-Lagrangian drifter effectively sampled meteorological data within the core flow and into the low-pressure core of a strong tornado, despite the extreme conditions and flying debris that typify core flow.
After 1.5 revolutions around the tornado, the probe underwent a consistently tilted, ascending path from an altitude of 4300 m a.s.l. up to the apex of 11 914 m a.s.l. with a maximum GPS velocity of 83 m s−1. The high ascent velocity, combined with the trajectory's lack of rotation and relative linearity, indicates that the probe was entrained very close to the center of the mesocyclonic updraft. The authors reached this conclusion as a rotating mesocyclone flow was not indicated in the data as evidenced by the GPS heading and, therefore, lack of probe rotation around a center.
While the thermodynamic data presented here are interesting and unique, it is important to note that significant corrections were required to align the temperature data to reasonably expected values, which was due to the lack of airflow past the sensor in pseudo-Lagrangian flight. In this correction, several assumptions were made that may not be valid in these conditions. Furthermore, the correction applied to the data is considerable and is largely beyond the level to which corrections are generally applied. Careful consideration of the temperature data is warranted and the data presented here are largely for illustrative purposes to showcase the potential of the probe. A future design of the probe minimizes this potential error source without the need for this level of data treatment.
The data received from the probe have been made available under a Creative Commons CC-By Attribution 4.0 International license: https://doi.org/10.17605/OSF.IO/Z64FD (Timmer et al., 2022).
A video animation of the probe trajectory (Supplemental1.mov) and a video recording of the rocket launch (Supplemental2.mov) have been made available under a Creative Commons CC-By Attribution 4.0 International license: https://osf.io/ubtn5/ (Timmer et al., 2023).
RT conceptualized the project, managed the fieldwork, and produced the rough draft of the paper; MS designed and built the probes, wrote the firmware, wrote the software, and tested, curated, and analyzed the data; MS prepared the paper in conjunction with RT and contributions from CB; CB designed and constructed the rockets and launch system and maintained Dominator 3; SS drove Dominator 3 and provided safety monitoring.
The contact author has declared that none of the authors has any competing interests.
Publisher's note: Copernicus Publications remains neutral with regard to jurisdictional claims made in the text, published maps, institutional affiliations, or any other geographical representation in this paper. While Copernicus Publications makes every effort to include appropriate place names, the final responsibility lies with the authors.
This work was partly supported by individual Facebook subscribers, for which we are grateful. We are indebted to David Horsley for his review, suggestions, and helpful comments. Additionally, the authors are grateful to Aaron Jayjack for weather spotting and safety monitoring during the deployment and to Matthew DuBois and Jeremy Belk from Leavenworth, KS, who assisted in locating and recovering the probe.
The authors appreciate the time, effort, and feedback provided by the peer reviewers of this paper.
This paper was edited by Wiebke Frey and reviewed by three anonymous referees.
Augustin, A., Yi, J., Clausen, T., and Townsley, W.: A Study of LoRa: Long Range & Low Power Networks for the Internet of Things, Sensors, 16, 1466, https://doi.org/10.3390/s16091466, 2016. a
Bartos, E. A., Markowski, P. M., and Richardson, Y. P.: Three-Dimensional Thermodynamic Observations in Supercell Thunderstorms from Swarms of Balloon-Borne Sondes, Mon. Weather Rev., 150, 1689–1723, https://doi.org/10.1175/MWR-D-21-0122.1, 2022. a, b, c
Beck, J. and Weiss, C.: An assessment of low-level baroclinity and vorticity within a simulated supercell, Mon. Weather Rev., 141, 649–669, 2013. a, b
Bedard Jr., A. and Ramzy, C.: Surface meteorological observations in severe thunderstorms. Part I: Design details of TOTO, J. Appl. Meteorol. Clim., 22, 911–918, https://doi.org/10.1175/1520-0450(1983)022<0911:SMOIST>2.0.CO;2, 1983. a
Blair, S. F., Deroche, D. R., and Pietrycha, A. E.: In situ observations of the 21 April 2007 Tulia, Texas tornado, E-Journal of Severe Storms Meteorology, 3, 1–27, https://doi.org/10.55599/ejssm.v3i3.16, 2008. a, b, c, d, e
Bluestein, H. B.: Surface meteorological observations in severe thunderstorms. Part II: Field experiments with TOTO, J. Appl. Meteorol. Clim., 22, 919–930, https://doi.org/10.1175/1520-0450(1983)022<0919:SMOIST>2.0.CO;2, 1983. a
Bluestein, H. B.: A history of severe-storm-intercept field programs, Weather Forecast., 14, 558–577, https://doi.org/10.1175/1520-0434(1999)014<0558:AHOSSI>2.0.CO;2, 1999. a, b
Bluestein, H. B., Lee, W.-C., Bell, M., Weiss, C. C., and Pazmany, A. L.: Mobile Doppler radar observations of a tornado in a supercell near Bassett, Nebraska, on 5 June 1999. Part II: Tornado-vortex structure, Mon. Weather Rev., 131, 2968–2984, https://doi.org/10.1175/1520-0493(2003)131<2968:MDROOA>2.0.CO;2, 2003. a
Bluestein, H. B., Weiss, C. C., and Pazmany, A. L.: The Vertical Structure of a Tornado near Happy, Texas, on 5 May 2002: High-Resolution, Mobile, W-band, Doppler Radar Observations, Mon. Weather Rev., 132, 2325–2337, https://doi.org/10.1175/1520-0493(2004)132<2325:tvsoat>2.0.co;2, 2004. a
Colgate, S. A.: Small rocket tornado probe, in: 12th Conf. on Severe Local Storms, San Antonio, Texas, 11–15 January 1982, American Meteorological Society, 396–400, https://digital.library.unt.edu/ark:/67531/metadc1092589/ (last access: 27 January 2024), 1982. a
Federal Aviation Administration: JO 7400.2N - Procedures for Handling Airspace Matters: Chapter 31, Amateur Rocket and Commercial Space Operations, https://www.faa.gov/air_traffic/publications/atpubs/pham_html/chapter_31.html (last access: 9 October 2022), 2022. a, b
Fiedler, B.: Suction vortices and spiral breakdown in numerical simulations of tornado-like vortices, Atmos. Sci. Lett., 10, 109–114, 2009. a, b
Frew, E. W., Argrow, B., Borenstein, S., Swenson, S., Hirst, C. A., Havenga, H., and Houston, A.: Field observation of tornadic supercells by multiple autonomous fixed-wing unmanned aircraft, J. Field Robot., 37, 1077–1093, https://doi.org/10.1002/rob.21947, 2020. a, b
Groenemeijer, P.: Great footage. I tracked an object that seemed to be lifted particularly fast early in the video. I calculated speeds partly over 100 m/s (360 km/h or 225 mph). Later, debris can be seen to move horizontally at similar speeds just 20ish meters above the ground, European Severe Storms Laboratory (ESSL), https://x.com/pgroenemeijer/status/1521027958827274240?s=20 (last access: 27 January 2024), 2022. a
Houston, A. L., Argrow, B., Coniglio, M. C., Frew, E. W., Rasmussen, E. N., Weiss, C. C., and Ziegler, C. L.: Targeted observation by radars and UAS of supercells (TORUS): Summary of the 2019 field campaign, in: 100th AMS Annual Meeting, American Meteorological Society, Boston Convention and Exhibition Center, MA, USA, 14 January 2020, Boston Convention and Exhibition Center, MA, USA https://ams.confex.com/ams/2020Annual/webprogram/Paper369999.html (last access: 27 January 2024), 2020. a, b
Karstens, C. D., Samaras, T. M., Lee, B. D., Gallus, W. A., and Finley, C. A.: Near-Ground Pressure and Wind Measurements in Tornadoes, Mon. Weather Rev., 138, 2570–2588, https://doi.org/10.1175/2010mwr3201.1, 2010. a, b, c, d, e, f, g, h
Kosiba, K. and Wurman, J.: The three-dimensional axisymmetric wind field structure of the Spencer, South Dakota, 1998 tornado, J. Atmos. Sci., 67, 3074–3083, https://doi.org/10.1175/2010JAS3416.1, 2010. a, b
Kosiba, K. A. and Wurman, J.: The three-dimensional structure and evolution of a tornado boundary layer, Weather Forecast., 28, 1552–1561, https://doi.org/10.1175/WAF-D-13-00070.1, 2013. a, b, c
Lemon, L. R. and Doswell III, C. A.: Severe thunderstorm evolution and mesocyclone structure as related to tornadogenesis, Mon. Weather Rev., 107, 1184–1197, 1979. a, b, c, d, e
Lewellen, D., Lewellen, W., and Xia, J.: The influence of a local swirl ratio on tornado intensification near the surface, J. Atmos. Sci., 57, 527–544, 2000. a, b, c, d
Lewellen, W., Lewellen, D., and Sykes, R.: Large-eddy simulation of a tornado’s interaction with the surface, J. Atmos. Sci., 54, 581–605, 1997. a, b, c
Mahesh, A., Walden, V. P., and Warren, S. G.: Radiosonde Temperature Measurements in Strong Inversions: Correction for Thermal Lag Based on an Experiment at the South Pole, J. Atmos. Ocean. Tech., 14, 45–53, https://doi.org/10.1175/1520-0426(1997)014<0045:rtmisi>2.0.co;2, 1997. a, b
Markowski, P. M., Richardson, Y. P., Richardson, S. J., and Petersson, A.: Aboveground thermodynamic observations in convective storms from balloonborne probes acting as pseudo-Lagrangian drifters, B. Am. Meteorol. Soc., 99, 711–724, https://doi.org/10.1175/BAMS-D-17-0204.1, 2018. a, b, c, d, e, f
Miloshevich, L. M., Paukkunen, A., Vömel, H., and Oltmans, S. J.: Development and Validation of a Time-Lag Correction for Vaisala Radiosonde Humidity Measurements, J. Atmos. Ocean. Tech., 21, 1305–1327, https://doi.org/10.1175/1520-0426(2004)021<1305:davoat>2.0.co;2, 2004. a, b
Nash, J.: Measurement of upper-air pressure, temperature and humidity; Instruments and Observing Methods Report No. 121, World Meteorological Organization, https://library.wmo.int/viewer/37291?medianame=iom_121_en_#page=1&viewer=picture&o=bookmarks&n=0&q= (last access: 27 January 2024), 2015. a
National Association of Rocketry: Model Rocket Safety Code, https://www.nar.org/safety-information/model-rocket-safety-code/ (last access: 9 October 2022), 2022a. a
National Association of Rocketry: Laws and Regulations, https://www.nar.org/find-a-local-club/section-guidebook/laws-regulations/ (last access: 9 October 2022), 2022b. a
National Fire Protection Association: Code for Model Rocketry, https://www.nfpa.org/codes-and-standards/all-codes-and-standards/list-of-codes-and-standards/detail?code=1122 (last access: 9 October 2022), 2018. a
National Weather Service: 28 May 2019 Tornadoes, https://www.weather.gov/eax/28May2019_Tornadoes (last access: 20 April 2022), 2019. a, b, c
National Weather Service: 11 Oct 2023 Radiosonde Observation, https://www.weather.gov/upperair/factsheet#:~:text=The%20radiosonde%20is%20a%20small,with%20hydrogen%20or%20helium%20gas. (last access: 11 October 2023), 2023. a
NOAA National Centers for Environmental Information (NCEI): State of the Climate: Monthly Tornadoes Report for May 2019, https://www.ncei.noaa.gov/access/monitoring/monthly-report/tornadoes/201905 (last access: 11 October 2022), 2019a. a
NOAA National Centers for Environmental Information (NCEI): Storm Events Database Bulk Data Download, https://www.ncei.noaa.gov/pub/data/swdi/stormevents/csvfiles/StormEvents_details-ftp_v1.0_d2019_c20210803.csv.gz (last access: 9 May 2022), 2019b. a, b
Noreen, U., Bounceur, A., and Clavier, L.: A study of LoRa low power and wide area network technology, in: 2017 International Conference on Advanced Technologies for Signal and Image Processing (ATSIP), Fez, Morocco, 22–24 May 2017, IEEE, 1–6, https://doi.org/10.1109/atsip.2017.8075570, 2017. a
Pazmany, A. L., Mead, J. B., Bluestein, H. B., Snyder, J. C., and Houser, J. B.: A mobile rapid-scanning X-band polarimetric (RaXPol) Doppler radar system, J. Atmos. Ocean. Tech., 30, 1398–1413, https://doi.org/10.1175/JTECH-D-12-00166.1, 2013. a
Samaras, T. M.: A historical perspective of in-situ observations within tornado cores, in: 22nd Conf. on Severe Local Storms, Hyannis, MA, 4–8 October 2004, American Meteorological Society (AMS) [preprint], vol. 11, https://ams.confex.com/ams/pdfpapers/81153.pdf (last access: 27 January 2024), 2004. a
Samaras, T. M. and Lee, J. J.: Pressure measurements within a large tornado, in: Eighth Symp. on Integrated Observing and Assimilation for Atmosphere, Oceans, and Land Surface, Seattle, WA, USA, 10–15 January 2004, American Meteorological Society (AMS), https://ams.confex.com/ams/pdfpapers/74267.pdf (last access: 27 January 2024), 2004. a, b, c, d
Semtech: LoRa and LoRaWAN: A Technical Overview, accessed, https://lora-developers.semtech.com/uploads/documents/files/LoRa_and_LoRaWAN-A_Tech_Overview-Downloadable.pdf (last access: 9 October 2022), 2019. a
Simpson, M. and Timmer, R.: Thermal Lag Treatment For Lawrence/Linwood Tornado Probe Data, OSF [data set], https://doi.org/10.17605/OSF.IO/BQ93T, 2019. a
Snow, J., Church, C., and Barnhart, B.: An investigation of the surface pressure fields beneath simulated tornado cyclones, J. Atmos. Sci., 37, 1013–1026, 1980. a, b, c
Storm Prediction Center: SPC Severe Weather Event Review for Tuesday May 28, 2019, https://www.spc.noaa.gov/exper/archive/event.php?date=20190528 (last access: 20 April 2022), 2019. a, b
Straka, J. M., Rasmussen, E. N., and Fredrickson, S. E.: A mobile mesonet for finescale meteorological observations, J. Atmos. Ocean. Tech., 13, 921–936, https://doi.org/10.1175/1520-0426(1996)013<0921:AMMFFM>2.0.CO;2, 1996. a
Swenson, S., Argrow, B., Frew, E., Borenstein, S., and Keeler, J.: Development and deployment of air-launched drifters from small uas, Sensors, 19, 2149, https://doi.org/10.3390/s19092149, 2019. a
Tanamachi, R. L., Bluestein, H. B., Xue, M., Lee, W.-C., Orzel, K. A., Frasier, S. J., and Wakimoto, R. M.: Near-Surface Vortex Structure in a Tornado and in a Sub-Tornado-Strength Convective-Storm Vortex Observed by a Mobile W-Band Radar during VORTEX2, Mon. Weather Rev., 141, 3661–3690, https://doi.org/10.1175/mwr-d-12-00331.1, 2013. a, b
Timmer, R., Simpson, M., Schofer, S., and Brooks, C.: Public Data Lawrence/Linwood EF4 Tornado - 28th May 2019, OSF [data set], https://doi.org/10.17605/OSF.IO/Z64FD, 2022. a
Timmer, R., Simpson, M., Schofer, S., and Brooks, C.: Video Supplement Lawrence/Linwood EF4 Tornado - 28th May 2019, Supplemental1.mov/Supplemental2.mov, OSF [video], https://osf.io/ubtn5/ (last access: 27 January 2024), 2023. a, b
Wakimoto, R. M., Murphey, H. V., Dowell, D. C., and Bluestein, H. B.: The Kellerville tornado during VORTEX: Damage survey and Doppler radar analyses, Mon. Weather Rev., 131, 2197–2221, https://doi.org/10.1175/1520-0493(2003)131<2197:TKTDVD>2.0.CO;2, 2003. a
Wakimoto, R. M., Atkins, N. T., and Wurman, J.: The LaGrange Tornado during VORTEX2. Part I: Photogrammetric Analysis of the Tornado Combined with Single-Doppler Radar Data, Mon. Weather Rev., 139, 2233–2258, https://doi.org/10.1175/2010mwr3568.1, 2011. a, b
Wakimoto, R. M., Atkins, N. T., Butler, K. M., Bluestein, H. B., Thiem, K., Snyder, J. C., Houser, J., Kosiba, K., and Wurman, J.: Aerial damage survey of the 2013 El Reno tornado combined with mobile radar data, Mon. Weather Rev., 144, 1749–1776, 2016. a
Wang, J., Zhang, L., Dai, A., Immler, F., Sommer, M., and Vömel, H.: Radiation dry bias correction of Vaisala RS92 humidity data and its impacts on historical radiosonde data, J. Atmos. Ocean. Tech., 30, 197–214, https://doi.org/10.1175/JTECH-D-12-00113.1, 2013. a
Weiss, C. C. and Schroeder, J.: StickNet–A new portable, rapidly-deployable, surface observation system, in: 24th Conf. on IIPS, New Orleans, LA, USA, 20–24 January 2008, https://ams.confex.com/ams/pdfpapers/134047.pdf (last access: 27 January 2024), 2008. a
Winn, W. P., Hunyady, S. J., and Aulich, G. D.: Pressure at the ground in a large tornado, J. Geophys. Res.-Atmos., 104, 22067–22082, https://doi.org/10.1029/1999jd900387, 1999. a
World Meteorological Organization: Guide to Meteorological Instruments and Methods of Observation, https://library.wmo.int/index.php?lvl=notice_display&id=12407#.XPf8bS8ZNhF (last access: 20 April 2022), 2017. a
Wurman, J., Dowell, D., Richardson, Y., Markowski, P., Rasmussen, E., Burgess, D., Wicker, L., and Bluestein, H. B.: The Second Verification of the Origins of Rotation in Tornadoes Experiment: VORTEX2, B. Am. Meteorol. Soc., 93, 1147–1170, https://doi.org/10.1175/bams-d-11-00010.1, 2012. a
Wurman, J., Kosiba, K., and Robinson, P.: In situ, Doppler radar, and video observations of the interior structure of a tornado and the wind–damage relationship, B. Am. Meteorol. Soc., 94, 835–846, 2013. a, b, c, d, e, f