the Creative Commons Attribution 4.0 License.
the Creative Commons Attribution 4.0 License.
 | 18 Jun 2025
Simple water vapor sampling for stable isotope analysis using affordable valves and bags
John D. Marshall
David Dubbert
Mathias Hoffmann
Maren Dubbert
Water-stable isotopes are commonly used in hydrological and ecological research. Until now, most measurements of soil or plant water isotopes have been made by taking a sample from the field and extracting its water in the laboratory. More recently, samples have been collected with gas-permeable membranes (GPMs) and measured in the field. These new methods, however, present challenges in achieving high-resolution measurements across multiple sites since they require significant effort and resources. Gas bag sampling offers the advantage of non-destructive, cost-efficient, easy-to-perform measurements without the need to bring a cavity ring-down spectroscopy (CRDS) analyzer into the field. We used gas-permeable membranes to extract samples of water vapor from the soil, which were then stored in multi-layer foil bags until analysis. The bags were modified with homemade connections to reduce leakage and simplify gas transfers. The bags were tested using laboratory standards to determine their maximum storage time, potential memory effects, and reusability. The storage experiment with new bags demonstrated the ability to store water vapor samples for up to 7 d while maintaining mostly acceptable trueness for δ2H and acceptable to questionable trueness for δ18O. Trueness was defined as the mean difference between the measured and known water vapor placed into the bags and precision by the standard deviation of replicate measurements. The memory experiment using new bags revealed that the influence of previous samples increased with duration of storage. In both experiments, the light standards seemed to result in less accuracy. The reuse experiment confirmed that the bags can be filled repeatedly, provided they are used for similar sample lines and flushed 10 times with dry air. To demonstrate bag applicability in the field, we compared measurements of stored samples to measurements made directly in the field. Storing beyond 24 h needs further investigation but appears promising. With new gas bags up to 24 h of storage, we found accuracies of 0.2 ‰ ± 0.9 for δ18O and 0.7 ‰ ± 2.3 for δ2H. When the bags were reused and stored up to 24 h, they yielded accuracies of 0.1 ‰ ± 0.8 for δ18O and 1.4 ‰ ± 3.3 for δ2H. The proposed system is simple, cost-efficient, and versatile for both lab and field applications; however, case-specific testing is necessary given the remaining uncertainties.
- Article
(2886 KB) - Full-text XML
-
Supplement
(591 KB) - BibTeX
- EndNote


Water-stable isotope measurements are used in a variety of scientific fields, particularly in hydrology, ecohydrology, and meteorology, which focus on aspects of the water cycle. The primary isotopes involved are 18O and 2H (e.g., Gat, 1996; Mook, 2000), described as δ18O and δ2H relative to the most abundant isotopes, 16O and 1H (Sodemann, 2006). They serve to investigate processes such as infiltration and groundwater recharge (e.g., Séraphin et al., 2016), evaporation (e.g., Rothfuss et al., 2010), or the plasticity of root water uptake under stress (e.g., Kühnhammer et al., 2021, 2023).
Traditionally, the isotopic composition of soil and plant water has been measured through destructive sampling of soil cores or sampled plant material, followed by water extraction, e.g., via cryogenic extraction (see method summary in Orlowski et al., 2016a), and measured with isotope ratio mass spectrometry (IRMS) analyzers (West et al., 2006; Sprenger et al., 2015). The development of smaller and less expensive cavity ring-down spectroscopy (CRDS) analyzers has led to an increase in potential applications, including in situ measurements using gas-permeable membranes (Rothfuss et al., 2013; Volkmann and Weiler, 2014; Volkmann et al., 2016; Kübert et al., 2020; Landgraf et al., 2022). Direct measurements are a viable alternative to classic destructive techniques, especially in small plots, as among other benefits (e.g., high-frequency measurements) they avoid repeated destructive sampling. However, direct, continuous in situ field setups are very cost-intensive and technically challenging and require a permanent power supply in the field as well as strong expertise to maintain. Moreover, direct in situ field setups require full-time operation of one laser spectrometer (e.g., a CRDS analyzer) each, whereas a vapor storage method could be operated with one CRDS analyzer for several field setups. To allow an expansion to a wider set of potential study areas and increase the number of absolute study areas maintainable, scientists have recently been trying to develop new simplified sampling systems. This includes capturing soil moisture as water vapor for subsequent laboratory analysis (e.g., Havranek et al., 2020; Magh et al., 2022; Herbstritt et al., 2023). To do so, primarily glass bottles or gas sampling bags with various fittings are used, which cost from ∼ EUR 1–200 per container. The advantages of these methods include the ability to quickly measure stored samples at elevated temperatures relative to the source in a temperature-stable laboratory environment. In addition, multiple sample containers can be filled at once in the field, which allows for the simultaneous measurement of multiple probes, and sampling can generally be performed at a much faster rate. These simplified and more affordable systems could therefore increase the number of studies on water-stable isotopes and provide new insights for research by increasing the number of possible experimental sites and samples.
In this study, we investigated the use of multi-foil bags with septum valves. Our investigation focused on exploring the potential of these commercially available but affordable bags for a wider range of applications (∼ EUR 20 per bag plus ∼ EUR 15 for the connection). To ensure easy and reliable bag filling and measurement, we built an additional connection and a portable dry-air supply box system for easy field measurement. We tested the prepared bags in several experiments in the laboratory using defined standards and, in the field, using comparison to in situ measurements with a CRDS analyzer. The focus was to investigate storage capability as well as possible isotopic fractionation effects due to exchange with the inner surface of the bags. Five different experiments were performed: (i) a storage experiment up to 7 d, (ii) a memory experiment without sample storage and two quite different standards, (iii) a memory experiment with 1 d of storage of the initial standard followed by sample replacement exploring duration effects on memory setting, and (iv) a field filling and bag reuse experiment to compare the bag measurements with in situ CRDS measurements. These were followed by (v) a gas bag measurement sequence over a full cultivation period. These results allowed us to find a simple approach to using septum-based gas bags for field measurements of water-stable isotopes.
2.1 Study area and basics of water-stable isotope measurements
The laboratory experiments were carried out at the Leibniz Centre for Agricultural Landscape Research (ZALF). The field experiments took place at the AgroFlux experimental platform of ZALF (see Dahlmann et al., 2023, for further details), located in the northeast of Germany, near Dedelow in the Uckermark region (53°22′45′′ N, 13°47′11′′ E; ∼50–60 m a.s.l.).
During the experiments, the δ2H and δ18O values were recorded using a CRDS analyzer (L2130-i, Picarro Inc., Santa Clara, CA, USA). The hydrogen and oxygen stable isotopes in the sampled water vapor (δ2H and δ18O) are given in per mil (‰), relative to the Vienna Standard Mean Ocean Water (VSMOW) using δ notation (Eq. 1; Craig, 1961).
During all experiments, water-stable isotope signatures (δ2H and δ18O in ‰) were measured with the method of Rothfuss et al. (2013), using gas-permeable membranes (GPMs; Accurel GP V8/2HF, 3M, Germany; 0.155 cm wall thickness, 0.55 cm i.d., 0.86 cm o.d.; e.g., as used in Kübert et al., 2020, or Kühnhammer et al., 2021). In the laboratory experiments, we attached two membranes to the cap of a 100 mL glass bottle with two stainless steel fittings (CUA-2, Hy-Lok D Vertriebs GmbH, Germany) to directly measure standard water vapor and to fill the bags. The glass bottle was filled with approx. 60–80 mL of standard water. The first membrane was submerged in the standard water, where it bubbles the dry air through, resulting in equilibration of water vapor in the headspace with the standard water. The second membrane, in the headspace, collects saturated sample air and supplies it to the analyzer. Both membranes were sealed with adhesive. The second membrane (< 5 cm) served as a safety mechanism to prevent liquid water from entering the tubing.
A gas cylinder was used to induce dry gas at a low flow rate of 50–80 mL min−1 (257-6409, RS Components GmbH, Germany). We ensured that the isotopic signature of the vapor would be at equilibrium with liquid water at this flow rate. We tested flows from the minimum required for Picarro operation (approx. 35 mL min−1) to 300 mL min−1 and found consistent results up to 100 mL min−1. At the lower flow rates, the water vapor passing through the membrane reached isotopic thermodynamic equilibrium (Majoube, 1971; Horita and Wesolowski, 1994).
In the field experiments, we used approx. 12 cm membranes (comparable to soil GPM, in e.g., Kühnhammer et al., 2021) attached to PTFE tubing to sample the four different soil depths (see Sect. 2.7). The in situ method was likewise based on the measurement of water vapor with the assumption that the vapor was in isotopic equilibrium with the liquid water surrounding the sample probe (Rothfuss et al., 2013). Finally, the isotopic fractionation was calculated as a function of the temperature (T) at the phase transition using equations based on Majoube (1971).
The water vapor from the standards and soil was then either transferred immediately to the CRDS analyzer and measured directly or stored in the gas bags and measured later. In laboratory experiments I, II and III, the temperatures were around 20 °C during filling and around 24 °C during storage and bag measurement to avoid condensation. In field experiments IV and V, great care was taken to measure the bags at elevated temperatures relative to the source temperatures.
In laboratory experiments, calibration was performed by measuring the described glass bottles before the start of the measurement and the used standard during and after the experiment for drift correction. In field experiments, the standards covering the expected sampled isotopic range were filled into bags and treated similarly to the samples. Calibration was then performed.
2.2 Storage and sampling design
2.2.1 Gas bag design
The sampling and measurement concept was intended to be as simple as possible, while still providing high accuracy and precision. Water vapor samples were stored in 1 L multi-layer foil bags with a septum-based valve (1l Multi-Layer Foil Bags with stainless steel fitting, Sense Trading B.V., Netherlands; see Table S1 for more details; Sense Trading B.V., personal communication, 1 August 2024). The stainless steel two-in-one fitting combined the valve and septum, with the septum acting as a seal, allowing air to flow around it when the valve was open, and sealing when the valve was closed. As recommended by the manufacturer, care was taken when filling the bags to ensure that the maximum volume did not exceed 90 % of nominal capacity, which could cause material damage. The connection (Fig. 1) was built to easily attach the bags with the sample setup. It consisted of two short PTFE tubes (PTFE tubing, Wolf-Technik eK, Germany) and an additional luer-lock stopcock (one-way Masterflex™ Stopcocks with Luer Connection, Avantor, USA). A hose clamp (TORRO SGL 5 mm, NORMA Group Holding GmbH, Germany) was used to directly connect a quarter-inch tube to the valve, and the other 4 mm tube was glued into the quarter-inch tube using two-component adhesive (DP8005, 3M Deutschland GmbH, Germany). Since the adhesive contact with the PTFE tube could break under tension and cause leakage, we wrapped electrical insulation tape around the splice to reinforce the connector. This tape was not essential for sealing. Then, a luer-lock connection (LF-1.5NK-QC, GMPTEC GmbH, Germany) was used to connect the luer-lock stopcock.
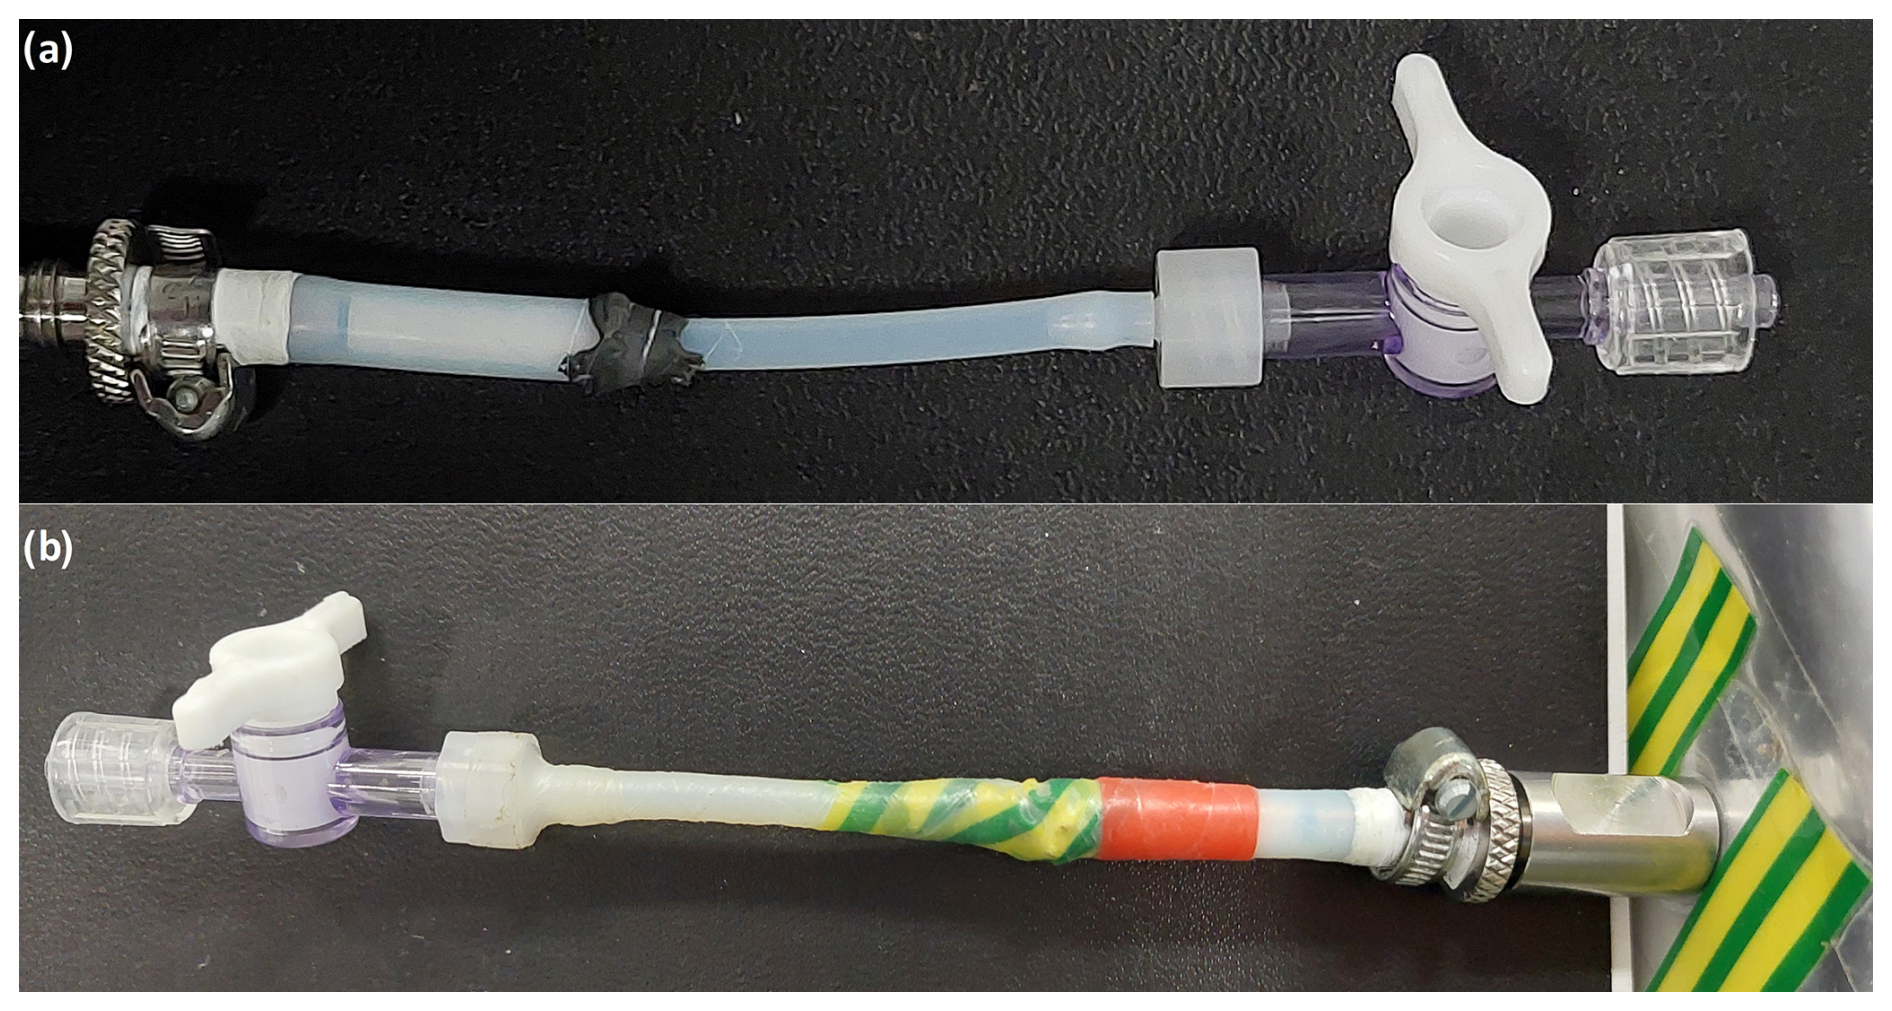
Figure 1Self-constructed luer-lock connector with the splice exposed (a) and stabilized with tape attached to the bag on the right (b).
2.2.2 Sampling design
(1) For the direct standard measurements, the sample generated was passed directly to the laser spectrometer to determine its isotopic signature. Since the laser spectrometer only has a flow rate of approx. 35 to 40 mL min−1, an open split was added to ensure a constant flow and to avoid pressure differences. Flow at the open split was measured continuously to ensure that no ambient air could flow back. A 5 min average was taken at the end of a minimum 10 min measurement for direct standard measurements.
(2) For the field measurements, the membranes were installed at the four different depths of 5, 15, 45, and 150 cm, and water vapor was transported out of the soil using 4 mm PTFE tubing. The open ends were fitted with Luer connectors for later connection of gas sample bags and the dry-air supply. To protect these open ends from environmental influences, waterproof outdoor boxes were installed 20 to 30 cm above the ground (outdoor.case type 500, B&W International GmbH, Germany). Cable glands were used to keep the boxes watertight (PG screw set, Reichelt Elektronik GmbH, Germany).
A separate box was built to supply pressurized dry air to the measuring system during the field experiments (Fig. 2). This contained a pump (NMP850KPDC-B, KNF DAC GmbH, Germany) including a power supply (DPP50-24, TDK-Lambda Germany, Germany), which could transport the dry air in three tubes simultaneously through up to three sample lines. The air is ambient air which is dried by a desiccant (Silica Gel Orange, Carl Roth GmbH + Co. KG, Germany) contained in a 1 L bottle (screw top bottle DURAN®, DWK Life Science, USA). To regulate the flow of individual sample lines, fixed valves were used (AS1002F-04, SMC Deutschland GmbH, Germany). The dry-air supply box was tested prior to our experiments by measuring the outlet concentration of the dry box over the course of 1 d. However, the use of such a system should always be tested for the specific application, as a very high flow rate combined with very humid air could greatly affect the duration of possible use. During the experiments, we periodically tested the water concentration before and after the field campaigns and could not detect any increase after 1 d in the field. The water concentration of the dry air produced was approx. 200 ppm.
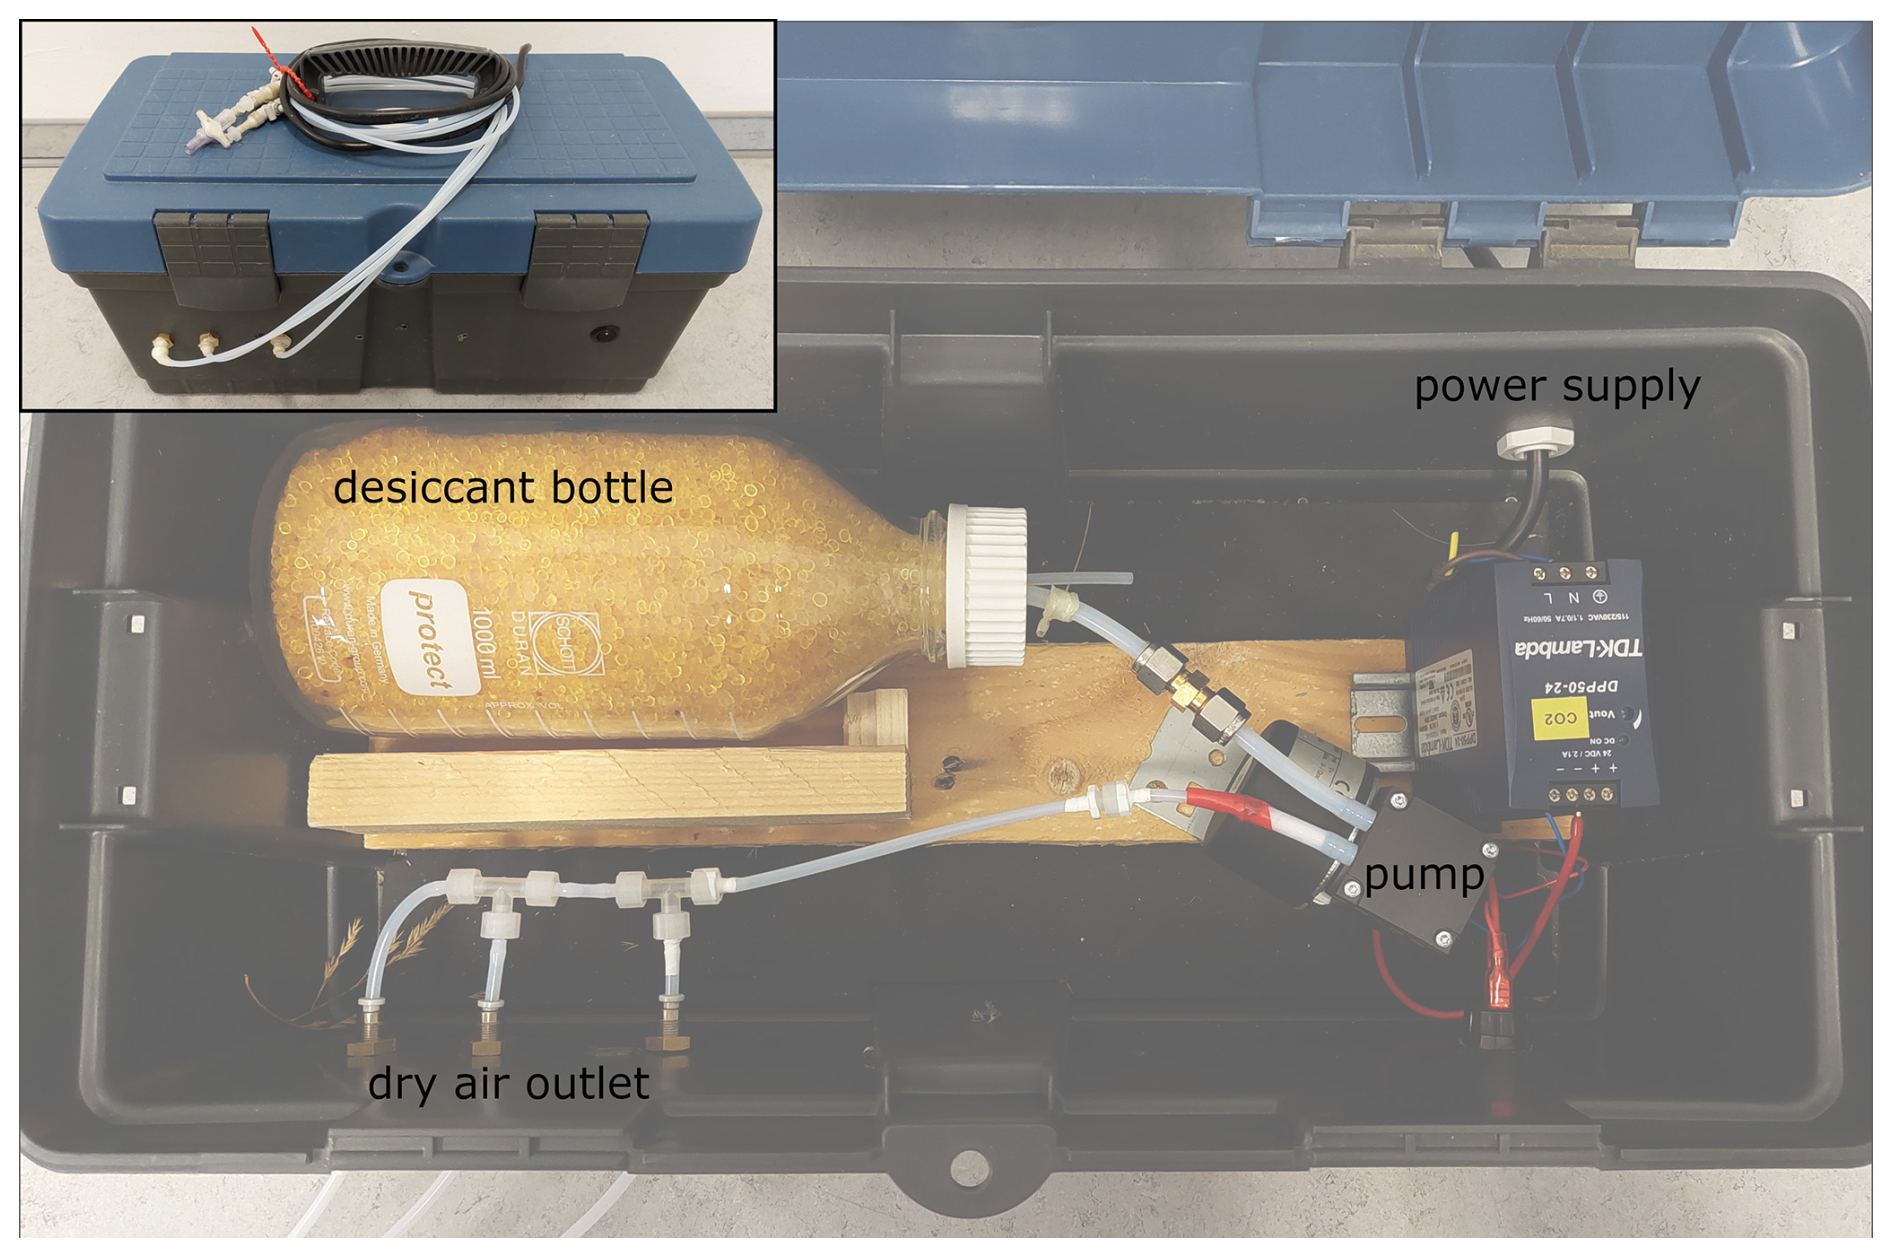
Figure 2Self-constructed box for field dry-air supply (top left) including a bottle with desiccant, the power supply, and a pump for up to three dry-air outlet lines.
2.3 Laboratory standards
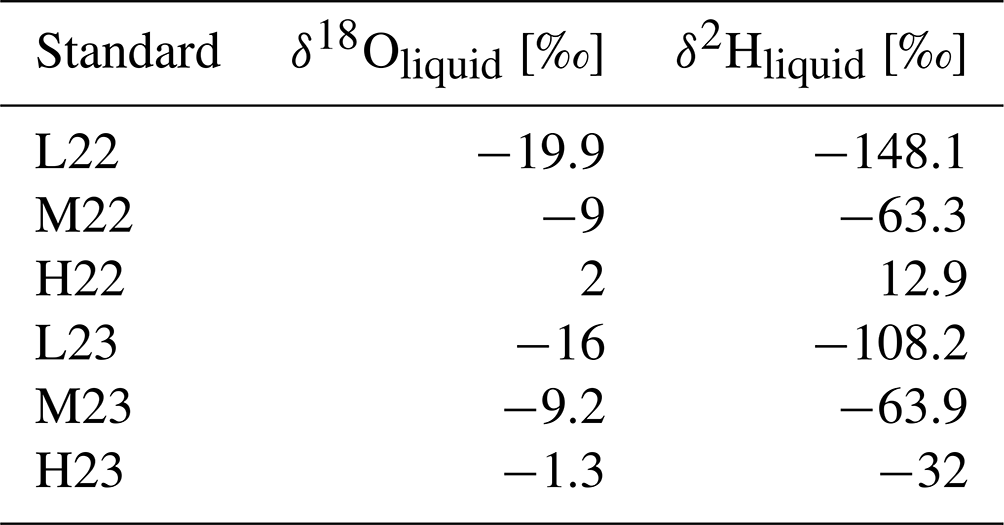
The water-stable isotope measurements were calibrated against six water vapor standards (see Table 1) that were manually measured during the experiments. Temperature (T) was recorded continuously every 30 s with a thermometer (EBI 20-TH1, Xylem Analytics Germany Sales GmbH & Co. KG, Germany) placed directly next to the standard container. This allowed us to measure the standards in the vapor phase and infer the values in a liquid phase at equilibrium (Sect. 2.5). Of the six standards with different δ values, approx. 60 mL was filled into the prepared 100 mL standard bottles as described in Sect. 2.1 and measured directly on the CRDS analyzer.
2.4 Experimental design
2.4.1 Experiment I: storage duration
In our storage experiment, we tested our gas sample bags for water vapor storage using water sources of known isotopic composition. New bags, including the homemade connections, were prepared to eliminate any production artifacts. Each bag was cycled with dry air, filled, and emptied five times in a row. Following this preparation, five bags per storage period were filled with two standards, L22 and M22 (15 min at 50 mL min−1).
Upon filling, the gas bags were promptly measured to ensure that no isotopic fractionation occurred during the filling process. Subsequently, the gas bags were stored in the laboratory for three storage durations −1, 3, and 7 d. After the designated storage periods, the samples were measured for 4 to 5 min, and a stable 2 min average was recorded.
2.4.2 Experiment II: memory
We conducted two memory tests, maintaining a consistent methodology similar to that employed during the storage experiment, both utilizing five newly prepared bags per standard. In the first test, we followed a structured sequence: we filled gas bags with the initial standard, emptied them, and switched to the opposite standard and refilled the bags. We repeated the process three times (fill, measure, empty) with the opposite standard until our measurements fell within the required acceptable range (defined in Sect. 2.5). In the first experiment, L23 was used as the initial standard and H23 as the opposite standard, and in the second experiment, the standards were used in reverse order.
2.4.3 Experiment III: memory test with storage
This laboratory experiment was conceived after we observed the effect of a short delay on memory in Experiment II. We followed a similar procedure except that the initial standard L22 was allowed to stand in the bags for 1 d prior to replacement with the second standard H22. We then proceeded with the second standard following the repeated steps (fill, measure, empty) until our measurements fell within the acceptable range again. Between the second and third measurement cycle, the experiment was interrupted due to the long duration (1 h) of each measurement cycle and continued the next day (after 15.5 h). The bags were left empty during this second night to avoid any effects. Due to the length of each measurement cycle, we used three repetitions during the experiment.
2.4.4 Experiment IV: field filling and bag reuse
To validate results gained during the laboratory experiments under field conditions, we compared measurements using the gas bags with direct in situ CRDS measurements. To do so, we conducted two measuring campaigns, the first using new bags and the second using reused bags. During the first one, we focused on the applicability of bag filling in the field by comparing direct measurements of the soil water isotopes with the CRDS analyzer in the field measurement of bagged samples. In the second campaign, we again compared direct field measurements to bagged measurements but this time using re-used bags measured in the laboratory within 24 h. To exclude any memory effects, as we saw in experiment III, the reused bags were flushed 10 times with dry air (approx. 10×10 min). Identical sample bags were utilized for the identical sample probe to minimize changes in isotopic composition and reduce the impact of memory effects. During each of the two measurement campaigns, a total of 48 samples were collected at four different depths: 5 cm (n=14), 15 cm (n=13), 45 cm (n=7), and 150 cm (n=14). Due to low soil permeability, the depth of 45 cm could only be sampled during one measurement campaign, resulting in only seven samples. Dry carrier gas was passed through the homemade membrane soil probes at a flow rate of approx. 50 mL min−1. First, we connected the CRDS analyzer to the outlet valve to determine the time required to reach a steady-state value (compared to, e.g., Kühnhammer et al., 2021). Subsequently, a 2 min average was recorded at the end of a 15 min measurement for comparison with the subsequent bag measurement. Second, we connected the bags and filled them for 15 min (approx. 750 mL). The temperature at the sampled soil depth (TEROS 21, Meter Group, USA) was logged using a data logger (CR1000, Campbell Scientific Ltd., Germany) at 20 min averages and used to correct for equilibrium fractionation. Furthermore, it was used to determine the saturated water concentration to control the concurrent measured concentration in the probe.
2.4.5 Experiment V: observation over a full cultivation period
The field applicability test was followed by gas bag sampling and subsequent water-stable isotope analyses in the laboratory for the same soil depths during a full winter wheat cropping period (variety – E. ponticus; sowing – 26 September 2022; harvest – 18 July 2023). We measured once a month during the winter and once a week starting in the spring resulting in 18 measurement campaigns using only our gas bags. As was the case with experiment IV, identical sample bags were used for the identical sample probes throughout all campaigns. Sample bags were replaced with new ones if they were damaged. To provide context for the soil isotopic data, additional precipitation samples were collected at the site over a 2-year period.
2.5 Calculation of isotope ratios and evaluation of uncertainty and data correction
The isotope signatures of the collected water vapor water sample were converted to liquid water isotope signatures using Majoube's method (Majoube, 1971). This conversion was based on equilibrium fractionation at the source temperature T [K] (Eqs. 2 and 3).
The equilibrium fractionation factor α+ was determined based on Majoube's (1971) experimental results, using the coefficients a, b, and c (a=1.137, , and for 18O and a=24.844, , and c=52.612 for 2H).
To assess the uncertainty of our laboratory measurements, we calculated z scores for each sample and water-stable isotope (δ18O and δ2H). Z scores indicate the normalized deviation of the measured water isotopic ratios from the known isotopic signature of the added water vapor and can be calculated following the method (Eq. 4) described by Wassenaar et al. (2012):
where S is the isotope signature (δ18O or δ2H) measured with our gas bag, B is the benchmark isotope signature, and μ is the target standard deviation. To assess the performance of each extraction method, we set a target standard deviation (SD) of 2 ‰ for δ2H and 0.4‰ for δ18O for measuring water vapor samples. The target SD was selected based on CRDS measurements using the bag method and considering standard deviations from previous studies, such as those by Wassenaar et al. (2012) or Orlowski et al. (2016a). A z score < 2 represents an acceptable range, a z score between 2 and 5 describes the questionable range, and a z score > 5 represents an unacceptable range (Wassenaar et al., 2012; Orlowski et al., 2016a).
The experimental results will be described using the following figure design: the defined standard deviation will be shown as a dashed blue box in plots of the true water vapor isotope values, which will be predominantly shown on the left side. The acceptable z scores are shown as a dashed black box, and the questionable z scores are shown as a black box, predominantly on the right side. Both standard deviation and z scores are defined in Sect. 2.5.
3.1 Experiment I: storage duration
The laboratory standards used, L22 and M22, spanned an isotopic range of −9.0 ‰ to −19.9 ‰ in δ18O and −63.3 ‰ to −148.1 ‰ in δ2H (Fig. 3a; filled symbols: M22, empty symbols: L22). On average, the measured accuracies were −0.7 ‰ ± 0.6 δ18O and −0.1 ‰ ± 2 δ2H after 1 d, −0.3 ‰ ± 0.6 δ18O and 4.3 ‰ ± 5.2 δ2H after 3 d, and 0.4 ‰ ± 1 δ18O and 0.1 ‰ ± 2 δ2H after 7 d of storage (Tables S2, S3). Except for one sample during the M22 experiment, the deviations from the true standard values for these measurements were all within ± 0.4 for δ18O and 2 ‰ for δ2H, and thus no bias was associated with bag filling.
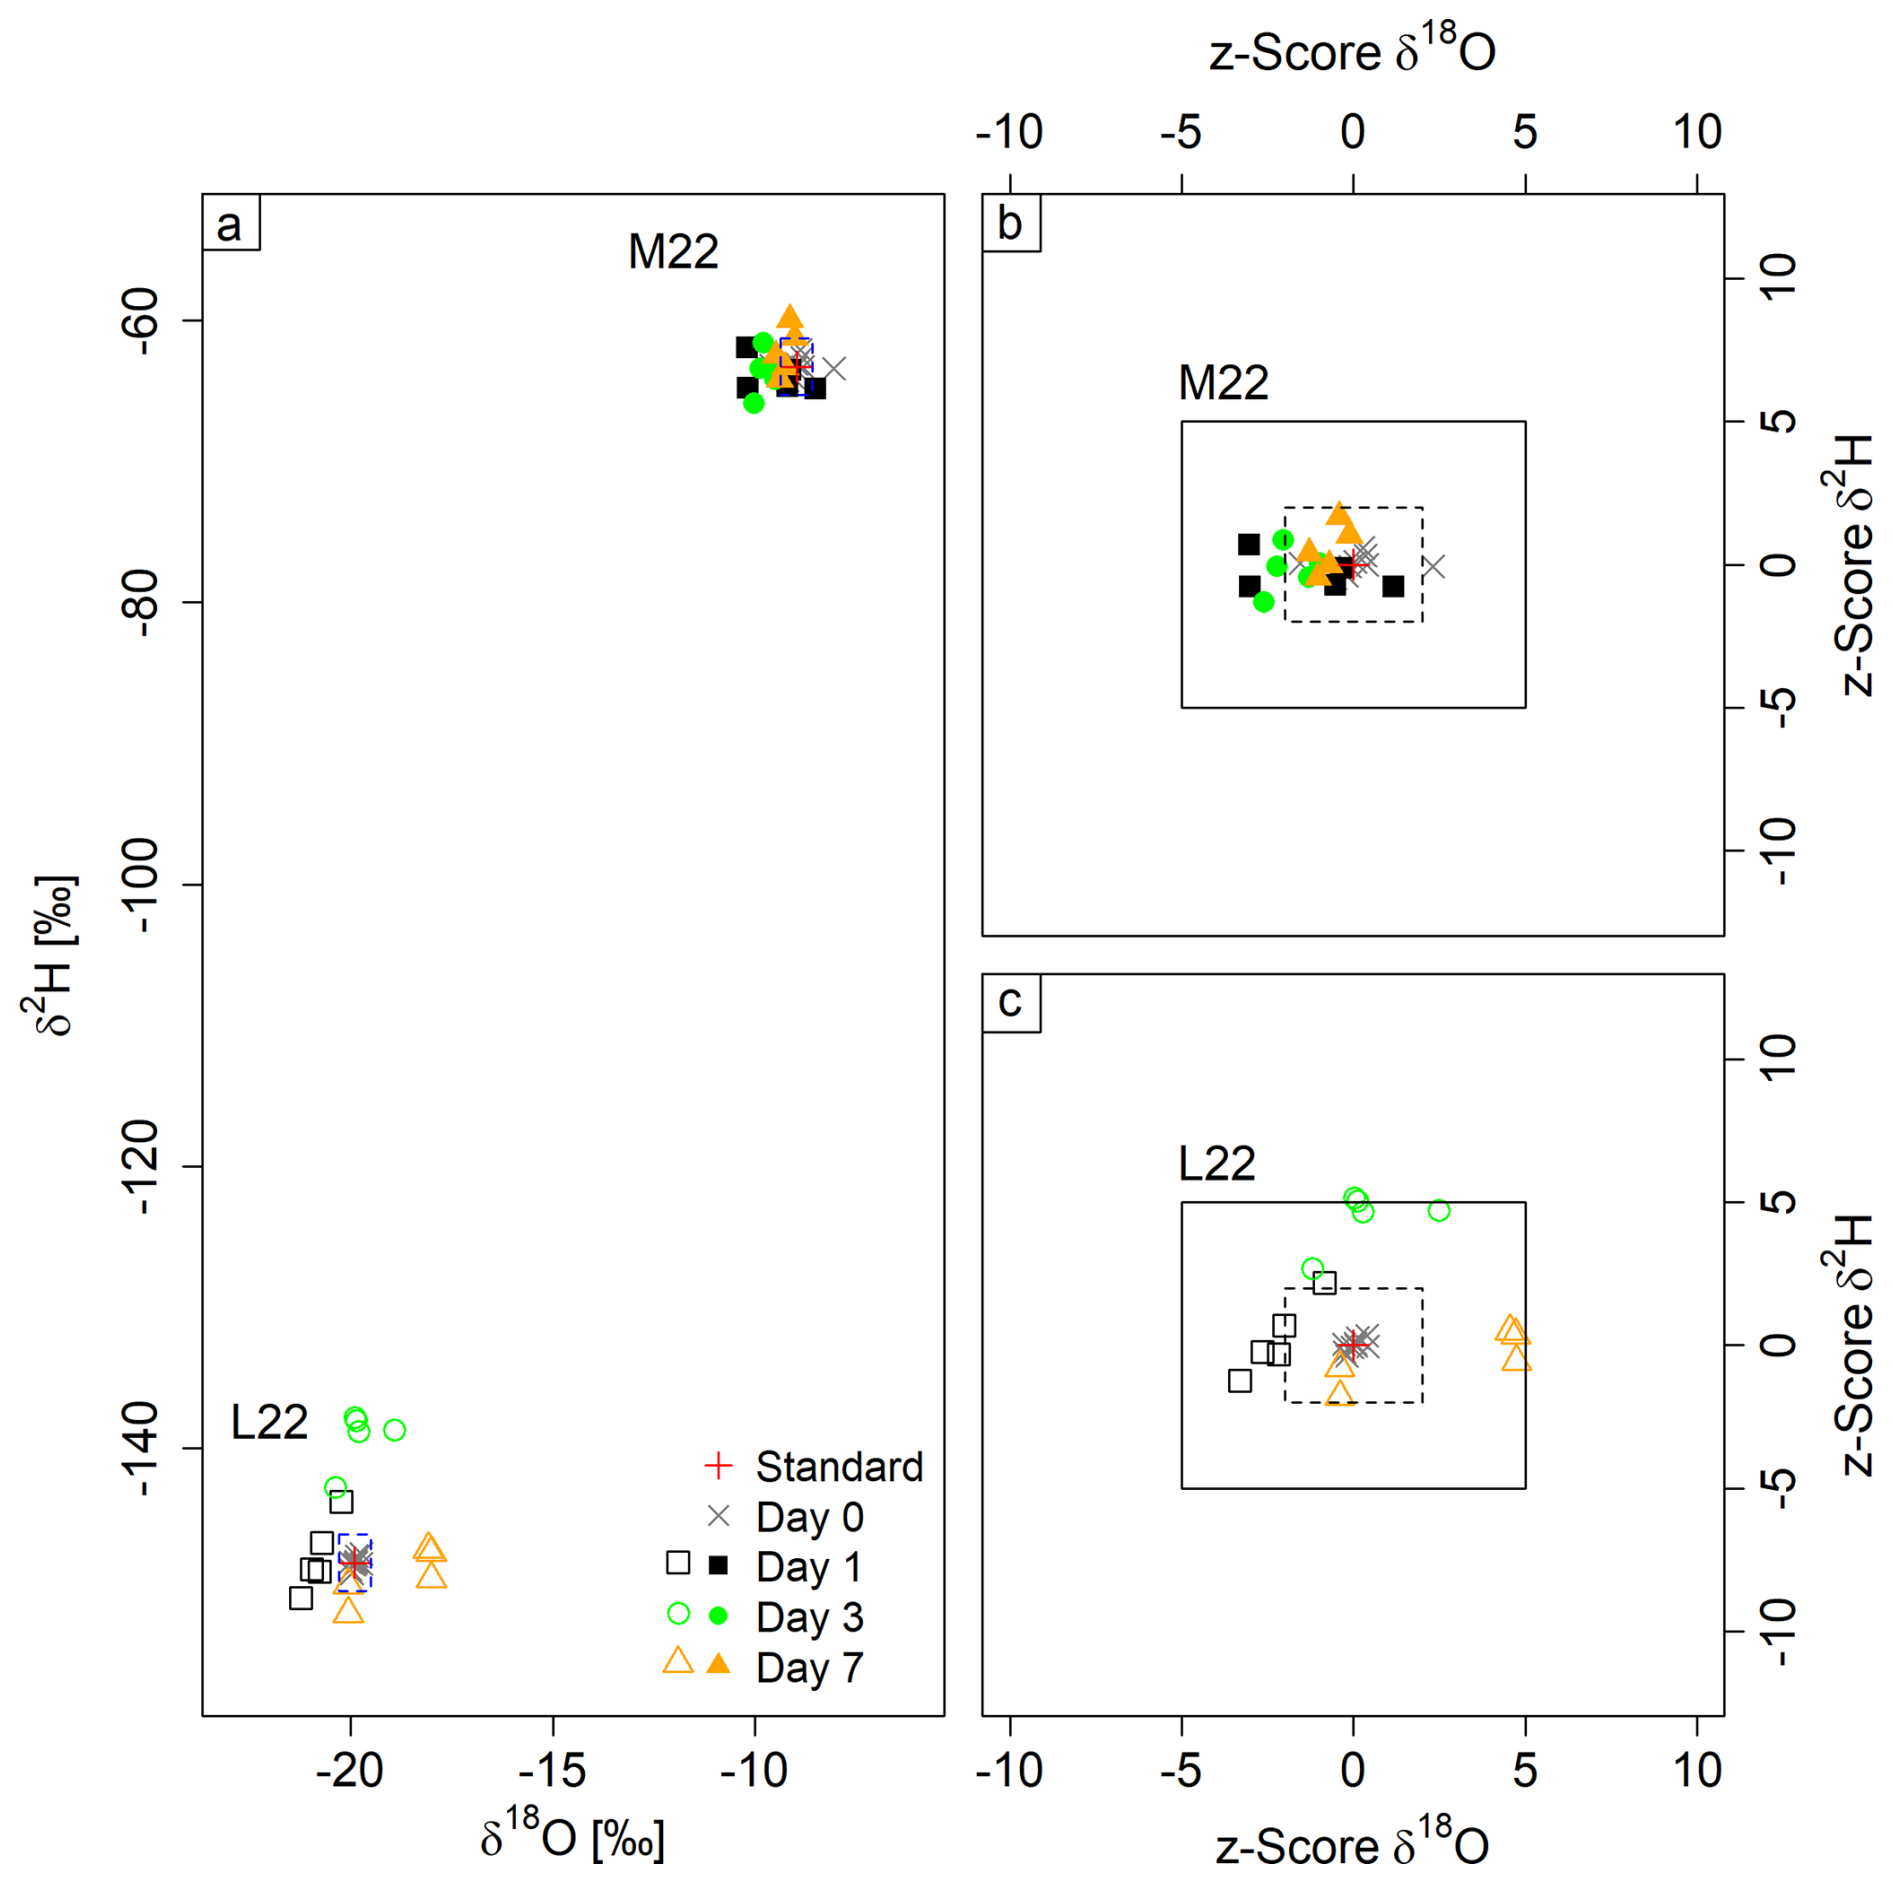
Figure 3Dual isotope plots showing variation over several days of water-vapor storage in gas bags. Panel (a) shows results from both experiments, and panels (b) and (c) show z score plots for standard M22 (filled symbols, b) and L22 (open symbols, c). The black boxes denote the questionable range, while the boxes delineated with a dashed line denote the acceptable range (b, c). The dashed blue lines in (a) denote the defined standard deviation for measurements.
The experiment using standard M22 resulted in overall high accuracies for all measurements of the three storage durations being −0.5 ‰ ± 0.5 for δ18O and 0 ‰ ± 1.6 for δ2H. In addition, no trend in isotopic signature could be observed over storage duration for either δ18O or δ2H. Consequently, z scores were either within the acceptable range or close to it, again with no trend of decreasing accuracy over storage time.
The second storage test using L22 showed a lower accuracy due to lower precision for δ2H, being 2.8 ‰ ± 4.9, and −0.1 ‰ ± 1.1 for δ18O. However, no time trend was observed. The decreased accuracy was mostly caused by the samples after 3 d, as all gas bags showed a significant enrichment (8.9 ‰ ± 2 δ2H on average). The higher inaccuracy after 3 d of storage must be due to an error during the measurement, as accuracy improved again after 7 d. The overall higher scatter (particularly for δ18O), which has a different isotopic signature than the ambient air, led to initial concern over potential exchange with ambient air. However, we do not think that is likely as the visible scatter that had already appeared within 1 d of storage was not directed towards isotopic signatures of ambient air and did not increase over time. The z scores show acceptable values for δ2H (except after 3 d) and more questionable values for δ18O. The average z score was 0.3 ± 2.7 for δ18O and 1.4 ± 2.5 for δ2H.
3.2 Experiment II: memory
In this experiment, the initial standard filled into the bags was L23, followed by cycles of filling and emptying with standard H23. This standard sequence was reversed in the second part of the experiment (initially H23, then cycles of L23). No clear memory effect was found in the first part of the experiment (Fig. 4b), whereas a clear memory effect was observed after the first filling (L1) of the second part of the experiment (Fig. 4c). However, this memory almost disappeared in the next repetition (L2).
As depicted in Fig. 4a and c, except for L1, almost all measurements fell within the target standard deviation for δ18O, while δ2H values are more scattered. The same pattern can be seen for the z scores (Fig. 4b and c). Three measurement points from L1 show unacceptable values, while the remaining z scores show acceptable or questionable values at the threshold of acceptable range.
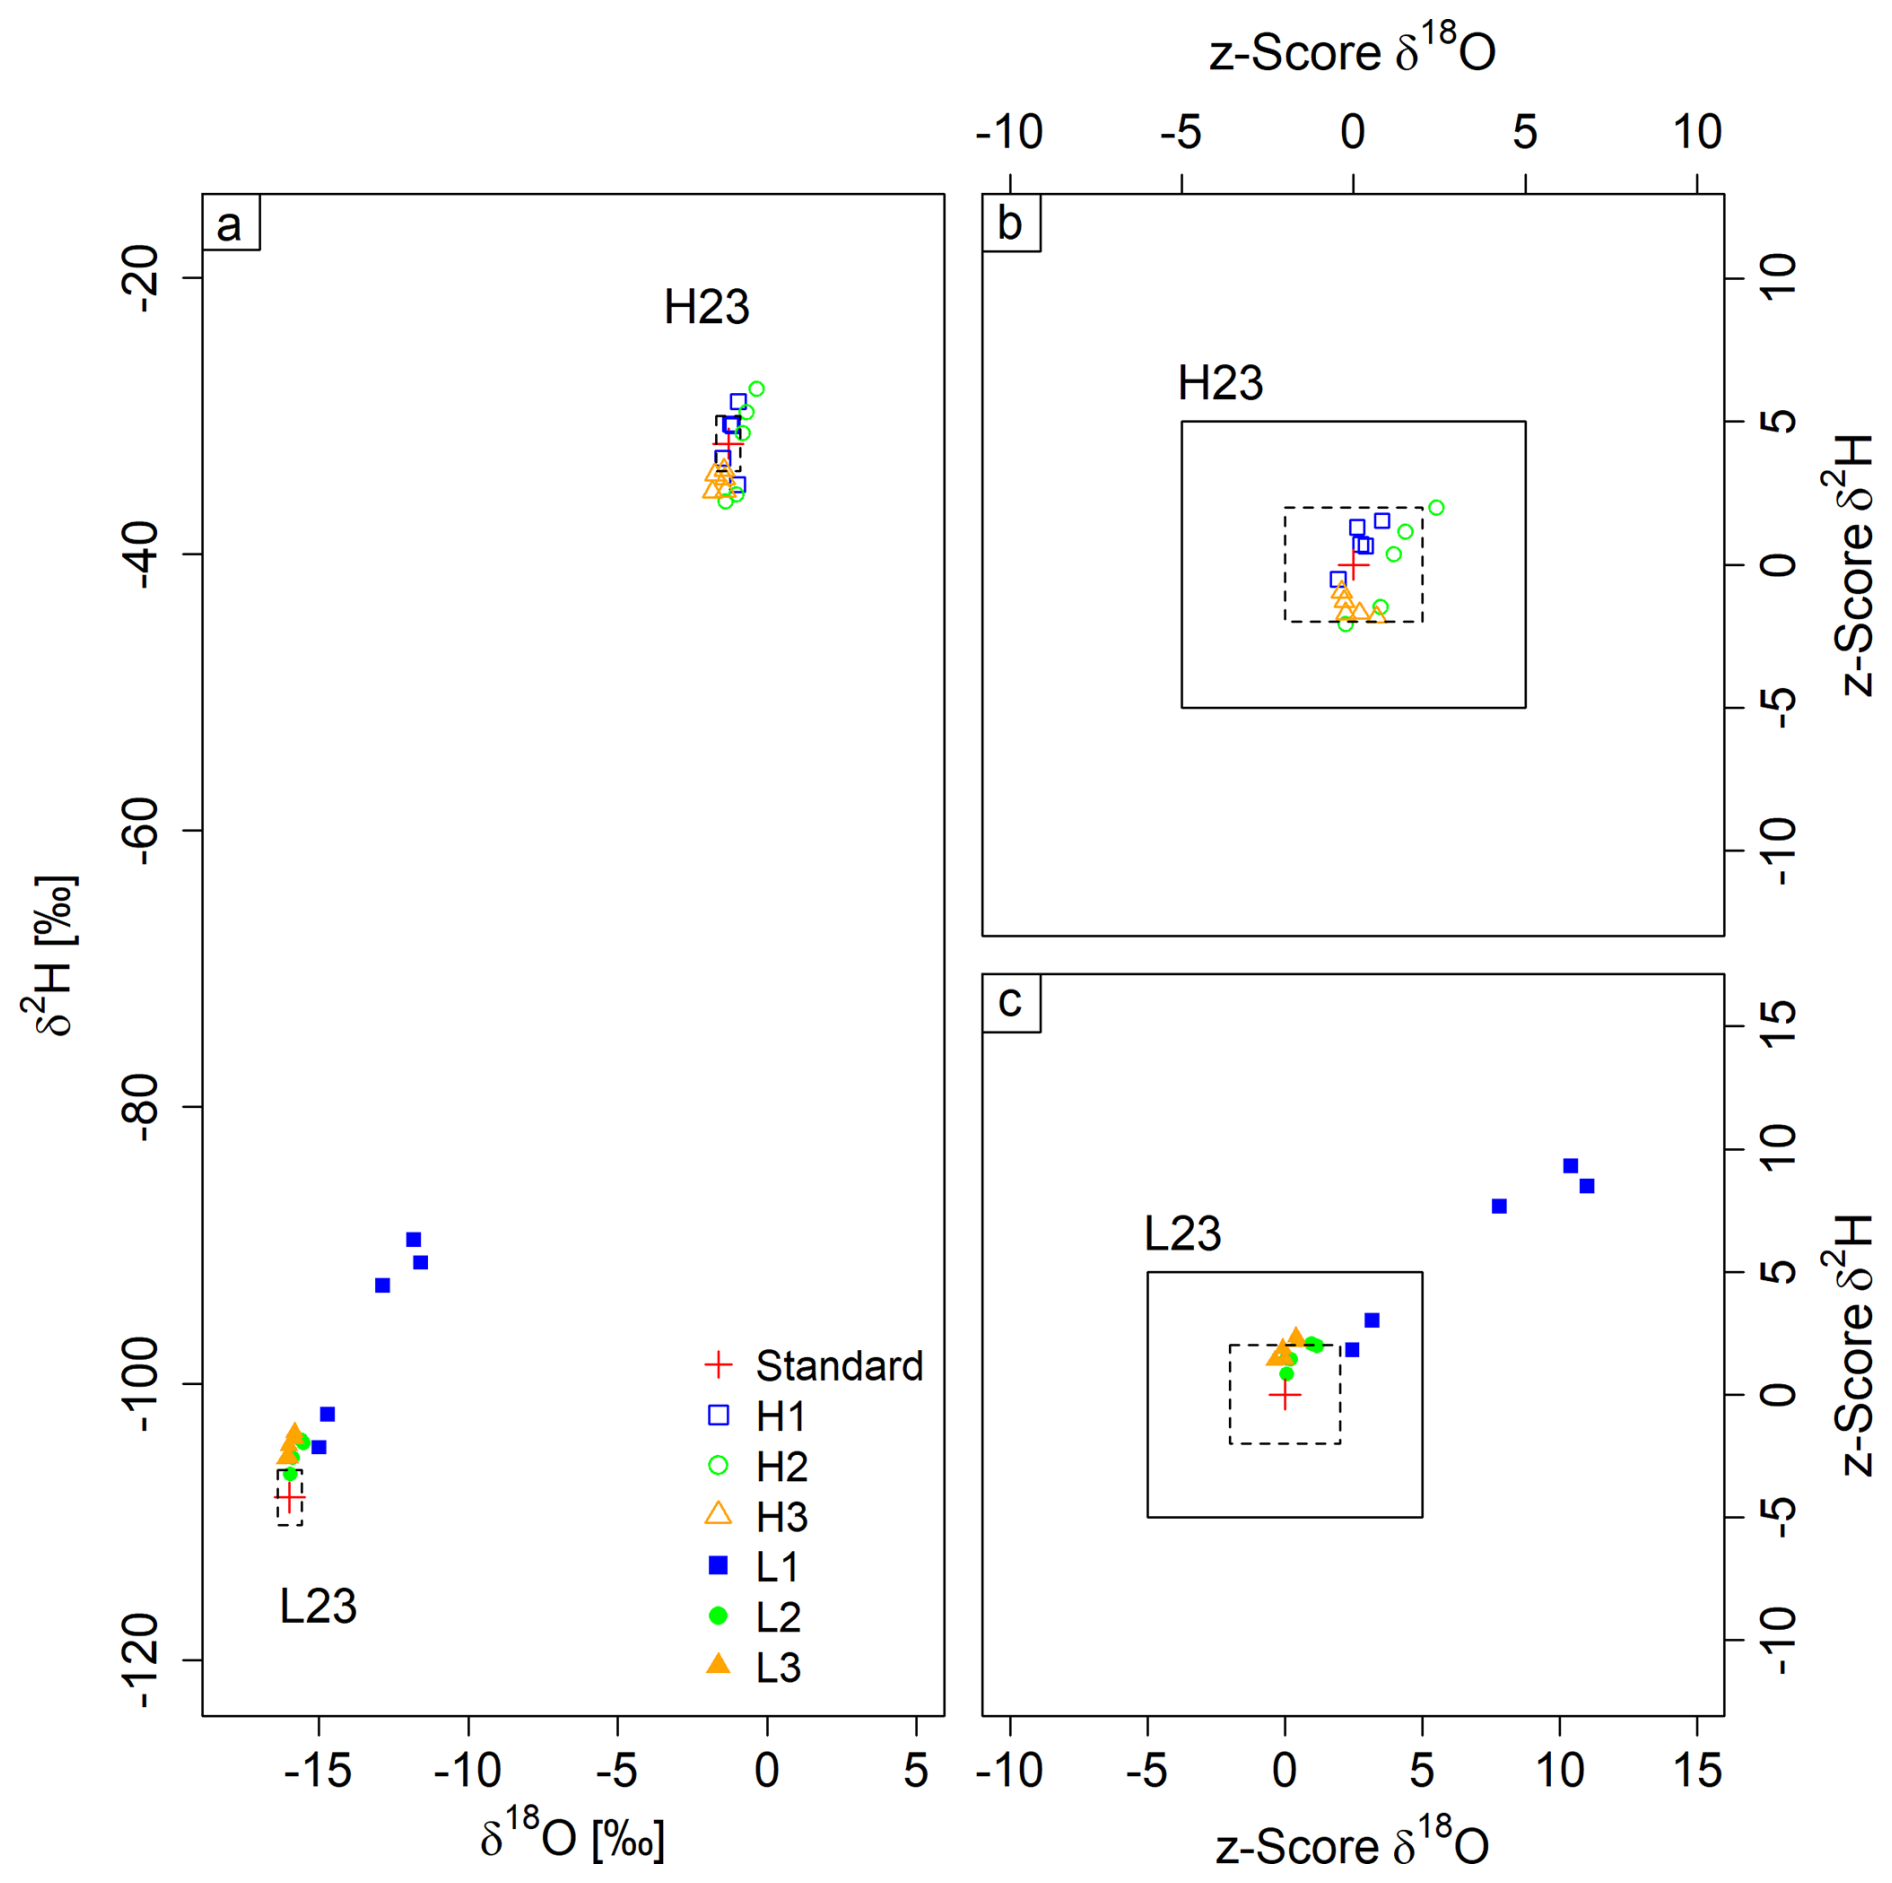
Figure 4Memory experiment results with dual-isotope plot for both experiments (a) and z score plots for L23 to H23 (b) and H23 to L23 (c). The bags were filled first with standard H23, then repeatedly (1–3) with standard L23. The memory effect is evident only for measurement L1, the first to follow the change of source water vapor. The black box denotes the questionable range, while the scatter black box denotes the acceptable range (b, c). The dashed blue lines in (a) denote the defined standard deviation for measurements.
3.3 Experiment III: memory test with storage
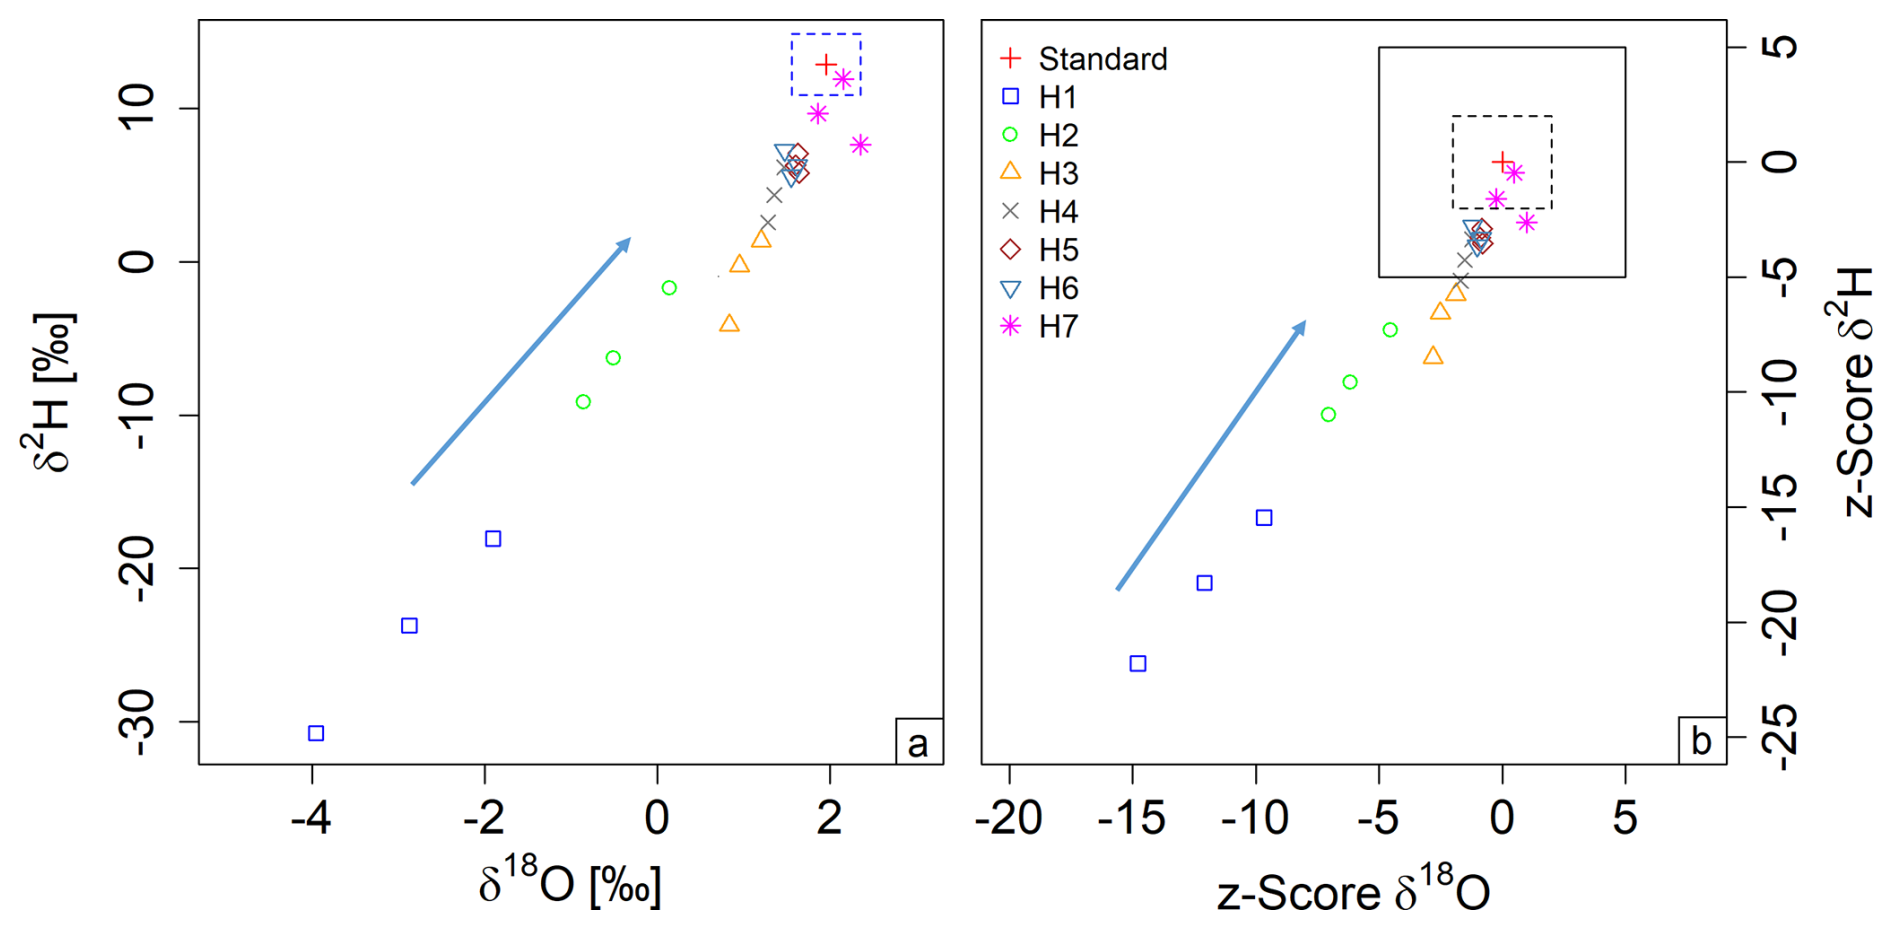
Figure 5Memory test with storage experiment: dual-isotope plot on the left (a) and z score plot on the right (b). The red cross denotes the target standard value. The dashed blue line in (a) denotes the defined standard deviation for measurements. The black box denotes the questionable range, while the dashed black box denotes the acceptable range, based on our classification of z scores (b) (Sect. 2.5). The arrow indicates the direction from strong to weak memory effect.
Table 2Mean differences between measured and known isotopic signatures (S − B; Eq. 4) of the different repetitions of the combined storage and memory experiment.
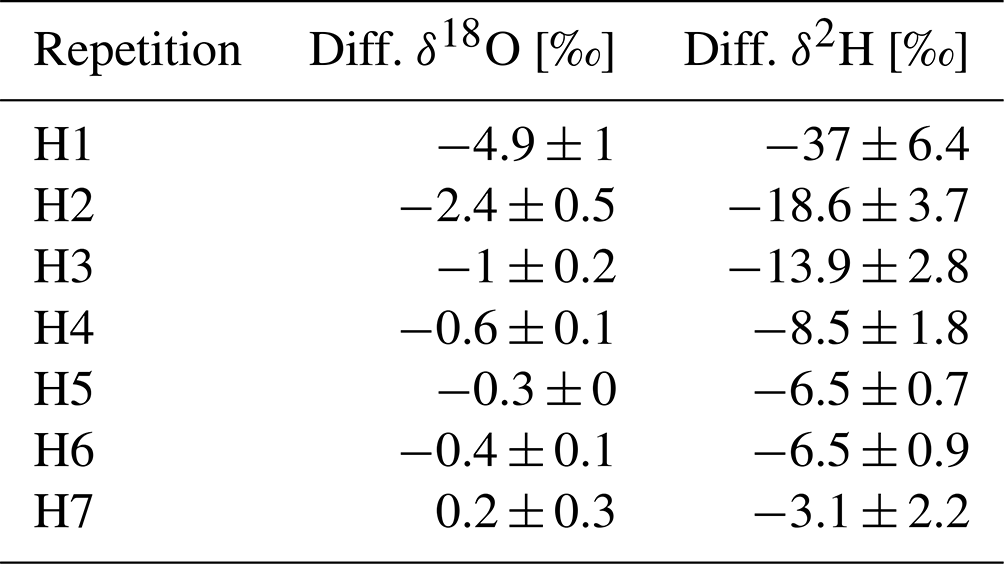
No significant storage effect was observed over the 1 d storage period, and there was no noticeable difference between the two repetitions (mean difference between days: 0.4 ‰ ± 0.4 δ18O and 0.1 ‰ ± 1.9 δ2H). However, when the water source was changed to H22, there was a clear memory effect of a magnitude up to −4.9 ‰ ± 1 in δ18O and −37 ‰ ± 6.4 in δ2H (Fig. 5 and Table 2). After filling with the opposite standard, H22, the first measurements (H1) revealed a low accuracy due to low precision and trueness, which was improved by around 50 % with each repetition until the average result of H7 was close to the target standard value. The z scores followed a similar trend from H1 to H5, gradually decreasing. Although H1 and H2 showed unacceptable z scores for δ18O, and H3 fell within the questionable range, all subsequent measurements had z scores within the acceptable range. The δ2H z scores follow a similar trend to the z scores for δ18O, thus also indicating a clear memory effect. However, this effect persisted for more cycles in the case of δ2H. The measurements H1 to H3 were in the unacceptable range, while the results for H4 to H6 were questionable.
3.4 Experiment IV: field filling and bag reuse
Table 3Mean differences between direct and bag measurement (S − B; Eq. 4) of water-stable isotopes (δ18O and δ2H) and z scores of the different depth during the two field experiments.
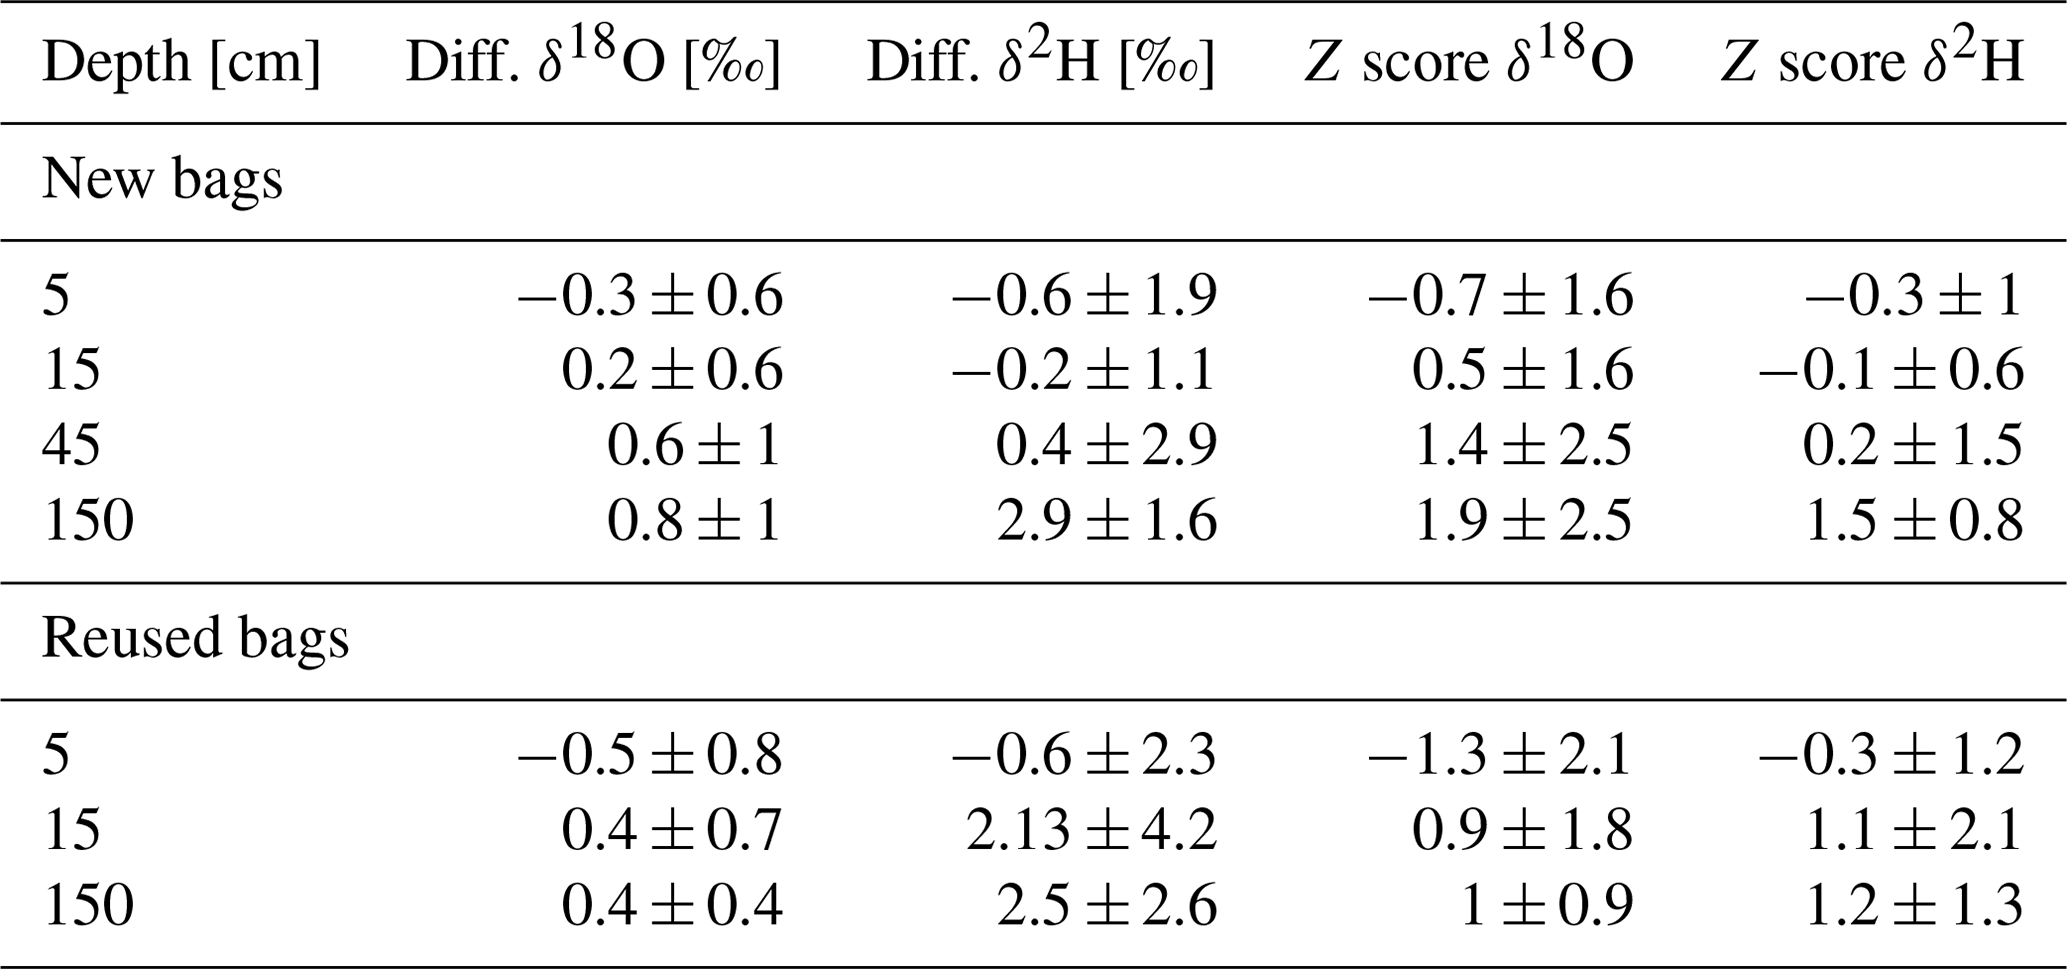
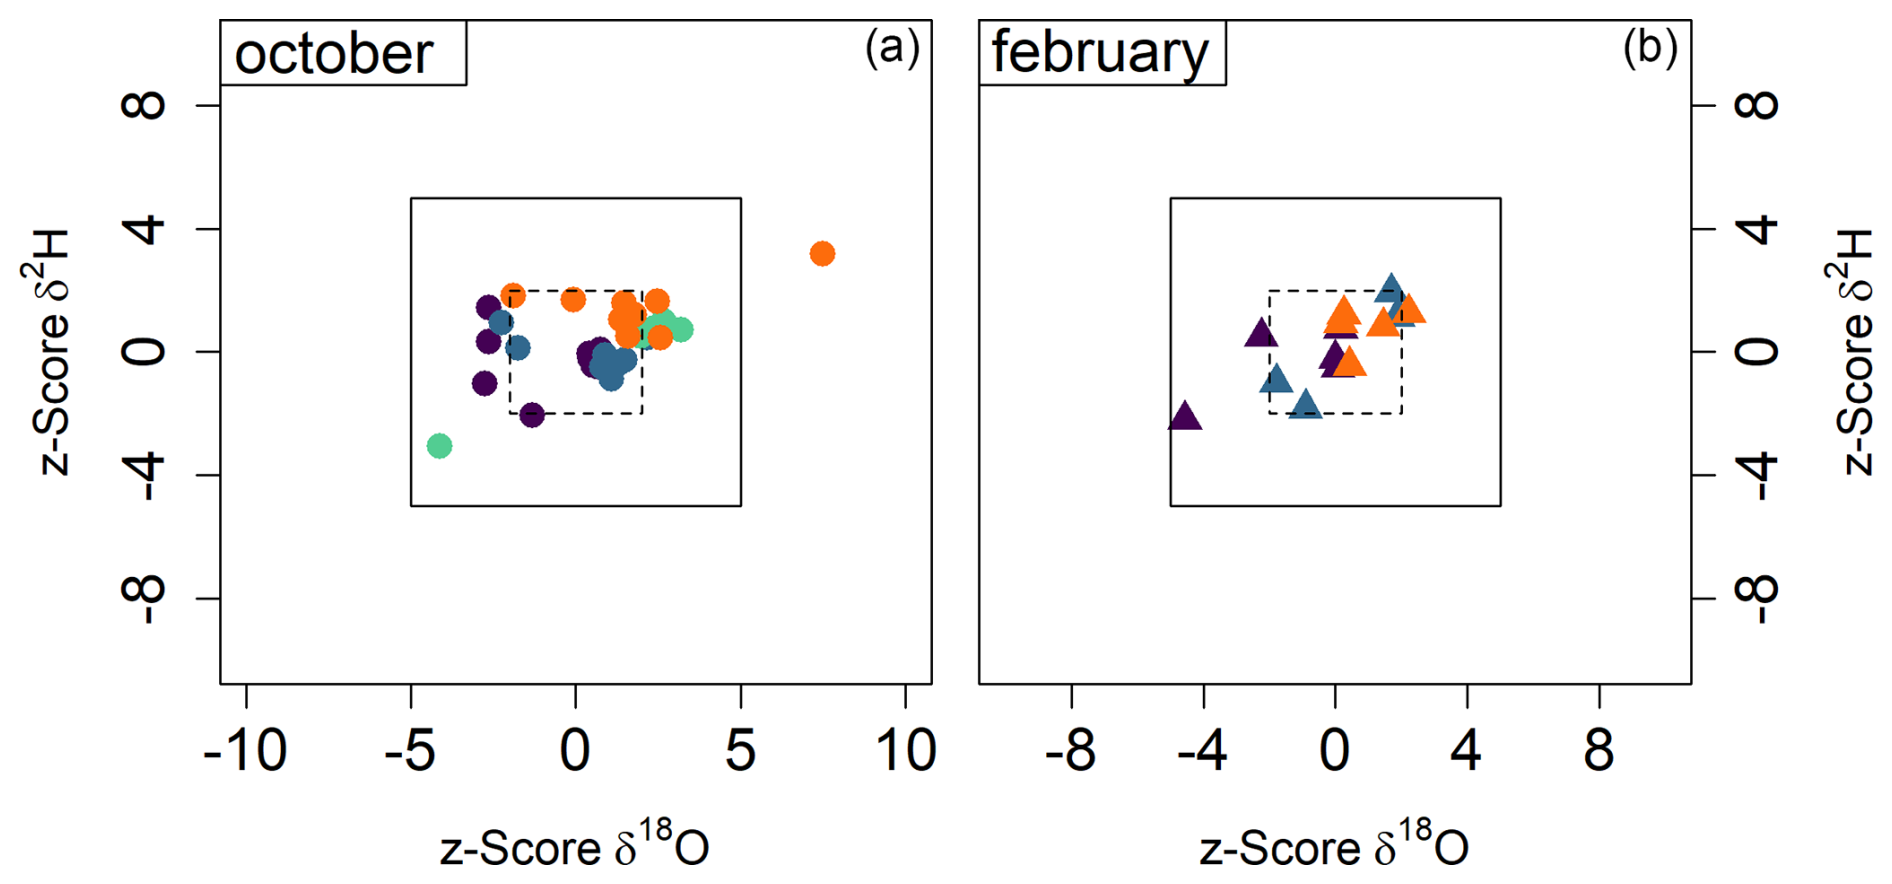
Figure 6(a) In October, in situ CRDS measurements were compared with bag measurements taken and measured directly after filling. (b) In February, in situ CRDS measurements were compared with reused bags measured the next day in the laboratory (after 10 cycles of flushing with dry air).
To compare the measurements during the two campaigns and calculate the z scores (Eq. 4), we considered the measured isotopic value obtained by the CRDS analyzer in the field as the benchmark value (B) and the measurements from the gas bags as the sample (S). The average difference between direct measurement and bag measurement was 0.2 ‰ ± 0.9 for δ18O and 0.7 ‰ ± 2.3 for δ2H during the first sampling campaign in October 2022 and 0.1 ‰ ± 0.8 for δ18O and 1.4 ‰ ± 3.3 for δ2H for the second sampling campaign with reused bags in February 2023 (Fig. 6). The deviation of the bag method from direct in situ measurements was thus mostly within the uncertainty range of the in situ method and yielded highly accurate z scores for δ2H. However, the δ18O z scores exhibit a larger scatter compared to δ2H, consistent with the results of the laboratory storage experiment (Exp. I).
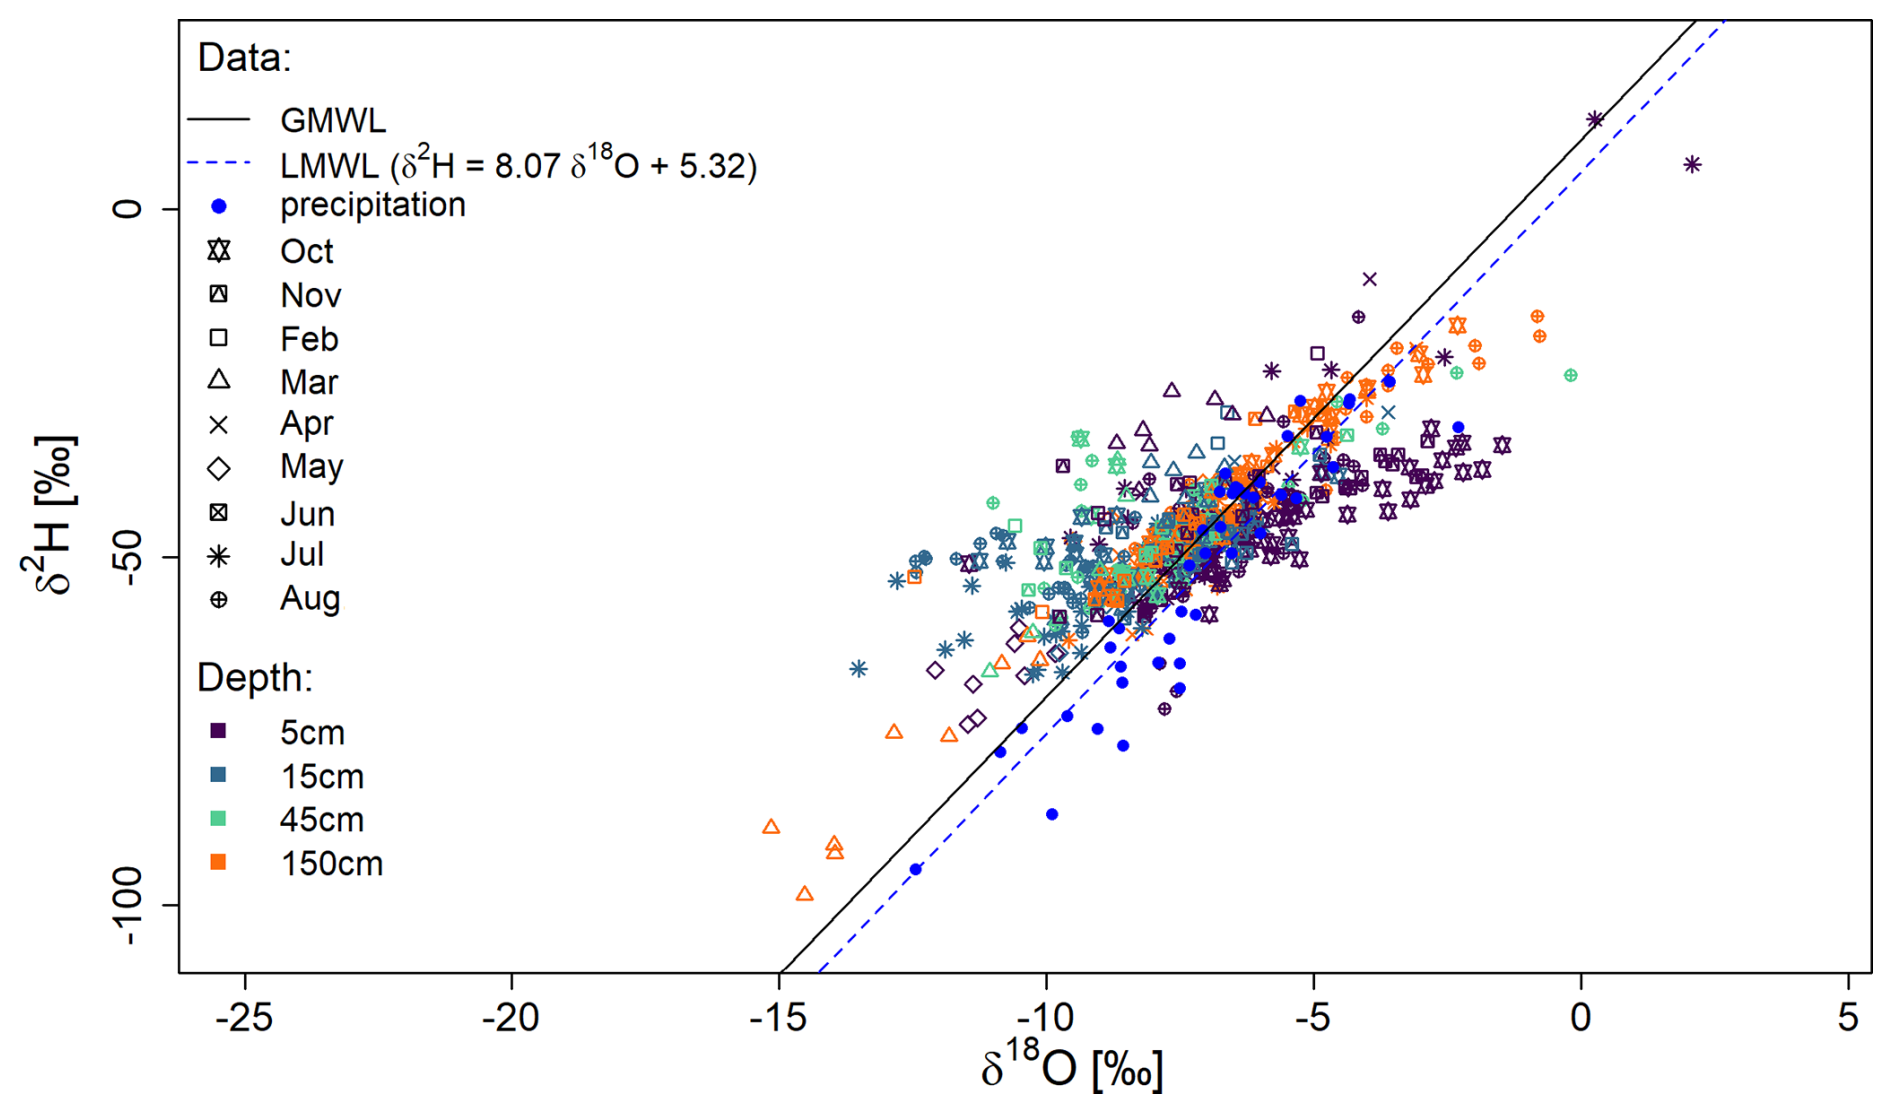
Figure 7The dual-isotope plot shows all 603 measurements taken during the cultivation period, including the global meteoric water line (GMWL; black line), the local meteoric water line (LMWL; dashed blue line) and the bag method measurements at 5, 15, 45 and 150 cm depth (purple, blue, green and yellow) during 9 different months.
3.5 Experiment V: observation over a full cultivation period
Measurements of soil water isotope profiles over the full season (Fig. 7) revealed a wide range of isotopic signatures with 2.1 ‰ to −15.2 ‰ for δ18O and 12.9 ‰ to −98.5 ‰ for δ2H. Of the 623 measurements taken, 20 measurements or 3.2 % had to be discarded due to damaged bags, filling errors, or condensation during the measurement and are therefore not shown (see “Handling Recommendations” in the Supplement for further details). The isotopic signature of precipitation is represented by the local meteoric water line (LMWL), shown here for the period of September 2021 to September 2023. The LMWL is nearly parallel to the global meteoric water line (GMWL). In general, the measurements show isotopic signatures similar to precipitation immediately after rain events and a trend toward evaporative enrichment during droughts (see Fig. S1 in the Supplement) but with distinct differences between months (e.g., March vs. October, at the 5 cm depth). Overall, our findings from the field trial suggest a good agreement with the LMWL and are plausible in terms of seasonal variability.
4.1 Comparison to previous developments to store and measure water vapor
In general, it is difficult to compare the different approaches to water vapor sampling for isotopic analysis because they vary in complexity and application (e.g., storage time or price per sample). However, our results for reused bag samples stored up to 24 h are generally comparable in accuracy to previous studies of water vapor storage. For example, the Soil Water Isotope Storage System (SWISS) introduced by Havranek et al. (2020) showed a higher precision during a 30 d storage period in a laboratory experiment (± 0.5 ‰ δ18O and ± 2.4 ‰ δ2H). This result was followed by several experiments, which showed an actual precision of 0.9 ‰ and 3.7‰ for δ18O and δ2H in field applications with a storage time of 14 d (Havranek et al., 2023). Their system is based on custom-made 750 mL glass vials with stainless steel connections. Magh et al. (2022) developed the vapor storage vial system (VSVS), which is based on crimp neck vials in combination with a PTFE/butyl membrane and has a similar accuracy compared to our results after 1 d of storage but, like the static vials used by Havranek et al. (2020), requires a linear correction. Moreover, although the mean isotopic composition remained the same throughout the measurement, it increasingly led to high scatter of the measured isotopic signatures. Both systems are more difficult to handle during the measurement compared to inflatable bags as they must be filled with the same amount of dry gas mixture during the measurement due to the static volume of the glass vials.
A recent paper compared different types of affordable food storage bags for water vapor sampling using standardized water with different isotopic signatures (Herbstritt et al., 2023). These authors conducted rigorous tests of diffusion tightness and inertness of various bag types. They detected significant memory in all bag types, even after flushing with dry N2. To circumvent these memory effects, they explored preconditioning of the bags with moist, isotopically homogeneous air samples where the goal was not to eliminate the memory effect but to quantify and correct for it. After 1 storage day, the accuracies were 0.25 ‰ ± 0.41 and 0.41 ‰ ± 1.93 for δ18O and δ2H. This preconditioning resembles the pre-treatment of feathers (Hobson, 1999) and hair (Ehleringer et al., 2008) to fill exchange sites with known water vapor prior to analysis, followed by post-processing to remove the pre-treatment effect.
Our study differs from the paper by Herbstritt et al. (2023) in several important ways. First, we have used different bags, which are more expensive but have better control over suppliers and better description of specifications. Second, we have modified the valve inlets to the bags in a way that simplified gas transfers and may reduce leakage. Third, we have suggested a means by which multiple flushes of the bags with dry air may eliminate, or at least minimize, the memory effect. Aside from the differences, we likewise identified a time-dependent memory effect, which is consistent with the notion that some diffusion/adsorption process occurs over many hours within the walls of the bag, setting an isotopic signal that requires multiple flushes to remove. This time-dependent process does not seem to require slow flushing to reverse the memory effect (Exp. IV). These results call for the automation of bag flushing protocols in order to make these techniques routinely useful. Since the isotopic range in the experiment was relatively narrow (< 20 ‰ for δ2H between first and second sampling), we additionally performed a small reuse experiment using two laboratory standards with higher differences in isotopic signatures and 10 flushes with dry air (Fig. S2). As expected, results were unaffected for both δ18O and δ2H directly after bag filling. While storage did not influence the δ18O signature, a clear but consistent effect was visible after 1 d regarding δ2H, which, contrary to the results of Herbstritt et al. (2023), did not increase over 3 d storage. Since this effect was stable and we know the previous sample signature, this effect may be correctable as in the moist conditioning approach described by Herbstritt et al. (2023) or erasable by increasing the number of flushes. In conclusion, our results show comparable accuracy to other methods for storage times of up to 24 h, but the accuracy of long-term storage and high isotopic differences for consecutive samples requires further investigation.
To the best of our knowledge, a campaign of measuring soil water isotopes using gas bags over an entire cultivation period, as shown in this study, has not been done before. However, such studies have been done with other data collection techniques. For example, the isotopic composition of water in surface soils can change significantly as evaporated soil vapor is depleted in heavy isotopes, leaving the remaining soil water enriched in 18O and 2H (Dubbert and Werner, 2018). This results in a wide range of isotopic signatures throughout the complete cultivation season, as can be seen in the smaller slope compared to the LMWL in the upper soil layer (Fig. 7). As expected, evaporative enrichment is evident following precipitation free periods in the upper 5 cm depth (e.g., April period in Fig. S1) but not after the rainy winter period. In contrast, there are only slight trends in evaporative enrichment at lower depths (compare e.g., Sprenger et al., 2016).
4.2 Limitations, future perspective, and cost classification
In the past, destructive measurements of soil water have relied predominantly on cryogenic vacuum extraction (CVE). The accuracy of CVE can vary greatly for soil samples and is associated with co-extraction of organic compounds, significantly interfering with the isotopic quantification using CRDS (Orlowski et al., 2016b). In comparison, methods using in situ soil or xylem probes based on gas-permeable membranes have been reported to be highly accurate but complex to handle and set up (Volkmann and Weiler, 2014; Volkmann et al., 2016; Rothfuss et al., 2013; Kübert et al., 2020). Therefore, efforts to combine destructive with in situ sampling continue.
As highlighted above, recent studies showed that sampling of water vapor with subsequent analysis in the laboratory is possible with both glass bottles and different types of bags. Glass containers revealed the advantage of fewer material effects and higher diffusion tightness, while gas bags were easier to measure due to their flexible structure. Nevertheless, further experiments should investigate the detected interaction of water samples within the gas bag wall. For example, while the storage experiment I results for δ2H were mostly accurate, we observed higher uncertainty for δ18O. Here, the light standard proved to be slightly more difficult to handle than the medium standard, while maintaining similar accuracy. At first glance, this decrease in accuracy seems to be similar for experiment II (higher uncertainty of light compared to heavy standard). In this experiment, a memory effect was expected given that the previous sample was not removed between standard fillings. However, when the initial standard was stored only briefly (minutes) before refilling with the opposite standard, as planned in experiment II, no clear memory effect was observed. The three measurements yielding unacceptable values were accidentally stored longer (45 min between filling and measurement; see blue squares in Fig. 4), providing valuable insight into a memory effect dependent on storage duration of the initial standard. Nevertheless, further studies should focus on whether samples with isotopically lighter signatures or isotopic signatures outside of the range tested in this study vary in accuracy when sampled and analyzed with the bag method. Based on our observations in experiment II, experiment III deliberately combined memory with storage, resulting in a clear memory effect in the direction of the initial standard after 1 d of storage for bags that were not subjected to a flushing procedure (such as that described in Herbstritt et al., 2023) before changing from one to the other standard. The observed number of refills required in this experiment with the standard H22 after an initial fill with L22 to eliminate this effect was used to guide our bag preparation strategy for bag reuse in the following experiment IV. Unlike experiments I and II, this experiment tested only the direction from light to heavy isotopes. Given the remaining uncertainty from experiments I and II concerning our light standard performance, this should be revisited in future studies to test whether or not the combined effect of memory and storage is stable over the desired isotope range. Finally, our reuse experiment (IV) showed similar results to experiment I. Here, we proved that a preconditioning of 10 dry-air flushes between two bag sampling campaigns worked for differences of up to 20 ‰ in δ2H for consecutive samples, while a much higher difference of 76.2 ‰ revealed a memory effect of about 12 ‰ after 1 and 3 d of storage for δ2H but not for δ18O (experiment S2). These results clearly show that the method provided good results for our isotopic range in the field but that further tests are required for experiments with a larger range of isotope signatures, particularly when considering use of this method for labeling experiments. However, it should be noted that bags have never been tested for reuse with such high isotopic differences, and some increase in uncertainty is to be expected due to the small but present water transmission through the material. Considering this, the glass container used in other methods may be superior for longer storage times, although, e.g., Magh et al. (2022) also recommended their method for storage times of less than 3 d.
The cost of the commercial gas bags we used was relatively low compared to the total cost of a typical field campaign. In perspective, SWISS was clearly more expensive when considering costs per container, while the other methods were less expensive per sample container with EUR 1–2 but produced running cost (Magh et al., 2022) or additional cost and effort to attach the valve and build the final bag (Herbstritt et al., 2023). We have demonstrated that commercially available bags meet the expected level of performance already, provided that samples are stored up to 24 h; they are flushed multiple times between uses; they are reused for a relatively narrow range of isotopic signatures (in the case of δ2H), e.g., reusing the same bags for the same sample probes; and standards are taken through the whole sample collection, transport, and analysis process. Following the conditions described, we were able to reliably measure soil water over a full cultivation period under natural abundance conditions.
Our laboratory and field experiments have confirmed the reliability of soil membranes combined with gas bags for in situ soil water vapor sampling and subsequent water-stable isotope analyses, provided the analysis occurs within 24 h. The method is cost-efficient and easy to handle, allowing for many future applications. We were able to demonstrate that both (1) storage is possible and (2) memory effects caused by previous samples can be prevented by appropriate preconditioning, allowing the gas bags to be reused. Regarding the isotopic signature during the experiment, reuse is easier to carry out with smaller differences between the consecutive samples in the bags. However, for larger differences in isotopic signatures, the bags need to be handled differently, which needs to be further investigated (e.g., better flushing between samples or no reuse). Through the field experiment (two campaigns with CRDS and bag measurements), we were able to show that the bags could be used in our case with accuracies of 0.23 ‰ ± 0.84 δ18O and 0.94 ‰ ± 2.69 δ2H for storage up to 24 h. The possibility to collect and store samples easily and without permanent power supply extends the usability of water-stable isotope measurements in the field.
The data are available in the BonaRes repository https://doi.org/10.4228/ZALF-37KW-R966 (Dahlmann et al., 2025).
The supplement related to this article is available online at https://doi.org/10.5194/amt-18-2607-2025-supplement.
AD and MD designed the study. AD conducted experiments and analyzed the data. JM, DD, and MH provided support for the experimental setup and analysis methods. AD prepared the paper with supervision from MD and contributions from all co-authors.
The contact author has declared that none of the authors has any competing interests.
Publisher's note: Copernicus Publications remains neutral with regard to jurisdictional claims made in the text, published maps, institutional affiliations, or any other geographical representation in this paper. While Copernicus Publications makes every effort to include appropriate place names, the final responsibility lies with the authors.
The authors wish to acknowledge the Experimental Infrastructure Platform (EIP) of ZALF and Linda Röderer for assisting with the field experiments.
This research has been supported by the Leibniz Centre for Agricultural Landscape Research (ZALF) as well as the Leibniz Association (ISO-SCALE project; grant no. K444/2022).
This paper was edited by Christof Janssen and reviewed by two anonymous referees.
Craig, H.: Standard for Reporting Concentrations of Deuterium and Oxygen-18 in Natural Waters, Science, 133, 1833–1834, https://doi.org/10.1126/science.133.3467.1833, 1961.
Dahlmann, A., Hoffmann, M., Verch, G., Schmidt, M., Sommer, M., Augustin, J., and Dubbert, M.: Benefits of a robotic chamber system for determining evapotranspiration in an erosion-affected, heterogeneous cropland, Hydrol. Earth Syst. Sci., 27, 3851–3873, https://doi.org/10.5194/hess-27-3851-2023, 2023.
Dahlmann, A., Marshall, J. D., Dubbert, D., Hoffmann, M., and Dubbert, M.: Presentation and explanation of the experiments for simple water vapor sampling for stable isotope analysis using affordable valves and bags, BonaRes Data Centre [data set], https://doi.org/10.4228/ZALF-37KW-R966, 2025.
Dubbert, M. and Werner, C.: Water fluxes mediated by vegetation: emerging isotopic insights at the soil and atmosphere interfaces, New Phytol., 221, 1754–1763, https://doi.org/10.1111/nph.15547, 2018.
Ehleringer, J. R., Bowen, G. J., Chesson, L. A., West, A. G., Podlesak, D. W., and Cerling, T. E.: Hydrogen and oxygen isotope ratios in human hair are related to geography, P. Natl. Acad. Sci.-Biol, 105, 2788–279, https://doi.org/10.1073/pnas.0712228105, 2008.
Gat, J. R.: Oxygen and hydrogen isotopes in the hydrologic cycle, Annu. Rev. Earth Pl. Sc., 24, 225–262, https://doi.org/10.1146/annurev.earth.24.1.225, 1996.
Havranek, R. E., Snell, K. E., Davidheiser-Kroll, B., Bowen, G. J., and Vaughn, B.: The Soil Water Isotope Storage System (SWISS): An integrated soil water vapor sampling and multiport storage system for stable isotope geochemistry, Rapid Commun. Mass. Sp., 34, e8783, https://doi.org/10.1002/rcm.8783, 2020.
Havranek, R. E., Snell, K., Kopf, S., Davidheiser-Kroll, B., Morris, V., and Vaughn, B.: Technical note: Lessons from and best practices for the deployment of the Soil Water Isotope Storage System, Hydrol. Earth Syst. Sci., 27, 2951–2971, https://doi.org/10.5194/hess-27-2951-2023, 2023.
Herbstritt, B., Gralher, B., Seeger, S., Rinderer, M., and Weiler, M.: Technical note: Discrete in situ vapor sampling for subsequent lab-based water stable isotope analysis, Hydrol. Earth Syst. Sci., 27, 3701–3718, https://doi.org/10.5194/hess-27-3701-2023, 2023.
Hobson, K. A.: Tracing origins and migration of wildlife using stable isotopes: a review, Oecologia, 120, 314–326, https://doi.org/10.1007/s004420050865, 1999.
Horita, J. and Wesolowski, D. J.: Liquid-vapor fractionation of oxygen and hydrogen isotopes of water from the freezing to the critical temperature, Geochim. Cosmochim. Ac., 58, 3425–3437, https://doi.org/10.1016/0016-7037(94)90096-5, 1994.
Kübert, A., Paulus, S., Dahlmann, A., Werner, C., Rothfuss, Y., Orlowski, N., and Dubbert, M.: Water stable isotopes in ecohydrological field research: comparison between in situ and destructive monitoring methods to determine soil water isotopic signatures, Front. Plant. Sci., 11, 497124, https://doi.org/10.3389/fpls.2020.00387, 2020.
Kühnhammer, K., Dahlmann, A., Iraheta, A., Gerchow, M., Birkel, C., Marshall, J. D., and Beyer, M.: Continuous in situ measurements of water stable isotopes in soils, tree trunk and root xylem: Field approval, Rapid Commun. Mass. Sp., 36, e9232, https://doi.org/10.1002/rcm.9232, 2021.
Kühnhammer, K., van Haren, J., Kübert, A., Bailey, K., Dubbert, M., Hu, J., Ladd, N. S., Meridith, L. K., Werner, C., and Beyer, M.: Deep roots mitigate drought impacts on tropical trees despite limited quantitative contribution to transpiration, Sci. Total Environ., 893, 164763, https://doi.org/10.1016/j.scitotenv.2023.164763, 2023.
Landgraf, J., Tetzlaff, D., Dubbert, M., Dubbert, D., Smith, A., and Soulsby, C.: Xylem water in riparian willow trees (Salix alba) reveals shallow sources of root water uptake by in situ monitoring of stable water isotopes, Hydrol. Earth Syst. Sci., 26, 2073–2092, https://doi.org/10.5194/hess-26-2073-2022, 2022.
Magh, R.-K., Gralher, B., Herbstritt, B., Kübert, A., Lim, H., Lundmark, T., and Marshall, J.: Technical note: Conservative storage of water vapour – practical in situ sampling of stable isotopes in tree stems, Hydrol. Earth Syst. Sci., 26, 3573–3587, https://doi.org/10.5194/hess-26-3573-2022, 2022.
Majoube, M.: Fractionnement en oxygene 18 et en deuterium entre l'eau et sa vapeur, J. Chim. Phys., 68, 1423–1436, https://doi.org/10.1051/jcp/1971681423, 1971.
Mook, W. G. (Eds.): Environmental isotopes in the hydrological cycle: principles and applications. UNESCO/IAEA, Volume 1, Centre for Isotope Research, Groningen, Netherlands, 280 pp., https://www.hydrology.nl/images/docs/ihp/Mook_III.pdf (last access: 12 March 2024), 2000.
Orlowski, N., Pratt, D. L., and McDonnell, J. J.: Intercomparison of soil pore water extraction methods for stable isotope analysis, Hydrol. Process., 30, 3434–3449, https://doi.org/10.1002/hyp.10870, 2016a.
Orlowski, N., Breuer, L., and Mcdonnell, J. J.: Critical issues with cryogenic extraction of soil water for stable isotope analysis, Ecohydrology, 9, 3–10, https://doi.org/10.1002/eco.1722, 2016b.
Rothfuss, Y., Biron, P., Braud, I., Canale, L., Durand, J. L., Gaudet, J. P., Richard, P., Vauclin, M., and Bariac, T.: Partitioning evapotranspiration fluxes into soil evaporation and plant transpiration using water stable isotopes under controlled conditions, Hydrol. Process., 24, 3177–3194, https://doi.org/10.1002/hyp.7743, 2010.
Rothfuss, Y., Vereecken, H., and Brüggemann, N.: Monitoring water stable isotopic composition in soils using gas-permeable tubing and infrared laser absorption spectroscopy, Water Resour. Res., 49, 3747–3755, https://doi.org/10.1002/wrcr.20311, 2013.
Séraphin, P., Vallet-Coulomb, C., and Gonçalvès, J.: Partitioning groundwater recharge between rainfall infiltration and irrigation return flow using stable isotopes: The Crau aquifer, J. Hydrol., 542, 241–253, https://doi.org/10.1016/j.jhydrol.2016.09.005, 2016.
Sodemann, H. (Eds.): Tropospheric transport of water vapour: Lagrangian and Eulerian perspectives, Swiss, ETH Zurich, No. 16623, 225 pp., ISBN 978-3832513849, 2006.
Sprenger, M., Herbstritt, B., and Weiler, M.: Established methods and new opportunities for pore water stable isotope analysis, Hydrol. Process., 29, 5174–5192, https://doi.org/10.1002/hyp.10643, 2015.
Sprenger, M., Leistert, H., Gimbel, K., and Weiler, M.: Illuminating hydrological processes at the soil-vegetation-atmosphere interface with water stable isotopes, Rev. Geophys., 54, 674–704, https://doi.org/10.1002/2015RG000515, 2016.
Volkmann, T. H., Haberer, K., Gessler, A., and Weiler, M.: High-resolution isotope measurements resolve rapid ecohydrological dynamics at the soil–plant interface, New Phytol., 210, 839–849, https://doi.org/10.1111/nph.13868, 2016.
Volkmann, T. H. M. and Weiler, M.: Continual in situ monitoring of pore water stable isotopes in the subsurface, Hydrol. Earth Syst. Sci., 18, 1819–1833, https://doi.org/10.5194/hess-18-1819-2014, 2014.
Wassenaar, L. I., Ahmad, M., Aggarwal, P., Van Duren, M., Pöltenstein, L., Araguas, L., and Kurttas, T.: Worldwide proficiency test for routine analysis of δ2H and δ18O in water by isotope-ratio mass spectrometry and laser absorption spectroscopy, Rapid Commun. Mass Sp., 26, 1641–1648, https://doi.org/10.1002/rcm.6270, 2012.
West, A. G., Patrickson, S. J., and Ehleringer, J. R.: Water extraction times for plant and soil materials used in stable isotope analysis, Rapid Commun. Mass Sp., 20, 1317–1321, https://doi.org/10.1002/rcm.2456, 2006.