the Creative Commons Attribution 4.0 License.
the Creative Commons Attribution 4.0 License.
 | 01 Jul 2025
In situ volcanic ash sampling and aerosol–gas analysis based on UAS technologies (AeroVolc)
Gholamhossein Bagheri
Przemyslaw M. Kornatowski
Allan Fries
Jonathan Lemus
Riccardo Simionato
Carolina Díaz-Vecino
Eduardo Rossi
Taishi Yamada
Simona Scollo
Costanza Bonadonna
Volcanic degassing and explosive eruptions inject significant amounts of gas and ash into the atmosphere, impacting the local environment and atmospheric dynamics from local to global scales. While ground- and satellite-based remote-sensing systems are key to describing explosive volcanism and assessing associated hazards, direct in situ measurements inside volcanic clouds are not possible with these methods. This study presents an innovative approach using an unoccupied aircraft system (UAS) for (i) airborne ash sampling and (ii) measurements of aerosol and gas concentrations (AeroVolc system). Commercial instruments (DJI™ Matrice 30 UAV, Alphasense™ N3 optical particle counter, and Soarability™ Sniffer4D Mini2 multigas hardware) were combined with custom-built ash collectors and particle counters to enable a more detailed analysis of volcanic clouds. Here, we showcase the deployment of our UAS on Sakurajima (Japan) and Etna (Italy), two volcanoes known for their frequent explosive eruptions and persistent degassing activity, to demonstrate how this approach enables in situ, high-resolution sample and data collection within challenging environments. Results provide grain size distributions (GSDs), information on the occurrence of particle aggregation, and solid aerosol (PM1, PM2.5, and PM10, corresponding to solid aerosol particles with a diameter of less than 1, 2.5, and 10 µm, respectively) and gas (SO2 and CO2) concentrations. Depending on whether the UAS was operated within or below ash- and/or gas-rich clouds, different insights were gained that open up new perspectives for volcanological research. These insights include the composition, concentration, generation, dispersion, and sedimentation patterns of volcanic clouds.
- Article
(15428 KB) - Full-text XML
-
Supplement
(126561 KB) - BibTeX
- EndNote


The direct observation of natural processes is a cornerstone of scientific inquiry, providing invaluable insights into process dynamics (e.g., Lenton, 2016; Paredes-Mariño et al., 2022; Singh, 2024). However, this task becomes complex when the processes under study occur in remote and/or hazardous environments. This complexity arises from multiple factors, including the inaccessibility of studied locations, the dynamic and often unpredictable nature of the studied processes, and the potential risks to researchers and equipment. These challenges necessitate the development and deployment of advanced observational technologies and methodologies, such as remote-sensing, autonomous, and robust systems and remotely piloted vehicles (see Bellingham and Rajan, 2007; Watts et al., 2012; Giordan et al., 2018, for reviews, classifications, and general considerations regarding the use of remote systems in science). For instance, unoccupied aircraft systems (UASs), which include unoccupied aircraft vehicles (UAVs, sometimes also called drones or remotely piloted aerial systems – RPASs) and associated equipment (i.e., embedded and payload instruments) are used for the potential analysis of flood inundation, flood monitoring, and post-flood changes (e.g., Costa et al., 2016; Le Coz et al., 2016; Izumida et al., 2017); for wildfire monitoring (e.g., Martínez-de Dios et al., 2011; Tang and Shao, 2015; Allison et al., 2016); for landslide recognition, monitoring, and hazard assessment (e.g., Giordan et al., 2015; Liu et al., 2015; Lindner et al., 2016); and for early impact assessment of earthquakes and building damage assessment (e.g., Boccardo et al., 2015; Fernandez Galarreta et al., 2015; Hirose et al., 2015).
Recent volcanic studies have also made use of UASs to obtain unprecedented access to remote and/or hazardous volcanic environments, thereby improving our understanding of volcano-related processes (see Jordan, 2019; Antoine et al., 2020; James et al., 2020, for reviews, classifications, and general considerations regarding the use of UASs in volcanology). More specifically, UASs are used for imaging, georeferencing, and photogrammetric surveys using visible-wavelength, thermal, and multispectral cameras (e.g., Zorn et al., 2019; Thivet et al., 2020a; Civico et al., 2021); for geophysical surveys using magnetic, gravity, and infrasound sensors (e.g., Gailler et al., 2021; Koyama et al., 2021; Iezzi et al., 2023); as platforms for sensor deployment in the field (e.g., Schmid et al., 2023); and for in situ measurement and sampling missions using multigas and particle sensors and various types of collectors (e.g., Liu et al., 2019; Schellenberg et al., 2019; Sibaja-Brenes et al., 2023). Employing UASs has been also proven to be an invaluable tool for assessing volcanic hazards, conducting multidisciplinary volcano monitoring, and responding to volcanic crises (e.g., Neal et al., 2019; Gailler et al., 2022; Román et al., 2022).
Among the many phenomena associated with volcanic activity, ash (i.e., pyroclastic particles measuring less than 2 mm in diameter) and gas (e.g., water vapor, H2O; sulfur dioxide, SO2; and carbon dioxide, CO2) emissions represent significant hazards during volcanic unrest and eruptions. These emissions usually form plumes (i.e., vertical buoyant columns of ash and gas rising from the volcanic vents) and clouds (i.e., horizontal currents of ash and gas moving in the atmosphere due to density contrasts and/or winds) of various sizes, concentrations, and lifetimes (e.g., Delmelle, 2003; Jenkins et al., 2015; Bonadonna et al., 2021). The intricate interplay between volcanic ash, gas emissions, and the atmosphere represents a complex challenge, necessitating innovative and complementary approaches for comprehensive investigation. Ground-based sampling, analysis of deposits and gas (e.g., Marchetti et al., 2022; Thivet et al., 2022; Pering et al., 2024), and ground- and satellite-based remote-sensing approaches (e.g., Marzano et al., 2013; Thivet et al., 2021; Guéhenneux and Gouhier, 2024) are crucial to characterize eruptive and degassing processes, but they miss what is dynamically occurring inside volcanic plumes and clouds. In parallel, numerical models have been developed to allow better anticipation and mitigation of the impacts of such natural events (see Folch, 2012; Costa et al., 2016; Suzuki et al., 2016, for reviews). However, some local key parameters and mechanisms occurring at smaller scales (e.g., in situ grain size distribution, GSD; particle aggregation; settling-driven gravitational instabilities, SDGIs; and local gas fluctuations) cannot be fully studied with these methods and need to be investigated using dedicated numerical or analog experiments (e.g., Fries et al., 2021; Lemus et al., 2021; Diaz-Vecino et al., 2023).
To contribute to the understanding of volcanic clouds, this paper presents an innovative use of a UAS specifically tailored for the in situ sampling of volcanic ash and measurements of key atmospheric parameters – especially SO2; CO2; particulate matter 1, 2.5, and 10 (PM1, PM2.5, and PM10, corresponding to solid aerosol particles with a diameter of less than 1, 2.5, and 10 µm, respectively); pressure (P); temperature (T); and relative humidity (RH) – inside or below these clouds, in a fully controlled manner and with high spatial and temporal resolutions. These key measurements are usually performed at ground level or in piloted aircraft far from the sources (e.g., Eliasson et al., 2016; Fries et al., 2023; Pering et al., 2024). Airborne ash sampling has also been tested, although without any spatial or temporal control (only using sticky tape on the UAV hull; see Mori et al., 2016) or with collectors directly exposed to the airflow of a fixed-wing UAV (which precludes the possibility of ash fallout sampling; see Schellenberg et al., 2019). PM measurements (Sasaki et al., 2021) and gas sampling (Wood et al., 2020; Shingubara et al., 2021) have also been carried out by UASs, although never coupled with controlled particle sampling that could help characterize the measured sample. The technologies described hereafter are meant to encompass the aspects described above and are meticulously engineered to withstand the harsh conditions encountered in hazardous volcanic environments (i.e., high PM and gas concentrations) and unpredictable weather patterns (i.e., sudden changes in P, T, and RH).
To demonstrate the feasibility of this approach, we present results from two campaigns conducted at Sakurajima volcano (Japan) in November 2023 and at Etna volcano (Italy) in July 2024; both of these locations are known for their frequent explosive and degassing activities (Scollo et al., 2014; Poulidis et al., 2018; Iguchi et al., 2022). Through a series of UAV flights adapted to both the environmental conditions and the instruments, we demonstrate the capability of the presented UAS to efficiently perform ash sampling and high-resolution data acquisition in challenging environments. Finally, we propose several perspectives on using and integrating these UAS technologies to study the processes involved in volcanic plume generation as well as the volcanic cloud composition, concentration, dispersion, and sedimentation.
2.1 Unoccupied aircraft vehicle (UAV)
The DJI™ Matrice 30 (Fig. 1) was selected as the operated UAV to ensure optimal performance and reliability in challenging volcanic environments based on various considerations, which are described hereafter. Note that a full description of the UAV is available from the manufacturer (https://enterprise.dji.com/matrice-30, last access: 20 June 2025). It should also be noted that all equipment described in this study (included batteries) can be transported by airplane.
Volcanic environments are notorious for their abrasive nature, especially because airborne volcanic ash poses a significant threat to the integrity of UAS components (Brosch, 2022). Weather conditions, especially relative humidity, the occurrence of rainfall, and wind, can also be a limitation with respect to the UAV operational capacity (Gao et al., 2021). An important consideration in selecting this UAV is its excellent dust- and waterproof design, reaching the IP55 (where IP stands for ingress protection and the first and second digits are ratings for solids and liquids on a scale from 0 to 6 and from 0 to 9, respectively) international standard IEC 60259 (where IEC stands for International Electrotechnical Commission). This standard is used to rate the degree of protection or sealing effectiveness in electrical and mechanical enclosures against the intrusion of solid particles and liquid droplets, meaning that this UAV is protected against the ingress of dust and powerful water jets. The IP55 protection category ensures that the UAV internal mechanisms remain shielded from abrasive volcanic ash particles and intense rainfall, thereby mitigating the risk of operational failure and prolonging the lifespan of the UAV (in addition to the anti-collision sensors). Moreover, the UAV can operate between −20 and 50 °C, at a maximum altitude of 7000 m a.s.l. (above sea level), and with a maximum recommended wind speed of 12 m s−1 (ca. 43 km h−1); thus it can accommodate a wide range of environmental conditions.
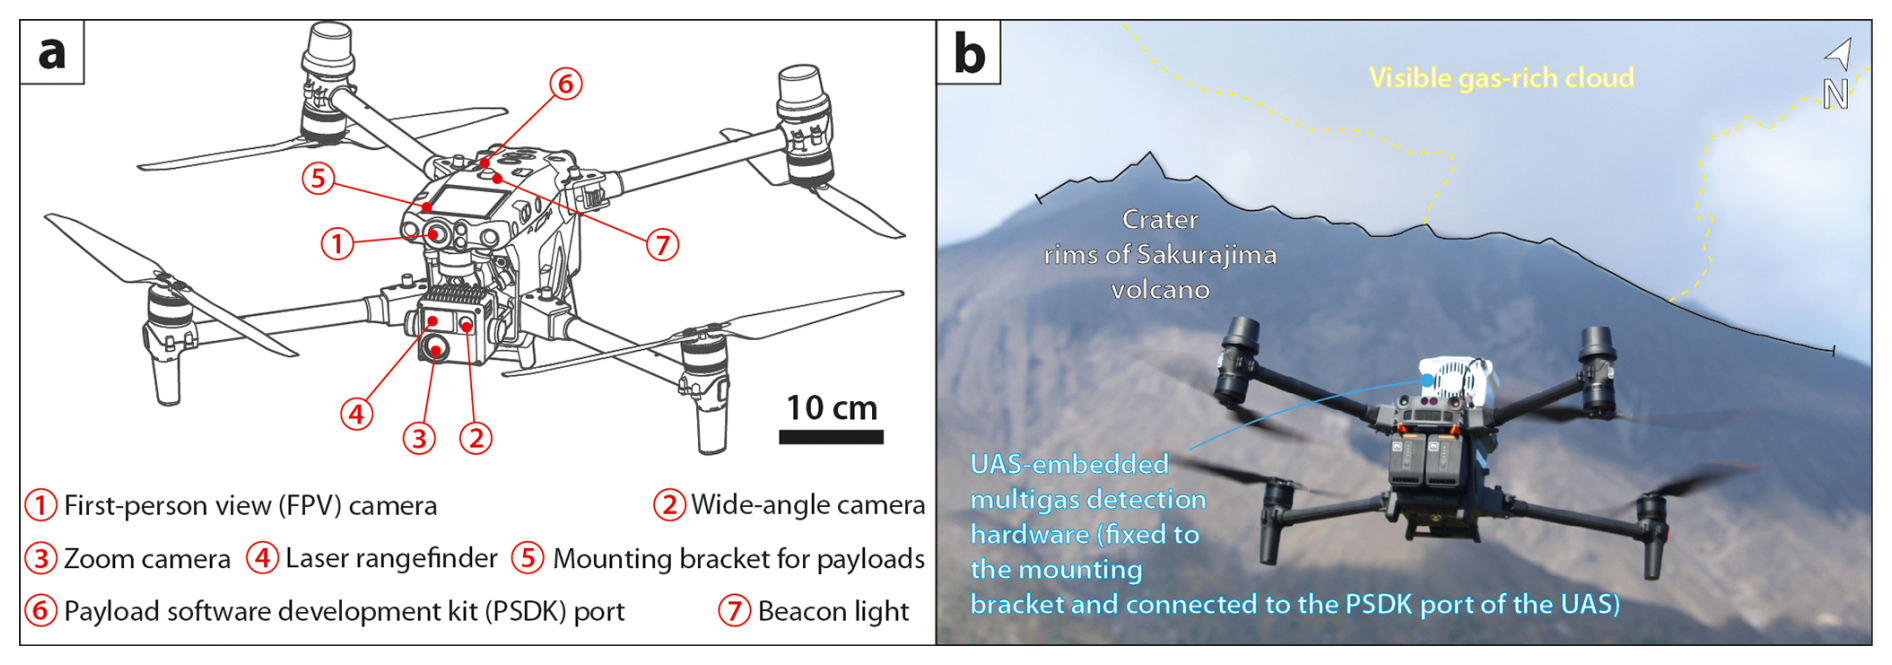
Figure 1The DJI™ Matrice 30 unoccupied aircraft vehicle (UAV). (a) Schematic of the UAV, illustrating the main characteristics described in the text. (b) Photo of the UAV in flight (just after takeoff and heading to the visible gas-rich cloud on the morning of 7 November 2023) at Sakurajima, carrying the Soarability™ Sniffer4D Mini2 multigas hardware (see the text for more information).
The UAV has an advanced camera system designed to navigate precisely and safely in difficult areas and capture valuable imagery in all directions. It includes a first-person-view (FPV) camera used to optimize images under low-light conditions, a wide-angle camera for the high-resolution recording of general scenes, and a zoom camera for capturing specific and distant targets (see labels 1, 2, and 3 in Fig. 1a, respectively). The UAV also features a laser rangefinder (i.e., telemeter; see label 4 in Fig. 1a) to measure the distance of targeted objects from 3 to 1200 m (not applicable to volcanic plumes and clouds). When coupled with the Global Navigation Satellite System (GNSS) of the UAV, specific targets can be accurately positioned in space. Note that an optional thermal camera can also be originally implemented in the UAV (DJI™ Matrice 30T model, not used in this study).
Another key advantage of the UAV is its extended battery life, providing ample autonomy for prolonged missions. In practice and with the use of payloads, drone flights do not exceed 30 min. Covering extensive areas without frequent battery changes enhances operational efficiency. It maximizes data collection efforts, which are crucial for comprehensive monitoring and research of dynamic changes in volcanic activity over time. Note that the batteries (DJI™ TB30) can be easily changed to quickly chain the flights, without having to turn off the UAV. Furthermore, the small size (i.e., mm in folded position), lightweight (i.e., 3770 g without payload, maximum recommended takeoff weight of 4069 g), and quadcopter (i.e., four rotors) nature of the UAV renders it exceptionally transportable in the field and maneuverable in flight, allowing precise navigation through complex terrain as well as stationary or mobile sampling and measurement missions.
The UAV boasts a small payload capacity that is suitable for accommodating external instruments (maximum recommended of 299 g). Nevertheless, this capability facilitates the integration of specialized sampling and sensor devices (see Figs. 1a and 2 and the subsections hereafter), enabling real-time sample and data acquisition without compromising flight stability or maneuverability. Payload devices are attached via mounting brackets (label 5 in Fig. 1a), and some of them can be directly connected to the Payload Software Development Kit (PSDK) port of the UAV (label 6 in Fig. 1a) to be supplied with energy and to directly display the acquired data in real-time through the UAV remote controller (feature used with the multigas detector; see 1b). The UAV beacon light is also shown (label 7 in Fig. 1a), as it is used to control some of the payload devices described in the following subsection. Of paramount importance, numerical and experimental studies on quadcopters have consistently shown that turbulence is predominantly generated below each UAV propeller, with only minor turbulence occurring above them. Notably, there is an absence of significant turbulence in the areas between and above the propellers (e.g., Hwang et al., 2015; Ventura Diaz and Yoon, 2018; Carreño Ruiz et al., 2022), which is where payload devices are typically located. This minimal turbulence generation in these regions is crucial for the stable operation of UASs during flight. This feature is particularly advantageous for volcanic ash sampling and for aerosol and gas analysis, which are thus not impacted during UAV flights.
Note that the remote controller of the UAV has an integrated screen that provides all information about the UAV, shows videos from all cameras, and allows the user to control additional payloads. Moreover, it has IP54, which is also crucial for harsh conditions. The remote controller allows long-range operation and telemetry data transmission, even though the UAV can fly autonomously.
2.2 Payload instruments
In the present study, we show four different payload instruments that can be installed on the UAV and used individually. Three instruments were fully developed in-house and dedicated to airborne ash collection (airborne ash collector device A2C) with additional particle counting (airborne ash collector and counter device A2C2) and image recording (airborne ash collector and counter with camera device A2C3). Finally, a commercial instrument was acquired (Soarability™ Sniffer4D Mini2 multigas hardware) for atmospheric multigas analysis and particle concentration.
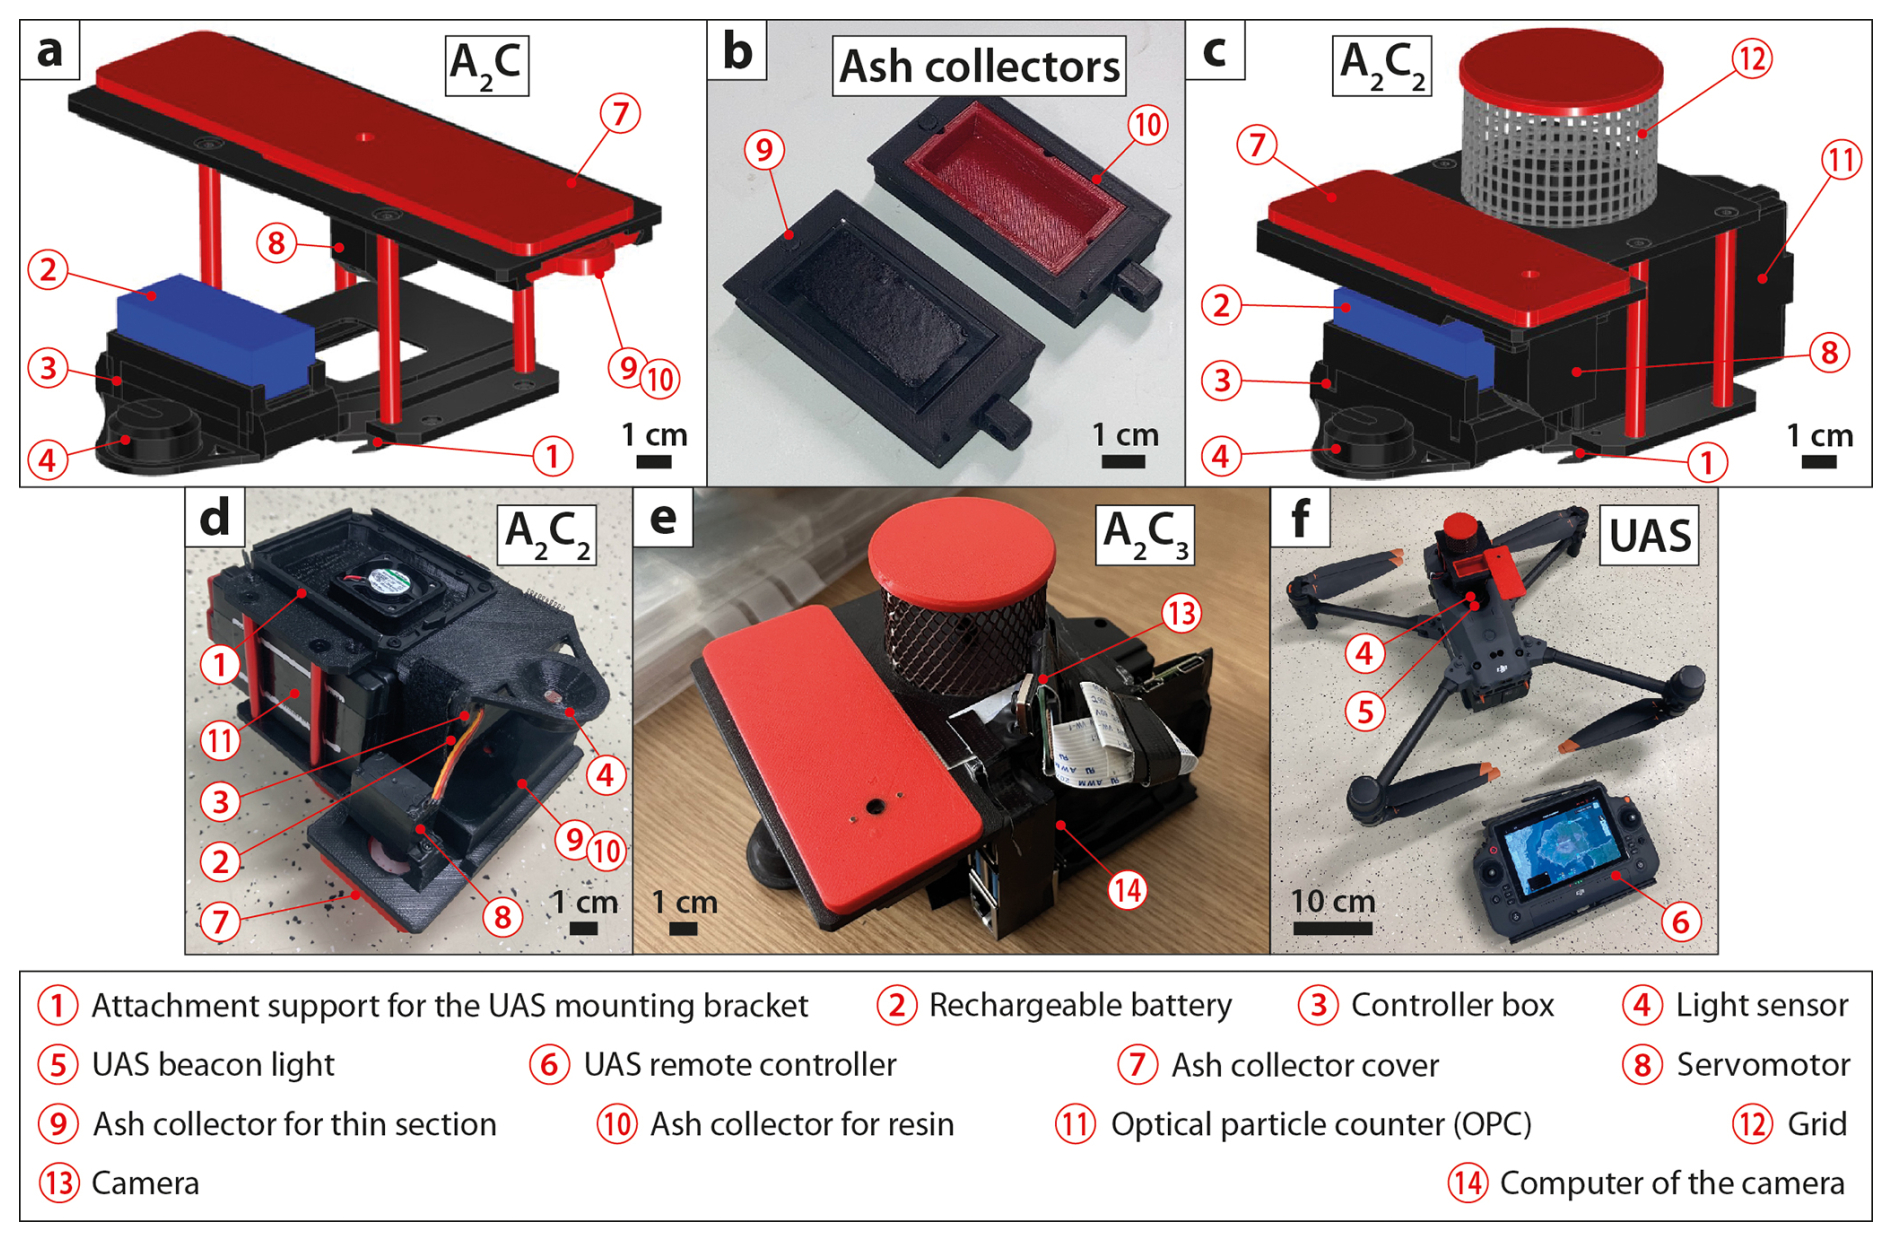
Figure 2Payload instrument developed in-house. (a) Schematic (isometric view) of the airborne ash collector device (A2C) dedicated to ash sampling only (it has two ash collector slots). (b) Photo of the two types of ash collectors; the bottom collector hosts a glassy thin section with conductive carbon adhesive tape, while the top collector is designed to host ultraviolet (UV) resin. (c) Schematic (isometric view) of the airborne ash collector and counter device (A2C2) dedicated to ash sampling (one ash collector slot) and simultaneous fine-ash counting. Counting is performed by an integrated Alphasense™ N3 optical particle counter (OPC). (d) Photo (view from the bottom) of the A2C2; the OPC outlet fan and the light sensor are visible. (e) Photo of the airborne ash collector and counter with camera device (A2C3) dedicated to ash sampling, counting, and image recording. Images are recorded by a Raspberry Pi Camera Module 3 connected to a Raspberry Pi 4 Model B single-board computer. (f) Photo of the A2C2 attached to the unoccupied aircraft vehicle (UAV) ready to fly. Note that the ash collector cover is open, as the beacon light of the UAV is off. See the text for a more detailed explanation.
2.2.1 Airborne ash collector (A2C)
The newly developed A2C (Fig. 2a) is dedicated to airborne volcanic ash sampling at controlled altitudes and distances from the emission sources (i.e., active volcanic vents). It is made of robust, metallic and 3D-printed-plastic pieces and low-priced, commercially available devices and consumables, potentially facilitating its widespread use in the study of airborne volcanic ash. Electrical components are sealed with rubber or silicon to avoid any potential abrasion or corrosion. The total weight of the device is 170 g, thereby making it suitable with respect to the UAV maximum recommended takeoff weight. The device can be fixed to the UAV via an attachment support for the UAV mounting bracket (label 1 in Fig. 2). It is independently powered by a small, rechargeable 7.4 V and 400 mA h lithium-ion battery (label 2 in Fig. 2) capable of powering the entire device for ca. 5 h, which is sufficient when compared to the UAV autonomy. The battery is directly linked to the electronic controller box (label 3 in Fig. 2). A light sensor (label 4 in Fig. 2) is designed to be positioned directly above the UAV beacon light (label 5 in Fig. 2) that can be switched on and off directly with the UAV remote controller (label 6 in Fig. 2). The electronic controller is programmed to close the ash collector cover (label 7 in Fig. 2) when the beacon light is on and to open the cover when the beacon light is off, thanks to a servomotor (label 8 in Fig. 2) that can rotate the ash collector cover by 90°. Hence, the UAS operator has full control over when and where to confidently perform volcanic ash sampling, which is the leading innovative point achieved by this device. Note that, contrary to uncontrolled collection methods (Mori et al., 2016) and to collectors directly exposed to a fixed-wing UAV airflow (Schellenberg et al., 2019), the A2C is designed to collect particles that are settling vertically (i.e., ash fallout). When the ash collector cover is open, samples can be collected in two types of ash collector (Fig. 2b). One collector is designed to hold conductive carbon tape stuck on a glassy thin section of standard dimensions of 48×28 mm (label 9 in Fig. 2). This technique has previously been used in various studies at ground level (e.g., Bonadonna et al., 2011; Bagheri et al., 2016; Gabellini et al., 2022). The second collector is designed with an additional rubber tank of inner dimensions of 43×23 mm (label 10 in Fig. 2) that can accommodate ultraviolet (UV) resin, which can better conserve the structure of potential particle aggregates during sampling compared to the use of carbon tape (Gabellini et al., 2024) and which can be immediately solidified after the UAV landing using a UV lamp (curing time of 2 to 3 min; sunlight only is not enough to solidify the resin). Note that the A2C displays two sampling slots; hence, it can perform the two sampling methods simultaneously. This can be useful for further and different laboratory analyses (e.g., Gurioli et al., 2022; Ross et al., 2022; Gabellini et al., 2024). Note that the design of this payload does not allow one to use the two sampling slots at different times.
2.2.2 Airborne ash collector and counter (A2C2)
To better interpret the collected airborne ash samples, we also used an optical particle counter (OPC) for in situ and real-time measurement of fine GSDs (i.e., below 40 µm) and PM1, PM2.5, and PM10 concentrations (Bonadonna et al., 2012). Therefore, the A2C2 was developed (Figs. 2c and d). It shares the same characteristics as the A2C, but it only has one sampling slot, which allows more space to integrate an Alphasense™ N3 OPC (label 11 in Fig. 2). Note that the total weight of the device is 250 g, which is also suitable for the UAV maximum recommended takeoff weight.
This OPC is recognized by the International Organization for Standardization (ISO) 9001:2015 certification. This device uses an embedded laser diode (658 nm, class-1 laser product, as the laser source is inaccessible). Similarly to conventional OPCs, it measures the light scattered by solid particles carried in a sample airstream through a laser beam. Raw data are used to determine particle sizes, which are related to the intensity of light scattered via a calibration based on the Mie scattering theory (Flagan and Seinfeld, 2012). PM1, PM2.5, and PM10 concentrations are directly calculated from the raw particle count spectra assuming a standard particle density (which can be changed as volcanic particles usually span a density range between 2490 and 2980 kg m−3, depending on their size and composition; see Vogel et al., 2017) and refractive index (equal to 1.5, which is coherent with values of fine volcanic particles; see also Vogel et al., 2017). The detection range is from 0.3 to 40 µm (spherical equivalent size), and data (acquired every 1.398 s) are stored in the integrated memory of the OPC. This device is factory-calibrated using particles of known diameter and refractive index. Tests confirmed that the way the A2C2 is displayed on the UAV does not restrict its airflow (from its intake, pointed upwards, to its outtake, pointed downwards). However, because the fan speed can vary, the sample flow rate through the OPC may also change (0.21 L min−1 on average). Such variations are monitored and corrected dynamically by the OPC so that the particle concentrations and derived PM values are unaffected by moderate flow variations. The OPC has onboard T and RH sensors. Note that a full description of the OPC is available from the manufacturer (https://www.alphasense.com/products?keyword=opc-n3, last access: 20 June 2025). It should also be noted that, as the airflow intake of the OPC is pointed upwards, a particle umbrella and grid (mesh of 2×4 mm), which does not interfere with particle flow, is located around the air intake to avoid large objects from entering the unit (label 12 in Fig. 2).
2.2.3 Airborne ash collector and counter with camera (A2C3)
In a third step, the A2C3 was further developed by adding a miniaturized camera to the A2C2 (Fig. 2e). The camera faces the ash collector to image sequences of falling particles. The objective is to monitor particle size and settling velocity and to document if particles bounce or break following impact on the ash collector. Images are particularly useful for distinguishing between the different types of ash aggregates (Brown et al., 2012; Bagheri et al., 2016; Diaz-Vecino et al., 2022), as images allow us to visualize how aggregates eventually break upon impact on the ash collector. Note that the total weight of the device sits right at the maximum recommended payload UAV capacity (299 g).
The camera is a Raspberry Pi Camera Module 3, which is small ( mm), lightweight (4 g), low-cost, versatile, and adaptable to a wide range of usages, including volcanology (Wilkes et al., 2017; Andò et al., 2021; Del Rosso et al., 2021). Here, the camera (label 13 in Fig. 2) is fixed on the side of the grid and connected to a Raspberry Pi 4 Model B single-board computer (label 14 in Fig. 2), which is placed on the side of the structure. The computer is powered through the PSDK port of the UAV (label 6 in Fig. 1a) and set up to record images automatically on startup. The image resolution is set at 1200×600 pixels, allowing the user to record videos at a frame rate of ca. 100 fps (frames per second). The depth of field is fixed at ca. 8 cm, and the spatial resolution is 33 µm per pixel. Videos are saved in the internal memory of the computer. Note that full descriptions of the camera and associated computer are available from the manufacturer (https://www.raspberrypi.com/documentation/accessories/camera.html, last access: 20 June 2025, and https://www.raspberrypi.com/products/raspberry-pi-4-model-b/specifications/, last access: 20 June 2025).
2.2.4 Multigas detector
In the scope of measuring complementary key atmospheric parameters, a commercial multigas detector developed by Soarability™ and specifically designed for the DJI™ Matrice 30 UAV was acquired (Fig. 1b). This multigas device is called Sniffer4D Mini2 and can obtain up to nine aerosol and gas concentrations at one time. It is the miniaturized version of the multigas detectors presented in Godfrey et al. (2023). We specifically choose the detection of SO2, CO2, PM1, PM2.5, and PM10 concentrations to focus on the study of volcanic gases and aerosols (the device also records P, T, and RH). Note that our device version weighs 269 g, which is suitable for the UAV maximum recommended takeoff weight.
This multigas detector is directly connected to the PSDK port of the UAV (Fig. 1), which delivers enough energy to power the device and allows real-time data transmission (for PM, SO2, and CO2 concentrations) to the UAV remote controller (label 6 in Fig. 2). The device's built-in cellular connectivity also enables secure real-time data transmission with unlimited range (except for some uncovered areas), which facilitates the 3D real-time visualization of gas concentration distributions and adapts UAV flight navigation according to the scientific objectives. Data (acquired every 1 s) are also saved in the device's internal memory. The active air intake fan on the back of the device allows the evacuation of sampled air, with the sample flow rate being ca. 10 L min−1. The filter on the front side can filter floating and coarse objects in the air. Note that a full description of the multigas device is available from the manufacturer (https://www.soarability.com/sniffer4d-uav-multi-gas-sensing, last access: 20 June 2025). All device modules are certified and calibrated on an annual basis by the manufacturer using adapted calibration chambers, to avoid any drift impact on the acquired data.
Similarly to OPCs, the PM sensing module is based on laser scattering, with a particle counting effectiveness of 50 % at 0.3 µm, rapidly reaching 98 % above 0.5 µm. It can measure particle concentration between 1 µg m−3 (value of sensitivity) and 1000 µg m−3 with a maximum measurement deviation of ±2 %. The module has an on-chip proprietary humidity correction algorithm, enabling better data quality in a wide humidity range (from 0 % to 95 %).
The detection method of the wide-range CO2 sensing module is based on nondispersive infrared (NDIR) absorption, as commonly encountered for CO2 sensors (e.g., Rüdiger et al., 2018; Liu et al., 2020; Pering et al., 2024). It can measure CO2 concentrations between 0.01 % (100 ppm, value of the sensitivity) and 5 % with a maximum measurement deviation of ±2 %. The module has on-chip proprietary environmental and individual difference compensation algorithms, enabling better data quality in wide temperature (from −20 to 50 °C) and relative humidity (from 0 % to 95 %) ranges as well as in the range of atmospheric pressures.
Finally, the detection method of the wide-range SO2 sensing module is based on electrochemistry, as commonly encountered for SO2 sensors (e.g., Rüdiger et al., 2018; Liu et al., 2020; Pering et al., 2024). It can measure SO2 concentrations between 0.000075 % (750 ppb, value of the sensitivity) and 0.01 % with a maximum measurement deviation of ± 4 %. The module has on-chip proprietary environmental and individual difference compensation algorithms, enabling better data quality in wide temperature (from −20 to 50 °C) and humidity ranges (15 % to 90 %).
Note that the overall response times of the PM, CO2, and SO2 modules are 10, 30, and 40 s, respectively. Knowing these times, all recorded data (PM, CO2, and SO2 concentrations; P; T; and RH) are automatically synchronized by the internal algorithm of the device to enable a comparison of these parameters in space and time.
2.3 Field strategy and data processing
The aforementioned instruments were deployed at Sakurajima volcano (Fig. 3) in November 2023 and Etna volcano (Fig. 4) in July 2024. In particular, the A2C, A2C2, and multigas detector were used at Sakurajima, whereas the A2C3 was only tested at Etna.
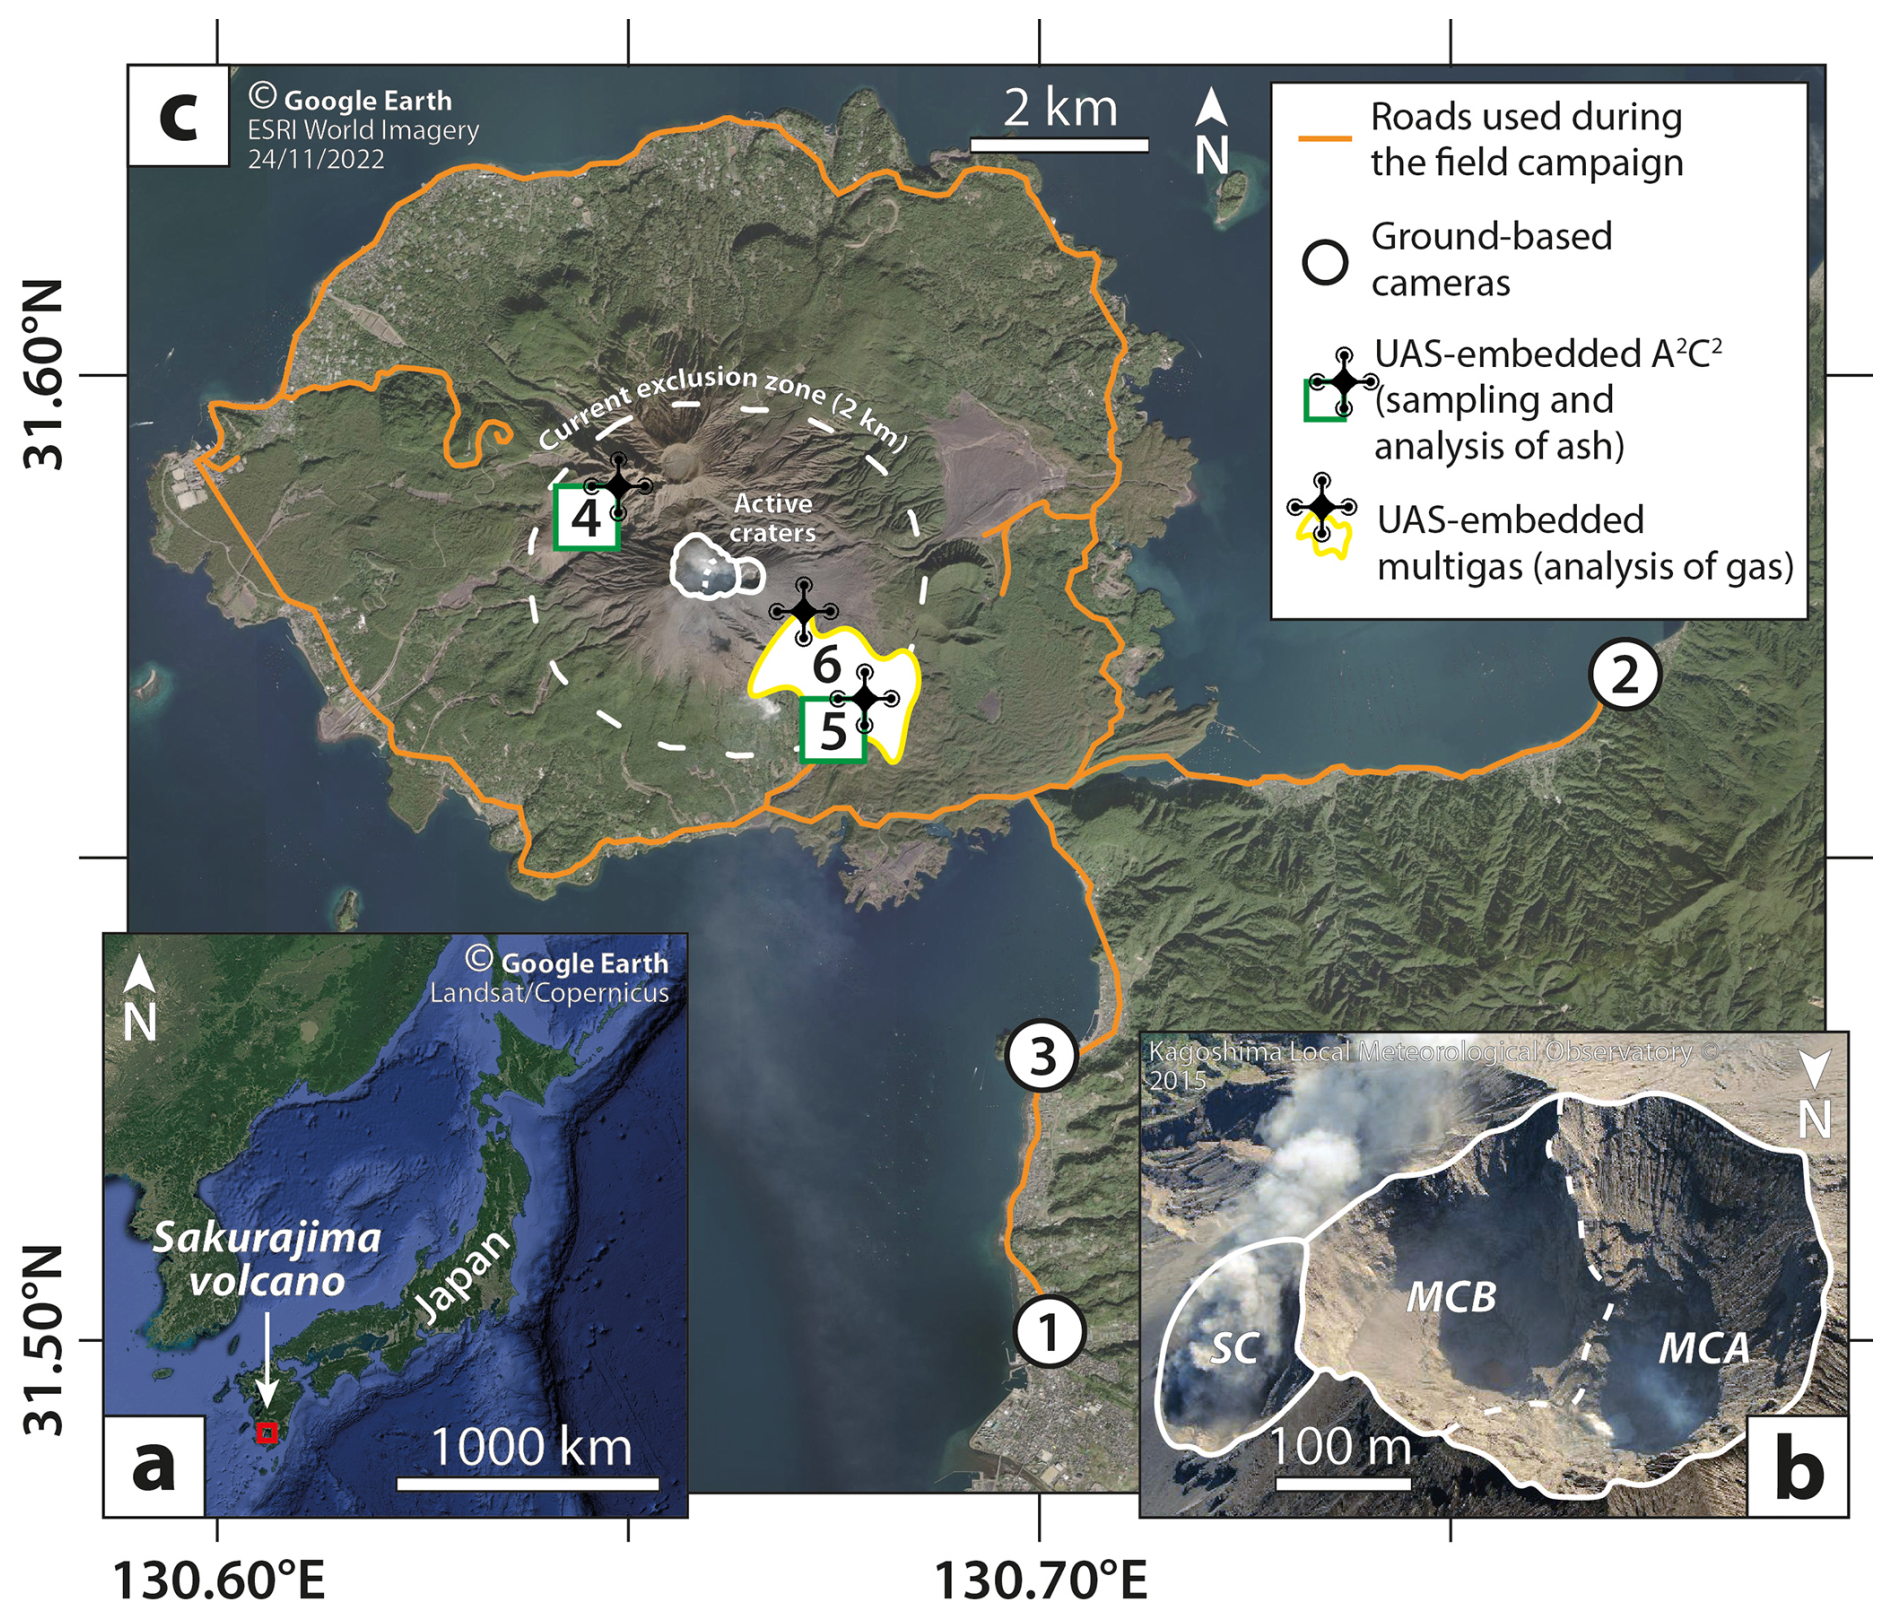
Figure 3Location and general features of Sakurajima volcano. (a) Localization of Sakurajima at a global scale. (b) Aerial photo of the active craters of Sakurajima. Abbreviations used in the figure are as follows: MCA – Minamidake crater vent A; MCB – Minamidake crater vent B; SC – Showa crater. (c) Map of Sakurajima edifice. White lines delimit the summit craters shown in panel (b). The dashed white circle represents the current exclusion zone (for a current alert level of 3, on a five-point scale, representative of frequent Vulcanian eruptions) delimited 2 km around the active craters.
Sakurajima volcano is situated in the northern part of Kagoshima Bay (Kyūshū, the most southerly of the four largest islands of Japan) (Fig. 3a). Since 1955, frequent volcanic activity has been observed either in Minamidake crater (vent A and B) or in Showa crater. This activity alternates between degassing periods and frequent Vulcanian explosions, both potentially producing ash- and/or gas-rich volcanic plumes and clouds of various intensities and features (e.g., Poulidis et al., 2018; Freret-Lorgeril et al., 2022; Takishita et al., 2024) (Fig. 3b). A main road goes around the volcano that allowed us to position ourselves directly near/below volcanic clouds depending on the winds and to fly the UAS over the restricted area (2 km exclusion zone around the active craters for a current alert level of 3) if needed (Fig. 3c).
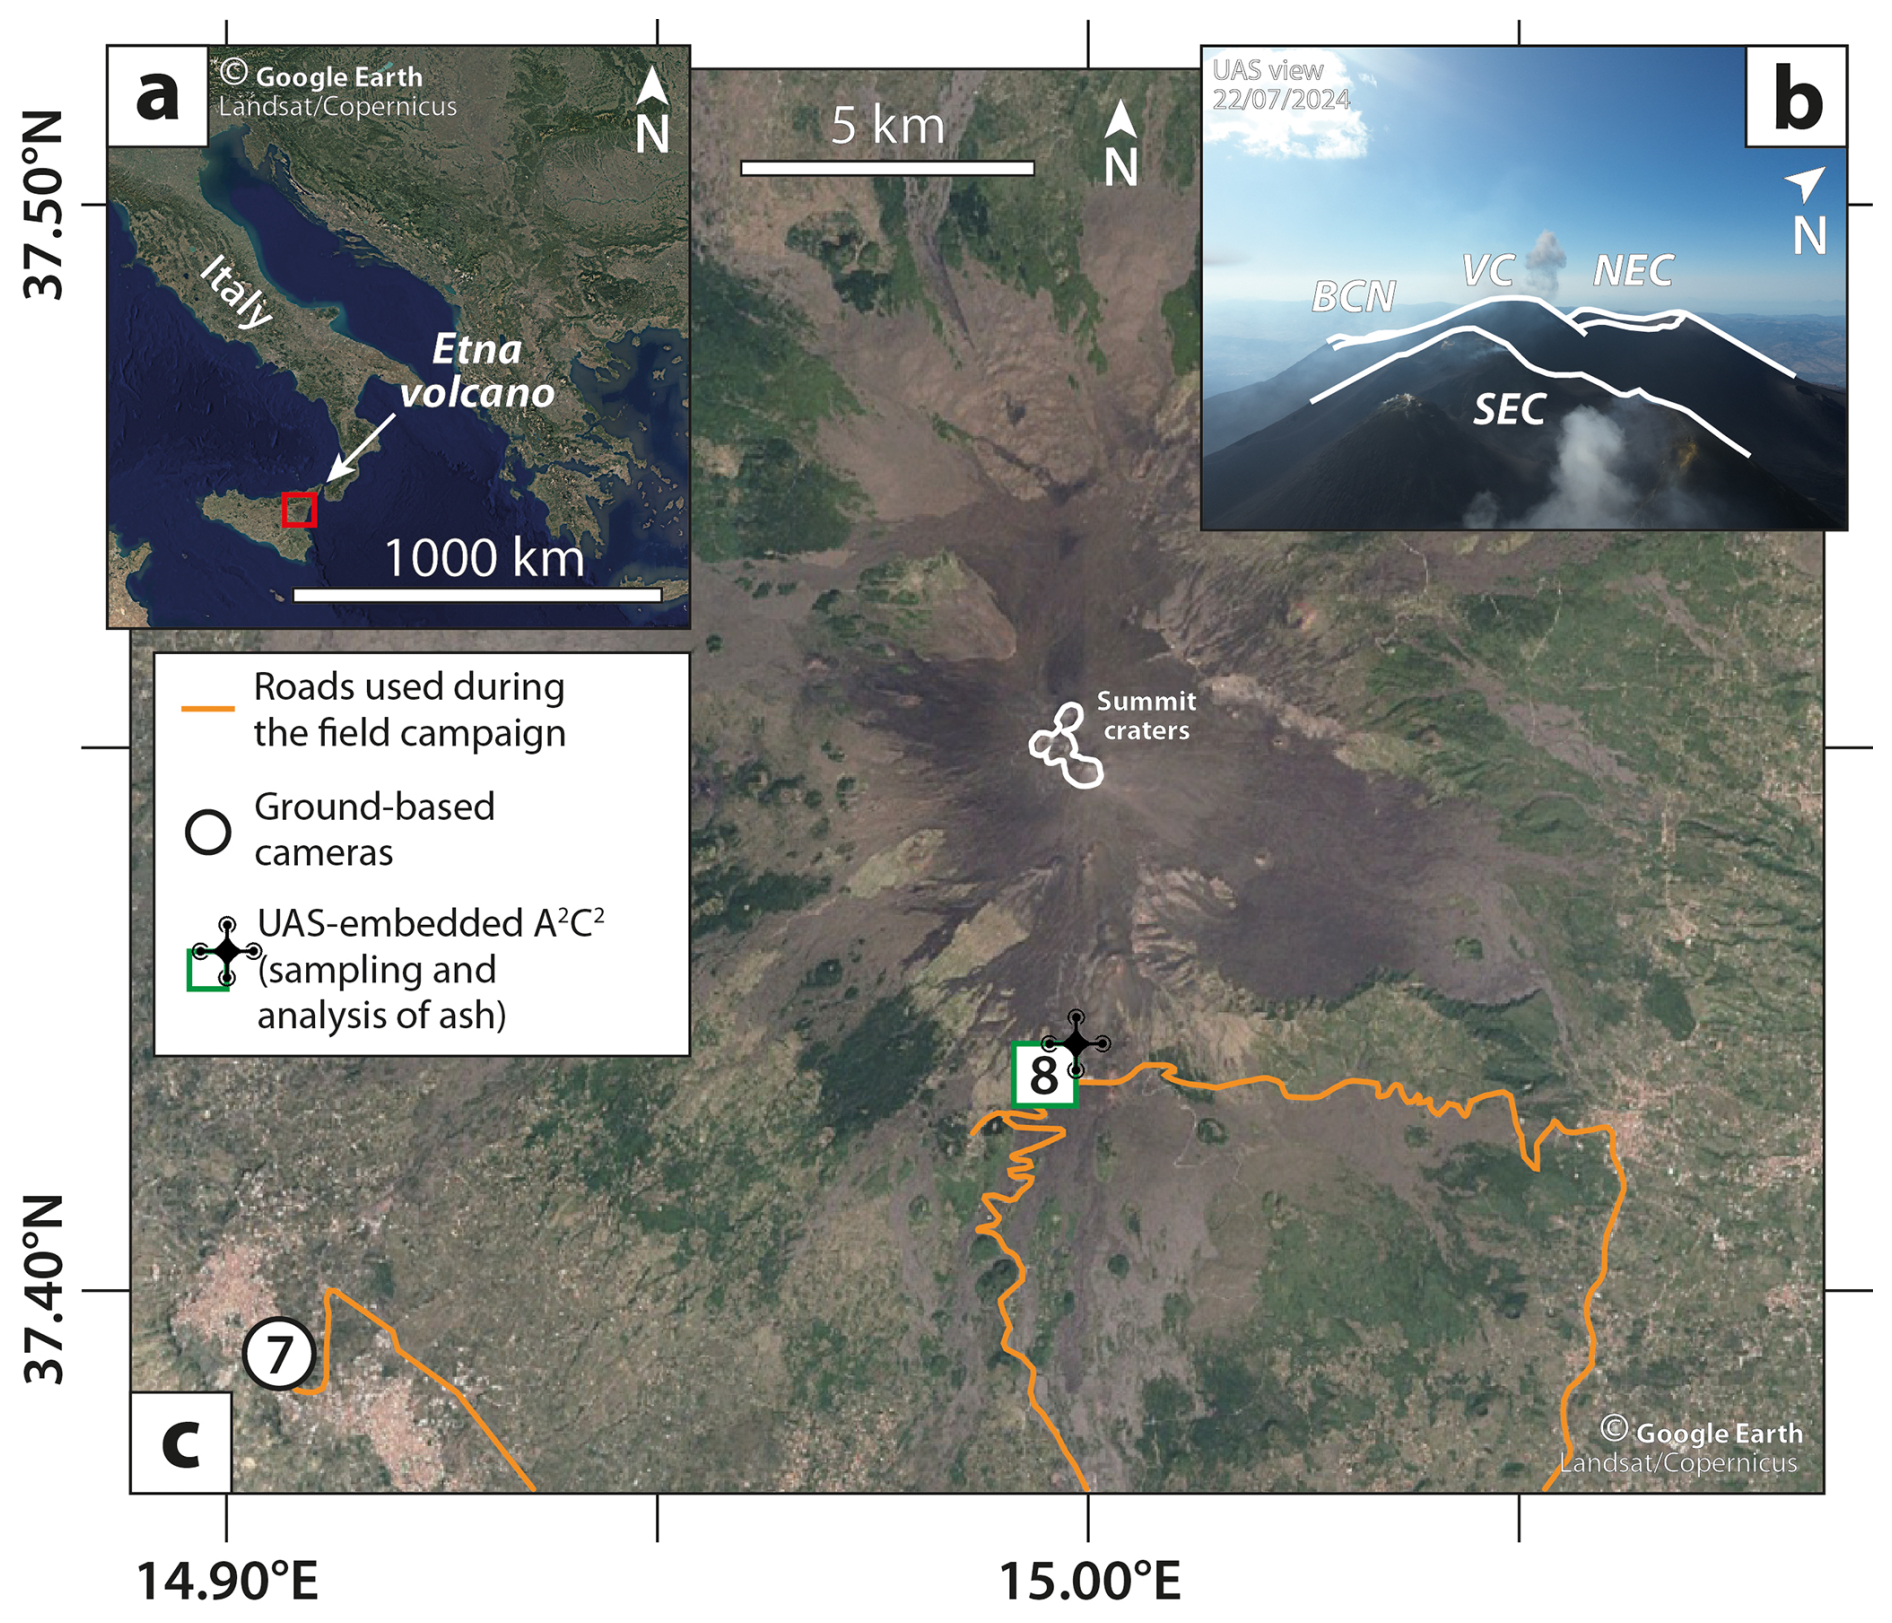
Figure 4Location and general features of Etna volcano. (a) Localization of Etna at a global scale. (b) Aerial picture of the active vents of Etna. Abbreviations used in the figure are as follows: VC – Voragine crater; NEC – Northeast crater; SEC – Southeast crater. Note that the Bocca Nuova crater (BNC) is located just behind and at the base of the Voragine crater in this photo. (c) Map of Etna edifice. White lines delimit the summit craters shown in panel (b).
Etna volcano is situated in the eastern part of the island of Sicily, in southern Italy (Fig. 4a). Volcanic activity, characterized by persistent degassing, ash emissions, Strombolian activity, and intense lava fountains (also named paroxysmal episodes), is usually observed in the Bocca Nuova, Voragine (with Bocca Nuova and Voragine both forming the central craters), Northeast, or Southeast craters (note that paroxysmal activity has been only observed at the Southeast and Voragine craters; Fig. 4b). Since 2010, Etna has often experienced paroxysmal eruptions that generate ash plumes (e.g., Calvari et al., 2018; Marchetti et al., 2022; Scollo et al., 2019). Depending on the wind, areas subject to fallout are mainly located in the southeast sector of the volcano (Scollo et al., 2013), which is accessible by several roads (Fig. 4c).
Note that UAV flights were conducted manually (to be able to adapt to any sudden change in volcanic and environmental conditions) and respecting local rules (e.g., UAV registered with the Swiss, European, and Japanese authorities and no flying over infrastructure or people), with a second operator in charge of securing takeoff and landing areas as well as visually following the UAV as much as possible. Note that UAV flights were restricted to a maximum of 500 and 1500 m above the takeoff points at Sakurajima and Etna, respectively. No major issues occurred during the measurements. Transmission between the remote controller and the UAV cut out once because of the distance and ground topography, but it was recovered as soon as the UAV automatically returned to the takeoff point. Note that the exposure to volcanic gases showed limited impacts on the UAS, with apparent corrosion only appearing on the metallic grid of the A2C2 and A2C3.
During the field campaigns, ground-based cameras were set up almost perpendicularly to the main dispersal axis of the occurring volcanic clouds in order to have complementary imaging. Volcanic plumes' elevations were inferred following the procedure described in Simionato et al. (2022), although also applying a correction to account for the effect of wind (as detailed in Snee et al., 2023). The wind direction was retrieved from the ERA5 hourly data on pressure levels (Hersbach et al., 2023). This is an important step to locate the UAV's altitude compared to the cloud's altitude, after the image processing (Fig. 5).
Note that an average PM density of 2500 and 2800 kg m−3 has been considered for the OPC measurements for Sakurajima and Etna, respectively, according to the magma composition of each volcano (Bagheri et al., 2016; Ferlito et al., 2017). OPC raw data (i.e., particle counts) were then converted to mass, considering that the optical equivalent diameter is equivalent to the geometric diameter.
Ash samples were analyzed in the laboratory with a Keyence™ VHX-7000 optical microscope, which enabled the acquisition of multi-focused (z-stacking technique) high-definition images, at different magnifications (from ×100 to ×1000), allowing for the reconstruction of the samples' GSDs after image binarization, considering the equivalent spherical diameter (ESD) of each particle (defined as the diameter of a sphere that would exhibit the same projected area as the irregularly shaped particle under consideration). Particle counts are also converted into mass considering spherical particles. Note that a full description of the microscope and associated software is available from the manufacturer (https://www.keyence.com/products/microscope/digital-microscope/vhx-7000/, last access: 20 June 2025).
Three volcanic events at Sakurajima and one event at Etna have been used as case studies. They are representative of different types of volcanic activity (Fig. 5), for which UAS sampling and measurements were performed with different objectives and scopes. Note that the UAV was always controlled in real time in order to be able to instantaneously adapt the flights, sampling, and measurements depending on the volcanic and atmospheric conditions.
The first case study is an explosive event that started from Minamidake crater (acquired data do not permit one to distinguish between vent A or vent B; see Fig. 5a) at Sakurajima on 10 November 2023 at 11:17:25 LT (local time; time format: hh:mm:ss). It produced a buoyancy-driven ash-loaded plume of relatively low altitude (maximum of ca. 1250 m a.s.l.) that was dispersed into two wind-advected clouds associated with two wind directions present at different elevations. The main cloud was dispersed toward the northwest by a downslope wind, which often occurs at Sakurajima (Poulidis et al., 2017). This brought the cloud down to ca. 550 m a.s.l. (see File S1 in the Supplement for the altitude parameterization). This relatively low altitude allowed a direct in situ UAV flight into the cloud (see label 4 in Fig. 5a) using the A2C2 device, as the UAV takeoff point was at 408 m a.s.l. at this location (at the old observatory near the Yunohira observation deck, with a maximum UAV flight altitude of 908 m a.s.l.).
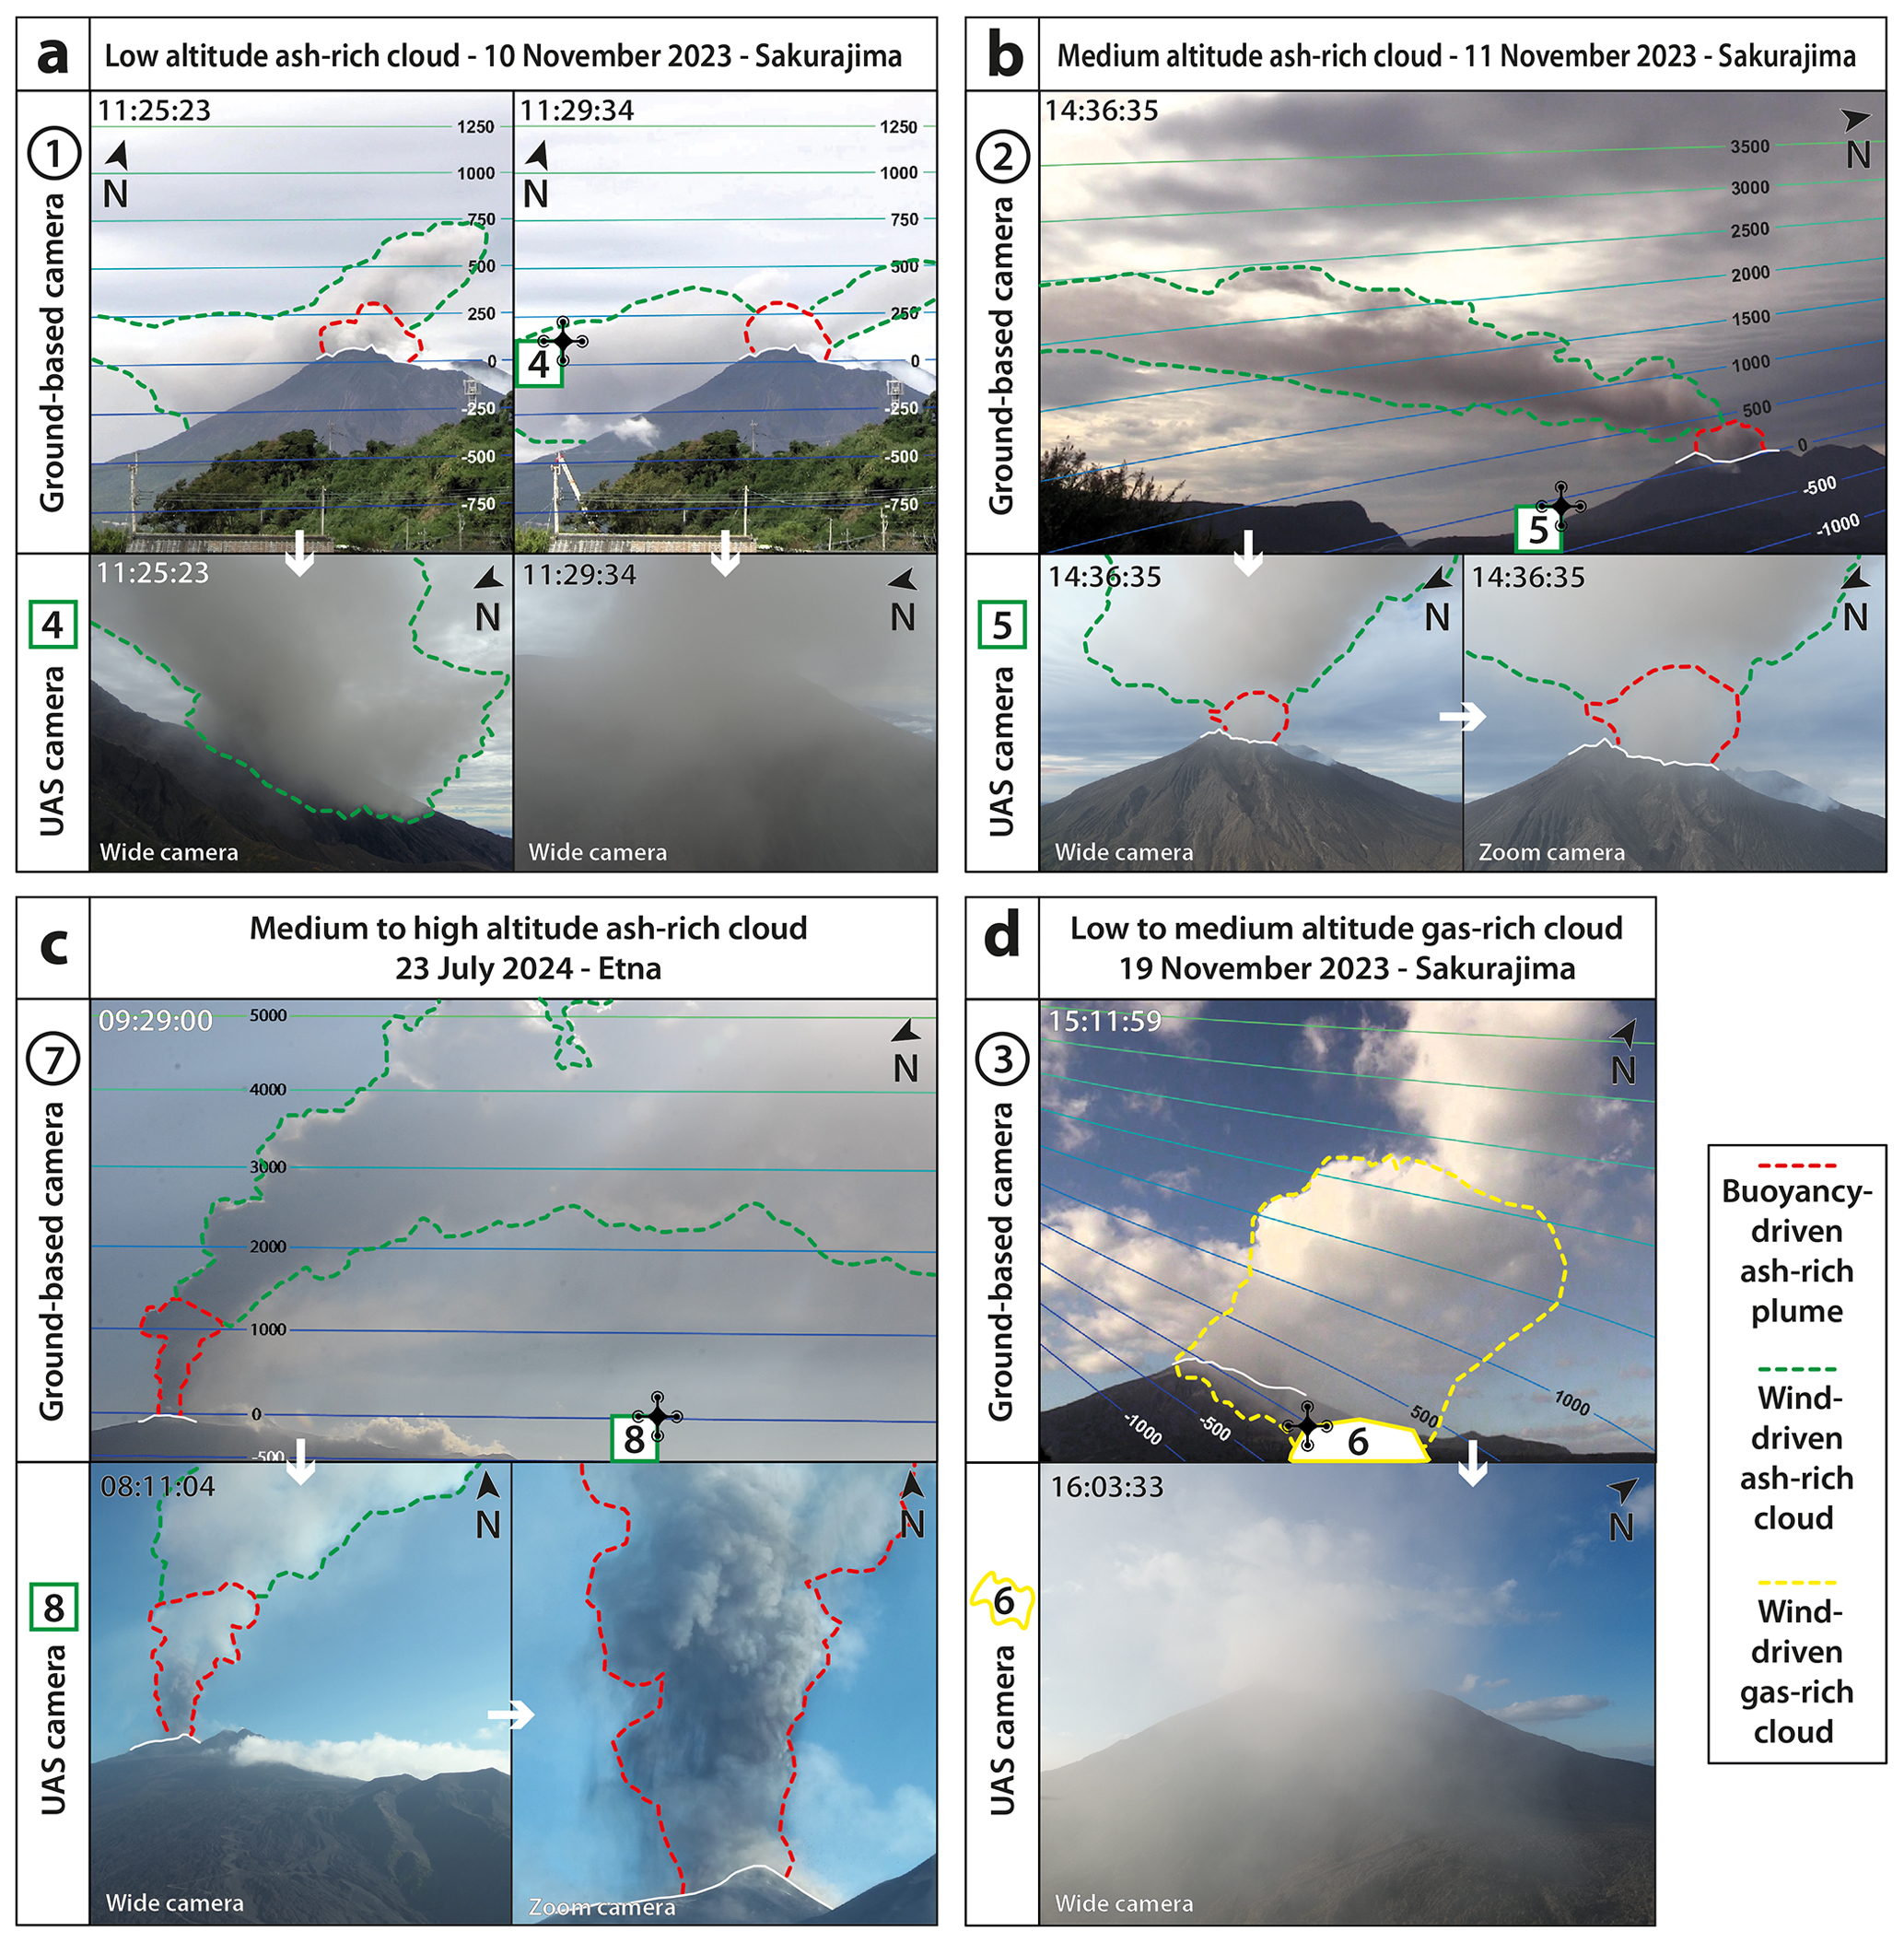
Figure 5Characterization of the events shown in this study. Labeled sites correspond those shown in Figs. 3c and 4c. All times provided in this study are local times (time format: hh:mm:ss). Ground-based photos show equal-elevation (m) isolines for each wind-corrected cloud plane (crater rim altitude in the cloud plane is defined at 0 m). (a) Explosive event that started at Sakurajima on the morning of 10 November 2023. (b) Explosive event that started at Sakurajima on the afternoon of 11 November 2023. (c) Paroxysmal eruption that started at Etna on the morning of 23 July 2024. (d) Continuous degassing that occurred at Sakurajima on the afternoon of 19 November 2023.
The second case study is an explosive event from Minamidake crater (vent A or vent B) at Sakurajima that started on 11 November 2023 at 14:28:47 LT (Fig. 5b). Similarly to the first case study, it produced a buoyancy-driven ash-loaded plume of relatively low altitude (maximum of ca. 1400 m a.s.l.). However, the associated ash-loaded cloud dispersed ash towards the southwest and progressively increased in altitude. For instance, the cloud base and top were at ca. 1700 and 2550 m a.s.l., respectively, at a distance of 2 km from the source, where airborne sampling was performed (see File S1 for the altitude parameterization). Contrary to the first case study, UAV flight was only possible below the cloud (see label 5 in Fig. 5b), as the UAV takeoff point was at 85 m a.s.l. at this location (at the Arimura lava observation deck, with a maximum flight altitude of 585 m a.s.l.); hence, the sedimentation of particles associated with the cloud was scoped using the A2C2 device.
The third case study is a paroxysmal eruption that occurred at Etna on the morning of 23 July 2024 (Fig. 5c). Sustained lava fountains were observed from the Voragine crater between ca. 5:00:00 and 10:00:00 LT. This activity generated a buoyancy-driven ash-loaded plume at an average altitude of 7000 m a.s.l. that moved towards the south because of the wind (see File S1 for the altitude parameterization). Thus, UAV flight was only possible below the cloud (see label 8 in Fig. 5c), as the UAV takeoff point was at 1883 m a.s.l. at this location (near the Sapienza refuge, with a maximum flight altitude of 2383 m); hence, the sedimentation of particles associated with the cloud was scoped using the A2C3 device at a distance of 6 km from the vent.
The fourth and last case study represents a continuous degassing at Sakurajima that occurred during the afternoon of 19 November 2023 without any explosive event (Fig. 5d). This active degassing produced a gas-rich cloud from the Minamidake crater (vent A or B) that was dispersed to the southwest. Most importantly, this cloud was dispersed from low (ca. 500 m a.s.l.) to medium (ca. 2000 m a.s.l.) altitudes (see File S1 for the altitude parameterization), which allowed one to scope the base of this gas-rich cloud using the multigas detector, as the UAV takeoff point was at 85 m a.s.l. at this location (at the Arimura lava observation deck, with a maximum flight altitude of 585 m a.s.l.).
3.1 First case study: ash sampling and analysis with the A2C2 device inside the ash-loaded cloud on 10 November 2023
The first case study is described based on a 9.7 min long UAV flight along the trajectory shown in Fig. 6a (see also File S2 for the UAV flight report). The OPC was active during the whole UAV flight (Fig. 6b), but sampling was only performed during 2 min at the closest position to the eruptive source and in a stationary position (see label 4 in Fig. 6). Note that no particular flying issues were reported inside the cloud.
Grain size data acquired by the OPC (see File S3 for raw data) show steady baselines at both the beginning and the end of the measurement (i.e., before 11:25:30 LT and after 11:29:30 LT). The baseline at the beginning is characterized by the slight occurrence of PM2.5 and a scarcer occurrence of particles up to 8 µm. As a result, PM1, PM2.5, and PM10 concentrations are typically lower than 5, 10, and 40 µg m−3, respectively. The baseline at the end is characterized by slightly higher levels of PM concentrations (i.e., maximum of 10, 40, and 100 µg m−3 for PM1, PM2.5, and PM10, respectively) with a scarcer occurrence of particles up to 16 µm.
The ash-loaded cloud is identified between 11:25:30 and 11:29:30 LT, as OPC data are characterized by a sudden increase in the particle concentration up to 16 µm, with a scarce occurrence of particles up to 22 µm. As a result, the maximum PM1, PM2.5, and PM10 concentrations measured in the cloud are 100, 3000, and 80 000 µg m−3, respectively. This corresponds to an OPC grain size mode of between 4 and 16 µm (see File S3 for histograms), without any significant number of particles below or above this range (i.e., good grain size sorting within the OPC measurement range). It should also be noted that a significant and unlikely lack of PM1 and PM2.5 characterizes two narrow areas in the cloud.
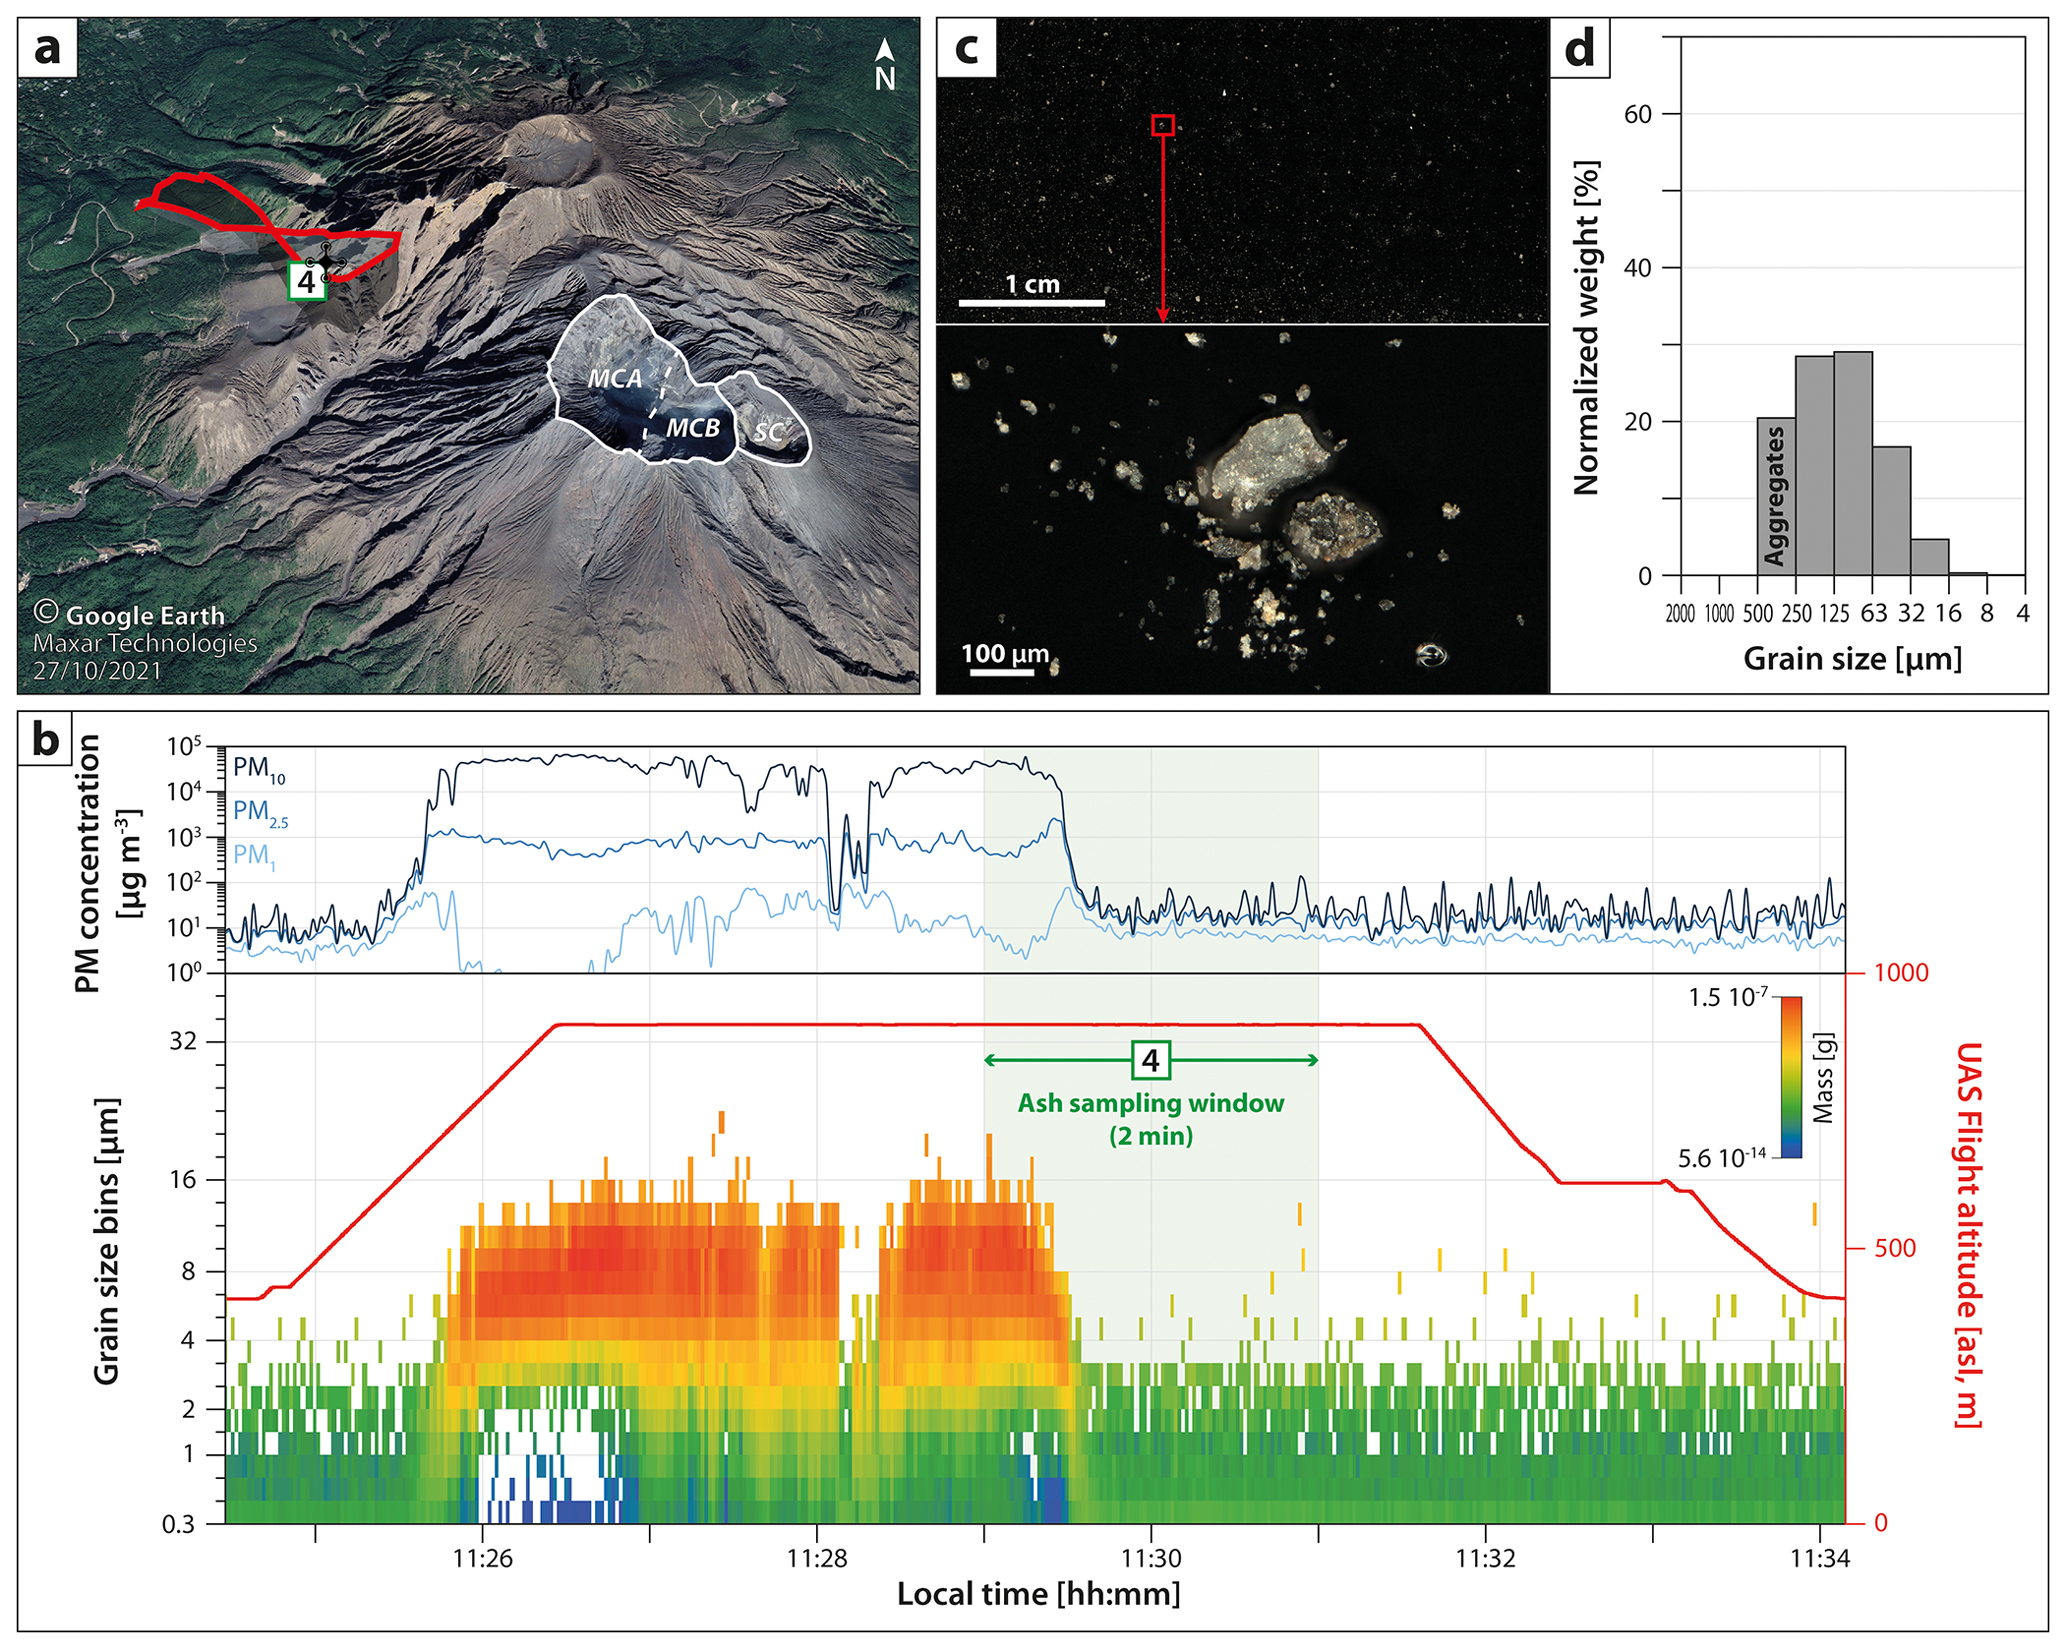
Figure 6Results obtained by the A2C2 device for the 10 November 2023 explosive event at Sakurajima. (a) UAV flight path (red line) during which the optical particle counter (OPC) analysis was performed. The green square (labeled 4) corresponds to the site shown in Figs. 3c and 5a and represents the ash sampling location and duration (also shown in panel b). White lines delimit the active craters shown in Fig. 3b (MCA – Minamidake crater vent A; MCB – Minamidake crater vent B; SC – Showa crater). (b) Particulate matter (PM) concentrations and grain size spectrogram from the optical particle counter (OPC) data. (c) Optical microscopy images of the collected sample at different scales. (d) Grain size distribution (GSD) inferred from image analysis of the collected sample.
The ash collector was opened between 11:29:00 and 11:31:00 LT, allowing the carbon tape to collect particles from the ash-loaded cloud for ca. 30 s (Fig. 6b). Particle distribution on the tape is not homogeneous (most of the particles were collected on the lower-left half of the tape; see also Fig. 6c and Files S4 and S5 for more detailed images and particle counting). Above the OPC measurement range, the GSD reconstructed from the image analysis of the collected sample (Fig. 6d) shows a relatively wide and unimodal distribution, with a mode between 63 and 125 µm. Note that particles above 250 µm should not be considered to be single particles but, rather, ash aggregates (all types of particle clusters, PCs, following the Brown et al., 2012, and Bagheri et al., 2016, nomenclatures, are observed; see also Fig. 6c).
3.2 Second case study: ash sampling and analysis with the A2C2 device below the ash-loaded cloud on 11 November 2023
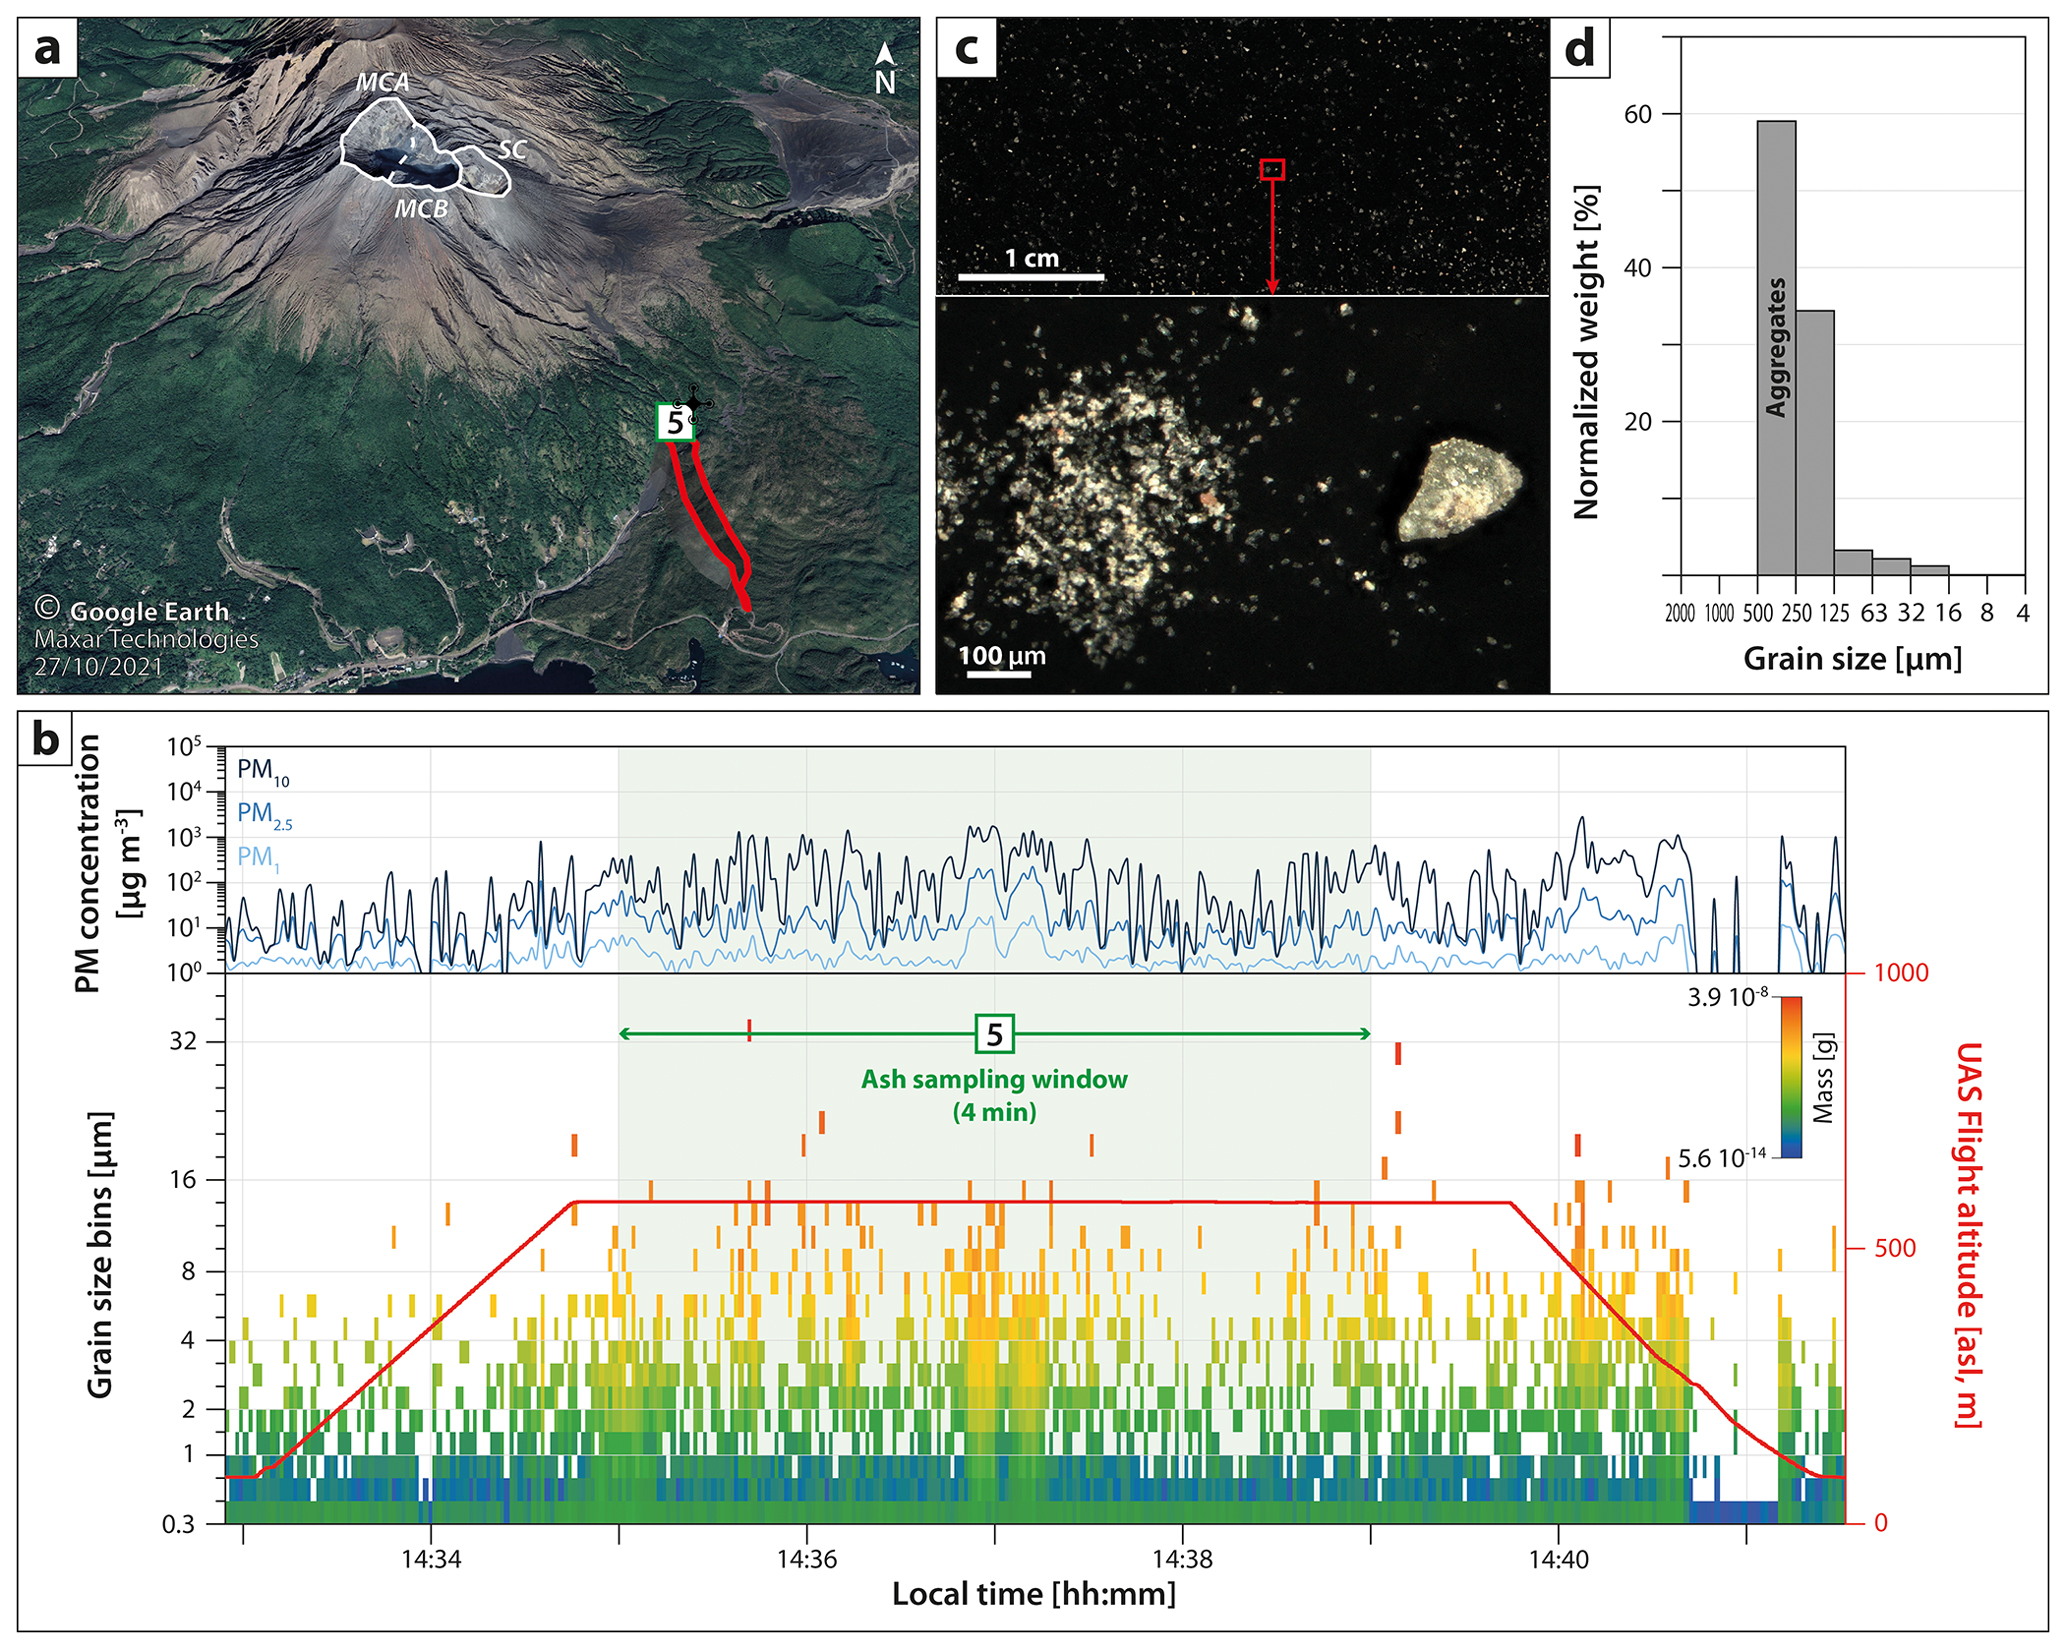
Figure 7Results obtained by the A2C2 device for the 11 November 2023 explosive event at Sakurajima. (a) UAV flight path (red line) during which the optical particle counter (OPC) analysis was performed. The green square (labeled 5) corresponds to the site shown in Figs. 3c and 5b and represents the ash sampling location and duration (also shown in panel b). White lines delimit the active craters shown in Fig. 3b (MCA – Minamidake crater vent A; MCB – Minamidake crater vent B; SC – Showa crater). (b) Particulate matter (PM) concentrations and grain size spectrogram from the optical particle counter (OPC) data. (c) Optical microscopy images of the collected sample at different scales. (d) Grain size distribution (GSD) inferred from image analysis of the collected sample.
The second case study is described based on an 8.6 min long UAV flight along the trajectory shown in Fig. 7a (see also File S2 for the UAV flight report). The OPC was active during the whole UAV flight (Fig. 7b), but A2C2 sampling was performed during 5 min at the closest position to the eruptive source and in a stationary position (see label 5 in Fig. 7).
Grain size data acquired by the OPC (see File S3 for raw data) show different patterns compared to those characterizing the first case study. The whole UAV flight outlined an unsteady baseline, characterized by the slight occurrence of particles up to 8 µm, resulting in low PM concentrations with similar values to the beginning baseline of the first case study. However, this baseline is intersected by numerous and brief (i.e., 2–20 s) peaks in particles from 0.3 to 32 µm, with a systematic mode between 8 and 16 µm (see File S3 for histograms), resulting in a spontaneous increase in PM concentrations (i.e., up to 20, 300, and 3000 µg m−3 for PM1, PM2.5, and PM10, respectively).
The ash collector was opened between 14:35:00 and 14:39:00 LT, allowing the carbon tape displayed on a thin section to collect particles from the sedimentation of the ash-loaded cloud for 4 min (Fig. 7b). Contrary to the first case study, the particle distribution on the tape was homogeneous (Fig. 7c; see also Files S4 and S5 for more detailed images and particle counting). Above the OPC measurement range, the GSD reconstructed from the image analysis of the collected sample (Fig. 7d) shows an unimodal and asymmetric distribution, skewed towards relatively coarse sizes, with a mode between 250 and 500 µm. Interestingly, particle aggregation (mostly represented in the 125 to 500 µm range) is much more developed than in the first case study (all types of PCs are observed).
3.3 Third case study: ash sampling and analysis with the A2C3 device below the ash-loaded cloud on 23 July 2024
The third case study is described based on a 21.7 min long UAV flight along the trajectory shown in Fig. 8a (see also File S2 for the UAV flight report). The OPC was active during the whole UAV flight (Fig. 8b), but A2C3 sampling was only performed for 7 min above the UAV takeoff position and in a stationary position (see label 8 in Fig. 8).
Grain size data acquired by the OPC (see File S3 for raw data) show a steady baseline during the whole flight, characterized by the systematic absence of particles above 10 µm and low particle mass below this threshold, resulting in low PM concentrations with similar values as the beginning baseline of the first case study.
The ash collector was opened between 08:10:00 and 08:17:00 LT, allowing the carbon tape displayed on a thin section to collect particles from the sedimentation of the ash-loaded cloud for 7 min (Fig. 8b). The particle distribution on the tape was homogeneous (Fig. 8c; see also Files S4 and S5 for more detailed images and particle counting). The GSD reconstructed from the image analysis of the collected sample (Fig. 8d) shows an unimodal and narrow distribution, with a mode between 500 and 1000 µm. It should also be noted that ash aggregation was not observed.
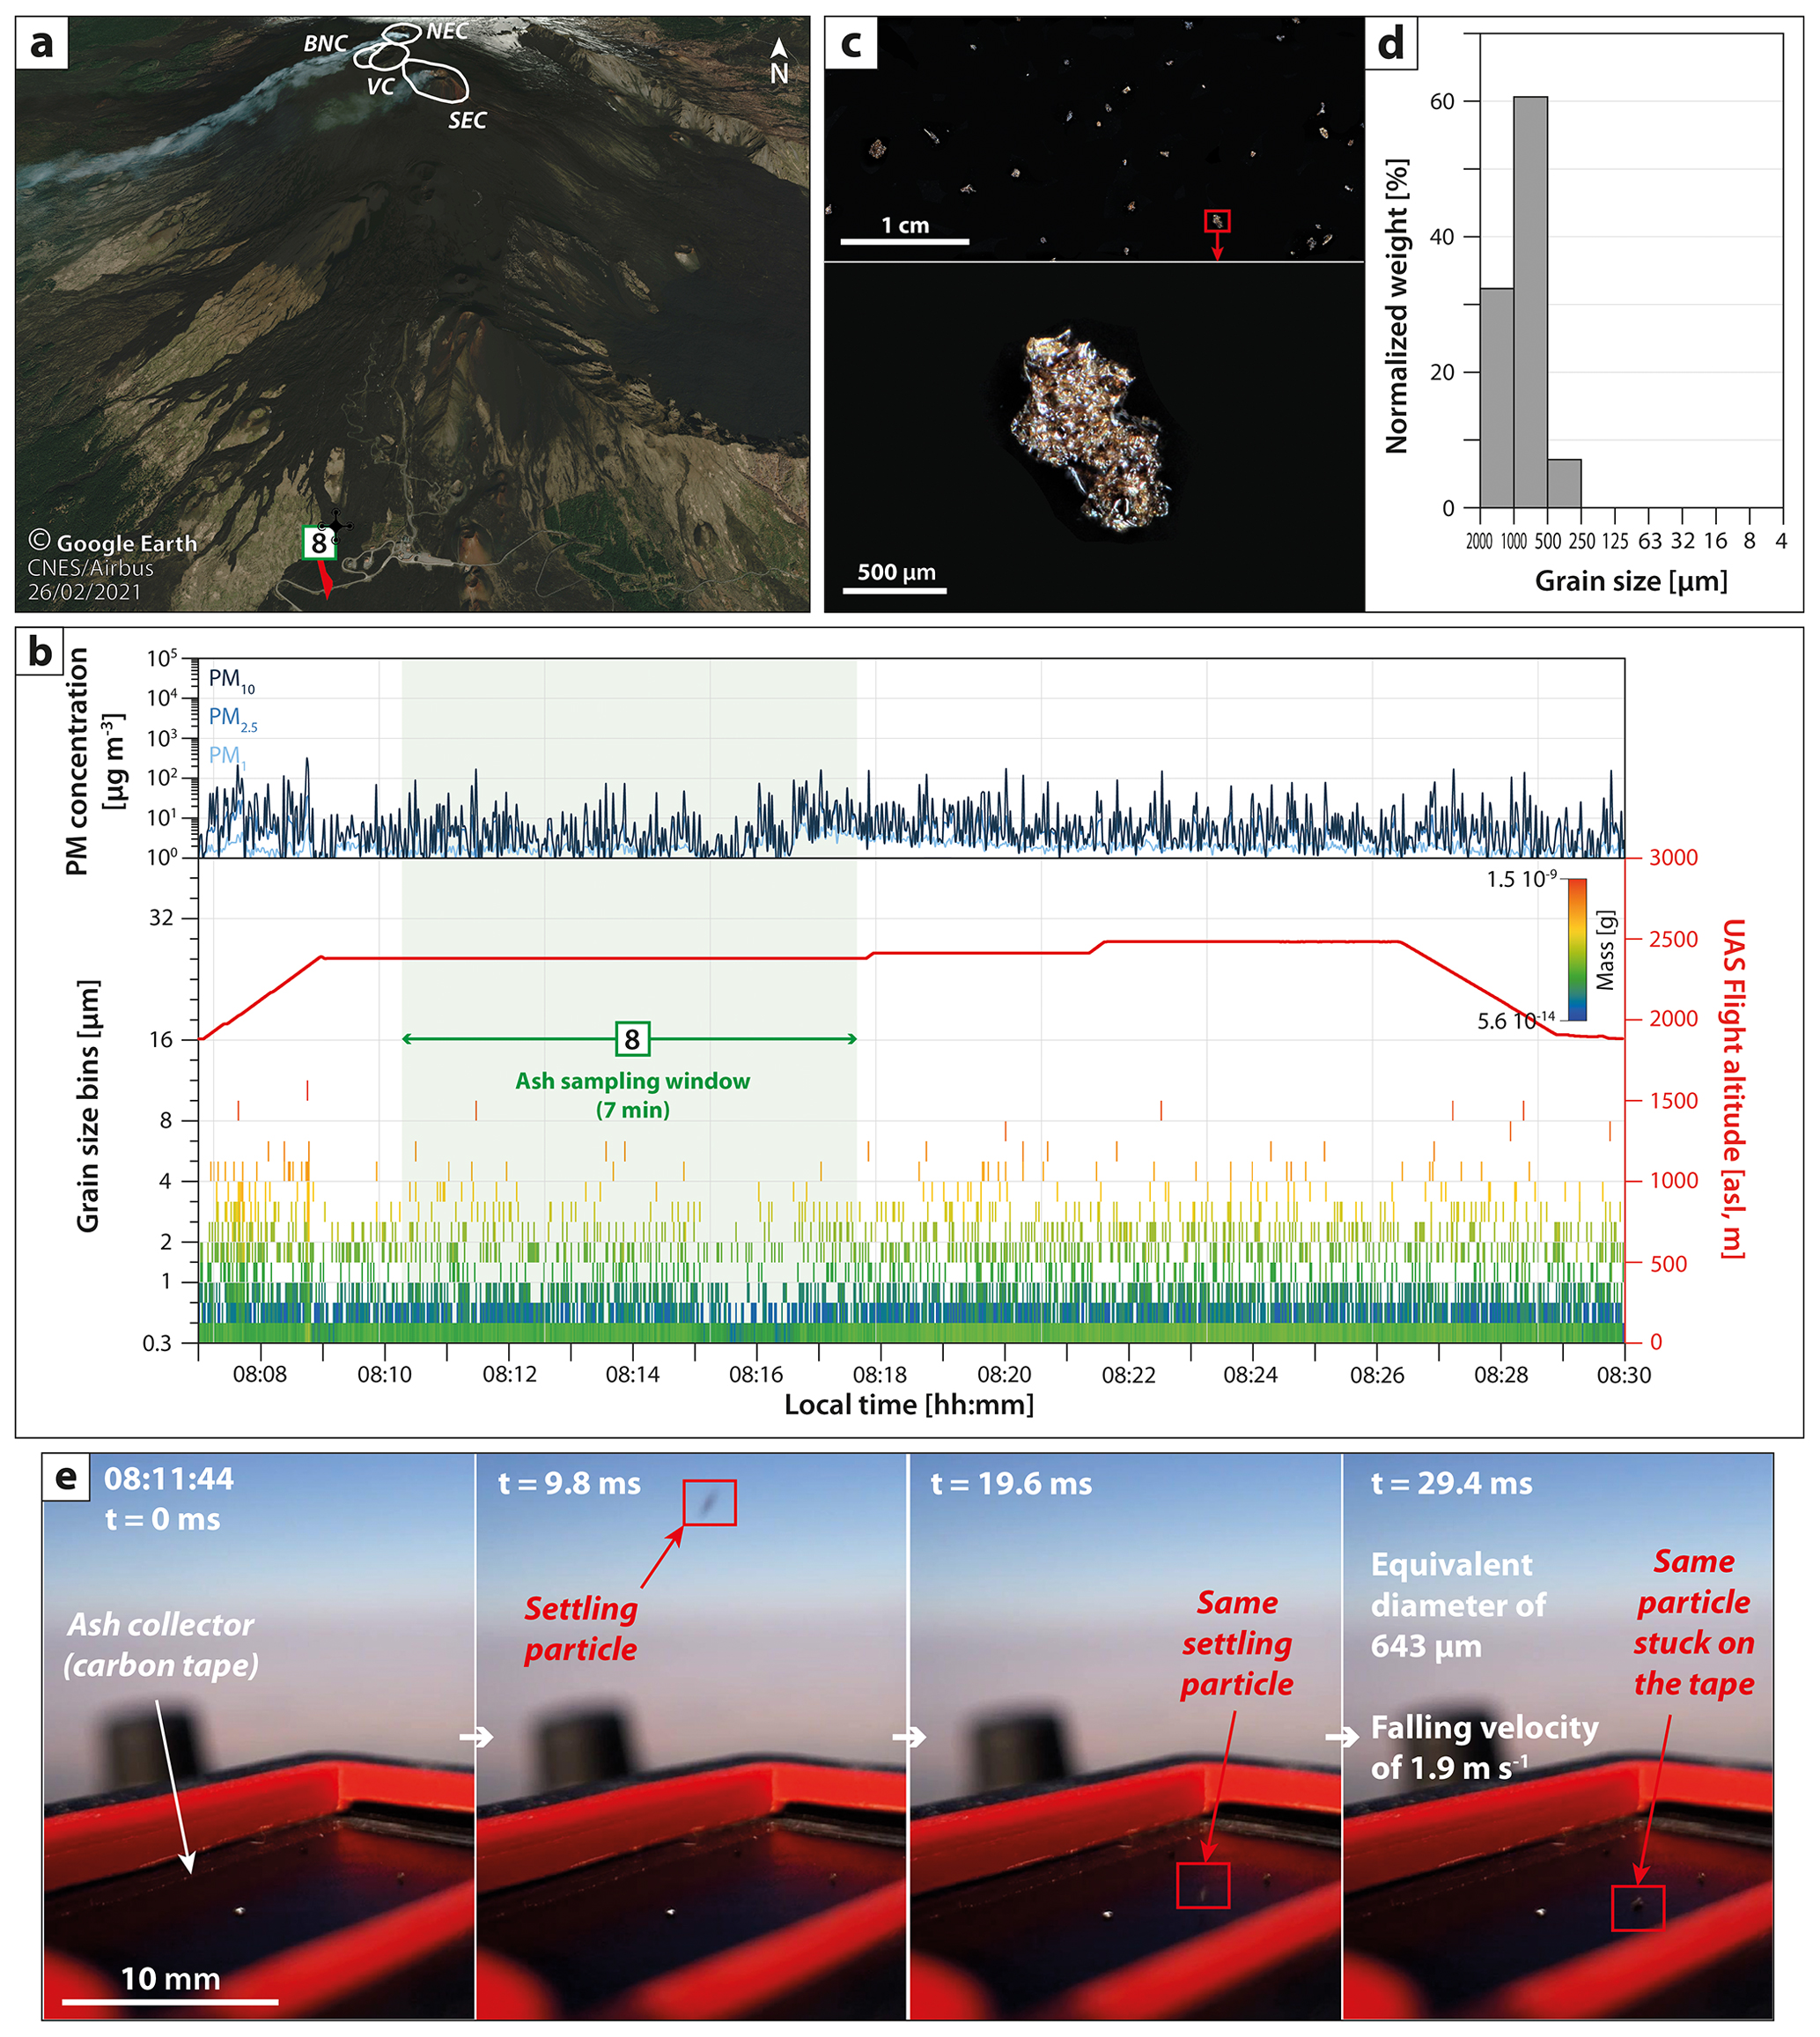
Figure 8Results obtained by the A2C3 device for the 23 July 2024 paroxysmal eruption at Etna. (a) UAV flight path (red line) during which the optical particle counter (OPC) analysis was performed. The green square (labeled 8) corresponds to the site shown in Figs. 4c and 5c and represents the ash sampling location and duration (also shown in panel b). White lines delimit the summit craters shown in Fig. 5b (BNC – Bocca Nuova crater; VC – Voragine crater; NEC – Northeast crater; SEC – Southeast crater). (b) Particulate matter (PM) concentrations and grain size spectrogram from the optical particle counter (OPC) data. (c) Optical microscopy images of the collected sample at different scales. (d) Grain size distribution (GSD) inferred from image analysis of the collected sample. (e) Sequence example of a single ash fallout particle imaged by the camera, with the annotated equivalent diameter and settling velocity (the full video is available in the Supplement). Note that the farthest corner of the sampling area corresponds to the top-right corner of the sample image shown in panel (c). The particle framed in red corresponds to the particle shown in panel (c).
The image sequence captured by the camera installed on the A2C3 allows one to discriminate between (1) particles that are directly falling and sticking in the ash collector (linear trajectories) and (2) particles that are first rebounding on the UAS before being collected (parabolic trajectories). The particle size and falling velocity are estimated for a single particle that has been clearly identified to directly fall and stick in the ash collector (see the red square in Fig. 8e; see also File S6 for raw data). This particle has an estimated falling velocity of 1.9 m s−1 and an average diameter of 643 µm (in agreement with the Fig. 8c, which shows the same particle in the ash collector). The sampling window and the analysis time of the video would need to be increased to get more measurements of particles, in order to increase the representativeness and reproducibility of these measurements.
3.4 Fourth case study: atmospheric analysis with the multigas detector inside the gas-rich cloud on 19 November 2023
The fourth case study is based on a 15.6 min long UAV flight along the trajectory shown in Fig. 9a (see also File S2 for the UAV flight report). The multigas analysis has been cropped to the maximum flight altitude of 589 m a.s.l. to show the data acquired during a horizontal flight at a steady altitude, trying to cover the area of the base of the gas-rich cloud. This represents a 9 min long and continuous atmospheric analysis (Fig. 9b; see also File S7 for raw data).
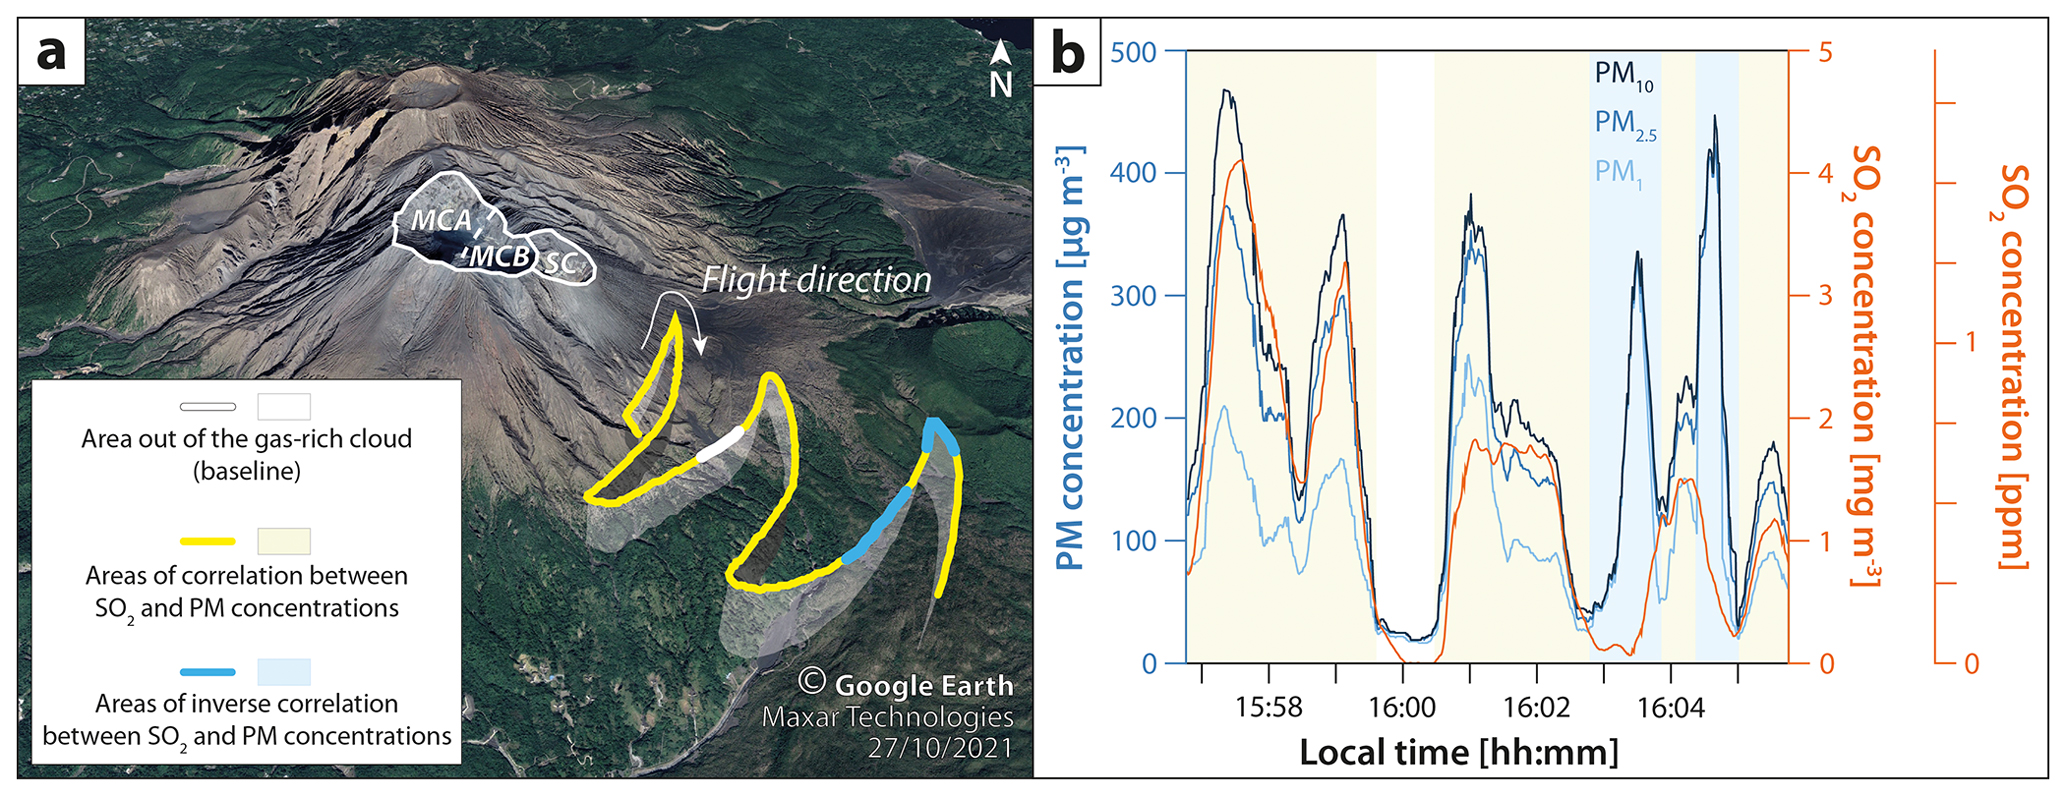
Figure 9Results obtained by the multigas detector. White lines delimit the active craters shown in Fig. 3b (MCA – Minamidake crater vent A; MCB – Minamidake crater vent B; SC – Showa crater). (a) UAV flight path during the multigas analysis for the 19 November 2023 continuous degassing period (see Figs. 3c and 5d). (b) Particulate matter (PM) and sulfur dioxide (SO2) concentrations are a function of time. Note that the time represented in panel (b) is correlated to the UAS location shown in panel (a), as the UAV flew at a horizontal speed of 65±21 km h−1.
CO2 concentrations (between 0.06 % and 0.07 %), T (between 4 and 6 °C), and RH (between 51 % and 59 %) do not show significant variations during the entire multigas analysis. Nevertheless, high variations in SO2 and PM concentrations are observed, and acquired data can be classified into three different areas. First, one small part of the multigas analysis measured the atmospheric baseline out of the gas-rich cloud (white line and area in Fig. 9), as SO2 concentrations were at 0 ppm and PM concentrations were at baseline levels (i.e., lower than 40 µg m−3 for PM1, PM2.5, and PM10). Second, the main part of the multigas analysis showed cloud areas where SO2 and PM concentrations were correlated (yellow lines and areas in Fig. 9). SO2 concentrations of up to 1.4 ppm and respective PM1, PM2.5, and PM10 concentrations of up to 250, 380, and 470 µg m−3 were measured. Third, and most interestingly, some of the parts of the multigas analysis scoped cloud areas where SO2 and PM concentrations were inversely correlated (blue lines and areas in Fig. 9). More specifically, these areas showed a sudden increase in PM concentrations (up to ca. 450 µg m−3 for PM1, PM2.5, and PM10) with a relatively low level of SO2 (down to 0.2 ppm).
4.1 Different OPC and sample signatures inside and below ash-loaded clouds as revealed by the A2C2 and A2C3 devices
OPC data acquired outside the volcanic cloud on 10 November 2023 (Fig. 6b) are characterized by low PM concentrations (PM10 lower than 40 µg m−3), in accordance with concentrations generally measured in the ambient atmosphere (e.g., Dongarrà et al., 2010; Filonchyk et al., 2016; Morino et al., 2018). The fact that PM baseline values after the cloud interception are slightly higher (PM10 up to 100 µg m−3) than at the beginning of the measurement period suggests that either the volcanic cloud left some slight traces of fine particles in the atmosphere on the UAS trip back to base or the OPC needs some time to balance and clean itself after passing through areas with high particle concentrations.
Nevertheless, these relatively low baseline concentrations contrast with the higher ones measured inside the ash-loaded cloud on 10 November 2023 (PM10 concentrations of up to 80 000 µg m−3; see Fig. 6b), which are significantly above the guideline values for daily (250 µg m−3) and annual (150 µg m−3) maximum exposures to PM10 provided by the International Volcanic Health Hazard Network (IVHHN, https://www.ivhhn.org/index.php/, last access: 20 June 2025). Even though more regular measurements are required to assess the real evolution of PM10 values during these periods, it is important to note that a downslope wind brought this cloud to low altitudes, which often occurs in the Sakurajima area (Poulidis et al., 2017), resulting in potential exposure to high PM concentrations at ground level. The lifetime of the high-PM-concentration anomaly (ca. 4 min and segmented into two parts, probably because the UAS was at the edge of the cloud) agrees with the fact that the OPC intercepted the ash-loaded cloud (Fig. 5a). We interpret the unlikely lack of PM1 and PM2.5 at the beginning and the end of the cloud interception (Fig. 6b) as a hardware bias, as previous laboratory tests have shown that the OPC displays null or unusually small values when measuring extreme concentrations of small particles. Note that another OPC bias can also occur when the UAS moves due to the orientation of the OPC, which sucks air that is moving perpendicular to its inlet. With this setup, the particle sampling bias increases as particles get larger (i.e., non-isokinetic sampling). However, the recorded data suggest that this bias is not significant compared to the real variations observed in the atmosphere.
Another interesting pattern was identified when the UAS reached the ash fallout area below the volcanic cloud at Sakurajima on 11 November 2023 (Fig. 7b). Instead of a single, global increase in PM concentrations, as observed when intercepting the ash-loaded cloud, zones below the cloud were characterized by spontaneous and brief increases in GSD modes and PM concentrations (PM10 concentrations of up to 3000 µg m−3), which were not as high as in the cloud but still above the IVHHN guidelines, emphasizing that even low-intensity events represent a potential respiratory health risk downwind of the event source. We interpret the short-lived GSD mode and PM peaks as being representative of ash fallout with a pulsatory behavior, corresponding to the source (i.e., pulsatory nature of the explosive event; see Fig. 5b) and/or to sedimentation processes, such as SDGIs generating discrete ash fingers (e.g., Scollo et al., 2017; Freret-Lorgeril et al., 2020; Lemus et al., 2021; Fries et al., 2021). The homogeneous particle distribution on the tape (Fig. 7c) provides further evidence that the collected particles were settling vertically without any significant turbulence, in accordance with a laminar ash fallout regime for the observed grain size (Bonadonna et al., 2015). Interestingly, the OPC measurement in the fallout area of Etna shows only a baseline pattern, highlighting the absence of fine particles (more data need to be acquired to interpret this observation as a source and/or a transport mechanism).
The combined results from the OPC measurements and the laboratory analysis of the collected samples enable more insights into the real GSD of the investigated areas. At Sakurajima, particle counts from the OPC show a systematic fine mode (between 4 and 16 µm), both inside the cloud and in the fallout area, while a coarser mode is systematically observed from the image analysis of the associated samples, between 63 and 125 µm excluding ash aggregates that can be coarser up to 500 µm (Figs. 6 and 7). Note that the Sakurajima and Etna fallout samples were collected at a 2 and 6 km distance from the source, respectively (Figs. 3 and 4). However, the Etna fallout sample (Fig. 8) is coarser (mode between 500 and 1000 µm) than the Sakurajima ones (coarse mode between 63 and 125 µm excluding aggregates), suggesting different eruptive parameters and transport mechanisms.
In addition, the significant occurrence of particle aggregates in the Sakurajima samples (absent for Etna sample), and more specifically in the fallout sample, confirms that aggregation is a common feature at Sakurajima (e.g., Gilbert et al., 1991; Bagheri et al., 2016; Diaz-Vecino et al., 2022). The observed aggregates are all PC types, in agreement with the absence of rain or significant amounts of condensed water in the atmosphere during the studied events (Fig. 5a and b). Aggregation is believed to be favored by the relatively fine and polydisperse grain size distribution, also with potential particle electrical charge (induced by particle friction inside the cloud) and/or chemical bonding (induced by secondary mineral precipitation inside the cloud). Moreover, the fact that most of the sampled fallout particles are part of structured aggregates (Fig. 7c) confirms that this UAS sampling is efficient for the sampling of aggregated particles, despite their fragile nature (i.e., no significant turbulence generated on the upper side of the UAS). The grain size mode of the Sakurajima fallout sample (between 250 and 500 µm) is mostly composed of aggregates. Therefore, a more detailed image analysis (i.e., manual separation of single particles inside aggregates) should be performed to better investigate ash aggregation and get a real GSD considering both individual and aggregated particles. The use of ash collectors with resin is also shown to better preserve the aggregate structures compared to carbon tape (Bagheri et al., 2016; Diaz-Vecino et al., 2022; Gabellini et al., 2024), and this needs to be tested in the future with the A2C3 device, which enables a visual monitoring of falling particles. Even though more data need to be acquired, the particle settling velocity estimated at Etna falls in the expected range for the observed particle size and texture (Freret-Lorgeril et al., 2019, 2020). This suggests that drone turbulence did not affect ash sedimentation in this case.
4.2 The complexity of gas-rich clouds as revealed by the multigas detector
First, it should be noted that the different exposure times of the different multigas sensors are not critical for data interpretation, as data show, on multiple occasions, that SO2 and PM concentrations are well correlated (Fig. 9b).
The insignificant variations in the CO2 concentrations are explained by the relatively low sensitivity of the sensor (100 ppm), compared to the concentration variations (less than 100 ppm, because of low CO2 fluxes and because of further atmospheric dilution).
Interestingly, the UAV flight undertaking multigas analysis in the gas-rich cloud on 19 November 2023 sometimes showed high PM concentrations, highlighting that continuous degassing clouds also involved fine ash particles that were probably emitted and remobilized at the source (i.e., ash venting). PM concentrations also strongly oscillated (sometimes PM and SO2 were anticorrelated), probably because ash venting experienced variable efficiencies in the production of particles. The relatively low expected Stokes number of PM particles (significantly below 1) supports the fact that PM particles are mostly tracers and behave like gases (drag-dominated regime). This fact most likely exclude a potential decoupling between SO2 and PM particles during the volcanic cloud transport. Even though more measurements and quantification of the relevant parameters (e.g., cloud velocity and turbulence and the particle sedimentation rate) are needed, we suggest that these areas of high particle concentrations could eventually lead PM10 and coarser particles to aggregate and/or sediment by gravity, ultimately forming discrete areas of particle sedimentation when low levels of turbulence are reached.
It is also important to note that both SO2 (up to 1.4 ppm) and PM (PM10 up to 470 µg m−3) concentrations experienced peaks above the hourly maximum exposure values provided by the IVHHN guidelines, as the base of the cloud was occasionally and locally at ground level due to downslope winds (Fig. 5c). Similarly to PM10 concentrations, more continuous measurements are necessary to evaluate the evolution of SO2 concentrations and rigorously assess potential health threats induced by SO2 at Sakurajima.
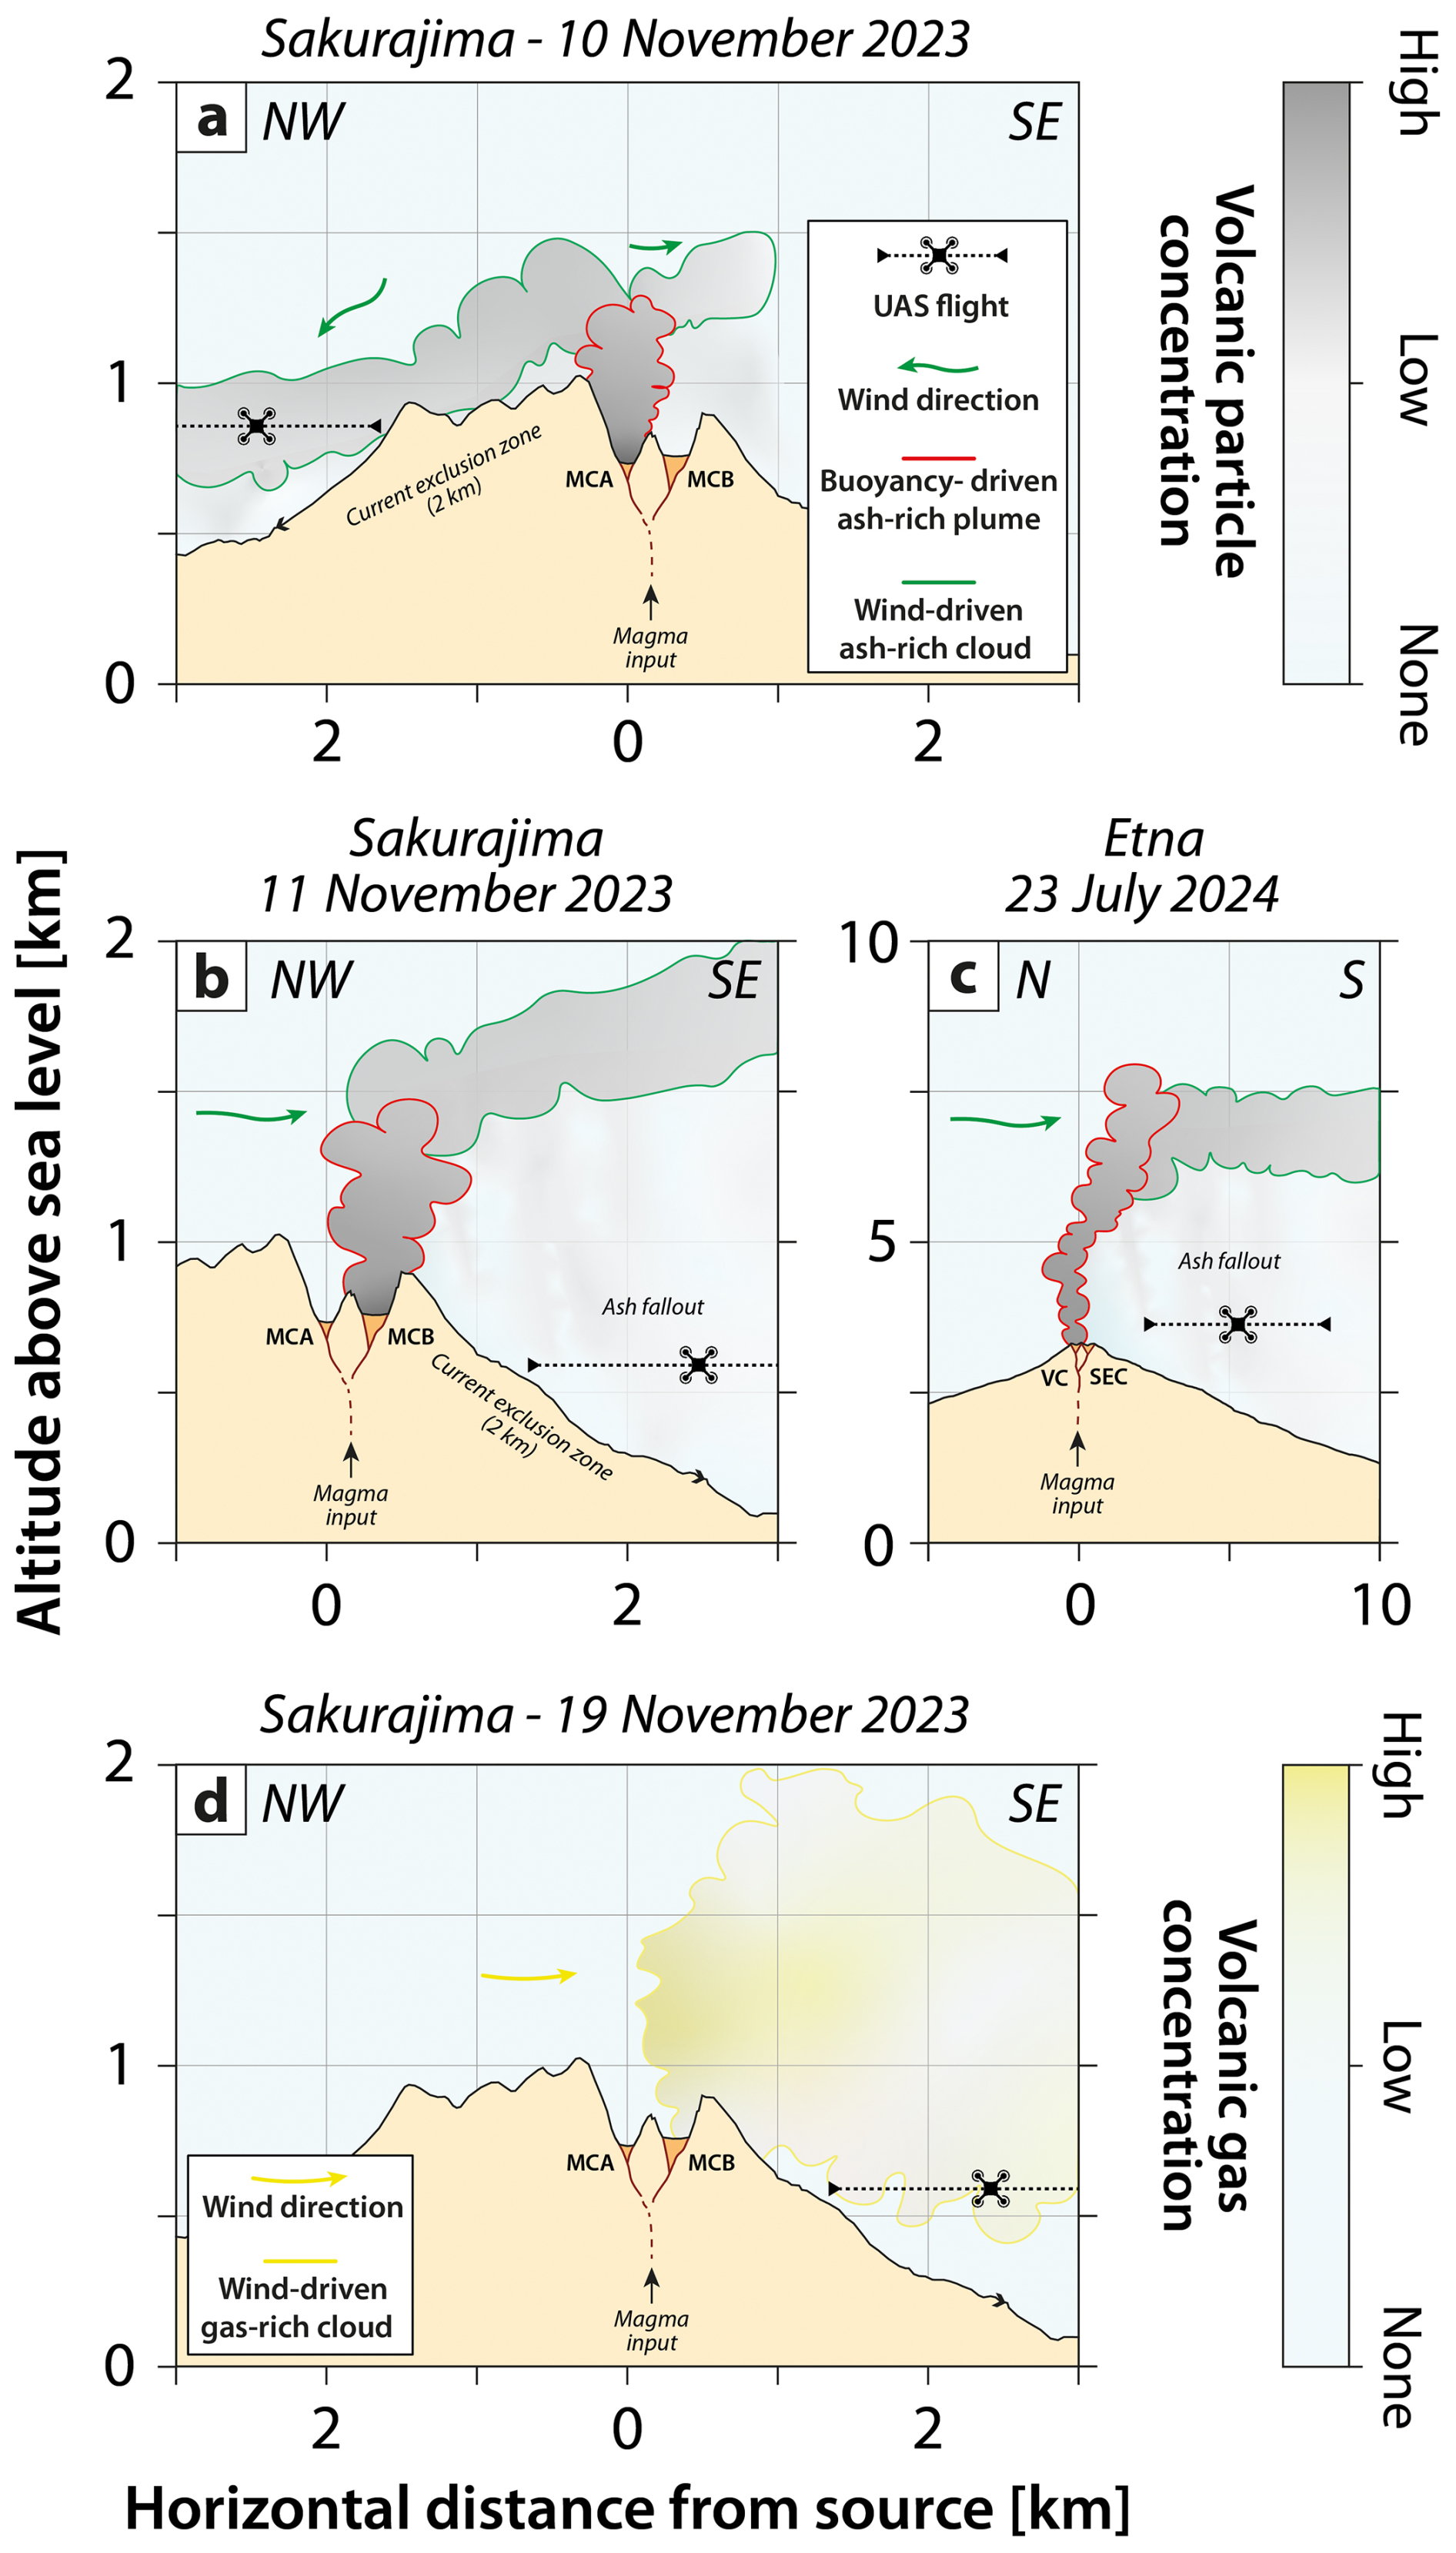
Figure 10The different case studies and possible applications shown in this study. (a) In situ analysis and sampling inside ash-loaded volcanic clouds: example using the 10 November 2023 at Sakurajima. (b) In situ analysis and sampling of ash fallout below volcanic clouds: example using the 11 November 2023 at Sakurajima. (c) In situ analysis and sampling of ash fallout below volcanic clouds: example using the 23 July 2024 at Etna. (d) In situ analysis of gas-rich volcanic clouds: example using the 19 November 2023 at Sakurajima.
Our study highlights that the developed and acquired technologies (Figs. 1 and 2) can be used to study various types of volcanic phenomena (Figs. 3 and 5). Depending on the site accessibility, UAV local flight regulations, and atmospheric conditions, the approach shown here enables in situ ash sampling and the measurement of GSDs and PM1, PM2.5, PM10, SO2, and CO2 concentrations inside (Figs. 6, 9, 10a and c) and below (Figs. 7 and 10b) ash- and/or gas-rich volcanic clouds. Exploratory results acquired in November 2023 at Sakurajima volcano and in July 2024 at Etna evidence significant differences between baseline (low PM concentrations, e.g., below 30 µg m−3 for PM10), inside-cloud (high PM concentrations, e.g., up to 80 000 µg m−3 for PM10, limited particle aggregation), and below-cloud (intermediate PM concentration, e.g., up to 3000 µg m−3, well-developed particle aggregation at Sakurajima, although this was not observed at Etna) environments. Hence, a wide range of opportunities become available to study volcanic events, as acquired airborne samples and atmospheric data can be studied for various purposes, from understanding the origins and mechanisms of volcanic eruptions to deciphering their potential impacts. The following are some areas in which the use and integration of UAS-related measurements could be implemented to support volcanic hazard forecasting and risk mitigation:
- (i)
UAV flights allow us to reach remote and/or hazardous areas (Figs. 3c and 5). Hence, UAS-related results represent invaluable data and sample acquisition to complement the information collected by classical fieldwork at ground level, static monitoring stations, and monitoring networks as well as various remote-sensing methods and crowd-sourced studies employing local population observation and sampling (e.g., Bonadonna et al., 2012; Thivet et al., 2020b; Balangue-Tarriela et al., 2022).
- (ii)
The A2C, A2C2, and (specifically) the A2C3 devices represent innovative instrumentation to collect and characterize particles directly in the atmosphere. These represent a new complementary technique to in situ imaging (Lawson et al., 2006), especially for coarse particles larger than 40 µm. The unique combination of aerosol measurements (OPC), ash collection (sampler), and camera technology is a step forward to fill knowledge gaps concerning key eruptive parameters (i.e., GSDs and particle concentrations) and sedimentation processes (i.e., particle aggregation and SDGIs) during the transport and sedimentation of volcanic ash (e.g., Rose and Durant, 2011; Brown et al., 2012; Rossi et al., 2021). More specifically, more sampling (with the associated image analysis of samples) and atmospheric analyses, both in air and at ground level, need to be performed to investigate the occurrence of particle aggregation during ash fallout (Fig. 7c) and inside cloud samples (Fig. 6c). Note that the instrumentation shown in this study can potentially be adapted for use on other UAV models and can also be dedicated to monitoring at ground level. The A2C can be used to validate and test different sampling methods, as it displays two sampling slots (one can be used with an adhesive carbon tape, whereas the other can be used with UV resin; see also Fig. 2a and b). However, the A2C2 and A2C3 are mostly used for research purposes (Fig. 2e), as they can sample and measure GSDs and PM concentrations simultaneously, in addition to in situ visual monitoring (Fig. 2c, d, e, and f).
- (iii)
Supplementary laboratory analysis can also be performed on the collected samples (e.g., GSD inside aggregates, particle componentry, morphology, texture, and composition; see Gurioli et al., 2022), to better understand processes involved before, during, and after eruptions. More specifically, conducting a standardized post-eruption analysis can provide a comprehensive understanding of the processes responsible for generating volcanic particles and, ultimately, allow for the comparison of acquired datasets for different case studies (Ross et al., 2022).
- (iv)
The intricate interactions between ash particles and gases within volcanic clouds need to be further investigated, as they can result in unexpected and impactful processes, including chemical reactions on ash surfaces, changes in particle aggregation efficiencies, and the modification of gas compositions (e.g., Delmelle et al., 2007, 2018; Colombier et al., 2019). UAS devices represent an innovative and efficient approach to decipher these mechanisms, as sampling and analysis are accurately performed in situ, inside or below volcanic clouds.
- (v)
Gas monitoring (more specifically for SO2 and CO2) is also important for eruption forecasting (e.g., Sparks, 2003; Aiuppa et al., 2007; Poland et al., 2020) and the characterization of eruptive-style transition (e.g., Shinohara et al., 2020; Thivet et al., 2020a, 2021). Thus, UAS-based volcanic gas measurements and sampling can be useful to regularly monitor in situ gas parameters at active volcanic sites as a complement to ground-based stations, especially above volcanic vents where permanent monitoring systems cannot be installed (e.g., Liu et al., 2019, 2020; Pering et al., 2020). The ability to measure SO2 concentrations also enables the potential analysis of SO2 fluxes from a volcano by considering the geometry and speed of any intersected cloud. An important point is that the wide-range CO2 sensor of the multigas device (sensitivity of 100 ppm) needs to be upgraded to a more precise sensor (sensitivity of 1 ppm) to enable the measurement of small CO2 variations and, thus, the analysis of important parameters such as the ratio inside volcanic clouds (an important ratio for both forecasting eruptions and understanding volcanic plumbing systems, including injections of new CO2-rich magma from deep levels; see de Moor et al., 2019).
- (vi)
The A2C3 and multigas devices can also be useful to monitor air quality in various environments and under various conditions. They can be used to study, monitor, and warn about volcanic ash health impacts, as this hazard is well known to cause consequences with respect to respiratory health, especially considering the inhalable fraction of PM that can deposit in the deep lung (i.e., particles between 1 and 10 µm) (e.g., Horwell and Baxter, 2006; Hillman et al., 2012; Andronico and Del Carlo, 2016). The multigas device can be also used to scope emissions of volcanic gases, especially SO2, as this gas is well known to cause various health issues (e.g., Shinkura et al., 1999; Hansell and Oppenheimer, 2004; Schmidt et al., 2015) that can occur due to the presence of volcanic aerosols and gases at ground levels.
All data used in this study are available in the Supplement of this paper.
All samples collected and used in this study are stored at the Department of Earth Sciences of the University of Geneva, Switzerland.
The supplement related to this article is available online at https://doi.org/10.5194/amt-18-2803-2025-supplement.
ST prepared and operated the UAV during the field campaigns, analyzed the data collected by the UAS, and wrote the first draft of the paper. CB, GB, JL, AF, and ER initiated and designed the initial project with respect to the UAS application for in situ volcanic cloud exploration. PMK provided advice on the choice of the UAV and on the multigas detection hardware and designed the A2C and A2C2 instruments. AF, ST, and RS developed the UAS-embedded A2C3 instrument. SiS, RS, and CD-V collected and analyzed the videos of the volcanic events during the field campaign. TY provided assistance at Sakurajima. SiS provided assistance at Etna. All authors contributed to the finalization of the paper.
The contact author has declared that none of the authors has any competing interests.
Publisher’s note: Copernicus Publications remains neutral with regard to jurisdictional claims made in the text, published maps, institutional affiliations, or any other geographical representation in this paper. While Copernicus Publications makes every effort to include appropriate place names, the final responsibility lies with the authors.
The authors are grateful to Valentin Fréret-Lorgeril, Frédéric Peyrin, Thierry Latchimi, and Masato Iguchi for their valuable help with drone operation in the field. We also wish to thank John Stix, Tom O'Hara, and the two anonymous referees, for their comprehensive reviews, and Cuiqi Zhang, for handling the manuscript.
This research has been supported by the Swiss National Science Foundation (grant no. 200020_204315/1).
This paper was edited by Cuiqi Zhang and reviewed by John Stix, Tom O'Hara, and two anonymous referees.
Aiuppa, A., Moretti, R., Federico, C., Giudice, G., Gurrieri, S., Liuzzo, M., Papale, P., Shinohara, H., and Valenza, M.: Forecasting Etna eruptions by real-time observation of volcanic gas composition, Geology, 35, 1115–1118, https://doi.org/10.1130/G24149A.1, 2007. a
Allison, R. S., Johnston, J. M., Craig, G., and Jennings, S.: Airborne Optical and Thermal Remote Sensing for Wildfire Detection and Monitoring, Sensors, 16, 1310, https://doi.org/10.3390/s16081310, 2016. a
Andronico, D. and Del Carlo, P.: PM10 measurements in urban settlements after lava fountain episodes at Mt. Etna, Italy: pilot test to assess volcanic ash hazard to human health, Nat. Hazards Earth Syst. Sci., 16, 29–40, https://doi.org/10.5194/nhess-16-29-2016, 2016. a
Andò, B., Baglio, S., Castorina, S., Graziani, S., Claudio, L., Marletta, V., and Trigona, C.: An Embedded Vision Tool for Volcanic Ash Analysis, in: 2021 IEEE Sensors Applications Symposium (SAS), 1–5 pp., https://doi.org/10.1109/SAS51076.2021.9530027, 2021. a
Antoine, R., Lopez, T., Tanguy, M., Lissak, C., Gailler, L., Labazuy, P., and Fauchard, C.: Geoscientists in the Sky: Unmanned Aerial Vehicles Responding to Geohazards, Surv. Geophys., 41, 1285–1321, https://doi.org/10.1007/s10712-020-09611-7, 2020. a
Bagheri, G., Rossi, E., Biass, S., and Bonadonna, C.: Timing and nature of volcanic particle clusters based on field and numerical investigations, J. Volcanol. Geotherm. Res., 327, 520–530, https://doi.org/10.1016/j.jvolgeores.2016.09.009, 2016. a, b, c, d, e, f
Balangue-Tarriela, M. I. R., Lagmay, A. M. F., Sarmiento, D. M., Vasquez, J., Baldago, M. C., Ybañez, R., Ybañez, A. A., Trinidad, J. R., Thivet, S., Gurioli, L., De Vries, B. V. W., Aurelio, M., Rafael, D. J., Bermas, A., and Escudero, J. A.: Analysis of the 2020 Taal Volcano tephra fall deposits from crowdsourced information and field data, Bull. Volcanol., 84, 35, https://doi.org/10.1007/s00445-022-01534-y, 2022. a
Bellingham, J. G. and Rajan, K.: Robotics in Remote and Hostile Environments, Science, 318, 1098–1102, https://doi.org/10.1126/science.1146230, 2007. a
Boccardo, P., Chiabrando, F., Dutto, F., Tonolo, F. G., and Lingua, A.: UAV Deployment Exercise for Mapping Purposes: Evaluation of Emergency Response Applications, Sensors, 15, 15717–15737, https://doi.org/10.3390/s150715717, 2015. a
Bonadonna, C., Genco, R., Gouhier, M., Pistolesi, M., Cioni, R., Alfano, F., Hoskuldsson, A., and Ripepe, M.: Tephra sedimentation during the 2010 Eyjafjallajökull eruption (Iceland) from deposit, radar, and satellite observations, J. Geophys. Res.-Solid Earth, 116, B12x, https://doi.org/10.1029/2011JB008462, 2011. a
Bonadonna, C., Folch, A., Loughlin, S., and Puempel, H.: Future developments in modelling and monitoring of volcanic ash clouds: outcomes from the first IAVCEI-WMO workshop on Ash Dispersal Forecast and Civil Aviation, Bull. Volcanol., 74, 1–10, https://doi.org/10.1007/s00445-011-0508-6, 2012. a, b
Bonadonna, C., Costa, A., Folch, A., and Koyaguchi, T.: Chapter 33 - Tephra Dispersal and Sedimentation, in: The Encyclopedia of Volcanoes (Second Edition), edited by: Sigurdsson, H., 587–597 pp., Academic Press, Amsterdam, ISBN 978-0-12-385938-9, https://www.sciencedirect.com/science/article/pii/B978012385938900033X (last access: 20 June 2025), 2015. a
Bonadonna, C., Biass, S., Menoni, S., and Gregg, C. E.: Chapter 8 - Assessment of risk associated with tephra-related hazards, in: Forecasting and Planning for Volcanic Hazards, Risks, and Disasters, edited by: Papale, P., Vol. 2 of Hazards and Disasters Series, 329–378 pp., Elsevier, ISBN 978-0-12-818082-2, https://www.sciencedirect.com/science/article/pii/B9780128180822000081 (last access: 20 June 2025), 2021. a
Brosch, E.: Volcanic Ash and Small Uncrewed Aerial Vehicle (sUAV) Interaction: In-situ Observations and Laboratory Experiments on Aircraft Failure, Front. Earth Sci., 10, 810962, https://doi.org/10.3389/feart.2022.810962, 2022. a
Brown, R. J., Bonadonna, C., and Durant, A. J.: A review of volcanic ash aggregation, Phys. Chem. Earth A/B/C, 45–46, 65–78, https://doi.org/10.1016/j.pce.2011.11.001, 2012. a, b, c
Calvari, S., Cannavò, F., Bonaccorso, A., Spampinato, L., and Pellegrino, A. G.: Paroxysmal Explosions, Lava Fountains and Ash Plumes at Etna Volcano: Eruptive Processes and Hazard Implications, Front. Earth Sci., 6, 107–127, https://doi.org/10.3389/feart.2018.00107, 2018. a
Carreño Ruiz, M., Bloise, N., Guglieri, G., and D’Ambrosio, D.: Numerical Analysis and Wind Tunnel Validation of Droplet Distribution in the Wake of an Unmanned Aerial Spraying System in Forward Flight, Drones, 6, 329, https://doi.org/10.3390/drones6110329, 2022. a
Civico, R., Ricci, T., Scarlato, P., Andronico, D., Cantarero, M., Carr, B. B., De Beni, E., Del Bello, E., Johnson, J. B., Kueppers, U., Pizzimenti, L., Schmid, M., Strehlow, K., and Taddeucci, J.: Unoccupied Aircraft Systems (UASs) Reveal the Morphological Changes at Stromboli Volcano (Italy) before, between, and after the 3 July and 28 August 2019 Paroxysmal Eruptions, Remote Sens., 13, 2870, https://doi.org/10.3390/rs13152870, 2021. a
Colombier, M., Mueller, S. B., Kueppers, U., Scheu, B., Delmelle, P., Cimarelli, C., Cronin, S. J., Brown, R. J., Tost, M., and Dingwell, D. B.: Diversity of soluble salt concentrations on volcanic ash aggregates from a variety of eruption types and deposits, Bull. Volcanol., 81, 39, https://doi.org/10.1007/s00445-019-1302-0, 2019. a
Costa, D., Burlando, P., and Priadi, C.: The importance of integrated solutions to flooding and water quality problems in the tropical megacity of Jakarta, Sustain. Cities Soc., 20, 199–209, https://doi.org/10.1016/j.scs.2015.09.009, 2016. a, b
Del Rosso, M. P., Sebastianelli, A., Spiller, D., Mathieu, P. P., and Ullo, S. L.: On-Board Volcanic Eruption Detection through CNNs and Satellite Multispectral Imagery, Remote Sens., 13, 3479, https://doi.org/10.3390/rs13173479, 2021. a
Delmelle, P.: Environmental impacts of tropospheric volcanic gas plumes, in: Volcanic Degassing, edited by: Oppenheimer, C., Pyle, D. M., and Barclay, J., Vol. 213, p. 0, Geological Society of London, ISBN 978-1-86239-136-9, https://doi.org/10.1144/GSL.SP.2003.213.01.23, 2003. a
Delmelle, P., Lambert, M., Dufrêne, Y., Gerin, P., and Óskarsson, N.: Gas/aerosol–ash interaction in volcanic plumes: New insights from surface analyses of fine ash particles, Earth Planet. Sci. Lett., 259, 159–170, https://doi.org/10.1016/j.epsl.2007.04.052, 2007. a
Delmelle, P., Wadsworth, F. B., Maters, E. C., and Ayris, P. M.: High Temperature Reactions Between Gases and Ash Particles in Volcanic Eruption Plumes, Rev. Mineral. Geochem., 84, 285–308, https://doi.org/10.2138/rmg.2018.84.8, 2018. a
de Moor, J. M., Stix, J., Avard, G., Muller, C., Corrales, E., Diaz, J. A., Alan, A., Brenes, J., Pacheco, J., Aiuppa, A., and Fischer, T. P.: Insights on Hydrothermal-Magmatic Interactions and Eruptive Processes at Poás Volcano (Costa Rica) From High-Frequency Gas Monitoring and Drone Measurements, Geophys. Res. Lett., 46, 1293–1302, https://doi.org/10.1029/2018GL080301, 2019. a
Diaz-Vecino, C., Rossi, E., Freret-Lorgeril, V., Fries, A., Gabellini, P., Lemus, J., Pollastri, S., Poulidis, A. P., Iguchi, M., and Bonadonna, C.: Aerodynamic characteristics and genesis of aggregates at Sakurajima Volcano, Japan, Sci. Rep., 12, 2044, https://doi.org/10.1038/s41598-022-05854-z, 2022. a, b, c
Diaz-Vecino, C., Rossi, E., Pollastri, S., Fries, A., Lemus, J., and Bonadonna, C.: Insights into the sticking probability of volcanic ash particles from laboratory experiments, Sci. Rep., 13, 21188, https://doi.org/10.1038/s41598-023-47712-6, 2023. a
Dongarrà, G., Manno, E., Varrica, D., Lombardo, M., and Vultaggio, M.: Study on ambient concentrations of PM10, PM10–2.5, PM2.5 and gaseous pollutants. Trace elements and chemical speciation of atmospheric particulates, Atmos. Environ., 44, 5244–5257, https://doi.org/10.1016/j.atmosenv.2010.08.041, 2010. a
Eliasson, J., Watson, I. M., and Weber, K.: Chapter 5 – In Situ Observations of Airborne Ash From Manned Aircraft, in: Volcanic Ash, edited by: Mackie, S., Cashman, K., Ricketts, H., Rust, A., and Watson, M., 89–98 pp., Elsevier, ISBN 978-0-08-100405-0, https://www.sciencedirect.com/science/article/pii/B9780081004050000094 (last access: 20 June 2025), 2016. a
Ferlito, C., Bruno, V., Salerno, G., Caltabiano, T., Scandura, D., Mattia, M., and Coltorti, M.: Dome-like behaviour at Mt. Etna: The case of the 28 December 2014 South East Crater paroxysm, Sci. Rep., 7, 5361, https://doi.org/10.1038/s41598-017-05318-9, 2017. a
Fernandez Galarreta, J., Kerle, N., and Gerke, M.: UAV-based urban structural damage assessment using object-based image analysis and semantic reasoning, Nat. Hazards Earth Syst. Sci., 15, 1087–1101, https://doi.org/10.5194/nhess-15-1087-2015, 2015. a
Filonchyk, M., Yan, H., Yang, S., and Hurynovich, V.: A study of PM2.5 and PM10 concentrations in the atmosphere of large cities in Gansu Province, China, in summer period, J. Earth Syst. Sci., 125, 1175–1187, https://doi.org/10.1007/s12040-016-0722-x, 2016. a
Flagan, R. C. and Seinfeld, J. H.: Fundamentals of air pollution engineering, Courier Corporation, https://books.google.com/books?hl=fr&lr=&id=-YZHbjUo9lAC&oi=fnd&pg=PP1&dq=Fundamentals+of+air+pollution+engineering&ots=zg8YiNNaQq&sig=7LIMkaIjc-jbI7sZ3awn_yKU6yU (last access: 20 June 2025), 2012. a
Folch, A.: A review of tephra transport and dispersal models: Evolution, current status, and future perspectives, J. Volcanol. Geotherm. Res., 235-236, 96–115, https://doi.org/10.1016/j.jvolgeores.2012.05.020, 2012. a
Freret-Lorgeril, V., Donnadieu, F., Eychenne, J., Soriaux, C., and Latchimy, T.: In situ terminal settling velocity measurements at Stromboli volcano: Input from physical characterization of ash, J. Volcanol. Geotherm. Res., 374, 62–79, https://doi.org/10.1016/j.jvolgeores.2019.02.005, 2019. a
Freret-Lorgeril, V., Gilchrist, J., Donnadieu, F., Jellinek, A., Delanoë, J., Latchimy, T., Vinson, J., Caudoux, C., Peyrin, F., Hervier, C., and Valade, S.: Ash sedimentation by fingering and sediment thermals from wind-affected volcanic plumes, Earth Planet. Sci. Lett., 534, 116072, https://doi.org/10.1016/j.epsl.2020.116072, 2020. a, b
Freret-Lorgeril, V., Bonadonna, C., Rossi, E., Poulidis, A. P., and Iguchi, M.: New insights into real-time detection of tephra grainsize, settling velocity and sedimentation rate, Sci. Rep., 12, 4650, https://doi.org/10.1038/s41598-022-08711-1, 2022. a
Fries, A., Lemus, J., Jarvis, P. A., Clarke, A. B., Phillips, J. C., Manzella, I., and Bonadonna, C.: The Influence of Particle Concentration on the Formation of Settling-Driven Gravitational Instabilities at the Base of Volcanic Clouds, Front. Earth Sci., 9, 640090, https://doi.org/10.3389/feart.2021.640090, 2021. a, b
Fries, A., Dominguez, L., Jarvis, P. A., Pistolesi, M., Manrique, N., Aguilar, R., Valdivia, D., Rossi, E., Pollastri, S., Horwell, C. J., and Bonadonna, C.: The post-2016 long-lasting Vulcanian activity of Sabancaya volcano (Peru) and associated aeolian remobilisation of volcanic ash, J. Volcanol. Geotherm. Res., 441, 107876, https://doi.org/10.1016/j.jvolgeores.2023.107876, 2023. a
Gabellini, P., Cioni, R., Geshi, N., Pistolesi, M., Miwa, T., Lacanna, G., and Ripepe, M.: Eruptive dynamics and fragmentation mechanisms during cyclic Vulcanian activity at Sakurajima volcano (Japan): Insights from ash texture analysis, J. Volcanol. Geotherm. Res., 428, 107582, https://doi.org/10.1016/j.jvolgeores.2022.107582, 2022. a
Gabellini, P., Rossi, E., Cioni, R., Pistolesi, M., Baumgartner, L., and Bonadonna, C.: The Hidden Structure of Volcanic Ash Aggregates as Unveiled by X-ray Micro-tomography, 2024. a, b, c
Gailler, L., Labazuy, P., Régis, E., Bontemps, M., Souriot, T., Bacques, G., and Carton, B.: Validation of a New UAV Magnetic Prospecting Tool for Volcano Monitoring and Geohazard Assessment, Remote Sens., 13, 894, https://doi.org/10.3390/rs13050894, 2021. a
Gailler, L., Labazuy, P., Régis, E., Peltier, A., and Ferrazzini, V.: Active structures and thermal state of the Piton de la Fournaise summit revealed by combined UAV magnetic and thermal infrared measurements, Volcanica, 5, 61–74, https://doi.org/10.30909/vol.05.01.6174, 2022. a
Gao, M., Hugenholtz, C. H., Fox, T. A., Kucharczyk, M., Barchyn, T. E., and Nesbit, P. R.: Weather constraints on global drone flyability, Sci. Rep., 11, 12092, https://doi.org/10.1038/s41598-021-91325-w, 2021. a
Gilbert, J. S., Lane, S. J., Sparks, R. S. J., and Koyaguchi, T.: Charge measurements on particle fallout from a volcanic plume, Nature, 349, 598–600, https://doi.org/10.1038/349598a0, 1991. a
Giordan, D., Manconi, A., Facello, A., Baldo, M., dell'Anese, F., Allasia, P., and Dutto, F.: Brief Communication: The use of an unmanned aerial vehicle in a rockfall emergency scenario, Nat. Hazards Earth Syst. Sci., 15, 163–169, https://doi.org/10.5194/nhess-15-163-2015, 2015. a
Giordan, D., Hayakawa, Y., Nex, F., Remondino, F., and Tarolli, P.: Review article: the use of remotely piloted aircraft systems (RPASs) for natural hazards monitoring and management, Nat. Hazards Earth Syst. Sci., 18, 1079–1096, https://doi.org/10.5194/nhess-18-1079-2018, 2018. a
Godfrey, I., Brenes, J. P. S., Cruz, M. M., Avard, G., and Meghraoui, K.: Launching the SnifferV and Sniffer4D multigas detectors into the active crater of the Poás Volcano in Costa Rica using unmanned aerial systems, Advanced UAV, 3, 153–176, https://publish.mersin.edu.tr/index.php/uav/article/view/1210 (last access: 20 June 2025), 2023. a
Gurioli, L., Tadini, A., Thivet, S., Médard, E., Berthod, C., and Vlastélic, I.: Monitoring of Eruptive Products: Deposits Associated with Pyroclastic Fallout, 45–166 pp., ISBN 978-1-78945-046-0, 2022. a, b
Guéhenneux, Y. and Gouhier, M.: HOTVOLC: the official French satellite-based service for operational monitoring and early warning of volcanic ash plumes, Bull. Volcanol., 86, 29, https://doi.org/10.1007/s00445-024-01716-w, 2024. a
Hansell, A. and Oppenheimer, C.: Health Hazards from Volcanic Gases: A Systematic Literature Review, Arch. Environ. Health: An Int. J., 59, 628–639, https://doi.org/10.1080/00039890409602947, 2004. a
Hersbach, H., Bell, B., Berrisford, P., Biavati, G., Horányi, A., Muñoz Sabater, J., Nicolas, J., Peubey, C., Radu, R., and Rozum, I.: ERA5 hourly data on pressure levels from 1979 to present, Copernicus climate change service (c3s) climate data store (cds), 10, https://doi.org/10.24381/cds.bd0915c6, 2023. a
Hillman, S. E., Horwell, C. J., Densmore, A. L., Damby, D. E., Fubini, B., Ishimine, Y., and Tomatis, M.: Sakurajima volcano: a physico-chemical study of the health consequences of long-term exposure to volcanic ash, Bull. Volcanol., 74, 913–930, https://doi.org/10.1007/s00445-012-0575-3, 2012. a
Hirose, M., Xiao, Y., Zuo, Z., Kamat, V. R., Zekkos, D., and Lynch, J.: Implementation of UAV localization methods for a mobile post-earthquake monitoring system, in: 2015 IEEE Workshop on Environmental, Energy, and Structural Monitoring Systems (EESMS) Proceedings, 66–71 pp., https://doi.org/10.1109/EESMS.2015.7175854, 2015. a
Horwell, C. J. and Baxter, P. J.: The respiratory health hazards of volcanic ash: a review for volcanic risk mitigation, Bull. Volcanol., 69, 1–24, https://doi.org/10.1007/s00445-006-0052-y, 2006. a
Hwang, J. Y., Jung, M. K., and Kwon, O. J.: Numerical Study of Aerodynamic Performance of a Multirotor Unmanned-Aerial-Vehicle Configuration, J. Aircraft, 52, 839–846, https://doi.org/10.2514/1.C032828, 2015. a
Iezzi, A. M., Buzard, R. M., Fee, D., Matoza, R. S., Gestrich, J. E., Jolly, A. D., Schmid, M., Cigala, V., Kueppers, U., Vossen, C. E. J., Cimarelli, C., Lacanna, G., and Ripepe, M.: UAS-Based Observations of Infrasound Directionality at Stromboli Volcano, Italy, Geophys. Res. Lett., 50, e2023GL102905, https://doi.org/10.1029/2023GL102905, 2023. a
Iguchi, M., Yamada, T., and Tameguri, T.: Sequence of Volcanic Activity of Sakurajima Volcano, Japan, as Revealed by Non-Eruptive Deflation, Front. Earth Sci., 10, 727909–727923, https://doi.org/10.3389/feart.2022.727909, 2022. a
Izumida, A., Uchiyama, S., and Sugai, T.: Application of UAV-SfM photogrammetry and aerial lidar to a disastrous flood: repeated topographic measurement of a newly formed crevasse splay of the Kinu River, central Japan, Nat. Hazards Earth Syst. Sci., 17, 1505–1519, https://doi.org/10.5194/nhess-17-1505-2017, 2017. a
James, M. R., Carr, B., D'Arcy, F., Diefenbach, A., Dietterich, H., Fornaciai, A., Lev, E., Liu, E., Pieri, D., Rodgers, M., Smets, B., Terada, A., Von Aulock, F., Walter, T., Wood, K., and Zorn, E.: Volcanological applications of unoccupied aircraft systems (UAS): Developments, strategies, and future challenges, Volcanica, 3, 67–114, https://doi.org/10.30909/vol.03.01.67114, 2020. a
Jenkins, S. F., Wilson, T. M., Magill, C., Miller, V., Stewart, C., Blong, R., Marzocchi, W., Boulton, M., Bonadonna, C., and Costa, A.: Volcanic ash fall hazard and risk, Global volcanic hazards and risk, 173–222 pp., https://books.google.com/books?hl=fr&lr=&id=8loZCgAAQBAJ&oi=fnd&pg=PA173&dq=Jenkins+2015+Volcanic+ash+fall+hazard+and+risk,+Global+Volcanic+Hazard+and+Risk&ots=eOo64NrPve&sig=dE1aLhV1pHxu_xF3tgdTLuID8wA (last access: 20 June 2025), 2015. a
Jordan, B. R.: Collecting field data in volcanic landscapes using small UAS (sUAS)/drones, J. Volcanol. Geotherm. Res., 385, 231–241, https://doi.org/10.1016/j.jvolgeores.2019.07.006, 2019. a
Koyama, T., Kanda, W., Utsugi, M., Kaneko, T., Ohminato, T., Watanabe, A., Tsuji, H., Nishimoto, T., Kuvshinov, A., and Honda, Y.: Aeromagnetic survey in Kusatsu-Shirane volcano, central Japan, by using an unmanned helicopter, Earth Planet. Space, 73, 139, https://doi.org/10.1186/s40623-021-01466-5, 2021. a
Lawson, R. P., O’Connor, D., Zmarzly, P., Weaver, K., Baker, B., Mo, Q., and Jonsson, H.: The 2D-S (Stereo) Probe: Design and Preliminary Tests of a New Airborne, High-Speed, High-Resolution Particle Imaging Probe, https://doi.org/10.1175/JTECH1927.1, 2006. a
Le Coz, J., Patalano, A., Collins, D., Guillén, N. F., García, C. M., Smart, G. M., Bind, J., Chiaverini, A., Le Boursicaud, R., Dramais, G., and Braud, I.: Crowdsourced data for flood hydrology: Feedback from recent citizen science projects in Argentina, France and New Zealand, J. Hydrol., 541, 766–777, https://doi.org/10.1016/j.jhydrol.2016.07.036, 2016. a
Lemus, J., Fries, A., Jarvis, P. A., Bonadonna, C., Chopard, B., and Lätt, J.: Modelling Settling-Driven Gravitational Instabilities at the Base of Volcanic Clouds Using the Lattice Boltzmann Method, Front. Earth Sci., 9, 713175, https://doi.org/10.3389/feart.2021.713175, 2021. a, b
Lenton, T.: Earth System Science: A Very Short Introduction, Oxford University Press, ISBN 978-0-19-178833-8, https://academic.oup.com/book/558 (last access: 20 June 2025), 2016. a
Lindner, G., Schraml, K., Mansberger, R., and Hübl, J.: UAV monitoring and documentation of a large landslide, Appl. Geomat., 8, 1–11, https://doi.org/10.1007/s12518-015-0165-0, 2016. a
Liu, C.-C., Chen, P.-L., Matsuo, T., and Chen, C.-Y.: Rapidly responding to landslides and debris flow events using a low-cost unmanned aerial vehicle, J. Appl. Remote Sens., 9, 096016, https://doi.org/10.1117/1.JRS.9.096016, 2015. a
Liu, E. J., Wood, K., Mason, E., Edmonds, M., Aiuppa, A., Giudice, G., Bitetto, M., Francofonte, V., Burrow, S., Richardson, T., Watson, M., Pering, T. D., Wilkes, T. C., McGonigle, A. J. S., Velasquez, G., Melgarejo, C., and Bucarey, C.: Dynamics of Outgassing and Plume Transport Revealed by Proximal Unmanned Aerial System (UAS) Measurements at Volcán Villarrica, Chile, Geochem. Geophys. Geosyst., 20, 730–750, https://doi.org/10.1029/2018GC007692, 2019. a, b
Liu, E. J., Aiuppa, A., Alan, A., Arellano, S., Bitetto, M., Bobrowski, N., Carn, S., Clarke, R., Corrales, E., de Moor, J. M., Diaz, J. A., Edmonds, M., Fischer, T. P., Freer, J., Fricke, G. M., Galle, B., Gerdes, G., Giudice, G., Gutmann, A., Hayer, C., Itikarai, I., Jones, J., Mason, E., McCormick Kilbride, B. T., Mulina, K., Nowicki, S., Rahilly, K., Richardson, T., Rüdiger, J., Schipper, C. I., Watson, I. M., and Wood, K.: Aerial strategies advance volcanic gas measurements at inaccessible, strongly degassing volcanoes, Sci. Adv., 6, eabb9103, https://doi.org/10.1126/sciadv.abb9103, 2020. a, b, c
Marchetti, E., Poggi, P., Donne, D. D., Pistolesi, M., Bonadonna, C., Bagheri, G., Pollastri, S., Thivet, S., Gheri, D., Gurioli, L., Harris, A., Hoskuldsoon, A., and Ripepe, M.: Real-time tephra-fallout accumulation rates and grain-size distributions using ASHER (ASH collector and sizER) disdrometers, J. Volcanol. Geotherm. Res., 429, 107611, https://doi.org/10.1016/j.jvolgeores.2022.107611, 2022. a, b
Martínez-de Dios, J. R., Merino, L., Caballero, F., and Ollero, A.: Automatic Forest-Fire Measuring Using Ground Stations and Unmanned Aerial Systems, Sensors, 11, 6328–6353, https://doi.org/10.3390/s110606328, 2011. a
Marzano, F. S., Picciotti, E., Montopoli, M., and Vulpiani, G.: Inside Volcanic Clouds: Remote Sensing of Volcanic Plumes Using Microwave Weather Radars, B. Am. Meteorol. Soc., 94, 1517–1586, https://doi.org/10.1175/BAMS-D-11-00160.1, 2013. a
Mori, T., Hashimoto, T., Terada, A., Yoshimoto, M., Kazahaya, R., Shinohara, H., and Tanaka, R.: Volcanic plume measurements using a UAV for the 2014 Mt. Ontake eruption, Earth Planet. Space, 68, 49, https://doi.org/10.1186/s40623-016-0418-0, 2016. a, b
Morino, Y., Chatani, S., Tanabe, K., Fujitani, Y., Morikawa, T., Takahashi, K., Sato, K., and Sugata, S.: Contributions of Condensable Particulate Matter to Atmospheric Organic Aerosol over Japan, Environ. Sci. Technol., 52, 8456–8466, https://doi.org/10.1021/acs.est.8b01285, 2018. a
Neal, C. A., Brantley, S. R., Antolik, L., Babb, J. L., Burgess, M., Calles, K., Cappos, M., Chang, J. C., Conway, S., Desmither, L., Dotray, P., Elias, T., Fukunaga, P., Fuke, S., Johanson, I. A., Kamibayashi, K., Kauahikaua, J., Lee, R. L., Pekalib, S., Miklius, A., Million, W., Moniz, C. J., Nadeau, P. A., Okubo, P., Parcheta, C., Patrick, M. R., Shiro, B., Swanson, D. A., Tollett, W., Trusdell, F., Younger, E. F., Zoeller, M. H., Montgomery-Brown, E. K., Anderson, K. R., Poland, M. P., Ball, J. L., Bard, J., Coombs, M., Dietterich, H. R., Kern, C., Thelen, W. A., Cervelli, P. F., Orr, T., Houghton, B. F., Gansecki, C., Hazlett, R., Lundgren, P., Diefenbach, A. K., Lerner, A. H., Waite, G., Kelly, P., Clor, L., Werner, C., Mulliken, K., Fisher, G., and Damby, D.: The 2018 rift eruption and summit collapse of Kīlauea Volcano, Science, 363, 367–374, https://doi.org/10.1126/science.aav7046, 2019. a
Paredes-Mariño, J., Forte, P., Alois, S., Chan, K. L., Cigala, V., Mueller, S. B., Poret, M., Spanu, A., Tomašek, I., Tournigand, P.-Y., Perugini, D., and Kueppers, U.: The lifecycle of volcanic ash: advances and ongoing challenges, Bull. Volcanol., 84, 51, https://doi.org/10.1007/s00445-022-01557-5, 2022. a
Pering, T. D., Liu, E. J., Wood, K., Wilkes, T. C., Aiuppa, A., Tamburello, G., Bitetto, M., Richardson, T., and McGonigle, A. J. S.: Combined ground and aerial measurements resolve vent-specific gas fluxes from a multi-vent volcano, Nat. Commun., 11, 3039, https://doi.org/10.1038/s41467-020-16862-w, 2020. a
Pering, T. D., Wilkes, T. C., Layana, S., Aguilera, F., and Aguilera, M.: The PiGas: A low-cost approach to volcanic gas sampling, J. Volcanol. Geotherm. Res., 449, p. 108063, https://doi.org/10.1016/j.jvolgeores.2024.108063, 2024. a, b, c, d
Poland, M. P., Lopez, T., Wright, R., and Pavolonis, M. J.: Forecasting, Detecting, and Tracking Volcanic Eruptions from Space, Remote Sens. Earth Syst. Sci., 3, 55–94, https://doi.org/10.1007/s41976-020-00034-x, 2020. a
Poulidis, A. P., Takemi, T., Iguchi, M., and Renfrew, I. A.: Orographic effects on the transport and deposition of volcanic ash: A case study of Mount Sakurajima, Japan, J. Geophys. Res.-Atmos., 122, 9332–9350, https://doi.org/10.1002/2017JD026595, 2017. a, b
Poulidis, A. P., Takemi, T., Shimizu, A., Iguchi, M., and Jenkins, S. F.: Statistical analysis of dispersal and deposition patterns of volcanic emissions from Mt. Sakurajima, Japan, Atmos. Environ., 179, 305–320, https://doi.org/10.1016/j.atmosenv.2018.02.021, 2018. a, b
Román, A., Tovar-Sánchez, A., Roque-Atienza, D., Huertas, I. E., Caballero, I., Fraile-Nuez, E., and Navarro, G.: Unmanned aerial vehicles (UAVs) as a tool for hazard assessment: The 2021 eruption of Cumbre Vieja volcano, La Palma Island (Spain), Sci. Total Environ., 843, 157092, https://doi.org/10.1016/j.scitotenv.2022.157092, 2022. a
Rose, W. I. and Durant, A. J.: Fate of volcanic ash: Aggregation and fallout, Geology, 39, 895–896, https://doi.org/10.1130/focus092011.1, 2011. a
Ross, P.-S., Dürig, T., Comida, P. P., Lefebvre, N., White, J., Andronico, D., Thivet, S., Eychenne, J., and Gurioli, L.: Standardized analysis of juvenile pyroclasts in comparative studies of primary magma fragmentation; 1. Overview and workflow, Bull. Volcanol., 84, 1–29, https://doi.org/10.1007/s00445-021-01516-6, 2022. a, b
Rossi, E., Bagheri, G., Beckett, F., and Bonadonna, C.: The fate of volcanic ash: premature or delayed sedimentation?, Nat. Commun., 12, 1303, https://doi.org/10.1038/s41467-021-21568-8, 2021. a
Rüdiger, J., Tirpitz, J.-L., de Moor, J. M., Bobrowski, N., Gutmann, A., Liuzzo, M., Ibarra, M., and Hoffmann, T.: Implementation of electrochemical, optical and denuder-based sensors and sampling techniques on UAV for volcanic gas measurements: examples from Masaya, Turrialba and Stromboli volcanoes, Atmos. Meas. Tech., 11, 2441–2457, https://doi.org/10.5194/amt-11-2441-2018, 2018. a, b
Sasaki, K., Inoue, M., Shimura, T., and Iguchi, M.: In Situ, Rotor-Based Drone Measurement of Wind Vector and Aerosol Concentration in Volcanic Areas, Atmosphere, 12, 376, https://doi.org/10.3390/atmos12030376, 2021. a
Schellenberg, B., Richardson, T., Watson, M., Greatwood, C., Clarke, R., Thomas, R., Wood, K., Freer, J., Thomas, H., Liu, E., Salama, F., and Chigna, G.: Remote sensing and identification of volcanic plumes using fixed-wing UAVs over Volcán de Fuego, Guatemala, J. Field Robot., 36, 1192–1211, https://doi.org/10.1002/rob.21896, 2019. a, b, c
Schmid, M., Kueppers, U., Huber, J., and Dingwell, D. B.: Drone deployed sensors: a tool for multiparametric near-vent measurements of volcanic explosions, Volcanica, 6, 95–106, https://doi.org/10.30909/vol.06.01.95106, 2023. a
Schmidt, A., Leadbetter, S., Theys, N., Carboni, E., Witham, C. S., Stevenson, J. A., Birch, C. E., Thordarson, T., Turnock, S., Barsotti, S., Delaney, L., Feng, W., Grainger, R. G., Hort, M. C., Höskuldsson, A., Ialongo, I., Ilyinskaya, E., Jóhannsson, T., Kenny, P., Mather, T. A., Richards, N. A. D., and Shepherd, J.: Satellite detection, long-range transport, and air quality impacts of volcanic sulfur dioxide from the 2014–2015 flood lava eruption at Bárdarbunga (Iceland), J. Geophys. Res.-Atmos., 120, 9739–9757, https://doi.org/10.1002/2015JD023638, 2015. a
Scollo, S., Coltelli, M., Bonadonna, C., and Del Carlo, P.: Tephra hazard assessment at Mt. Etna (Italy), Nat. Hazards Earth Syst. Sci., 13, 3221–3233, https://doi.org/10.5194/nhess-13-3221-2013, 2013. a
Scollo, S., Prestifilippo, M., Pecora, E., Corradini, S., Merucci, L., Spata, G., and Coltelli, M.: Eruption column height estimation of the 2011-2013 Etna lava fountains, Ann. Geophys., 57, S0214–S0214, https://doi.org/10.4401/ag-6396, 2014. a
Scollo, S., Bonadonna, C., and Manzella, I.: Settling-driven gravitational instabilities associated with volcanic clouds: new insights from experimental investigations, Bull. Volcanol., 79, 39, https://doi.org/10.1007/s00445-017-1124-x, 2017. a
Scollo, S., Prestifilippo, M., Bonadonna, C., Cioni, R., Corradini, S., Degruyter, W., Rossi, E., Silvestri, M., Biale, E., Carparelli, G., Cassisi, C., Merucci, L., Musacchio, M., and Pecora, E.: Near-Real-Time Tephra Fallout Assessment at Mt. Etna, Italy, Remote Sens., 11, 2987, https://doi.org/10.3390/rs11242987, 2019. a
Shingubara, R., Tsunogai, U., Ito, M., Nakagawa, F., Yoshikawa, S., Utsugi, M., and Yokoo, A.: Development of a drone-borne volcanic plume sampler, J. Volcanol. Geotherm. Res., 412, 107197, https://doi.org/10.1016/j.jvolgeores.2021.107197, 2021. a
Shinkura, R., Fujiyama, C., and Akiba, S.: Relationship between ambient sulfur dioxide levels and neonatal mortality near the Mt. Sakurajima volcano in Japan, J. Epidemiol., 9, 344–349, https://www.jstage.jst.go.jp/article/jea1991/9/5/9_5_344/_article/-char/ja/ (last access: 20 June 2025), 1999. a
Shinohara, H., Kazahaya, R., Ohminato, T., Kaneko, T., Tsunogai, U., and Morita, M.: Variation of volcanic gas composition at a poorly accessible volcano: Sakurajima, Japan, J. Volcanol. Geotherm. Res., 407, 107098, https://doi.org/10.1016/j.jvolgeores.2020.107098, 2020. a
Sibaja-Brenes, J. P., Terada, A., Solís, R. A., Luna, M. C., Castro, D. U., Ramírez, D. P., Gutiérrez, R. S., Arroyo, M. M., Godfrey, I., and Cruz, M. M.: Drone monitoring of volcanic lakes in Costa Rica: a new approach, Drone Syst. Appl., 11, 1–14, https://doi.org/10.1139/dsa-2022-0023, 2023. a
Simionato, R., Jarvis, P., Rossi, E., and Bonadonna, C.: PlumeTraP: A New MATLAB-Based Algorithm to Detect and Parametrize Volcanic Plumes from Visible-Wavelength Images, Remote Sens., 14, 1766, https://doi.org/10.3390/rs14071766, 2022. a
Singh, V.: The Environment and Its Components, in: Textbook of Environment and Ecology, edited by: Singh, V., 1–13 pp., Springer Nature, Singapore, ISBN 978-981-9988-46-4, https://doi.org/10.1007/978-981-99-8846-4_1, 2024. a
Snee, E., Jarvis, P., Simionato, R., Scollo, S., Prestifilippo, M., Degruyter, W., and Bonadonna, C.: Image analysis of volcanic plumes: A simple calibration tool to correct for the effect of wind, Volcanica, 6, 447–458, https://doi.org/10.30909/vol.06.02.447458, 2023. a
Sparks, R. S. J.: Forecasting volcanic eruptions, Earth Planet. Sci. Lett., 210, 1–15, https://doi.org/10.1016/S0012-821X(03)00124-9, 2003. a
Suzuki, Y., Costa, A., Cerminara, M., Esposti Ongaro, T., Herzog, M., Van Eaton, A., and Denby, L.: Inter-comparison of three-dimensional models of volcanic plumes, J. Volcanol. Geotherm. Res., 326, 26–42, https://doi.org/10.1016/j.jvolgeores.2016.06.011, 2016. a
Takishita, K., Poulidis, A.-P., and Iguchi, M.: Tephra segregation profiles based on disdrometer observations and tephra dispersal modeling: Vulcanian eruptions of Sakurajima volcano, Japan, Earth Planet. Space, 76, 29, https://doi.org/10.1186/s40623-023-01952-y, 2024. a
Tang, L. and Shao, G.: Drone remote sensing for forestry research and practices, J. Forest. Res., 26, 791–797, https://doi.org/10.1007/s11676-015-0088-y, 2015. a
Thivet, S., Gurioli, L., Di Muro, A., Derrien, A., Ferrazzini, V., Gouhier, M., Coppola, D., Galle, B., and Arellano, S.: Evidences of Plug Pressurization Enhancing Magma Fragmentation During the September 2016 Basaltic Eruption at Piton de la Fournaise (La Réunion Island, France), Geochem. Geophys. Geosyst., 21, e2019GC008 611, https://doi.org/10.1029/2019GC008611, 2020a. a, b
Thivet, S., Gurioli, L., Di Muro, A., Eychenne, J., Besson, P., and Nedelec, J.-M.: Variability of ash deposits at Piton de la Fournaise (La Reunion Island): insights into fragmentation processes at basaltic shield volcanoes, Bull. Volcanol., 82, 63, https://doi.org/10.1007/s00445-020-01398-0, 2020b. a
Thivet, S., Harris, A. J. L., Gurioli, L., Bani, P., Barnie, T., Bombrun, M., and Marchetti, E.: Multi-Parametric Field Experiment Links Explosive Activity and Persistent Degassing at Stromboli, Front. Earth Sci., 9, 669661, https://doi.org/10.3389/feart.2021.669661, 2021. a, b
Thivet, S., Carlier, J., Gurioli, L., Di Muro, A., Besson, P., Smietana, M., Boudon, G., Bachèlery, P., Eychenne, J., and Nedelec, J.-M.: Magmatic and phreatomagmatic contributions on the ash-dominated basaltic eruptions: Insights from the April and November–December 2005 paroxysmal events at Karthala volcano, Comoros, J. Volcanol. Geotherm. Res., 424, 107500, https://doi.org/10.1016/j.jvolgeores.2022.107500, 2022. a
Ventura Diaz, P. and Yoon, S.: High-Fidelity Computational Aerodynamics of Multi-Rotor Unmanned Aerial Vehicles, in: 2018 AIAA Aerospace Sciences Meeting, AIAA SciTech Forum, American Institute of Aeronautics and Astronautics, https://arc.aiaa.org/doi/10.2514/6.2018-1266 (last access: 20 June 2025), 2018. a
Vogel, A., Diplas, S., Durant, A. J., Azar, A. S., Sunding, M. F., Rose, W. I., Sytchkova, A., Bonadonna, C., Krüger, K., and Stohl, A.: Reference data set of volcanic ash physicochemical and optical properties, J. Geophys. Res.-Atmos., 122, 9485–9514, https://doi.org/10.1002/2016JD026328, 2017. a, b
Watts, A. C., Ambrosia, V. G., and Hinkley, E. A.: Unmanned Aircraft Systems in Remote Sensing and Scientific Research: Classification and Considerations of Use, Remote Sens., 4, 1671–1692, https://doi.org/10.3390/rs4061671, 2012. a
Wilkes, T. C., Pering, T. D., McGonigle, A. J. S., Tamburello, G., and Willmott, J. R.: A Low-Cost Smartphone Sensor-Based UV Camera for Volcanic SO2 Emission Measurements, Remote Sens., 9, 27, https://doi.org/10.3390/rs9010027, 2017. a
Wood, K., Liu, E. J., Richardson, T., Clarke, R., Freer, J., Aiuppa, A., Giudice, G., Bitetto, M., Mulina, K., and Itikarai, I.: BVLOS UAS Operations in Highly-Turbulent Volcanic Plumes, Front. Robot. AI, 7, p. 549716, https://doi.org/10.3389/frobt.2020.549716, 2020. a
Zorn, E. U., Le Corvec, N., Varley, N. R., Salzer, J. T., Walter, T. R., Navarro-Ochoa, C., Vargas-Bracamontes, D. M., Thiele, S. T., and Arámbula Mendoza, R.: Load Stress Controls on Directional Lava Dome Growth at Volcán de Colima, Mexico, Front. Earth Sci., 7, 84, https://doi.org/10.3389/feart.2019.00084, 2019. a