the Creative Commons Attribution 4.0 License.
the Creative Commons Attribution 4.0 License.
 | 07 Aug 2025
TanSat-2: a new satellite for mapping solar-induced chlorophyll fluorescence at both red and far-red bands with high spatiotemporal resolution
Dianrun Zhao
Chu Zou
Longfei Tian
Meng Fan
Liangyun Liu
Global observations of solar-induced chlorophyll fluorescence (SIF) serve as a robust proxy for monitoring vegetation photosynthetic activity and elucidating the terrestrial carbon cycle. To date, several atmospheric remote sensing satellites have been deployed to generate global SIF products. However, accurate mapping of dual-band (red and far-red) SIF with daily temporal resolution and kilometer-level spatial resolution remains a critical gap, despite its significance for various applications. The Chinese next-generation greenhouse gas monitoring satellite, TanSat-2, is set to succeed the original TanSat satellite, aiming to record the fraction of greenhouse gases, pollutants, and SIF measurements from space. According to current schedules, TanSat-2 is slated for launch in 2026. This satellite will feature a wide swath of 2900 km, a high spatial resolution of 2 km at an orbit altitude of 7000 km, and near-daily global coverage. TanSat-2 is equipped with two spectral channels, 747–777 and 672–702 nm, operating at a spectral resolution of 0.12 nm, thereby offering significant potential for mapping SIF in both the red and the far-red bands. In this study, we explore the prospective capabilities of TanSat-2 for SIF retrieval through simulation experiments. First, we simulated the satellite's radiative transfer processes using the Moderate Resolution Atmospheric Transmission 5 (MODTRAN 5) and Soil Canopy Observation of Photosynthesis and Energy (SCOPE) models. An end-to-end orbit simulation dataset for TanSat-2 was generated by aggregating global bottom-of-atmosphere (BOA) reflectance, meteorological datasets, and the global Orbiting Carbon Observatory-2 (OCO-2) SIF dataset (GOSIF). We then assessed the theoretical accuracy of TanSat-2 based on this spectral simulation dataset, yielding root mean square error (RMSE) values of 0.24 and 0.19 mW m−2 sr−1 nm−1 for SIF retrievals at 740 and 685 nm, respectively. Finally, we examined the global prospects of TanSat-2 SIF retrievals using the end-to-end orbit simulations. Comparisons between the anticipated TanSat-2 SIF retrievals and GOSIF inputs revealed excellent correlation at both bands, with R2 values of 0.88 and 0.61 and RMSE values of 0.082 and 0.061 mW m−2 sr−1 nm−1, respectively. Thus, TanSat-2 is poised to provide a valuable data resource for reliable SIF retrievals in the red and far-red bands, characterized by high spatiotemporal resolution on a global scale.
- Article
(7236 KB) - Full-text XML
- BibTeX
- EndNote


Solar-induced chlorophyll fluorescence (SIF) is a subtle emission produced by chlorophyll during photosynthesis, spanning approximately 640–850 nm with distinct peaks around 685 and 740 nm (Mohammed et al., 2019; Guanter et al., 2014). Recent advancements in hyperspectral satellite sensor technology have made global SIF monitoring a focal point of research (Guanter et al., 2012; Köhler et al., 2015b). SIF mapping from satellites offers a robust tool for assessing global vegetation photosynthetic activity and understanding the terrestrial carbon cycle (Zheng et al., 2024).
Table 1Specifications of the launched and scheduled satellites with the potential of SIF retrieval.
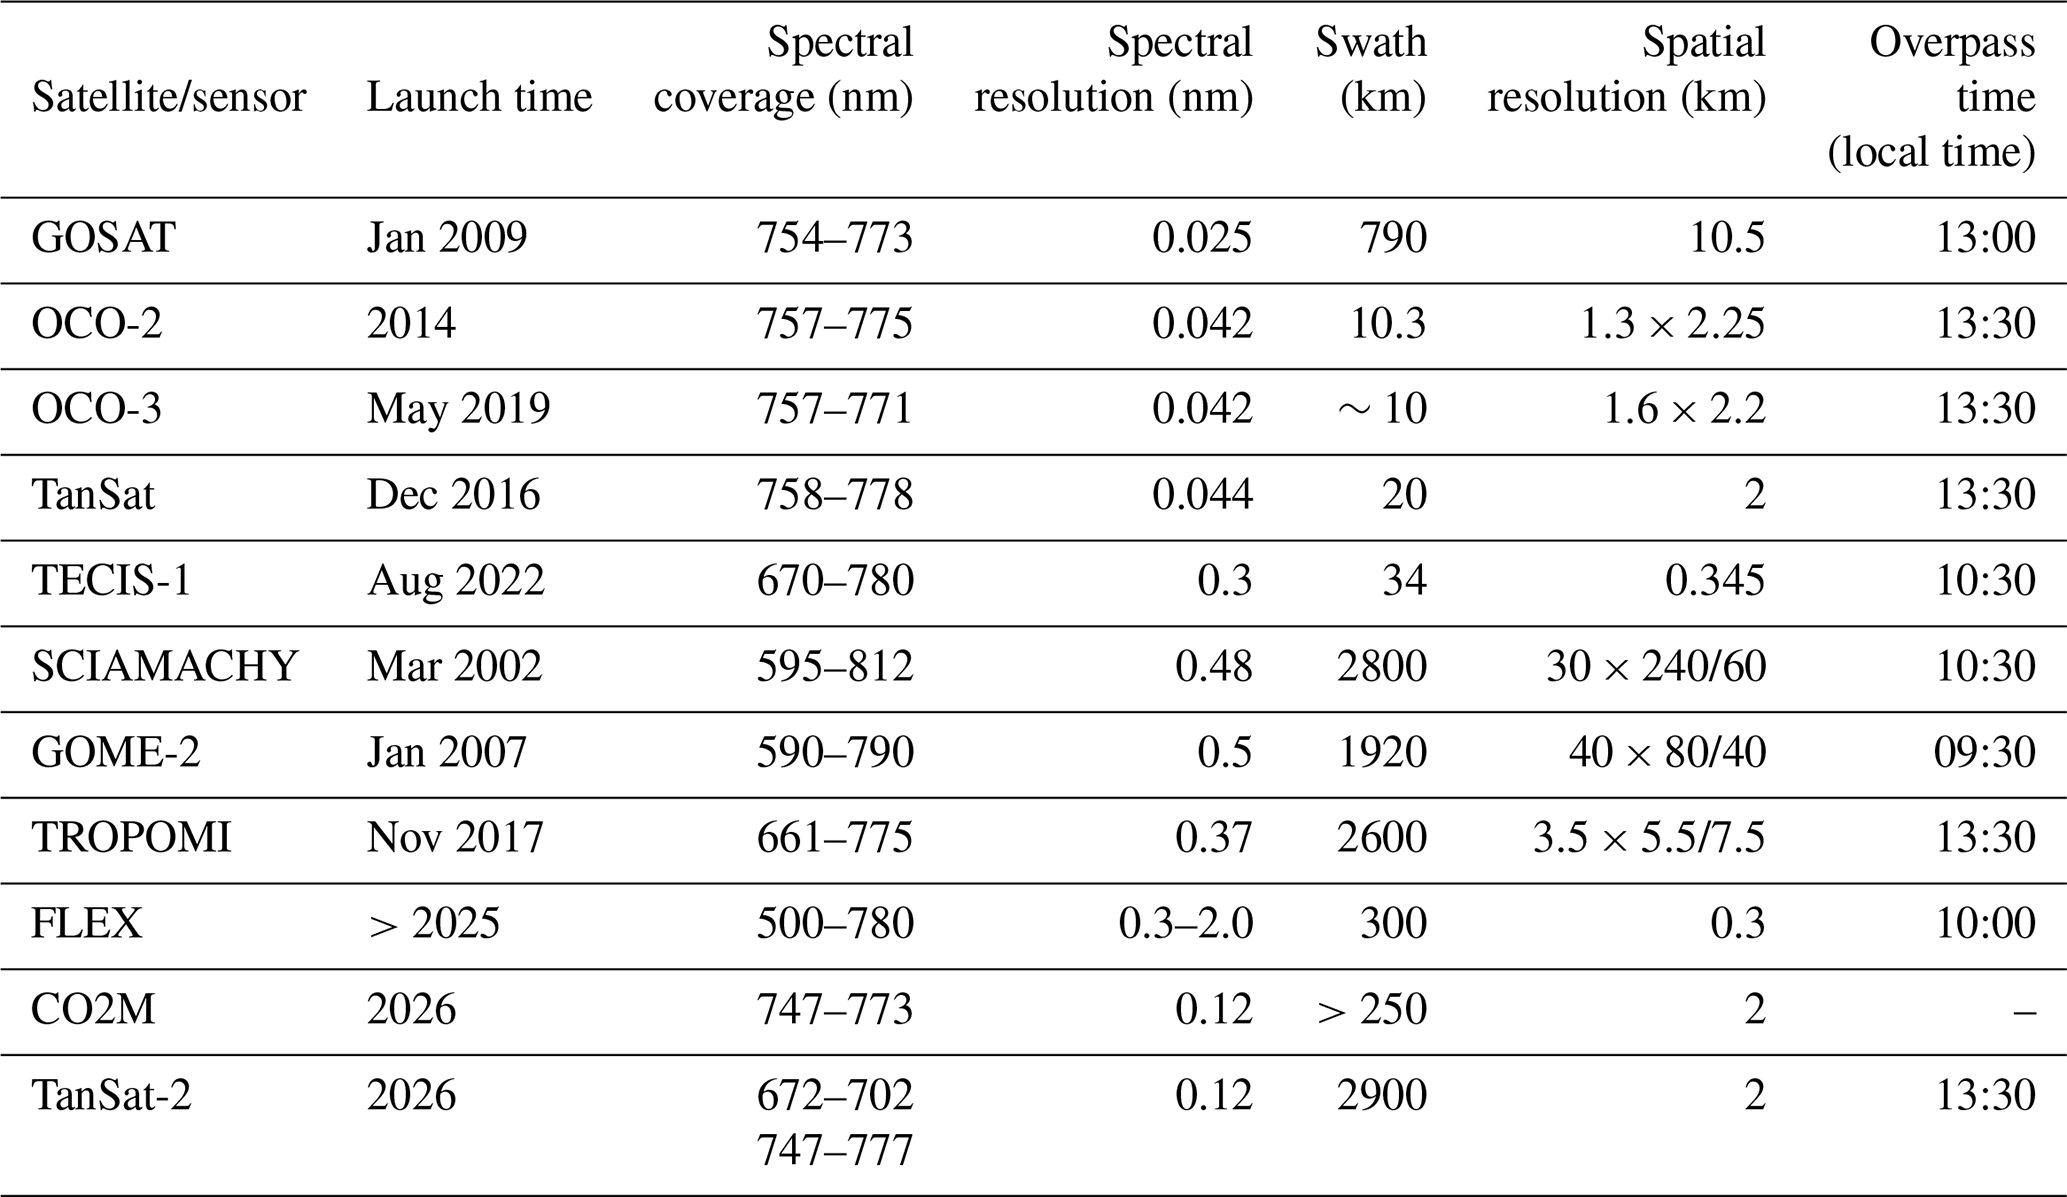
Table 1 outlines the specifications of satellites and instruments capable of SIF retrieval. The first global SIF map utilized data from the Japanese Greenhouse Gases Observing SATellite (GOSAT), which launched in 2009. GOSAT operates within a spectral range of 754–773 nm and boasts a spectral resolution of 0.025 nm. Its coverage includes a swath width of 790 km and a spatial resolution of 10.5 km diameter, providing moderate-resolution surface data but lacking in continuous global coverage due to periodic sampling intervals (Frankenberg et al., 2011a; Joiner et al., 2011). Conversely, the Orbiting Carbon Observatory-2 (OCO-2) enhances SIF retrieval capabilities with a 100-fold increase in observations compared to GOSAT, although it has a narrower swath of 10.3 km and a pixel size of 1.3 km × 2.25 km, still falling short of continuous global coverage (Frankenberg et al., 2014a; Sun et al., 2017). The subsequent OCO-3, launched in 2019, maintains similar specifications with a swath width of around 10 km and a spatial resolution of 1.6×2.2 km (Taylor et al., 2020). Launched in 2016, the Chinese Carbon Dioxide Observation Satellite Mission (TanSat) covers a spectral range of 758–778 nm and offers a spectral resolution of 0.044 nm, with a swath width of 20 km and a spatial resolution of 2 km, facilitating SIF retrieval at Fe (centered at 758.8 nm) and KI (centered at 771 nm) Fraunhofer lines (Du et al., 2018). The recently launched First Terrestrial Ecosystem Carbon Inventory Satellite (TECIS-1) in August 2022 operates across 670–780 nm with a swath width of 34 km and an unprecedented spatial resolution of 375 m, suitable for dual-band (red and far-red) SIF retrieval (Du et al., 2020, 2022; Zou et al., 2021). The Global Ozone Monitoring Experiment 2 (GOME-2) on the MetOp-A/B satellites, launched by Europe in 2007, operates in the red and near-infrared spectra (Joiner et al., 2013, 2016; Köhler et al., 2015a). Initially featuring a pixel resolution of 40 km × 80 km, this was later refined to 40 km × 40 km for MetOp-A starting in July 2013. GOME-2 scans the Earth with a 1920 km wide swath, achieving global coverage approximately every 1.5 d. Despite its relatively coarse resolution, GOME-2, along with the Scanning Imaging Absorption Spectrometer for Atmospheric Chartography (SCIAMACHY) aboard ENVISAT, has facilitated the creation of two global, spatially continuous solar-induced fluorescence (SIF) datasets. SCIAMACHY covers a spectral range of 595–812 nm at 0.48 nm resolution, extending across a 2800 km swath with pixel sizes varying from 30 km × 240 km to 30 km × 60 km (Joiner et al., 2012; Köhler et al., 2015a).
Launched in 2017, the TROPOspheric Monitoring Instrument (TROPOMI) on the Sentinel-5 Precursor offers unprecedented detail with its 2600 km swath and high spatial resolution of 3.5 km × 5.5/7.5 km, ensuring daily global coverage (Guanter et al., 2015; Köhler et al., 2018; Zhao et al., 2022a). As the first imaging spectrometer of its kind, TROPOMI provides kilometer-level spatial resolution and continuous spectral sampling from 675 to 775 nm at a resolution of 0.38 nm. While it delivers enhanced radiometric sensitivity and broad spectral coverage, its spectral resolution remains suboptimal for detailed red SIF retrieval (Zou et al., 2022).
Looking ahead to post-2025, the planned FLEX mission aims to survey the 500–780 nm range with an adaptable spectral resolution between 0.3 and 2.0 nm. It will feature a swath width of at least 150 km and a spatial resolution as fine as 0.3 km (Vicent et al., 2016; Coppo et al., 2017). This mission is set to significantly advance our monitoring of photosynthesis and vegetation health. Concurrently, the CO2M mission, slated for a 2026 launch, will offer high spectral and spatial resolutions. However, its narrower swath will limit its coverage area, impacting its ability to monitor SIF extensively.
The next-generation Chinese greenhouse gas monitoring satellite, TanSat-2, is scheduled for launch in 2026 as the successor to the original TanSat satellite. Unlike its predecessor, which primarily focused on carbon dioxide monitoring, TanSat-2 is designed to facilitate global carbon stocktaking. To achieve this objective, it will combine a wide swath of 2900 km with high spatial resolution (2 km at an orbit altitude of 7000 km) and near-daily global coverage. Compared to the TROPOMI satellite, TanSat-2's broader swath and enhanced spatial resolution are expected to yield more frequent and detailed observations, thereby improving the quality and utility of data collected for environmental monitoring and research. Additionally, TanSat-2 will record upwelling radiances with a spectral resolution of 0.12 nm across both the O2-A and the O2-B bands. This extensive spectral coverage and high spectral resolution will allow for a more accurate exploitation of the entire SIF spectrum, rather than being limited to the far-red SIF.
Red SIF is recognized for its superior ability to reflect the biochemical characteristics and photosynthetic capacity of vegetation compared to far-red SIF (Verrelst et al., 2015). However, the absorption features in the red region tend to be narrower and less pronounced than those in the far-red band, complicating the retrieval of SIF in the red spectral region. Furthermore, there are currently few satellites equipped with red SIF bands, resulting in ongoing challenges with poor signal quality and insufficient accuracy at the application level for existing red SIF products (Dechant et al., 2022). Consequently, most satellite-based SIF products have focused on the far-red band. Some studies have suggested that a payload with high spectral resolution (0.1 nm) and a high signal-to-noise ratio (SNR > 1500) could fulfill the requirements for retrieving red SIF, as demonstrated through simulations of satellite remote sensing accuracy (Zou et al., 2022). Presently, existing spaceborne imaging spectrometers, including TROPOMI, TECIS-1, GOME-2, and FLEX, do not meet the stringent spectral requirements necessary for effective red SIF retrieval. Therefore, TanSat-2 is poised to be the only satellite capable of delivering high-quality SIF retrievals for both the red and the far-red bands (Zou et al., 2022). With its wide swath of 2900 km and spatial resolution of 2 km, TanSat-2 is anticipated to significantly enhance global SIF observation capabilities compared to all current satellites.
In this study, we aim to (1) generate an end-to-end orbit simulation dataset for the TanSat-2 satellite, (2) optimize the empirical parameters of the data-driven algorithm for red and far-red SIF retrieval, (3) investigate TanSat-2's potential for improving SIF retrieval accuracy, and (4) explore the prospects of TanSat-2 for global-scale SIF monitoring.
2.1 TanSat-2 satellite
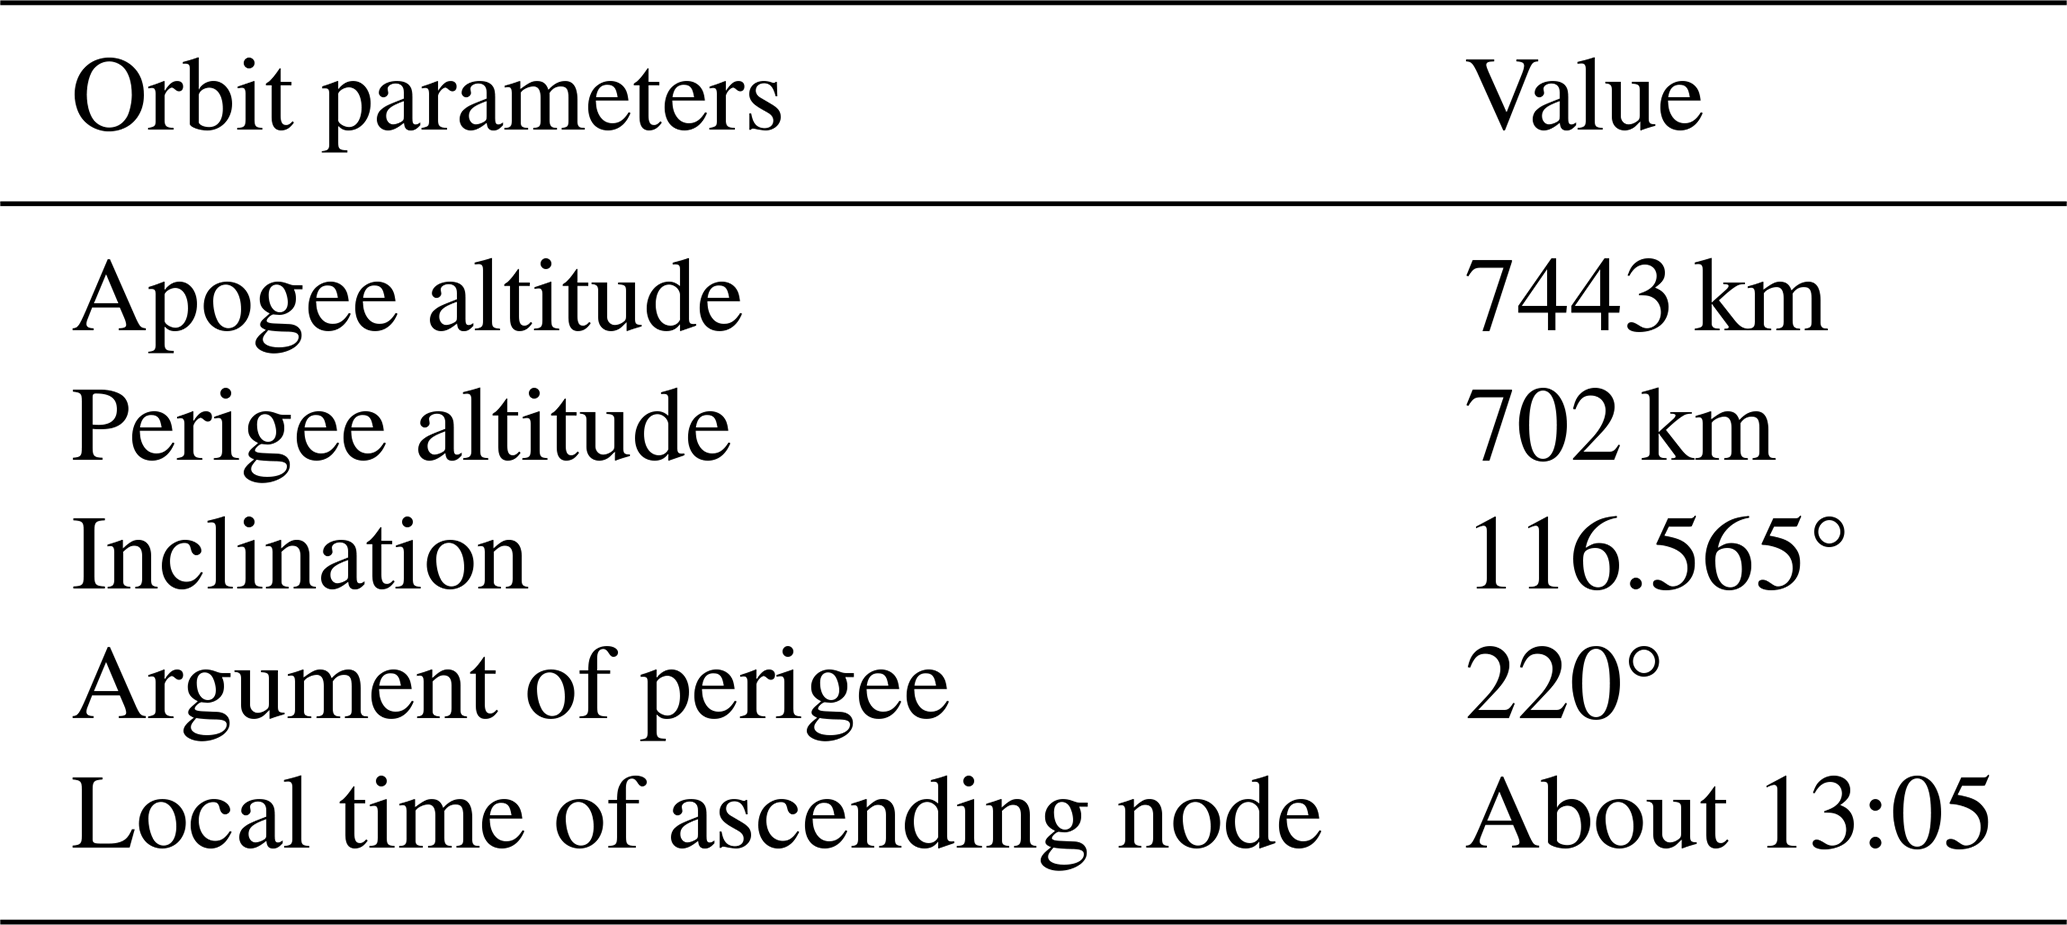
The second iteration of China's TanSat satellite, TanSat-2, operates in a critically inclined sun-synchronous orbit with an inclination of approximately 116.6°. Positioned primarily above the Northern Hemisphere, the satellite is strategically placed to monitor densely populated regions, such as Asia, North America, and Europe, where human activities are concentrated. By meticulously adjusting various orbital elements, including inclination, semi-major axis, and eccentricity, TanSat-2 achieves a nodal precession rate of roughly 0.98° d−1 eastward. This specific configuration preserves the sun-synchronous nature of the orbit, ensuring that observations are made under consistent solar illumination at the same local time each day. The parameters of this orbit are detailed in Table 2, which facilitates the simulation of the satellite's trajectory.
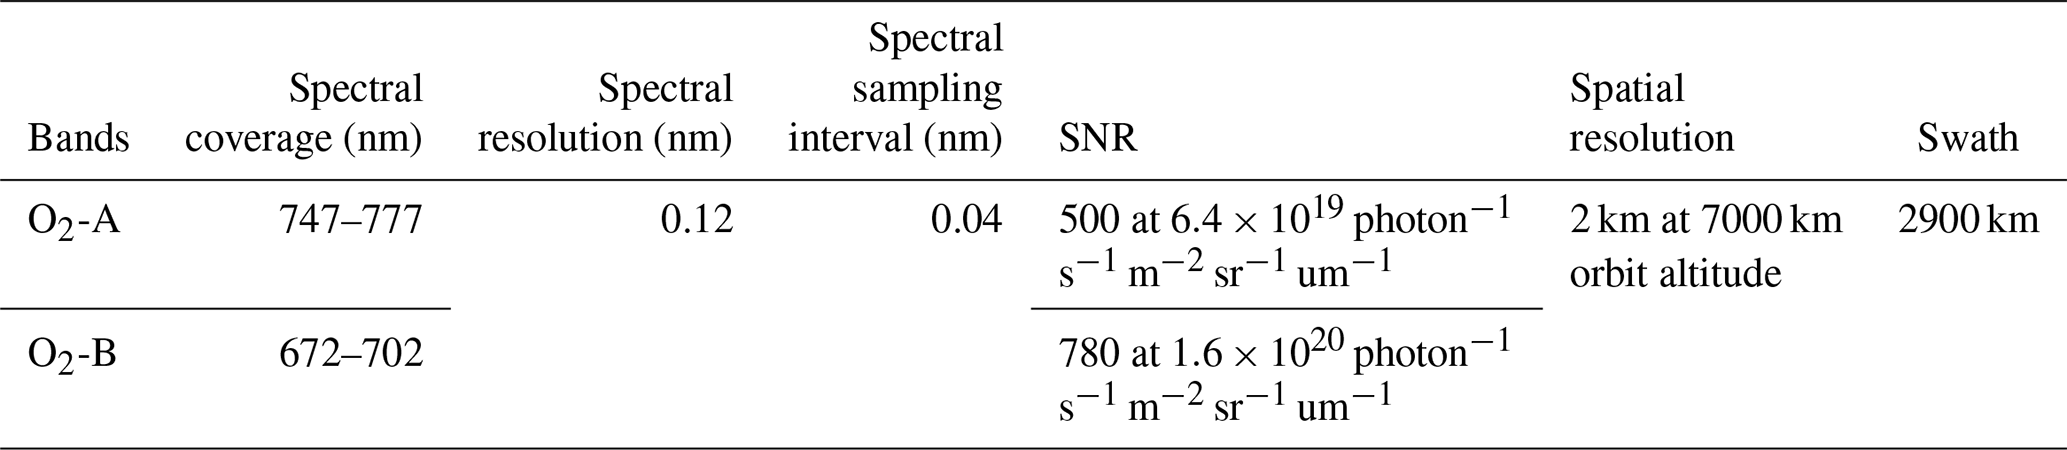
Equipped with four advanced payloads, TanSat-2 surpasses its predecessor in capability. These include the ultra-wide-swath hyperspectral imager for co-monitoring GHG and NO2 (Uwhigo), which monitors greenhouse gases (GHGs) and nitrogen dioxide (NO2) across a 1500 km swath with a 4 km resolution. The high-resolution hyperspectral imager for monitoring hotspot emission (H3imager) targets GHG emissions from localized sources with a 50 km swath and 500 m resolution. The cloud and aerosol polarization hyperspectral imager (CAPHI) is designed to assess aerosol optical depth (AOD) and cloud coverage, while the dual-band SIF imaging spectrometer (DuSIFIS) focuses on far-red and red SIF detection. The specifications for the DuSIFIS payload are provided in Table 3.
Table 3Preliminary specifications for the O2 bands included in the TanSat-2 payloads.
2.2 Simulation experiments
2.2.1 Satellite radiative transfer simulation of TanSat-2
Assuming a Lambertian surface, the top-of-atmosphere (TOA) radiance observed by an instrument over vegetative targets can be approximated as (Guanter et al., 2010; Liu and Liu, 2014):
where Isol is the extraterrestrial solar radiation, and μ0 denotes the cosine of the solar zenith angle (SZA). Reflectance from the atmospheric path is indicated by ρ0, and surface reflectance is denoted by ρs. The spherical albedo of the atmosphere is symbolized by S. The total atmospheric transmittance, , encompasses both downward and upward transmission, with T↑ specifically referring to the transmission from the surface to the sensor. The fluorescence signal (SIF), emitted at the top of the canopy (TOC), should be excluded when modeling radiance for areas without vegetation.
The Soil Canopy Observation Photochemistry and Energy Flux (SCOPE) model (van der Tol et al., 2009) is capable of simulating vegetation canopy reflectance spectra and SIF under diverse canopy structures and leaf biochemical conditions, including leaf optical properties (e.g., chlorophyll content, dry matter) and canopy structural parameters (e.g., leaf area index, canopy height). Atmospheric radiative transfer functions were derived from the Moderate Resolution Atmospheric Transmission 5 model (MODTRAN 5; Berk et al., 1998, 2000) to generate TOA radiance. Critical processing steps included (1) using the MODTRAN interrogation technique (MIT) (Verhoef and Bach, 2012; Verhoef et al., 2018) to extract 18 spectral transfer functions parameterized by aerosol optical depth, water vapor content, and observation geometry from MODTRAN 5 outputs and (2) using the RTMo module in SCOPE, which dynamically couples these functions with bidirectional reflectance distribution (BRDF) and SIF emission spectra to resolve surface–atmosphere interactions. The simulated atmospheric parameters, canopy reflectance, and SIF signals were then integrated using the radiative transfer operator defined in Eq. (1) to generate the TOA radiance spectra across the 640–850 nm range.
For the original MODTRAN 5 dataset, the spatial resolution (SR) and spectral sampling interval (SSI) are approximately 0.005 nm. To simulate satellite observations, the original spectral data underwent convolution and resampling techniques tailored to the specific SR and SSI of various bands, as detailed in Table 3. Based on the configuration of the TanSat-2 satellite, we established two spectral channels with distinct spectral ranges. The spectral response functions were modeled using Gaussian functions, which correlate with the SR (Zhao et al., 2022b; Zou et al., 2022). This modeling process employs a filter kernel, K, defined by both the original and the adjusted SR levels, to convolve the initial 0.005 nm spectrum into the new spectral resolution. Consequently, the radiance for a given wavelength (λ) is calculated using the following equations (Damm et al., 2011; Zou et al., 2022):
where λ represents the center wavelength after undergoing spectral sampling, while corresponds to the wavelength in the original dataset. denotes the TOA radiance output by MODTRAN and SCOPE simulations. The term SRo refers to the initial spectral resolution (0.005 nm), and SRd corresponds to the spectral resolution relevant to the various channels. The parameter ε, indicating the kernel's half-width in wavelength terms, was set to 3 times SRd. For computational efficiency, a summation approach was utilized in lieu of direct integration, with the differential wavelength interval, , fixed at 0.005 nm. This process involved resampling the original spectra by selecting wavelength points (λ) at intervals defined by the SSI for each channel, ensuring adequate coverage within the sensor's spectral coverage (SC).
Finally, random noise was incorporated into the data, quantified by the SNR, which varies with both radiance levels and wavelength (Köhler et al., 2015a; Zou et al., 2022):
where SNRref represents the reference SNR at the reference radiance level Radref.
2.2.2 Spectral simulation dataset
In the context of vegetative scenes, a total of 1008 cases were examined, incorporating combinations of diverse leaf biochemical characteristics, canopy structures, and geometric conditions, as illustrated in Table 4. For non-vegetation targets, 10 distinct reflectance spectra representing snow and bare soil surfaces were sourced from the Image Visualization Environment (ENVI) spectral library (Clark and Swayze, 1995). A total of 1280 atmospheric and observational conditions were simulated (Table 4), with the observational conditions aligning with those of the SCOPE model. Ultimately, 12 800 non-vegetated spectra and 161 280 vegetative spectra were generated as training and test datasets.
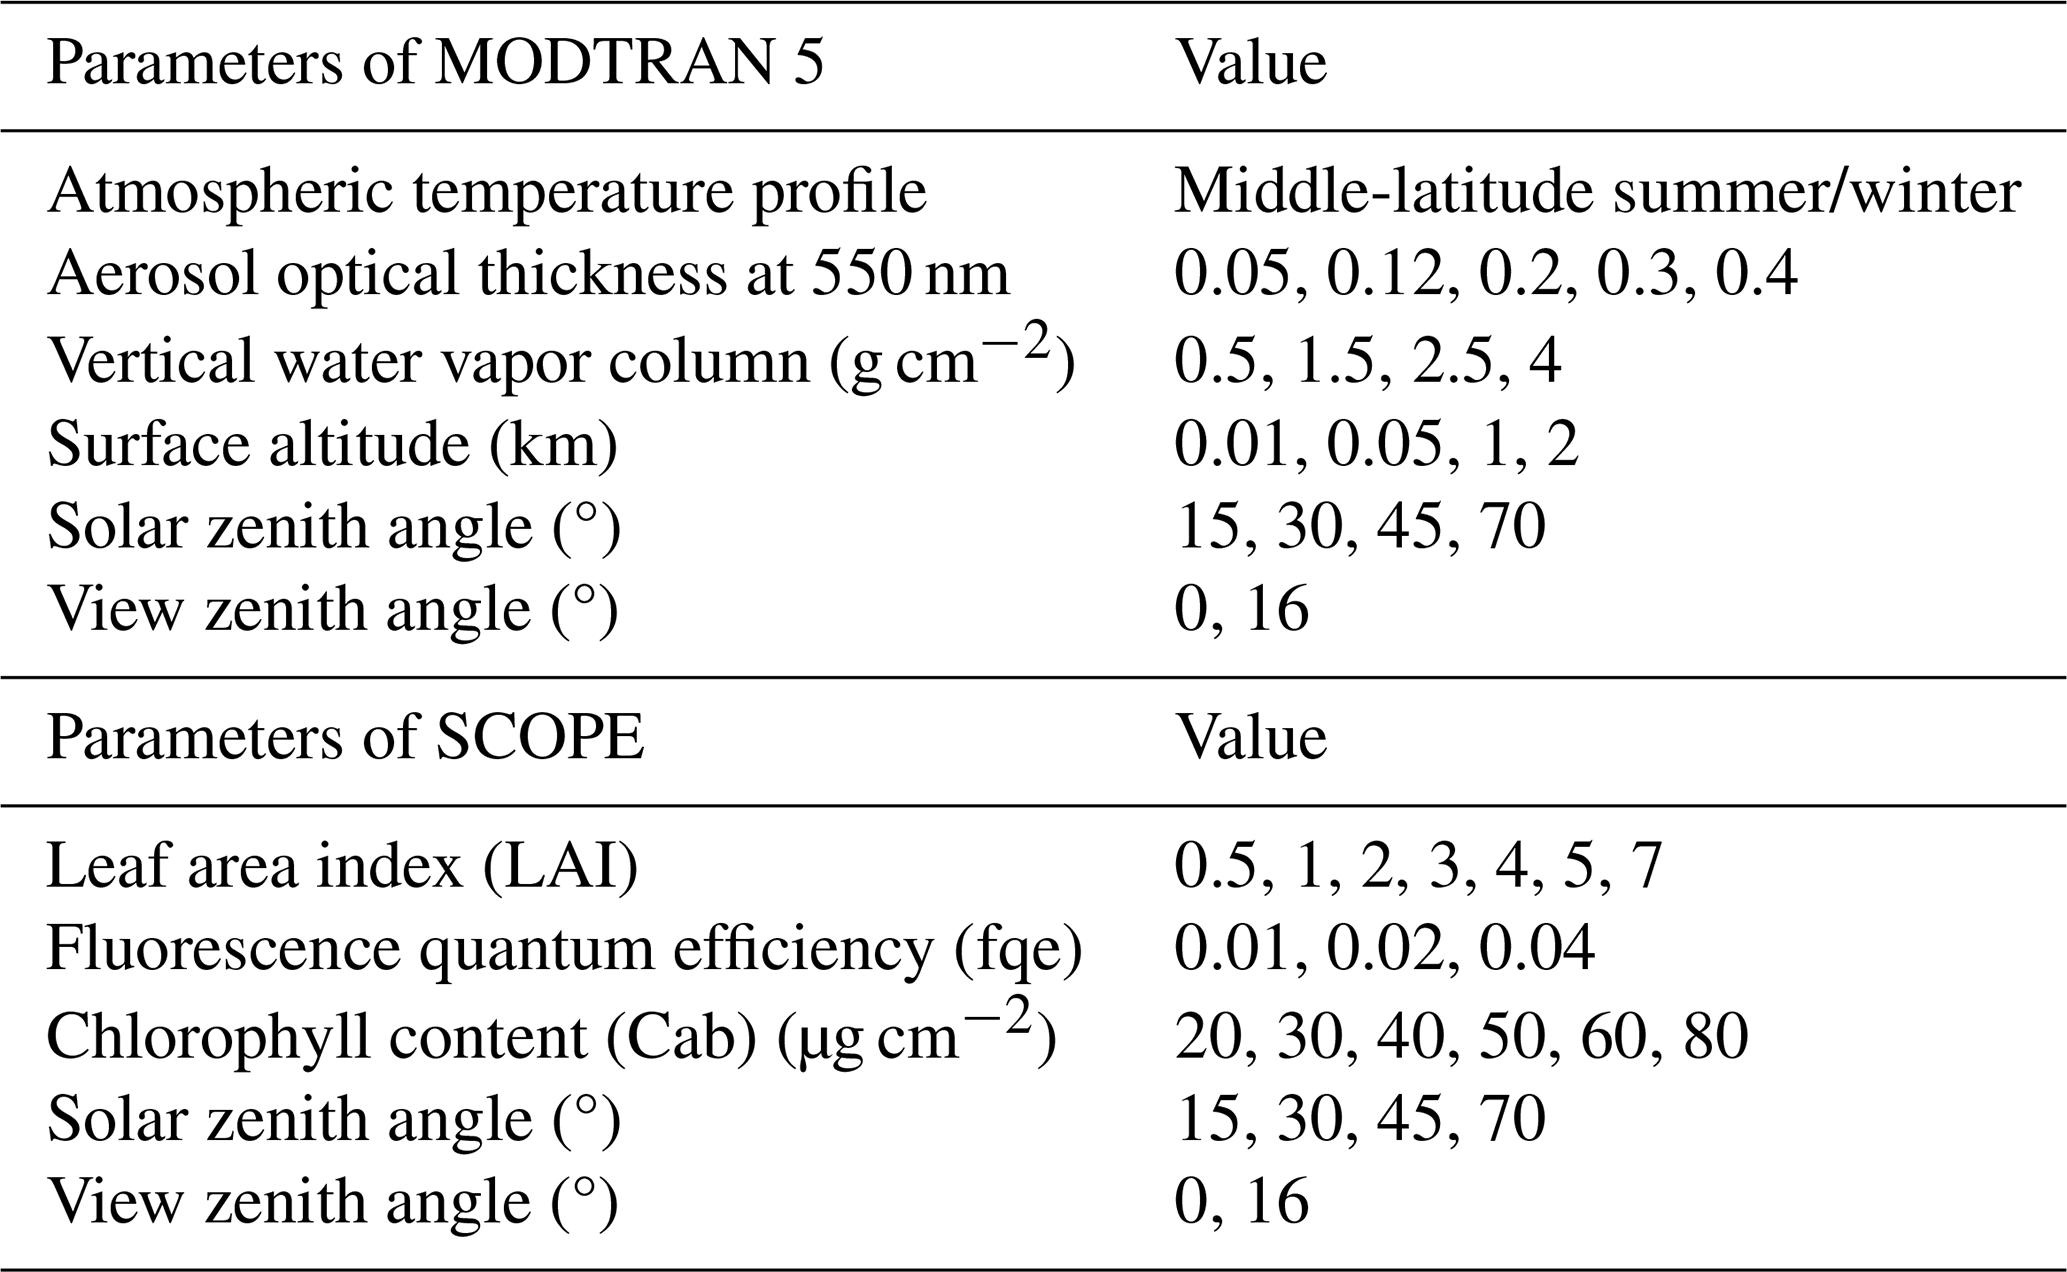
Figure 1 presents the simulated spectrum with an SR of 0.12 nm and an SSI of 0.04 nm. The displayed solar-induced fluorescence (SIF) spectra exhibit characteristic double peaks in the red and far-red bands, around 685 and 740 nm, respectively. Additionally, the spectra distinctly reveal the absorption features of the Earth's atmosphere, as well as the Fraunhofer lines.
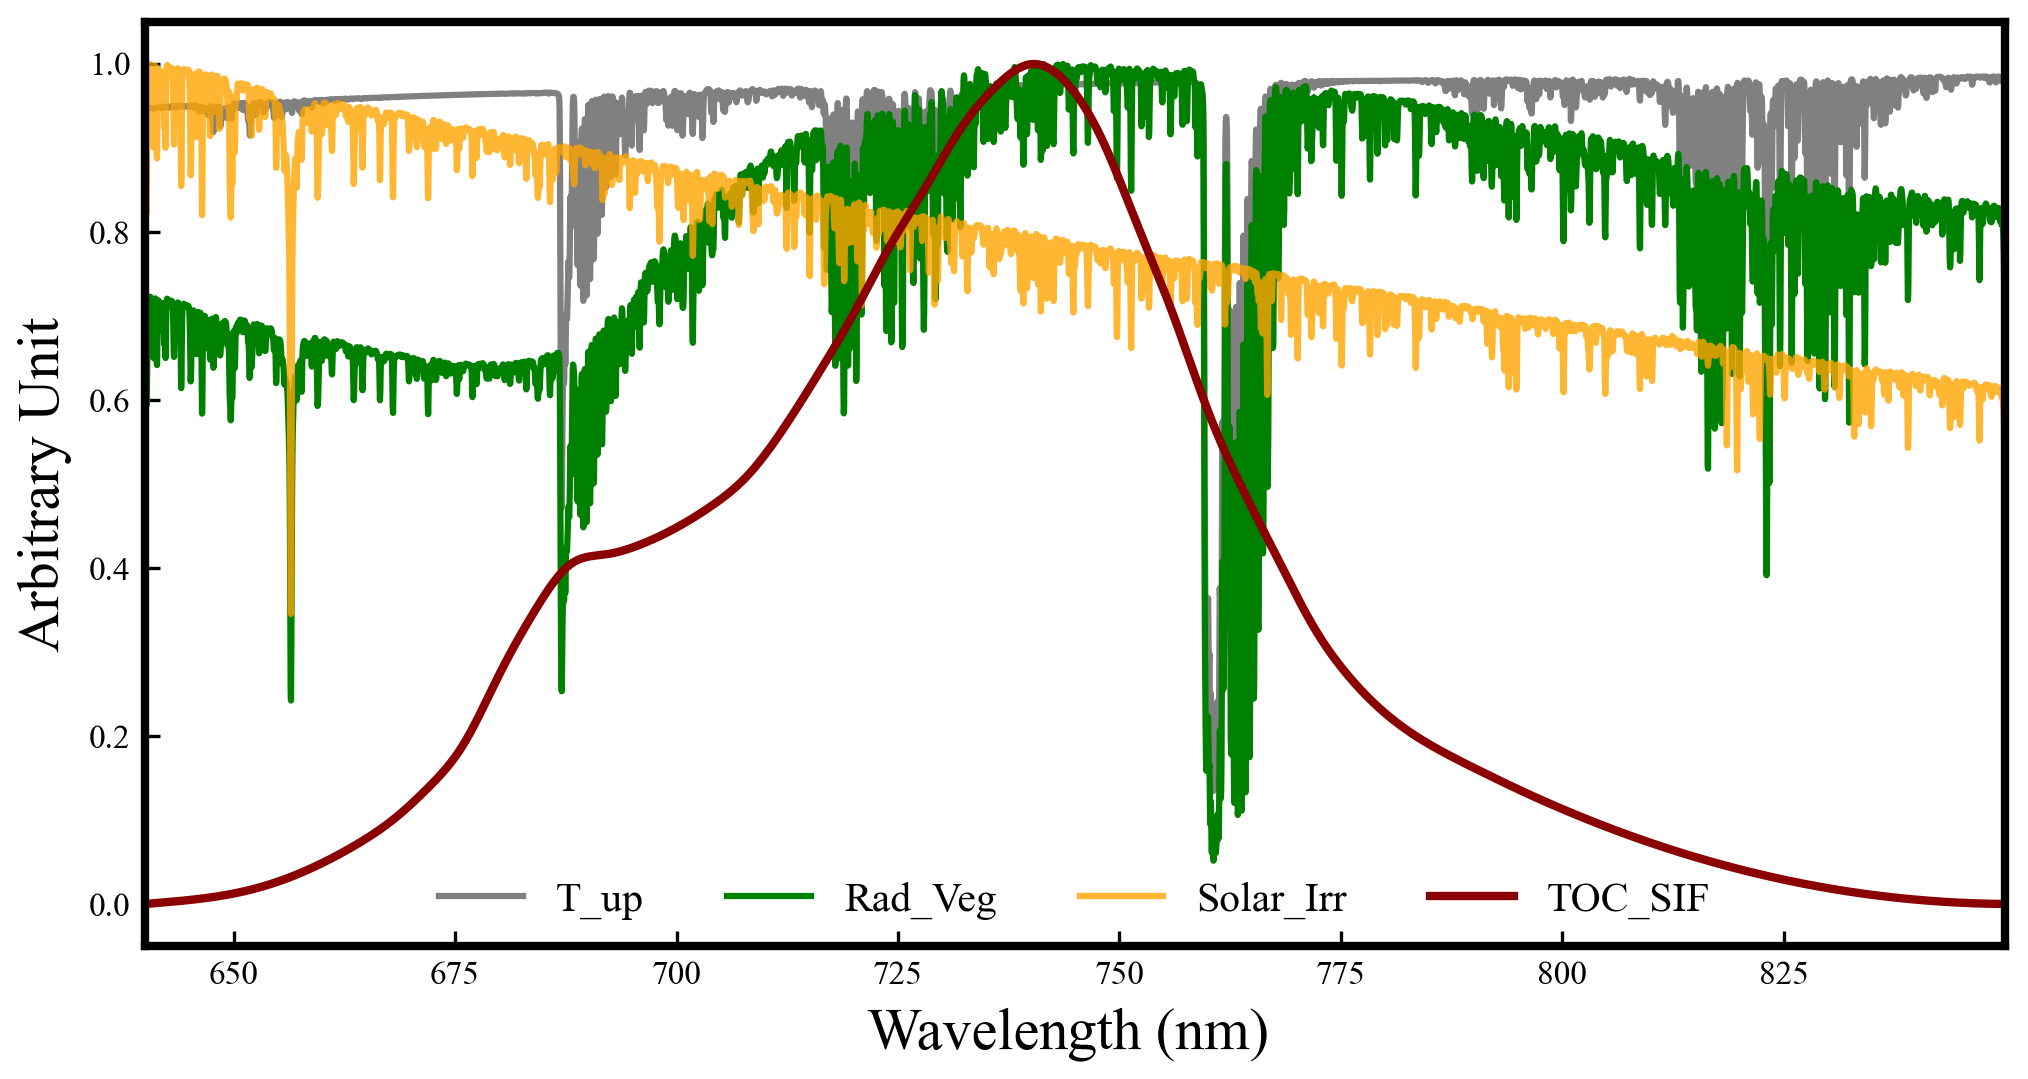
Figure 1A collective set of normalized, simulated spectra at the TOA over vegetated surfaces (Rad_Veg), together with the incident solar radiance that arrives at the TOC (Solar_Irr), upward transmittance of the atmosphere (T_up), and SIF at the TOC (TOC_SIF). These spectra are presented with an SR of 0.12 nm and an SSI of 0.04 nm derived from the SCOPE and MODTRAN 5 models.
2.2.3 End-to-end orbit simulation dataset
TanSat-2 boasts a spatial resolution of 2 km paired with a swath width of 2900 km, enabling it to offer high spatiotemporal resolution and comprehensive observations. Its expansive swath ensures nearly global coverage each day. Utilizing the J2 orbit perturbation model and TanSat-2's orbital elements, we simulated its orbit – a critically inclined, sun-synchronous trajectory. This simulation facilitated the assessment of global surface observations to model the worldwide spatiotemporal distribution of data collected by TanSat-2. Under typical acquisition scenarios, global simulations were conducted, harnessing the satellite's spatiotemporal resolution to simulate the TOA radiance spectra received by TanSat-2. The aim is to explore the spatiotemporal capabilities of TanSat-2 in retrieving SIF from its global observations.
For our study, mid-June was selected due to the peak greenness of vegetation in the Northern Hemisphere, which corresponds with the greatest global variability in vegetation cover. The end-to-end simulation of TOA radiance, in line with Eq. (1) and following the spectral simulation process described in Sect. 2.2.2, combined the SCOPE and MODTRAN models to generate the reflectance and SIF spectra, as well as atmospheric functions. Limitations in globally representative data for vegetation and atmospheric parameters introduce some discrepancies into the end-to-end simulation processes compared to the spectral simulation, as depicted in Fig. 2.
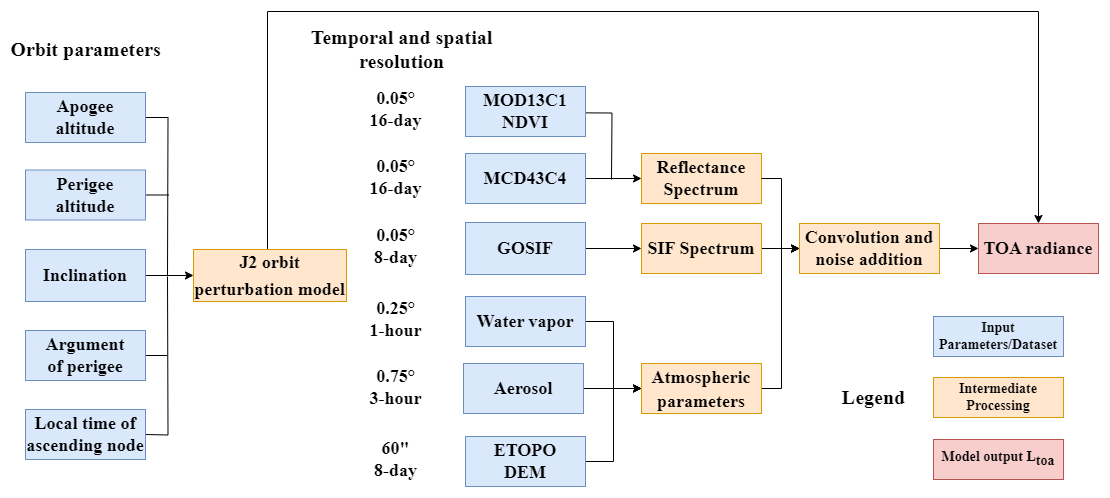
The spectral reflectance characterization leveraged multi-band observations from the Moderate Resolution Imaging Spectroradiometer (MODIS) MCD43C4 product (Huete et al., 2002), incorporating green (555 nm), red (659 nm), and near-infrared (858 nm) spectral bands. To account for surface heterogeneity, distinct spectral simulation approaches were developed for vegetated and non-vegetated surfaces. Vegetation coverage was delineated using the MODIS MOD13C1 Normalized Difference Vegetation Index (NDVI) product (Huete et al., 2002), with an NDVI threshold of 0.2 discriminating non-photosynthetic vegetation from active canopies.
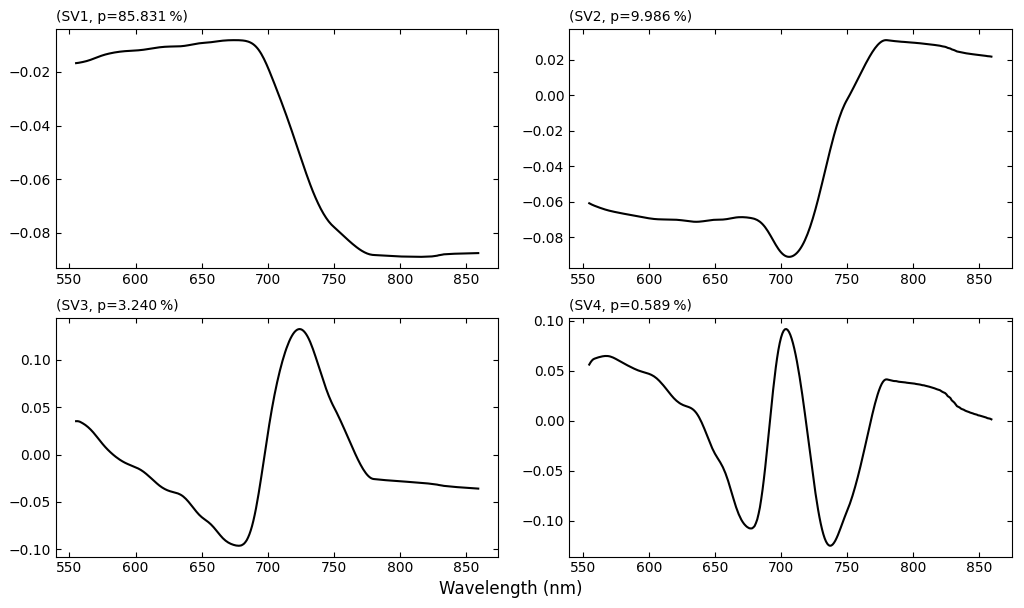
Figure 3The first four singular vectors from the singular value decomposition of the reflectance training dataset.
Non-vegetated surface reflectance spectra were parameterized through quadratic polynomial fitting, while vegetation spectra required advanced spectral decomposition due to their complex radiative interactions. As demonstrated in Fig. 3, vegetation reflectance characteristics between 640–800 nm were reconstructed through singular value decomposition (SVD) of the reference spectra described in Sect. 2.1, retaining the first two orthogonal basis vectors that collectively explained >95 % of spectral variance. SIF spatial patterns were derived from the global OCO-2-based SIF product (GOSIF v2; Li and Xiao, 2019), with spectral continuity achieved through adaptive gap-filling interpolation and by depicting the SIF spectral shape with a typical profile shown in Fig. 1.
Table 5Look-up table (LUT) of MODTRAN 5 used to train the atmospheric parameter random forest model.
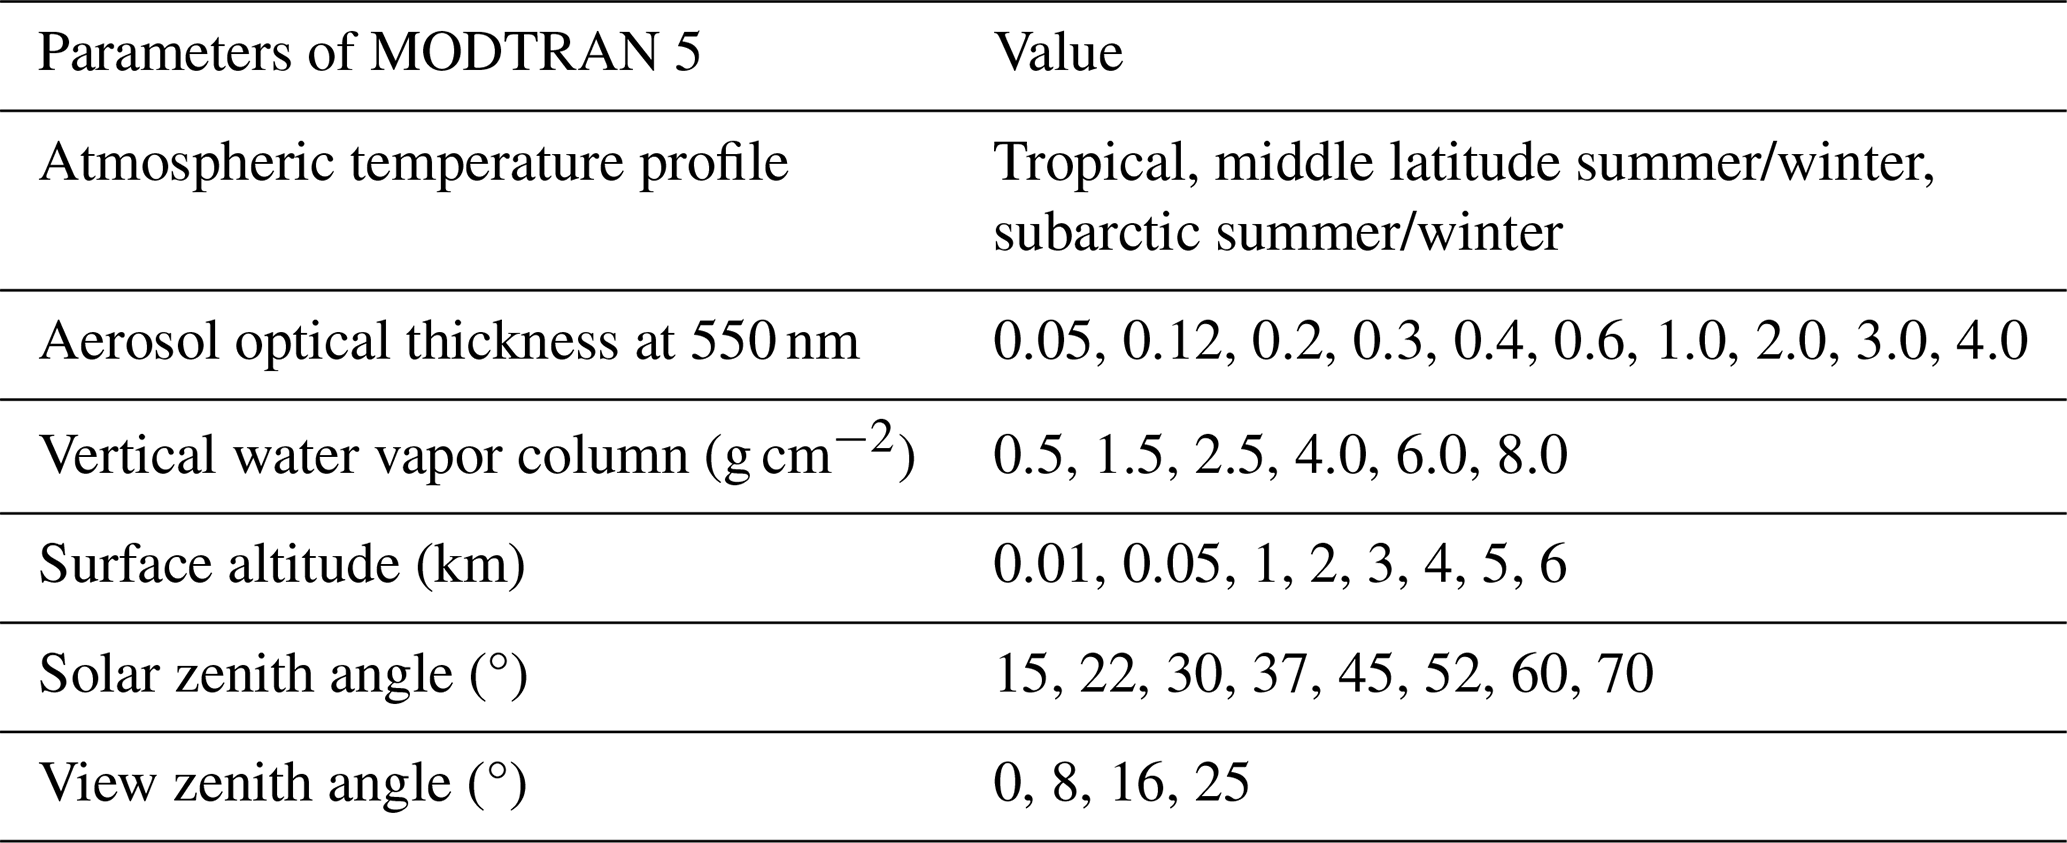
The atmospheric parameterization framework was constructed using a synthesis of global datasets to characterize key environmental variables. Total column water vapor data were obtained from the fifth-generation ECMWF reanalysis (ERA5; Hersbach et al., 2020), while aerosol information was acquired from the EAC4 reanalysis (Copernicus Atmosphere Monitoring Service; Inness et al., 2019). Topographic elevation data were derived from the ETOPO digital elevation model (NOAA; Amante and Eakins, 2009). Atmospheric temperature profiles were partitioned according to latitude. The atmospheric parameter space outlined in Table 4 was expanded (see Table 5) to compute critical radiative transfer variables (ρ0, S, , and T↑ in Eq. 1) required for simulating TOA radiance. To address computational constraints associated with full-resolution MODTRAN 5 radiative transfer modeling, a machine learning surrogate strategy was implemented. A representative subset of 7680 atmospheric scenarios (10 % of parameter combinations in Table 5) was simulated using MODTRAN 5. These simulations trained a random forest regressor to predict atmospheric parameters across the global domain at 0.02° resolution. These simulations were incorporated into Eq. (1) to compute TOA radiance. Additional processes, including convolution and noise addition, were applied.
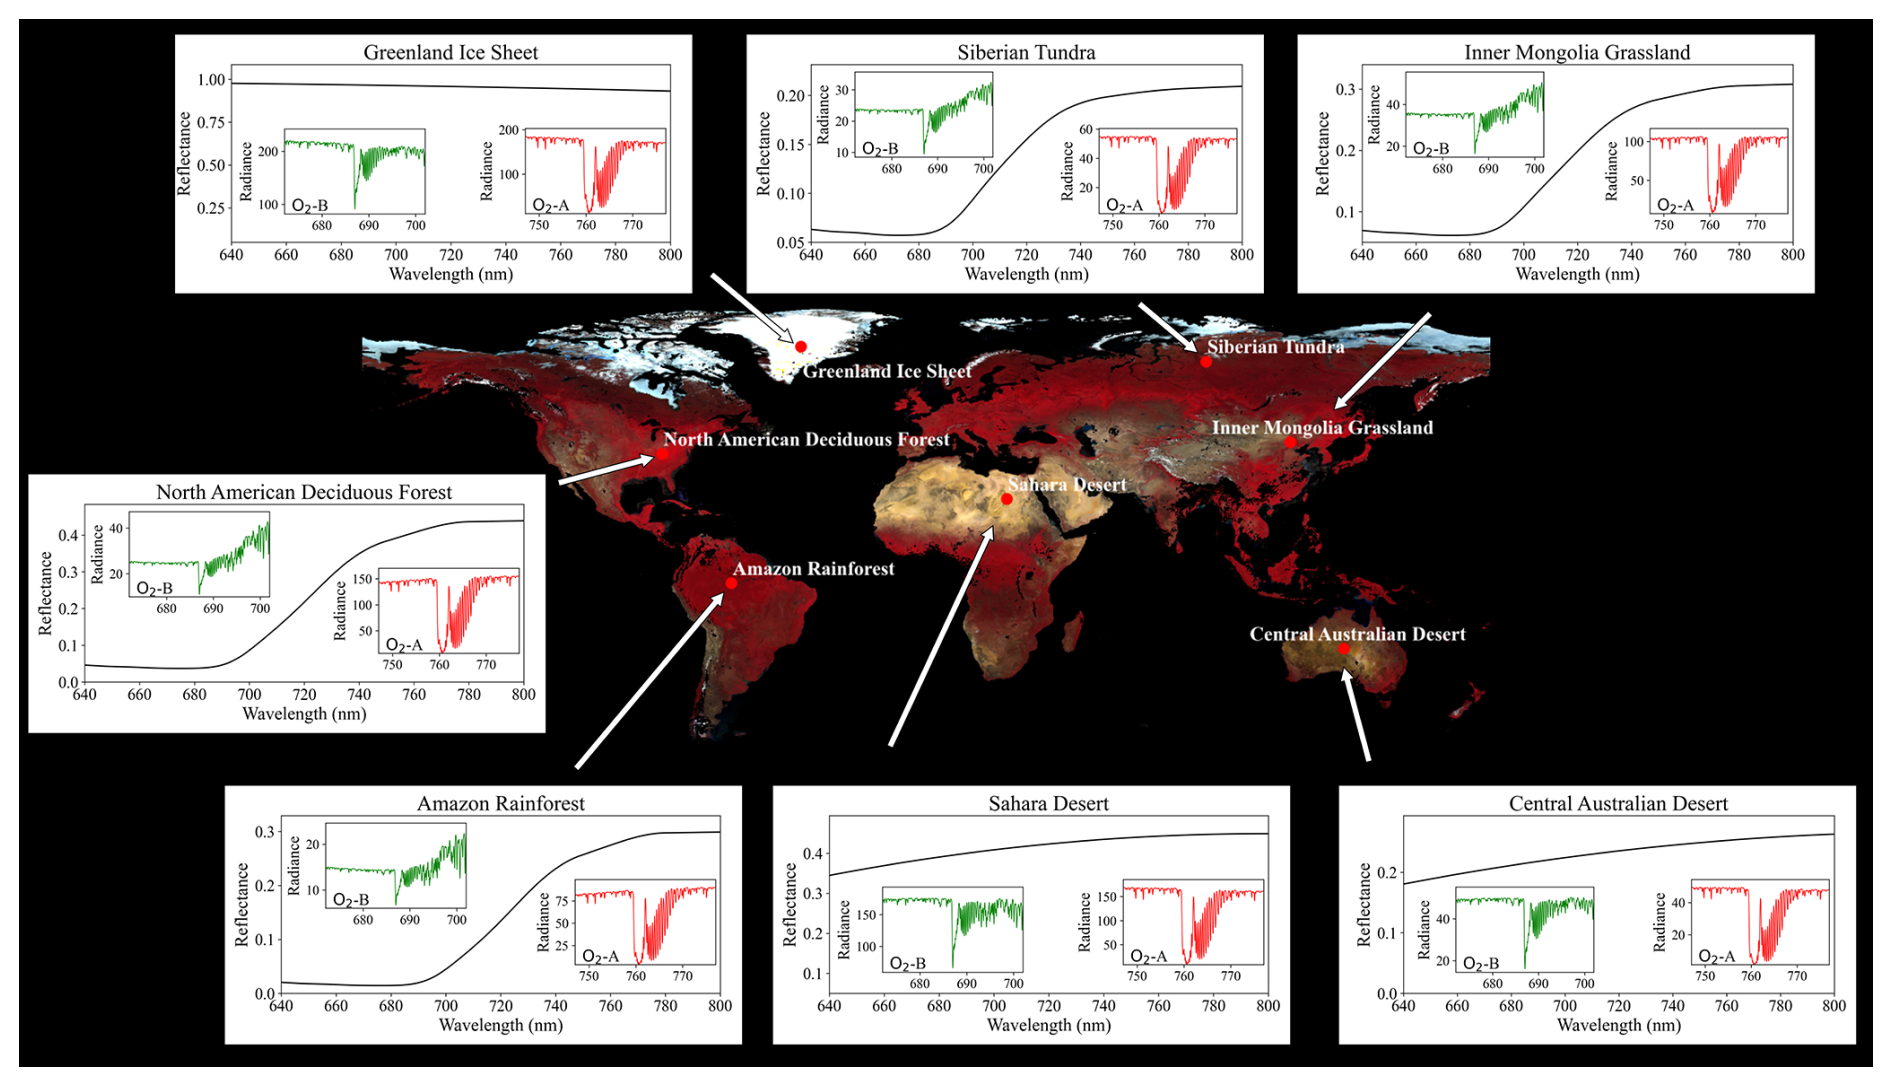
Figure 4Global reflectance pseudo-color composite and the bottom-of-atmosphere (BOA) reflectance along with simulated TOA radiance for two channels in typical regions.
It should be noted that we did not explicitly simulate cloud contamination or utilize cloud cover products for screening purposes. As such, our end-to-end orbital simulation operates under the assumption of clear-sky conditions, deliberately excluding the potential impacts of cloud cover. Furthermore, the CAPHI instrument aboard the satellite will supply data on AOD and cloud coverage, enhancing our understanding of atmospheric conditions and cloud dynamics while also providing supplementary data for future SIF retrieval efforts with TanSat-2. Furthermore, our simulations exclude rotational Raman scattering (RRS) effects. The RRS effects will be relatively small in the spectral range of red and far-red bands (Vasilkov et al., 2013). Figure 4 presents pseudo-color composites using the near-infrared, red, and green bands of MCD43C4, comparing surface reflectance reconstructions with simulated TOA radiances in seven geomorphologically distinct regions, including desert, boreal forest, and tropical rainforest ecosystems.
Moreover, we adopted strategies similar to those utilized by Du et al. (2018) to create datasets as training samples for the data-driven method. Our selection criteria targeted non-vegetation surfaces, such as bare soil and snow, to minimize biases and uncertainties. The SZA and view zenith angle (VZA) were restricted to less than 70 and 60°, respectively, ensuring that the SZAs within the training dataset were representative. We used the MODIS MCD43C4 BRDF-adjusted reflectance product to identify non-vegetation surfaces. As demonstrated by Guanter et al. (2012), the criterion RNIR < RSWIR effectively differentiates bare soil from other surface types. Bright soil pixels, characterized by high reflectivity, were identified using the MODIS data, specifically when the reflectance in band 6 surpassed that in band 2 and exceeded a threshold value of 0.2. Additionally, snow-covered areas were delineated employing the Normalized Difference Snow Index (NDSI) as defined by Salomonson and Appel (2004). A pixel was identified as snow covered when its NDSI value exceeded 0.4, with further constraints on reflectance values in the near-infrared (band 2) above 0.11 and in band 4 above 0.10, following the criteria established by Riggs et al. (2006).
To ensure the training dataset's representativeness and variability, spectra were selected to be uniformly distributed across the globe. Consequently, 400 000 spectra were randomly sampled to achieve this diversity.
3.1 Data-driven SIF retrieval algorithm
SVD technology, akin to principal component analysis, is extensively utilized for solving linear equations and is pivotal in statistical analysis and reducing dimensionality in large datasets (Du et al., 2018). In models driven by data, the initial segment of Eq. (1), which excludes fluorescence effects, integrates high-frequency and low-frequency components. As delineated by Guanter et al. (2012, 2013), high-frequency components, stemming from atmospheric absorption influenced by solar and terrestrial sources, are extracted from non-vegetation datasets through SVD and reconstructed using a select set of characteristic spectra. Conversely, the low-frequency components, representing atmospheric scattering (denoted as ρ0 and S) and surface reflectance (ρs), are approximated using polynomial wavelength functions (λ). Moreover, the shape of SIF spectra is typically modeled through a normalized Gaussian function (hf).
Here λ0 is the peak emission wavelength of SIF spectra in the far-red and red bands, and the value of σh determines the shape of SIF spectra. Therefore, Eq. (1) can be rewritten as
where β and γ represent the coefficient vectors to be determined; np is the polynomial order; and v refers to the singular vectors of the high-frequency components, with their number given by nv. is the effective upward transmittance used to represent the atmospheric transmittance from the surface to the sensor. can be estimated before retrieval (Köhler et al., 2015a):
where represents the effective two-way atmospheric transmittance, obtained by normalizing the TOA reflectance using low-order polynomials. θ0 and θv are the SZA and VZA, respectively.
The spectral parameterization of SIF employed Gaussian functions with band-specific configurations. For the far-red band, a single Gaussian function was adopted with λ0 of 740 nm and σh of 21 nm. The red band required a dual-Gaussian representation to capture its complex spectral features, characterized by λ0 values of 685 and 740 nm with corresponding σh values of 10 and 21 nm, respectively (Joiner et al., 2016; Zou et al., 2022). These spectral regions encompass critical atmospheric absorption bands – specifically, the O2-A band (758–772 nm) for far-red SIF and the O2-B band (682–692 nm) for red SIF retrieval (Guanter et al., 2015; Joiner et al., 2013). Surrounding solar Fraunhofer and atmospheric absorption lines also play a crucial role in the SIF retrieval process in satellites with refined spectral resolution (Frankenberg et al., 2011b; Joiner et al., 2011).
As a semi-empirical approach, the performance of data-driven algorithms heavily depends on the empirical parameters employed in the model. To optimize these parameters, different retrieval windows were selected for each channel. Specifically, the far-red band employed window settings of 747–758, 759–772, and 747–777 nm, while the red band used 672–686, 682–697, and 672–702 nm. Additionally, the permissible ranges for the parameters np (0–7) and nv (1–50) were defined for SIF retrieval (Köhler et al., 2015a; Zou et al., 2022). Through variable reduction, the final retrievals retained only βj, γk, and Fs, resolved via linear least squares optimization.
SVD was applied to spectral simulation datasets to disentangle dominant signal components from noise. These vectors are strategically arranged such that each successive vector accounts for progressively less signal variability, enabling a hierarchical representation of data. The first six basis vectors accounted for over 98 % of cumulative spectral variance, as quantified in Fig. 5. Predominantly, the spectral variations within the fitting window arise from Fraunhofer lines and atmospheric absorption features. Notably, none of the basis vectors exhibited correlation with intrinsic SIF spectral shapes, confirming the method's capability to isolate fluorescence signals from background radiative processes.
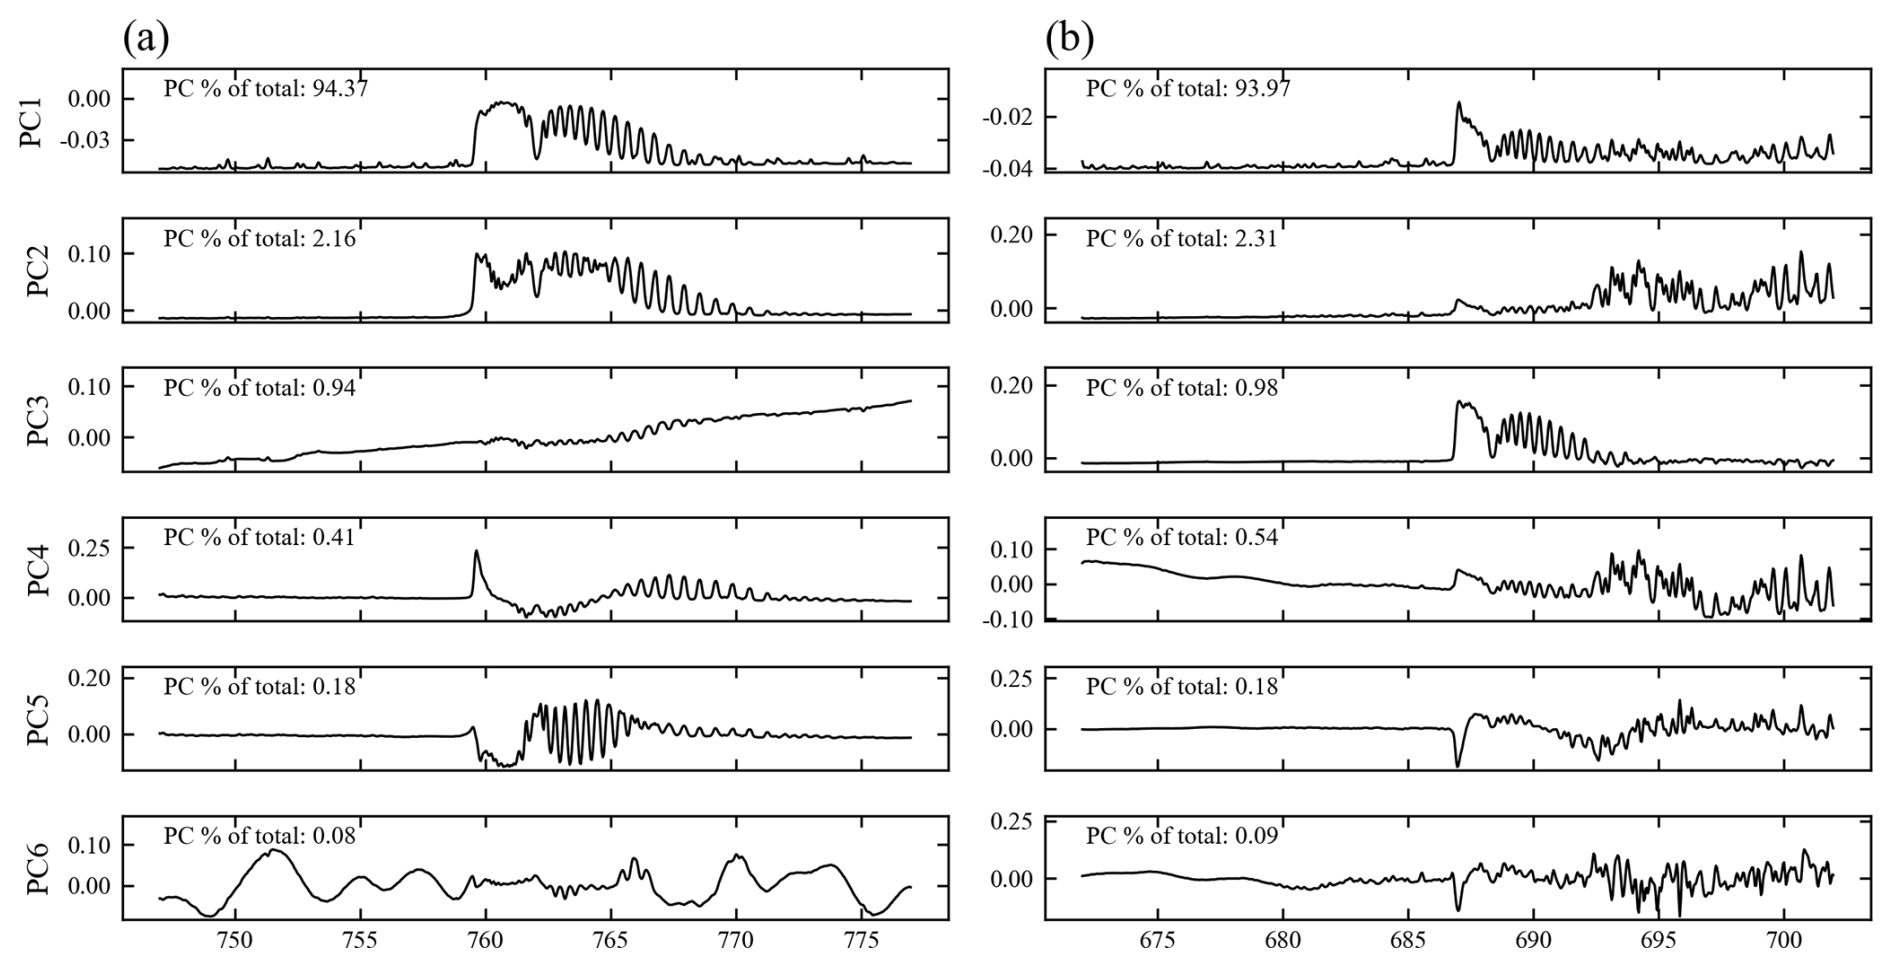
Figure 5The first six bias vectors from the SVD of the spectral simulation training dataset in two spectral ranges: (a) 747–777 nm and (b) 672–702 nm.
3.2 Metrics for evaluating accuracy
For the simulated SIF intensities at 740 and 685 nm, we designated these values as the true SIF signals (SIFtrue) for each channel. To evaluate the accuracy of the spectral retrieval, we compared the retrieved SIF values (SIFretrieved) at these wavelengths with SIFtrue. The analysis included calculating the root mean square error (RMSE) to quantify the retrieval precision. Additionally, several statistical metrics were employed to further assess the retrieval performance, such as the slope and intercept from the linear regression between SIFretrieved and SIFtrue, alongside the coefficient of determination (R2). The adjusted SIF values (SIFcorr), intended to rectify systematic biases inherent in data-driven retrieval methods, were computed as per Eq. (8) (Du et al., 2020; Zou et al., 2022):
where the intercept and slope represent the parameters of the linear relationship between SIFretrieved and SIFtrue, expressed as SIFretrieved= SIFtrue × slope + intercept. The corrected RMSE (RMSE∗) was calculated by comparing SIFtrue with SIFcorr.
3.3 Quality filtering rules for global SIF composites
Global composites of SIF were generated by averaging retrieval data across a grid with a resolution of 0.05° by 0.05° over a 1 d period. Before averaging, the retrieval data underwent a filtering process based on established quality criteria (Du et al., 2018; Guanter et al., 2021). The criteria include the following:
-
land surface
-
an SZA of < 70° and a VZA of < 60°
-
estimates inside the 95 % range of expected values.
Here, the chi-square (χ2) test is a statistical method used to evaluate how well a model fits observed data by measuring the difference between observed and fitted data. If the fitted radiances deviate significantly from the observed radiances, it indicates a poor fit. The reduced chi square () is calculated by dividing the chi-square value by the degrees of freedom.
4.1 Optimization of empirical parameters in the data-driven algorithm using spectral simulations
4.1.1 Impact of empirical parameters on SIF retrievals
To refine the parameterization of the algorithm that guides the TanSat-2 SIF retrieval, we conducted a quantitative analysis based on spectral simulations. This study evaluates the impact of various empirical parameters utilized in data-driven algorithms on the retrieval outcomes. The parameters investigated include the configuration of the fitting windows, the number of eigenvectors (nv), and the polynomial order (np).
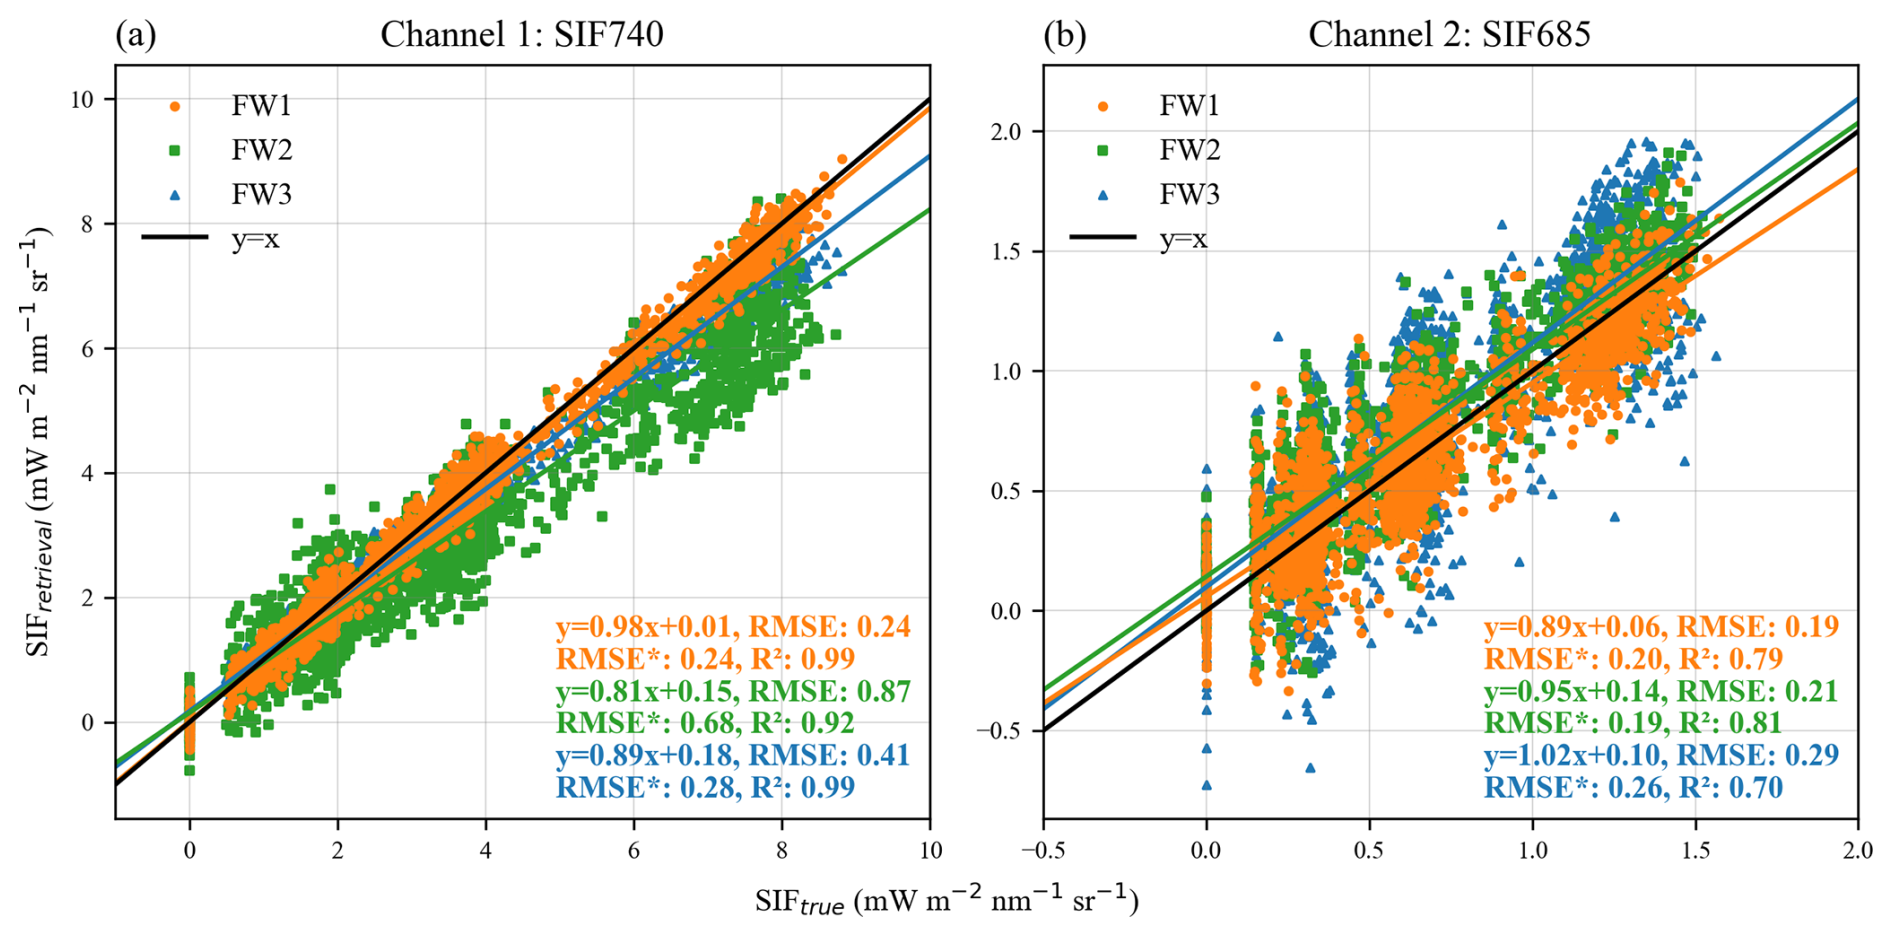
Figure 6Retrieval using simulated datasets of two channels with different fitting windows: the windows for channel 1 are 747–758, 759–772, and 747–777 nm, and the windows for channel 2 are 672–686, 682–697, and 672–702 nm. For demonstration purposes, only a randomly selected portion of the data is used to draw the scatter plot.
In our analysis, we implemented differing window settings across two spectral channels, as depicted in Fig. 6. A comparative analysis reveals substantial variations in retrieval performance among the window settings. Notably, the optimal retrieval windows for both channels exclusively utilized atmospheric windows for retrieval, achieving RMSEs of 0.24 and 0.19 mW m−2 sr−1 nm−1. Wider fitting windows tend to encompass atmospheric absorption bands, offering a plethora of usable spectral data. However, this approach necessitates precise simulation of atmospheric upwelling transmittance and complicates the modeling of vegetation surface reflectance and SIF spectral shape, particularly in the red band. Consequently, a narrower atmospheric window band frequently serves as a more advantageous choice for the spectral parameters of TanSat-2.
The relationship between the number of eigenvectors and RMSEs was examined within the context of the optimal fitting window, as illustrated in Fig. 7. The analysis indicates that RMSEs initially decrease, subsequently increase, and ultimately stabilize as the number of eigenvectors grows. Optimal nv values were determined to be 6 for channel 1 and 4 for channel 2.
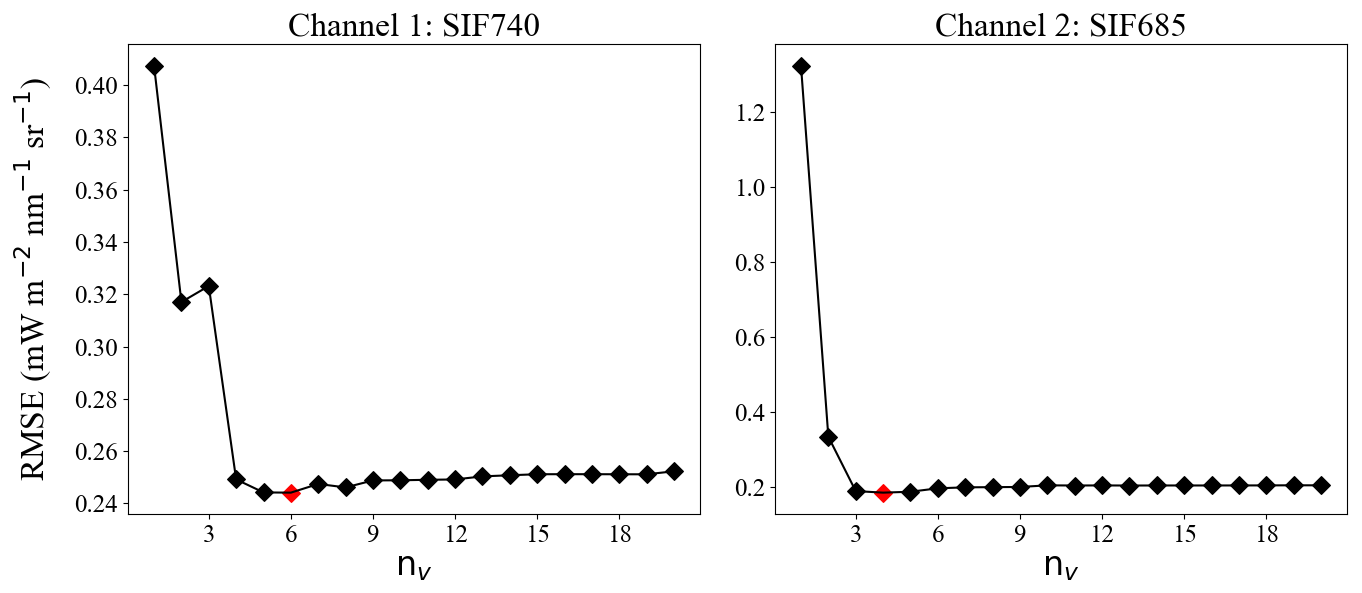
Figure 7RMSE of SIF retrieval in the optimal fitting windows using varying numbers of eigenvectors. The red point refers to the optimal nv.
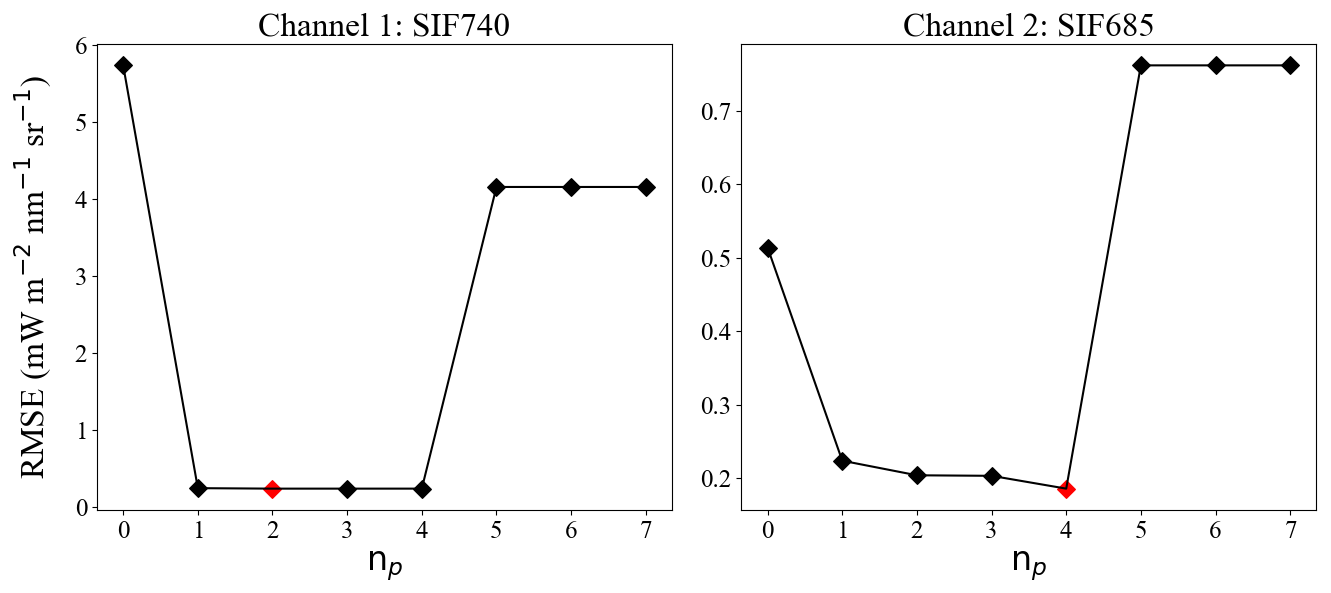
Figure 8RMSE of SIF retrieval in the optimal fitting windows using a varying polynomial order. The red point refers to the optimal np.
Data-driven models commonly employ polynomials to approximate the shape of reflectance and atmospheric scattering within the fitting window. Typically, a broader fitting window necessitates the use of higher-order polynomials. The red band, positioned near the vegetation's red edge and heavily influenced by chlorophyll absorption, exhibits notably complex reflectance patterns. Thus, higher polynomial orders are generally required for the red band compared to the far-red band. An analysis utilizing the optimal window revealed that RMSE values initially decrease and then increase with the escalation of the polynomial order, as detailed in Fig. 8. This pattern arises because low polynomial orders fail to accurately model the reflectance spectral shape, whereas excessively high orders induce overfitting, obstructing the detection of faint SIF signals within the upstream radiance. After surpassing a certain threshold, RMSE stabilizes at a high value. For channels 1 and 2, the optimal polynomial orders were found to be 2 and 4, respectively.
4.1.2 SIF retrievals using optimized empirical parameters
SIF retrieval was performed using the spectral simulation of the TanSat-2 payload configuration to evaluate its retrieval potential. We assessed the retrieved SIF values (SIFretrieval) against the actual values (SIFtrue) under varied atmospheric conditions, leaf biochemical characteristics, canopy structures, and geometrical arrangements. The results presented in Fig. 9 illustrate the SIF retrievals for TanSat-2, utilizing the optimally derived empirical parameters.
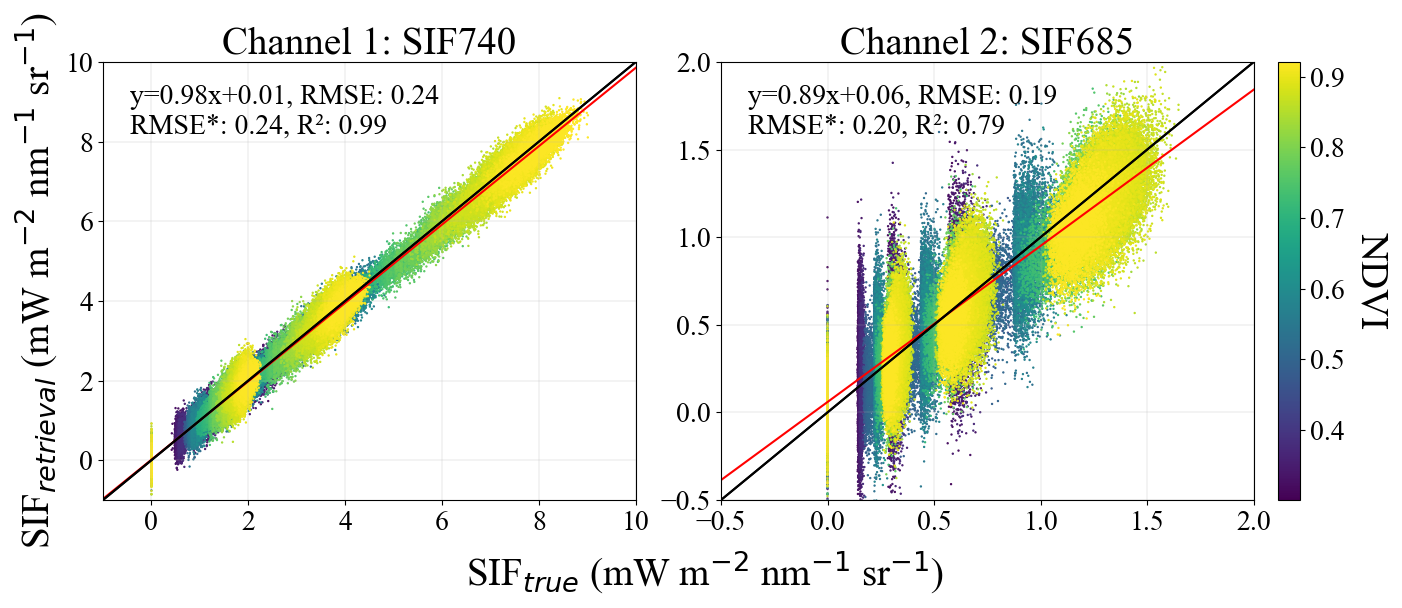
Figure 9SIF retrievals of spectral simulation using two channels with optimal parameter settings. The black line denotes y=x, while the red one denotes the linear fitting line.
For the two spectral channels examined, the scatter plot distributions align closely with the 1:1 line, indicating high retrieval accuracy. In channel 1, the data-driven algorithm was optimized with settings that included a spectral fitting window from 747–758 nm, a second-order polynomial fitting, and six eigenvectors, yielding an RMSE of 0.24 mW m−2 sr−1 nm−1. Channel 2 employed a fourth-order polynomial and four eigenvectors within a 672–686 nm window, achieving an RMSE of 0.19 mW m−2 sr−1 nm−1. Furthermore, the correlation between the RMSE and its normalized counterpart (RMSE*) suggests minimal systematic errors in the retrieval methodology.
To illustrate the forward model fit, TOA radiance spectra for the ranges 747–758 and 672–686 nm were simulated using both the standard forward model and a variant excluding SIF. Comparison of these spectra against actual TOA radiance measurements yielded two spectral residuals, depicted in Fig. 10. Models incorporating SIF showed significantly lower spectral residuals, particularly around the Fraunhofer lines. Additionally, in the forward model that includes SIF, the spectral residuals across both channels were generally minimal, underlining the efficacy of the SVD method in fitting data and accurately reconstructing surface spectral shapes without SIF signals.
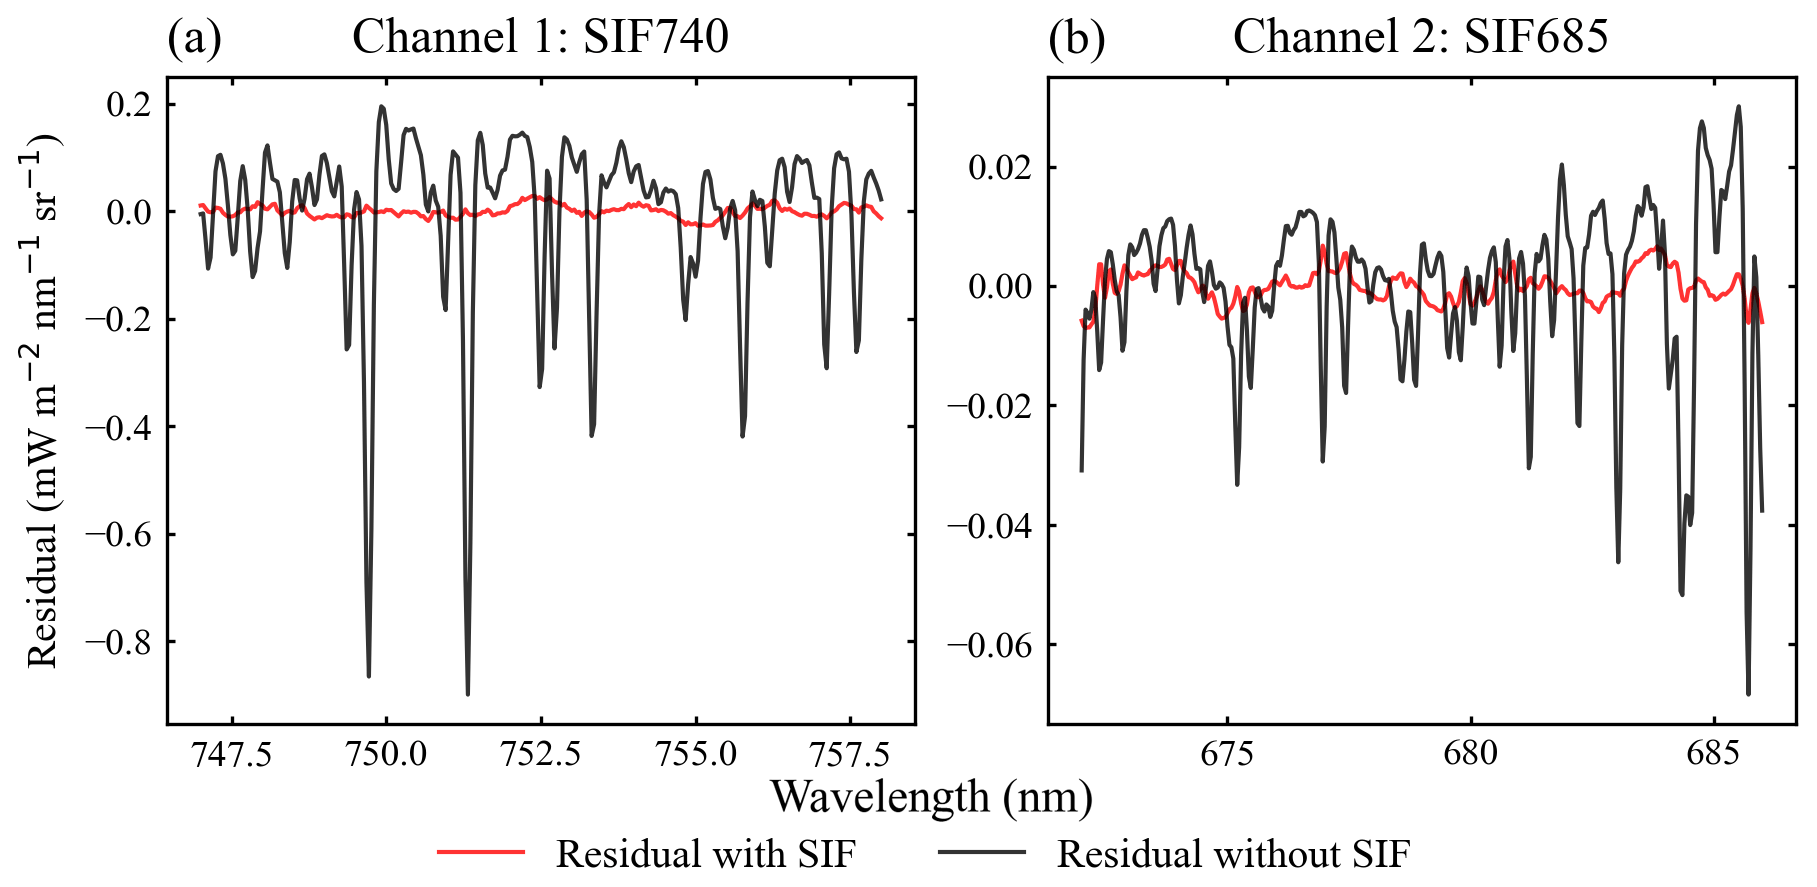
Figure 10Spectral residuals between the fitted and observed TOA radiances, shown for cases where the model includes SIF (red) and excludes SIF (black) in two spectral ranges: (a) 747–758 nm and (b) 672–686 nm. Panels (a) and (b) correspond to channels 1 and 2.
4.2 Evaluation of SIF retrievals based on end-to-end orbit simulations
In Sect. 4.1, we evaluated the impact of empirical parameters on SIF retrieval accuracy using a data-driven model and established an optimal algorithm for the two channels on TanSat-2, based on spectral simulations detailed in Sect. 2.2.2. This section also discusses how retrieval errors from a single pass of TanSat-2 propagate into the spatiotemporal composite. Figure 11 illustrates the global distribution of observations measured by TanSat-2 within a 0.05° global grid over a single day. Despite the fine resolution, the satellite's high spatial resolution and wide swath enabled a substantial volume of observations, approximately 5–7 times greater than that achieved by TROPOMI. These payload characteristics of TanSat-2 significantly enhance the reliability of SIF retrievals.
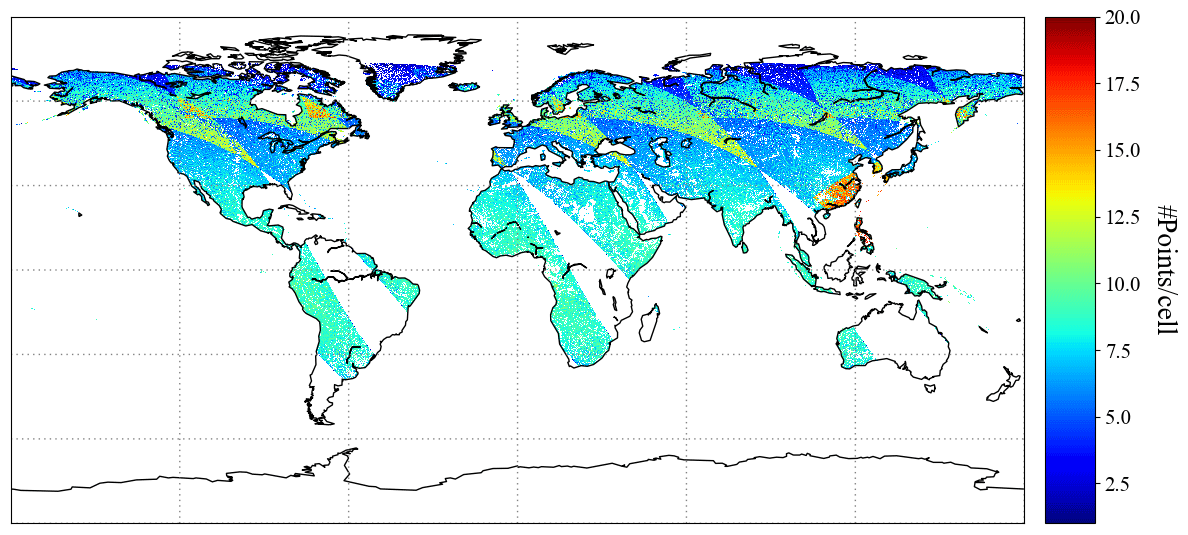
Figure 11Global map showing the total number of TanSat-2 observations. The simulations represent daily averages for June, with a grid resolution of 0.05°.
The aggregated SIF retrieval results for two bands and the global observations of SIF (GOSIF) over a 1 d period, displayed in Fig. 12 with a grid size of 0.05°, demonstrate a strong correlation. High SIF values are noted in densely vegetated regions, with the highest global SIF signals occurring in the eastern United States. Conversely, SIF values near zero are observed in regions such as Greenland, the Sahara, and much of Australia. For the analysis, GOSIF values at 757 nm were converted to 740 and 685 nm to represent the actual SIF of the two channels. This conversion involved multiplying the 757 nm SIF values by factors of 1.48 and 0.54, which align with the SIF spectral shape used in the end-to-end orbit simulated dataset (refer to Fig. 1). A comparison of the retrieved SIF with the true SIF shows discrepancies generally less than 0.15 mW m−2 sr−1 nm−1, as illustrated in Fig. 13. The R2 values for the two channels are 0.88 and 0.61, with corresponding RMSE values of 0.082 and 0.061, respectively. These RMSE values represent approximately 5.4 % and 11.1 % of the globally observed SIF peaks, which are considered acceptable error thresholds for SIF synthesis (Fig. 14).
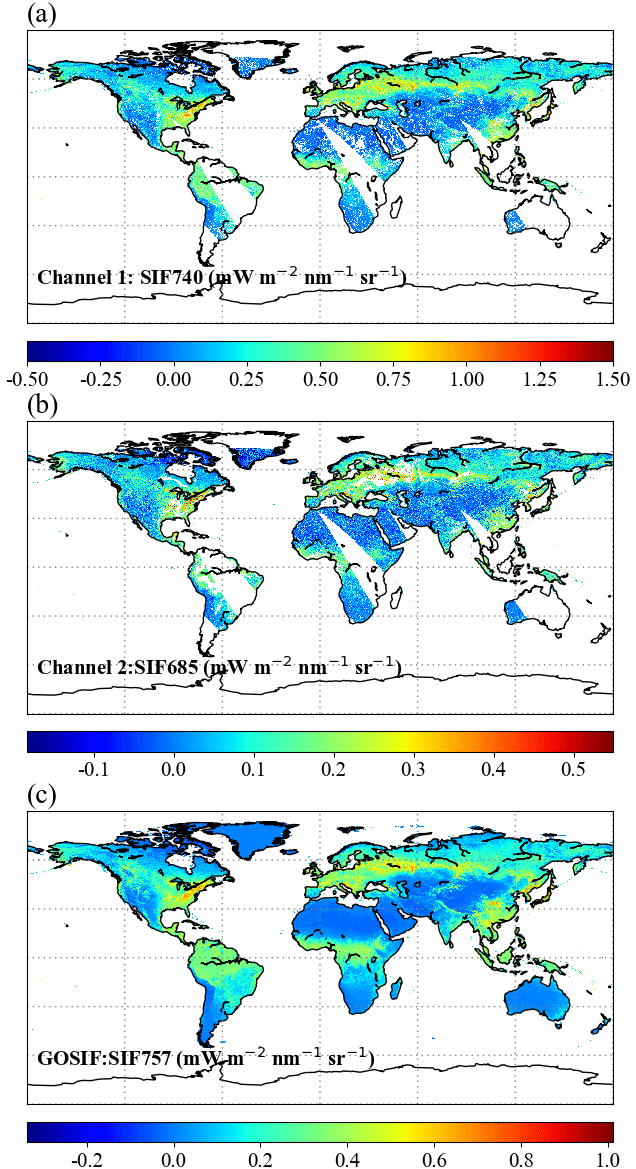
Figure 12Global maps of mean SIF for each of the two channels, with GOSIF serving as the reference for true SIF, under the same conditions as Fig. 11. The SIF range is scaled according to the proportion of the SIF spectrum used.
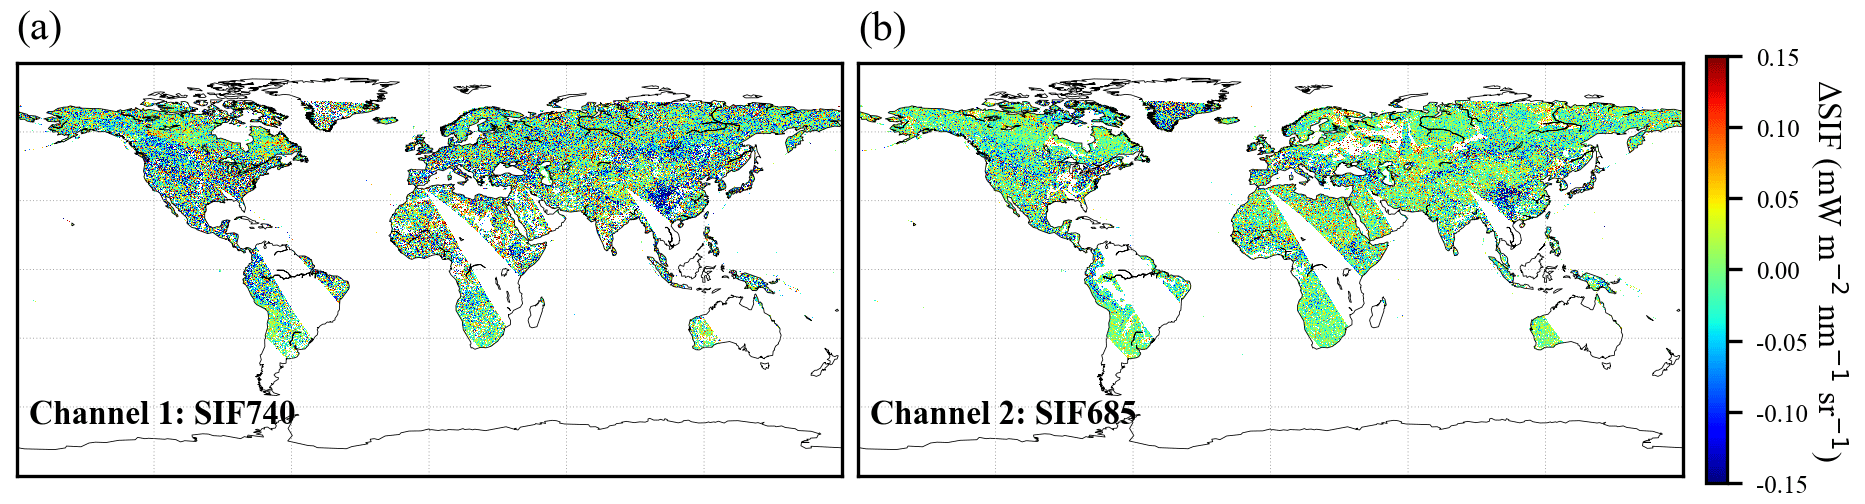
Figure 13SIF retrieval errors (ΔSIF = retrieved SIF – true SIF) for two channels, under the same conditions as in Fig. 11.
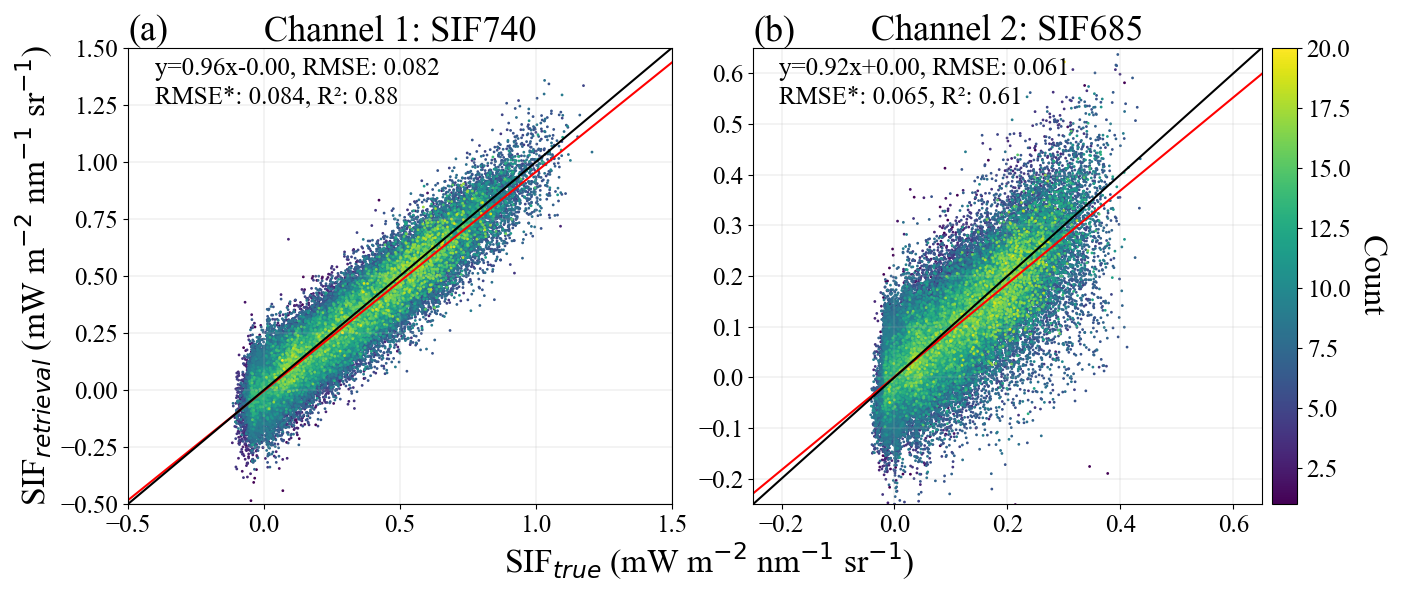
Figure 14Global simulations of SIF retrieval from two channels, under the same conditions as in Fig. 11. The black line denotes y=x, while the red one denotes the linear fitting line.
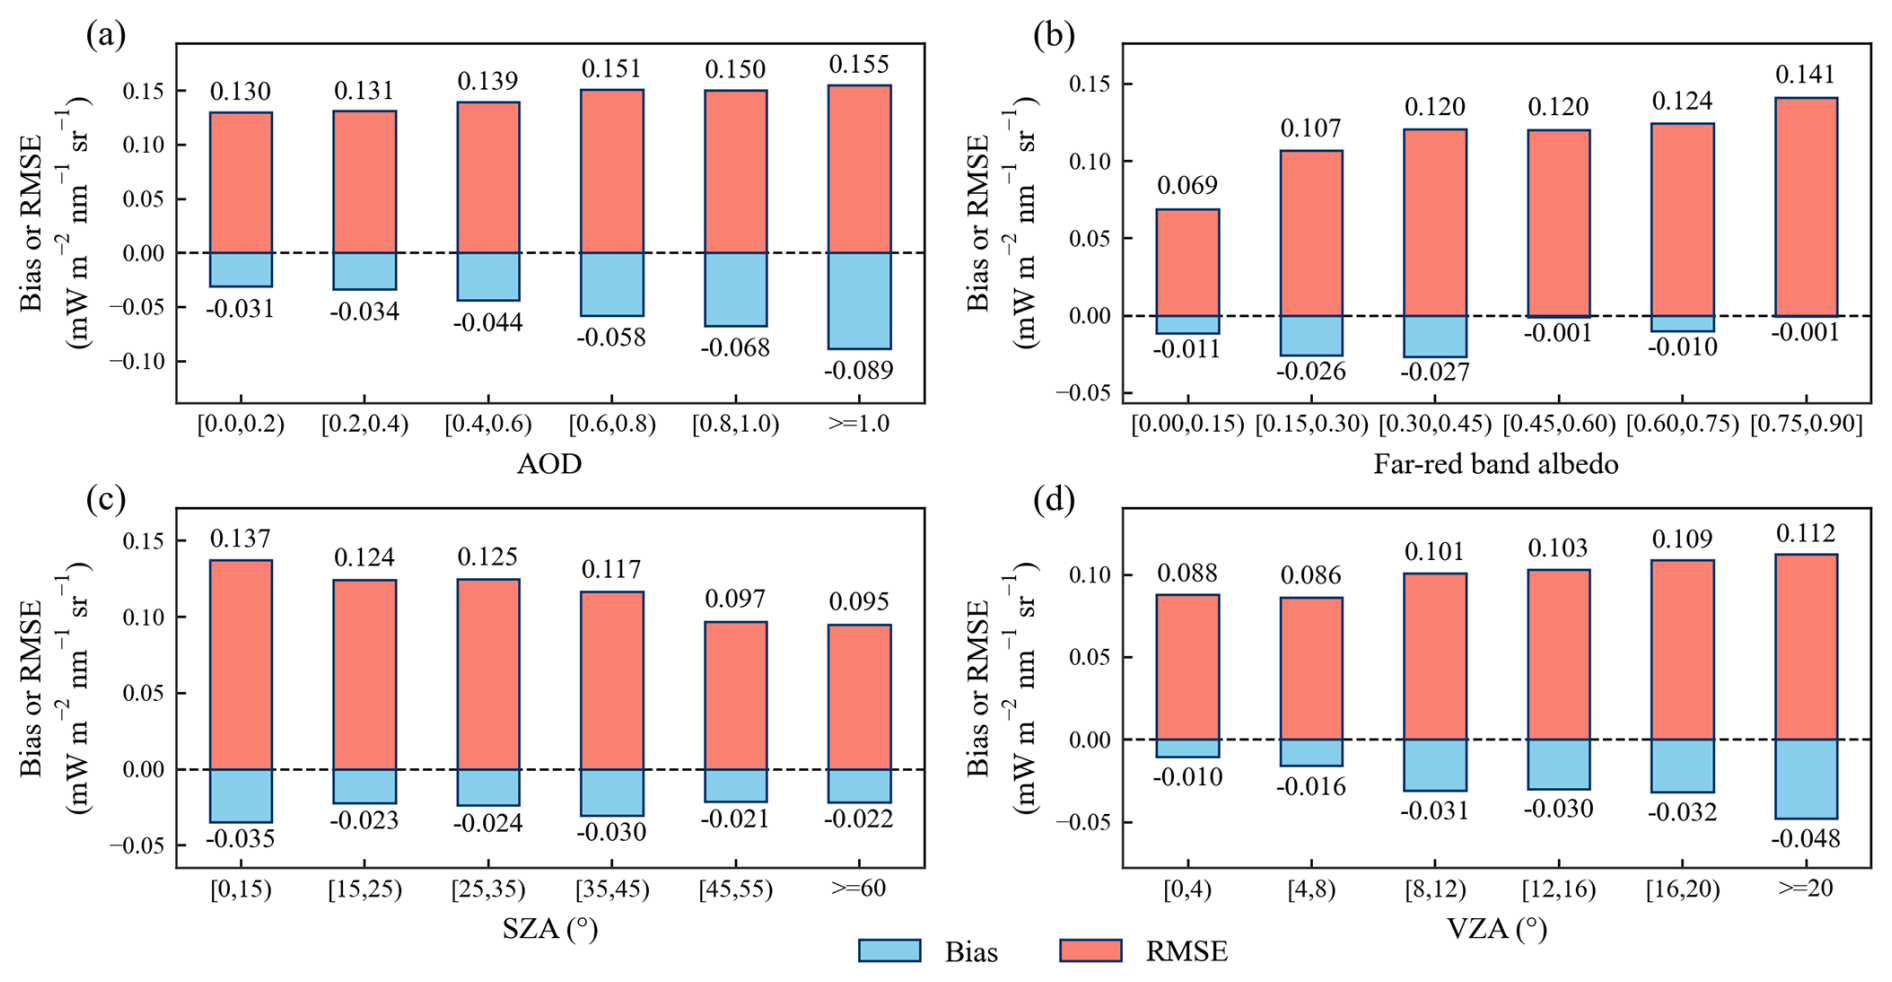
Figure 15Statistical analysis of far-red SIF retrieval errors with respect to (a) AOD, (b) far-red band albedo, (c) SZA, and (d) VZA. The bias represents the mean value of ΔSIF (retrieved SIF – true SIF).
The retrieval uncertainties manifest predominantly as spectrally structured noise coupled with pronounced sensitivity to atmospheric scattering processes. The former primarily varies with scene-specific radiance magnitudes within retrieval windows, while systematic SIF underestimation in high-aerosol-loading regimes arises from unaccounted-for scattering effects within our forward model. In order to disentangle the error sources, we conducted a statistical analysis of the far-red SIF retrieval errors (results for the red band are similar) in relation to AOD, the albedo within the fitting window, SZA, and VZA, as shown in Fig. 15. The results indicate that RMSE increases significantly with the increase in surface albedo and the decrease in SZA. Both changes enhance the background radiance, leading to a noticeable rise in retrieval uncertainty due to an increase in signal noise. Spatially, these retrieval errors dominate in bright surface areas, such as the Sahara and the Congo Basin, as shown in Fig. 13. Meanwhile, retrieval bias exhibits substantial amplification under higher AOD and larger VZA. This phenomenon arises because the higher AOD strengthens atmospheric scattering efficiency, while larger VZA values extend the effective radiative path length. These factors collectively amplify atmospheric scattering effects, resulting in progressively larger underestimation of SIF. The spatial pattern of this bias prominently features regions with high aerosol, particularly Central Asia and South Asia, as depicted in Fig. 13. Notably, red SIF retrieval over aquatic environments necessitates distinct processing techniques compared to terrestrial environments. This technical disparity manifests as substantially exaggerated SIF estimates within specific watersheds, particularly those in northern/western Russia and the Great Lakes region of North America.
Moreover, we evaluated the results of 4 and 8 d composites, as shown in Figs. A1 and A2. Compared to single-day observations, the global coverage is more comprehensive, and the composite method significantly reduces retrieval errors by increasing observation density and suppressing noise (the RMSE for the 4 and 8 d composites decreased by 35 % and 47 %, respectively). This further demonstrates the performance of the instrument on the TanSat-2 satellite. However, several persistent systematic biases were detected: underestimation in high-AOD regions (Central Asia and South Asia) due to enhanced atmospheric scattering, overestimation in bright surfaces (the Sahara and the Congo Basin) caused by radiation saturation, and overestimation of red SIF near waterbodies (Russian rivers, the Great Lakes in North America) due to residual surface reflectance effects. Overall, the 4 and 8 d composites achieved excellent accuracy, demonstrating robust retrieval performance that balances spatial coverage and accuracy. The R2 values for the two channels were 0.95 and 0.79 and 0.97 and 0.85, while the RMSE values were 0.053 and 0.041 and 0.043 and 0.034 mW m−2 sr−1 nm−1. It should be noted that although the AOD product used partially accounts for cloud impacts, it does not explicitly model cloud contamination or apply cloud fraction products for screening. Consequently, our results assume clear-sky conditions. Additionally, these simulations do not incorporate RRS, as the filter only considers data with an SZA less than 70°, where the RRS effects are minimal.
5.1 Representativeness of simulations to satellite observations
For the end-to-end orbit simulation, we modeled TanSat-2's Earth observations based on its orbital parameters. Designed to optimize global carbon stocktaking, the inclined elliptical orbit enhances observational frequency over the Northern Hemisphere's densely populated regions (e.g., Asia, North America, and Europe), as evidenced by the increased observation density shown in Figs. 11 and A1. Continuous observations over 4 or 8 d cycles ensure near-global coverage. However, this orbital architecture introduces inherent challenges. The efficiency of the sun-synchronous elliptical orbit is relatively low, as its apogee is approximately 10 times higher than its perigee. Although the imaging setting only allows observations at orbital altitudes above ∼2350 km, significant altitude disparity still persists. This results in a swath width variation that increases more than twofold, leading to uneven ground coverage and spatial resolution, which in turn reduces the efficiency of achieving uniform global sampling – particularly in equatorial regions. Furthermore, the orbit may induce field-of-view aberrations that could compromise measurement accuracy. These limitations necessitate systematic mitigation strategies during satellite system design and orbital parameter optimization.
In this study, we used data from various sources to represent the global distribution of surface reflectance, SIF, and atmospheric conditions. Although the simulation is driven by satellite datasets, it cannot fully capture the complexities present in actual satellite measurements, such as instrument artifacts or RRS effects. In the simulation, radiances are initially generated monochromatically through scattering and then convolved with the instrument response function. The instrument response function is modeled using a Gaussian profile. To simulate random noise, a simplified SNR model (Eq. 4) was applied. Zou et al. (2022) compared the simulated spectra and SNR with actual satellite measurements, and the results demonstrated high consistency between the two, validating the accuracy of the SNR model and the spectral filtering process. Thus, it is feasible to assess the SIF retrieval capability of TanSat-2 based on the simulated dataset.
Additionally, while the AOD dataset partially incorporates the influence of clouds – particularly in areas of high value – we did not explicitly simulate cloud contamination or utilize cloud cover products for screening purposes. The satellite's observations inherently reflect the impact of clouds on the radiance signal. The establishment of various cloud screening criteria involves a trade-off between mitigating the clear-sky bias inherent in satellite observations and optimizing the accuracy of SIF retrieval (Frankenberg et al., 2014b). Stringent cloud screening measures can lead to a reduction in the overall number of usable measurements, consequently producing a noisier output map. This paper aims to investigate the benefits derived from the TanSat-2 sensor's superior spectral observation capabilities and its high temporal and spatial resolution in SIF retrieval. As such, our end-to-end orbital simulation operates under the assumption of clear-sky conditions, deliberately excluding the potential impacts of cloud cover. Furthermore, the CAPHI instrument aboard the satellite will supply data on AOD and cloud coverage, enhancing our understanding of atmospheric conditions and cloud dynamics while also providing supplementary data for future SIF retrieval efforts with TanSat-2.
It should be noted that our simulations did not account for radiative effects induced by RRS. The RRS intensity typically decreases with increasing wavelength (Vasilkov et al., 2013), and its spectral interference is statistically negligible within the red to far-red spectral bands. Moreover, the data-driven SIF retrieval framework inherently addresses potential RRS contamination through basis vector parameterization (Joiner et al., 2016). This approach enables the decoupling of RRS-induced spectral variations from SIF emission signals.
5.2 Advancing global vegetation dynamic insights through TanSat-2 observations
The TanSat-2 mission is equipped with a SIF imaging spectrometer that continuously gathers high-spectral-resolution data across the O2-A and O2-B bands, boasting excellent SNR. The precise retrieval of red and far-red SIF is vital for advancing our comprehension of plant photosynthesis and global carbon cycles. Moreover, the satellite's wide-swath and high-spatial-resolution capabilities promise significant improvements in the informational content of SIF data, especially in regions characterized by fragmented vegetation, thereby facilitating more frequent and valid observations.
The integration of SIF signals from distinct spectral bands offers unique advantages for monitoring vegetation health and photosynthesis (Liu et al., 2017). Notably, the majority of SIF emissions stem from photosystem II (PSII) protein complexes involved in photosynthesis, whereas photosystem I (PSI) predominantly contributes to far-red fluorescence, with its influence increasing at longer wavelengths and typically remaining unaffected by biochemical factors. In contrast, the contributions from PSII are modulated by physiological regulation, leaf structure, and chemical composition (Verrelst et al., 2015). Ač et al. (2015) conducted a meta-analysis that concluded that canopy-level red and far-red SIF diminishes under water stress, while the ratio of red to far-red fluorescence increases in response to nitrogen deficiency. Red and far-red SIF can serve as early indicators of both water stress and recovery (Daumard et al., 2010; Xu et al., 2018). By utilizing high-precision spectral data from TanSat-2 for dual-band SIF retrieval, the capacity to detect vegetation physiological parameters is significantly enhanced, offering substantial advantages for monitoring vegetation health. Furthermore, Verrelst et al. (2015) demonstrated that peaks in red SIF emission are strongly influenced by carboxylation capacity (Vcmo), which correlates with photosynthetic capacity. Consequently, employing dual-band emission fluxes, rather than relying solely on a single far-red band, proves more effective for correlating SIF with photosynthetic metrics such as gross primary productivity (GPP).
The TanSat-2 satellite is specifically designed for global carbon inventory verification. It features a wide swath of 2900 km and high spatial resolution of 2 km at an orbit altitude of 7000 km, providing near-daily global baseline coverage. Additionally, it is equipped with a wide spectral range and high spectral specifications, enabling dual-band SIF retrievals with unprecedented accuracy. This paper employs spectral simulations to optimize empirical parameters for data-driven SIF retrieval in two channels of the TanSat-2 satellite. Using the optimized data-driven algorithm, the RMSEs of SIF retrievals for the two channels are 0.24 m and 0.19 mW m−2 sr−1 nm−1. Furthermore, the potential of the forthcoming TanSat-2 satellite for global SIF monitoring is evaluated through end-to-end simulations at a global scale. Comparisons between daily and 0.05° global composites of dual-band SIF retrievals and GOSIF indicate strong agreement, with R2 values of 0.88 and 0.61 and RMSE values of 0.082 and 0.061 mW m−1 sr−1 nm−1 for the SIF retrievals at the two bands. Therefore, TanSat-2 presents significant opportunities for SIF retrieval at both red and far-red bands, offering high resolution, precision, and frequency of coverage, which are crucial for a comprehensive understanding of global vegetation photosynthetic activities and the terrestrial carbon cycle.
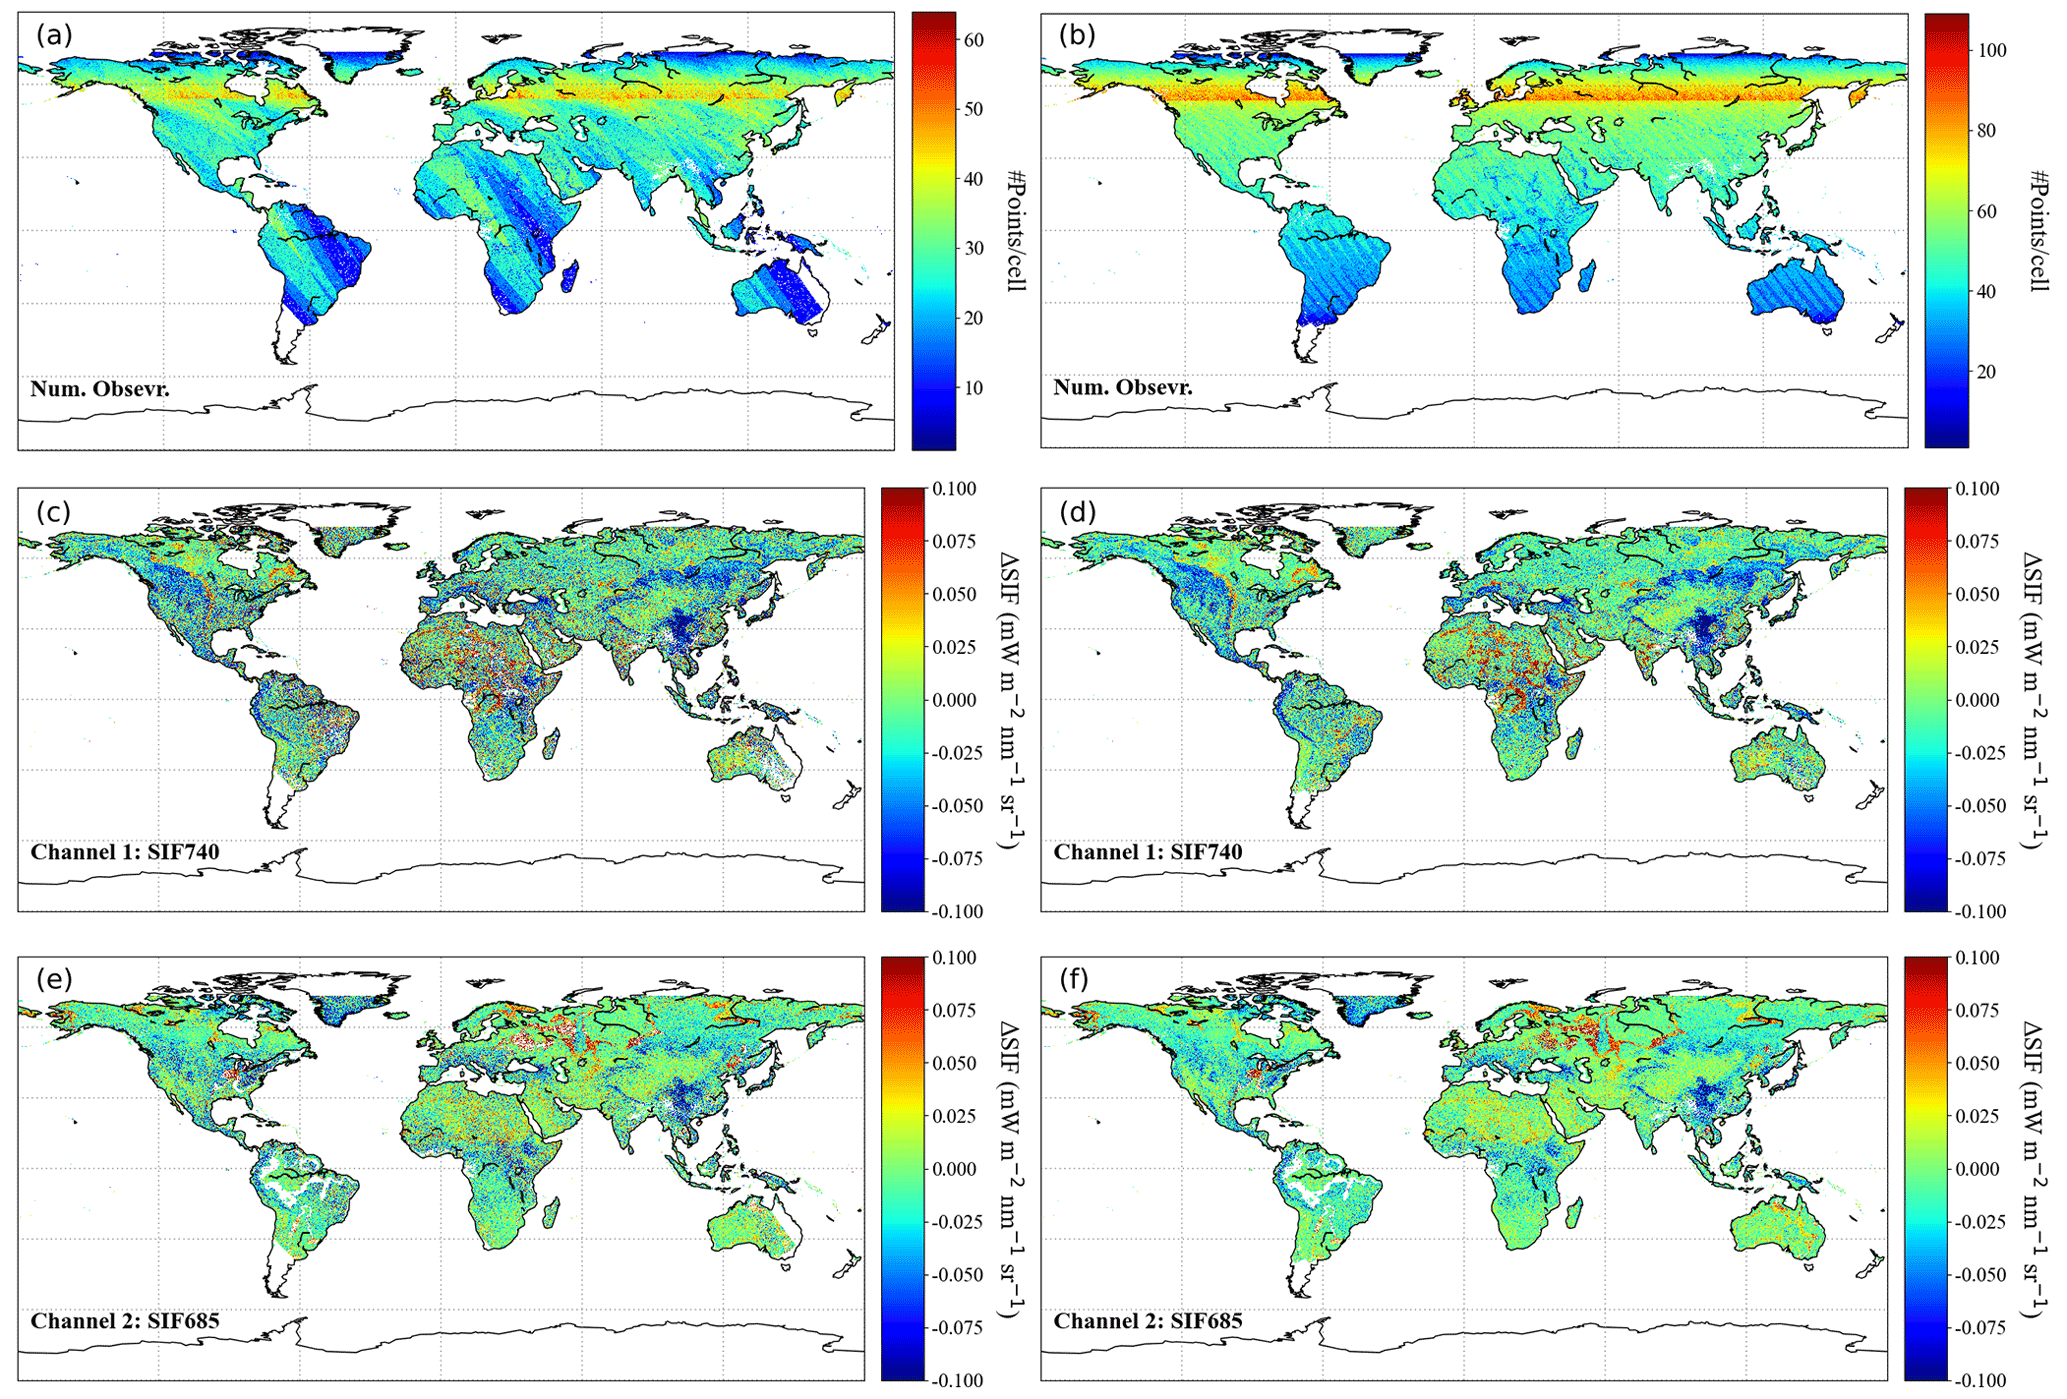
Figure A1Global maps of TanSat-2 observation counts (a, b) and retrieval errors (retrieved SIF minus reference SIF) for channel l (c, d) and channel 2 (e, f). Results are derived from 4 d (a, c, e) and 8 d (b, d, f) composites at 0.05° grid resolution.
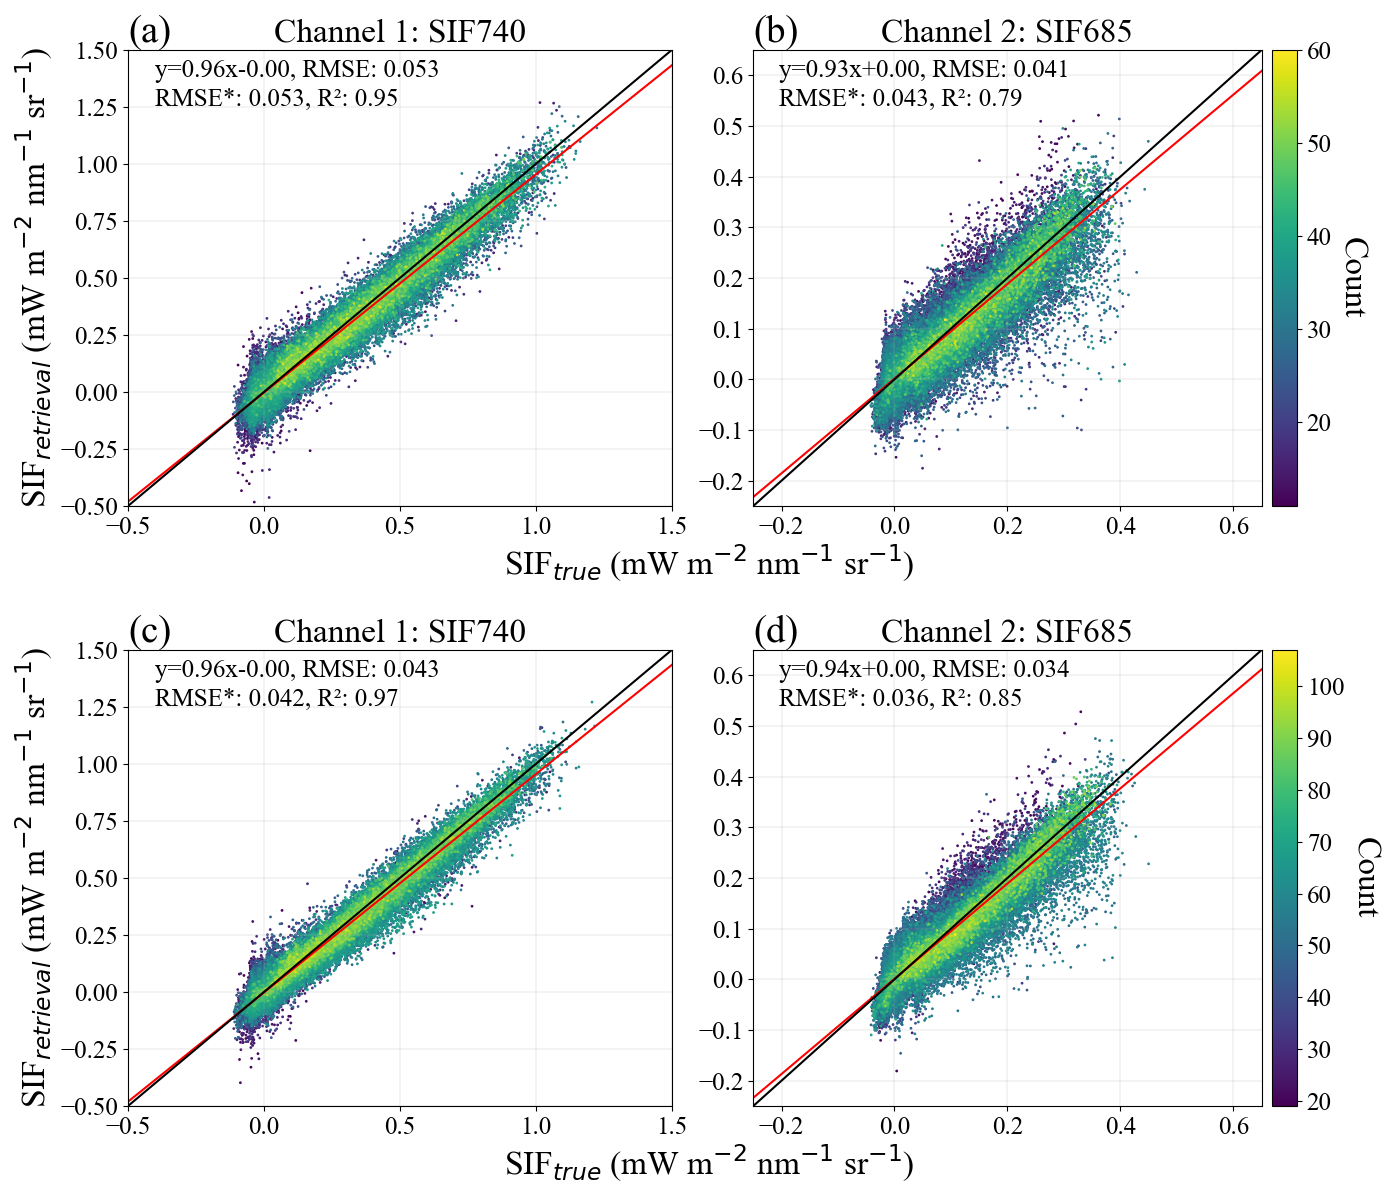
Figure A2Retrieved versus reference SIF relationships for TanSat-2's two channels derived from 4 d composites (a, b) and 8 d composites (c, d). The black lines denote the 1:1 relationship, while the red lines indicate linear regression fits.
The TanSat-2 SIF retrieval code (v1.0) developed in this study is openly available at https://github.com/DianrunZhao/TanSat-2-SIF-retrieval (last access: 5 August 2025) and archived on Zenodo (https://doi.org/10.5281/zenodo.16749197, Zhao et al., 2025).
Data will be made available on request.
DZ, SD, and LL designed the experiments, and DZ carried them out. DZ developed the model code and prepared the paper. CZ, MF, and YD contributed significantly to the research method and the paper revision. LT provided important support concerning the descriptions of the satellite.
The contact author has declared that none of the authors has any competing interests.
Publisher's note: Copernicus Publications remains neutral with regard to jurisdictional claims made in the text, published maps, institutional affiliations, or any other geographical representation in this paper. While Copernicus Publications makes every effort to include appropriate place names, the final responsibility lies with the authors.
We gratefully acknowledge all teams and institutions that make their datasets and software publicly available, enabling this study. We also thank the editor and three reviewers for their constructive comments and suggestions.
This work was funded by the National Key Research and Development Program Earth Observation and Navigation Key project (grant no. 2023YFB3907405) and the National Natural Science Foundation of China (grant no. 42201356).
This paper was edited by Meng Gao and reviewed by Henry Buijs and two anonymous referees.
Ač, A., Malenovský, Z., Olejníčková, J., Gallé, A., Rascher, U., and Mohammed, G.: Meta-analysis assessing potential of steady-state chlorophyll fluorescence for remote sensing detection of plant water, temperature and nitrogen stress, Remote Sens. Environ., 168, 420–436, https://doi.org/10.1016/j.rse.2015.07.022, 2015.
Amante, C. and Eakins, B. W.: ETOPO1 arc-minute global relief model: procedures, data sources and analysis, NOAA Tech. Memo. NESDIS NGDC 24, National Geophysical Data Center, https://doi.org/10.7289/V5C8276M, 2009.
Berk, A., Bernstein, L. S., Anderson, G. P., Acharya, P. K., Robertson, D. C., Chetwynd, J. H., and Adler-Golden, S. M.: MODTRAN Cloud and Multiple Scattering Upgrades with Application to AVIRIS, Remote Sens. Environ., 65, 367–375, https://doi.org/10.1016/S0034-4257(98)00045-5, 1998.
Berk, A., Acharya, P. K., Bernstein, L. S., Anderson, G. P., Jr, J. H. C., and Hoke, M. L.: Reformulation of the MODTRAN band model for higher spectral resolution, in: Algorithms for Multispectral, Hyperspectral, and Ultraspectral Imagery VI, Algorithms for Multispectral, Hyperspectral, and Ultraspectral Imagery VI, 190–198, https://doi.org/10.1117/12.410340, 2000.
Clark, R. N. and Swayze, G. A.: Automated spectral analysis – mapping minerals, amorphous materials, environmental materials, vegetation, water, ice and snow, and other materials: the USGS Tricorder algorithm, in: Proceedings of the 26th Lunar and Planetary Science Conference, Houston, TX, USA, 13–17 March 1995, 255–256, https://ui.adsabs.harvard.edu/abs/1995LPI....26..255C (last access: 5 August 2025), 1995.
Coppo, P., Taiti, A., Pettinato, L., Francois, M., Taccola, M., and Drusch, M.: Fluorescence Imaging Spectrometer (FLORIS) for ESA FLEX Mission, Remote Sens., 9, 649, https://doi.org/10.3390/rs9070649, 2017.
Damm, A., Erler, A., Hillen, W., Meroni, M., Schaepman, M. E., Verhoef, W., and Rascher, U.: Modeling the impact of spectral sensor configurations on the FLD retrieval accuracy of sun-induced chlorophyll fluorescence, Remote Sens. Environ., 115, 1882–1892, https://doi.org/10.1016/j.rse.2011.03.011, 2011.
Daumard, F., Champagne, S., Fournier, A., Goulas, Y., Ounis, A., Hanocq, J.-F., and Moya, I.: A Field Platform for Continuous Measurement of Canopy Fluorescence, IEEE T. Geosci. Remote Sens., 48, 3358–3368, https://doi.org/10.1109/TGRS.2010.2046420, 2010.
Dechant, B., Ryu, Y., Badgley, G., Köhler, P., Rascher, U., Migliavacca, M., Zhang, Y., Tagliabue, G., Guan, K., Rossini, M., Goulas, Y., Zeng, Y., Frankenberg, C., and Berry, J. A.: NIRVP: A robust structural proxy for sun-induced chlorophyll fluorescence and photosynthesis across scales, Remote Sens. Environ., 268, 112763, https://doi.org/10.1016/j.rse.2021.112763, 2022.
Du, S., Liu, L., Liu, X., Zhang, X., Zhang, X., Bi, Y., and Zhang, L.: Retrieval of global terrestrial solar-induced chlorophyll fluorescence from TanSat satellite, Sci. Bull., 63, 1502–1512, https://doi.org/10.1016/j.scib.2018.10.003, 2018.
Du, S., Liu, L., Liu, X., Zhang, X., Gao, X., and Wang, W.: The Solar-Induced Chlorophyll Fluorescence Imaging Spectrometer (SIFIS) Onboard the First Terrestrial Ecosystem Carbon Inventory Satellite (TECIS-1): Specifications and Prospects, Sensors, 20, 815, https://doi.org/10.3390/s20030815, 2020.
Du, S., Liu, X., Chen, J., and Liu, L.: Prospects for Solar-Induced Chlorophyll Fluorescence Remote Sensing from the SIFIS Payload Onboard the TECIS-1 Satellite, J. Remote Sens., 2022, 9845432, https://doi.org/10.34133/2022/9845432, 2022.
Frankenberg, C., Butz, A., and Toon, G. C.: Disentangling chlorophyll fluorescence from atmospheric scattering effects in O2 A-band spectra of reflected sun-light, Geophys. Res. Lett., 38, L03801, https://doi.org/10.1029/2010GL045896, 2011a.
Frankenberg, C., Fisher, J. B., Worden, J., Badgley, G., Saatchi, S. S., Lee, J.-E., Toon, G. C., Butz, A., Jung, M., Kuze, A., and Yokota, T.: New global observations of the terrestrial carbon cycle from GOSAT: Patterns of plant fluorescence with gross primary productivity, Geophys. Res. Lett., 38, L17706, https://doi.org/10.1029/2011GL048738, 2011b.
Frankenberg, C., O'Dell, C., Berry, J., Guanter, L., Joiner, J., Köhler, P., Pollock, R., and Taylor, T. E.: Prospects for chlorophyll fluorescence remote sensing from the Orbiting Carbon Observatory-2, Remote Sens. Environ., 147, 1–12, https://doi.org/10.1016/j.rse.2014.02.007, 2014a.
Frankenberg, C., O'Dell, C., Berry, J., Guanter, L., Joiner, J., Köhler, P., Pollock, R., and Taylor, T. E.: Prospects for chlorophyll fluorescence remote sensing from the Orbiting Carbon Observatory-2, Remote Sens. Environ., 147, 1–12, https://doi.org/10.1016/j.rse.2014.02.007, 2014b.
Guanter, L., Alonso, L., Gómez-Chova, L., Meroni, M., Preusker,R., Fischer, J., and Moreno, J.: Developments for vegetation fluorescence retrieval from spaceborne high-resolution spectrometry in the O2-A and O2-B absorption bands, J. Geophys. Res.-Atmos., 115, D19303, https://doi.org/10.1029/2009JD013716, 2010.
Guanter, L., Frankenberg, C., Dudhia, A., Lewis, P. E., Gómez-Dans, J., Kuze, A., Suto, H., and Grainger, R. G.: Retrieval and global assessment of terrestrial chlorophyll fluorescence from GOSAT space measurements, Remote Sens. Environ., 121, 236–251, https://doi.org/10.1016/j.rse.2012.02.006, 2012.
Guanter, L., Rossini, M., Colombo, R., Meroni, M., Frankenberg, C., Lee, J.-E., and Joiner, J.: Using field spectroscopy to assess the potential of statistical approaches for the retrieval of sun-induced chlorophyll fluorescence from ground and space, Remote Sens. Environ., 133, 52–61, https://doi.org/10.1016/j.rse.2013.01.017, 2013.
Guanter, L., Zhang, Y., Jung, M., Joiner, J., Voigt, M., Berry, J. A., Frankenberg, C., Huete, A. R., Zarco-Tejada, P., Lee, J.-E., Moran, M. S., Ponce-Campos, G., Beer, C., Camps-Valls, G., Buchmann, N., Gianelle, D., Klumpp, K., Cescatti, A., Baker, J. M., and Griffis, T. J.: Global and time-resolved monitoring of crop photosynthesis with chlorophyll fluorescence, P. Natl. Acad. Sci. USA, 111, E1327–1333, https://doi.org/10.1073/pnas.1320008111, 2014.
Guanter, L., Aben, I., Tol, P., Krijger, J. M., Hollstein, A., Köhler, P., Damm, A., Joiner, J., Frankenberg, C., and Landgraf, J.: Potential of the TROPOspheric Monitoring Instrument (TROPOMI) onboard the Sentinel-5 Precursor for the monitoring of terrestrial chlorophyll fluorescence, Atmos. Meas. Tech., 8, 1337–1352, https://doi.org/10.5194/amt-8-1337-2015, 2015.
Guanter, L., Bacour, C., Schneider, A., Aben, I., van Kempen, T. A., Maignan, F., Retscher, C., Köhler, P., Frankenberg, C., Joiner, J., and Zhang, Y.: The TROPOSIF global sun-induced fluorescence dataset from the Sentinel-5P TROPOMI mission, Earth Syst. Sci. Data, 13, 5423–5440, https://doi.org/10.5194/essd-13-5423-2021, 2021.
Hersbach, H., Bell, B., Berrisford, P., Hirahara, S., Horányi, A., Muñoz-Sabater, J., Nicolas, J., Peubey, C., Radu, R., Schepers, D., Simmons, A., Soci, C., Abdalla, S., Abellan, X., Balsamo, G., Bechtold, P., Biavati, G., Bidlot, J., Bonavita, M., De Chiara, G., Dahlgren, P., Dee, D., Diamantakis, M., Dragani, R., Flemming, J., Forbes, R., Fuentes, M., Geer, A., Haimberger, L., Healy, S., Hogan, R. J., Hólm, E., Janisková, M., Keeley, S., Laloyaux, P., Lopez, P., Lupu, C., Radnoti, G., de Rosnay, P., Rozum, I., Vamborg, F., Villaume, S., and Thépaut, J.-N.: The ERA5 global reanalysis, Q. J. Roy. Meteorol. Soc., 146, 1999–2049, https://doi.org/10.1002/qj.3803, 2020.
Huete, A., Didan, K., Miura, T., Rodriguez, E. P., Gao, X., and Ferreira, L. G.: Overview of the radiometric and biophysical performance of the MODIS vegetation indices, Remote Sens. Environ., 83, 195–213, https://doi.org/10.1016/S0034-4257(02)00096-2, 2002.
Inness, A., Ades, M., Agustí-Panareda, A., Barré, J., Benedictow, A., Blechschmidt, A.-M., Dominguez, J. J., Engelen, R., Eskes, H., Flemming, J., Huijnen, V., Jones, L., Kipling, Z., Massart, S., Parrington, M., Peuch, V.-H., Razinger, M., Remy, S., Schulz, M., and Suttie, M.: The CAMS reanalysis of atmospheric composition, Atmos. Chem. Phys., 19, 3515–3556, https://doi.org/10.5194/acp-19-3515-2019, 2019.
Joiner, J., Yoshida, Y., Vasilkov, A. P., Yoshida, Y., Corp, L. A., and Middleton, E. M.: First observations of global and seasonal terrestrial chlorophyll fluorescence from space, Biogeosciences, 8, 637–651, https://doi.org/10.5194/bg-8-637-2011, 2011.
Joiner, J., Yoshida, Y., Vasilkov, A. P., Middleton, E. M., Campbell, P. K. E., Yoshida, Y., Kuze, A., and Corp, L. A.: Filling-in of near-infrared solar lines by terrestrial fluorescence and other geophysical effects: simulations and space-based observations from SCIAMACHY and GOSAT, Atmos. Meas. Tech., 5, 809–829, https://doi.org/10.5194/amt-5-809-2012, 2012.
Joiner, J., Guanter, L., Lindstrot, R., Voigt, M., Vasilkov, A. P., Middleton, E. M., Huemmrich, K. F., Yoshida, Y., and Frankenberg, C.: Global monitoring of terrestrial chlorophyll fluorescence from moderate-spectral-resolution near-infrared satellite measurements: methodology, simulations, and application to GOME-2, Atmos. Meas. Tech., 6, 2803–2823, https://doi.org/10.5194/amt-6-2803-2013, 2013.
Joiner, J., Yoshida, Y., Guanter, L., and Middleton, E. M.: New methods for the retrieval of chlorophyll red fluorescence from hyperspectral satellite instruments: simulations and application to GOME-2 and SCIAMACHY, Atmos. Meas. Tech., 9, 3939–3967, https://doi.org/10.5194/amt-9-3939-2016, 2016.
Köhler, P., Guanter, L., and Joiner, J.: A linear method for the retrieval of sun-induced chlorophyll fluorescence from GOME-2 and SCIAMACHY data, Atmos. Meas. Tech., 8, 2589–2608, https://doi.org/10.5194/amt-8-2589-2015, 2015a.
Köhler, P., Guanter, L., and Frankenberg, C.: Simplified physically based retrieval of sun-induced chlorophyll fluorescence from GOSAT data, IEEE Geosci. Remote Sens. Lett., 12, 1446–1450, https://doi.org/10.1109/LGRS.2015.2407051, 2015b.
Köhler, P., Frankenberg, C., Magney, T. S., Guanter, L., Joiner, J., and Landgraf, J.: Global Retrievals of Solar-Induced Chlorophyll Fluorescence With TROPOMI: First Results and Intersensor Comparison to OCO-2, https://doi.org/10.1029/2018GL079031, 2018.
Liu, L., Liu, X., Hu, J., and Guan, L.: Assessing the wavelength-dependent ability of solar-induced chlorophyll fluorescence to estimate the GPP of winter wheat at the canopy level, Int. J. Remote Sens., 38, 4396–4417, https://doi.org/10.1080/01431161.2017.1320449, 2017.
Liu, X. and Liu, L.: Assessing Band Sensitivity to Atmospheric Radiation Transfer for Space-Based Retrieval of Solar-Induced Chlorophyll Fluorescence, Remote Sens., 6, 10656–10675, https://doi.org/10.3390/rs61110656, 2014.
Li, X. and Xiao, J.: A Global, 0.05-Degree Product of Solar-Induced Chlorophyll Fluorescence Derived from OCO-2, MODIS, and Reanalysis Data, Remote Sens., 11, 517, https://doi.org/10.3390/rs11050517, 2019.
Mohammed, G. H., Colombo, R., Middleton, E. M., Rascher, U., van der Tol, C., Nedbal, L., Goulas, Y., Pérez-Priego, O., Damm, A., Meroni, M., Joiner, J., Cogliati, S., Verhoef, W., Malenovský, Z., Gastellu-Etchegorry, J.-P., Miller, J. R., Guanter, L., Moreno, J., Moya, I., Berry, J. A., Frankenberg, C., and Zarco-Tejada, P. J.: Remote sensing of solar-induced chlorophyll fluorescence (SIF) in vegetation: 50 years of progress, Remote Sens. Environ., 231, 111177, https://doi.org/10.1016/j.rse.2019.04.030, 2019.
Riggs, G., Hall, D., and Salomonson, V.: MODIS Snow products user guide to collection 5, Digital Media, 6, 80 pp., https://nsidc.org/data/modis/data_summaries (last access: 5 August 2025), 2006.
Salomonson, V. V. and Appel, I.: Estimating fractional snow cover from MODIS using the normalized difference snow index, Remote Sens. Environ., 89, 351–360, https://doi.org/10.1016/j.rse.2003.10.016, 2004.
Sun, Y., Frankenberg, C., Wood, J. D., Schimel, D. S., Jung, M., Guanter, L., Drewry, D. T., Verma, M., Porcar-Castell, A., Griffis, T. J., Gu, L., Magney, T. S., Köhler, P., Evans, B., and Yuen, K.: OCO-2 advances photosynthesis observation from space via solar-induced chlorophyll fluorescence, Science, 358, eaam5747, https://doi.org/10.1126/science.aam5747, 2017.
Taylor, T. E., Eldering, A., Merrelli, A., Kiel, M., Somkuti, P., Cheng, C., Rosenberg, R., Fisher, B., Crisp, D., Basilio, R., Bennett, M., Cervantes, D., Chang, A., Dang, L., Frankenberg, C., Haemmerle, V. R., Keller, G. R., Kurosu, T., Laughner, J. L., Lee, R., Marchetti, Y., Nelson, R. R., O'Dell, C. W., Osterman, G., Pavlick, R., Roehl, C., Schneider, R., Spiers, G., To, C., Wells, C., Wennberg, P. O., Yelamanchili, A., and Yu, S.: OCO-3 early mission operations and initial (vEarly) XCO2 and SIF retrievals, Remote Sens. Environ., 251, 112032, https://doi.org/10.1016/j.rse.2020.112032, 2020.
van der Tol, C., Verhoef, W., Timmermans, J., Verhoef, A., and Su, Z.: An integrated model of soil-canopy spectral radiances, photosynthesis, fluorescence, temperature and energy balance, Biogeosciences, 6, 3109–3129, https://doi.org/10.5194/bg-6-3109-2009, 2009.
Vasilkov, A., Joiner, J., and Spurr, R.: Note on rotational-Raman scattering in the O2 A- and B-bands, Atmos. Meas. Tech., 6, 981–990, https://doi.org/10.5194/amt-6-981-2013, 2013.
Verhoef, W. and Bach, H.: Simulation of Sentinel-3 images by four-stream surface–atmosphere radiative transfer modeling in the optical and thermal domains, Remote Sens. Environ., 120, 197–207, https://doi.org/10.1016/j.rse.2011.10.034, 2012.
Verhoef, W., van der Tol, C., and Middleton, E. M.: Hyperspectral radiative transfer modeling to explore the combined retrieval of biophysical parameters and canopy fluorescence from FLEX – Sentinel-3 tandem mission multi-sensor data, Remote Sens. Environ., 204, 942–963, https://doi.org/10.1016/j.rse.2017.08.006, 2018.
Verrelst, J., Camps-Valls, G., Muñoz-Marí, J., Rivera, J. P., Veroustraete, F., Clevers, J. G. P. W., and Moreno, J.: Optical remote sensing and the retrieval of terrestrial vegetation bio-geophysical properties – A review, ISPRS J. Photogramm. Remote Sens., 108, 273–290, https://doi.org/10.1016/j.isprsjprs.2015.05.005, 2015.
Vicent, J., Sabater, N., Tenjo, C., Acarreta, J. R., Manzano, M., Rivera, J. P., Jurado, P., Franco, R., Alonso, L., Verrelst, J., and Moreno, J.: FLEX End-to-End Mission Performance Simulator, IEEE T. Geosci. Remote Sens., 54, 4215–4223, https://doi.org/10.1109/TGRS.2016.2538300, 2016.
Xu, S., Liu, Z., Zhao, L., Zhao, H., and Ren, S.: Diurnal Response of Sun-Induced Fluorescence and PRI to Water Stress in Maize Using a Near-Surface Remote Sensing Platform, Remote Sens., 10, 1510, https://doi.org/10.3390/rs10101510, 2018.
Zhao, D., Du, S., Zou, C., Tian, L., Fan, M., Du, Y., and Liu, L.: TanSat-2 SIF retrieval (v1.0), Zenodo [code], https://doi.org/10.5281/zenodo.16749197, 2025.
Zhao, F., Ma, W., Köhler, P., Ma, X., Sun, H., Verhoef, W., Zhao, J., Huang, Y., Li, Z., and Ratul, A. K.: Retrieval of Red Solar-Induced Chlorophyll Fluorescence With TROPOMI on the Sentinel-5 Precursor Mission, IEEE T. Geosci. Remote Sens., 60, 1–14, https://doi.org/10.1109/TGRS.2022.3162726, 2022a.
Zhao, F., Ma, W., Köhler, P., Ma, X., Sun, H., Verhoef, W., Zhao, J., Huang, Y., Li, Z., and Ratul, A. K.: Retrieval of Red Solar-Induced Chlorophyll Fluorescence With TROPOMI on the Sentinel-5 Precursor Mission, IEEE T. Geosci. Remote Sens., 60, 1–14, https://doi.org/10.1109/TGRS.2022.3162726, 2022b.
Zheng, X., Zhao, W., Zhu, Z., Wang, Z., Zheng, Y., and Li, D.: Characterization and Evaluation of Global Solar-Induced Chlorophyll Fluorescence Products: Estimation of Gross Primary Productivity and Phenology, J. Remote Sens., 4, 0173, https://doi.org/10.34133/remotesensing.0173, 2024.
Zou, C., Du, S., Liu, X., Liu, L., Wang, Y., and Li, Z.: Optimizing the Empirical Parameters of the Data-Driven Algorithm for SIF Retrieval for SIFIS Onboard TECIS-1 Satellite, Sensors, 21, 3482, https://doi.org/10.3390/s21103482, 2021.
Zou, C., Liu, L., Du, S., and Liu, X.: Investigating the Potential Accuracy of Spaceborne Solar-Induced Chlorophyll Fluorescence Retrieval for 12 Capable Satellites Based on Simulation Data, IEEE T. Geosci. Remote Sens., 60, 1–13, https://doi.org/10.1109/TGRS.2022.3210185, 2022.