the Creative Commons Attribution 4.0 License.
the Creative Commons Attribution 4.0 License.
 | 16 Sep 2025
Assessment of aerosol optical depth forecast for day-ahead clear-sky direct irradiance
Kyriakoula Papachristopoulou
Stelios Kazadzis
We used aerosol data from surface-based AErosol RObotic NETwork (AERONET) and day-ahead aerosol optical depth (AOD) forecasts from the Copernicus Atmosphere Monitoring Service (CAMS) to examine the spatiotemporal variations in AOD at selected sites worldwide. We evaluated three methods for day-ahead AOD forecasting: AERONET 1 d (and 2 d) persistence or monthly mean, along with CAMS forecast. High values of daily mean AOD indicates larger day-to-day variability in AOD and lower predictability. Using radiative transfer modeling, we quantify deviations in forecasts of cloud-free direct normal irradiance (DNI) induced by errors in AOD forecasts. The performance of each AOD forecast method in DNI forecast is assessed and compared. Taking into account the characteristic aerosol types at selected locations, we also draw quantitative implications about the reliability and usability of CAMS AOD forecasts for DNI forecasts as alternatives to AOD forecasts based on approaches using ground-based measurements. For example, CAMS forecasts perform better at more sites than AERONET persistence approaches do, among them many urban-industrial aerosol sites. AERONET persistence forecasts AOD with lower errors at dust aerosol sites. To date, none of the forecast methods for AOD discussed here reliably achieve an accuracy of < 5 % deviation in day-ahead forecasts of direct normal irradiation (daily sum), but most of the sites can expect better DNI forecasts with a threshold of 20 % DNI deviation.
- Article
(2809 KB) - Full-text XML
- BibTeX
- EndNote


Besides solar photovoltaics (PV), concentrating solar power (CSP) is another promising solar energy technology growing fast in recent years (IEA, 2020). CSP only operates in regions with high direct normal irradiance (DNI, > 200 W m−2) and low cloud cover (Schroedter-Homscheidt et al., 2013). In such high-DNI regions, tracked PV also yields e.g. 25 %–35 % more using dual-axis tracking than fixed-tilt systems (Wang et al., 2023). Accurate and reliable forecasts of solar resources thus are important for both PV systems and CSP plants (Yang et al., 2022), which possess the potential to mitigate energy crisis and climate change at the regional and global scales.
Solar forecasts of global irradiance for PV systems are primarily affected by the uncertainty of clouds. DNI, as one component of global irradiance, is attenuated by aerosols to a larger extent than the diffuse component. Therefore, aerosols play the main role in DNI forecasts for CSP applications in regions with high insolation and low cloudiness (Xu et al., 2016). The intensity of aerosols critically affects surface solar radiation (SSR) availability in some of the most sunshine-privileged regions, including North Africa (Mona et al., 2023; Xiong et al., 2020; Neher et al., 2017), Middle East (Al-Rasheedi et al., 2020; Gueymard and Jimenez, 2018), and the Mediterranean (Tuna Tuygun and Elbir, 2024; Masoom et al., 2023; Fountoulakis et al., 2021), concurrent with low cloudiness. Even Central Europe belongs to a much-affected region with higher sensitivity of solar energy production to aerosols (Blaga et al., 2024). In desert regions or regions suffered from air pollution such as Northern China (Gao et al., 2024; Tang et al., 2023) and India (Masoom et al., 2021), the soiling of solar collectors due to dust is a concern (Yang et al., 2022).
The extinction of solar radiation by atmospheric aerosols is conventionally quantified by aerosol optical depth (AOD). Studies show that the disagreement in irradiances between models and measurements is often linked to models' AOD input (Yang et al., 2022; Gueymard, 2010). To forecast short-term AOD (e.g., within 2 d ahead) before assessing its effect on DNI, it is essential to understand its temporal variability in the first place. Sources of AOD data can be ground-based measurements (e.g., the AErosol RObotic NETwork, AERONET, Holben et al., 1998, or the Global Atmosphere Watch Precision Filter Radiometer, GAW-PFR Network, Kazadzis et al., 2018) or satellite observations. On the one hand, ground-based stations measure aerosols more accurately based on passive remote sensing using radiometers and active remote sensing using LiDARs. However, compared to measurement stations dedicated to other meteorological parameters such as temperature and precipitation, ground sites measuring AOD remain sparse at the global scale (Sengupta et al., 2021). On the other hand, contemporary satellite observations provide vast spatial coverage and long records with relatively high sampling frequency (Gkikas et al., 2021).
The literature contains several studies that investigated the effect of aerosols on solar radiation forecasts: Gueymard (2012) introduced the Aerosol Variability Index to describe the temporal variability of AOD from daily to yearly scales and the Aerosol Sensitivity Index to quantify the effects of absolute variations in AOD on relative variations in SSR. Schroedter-Homscheidt et al. (2013) examined the DNI deviation induced by deviations in AOD across the globe using ground-based measurements and atmospheric modeling data. They then discussed the usability of AOD products in solar radiation forecasting, especially DNI under clear-sky conditions. Salamalikis et al. (2021) also evaluated the influence of AOD accuracy on uncertainties in cloud-free DNI estimates using AOD reanalysis products of global coverage. More recently, Chen et al. (2023) classified four aerosol types based on size distributions and absorptivity using AERONET data and determined the influence of aerosol properties on surface aerosol radiative forcing efficiency. Ansari and Ramachandran (2024) compared the aerosol products from Copernicus Atmosphere Monitoring Service (CAMS) and MERRA-2 in terms of physical properties and spatiotemporal variability over Asia and discovered a superior performance of CAMS in modeling AOD.
However, it remains unclear to which degree we can reconcile the reliability of ground-based measurements of AOD with the wide coverage of model-based AOD for use cases of DNI forecasts worldwide. The questions include which AOD source can provide day-ahead forecasts of irradiance with what level of accuracy and which forecast method to use at a site with certain aerosol types. Using the more recent CAMS AOD forecast, this study revisits Schroedter-Homscheidt et al. (2013) with a similar approach and metrics as suggested by them more than a decade ago. We aim to first examine AOD data sets based on ground-based measurements at selected sites worldwide and quantify the day-to-day AOD variation. We then evaluate three methods to forecast AOD. Next, using the radiative transfer model (RTM) calculations, deviations in cloud-free DNI caused by differences in AOD forecast are quantified, which are directly linked to the accuracy of DNI forecasts. One objective is to assess the reliability and usability of model-based data for AOD forecasts as alternatives to AOD forecasts based on approaches using ground measurements. Last but not least, we also assess DNI forecasts on locations with different aerosol types and draw implications.
We used the following aerosol data sets: Level-2 (cloud screened and quality assured) ground-based AOD measurements from the AERONET Version 3 (Giles et al., 2019) and AOD forecasts from CAMS (Bouarar et al., 2024). AERONET AOD measurement is commonly used as the ground truth for validating and assessing satellite retrievals or reanalysis-based AOD products (Zhang et al., 2024). CAMS obtains the initial conditions of each forecast by combining a previous forecast with current satellite observations through data assimilation (Bozzo et al., 2020). The aerosol modeling scheme includes the following components: dust, organic carbon, black carbon, sulfate AOD and sea salt. CAMS forecasts are validated against ground-based measurements from AERONET and are available from 2015, providing hourly forecasts up to 5 d ahead. Validation of CAMS reanalysis with AERONET data (Inness et al., 2019) suggests a mean bias of −0.003 ± 0.110 in total AOD globally for the period 2003–2016, with positive mean biases over North America and Africa, and largest standard deviation (0.184) over Southeast Asia.
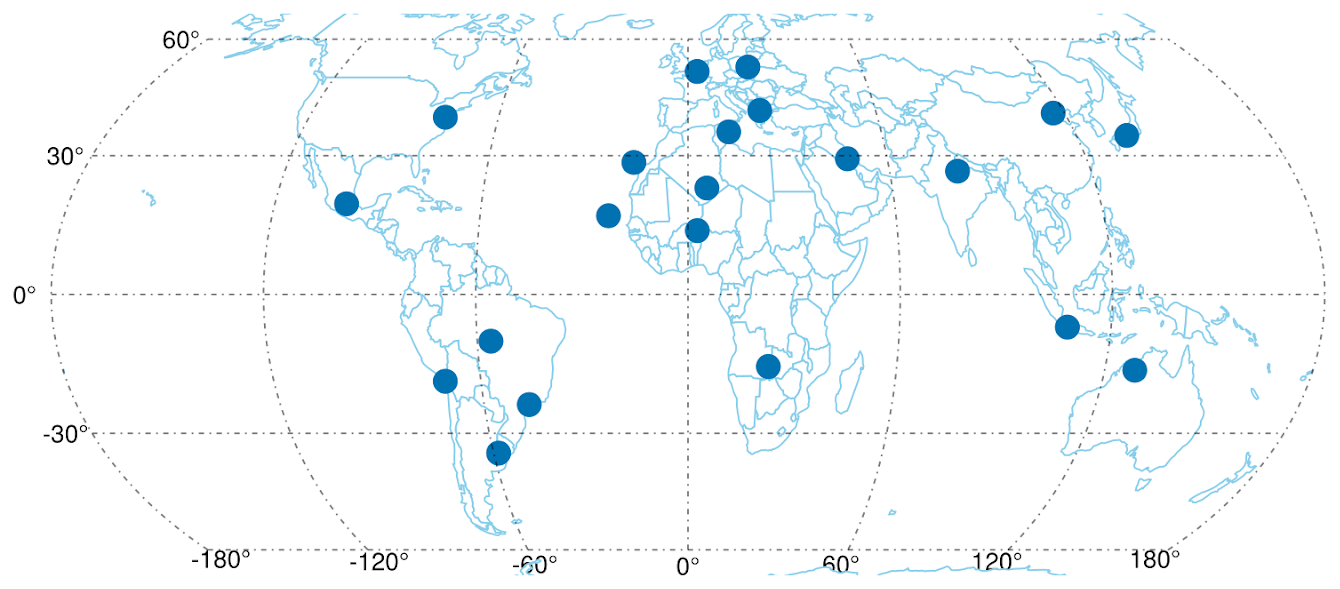
Figure 1Map of 21 selected AERONET sites.
Table 121 AERONET sites grouped by main aerosol type used in this study, with country and mean AOD. Sites marked with ∗ are classified with more than one typical aerosol type.
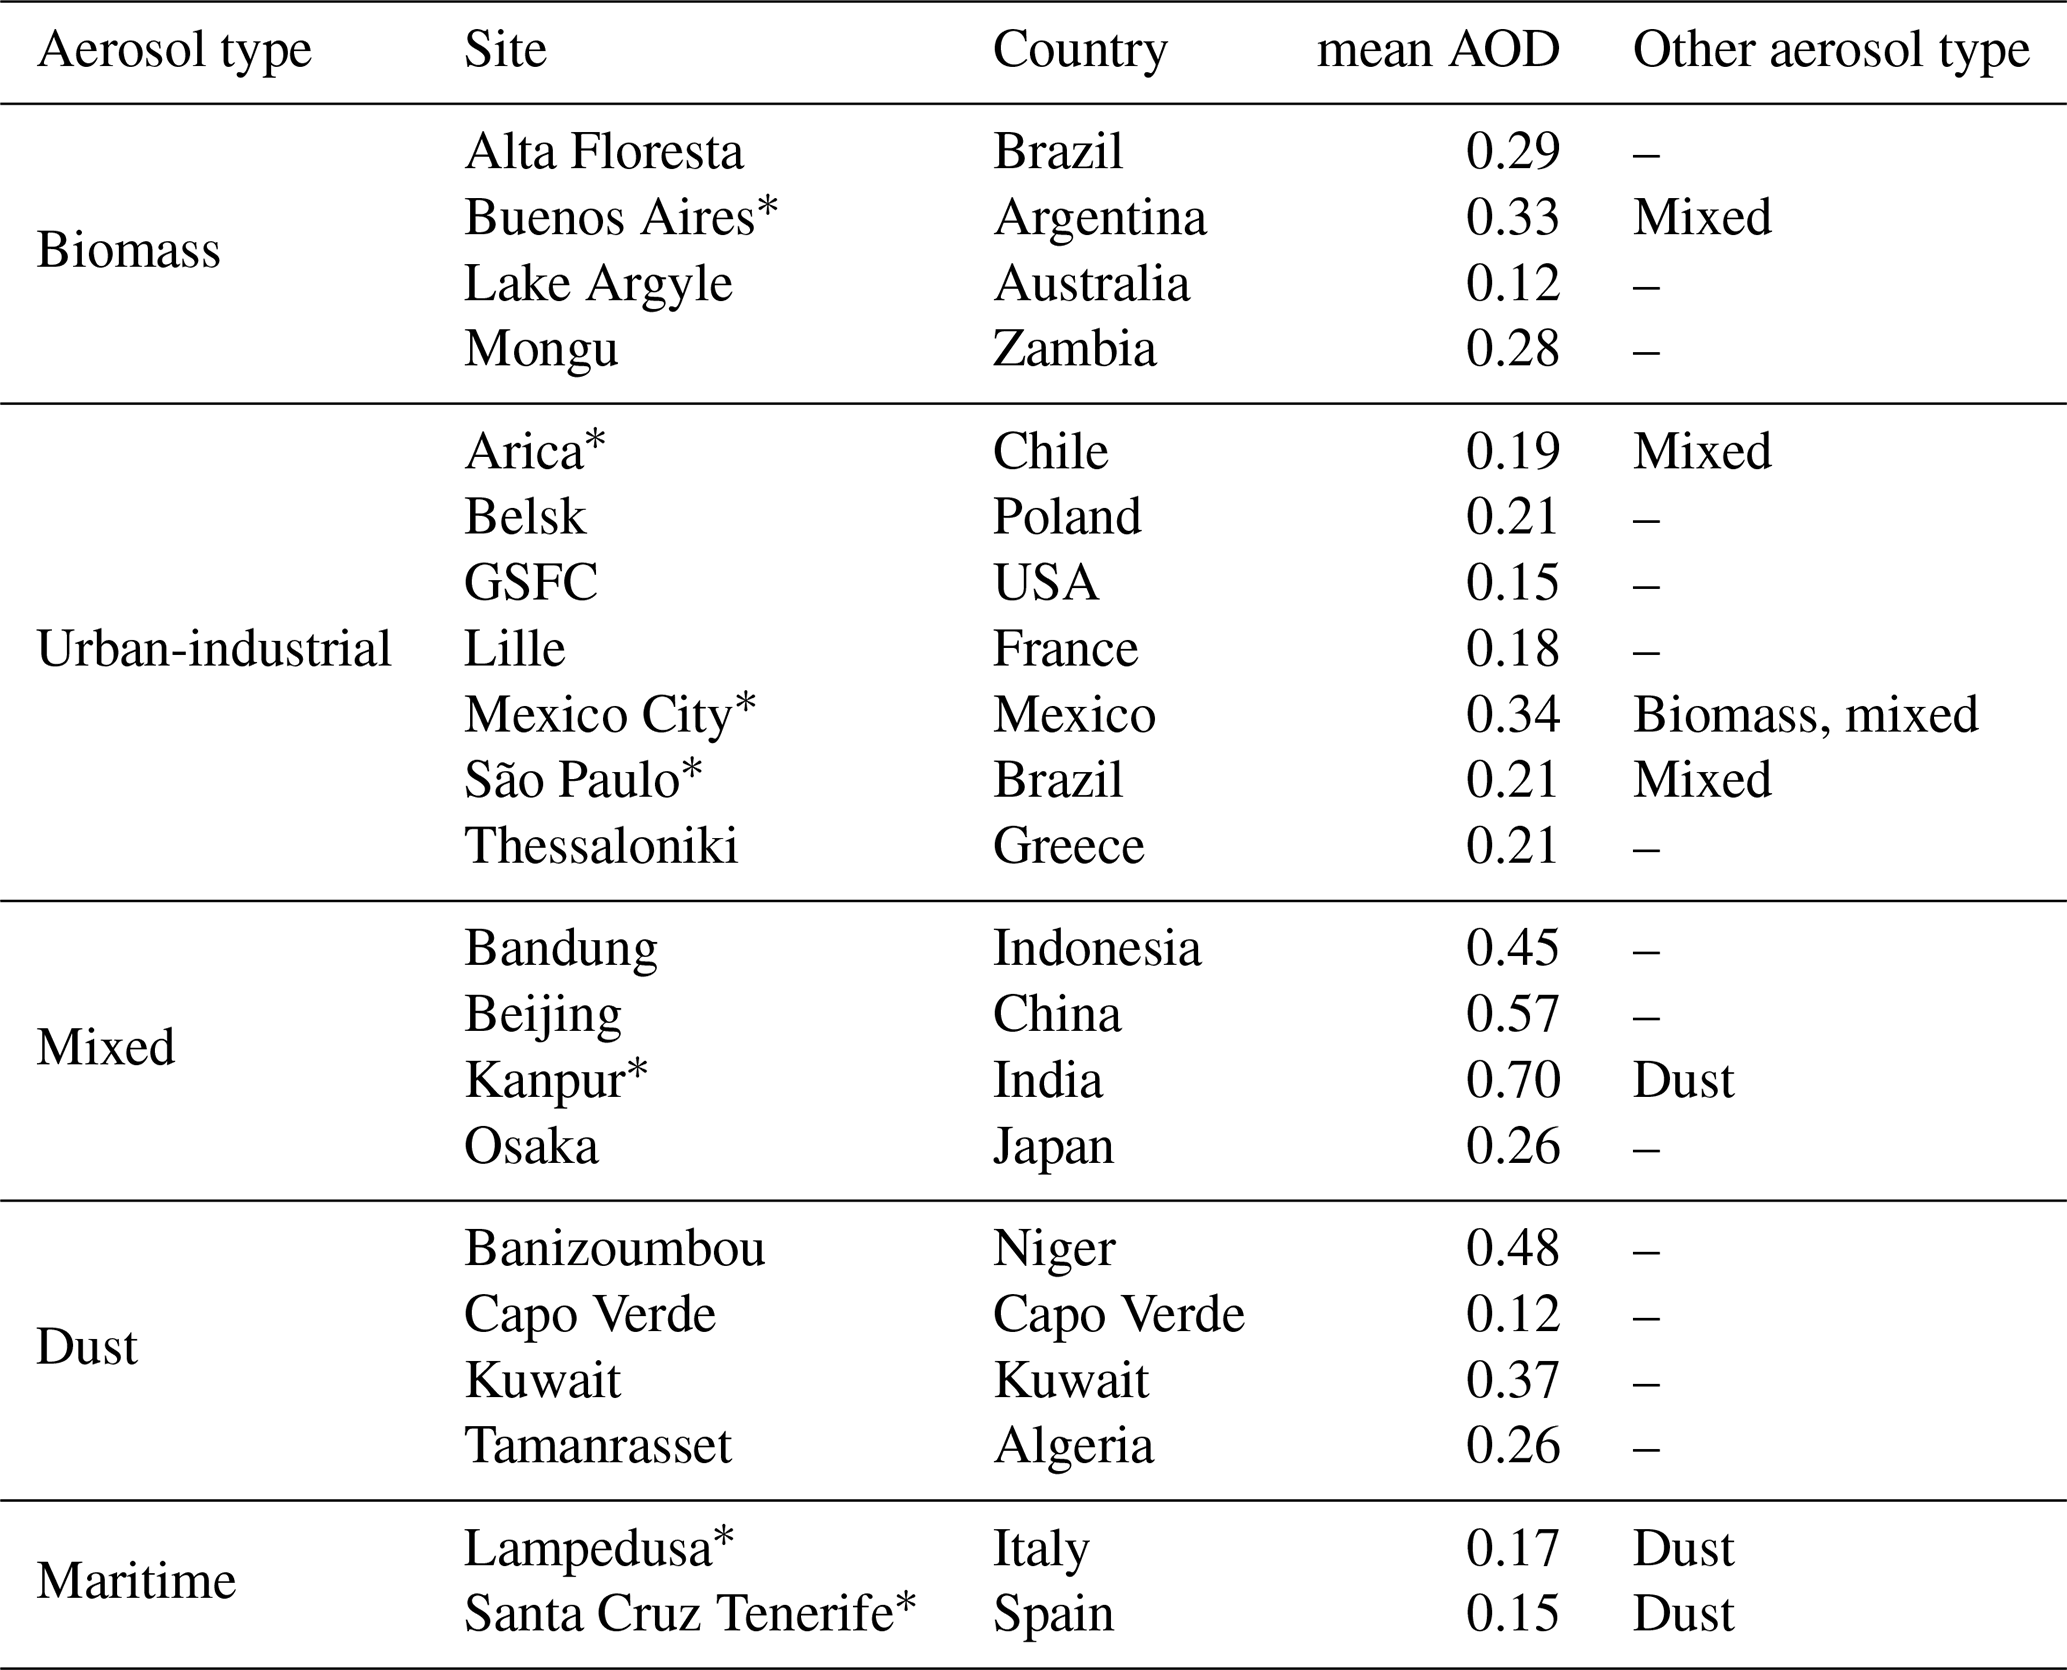
We selected 21 AERONET sites worldwide for the analysis (Fig. 1). Our first criterion of the AERONET site selection is the length of the records with consecutive days from 2010 to 2020. At most sites selected, more than 1200 daily values (average calculated from at least three measurements during the day) for consecutive days from 2010 to 2020 are available. The second criterion follows the aerosol classification by Hamill et al. (2016), which classifies AERONET sites worldwide according to five major aerosol types: biomass, dust, maritime, mixed and urban-industrial. A wide geographical distribution is also considered as the third selection criterion. Therefore, the sites with consecutive days of records < 1000 (Beijing, Capo Verde and Kuwait) are nevertheless included in our analysis. Selected sites with representative aerosol types and country are listed in Table 1. The coordinates and elevation (above sea level) of the sites can be found in Table A1 in the Appendix.
Giles et al. (2019)Bouarar et al. (2024)Bhartia (2012)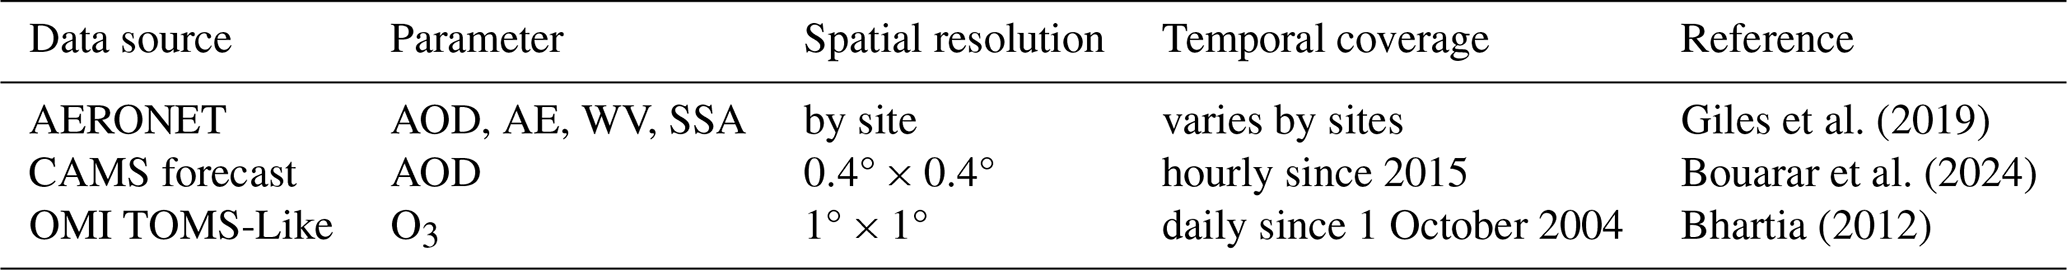
The SSR simulation of DNI for cloud-free conditions was performed using the uvspec model from the libRadtran package (Emde et al., 2016; Mayer and Kylling, 2005). Besides AOD, AE and solar zenith angle (SZA), other input parameters needed are the total column water vapor (TCWV), single scattering albedo (SSA), total ozone column (TOC) and the Earth's albedo. TCWV and SSA are both available from AERONET, where we adopted monthly mean SSA calculated from daily values. We obtained TOC from the Ozone Monitoring Instrument (OMI) TOMS-Like Level-3 product (Bhartia, 2012), which is available daily on a 1°×1° global grid. Pre-calculated look-up tables (LUT) provide hourly solar irradiance values using combinations of possible parameters. Papachristopoulou et al. (2022a) described the interpolation applied on the spectrally integrated irradiance to derive finer LUTs covering over millions of RTM runs: AOD (0 : 0.05 : 2, 2.5, 3), AE (0 : 0.4 : 2), TCWV (0 : 1 : 3, in cm), SSA (0.6 : 0.1 : 1), TOC (200 : 100 : 400, in Dobson Unit) and SZA (1 : 1 : 89, in °) and the surface albedo was set to 0.2. Table 2 provides an overview of the used datasets.
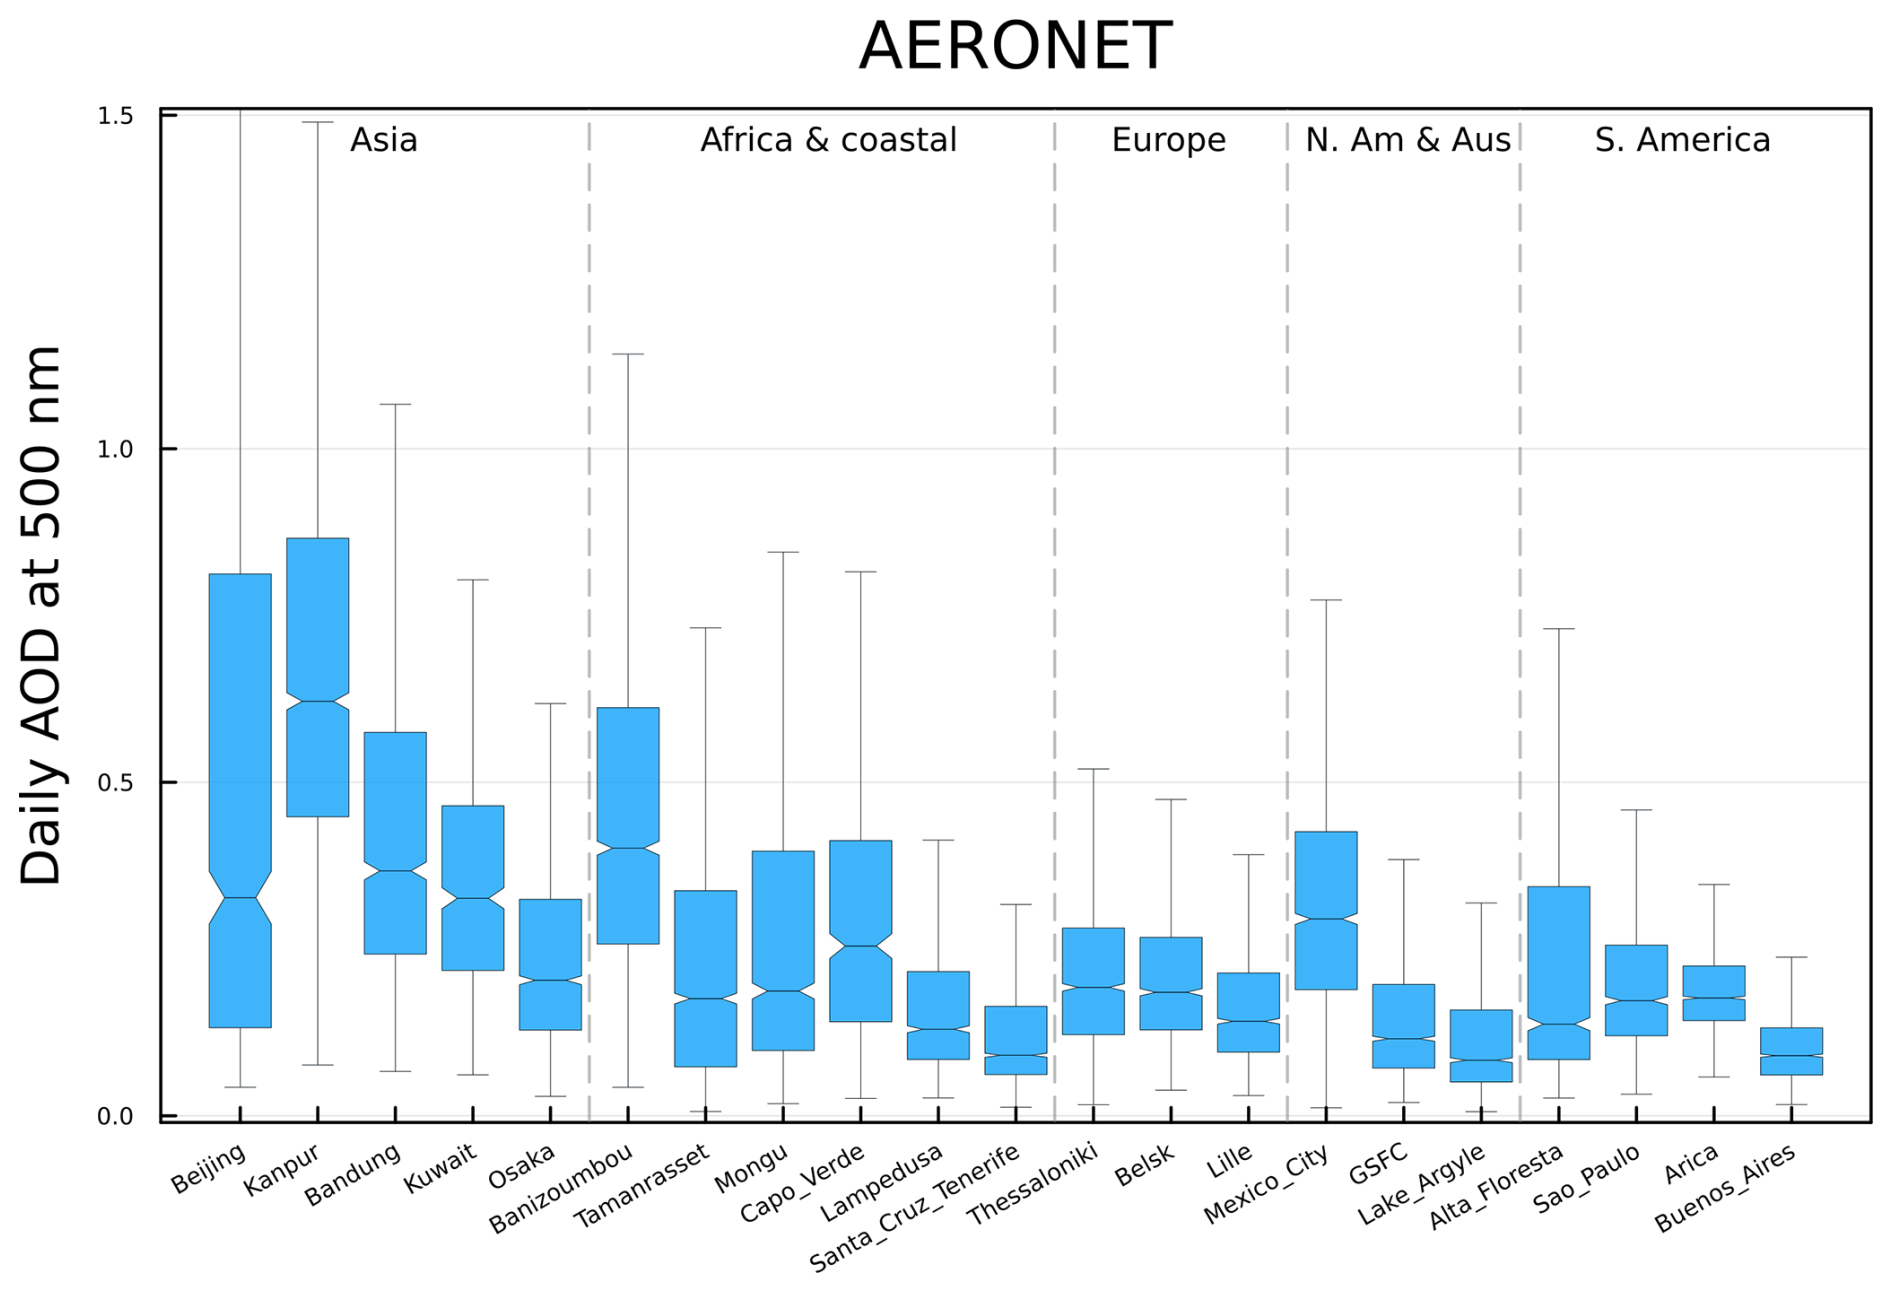
Figure 2Distribution of daily AOD at 500 nm for 21 AERONET sites in this study. Boxes expand the interquartile range (IQR) of the differences. Whiskers correspond to 1.5 times the IQR. Outliers are not plotted. For readability, we set the y-axis limit to be 1.5, which cut the upper whisker of the Beijing box.
Since the intra-day variation of AOD results in small variation of DNI for most AERONET sites (Schroedter-Homscheidt et al., 2013), we used daily AOD (average calculated from at least three measurements during the day) at the wavelength of 500 nm (AOD500) from AERONET sites as the reference. Hourly forecasts of AOD at 550 nm (AOD550) on the following day are extracted from CAMS based on the coordinates of the AERONET sites. The Ångström exponent (AE) between 440 and 870 nm from AERONET is applied in the Ångström formula to interpolate AOD to the common wavelength 500 nm with AERONET as expressed in Eq. (1):
Day-to-day AOD variation is quantified for each site. To forecast the day-ahead AOD, we examined three approaches:
-
persistence (assumes daily AOD remains the same in 1 or 2 d) using AERONET,
-
monthly mean (2010–2020) AOD from AERONET,
-
CAMS AOD forecast product.
Compared with the day-ahead AOD measurement from AERONET, Pearson correlation coefficients and root-mean-square error (RMSE), mean absolute error (MAE) and mean bias error (MBE) with standard deviation by each method are computed for each site. Based on these accuracy measures in AOD forecasts compared with AERONET measurements, the optimal forecast method is identified for each site. We also discuss the characteristics of AOD forecasts at different locations with representative aerosol types. Relative deviation in DNI caused by deviation in AOD forecast is computed for individual sites. While focusing in more detail on the selected sites with certain aerosol characteristics, we also draw implications at a regional scale.
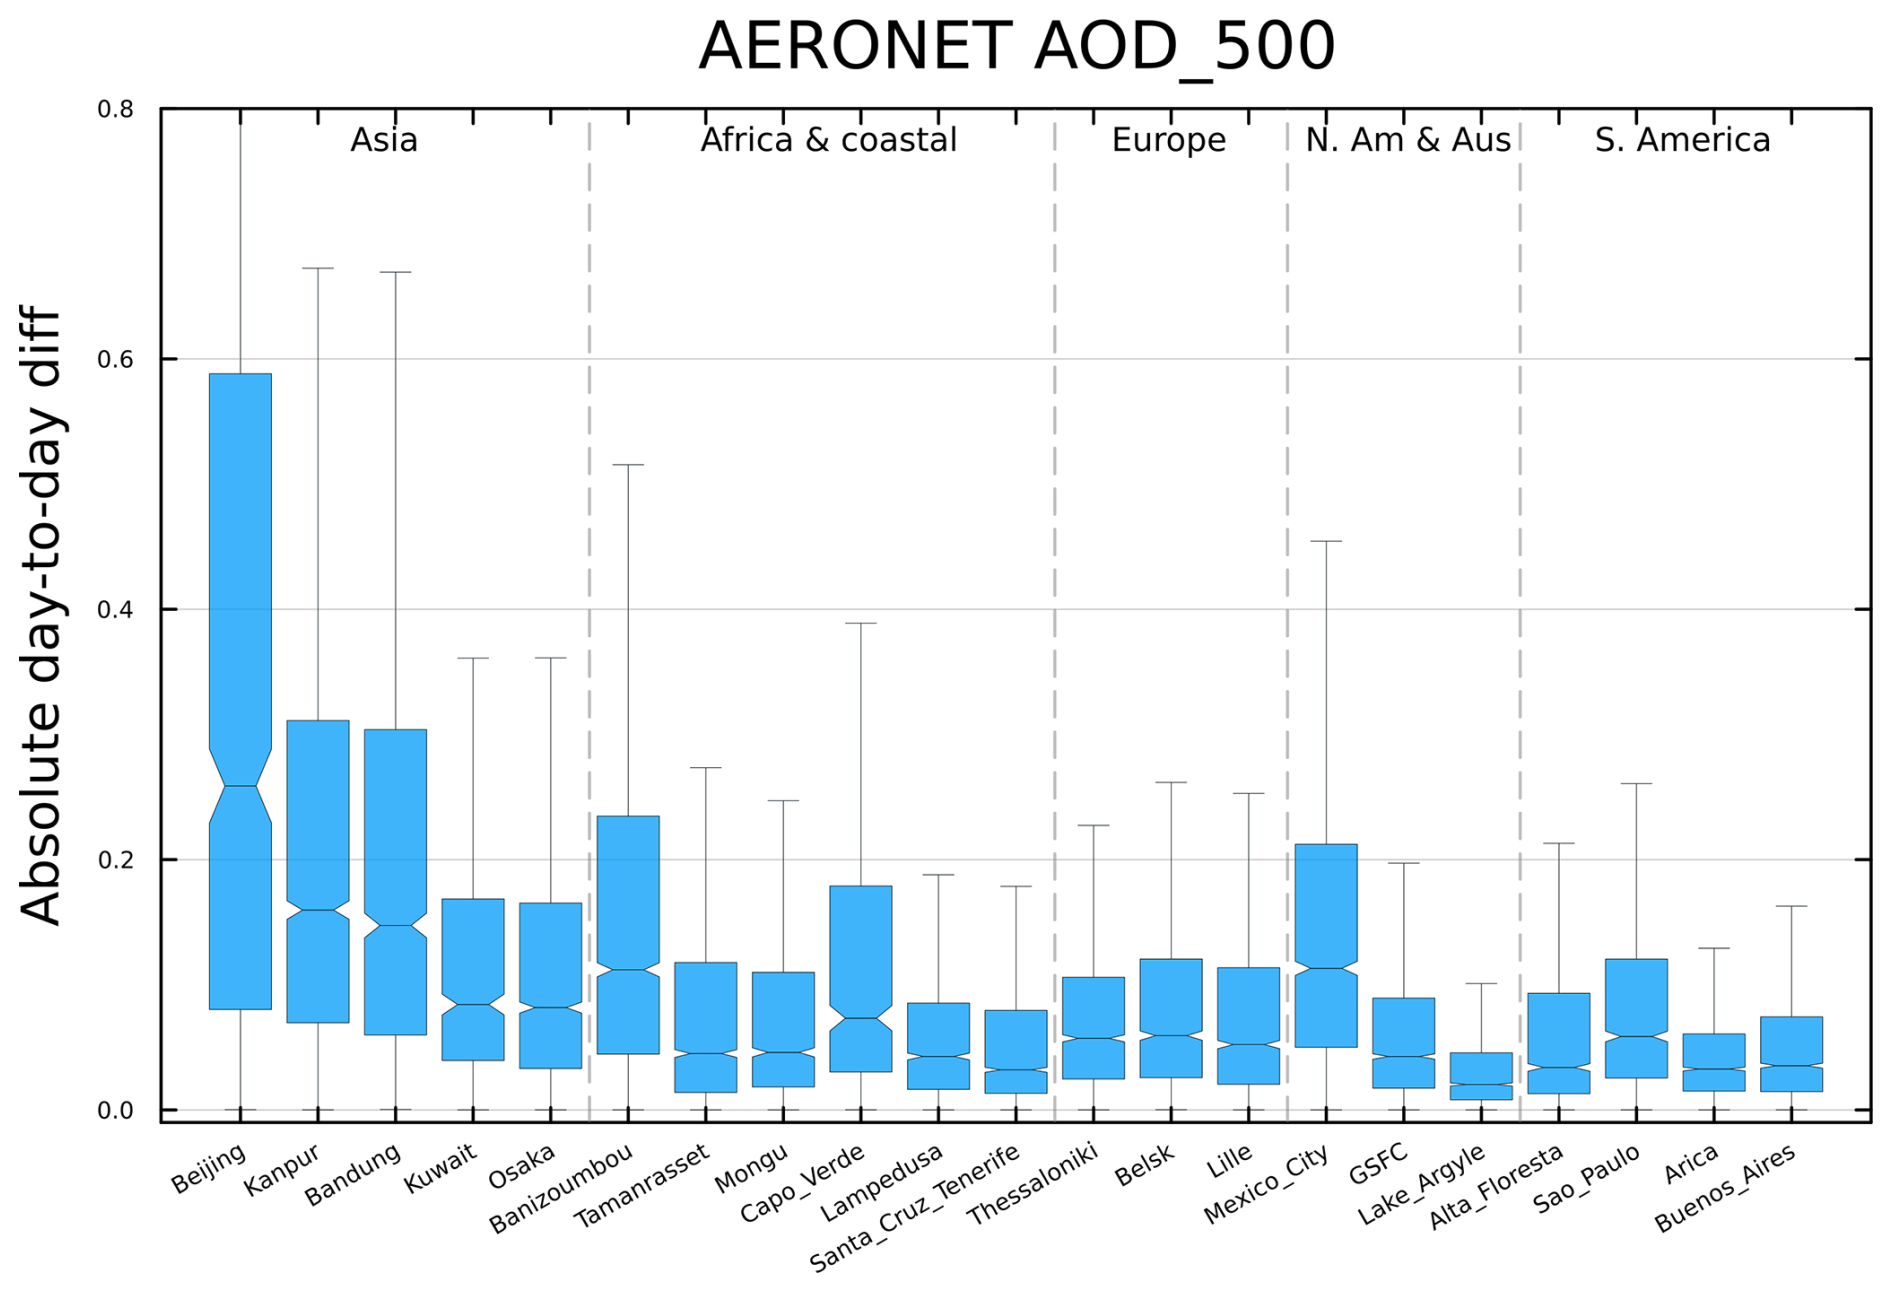
Figure 3Distribution of absolute day-to-day difference in daily mean AOD for 21 AERONET sites in this study. Boxes expand the interquartile range (IQR) of the differences. Whiskers correspond to 1.5 times the IQR. Outliers are not plotted. For readability, we set the y-axis limit to be 0.8, which cut the upper whisker of the Beijing box.
To take into account the diurnal variability of AOD, we compared the effect of using daily or hourly AOD forecasts by CAMS on simulated DNI for the sites Beijing, Lake Argyle and Thessaloniki, which have high, low and moderate AOD variability, respectively. Intra-hour AOD measurements from AERONET are assigned timestamps of the closest hour to match the hourly AOD forecasts from CAMS. Next, we computed daily integrals of DNI estimates based on AOD by three forecast methods and other parameters listed in Table 2, before calculating the percentage of days with predefined thresholds of DNI deviation compared with simulated DNI using AOD measurements from AERONET.
We first present the results of daily AOD at 500 nm at the 21 selected AERONET sites. Figure 2 shows the distribution of daily AOD for all the sites grouped by regions. In general, European and American sites have the lowest mean AOD, as found in Papachristopoulou et al. (2022b). The majority of the sites have its 3rd quartile lower than 0.5. Kanpur, an Indian site characterized by mixed and dust aerosols, has the highest AOD median, partly because South Asia is heavily influenced by the coarse mode dust aerosol from seasonal transport (Ansari and Ramachandran, 2024). Also a mixed aerosol site, Beijing has the largest interquartile range (IQR) in daily AOD.
Dust aerosol-dominated sites such as Banizoumbou and Tamanrasset in Northern Africa, as well as Kuwait in Middle East generally have over-average high AOD values. The mixed aerosol site Bandung (Indonesia) is also among the sites with the highest daily AOD. Lampedusa and Santa Cruz de Tenerife, both islands near the African coast, belong to maritime aerosol sites and have lower daily AOD than dust sites.
At the three selected European sites (Belsk, Lille and Thessaloniki), all of them characterized by urban-industrial aerosols, the IQR of daily AOD is similar. In Japan, a significant amount of urban-industrial aerosols exists (Hamill et al., 2016), as the site Osaka exemplifies. Another urban site, Arica (Chile), has the smallest IQR in daily AOD among all selected sites. Compared to Arica, the site GSFC (Goddard Space Flight Center, situated in suburban Washington, D.C., USA) has a lower limit on daily AOD. There, local emissions are dominated by automobiles rather than industry (Smirnov et al., 2002).
Sites with biomass aerosols Alta Floresta in the Amazonia, Lake Argyle (Australia) and Mongu in Southern Africa share a similar pattern, with the range of the 3rd quartile much larger than the 2nd one. The Southern American sites Buenos Aires and São Paulo both have considerable amount of mixed aerosols, yet Buenos Aires has overall the lowest AOD among the selected sites.
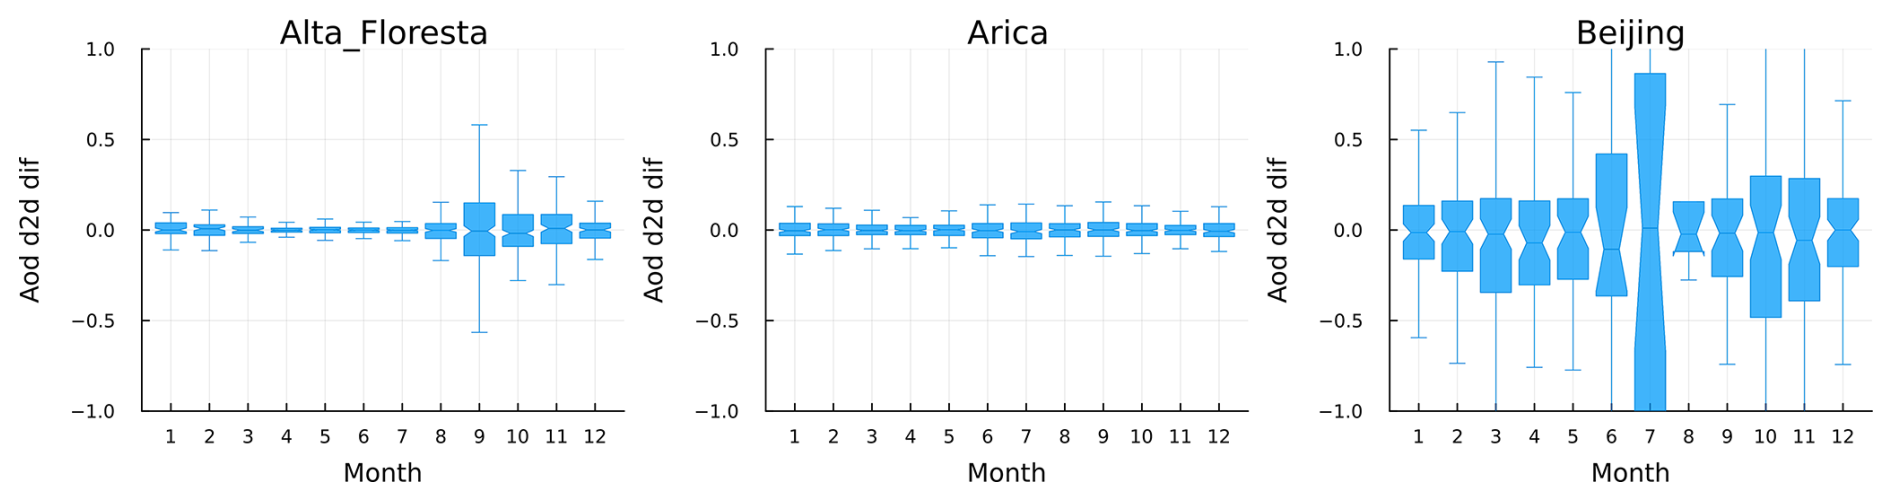
Figure 4Monthly distribution of the absolute day-to-day difference in daily mean AOD for three selected sites, representing seasonal variability, small and large intra-annual variability. The vertical range is homogenized to be [].
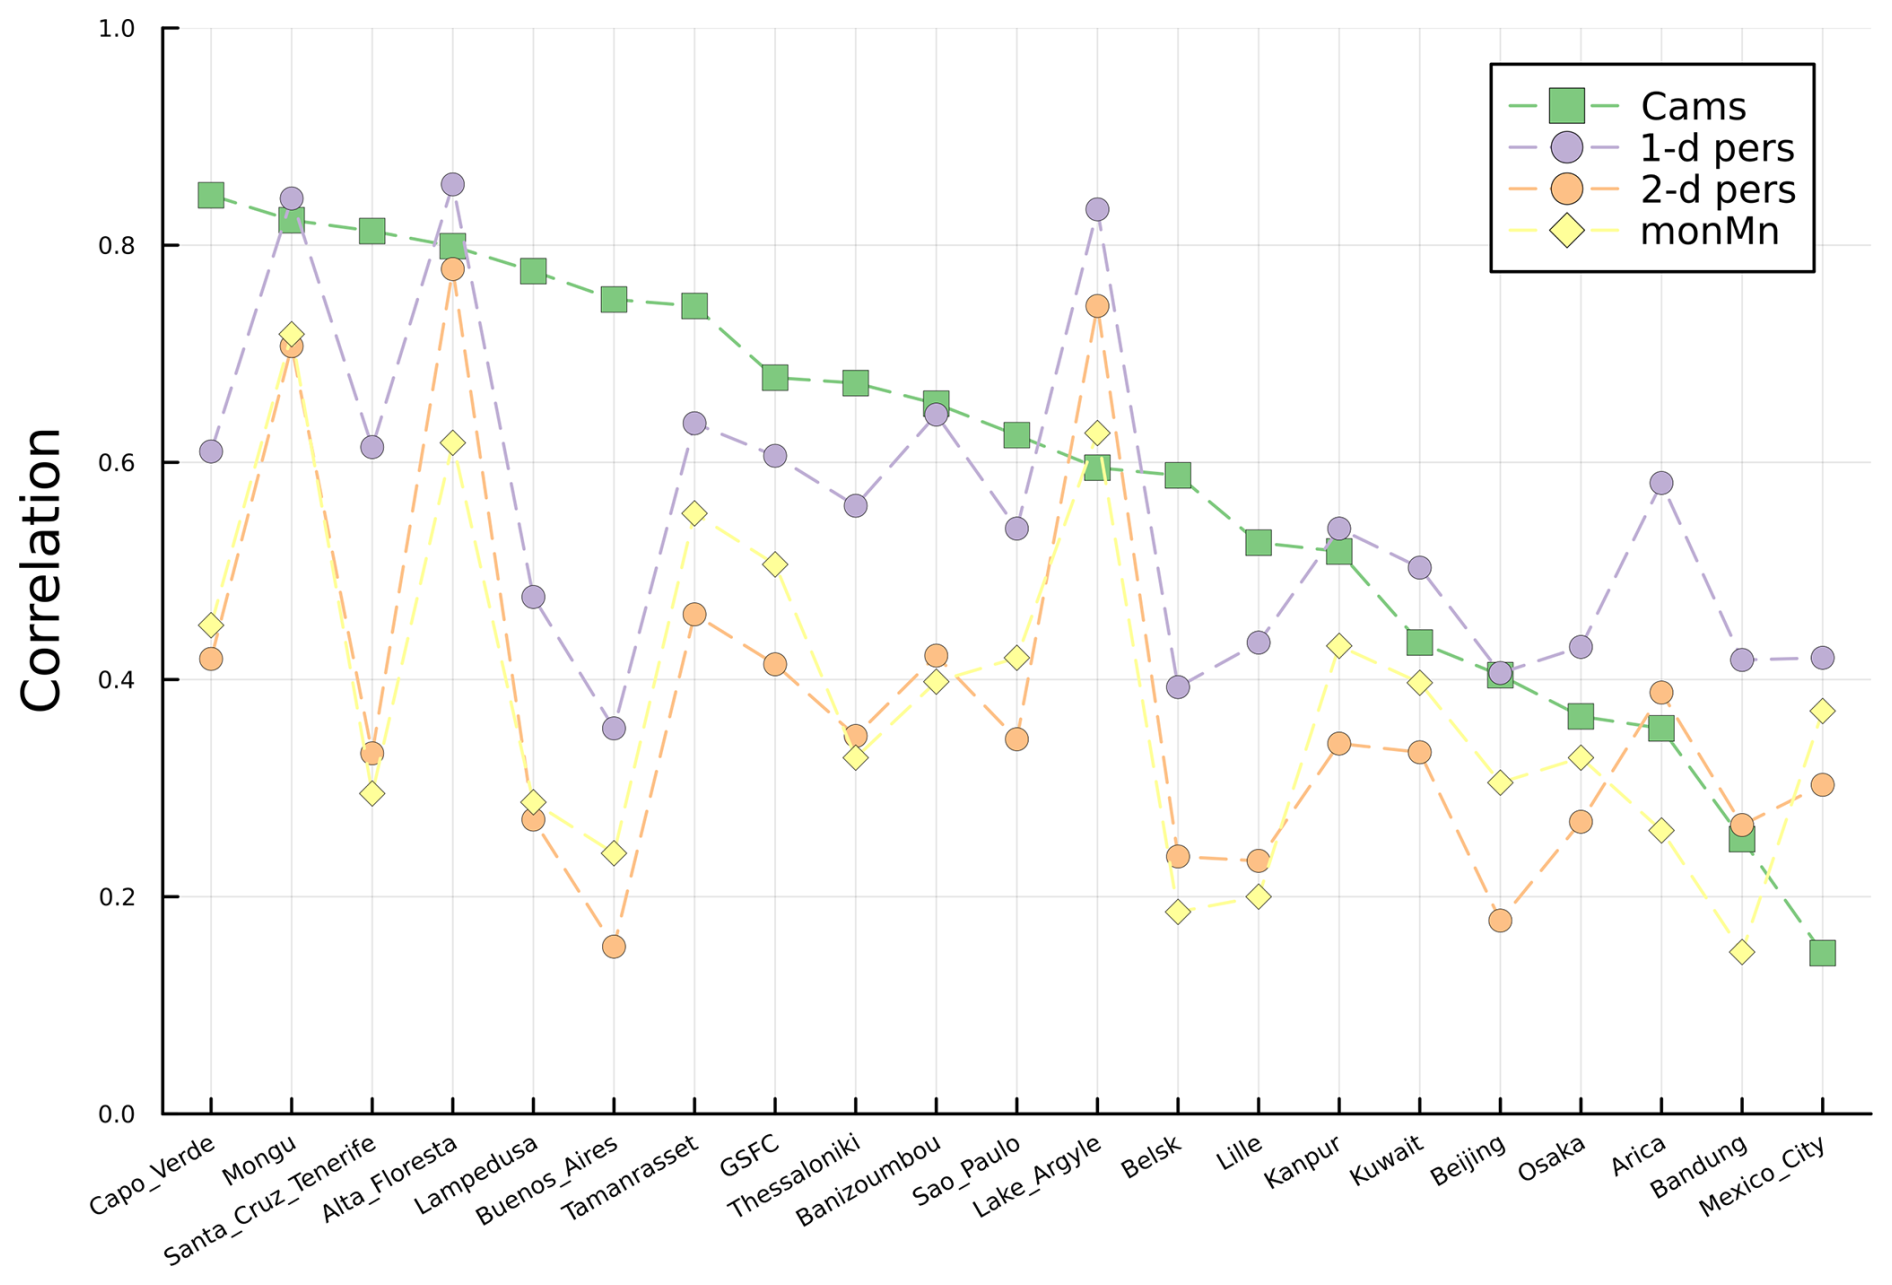
Figure 5Correlation coefficients of the AERONET measurement with the daily mean AOD forecast by three forecast methods: CAMS forecast (green rectangles), AERONET 1 d (purple circles) and 2 d (orange circles) persistence and AERONET monthly mean (yellow diamonds), sorted in descending order by CAMS forecast.
4.1 Day-to-day AOD variability
The distribution of absolute day-to-day differences in AOD (Fig. 3) for the selected sites shares a similar pattern to the distribution of mean daily AOD (Fig. 2). Beijing is the site with the largest day-to-day AOD variability among them, exceeding 1 at the upper limit. The day-to-day AOD variability is sufficiently close between Bandung and Kanpur, both among the highest. Mexico City also has a higher than average day-to-day variation in AOD. For these aforementioned sites, the proportion of mixed aerosols is considerable. On the other side, Arica, Buenos Aires and Lake Argyle have the smallest day-to-day AOD variability, with the IQR smaller than other sites. Sites with day-to-day AOD variability on the lower end (the 3rd quartile or median < 0.1) further include Alta Floresta, Belsk, GSFC, Lampedusa and Santa Cruz de Tenerife. Therefore, sites classified as predominantly biomass aerosols, maritime aerosols and some urban-industrial aerosol sites have lower day-to-day AOD variability than sites with other major aerosol types.
The monthly distribution of absolute day-to-day difference in AOD for three selected sites is shown in Fig. 4. Alta Floresta is characterized by drastically increased aerosol load from September, which could be associated with seasonal biomass burning in Amazonia (Schumacher and Setzer, 2024). Arica, situated on the northwestern Chilean coast, has a low day-to-day AOD variation throughout the year (also low seasonal variability) despite its arid desert climate. Beijing, as mentioned earlier, has relatively high day-to-day AOD variation all year round, although most pronounced during summer. In addition, anthropogenic emissions in autumn and winter result in frequent severe haze events in Beijing, significantly reducing available SSR there (Cheng et al., 2022).
4.2 AOD Forecasts
We investigated both 1 and 2 d forecasts based on AERONET. This was based on the fact that even if most AERONET data can be derived in near real time for forecasting SSR for the next day energy market, AERONET data of today could be available only at the end of the day, thus next-day forecast should be performed relatively late for such applications. In terms of which method forecasts 2 d-ahead AOD the best, Table 3 summarizes the best-performing forecasting methods for each site based on Pearson correlation coefficient, RMSE or MAE. At 10 of 21 sites, CAMS forecasts perform the best with the maximum correlation and the minimum errors. The site Lake Argyle has the highest correlation and lowest errors by the AERONET 2 d persistence method. Based on the minimization of both errors, AERONET monthly mean performs the best at six sites, although the correlation and MAE would suggest using one of the two other forecast methods at five of these sites except Mexico City: in Arica and Bandung, the highest correlation can be achieved by 2 d persistence, whereas using the AERONET monthly mean leads to the smallest errors; in Beijing and Kuwait, CAMS forecast has the highest correlation.
Table 321 AERONET sites, corresponding aerosol types and the best-performing forecasting methods (AERONET 2 d persistence is denoted as p, AERONET monthly mean as m, and CAMS forecasts as c) for each site based on maximum Pearson correlation coefficient (corr) or minimum errors (RMSE or MAE). Sites marked with ∗ are classified with more than one typical aerosol type (Table 1).
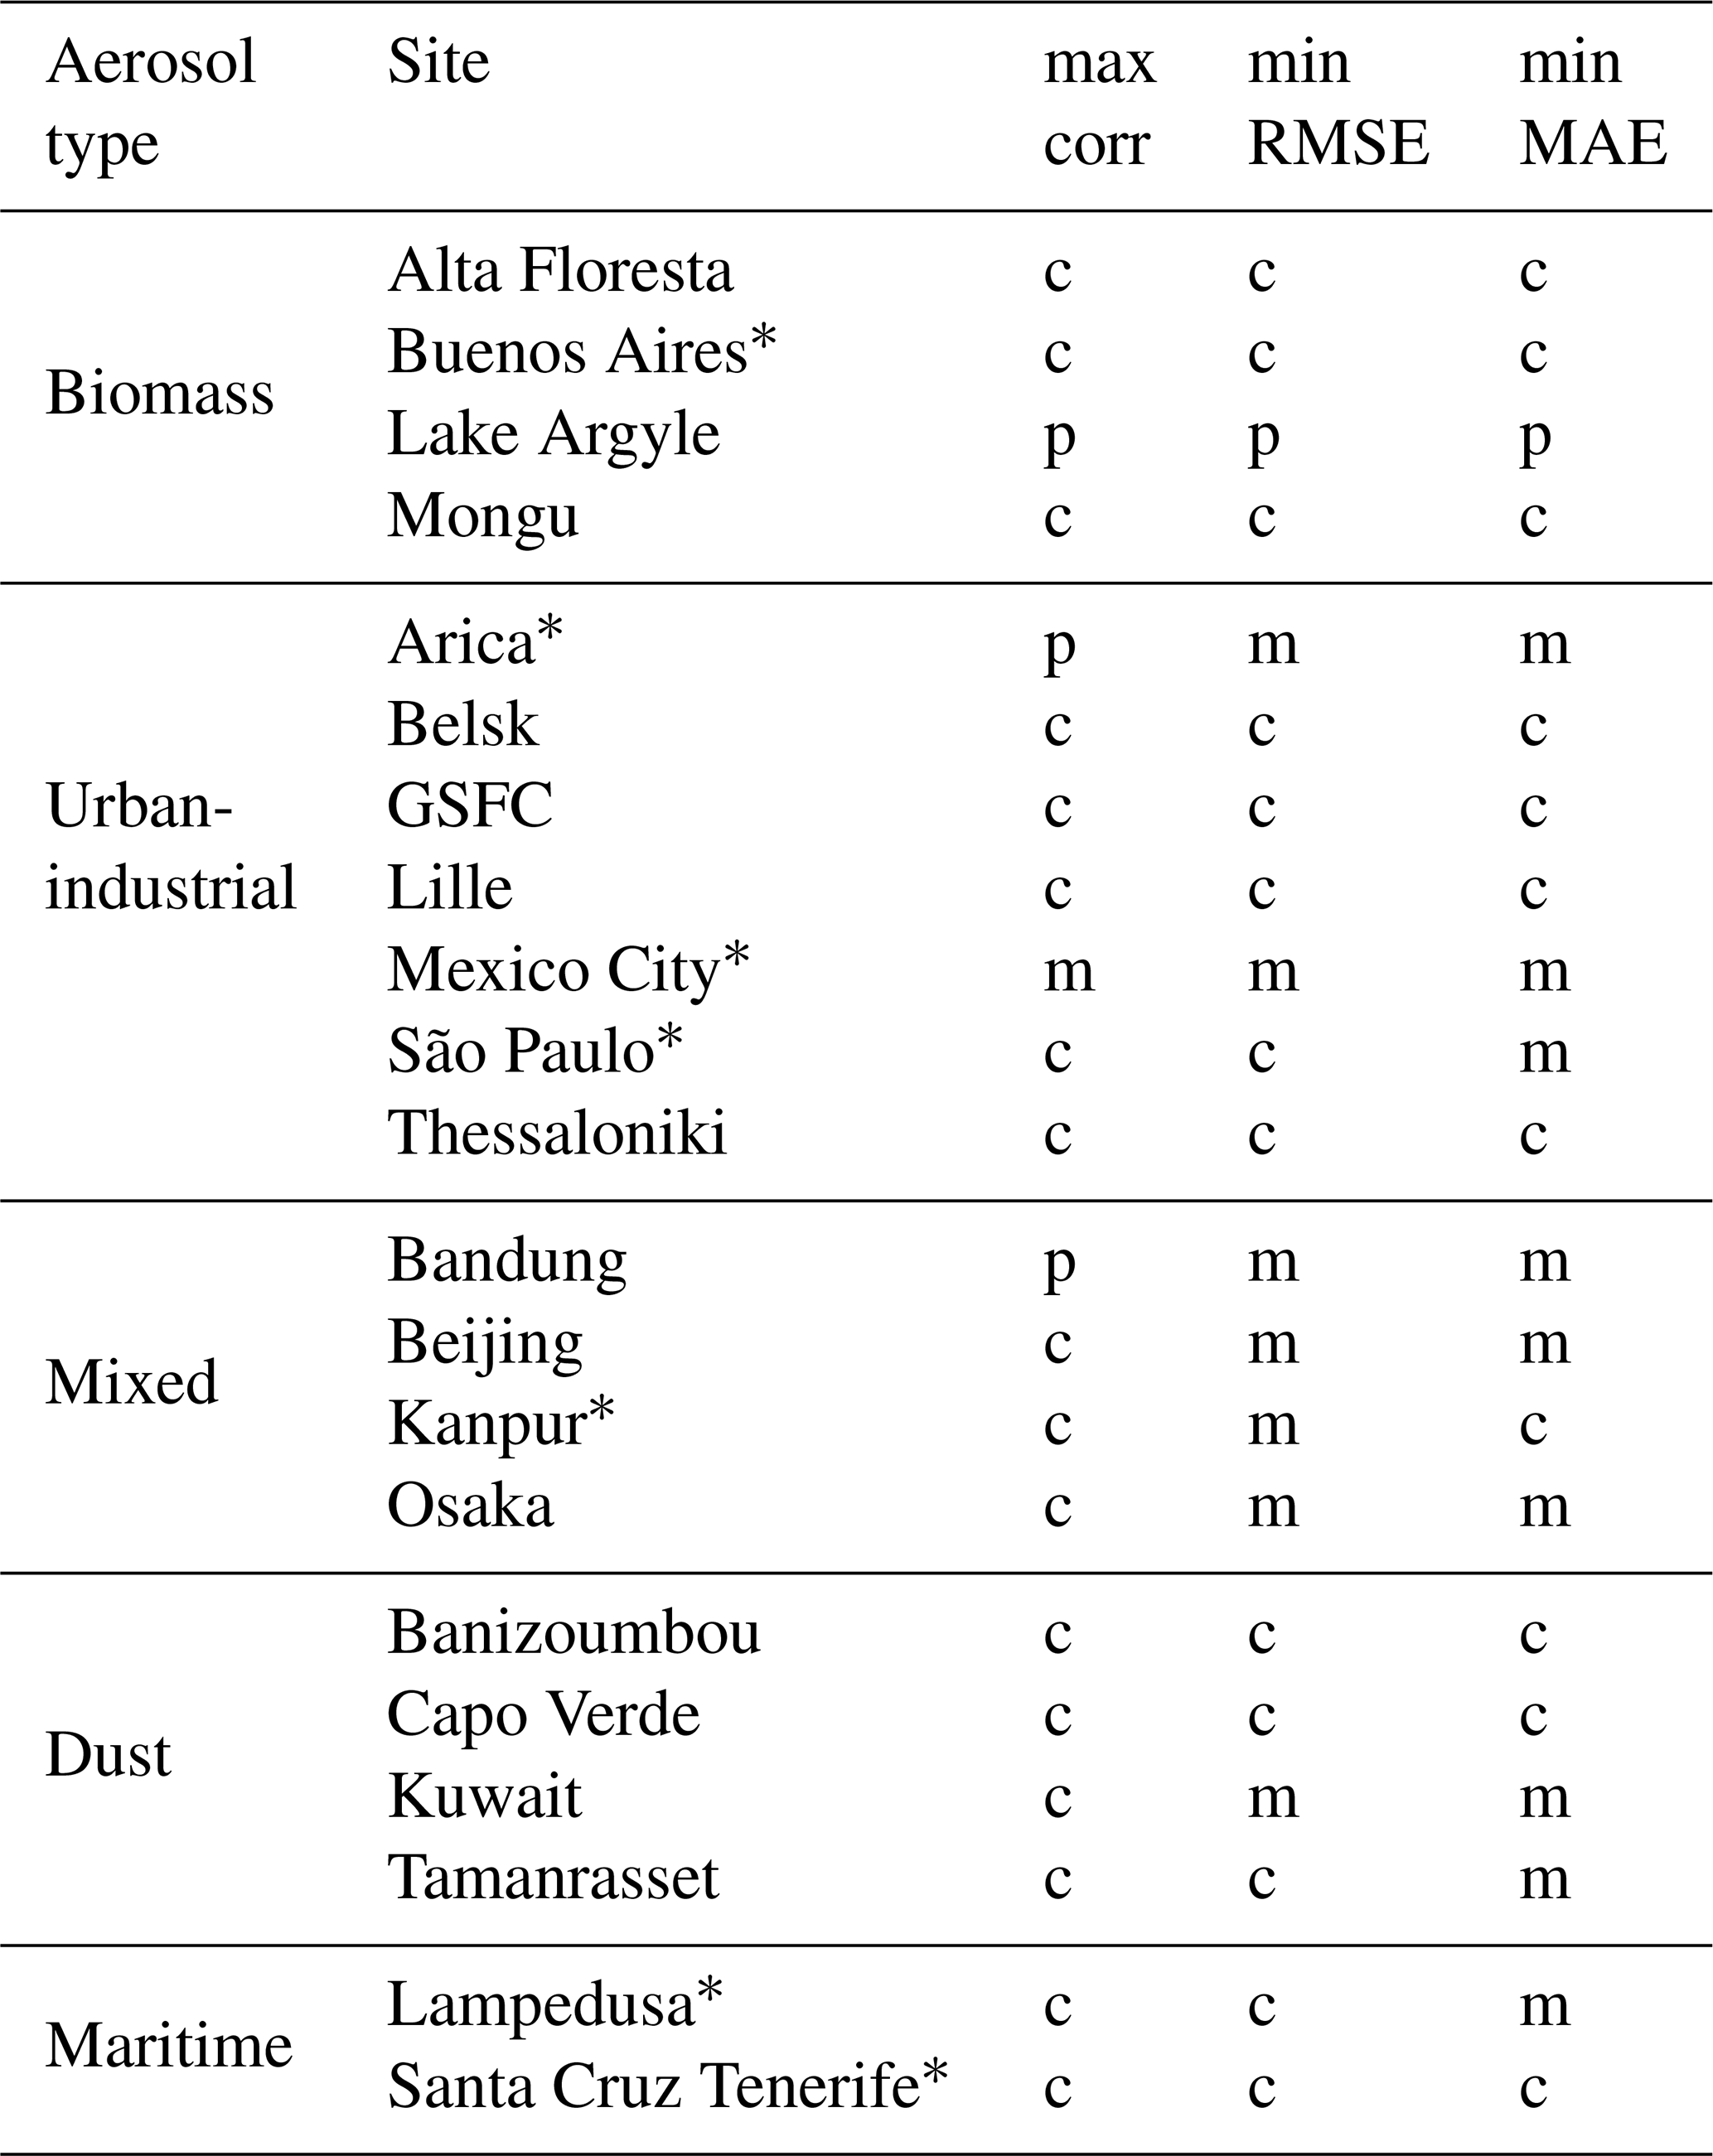
If grouped by aerosol types, at three biomass aerosol sites, CAMS forecast has the advantage. It also performs the best for the two maritime sites (both also partly loaded with dust aerosols). Three of the four dust-aerosol sites favor CAMS forecasts, and the site Kuwait obtained better results from AERONET monthly mean in terms of RMSE and MAE. As for the urban-industrial sites, which are the most numerous in our analysis, CAMS forecasts support more sites (5) than the AERONET methods (2).
In the following, the three accuracy measures are examined individually for each forecast method. Figure 5 shows the correlation coefficients of the AERONET measurement with the AOD forecast by forecast methods detailed earlier. Based on the correlation, CAMS forecasts perform the best at 11 of the 21 sites, and the second best at 5 other sites, thus generally outperforming the forecast methods using AERONET AOD. The correlation can be as high as nearly 85 % by AERONET 1 d persistence at several sites to as low as < 15 % by CAMS forecast in Mexico City. For one site, such as Buenos Aires, forecasts by these three methods can differ a lot or be fairly close, such as in Kanpur. CAMS forecasts perform the worst among the forecast methods only at the site Mexico City. Furthermore, Mexico City, Bandung, Osaka and Beijing are sites where all the forecast methods fail to achieve a correlation coefficient higher than 0.5. Hamill et al. (2016) pointed out that Mexico City is one of the most difficult sites to classify since besides urban-industrial aerosols, biomass and mixed aerosols are almost equal-proportionally present there. Besides, Mexico City is a site that is advised to exclude due to volcanic eruptions when calculating the global mean using CAMS reanalysis (Inness et al., 2019).
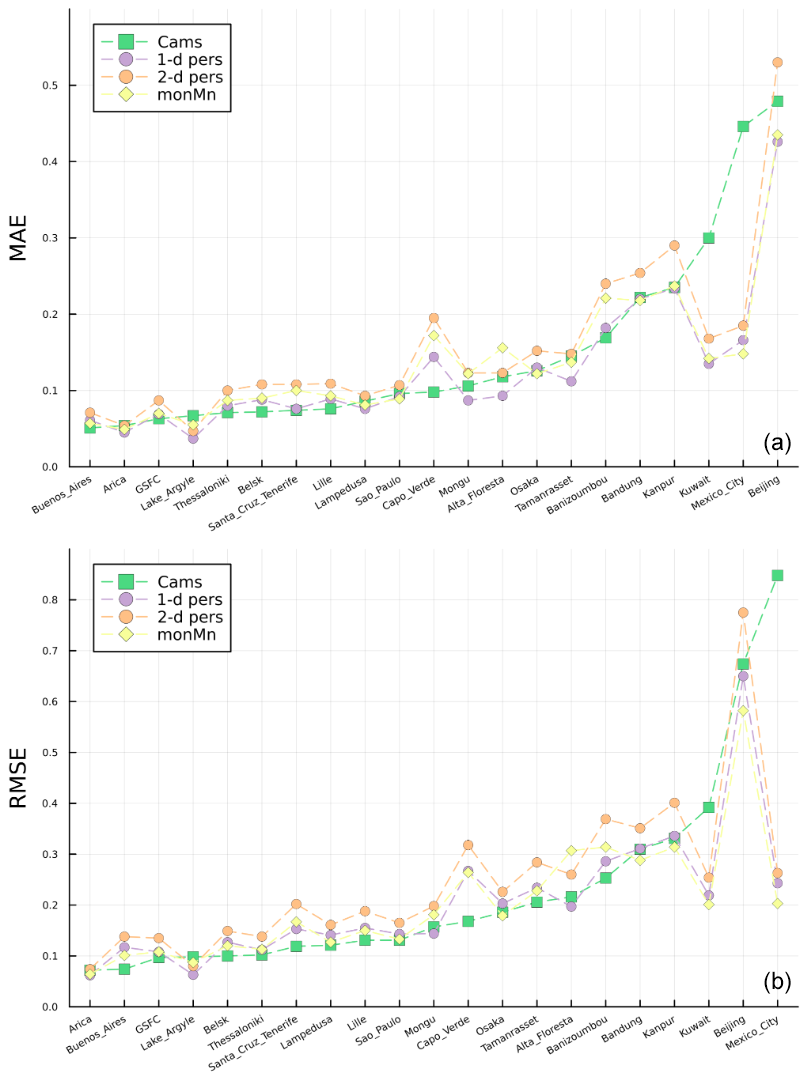
Figure 6MAE (a) and RMSE (b) of the daily mean AOD forecast by three forecast methods: CAMS forecast (green rectangles), AERONET 1 d (purple circles) and 2 d (orange circles) persistence and AERONET monthly mean (yellow diamonds), sorted in ascending order by CAMS forecast in terms of RMSE.
Figure 6 shows the MAE (top) and RMSE (bottom) of the AOD forecast by forecast methods compared with the AERONET measurements. Arica and Buenos Aires are sites with the sites with the lowest errors. On the contrary, Beijing and Kanpur are among the sites with the highest errors. At most sites, MAE and RMSE in AOD forecasts are close using all these forecasting methods; exceptions are Kuwait and Mexico City, where CAMS forecasts produce much larger errors than using AERONET-based forecasting methods. With smaller differences in errors, CAMS forecasts also perform the worst among the these forecast methods at the site Lake Argyle.
At the sites Lampedusa and Tamanrasset, both loaded with dust aerosols, despite the discrepancy of forecast methods based on minimum RMSE or MAE, the MAE using the AERONET monthly mean does not differ much from CAMS forecast, which supports the use of CAMS as the optimal forecast method. At the site Kanpur and São Paulo, where the minimum MAE and minimum RMSE also indicate distinct optimal forecast methods, Fig. 6 reveals that the errors by AERONET monthly mean is very close to that by CAMS forecast.
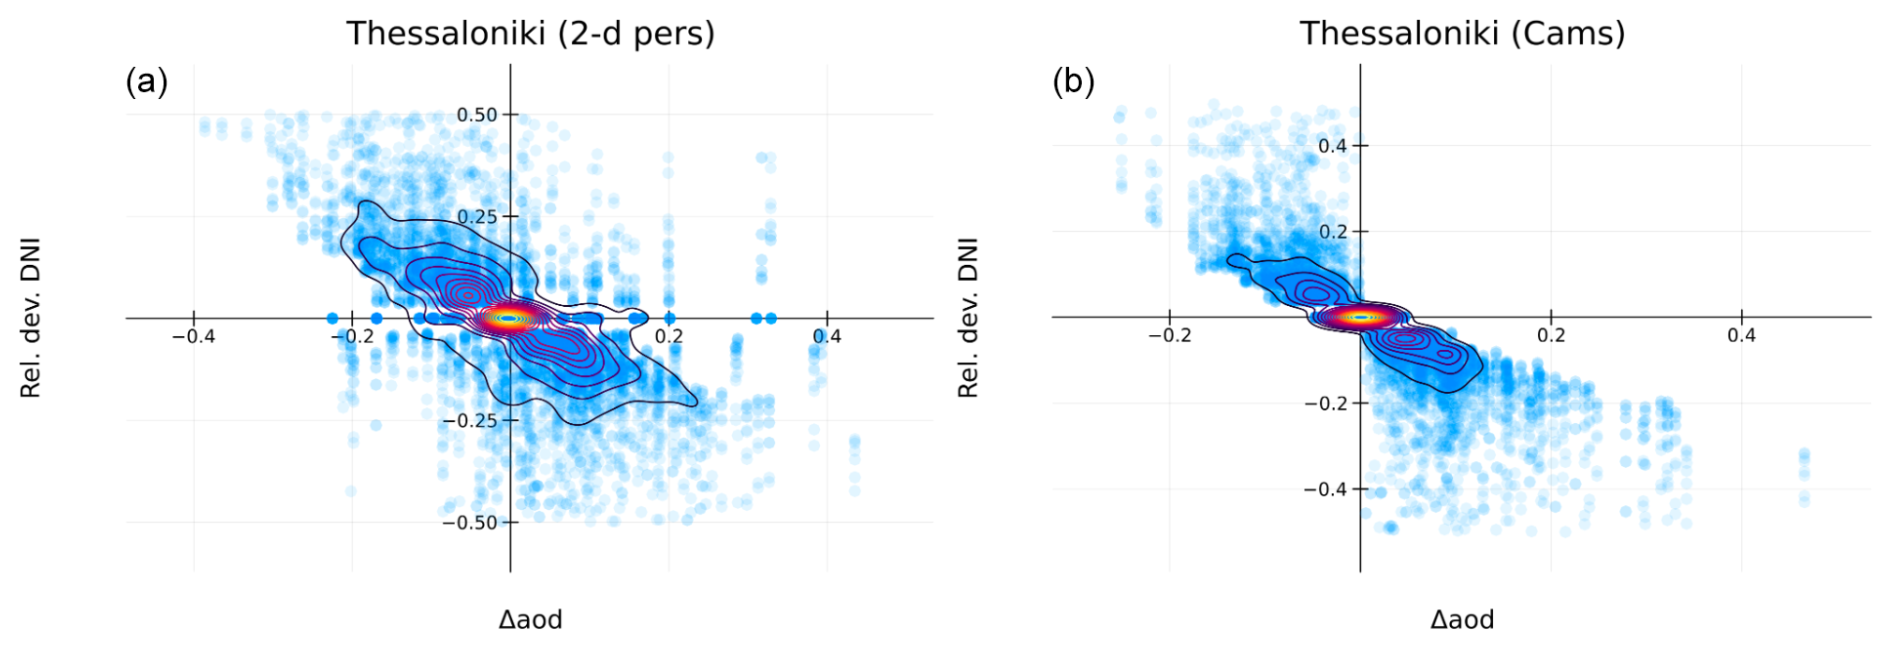
Figure 7Relative deviation of DNI forecasts versus 2 d AOD variation in Thessaloniki from July 2015 to December 2020 based on AERONET 2 d persistence (a) or CAMS forecast (b) with AERONET measurement.
4.3 Intraday AOD variability
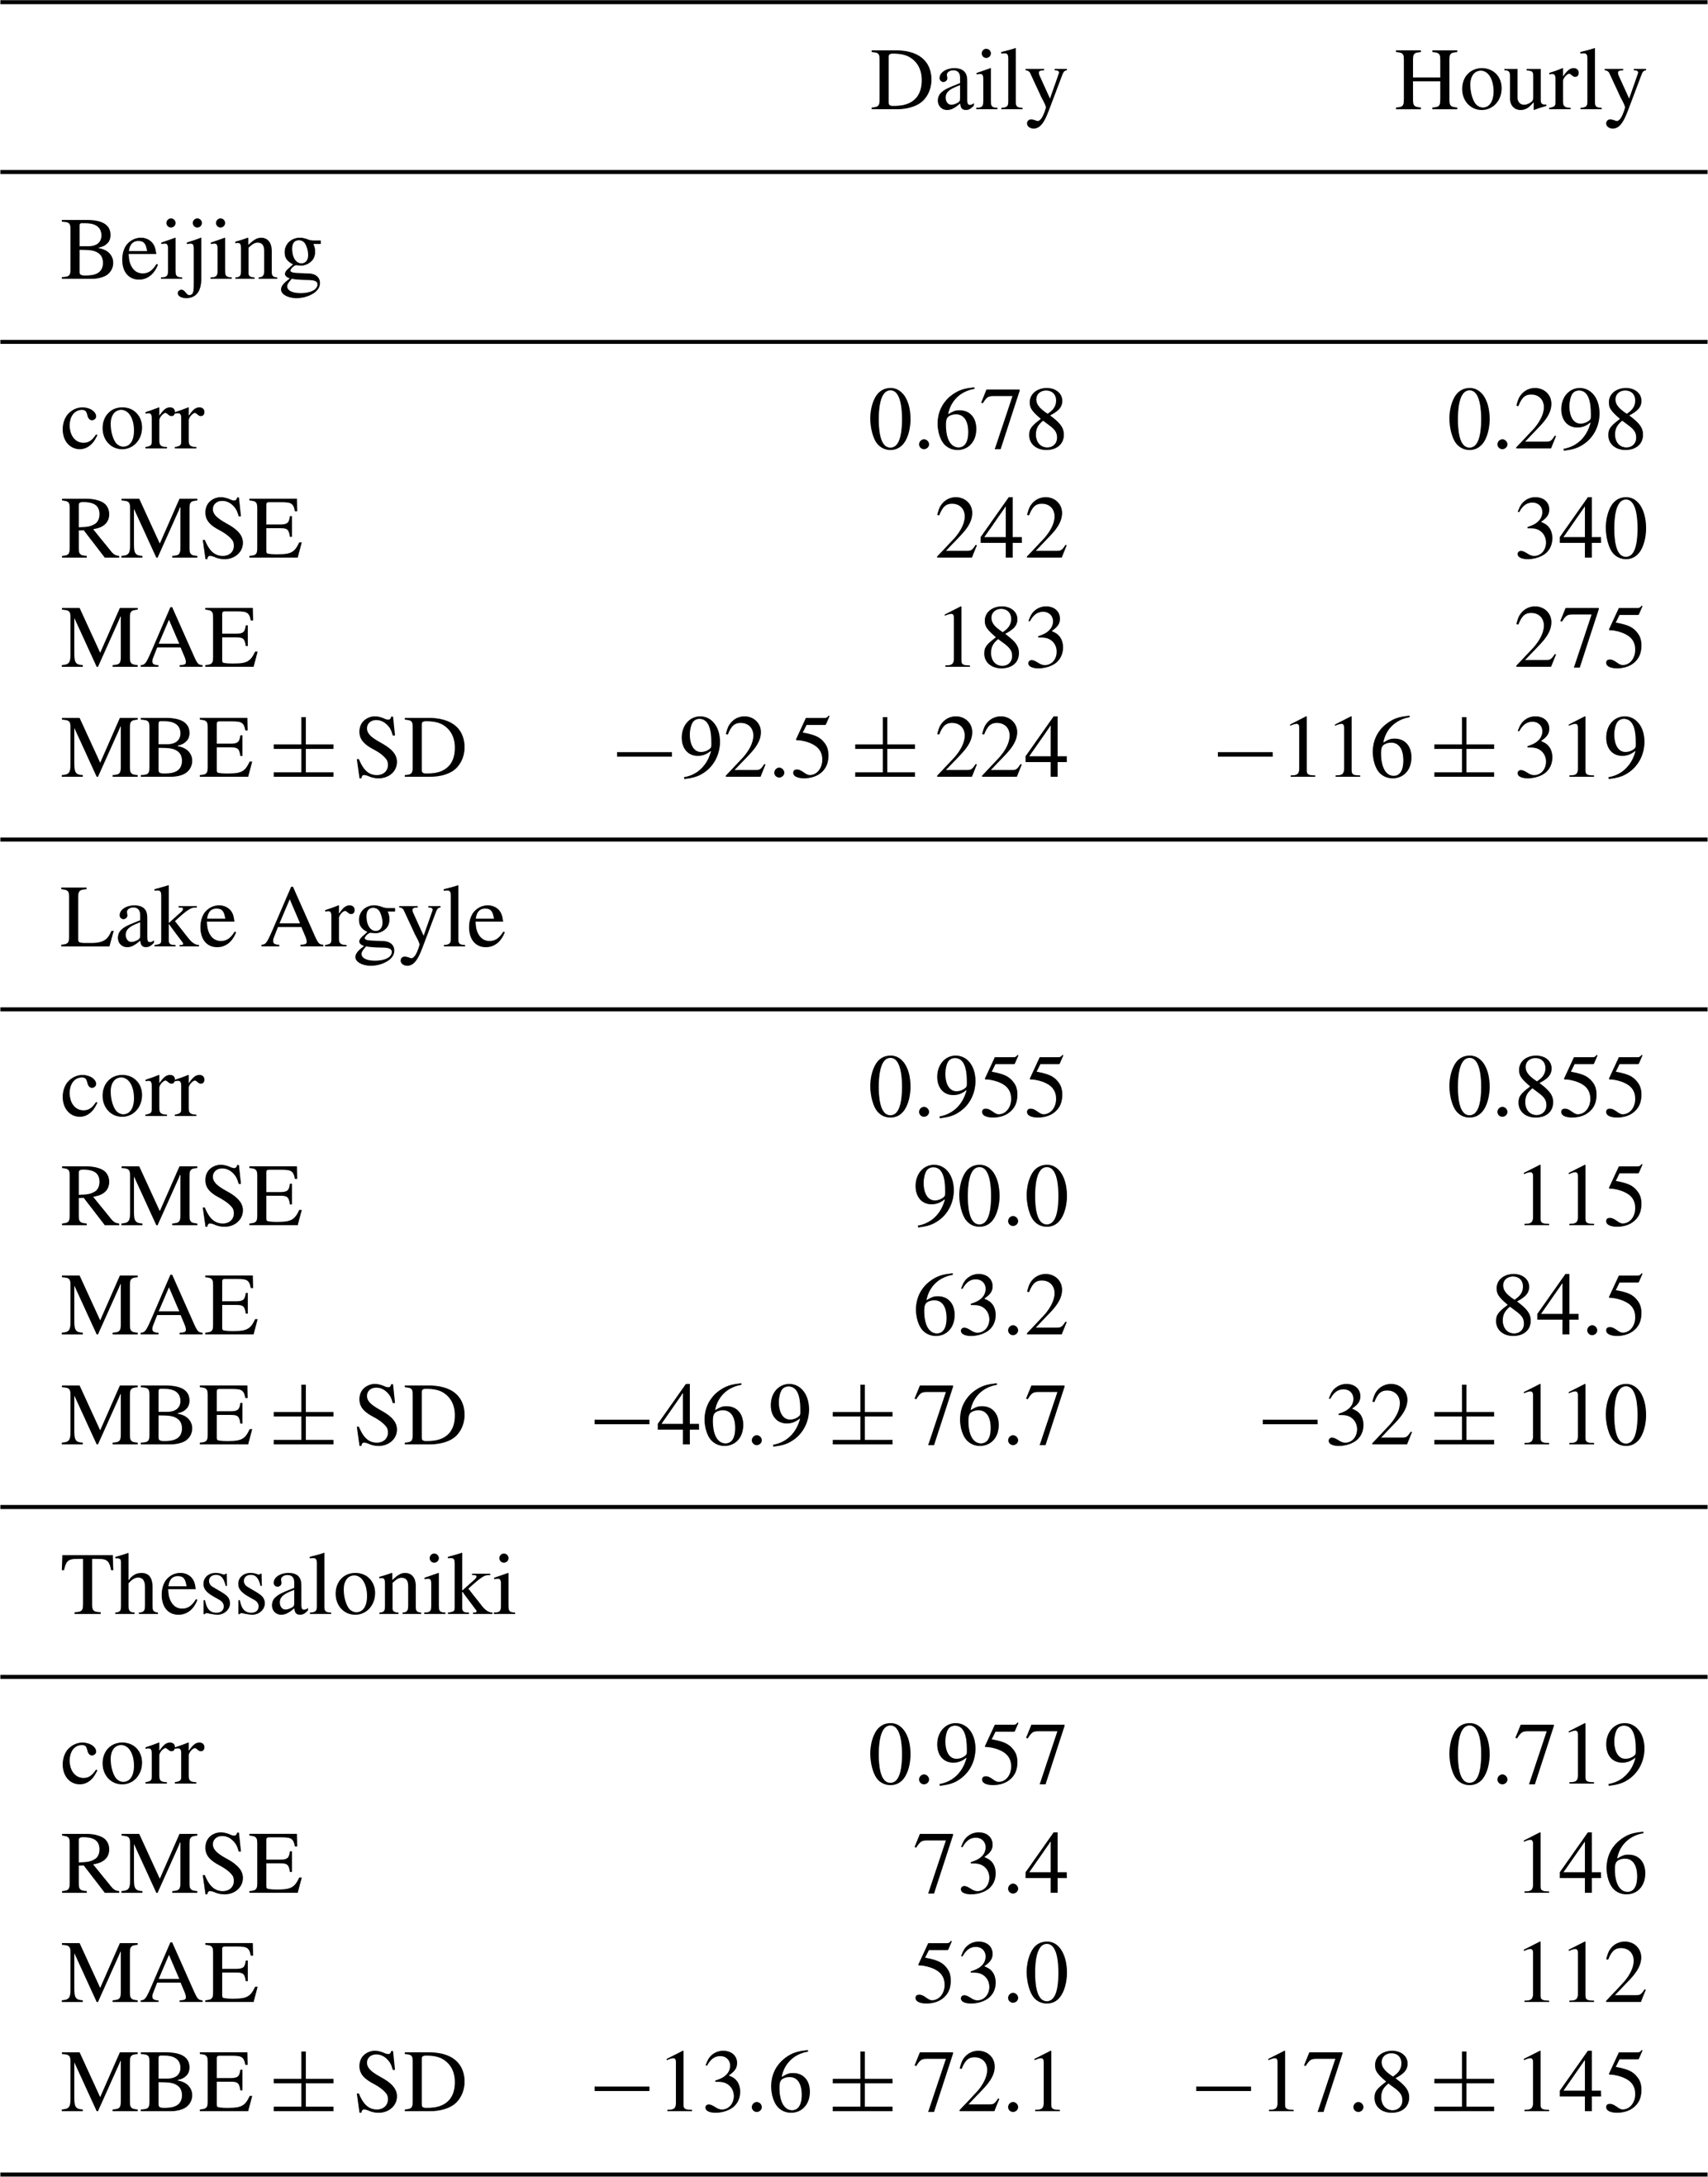
In this work, we have used daily AOD values in order to forecast AOD for the next 1 or 2 d. However, these averages from both AERONET and CAMS are calculated based on all available data within a day. In order to investigate the effect of this averaging approach on our results, we performed a sensitivity study calculating deviation in DNI with two different methods. Table 4 shows the accuracy measures of DNI using daily or hourly AOD from CAMS for the sites Beijing, Lake Argyle and Thessaloniki. The correlation of DNI using daily AOD from CAMS with daily AOD from AERONET measurements is generally higher than when hourly AOD is used. At the same time, using daily CAMS AOD leads to smaller errors in DNI than hourly values, except for mean bias error (MBE) at the site Lake Argyle. Note that the hourly AOD measurements at AERONET sites are limited and irregular, resulting in few coincident data points with the hourly AOD by CAMS. Thus, the comparison of hourly AOD is based on much fewer data points than using interpolated daily AOD.
Table 4Comparison of accuracy measures of DNI (corr unitless, the other measures in W m−2) using daily or hourly AOD from CAMS for the sites Beijing, Lake Argyle and Thessaloniki.
4.4 DNI forecasts
Figure 7 presents an example of the 2 d AOD variation versus the relative deviation of DNI forecasts for the site Thessaloniki from July 2015 to December 2020 based on AERONET 2 d persistence or CAMS forecasts with AERONET measurement. There is a concentration of data points at the origin in both plots. Both forecasts reveal a negative relationship between 2 d AOD variation and relative deviation in DNI forecasts, with the distinction that AERONET 2 d persistence also forecasts sporadic data pairs with a positive correlation.
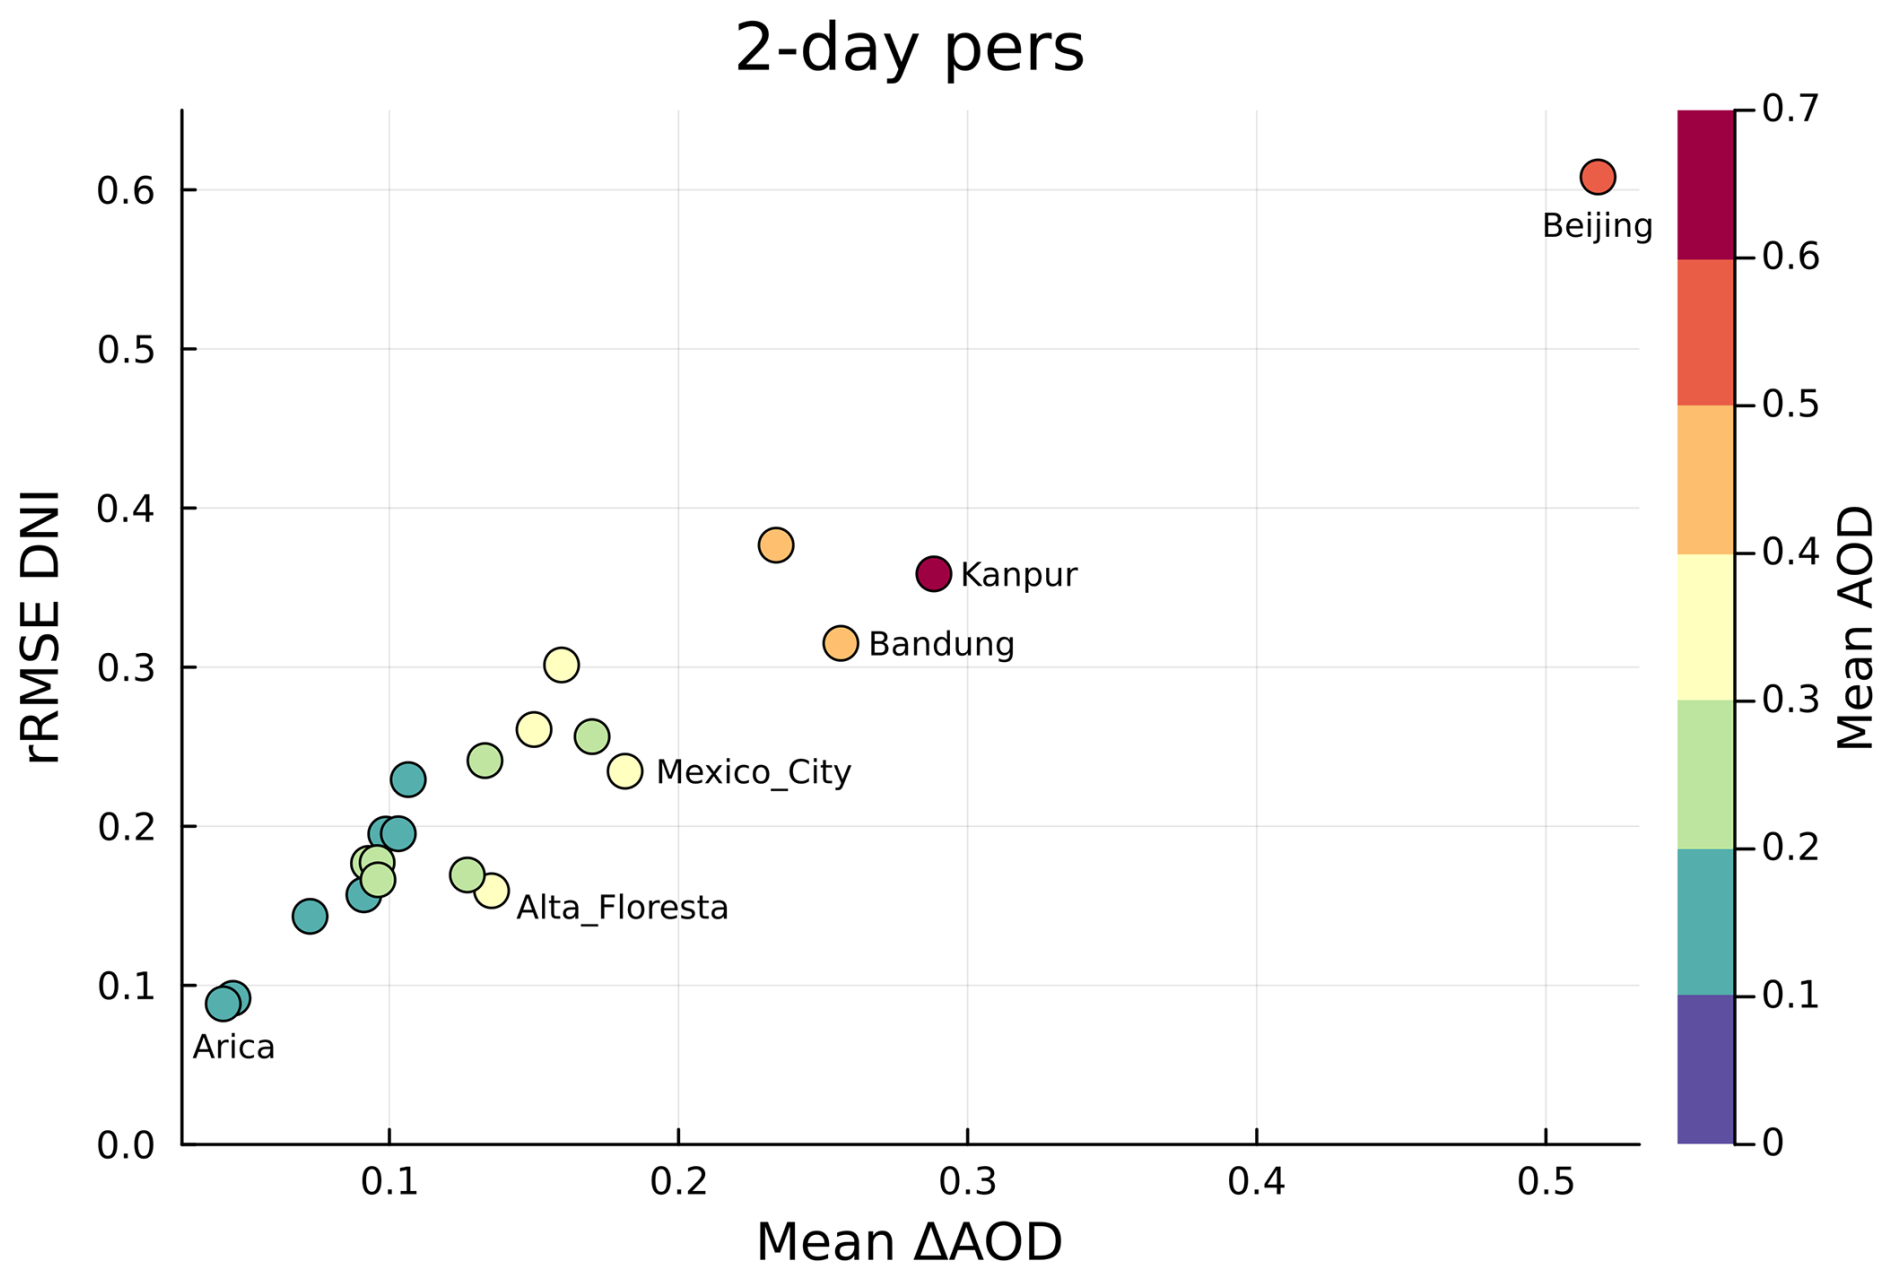
Figure 8Relative deviation of DNI forecasts versus mean 2 d AOD variation by AERONET 2 d persistence for 21 sites. Color codes denote the mean AOD of each site.
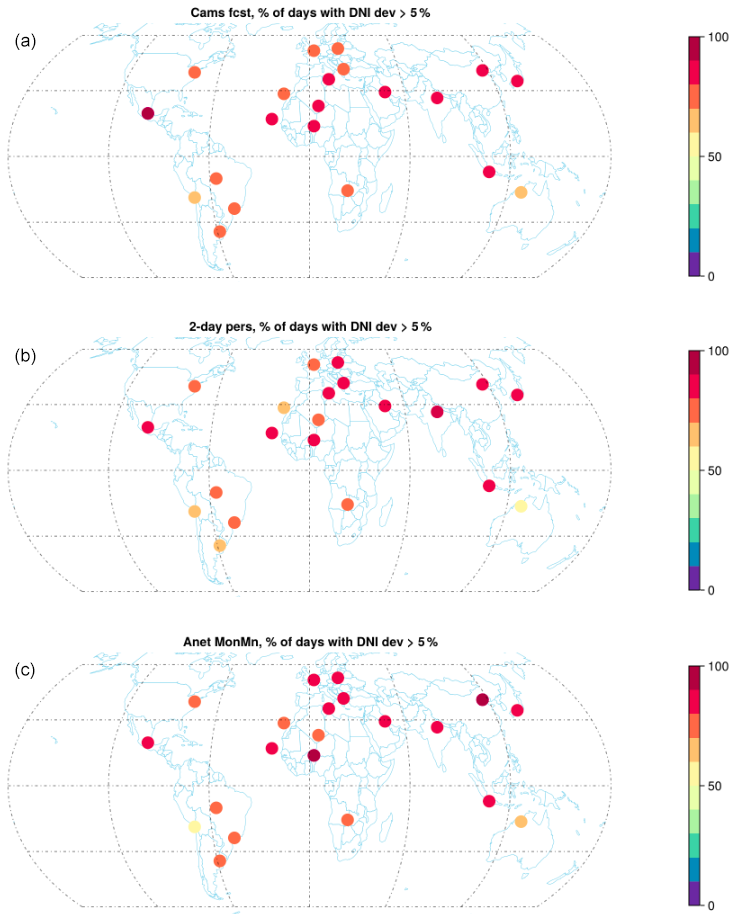
Figure 9Percentage of days with > 5 % deviation in daily sum of DNI due to day-to-day AOD variation using CAMS forecasts (a), AERONET 2 d persistence (b), and AERONET climatology (c).
When all selected sites are considered, we can find a positive relationship between the relative RMSE of DNI forecasts based on AERONET 2 d persistence and mean absolute 2 d AOD variation, as shown in Fig. 8. Color codes denote the mean AOD of each site. The majority of these sites have a mean AOD below 0.4. The mean absolute 2 d AOD variation at most sites is below 0.2, corresponding relative RMSE lower than 30 %. Beijing has a slightly lower mean AOD than Kanpur, yet the mean absolute 2 d AOD variation in Beijing is much higher than other sites, which results in a relative RMSE in DNI much higher, reaching > 60 %. On the other hand, it can be confirmed again that Arica, as one of the sites with the smallest 2 d AOD variation, experiences the smallest relative errors in DNI forecasts using AOD by AERONET 2 d persistence. Figure 8 quantifies the relationship between mean 2 d difference in AOD and relative RMSE in DNI, which aids in estimating the DNI deviation for further sites once the mean difference in AOD is known.
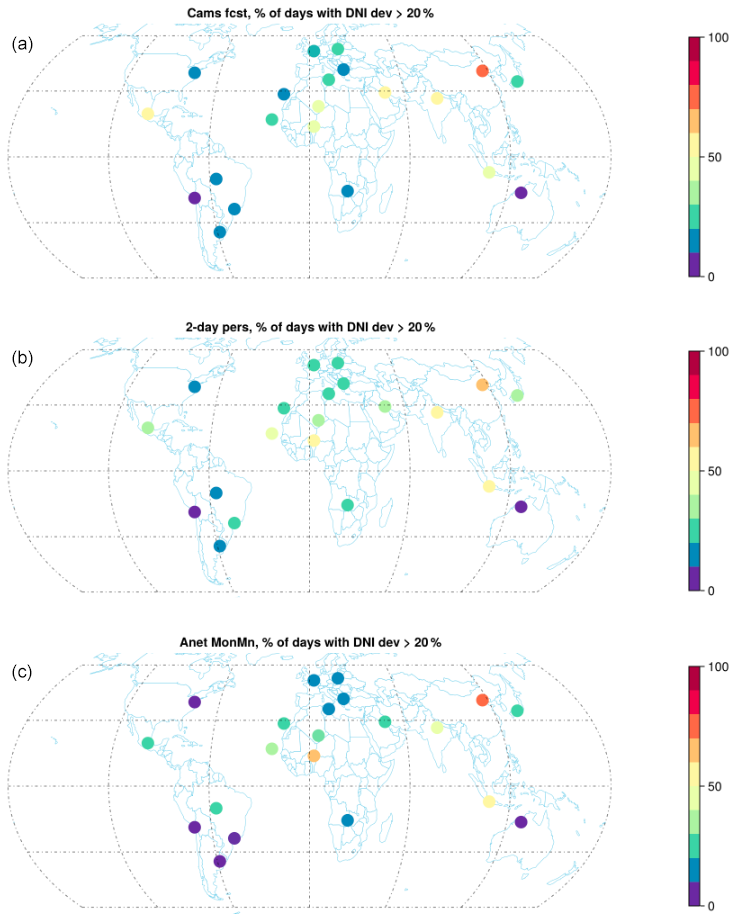
Figure 10Percentage of days with > 20 % deviation in daily sum of DNI due to day-to-day AOD variation using CAMS forecasts (a), AERONET 2 d persistence (b), and AERONET climatology (c).
To summarize the performance of each AOD forecast method in 2 d-ahead DNI forecasting, Fig. 9 presents the percentage of days at each site with DNI deviation > 5 % and Fig. 10 with the percentage > 20 % due to 2 d AOD variation using AERONET persistence, CAMS forecasts and AERONET climatology. For most sites, when the threshold is set to 5 %, more than 70 % of the days (up to 100 %), the DNI deviation is higher than this threshold, regardless of the forecast method used for AOD. If a DNI deviation of within 20 % is chosen, most sites have at least half of the days satisfying this criterion (10 %–50 % of the days failing), notably the southern American site Arica and the Australian site Lake Argyle (< 10 % of the days with > 20 % DNI deviation). Exceptions include Beijing, which would have more than 60 % of the days with DNI deviation > 20 % using any of the three forecast methods for AOD. The site Kuwait in the Middle East would also experience 50 %–60 % of the days with higher than 20 % deviation in DNI forecasts when CAMS AOD forecast is used; the percentage of such days would decrease to < 40 %, when adopting forecast methods from AERONET (persistence or monthly mean). Kosmopoulos et al. (2017) pointed out that CAMS overestimates DNI under high aerosol loads, which to a certain extent explains the inferior performance of CAMS forecast for the sites Beijing and Mexico City, where there are predominantly mixed aerosols. Another location to take caution is the northwestern African site Banizoumbou (situated south of the Saharan desert) since all three forecast methods report ±50 % of days surpassing the DNI deviation threshold of 20 %, which indicates less reliable forecasts there than at fellow dust aerosol sites. In the end, an acceptable deviation in DNI depends on the location-specific requirements of user groups.
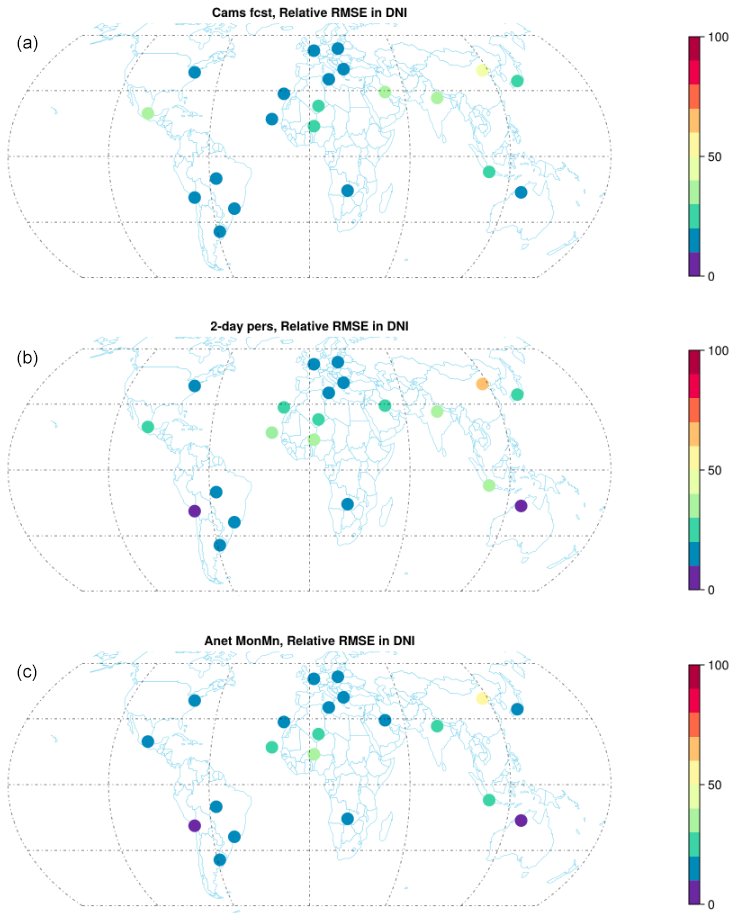
Figure 11Relative RMSE in DNI forecasts due to day-to-day AOD variation using CAMS forecasts (a), AERONET 2 d persistence (b), and AERONET climatology (c).
Last but not least, Fig. 11 shows the relative RMSE (rRMSE) in DNI forecasts due to 2 d AOD variation using the three forecast methods. The relative RMSE in DNI at most sites is lower than 30 %. The sites Arica and Lake Argyle have the minimum rRMSE (down to < 10 %), and Beijing has the maximum, by both AERONET 2 d persistence and monthly mean. The sites Beijing, Mexico City, Kanpur and Kuwait could expect improvements in the CAMS AOD forecast to reduce the deviations in DNI forecasts there.
To sum up, this study analyzes the spatiotemporal variability in AOD from ground measurements. CAMS AOD forecast is compared with forecast methods based on AERONET measurements. The induced deviation in DNI forecasts due to day-to-day AOD variation is also quantified, and implications in terms of geographical regions as well as aerosol types are derived. Day-to-day AOD variability is high at locations with high aerosol load, e.g., Beijing and Mexico City, both characterized by mixed aerosols. At dust aerosol sites, we also found high day-to-day AOD variability.
At different sites, the optimal AOD forecasts with the highest correlation or the smallest errors come from different data sources and forecast methods, which the sites' representative aerosol types can sometimes inform, providing information about the usability of model-based AOD forecasts as alternatives to AOD forecasts using ground measurements. CAMS forecasts perform better at more sites than AERONET persistence, among them many urban-industrial aerosol sites. AERONET persistence forecasts AOD with lower errors at dust aerosol sites. Under cloudless conditions, AOD variability results in the deviation of DNI forecasts from actual values, which demonstrates the anti-correlation of AOD levels with DNI forecast accuracy. At the accuracy level of 5 % deviation in 2 d-ahead DNI forecasts, none of the AOD forecast methods discussed here satisfactorily meet the requirements. We can expect better results achievable at many more sites with a threshold of 20 % DNI deviation, e.g. 70 %–80 % of the time in Europe and North America. Still, the performance of CAMS forecasts at dust aerosol sites in desert regions needs improvement.
For prospect research, seasonal and interannual variability or trends of AOD could be examined. Relative deviations in hourly DNI caused by deviations in hourly AOD forecast could be quantified and compared with clear-sky climatology. Moreover, to corroborate or elaborate on the findings about the usability of model-based AOD forecasts or forecasts based on ground measurements presented here, more site-specific case studies are needed. One can further investigate the characteristics of direct solar irradiance forecasts on locations with different aerosol types. In addition, research in this field would benefit from longer quality-assured surface-based aerosol measurements.
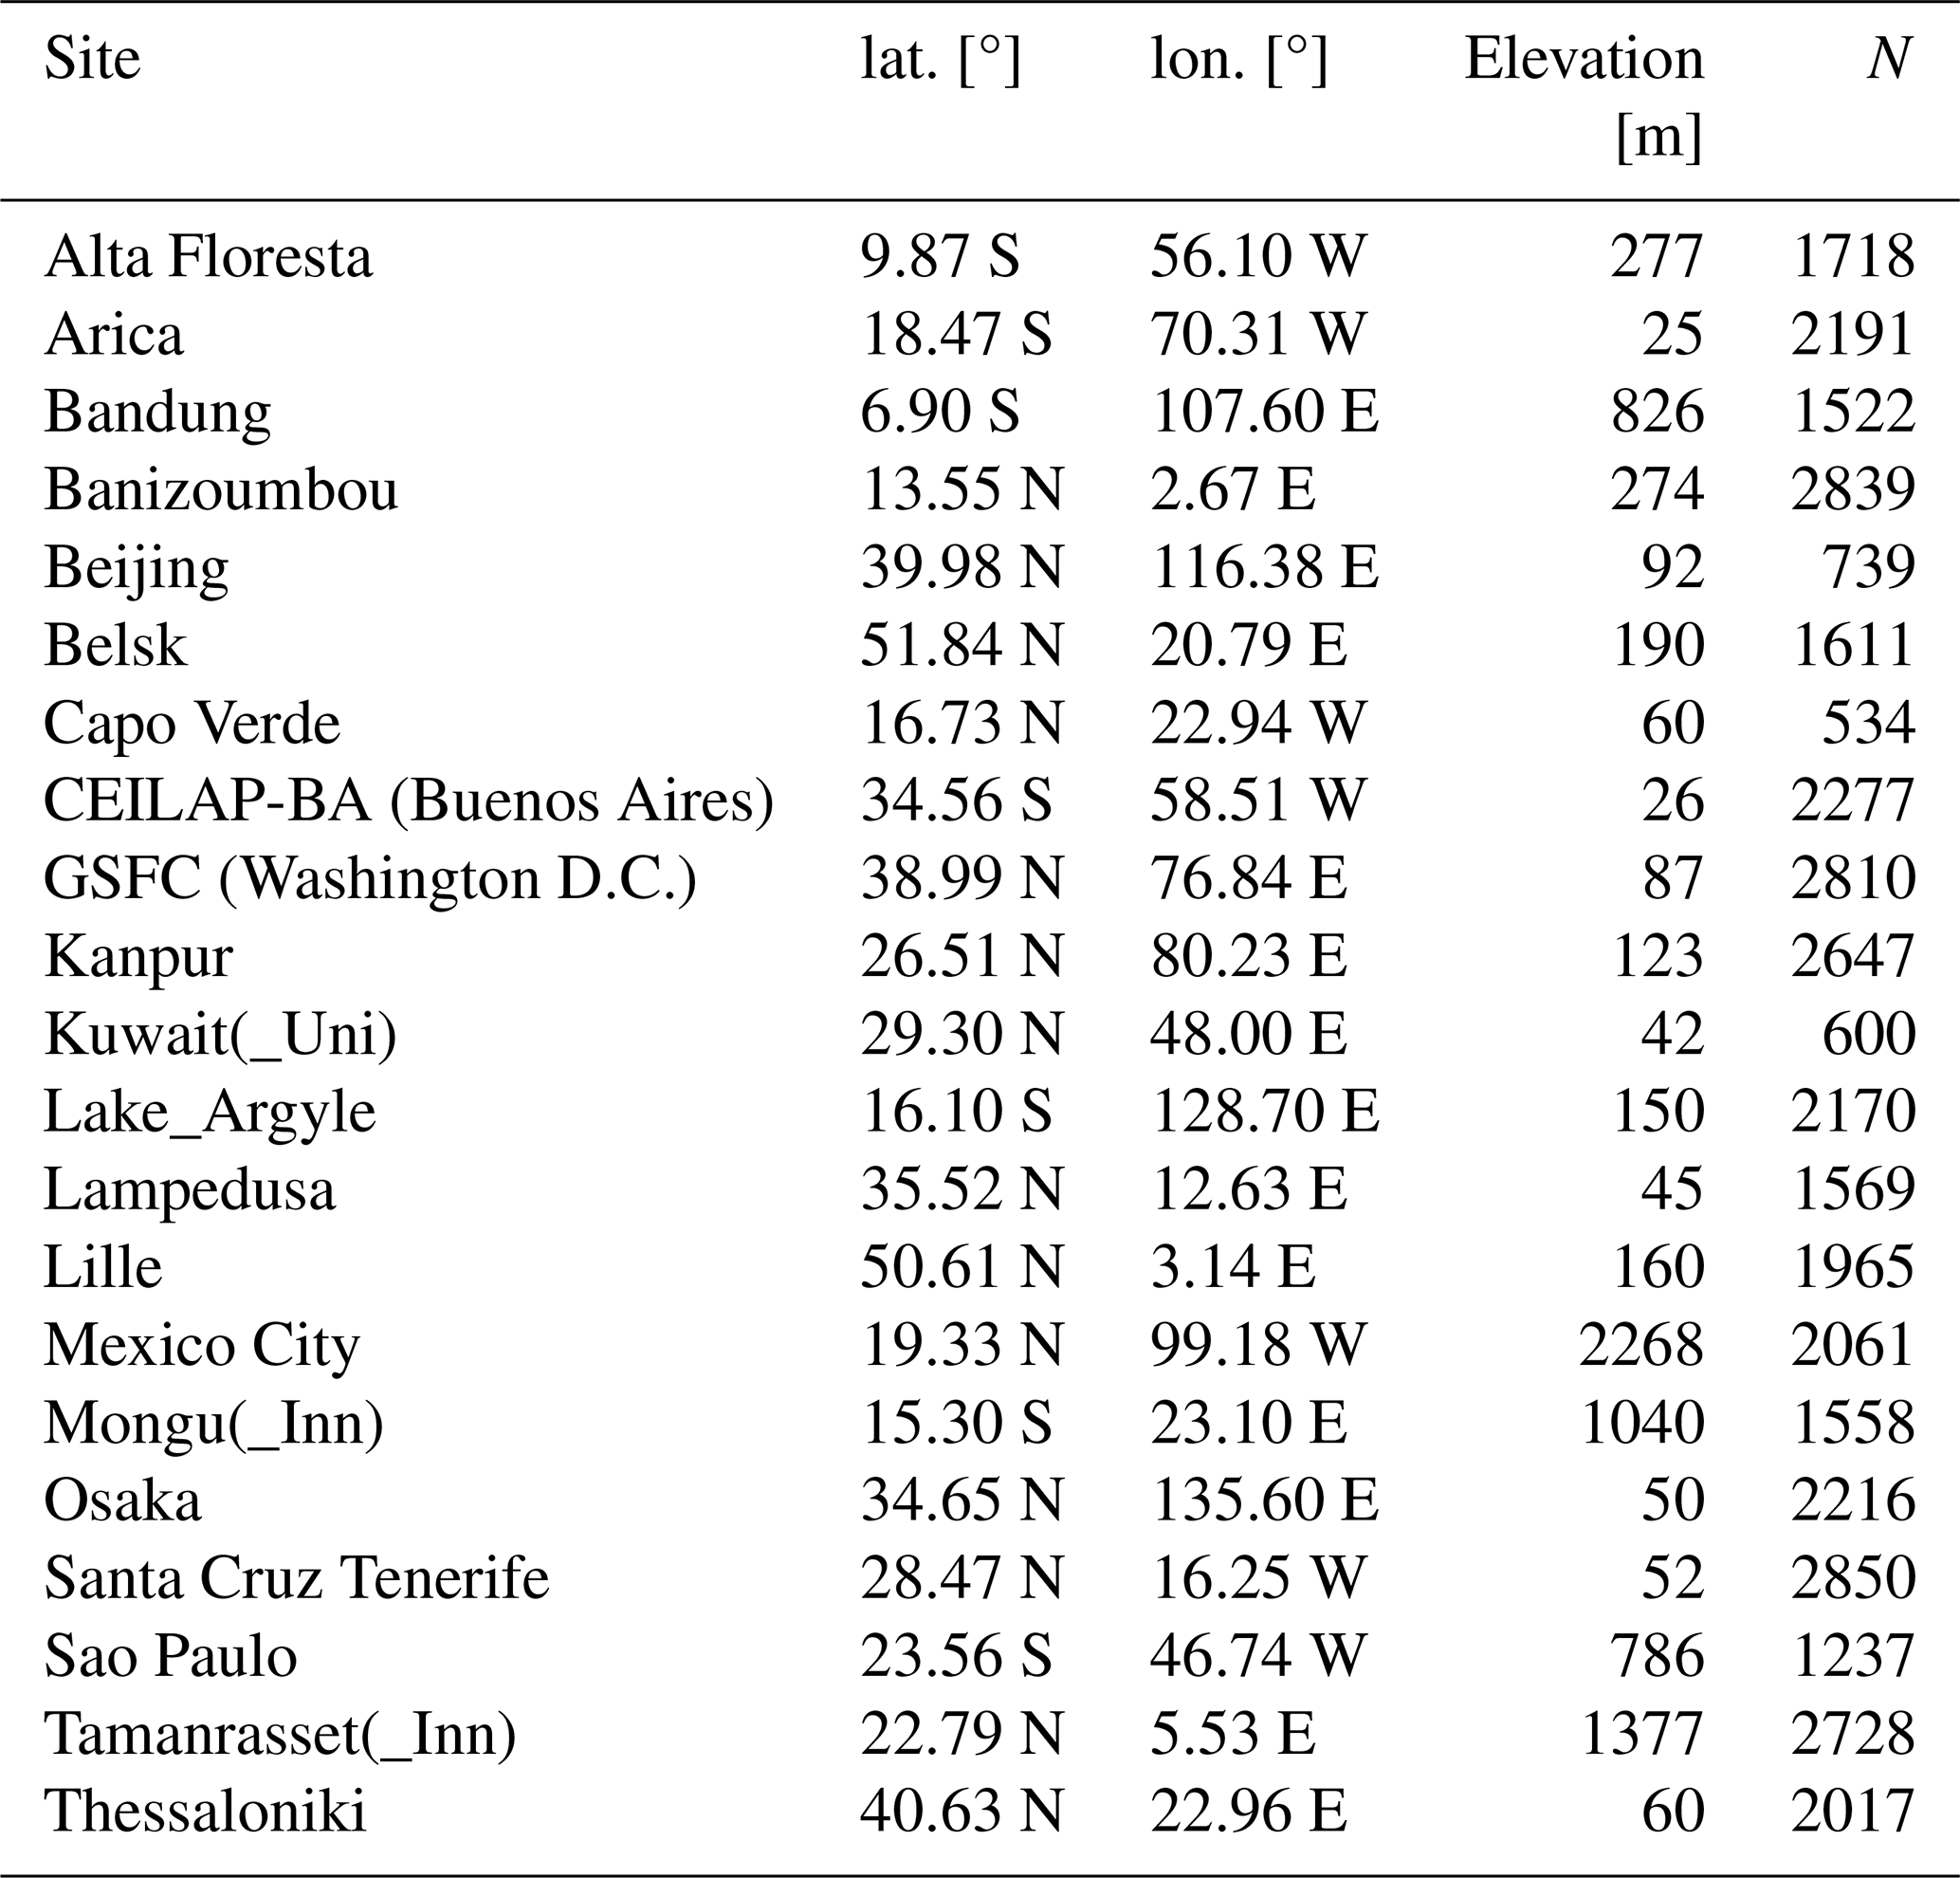
Table A1Information on the stations (alphabetically ordered) from the AERONET used in this study. N refers to the number of quality-assured consecutive days at each site.
Version 3 AOD data are freely available from the AERONET website (https://aeronet.gsfc.nasa.gov, last access: 1 December 2024). All the used and processed data for this paper can be requested from the corresponding author.
Idea and initialization: XH, SK; data provision and curation: XH, KP; first draft writing, visualization, analysis, and interpretation: XH; writing, review, and editing: all authors.
The contact author has declared that none of the authors has any competing interests.
Publisher's note: Copernicus Publications remains neutral with regard to jurisdictional claims made in the text, published maps, institutional affiliations, or any other geographical representation in this paper. While Copernicus Publications makes every effort to include appropriate place names, the final responsibility lies with the authors. Also, please note that this paper has not received English language copy-editing.
This article is part of the special issue “Sun-photometric measurements of aerosols: harmonization, comparisons, synergies, effects, and applications”. It is not associated with a conference.
This research was partly funded by the “EXCELSIOR”: ERATOSTHENES: Excellence Research Centre for Earth Surveillance and Space-Based Monitoring of the Environment H2020 Widespread Teaming project (https://www.excelsior2020.eu, last access: 8 July 2025). The “EXCELSIOR” project has received funding from the European Union's Horizon 2020 research and innovation program from the Government of the Republic of Cyprus through the “Directorate General for the European Programmes, Coordination, and Development” and the Cyprus University of Technology. Part of this work was supported by the COST Action Harmonia supported by COST (European Cooperation in Science and Technology). We thank the teams of the AERONET for ground measurements and maintenance, and CAMS for the data production and distribution.
This research has been supported by the Horizon 2020 (grant no. 857510) and the European Cooperation in Science and Technology (grant no. CA21119).
This paper was edited by Maria João Costa and reviewed by two anonymous referees.
Al-Rasheedi, M., Gueymard, C. A., Al-Khayat, M., Ismail, A., Lee, J. A., and Al-Duaj, H.: Performance Evaluation of a Utility-Scale Dual-Technology Photovoltaic Power Plant at the Shagaya Renewable Energy Park in Kuwait, Renew. Sust. Energ. Rev., 133, 110139, https://doi.org/10.1016/j.rser.2020.110139, 2020. a
Ansari, K. and Ramachandran, S.: Optical and physical characteristics of aerosols over Asia: AERONET, MERRA-2 and CAMS, Atmos. Environ., 326, 120470, https://doi.org/10.1016/j.atmosenv.2024.120470, 2024. a, b
Bhartia, P. K.: OMI/Aura TOMS-Like Ozone, Aerosol Index, Cloud Radiance Fraction L3 1 day 1 degree × 1 degree V3 (OMTO3d 003), NASA Goddard Space Flight Center, Goddard Earth Sciences Data and Information Services Center (GES DISC) [data set], https://disc.gsfc.nasa.gov/datasets/OMTO3d_003/summary (last access: 8 July 2025), 2012. a, b
Blaga, R., Calinoiu, D., and Paulescu, M.: A methodology for realistic estimation of the aerosol impact on the solar potential, Sol. Energy, 271, 112 425, https://doi.org/10.1016/j.solener.2024.112425, 2024. a
Bouarar, I., Arola, A., Benedictow, A., Bennouna, Y., Blake, L., Cuevas, E., Errera, Q., Eskes, H., Griesfeller, J., Basart, S., Kapsomenakis, J., Kouyate, M., Langerock, B., Mortier, A., Pitkänen, M., Pison, I., Ramonet, M., Richter, A., Schoenhardt, A., Schulz, M., Tarniewicz, J., Thouret, V., Tsikerdekis, A., Warneke, T., and Zerefos, C.: Validation report of the CAMS near-real-time global atmospheric composition service: Period December 2023–February 2024, Tech. rep., Copernicus Atmosphere Monitoring Service, https://doi.org/10.24380/N70-G3W3, 2024. a, b
Bozzo, A., Benedetti, A., Flemming, J., Kipling, Z., and Rémy, S.: An aerosol climatology for global models based on the tropospheric aerosol scheme in the Integrated Forecasting System of ECMWF, Geosci. Model Dev., 13, 1007–1034, https://doi.org/10.5194/gmd-13-1007-2020, 2020. a
Chen, A., Zhao, C., Shen, L., and Fan, T.: Influence of Aerosol Properties and Surface Albedo on Radiative Forcing Efficiency of Key Aerosol Types Using Global AERONET Data, Atmos. Res., 282, 106519, https://doi.org/10.1016/j.atmosres.2022.106519, 2023. a
Cheng, X., Ye, D., Shen, Y., Li, D., and Feng, J.: Studies on the improvement of modelled solar radiation and the attenuation effect of aerosol using the WRF-Solar model with satellite-based AOD data over north China, Renew. Energ., 196, 358–365, https://doi.org/10.1016/j.renene.2022.06.141, 2022. a
Emde, C., Buras-Schnell, R., Kylling, A., Mayer, B., Gasteiger, J., Hamann, U., Kylling, J., Richter, B., Pause, C., Dowling, T., and Bugliaro, L.: The libRadtran software package for radiative transfer calculations (version 2.0.1), Geosci. Model Dev., 9, 1647–1672, https://doi.org/10.5194/gmd-9-1647-2016, 2016. a
Fountoulakis, I., Kosmopoulos, P., Papachristopoulou, K., Raptis, I.-P., Mamouri, R.-E., Nisantzi, A., Gkikas, A., Witthuhn, J., Bley, S., Moustaka, A., Buehl, J., Seifert, P., Hadjimitsis, D. G., Kontoes, C., and Kazadzis, S.: Effects of Aerosols and Clouds on the Levels of Surface Solar Radiation and Solar Energy in Cyprus, Remote Sens., 13, 2319, https://doi.org/10.3390/rs13122319, 2021. a
Gao, X.-Y., Huang, C.-L., Zhang, Z.-H., Chen, Q.-X., Zheng, Y., Fu, D.-S., and Yuan, Y.: Global horizontal irradiance prediction model for multi-site fusion under different aerosol types, Renew. Energ., 227, 120565, https://doi.org/10.1016/j.renene.2024.120565, 2024. a
Giles, D. M., Sinyuk, A., Sorokin, M. G., Schafer, J. S., Smirnov, A., Slutsker, I., Eck, T. F., Holben, B. N., Lewis, J. R., Campbell, J. R., Welton, E. J., Korkin, S. V., and Lyapustin, A. I.: Advancements in the Aerosol Robotic Network (AERONET) Version 3 database – automated near-real-time quality control algorithm with improved cloud screening for Sun photometer aerosol optical depth (AOD) measurements, Atmos. Meas. Tech., 12, 169–209, https://doi.org/10.5194/amt-12-169-2019, 2019. a, b
Gkikas, A., Proestakis, E., Amiridis, V., Kazadzis, S., Di Tomaso, E., Tsekeri, A., Marinou, E., Hatzianastassiou, N., and Pérez García-Pando, C.: ModIs Dust AeroSol (MIDAS): a global fine-resolution dust optical depth data set, Atmos. Meas. Tech., 14, 309–334, https://doi.org/10.5194/amt-14-309-2021, 2021. a
Gueymard, C.: Variability in direct irradiance around the Sahara: Are the modeled datasets of bankable quality?, in: SolarPACES Conference 2010, Perpignan, France, https://www.academia.edu/29425719/Variability_in_direct_irradiance_around_the_Sahara_Are_the_modeled_datasets_of_bankable_quality (last access: 8 July 2025), 2010. a
Gueymard, C. and Jimenez, P.: Validation of Real-Time Solar Irradiance Simulations Over Kuwait Using WRF-Solar, in: Proceedings of EuroSun 2018, International Solar Energy Society, Rapperswil, CH, 1–11, ISBN 978-3-9820408-0-6, https://doi.org/10.18086/eurosun2018.09.14, 2018. a
Gueymard, C. A.: Temporal variability in direct and global irradiance at various time scales as affected by aerosols, Sol. Energy, 86, 3544–3553, https://doi.org/10.1016/j.solener.2012.01.013, 2012. a
Hamill, P., Giordano, M., Ward, C., Giles, D., and Holben, B.: An AERONET-based aerosol classification using the Mahalanobis distance, Atmos. Environ., 140, 213–233, https://doi.org/10.1016/j.atmosenv.2016.06.002, 2016. a, b, c
Holben, B. N., Eck, T. F., Slutsker, I., Tanré, D., Buis, J. P., Setzer, A., Vermote, E., Reagan, J. A., Kaufman, Y. J., Nakajima, T., Lavenu, F., Jankowiak, I., and Smirnov, A.: AERONET – A Federated Instrument Network and Data Archive for Aerosol Characterization, Remote Sens. Environ., 66, 1–16, https://doi.org/10.1016/S0034-4257(98)00031-5, 1998. a
IEA: Concentrating solar power generation in the Sustainable Development Scenario, 2000–2030, IEA, https://www.iea.org/data-and-statistics/charts/concentrating-solar-power-generation-in-the-sustainable-development-scenario-2000-2030 (last access: 8 July 2025), 2020. a
Inness, A., Ades, M., Agustí-Panareda, A., Barré, J., Benedictow, A., Blechschmidt, A.-M., Dominguez, J. J., Engelen, R., Eskes, H., Flemming, J., Huijnen, V., Jones, L., Kipling, Z., Massart, S., Parrington, M., Peuch, V.-H., Razinger, M., Remy, S., Schulz, M., and Suttie, M.: The CAMS reanalysis of atmospheric composition, Atmos. Chem. Phys., 19, 3515–3556, https://doi.org/10.5194/acp-19-3515-2019, 2019. a, b
Kazadzis, S., Kouremeti, N., Nyeki, S., Gröbner, J., and Wehrli, C.: The World Optical Depth Research and Calibration Center (WORCC) quality assurance and quality control of GAW-PFR AOD measurements, Geosci. Instrum. Method. Data Syst., 7, 39–53, https://doi.org/10.5194/gi-7-39-2018, 2018. a
Kosmopoulos, P. G., Kazadzis, S., Taylor, M., Athanasopoulou, E., Speyer, O., Raptis, P. I., Marinou, E., Proestakis, E., Solomos, S., Gerasopoulos, E., Amiridis, V., Bais, A., and Kontoes, C.: Dust impact on surface solar irradiance assessed with model simulations, satellite observations and ground-based measurements, Atmos. Meas. Tech., 10, 2435–2453, https://doi.org/10.5194/amt-10-2435-2017, 2017. a
Masoom, A., Kosmopoulos, P., Bansal, A., Gkikas, A., Proestakis, E., Kazadzis, S., and Amiridis, V.: Forecasting dust impact on solar energy using remote sensing and modeling techniques, Sol. Energy, 228, 317–332, https://doi.org/10.1016/j.solener.2021.09.033, 2021. a
Masoom, A., Fountoulakis, I., Kazadzis, S., Raptis, I.-P., Kampouri, A., Psiloglou, B. E., Kouklaki, D., Papachristopoulou, K., Marinou, E., Solomos, S., Gialitaki, A., Founda, D., Salamalikis, V., Kaskaoutis, D., Kouremeti, N., Mihalopoulos, N., Amiridis, V., Kazantzidis, A., Papayannis, A., Zerefos, C. S., and Eleftheratos, K.: Investigation of the effects of the Greek extreme wildfires of August 2021 on air quality and spectral solar irradiance, Atmos. Chem. Phys., 23, 8487–8514, https://doi.org/10.5194/acp-23-8487-2023, 2023. a
Mayer, B. and Kylling, A.: Technical note: The libRadtran software package for radiative transfer calculations – description and examples of use, Atmos. Chem. Phys., 5, 1855–1877, https://doi.org/10.5194/acp-5-1855-2005, 2005. a
Mona, L., Amiridis, V., Cuevas, E., Gkikas, A., Trippetta, S., Vandenbussche, S., Benedetti, A., Dagsson-Waldhauserova, P., Formenti, P., Haefele, A., Kazadzis, S., Knippertz, P., Laurent, B., Madonna, F., Nickovic, S., Papagiannopoulos, N., Pappalardo, G., García-Pando, C. P., Popp, T., Rodríguez, S., Sealy, A., Sugimoto, N., Terradellas, E., Vimic, A. V., Weinzierl, B., and Basart, S.: Observing Mineral Dust in Northern Africa, the Middle East, and Europe: Current Capabilities and Challenges ahead for the Development of Dust Services, B. Am. Meteorol. Soc., https://doi.org/10.1175/BAMS-D-23-0005.1, 2023. a
Neher, I., Buchmann, T., Crewell, S., Evers-Dietze, B., Pfeilsticker, K., Pospichal, B., Schirrmeister, C., and Meilinger, S.: Impact of Atmospheric Aerosols on Photovoltaic Energy Production Scenario for the Sahel Zone, Enrgy. Proced., 125, 170–179, https://doi.org/10.1016/j.egypro.2017.08.168, 2017. a
Papachristopoulou, K., Fountoulakis, I., Gkikas, A., Kosmopoulos, P. G., Nastos, P. T., Hatzaki, M., and Kazadzis, S.: 15-Year Analysis of Direct Effects of Total and Dust Aerosols in Solar Radiation/Energy over the Mediterranean Basin, Remote Sens., 14, 1535, https://doi.org/10.3390/rs14071535, 2022a. a
Papachristopoulou, K., Raptis, I.-P., Gkikas, A., Fountoulakis, I., Masoom, A., and Kazadzis, S.: Aerosol optical depth regime over megacities of the world, Atmos. Chem. Phys., 22, 15703–15727, https://doi.org/10.5194/acp-22-15703-2022, 2022b. a
Salamalikis, V., Vamvakas, I., Blanc, P., and Kazantzidis, A.: Ground-based validation of aerosol optical depth from CAMS reanalysis project: An uncertainty input on direct normal irradiance under cloud-free conditions, Renew. Energ., 170, 847–857, https://doi.org/10.1016/j.renene.2021.02.025, 2021. a
Schroedter-Homscheidt, M., Oumbe, A., Benedetti, A., and Morcrette, J.-J.: Aerosols for Concentrating Solar Electricity Production Forecasts: Requirement Quantification and ECMWF/MACC Aerosol Forecast Assessment, B. Am. Meteorol. Soc., 94, 903–914, https://doi.org/10.1175/BAMS-D-11-00259.1, 2013. a, b, c, d
Schumacher, V. and Setzer, A.: Assessment and characteristics of S-NPP VIIRS Deep Blue and Dark Target aerosol properties under clean, polluted and fire scenarios over the Amazon, Atmos. Environ., 323, 120398, https://doi.org/10.1016/j.atmosenv.2024.120398, 2024. a
Sengupta, M., Habte, A., Wilbert, S., Gueymard, C., and Remund, J.: Best Practices Handbook for the Collection and Use of Solar Resource Data for Solar Energy Applications: Third Edition, Tech. Rep. NREL/TP-5D00-77635, 1778700, MainId:29561, NREL, https://doi.org/10.2172/1778700, 2021. a
Smirnov, A., Holben, B. N., Eck, T. F., Slutsker, I., Chatenet, B., and Pinker, R. T.: Diurnal variability of aerosol optical depth observed at AERONET (Aerosol Robotic Network) sites, Geophys. Res. Lett., 29, 30-1–30-4, https://doi.org/10.1029/2002GL016305, 2002. a
Tang, C., Shi, C., Letu, H., Ma, R., Yoshida, M., Kikuchi, M., Xu, J., Li, N., Zhao, M., Chen, L., and Shi, G.: Evaluation and uncertainty analysis of Himawari-8 hourly aerosol product version 3.1 and its influence on surface solar radiation before and during the COVID-19 outbreak, Sci. Total Environ., 892, 164456, https://doi.org/10.1016/j.scitotenv.2023.164456, 2023. a
Tuna Tuygun, G. and Elbir, T.: Comparative analysis of CAMS aerosol optical depth data and AERONET observations in the Eastern Mediterranean over 19 years, Environ. Sci. Pollut. Res., https://doi.org/10.1007/s11356-024-32950-6, 2024. a
Wang, D., Li, C., Mao, J., and Yang, Q.: What affects the implementation of the renewable portfolio standard? An analysis of the four-party evolutionary game, Renew. Energ., 204, 250–261, https://doi.org/10.1016/j.renene.2023.01.015, 2023. a
Xiong, J., Zhao, T., Bai, Y., Liu, Y., Han, Y., and Guo, C.: Climate Characteristics of Dust Aerosol and Its Transport in Major Global Dust Source Regions, J. Atmos. Sol.-Terr. Phy., 209, 105415, https://doi.org/10.1016/j.jastp.2020.105415, 2020. a
Xu, X., Vignarooban, K., Xu, B., Hsu, K., and Kannan, A. M.: Prospects and problems of concentrating solar power technologies for power generation in the desert regions, Renew. Sust. Energ. Rev., 53, 1106–1131, https://doi.org/10.1016/j.rser.2015.09.015, 2016. a
Yang, D., Wang, W., Gueymard, C. A., Hong, T., Kleissl, J., Huang, J., Perez, M. J., Perez, R., Bright, J. M., Xia, X., van der Meer, D., and Peters, I. M.: A Review of Solar Forecasting, Its Dependence on Atmospheric Sciences and Implications for Grid Integration: Towards Carbon Neutrality, Renew. Sust. Energ. Rev., 161, 112348, https://doi.org/10.1016/j.rser.2022.112348, 2022. a, b, c
Zhang, L., Wang, X., Huang, G., and Zhang, S.: Comprehensive Assessment and Analysis of the Current Global Aerosol Optical Depth Products, Remote Sens., 16, 1425, https://doi.org/10.3390/rs16081425, 2024. a