the Creative Commons Attribution 4.0 License.
the Creative Commons Attribution 4.0 License.
 | 16 Sep 2025
Retrieval of black carbon aerosol surface concentration using integrated MODIS and AERONET data
Xingxing Jiang
Yong Xue
Mariarosaria Calvello
Shuhui Wu
Pei Li
Black Carbon (BC) is a carbonaceous aerosol that strongly absorbs solar radiation. The high emissions of these highly absorbent particles exacerbate regional air quality and pose significant threats to global climate, both in the short and long term. Therefore, accurately quantifying the spatial distribution of BC is crucial for improving regional air quality and mitigating the climate change impacts driven by human activities. In this study, we developed a novel algorithm for retrieving BC surface concentration jointly using MODIS and AERONET data. Firstly, the algorithm employed the K-means clustering method to determine seasonal background aerosols model based on AERONET V3 daily products. Then, the Maxwell–Garnett effective medium approximation model was utilized to calculate the complex refractive index of the internally mixed aerosols. Subsequently, the lookup tables were established using the 6SV2.1 radiative transfer code to estimate optimal BC fraction and column concentration. Next, the column concentration data were converted to surface concentration using a conversion coefficient derived from MERRA-2. Finally, the retrieved MODIS BC surface concentration was validated with in-situ Aethalometer measurements. The validation showed a correlation coefficient (R) of 0.727, a root mean square error (RMSE) of 0.353, a mean absolute error (MAE) of 0.211, and a linear fit function of . These statistical parameters outperform those obtained from MERRA-2 BC data (R = 0.655, RMSE = 0.487, MAE = 0.381, and ), demonstrating the superior performance of the proposed algorithm in this study area.
- Article
(6682 KB) - Full-text XML
- BibTeX
- EndNote


Black carbon aerosol (BC) particles have important impacts on the global climate, air pollution, and human health (Ramanathan and Carmichael, 2008). According to the latest report of the Intergovernmental Panel on Climate Change (IPCC) (Everett et al., 2022), the overall climate effect of aerosols is cooling, but the BC particles therein have a significant warming effect, and play an extremely important role in promoting glacier melting in the Arctic region (Flanner, 2013). In addition, BC emitted from human activities also significantly affects air quality (Cao et al., 2007). It is one of the main components of fine particulate matters (PM2.5) (Cai et al., 2020), which has a great impact on human health and is considered an important factor leading to obesity (Guo et al., 2022). Therefore, it is of great research significance to obtain accurate and reliable BC spatiotemporal distribution, especially BC surface concentration data that is extremely relevant to human activities.
Currently, the most common method to obtain the chemical composition of BC relying on in-situ measurements, such as Aethalometers (AE31/33) (Pavese et al., 2020), aerosol mass spectrometer (Wang et al., 2018), scanning electron microscopy (Brodowski et al., 2005), etc. These methods are accurate and reliable but can only obtain BC concentrations in specific areas. In addition, using chemical transport models to simulate BC concentrations is also an important method (Xu et al., 2020). Still, the current assimilation products have low spatial resolution and the results are highly uncertain due to the deviation of model input data from actual atmospheric conditions (Sato et al., 2003).
Over the past 20 years, obtaining aerosol physical and chemical properties based on ground-based remote sensing and satellite remote sensing methods has been a hot topic in atmospheric science research (Remer et al., 2024). In ground-based remote sensing, some scholars used the Aerosol Robotic Observation Network (AERONET) to invert the BC-dominated absorption component based on the observation results of the complex refractive index (RI), combined with the three aerosol characteristics of BC, ammonium sulfate, and aerosol water (Sato et al., 2003; Schuster et al., 2005). Later, the single scattering albedo (SSA) was introduced based on the RI, and a five-component inversion model was established (Wang et al., 2013). On this basis, Xie et al. (2017) introduced the log-normal volume size distribution, and then using fine mode volume concentration and coarse mode volume concentration, combined with aerosol optical depth (AOD) correction, successfully separated the proportion of coarse and fine particles, and simulated the concentration and volume distribution of seven different aerosol types. Zhang et al. (2024) simultaneously obtained the long-term series BC column concentration of global AERONET stations based on the Generalized Retrieval of Aerosol and Surface Properties (GRASP)/Component algorithm (Dubovik et al., 2011). However, ground-based remote sensing cannot accurately describe the spatial variation of BC. Therefore, multi-temporal and wide-area observations using satellite remote sensing have the potential to monitor the large-scale spatiotemporal variation of BC. Some studies have preliminarily proposed BC concentration inversion algorithms based on satellite data, such as applying the GRASP algorithm to polarized satellite data such as Polarization and Directionality of the Earth's Reflectances (POLDER) (Bao et al., 2019; Li et al., 2019, 2020) and Directional Polarimetric Camera (DPC) instruments (Li et al., 2022). Based on Moderate Resolution Imaging Spectroradiometer (MODIS) data, the BC column concentration was estimated in China using the lookup table method (LUT) (Bao et al., 2020). Based on the geostationary satellite Himawari-8 data, the hourly BC surface concentration in North China was estimated using the critical reflectance method (Bao et al., 2023). Choi et al. (2024) used the inferred BC volume fraction and particle mass concentration using the Earth Polychromatic Imaging Camera (EPIC) to infer the volume fraction and particle mass concentration of BC based on the spectral absorption provided by the Multi-Angle Implementation of Atmospheric Correction (MAIAC) algorithm. In this paper, we utilized MODIS data, long-term AERONET aerosol optical property observation data, considering the seasonal differences of background aerosols (BAs) across the study area. The K-means method was applied to categorize the optical properties of BAs for different seasons, and multiple LUTs were established with varying BC fraction. This enables the development of a novel BC surface concentration inversion algorithm tailored to the region. Given that MODIS has provided a substantial volume of long-term data, this new algorithm holds significant potential for investigating long-term spatiotemporal changes in BC concentrations. Section 2 describes data source; Sect. 3 illustrates the methodology, including forward model, calculation strategy for physical properties of internal mixed aerosols, inverse method, and sensitivity studies; Sect. 4 contains the retrieved MODIS BC surface concentration results, validation, and uncertainty analysis. Section 5 represents conclusion.
2.1 MODIS data
MODIS has been recording data on the Aqua and Terra satellites launched by NASA and has been providing a large amount of observations since 1999 (Remer et al., 2005). This study used MODIS data from November 2023 to June 2024 in the study area of 5–20° E, 30–50° N, including three types of datasets: MO/YD02 (L1B data), MO/YD03 (Geolocation data), and MO/YD04 (AOD data based on Dark Target algorithm (DT), 0.55 µm). The DT used the linear relationship between the surface reflectance of 0.47, 0.66 and 2.12 µm to retrieve AOD. This product has been widely used in atmospheric remote sensing and climate change research due to its reliable accuracy and long time series. The DT used the linear relationship between the surface reflectance of 0.47, 0.66 and 2.12 µm to retrieve AOD (Levy et al., 2013). This product has been widely used in atmospheric remote sensing and climate change research due to its reliable accuracy and long time series. These datasets can be obtained from this website https://ladsweb.modaps.eosdis.nasa.gov/ (last access: 5 July 2025).
2.2 AERONET data
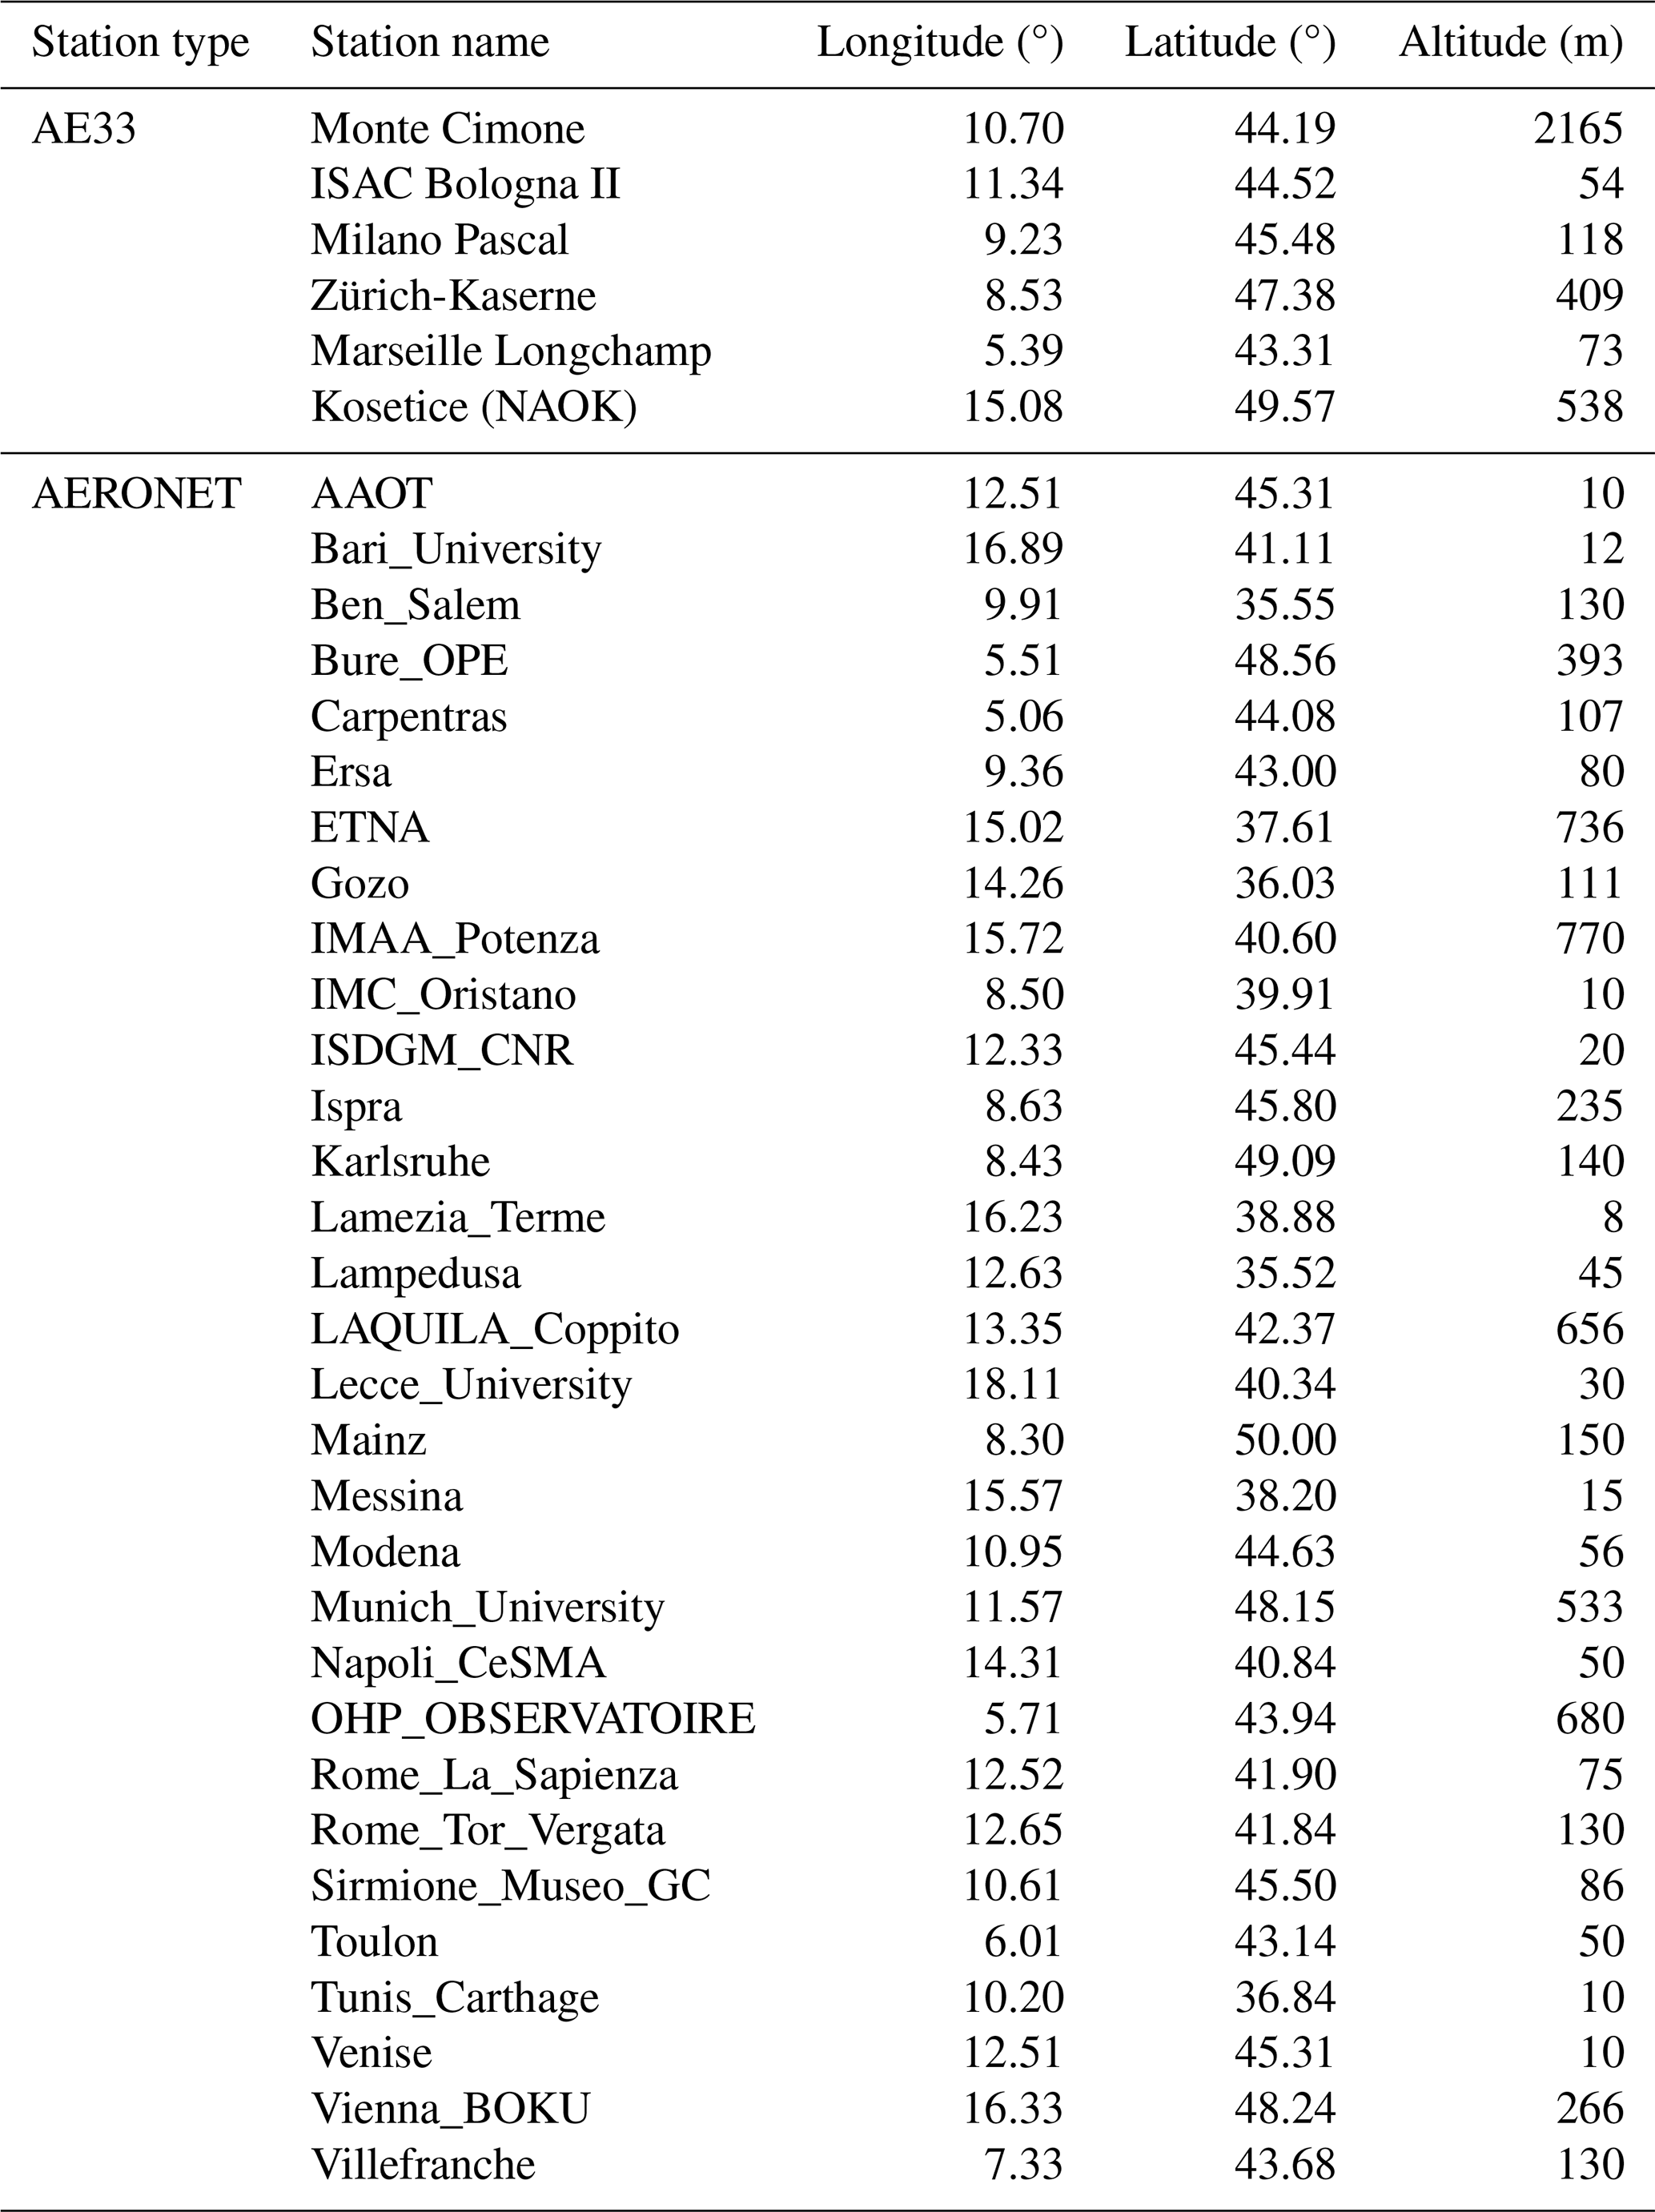
AERONET is the world's most widely used ground-based aerosol physical characteristics observation network, providing long-term aerosol optical and physical property observation data from thousands of stations for nearly 30 years (Dubovik et al., 2000). This study used the AERONET V3 daily dataset of 32 stations in the study area to obtain BAs characteristic data, which was used as aerosol model input data in the atmospheric radiation transfer model. The locations of these sites are shown as red dots in Fig. 1, and the detailed site information is shown in Table 1. This dataset can be downloaded at https://aeronet.gsfc.nasa.gov/ (last access: 5 July 2025).
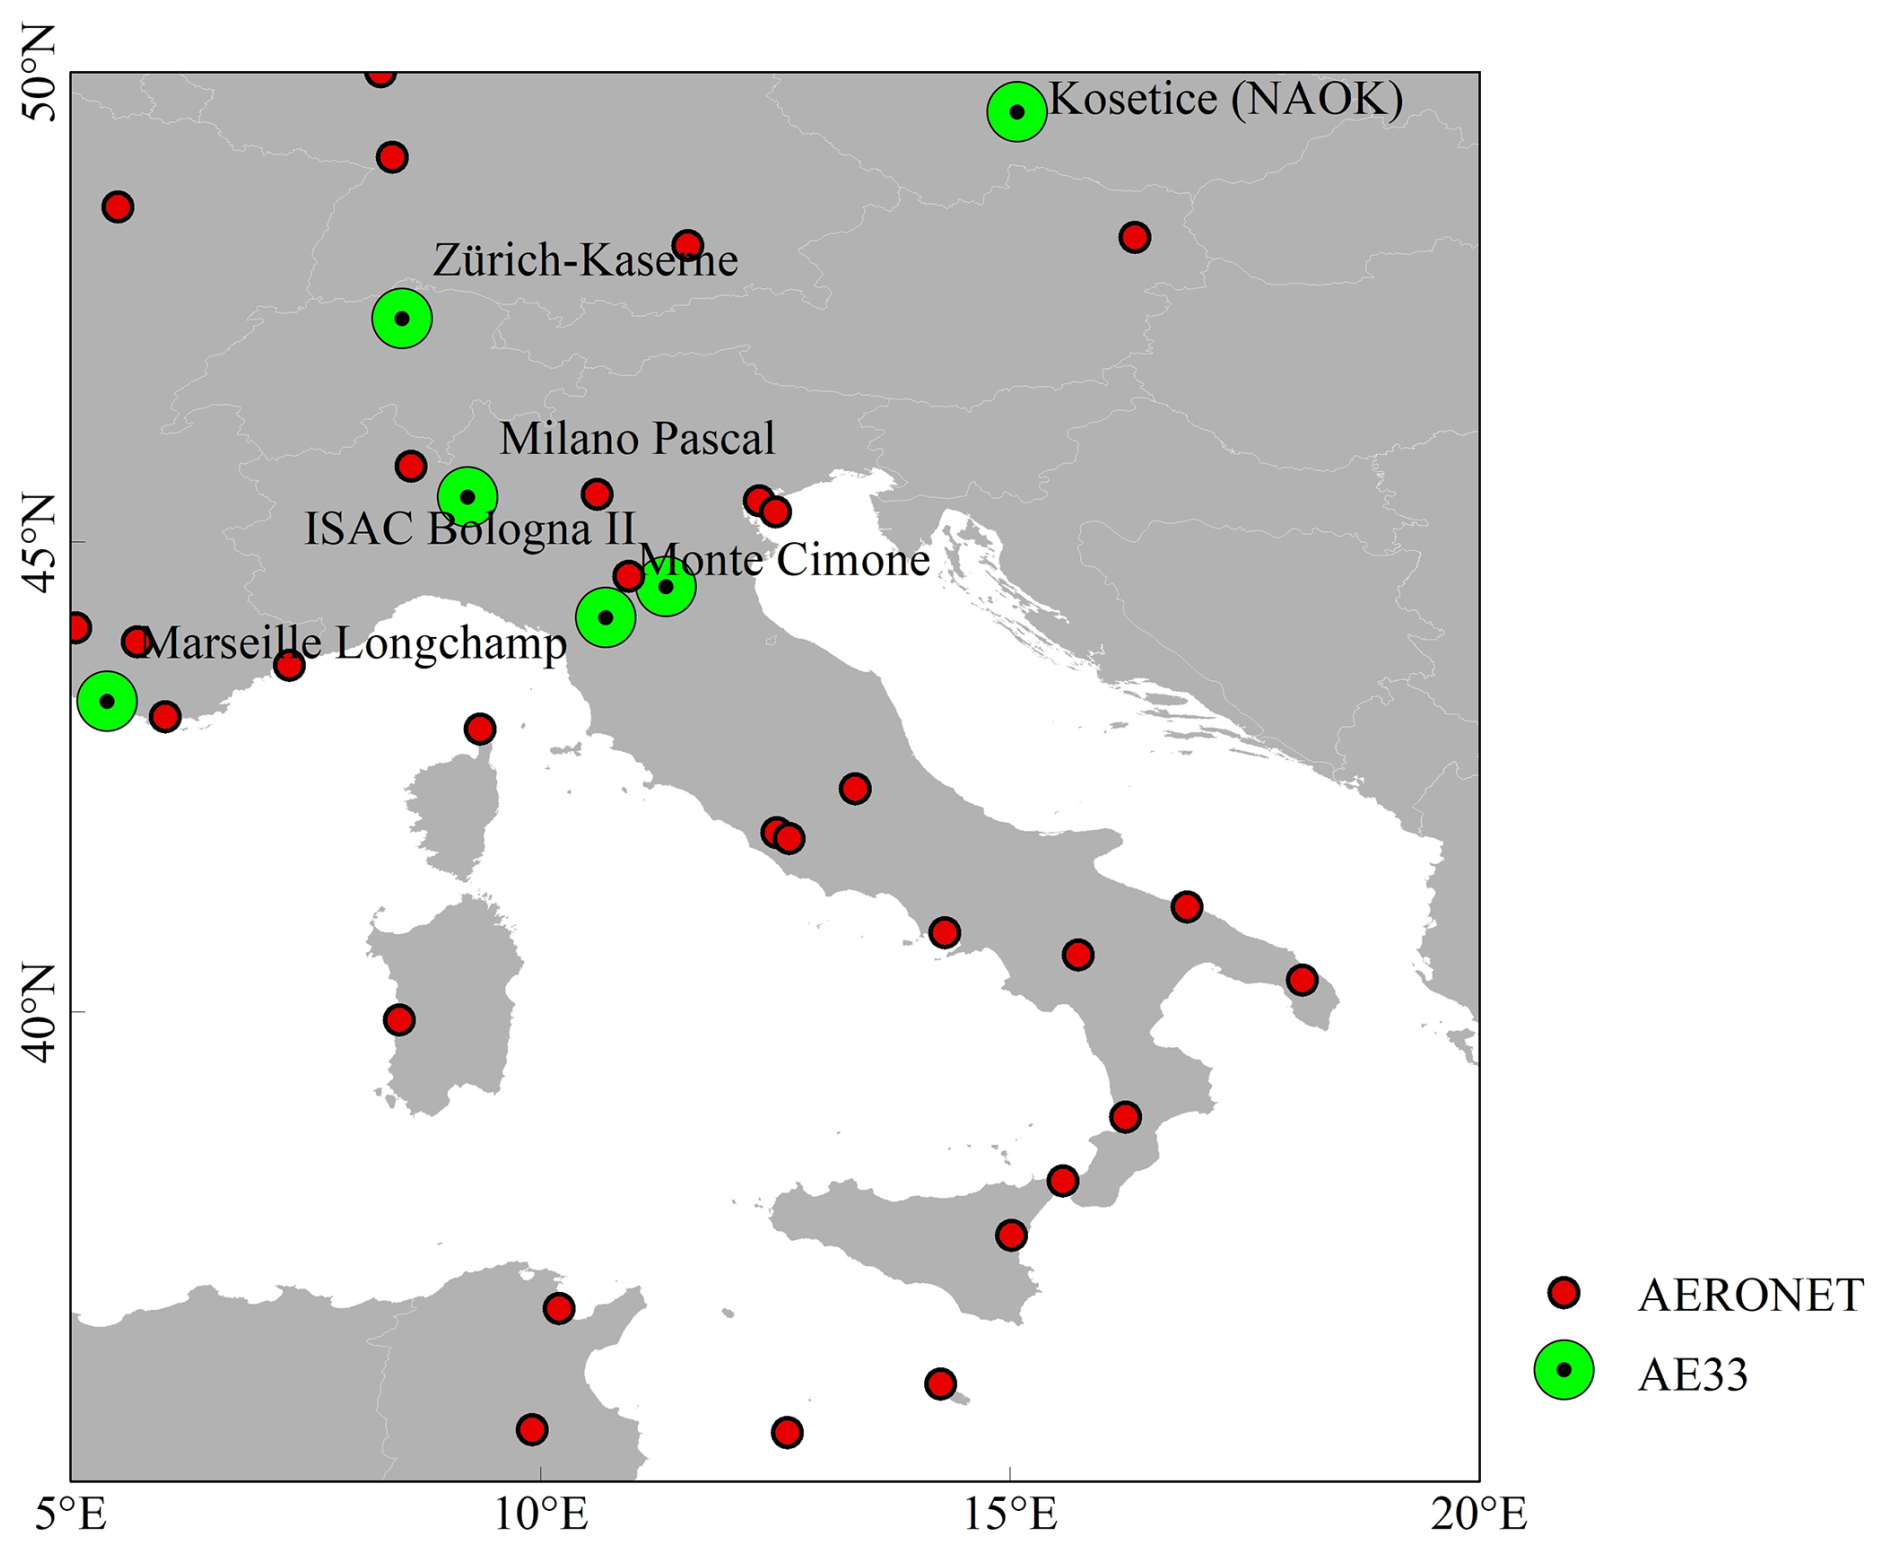
Figure 1Location distribution of AERONET and AE33 ground observation stations. The small red dots, large green dots, and text in the figure represent AERONET sites, AE33 sites, and AE33 site names, respectively.
Table 1AE33 and AERONET ground observation stations parameters.
2.3 AE33 data
AE33 aethalometer is based on the principle of light absorption and quantifies BC surface concentration by measuring the light absorption characteristics of aerosol samples at multiple wavelengths (Yus-Díez et al., 2021). The instrument typically conducts real-time continuous light absorption measurements at seven wavelengths, ranging from ultraviolet to near-infrared, allowing it to distinguish between different sources of BC and aerosol components, thus improving data accuracy (Rajesh and Ramachandran, 2018). In this study, we used the BC surface concentration data from 6 sites equipped with AE33 and located in the study area, with the measurement wavelength at 637 nm. The locations of the 6 AE33 sites are shown in Fig. 1, and the detailed site information is shown in Table 1. The AE33 BC surface concentration data can be obtained from this website https://ebas.nilu.no/data-access/ (last access: 5 July 2025).
2.4 MERRA-2 data
MERRA-2 is a global atmospheric reanalysis dataset developed by NASA. It is specifically designed to provide high-quality historical datasets for the study of atmospheric and climate processes (Gelaro et al., 2017). In this paper, we used water vapor and ozone data to correct the absorption of MODIS L1B data, and BC column concentration and surface concentration data were used to obtain a priori ratio and for comparison. The MERRA-2 datasets can be downloaded from https://search.earthdata.nasa.gov/ (last access: 5 July 2025).
3.1 Forward model
In this study, we used the 6SV2.1 model (Vermote et al., 2016), which is widely used in current aerosol remote sensing inversion. When the zenith angle does not exceed 75°, the estimation error of top of atmosphere reflectance (TOA) does not exceed 0.4 % (Jiang et al., 2022). The 6SV2.1 model equation is as follows:
In the Eq. (1), θs, θv, φ, τ and fBC denote solar zenith angle, satellite zenith angle, relative azimuth angle, AOD, and BC volume fraction, respectively. ρTOA, ρatm, ρs, S, Tg, T1, and T2 represent TOA, atmospheric path reflectance, surface reflectance, atmospheric spherical albedo, gaseous transmission, downward atmospheric transmission, and upward atmospheric transmission, respectively.
3.2 Estimation of optical properties of mixture aerosol
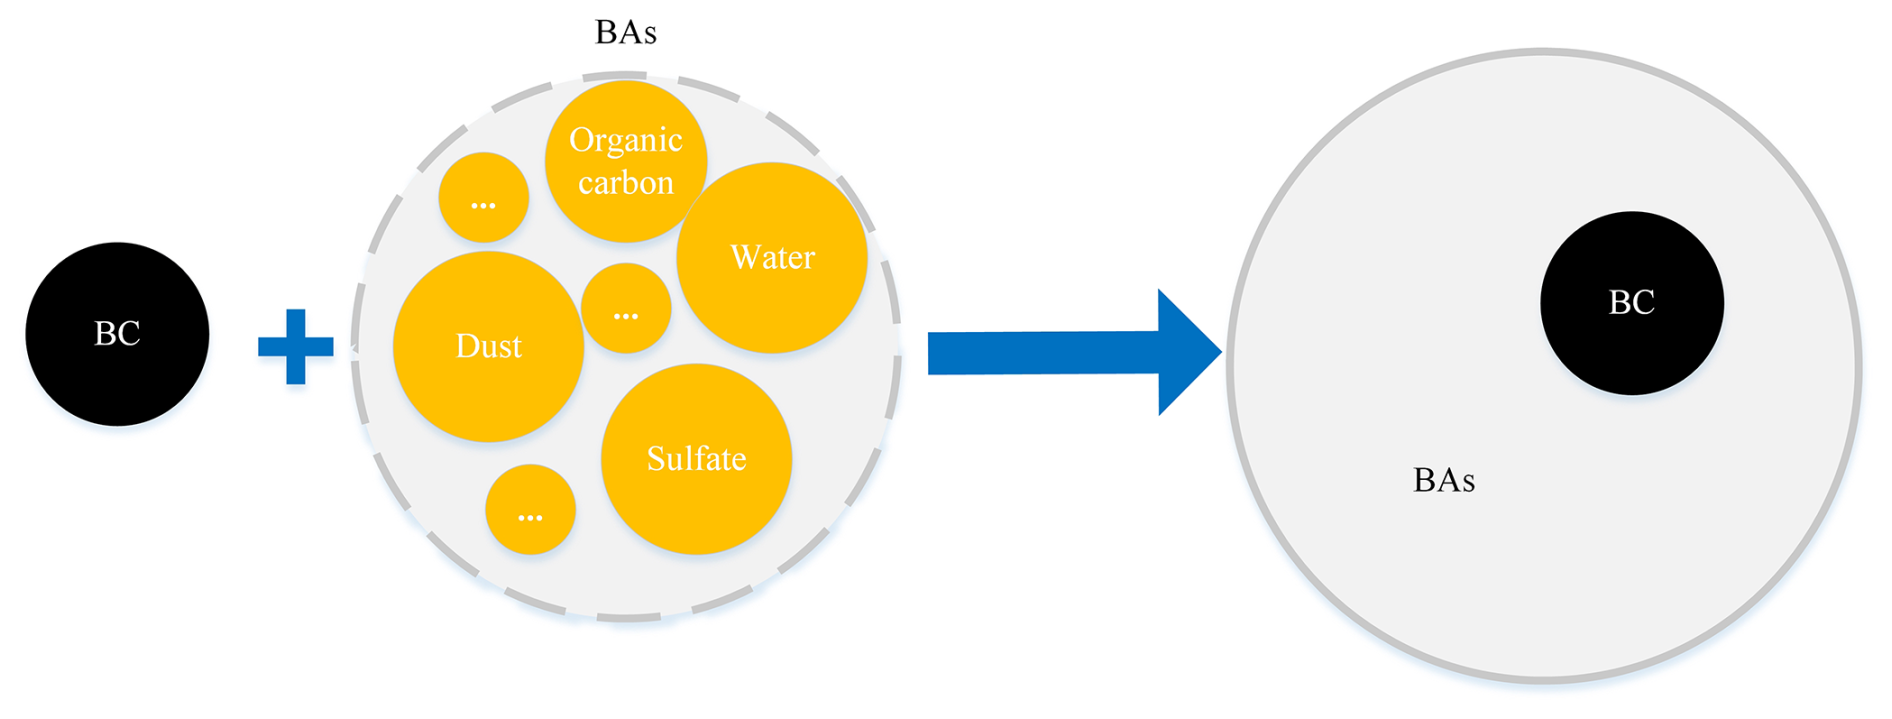
Maxwell−Garnett effective medium approximation model (MG-MEA) is used to estimate the Maxwell-Garnett dielectric function of aerosol mixtures (Schuster et al., 2005). In this paper, the schematic diagram of the mixture including BC surrounded by BAs is shown in Fig. 2. The MG-EMA equation is as follows:
where εMG, εBAs, fBC and εBC indicate mixture aerosol dielectric function, BAs complex dielectric function, BC volume fraction and BC complex dielectric function, respectively. For εBAs and εBC values can be obtained through RI:
where j = BC, BAs, represents different component.
After obtaining εMG, the mixture aerosol RI can be calculated by Eqs. (4) and (5):
where εr and εi are real part and imaginary part of εMG, n and k are real part and imaginary part of the mixture aerosol RI.
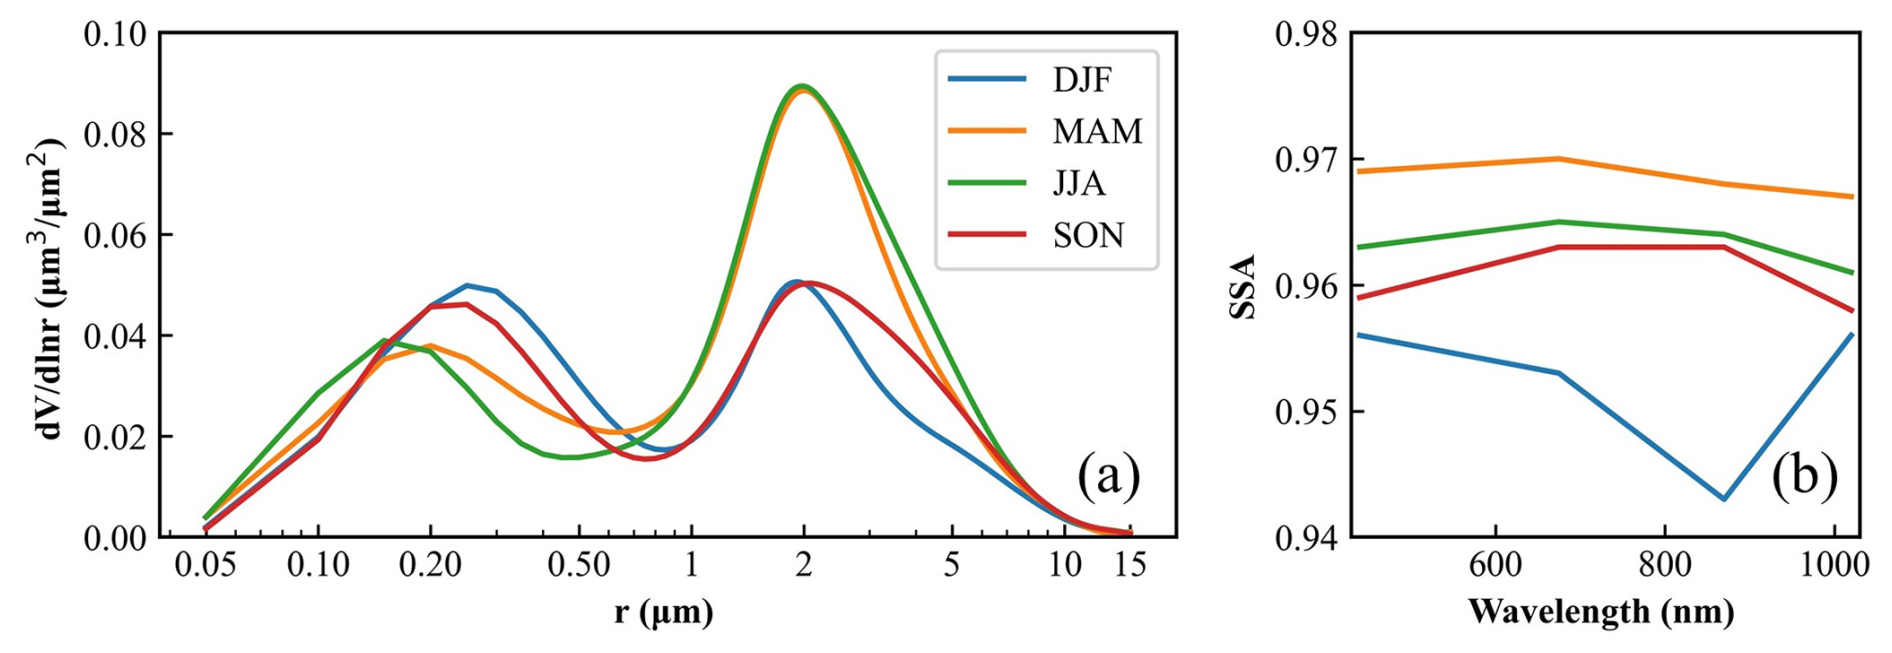
Figure 3BAs particle optical properties in different seasons. Panels (a) and (b) denote particle volume size distribution and SSA, respectively. DJF represents winter (December–January–February); MAM represents spring (March–April–May); JJA represents summer (June–July–August); SON represents autumn (September–October–November).
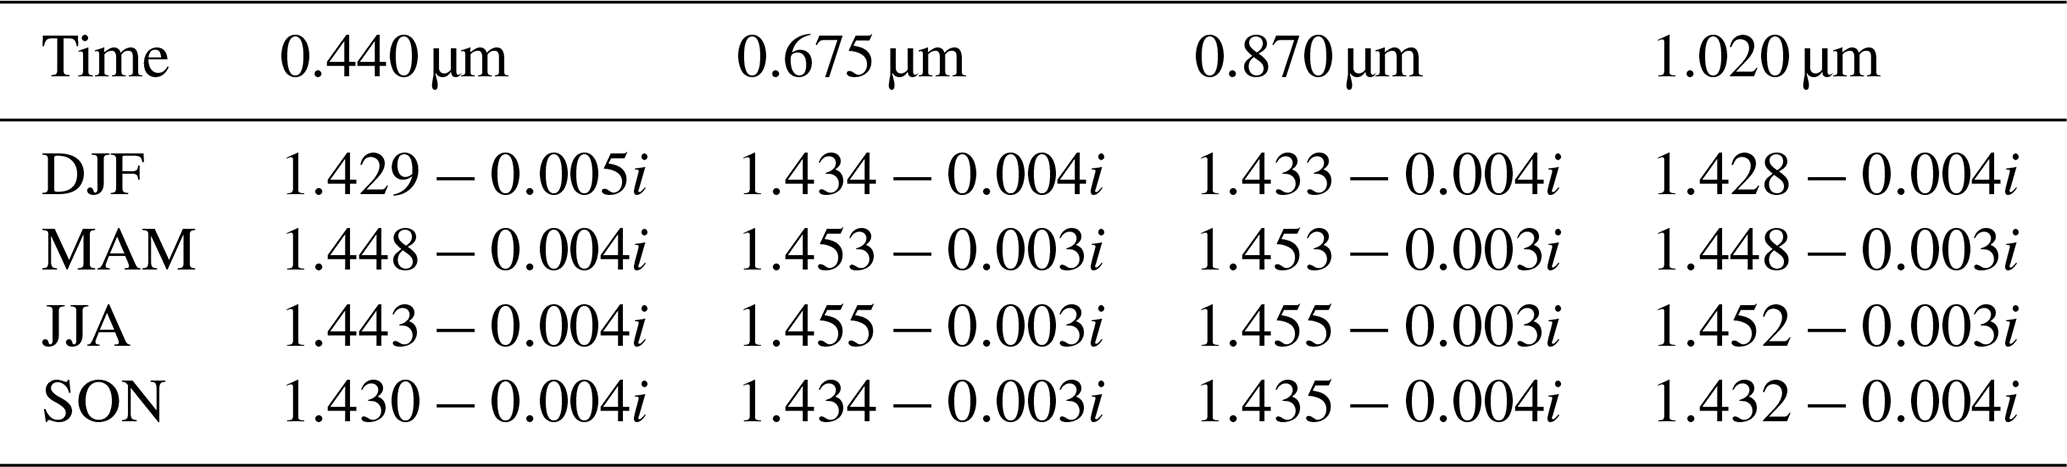
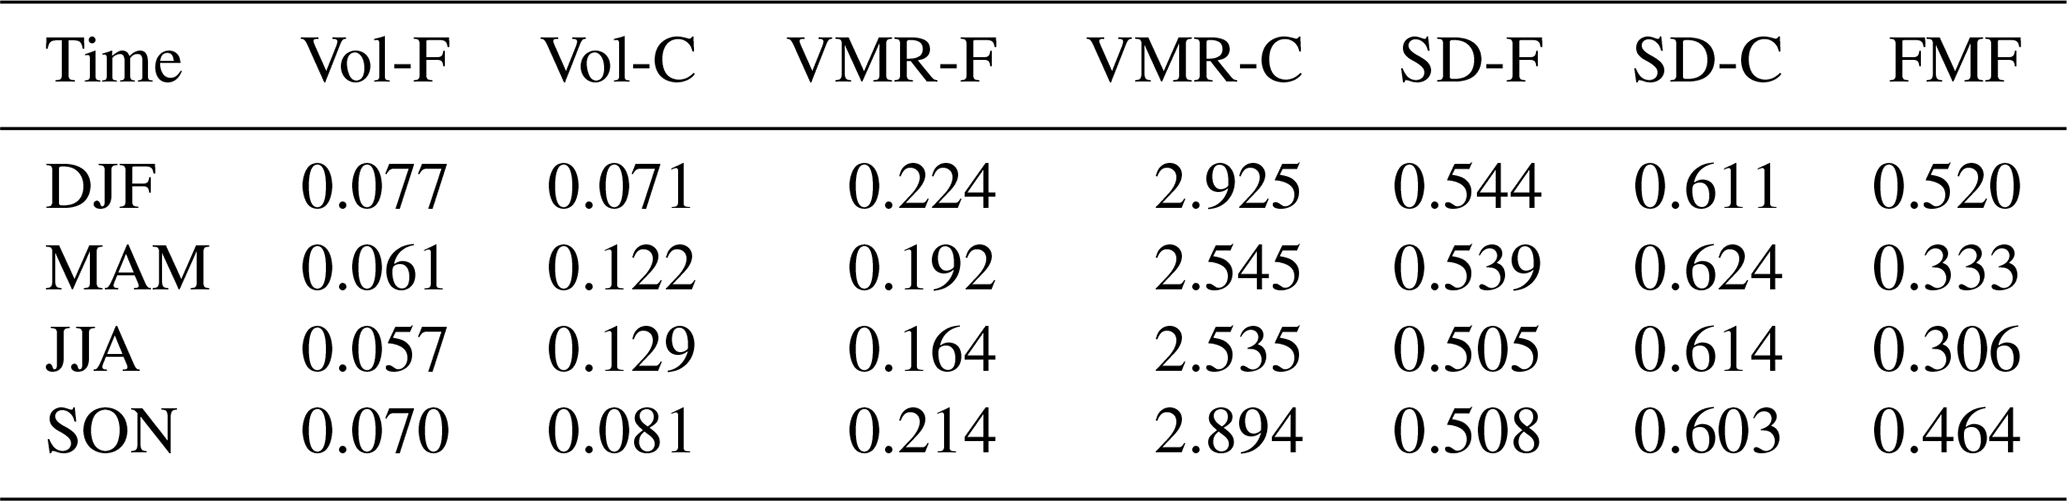
Table 3Particle volume size distribution parameters clustering results of BAs in different seasons. Vol-m, VMR-m, and SD-m (m = F, C; F = Fine mode, C = Coarse mode) represent particle volume concentration, volume median radius, and standard deviation, respectively.
We used the (Bond and Bergstrom, 2006). As regards RIBAs, we obtained them from AERONET based on K-means cluster method (Russell et al., 2014). In AERONET V3 daily product, we used the following criteria to remove strong absorbing fine aerosol particles data before clustering: (1) at a wavelength of 440 nm, many aerosol particles exhibit strong absorption, making it challenging to separate strongly absorbing BC particles. However, BC still exhibits strong absorption in the 675–1020 nm range, and this characteristic can be leveraged to effectively isolate strongly absorbing fine particles (Bond et al., 2013), so we choose to remove the data with SSA (675–1020 nm) < 0.85 and Fine mode fraction (FMF) > 0.4; (2) in some biomass combustion and industrial cases, SSA values range from 0.85 to 0.95 (Dubovik et al., 2002). In order to reduce the impact of BC aerosols on classification, fine particles whose SSA decreases with wavelength climbing (Ångström Exponent, AE > 1.5) are also removed. Figure 3 shows the particle volume size distribution and SSA of BAs at different times. It can be observed that during spring and summer, the volume concentration of coarse-mode particles is higher in BAs, which is associated with the frequent occurrence of dust aerosols from North Africa during from March to June every year (Meloni et al., 2008). Moreover, the changes in SSA across different seasons are quite pronounced, with the absorption of fine aerosol particles being higher in winter. Using data from all seasons for clustering could introduce significant errors in the estimation of BAs. Therefore, this study clustered the AERONET data by season to obtain accurate seasonal variations in the physical properties of BAs. Tables 2 and 3 show RI clustering results and particle volume size distribution parameters clustering results of BAs in different seasons.
In the 6SV2.1 model, we need to input aerosol mixture RI and particle volume size distribution. The particle volume size distribution equation is as follows (Dubovik and King, 2000):
In Eq. (6), i represents components, including BC, fine BAs, and Coarse BAs; r represents particle radius; Ci, σi, and rm,j represent particles volume concentration, standard deviation, and volume median radius of different components, respectively. Particles volume size distribution parameters for BAs have been shown in Table 3. For BC, µm and σBC=1.80 µm (Ganguly et al., 2009). Because the Ctotal is normalization parameter, Ci is equal to the volume fraction of each component.
3.3 Inverse method
After geometric correction of the MODIS L1B data, the water vapor and ozone data of MERRA-2 were used to correct the gas absorption of the band (Xie et al., 2020). Considering that at 0.47 µm, there is strong absorption by other particles (like BrC et al.) besides BC absorption (Chung et al., 2012), this study used the band of 0.66 and 2.12 µm for inversion. The cloud mask algorithm used multiple wavelengths from visible to near-infrared for cloud identification (Xue et al., 2014). Then we used the 6SV2.1 to build LUT based on mixture aerosol optical properties. Since the fraction of BC in mixture aerosol particles generally does not exceed 6 % (Bao et al., 2020), when generating the LUT, the value of fBC is from 0 to 0.06, and the step size is 0.01. In the retrieval process, we used DT AOD to input for finding optimal results, the cost function is as follows:
where j represents 2 band (0.66 and 2.12 µm), and are calculated surface reflectance and surface reflectance generated by DT algorithm, respectively.
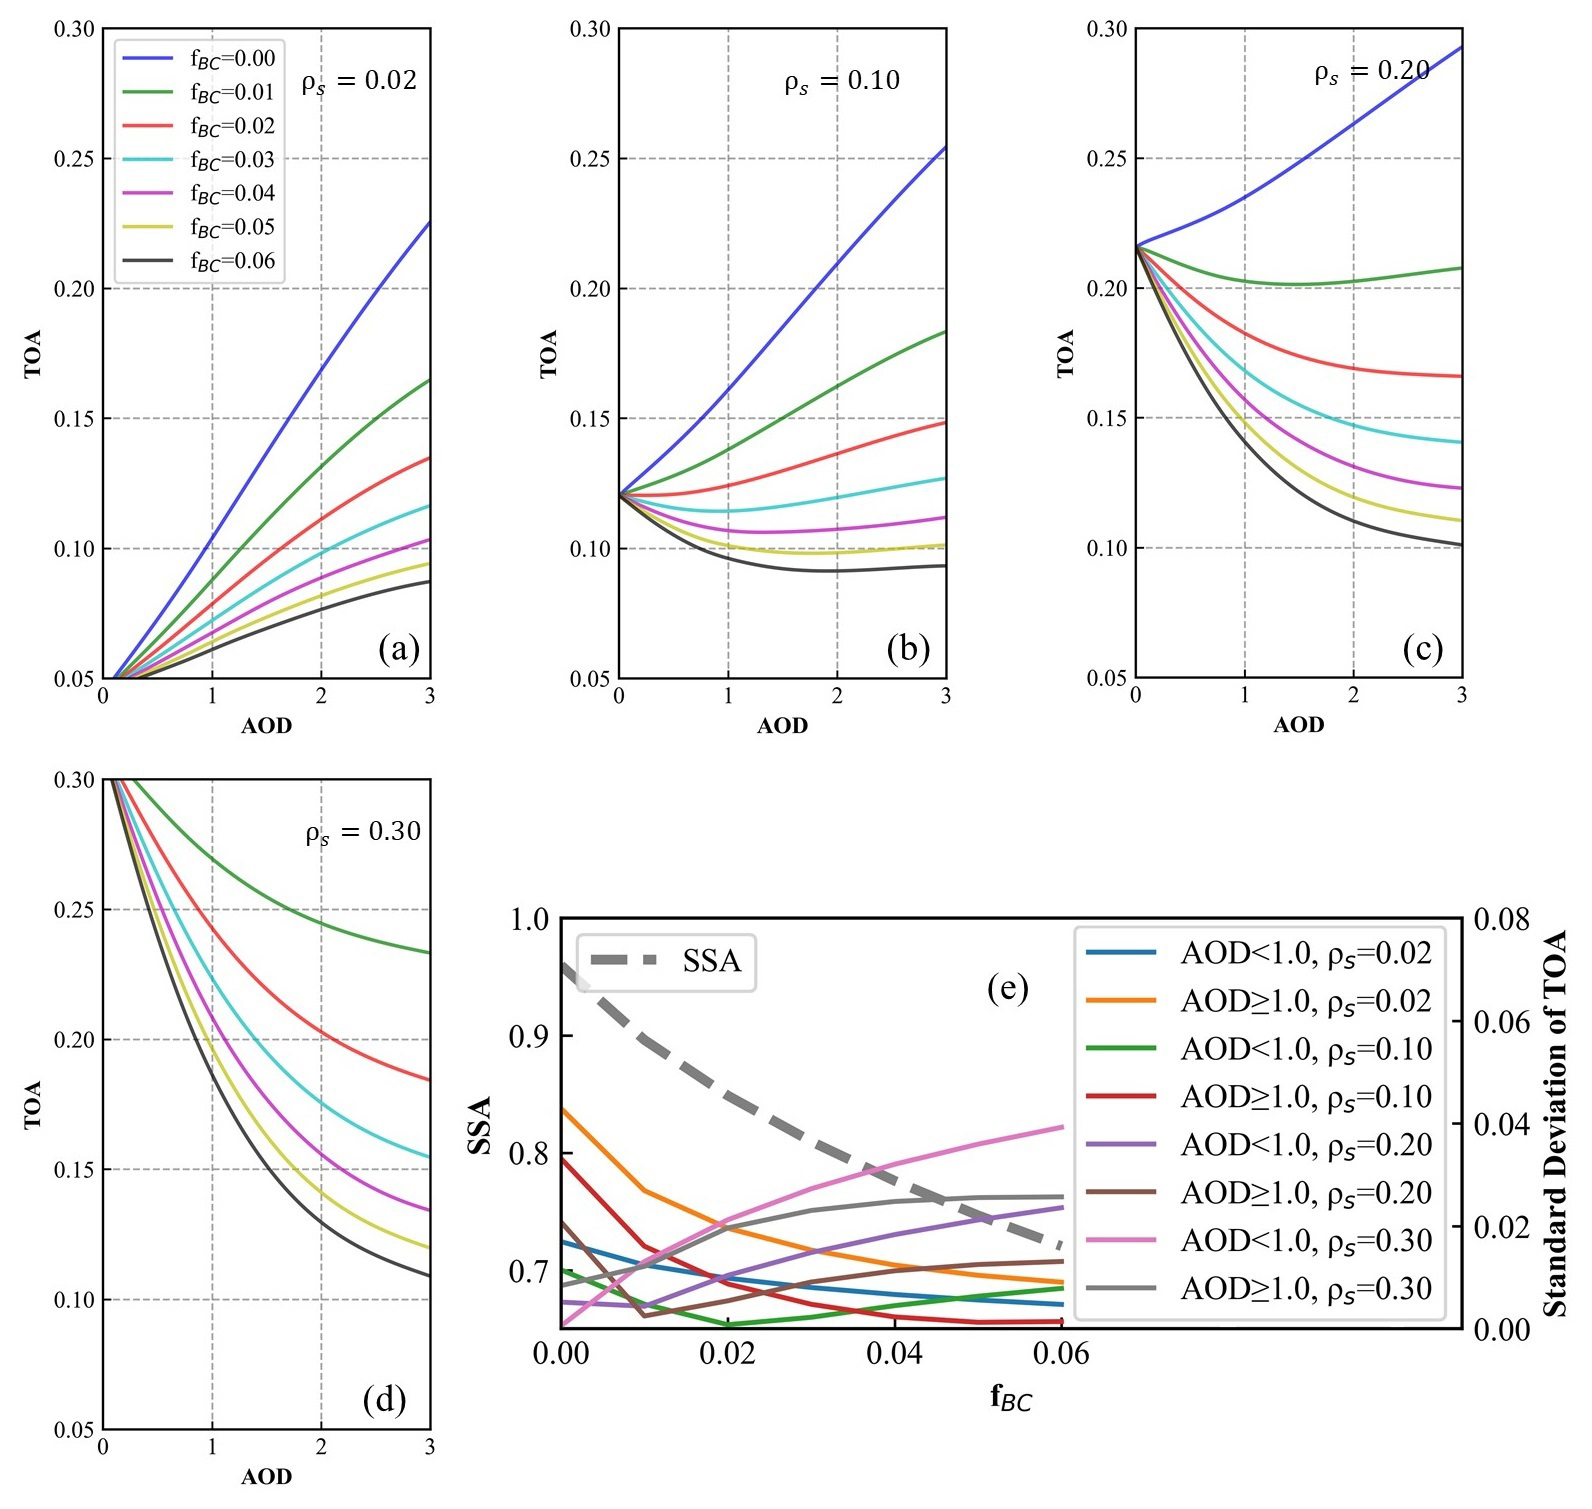
Figure 5Sensitivity analysis of BC inversion based on 6SV2.1 model. Panels (a)–(d) represent the ρs at 0.66 µm variation step sizes, which are 0.02, 0.10, 0.20, and 0.30, respectively. Panel (e) represents SSA and Standard deviation of TOA changes in different fBC.
Once the fBC is obtained, the BC column concentration can be calculated according to the following equation:
In Eq. (8), ρBC=1.0 g cm−3 (Ganguly et al., 2009), represents mass density of BC particles. CBAs is the integral of the volume size distribution of BAs obtained from AERONET clustering.
Since AE33 measures BC surface concentration (BCsurface), the inverted BCcolumn needs to be converted. Previous studies assumed that BC was continuous uniform distribution below the atmospheric boundary layer, and directly divided BCcolumn by the boundary layer height to obtain BCsurface (Li et al., 2020; Bao et al., 2019). However, it is well known that the vertical distribution of BC is not uniform (Yuan et al., 2022), so this study used MERRA-2 data to obtain the ratio K at each pixel to improve the accuracy of the conversion. The conversion equation is as follows:
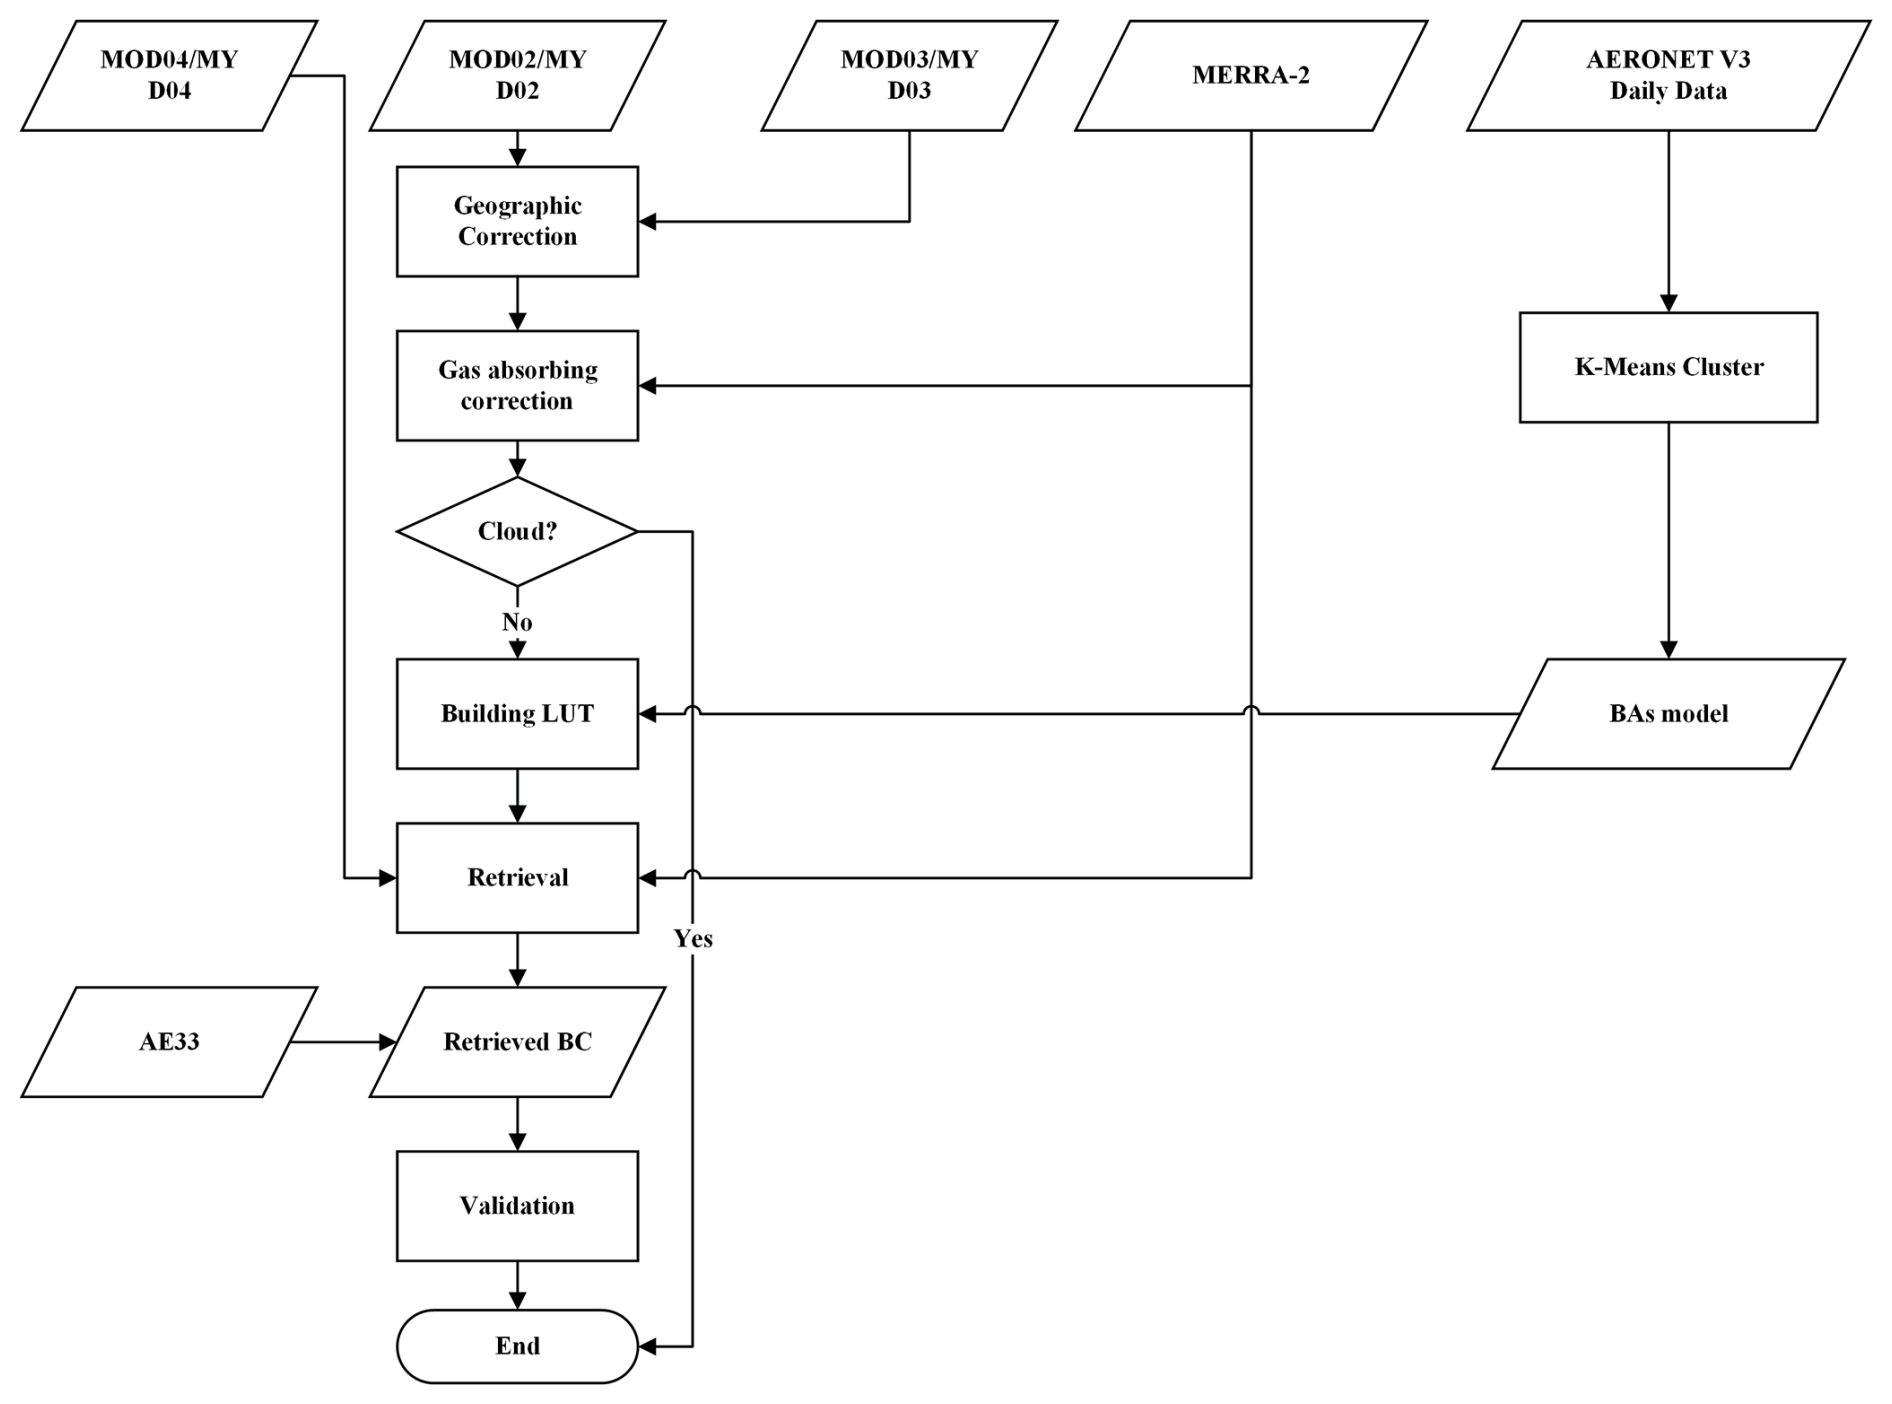
The overall inversion process is shown in Fig. 4.
3.4 Model sensitivity analysis
Based on the aerosol model physical properties obtained above, we took the aerosol model in the DJF period as an example to conduct sensitivity analysis on 6SV2.1. The solar zenith angle, satellite zenith angle and relative azimuth angle are 30, 30 and 12° respectively, and the surface reflectance of 0.66 µm change steps are 0.02, 0.10, 0.20, and 0.30. The relevant results are shown in Fig. 5.
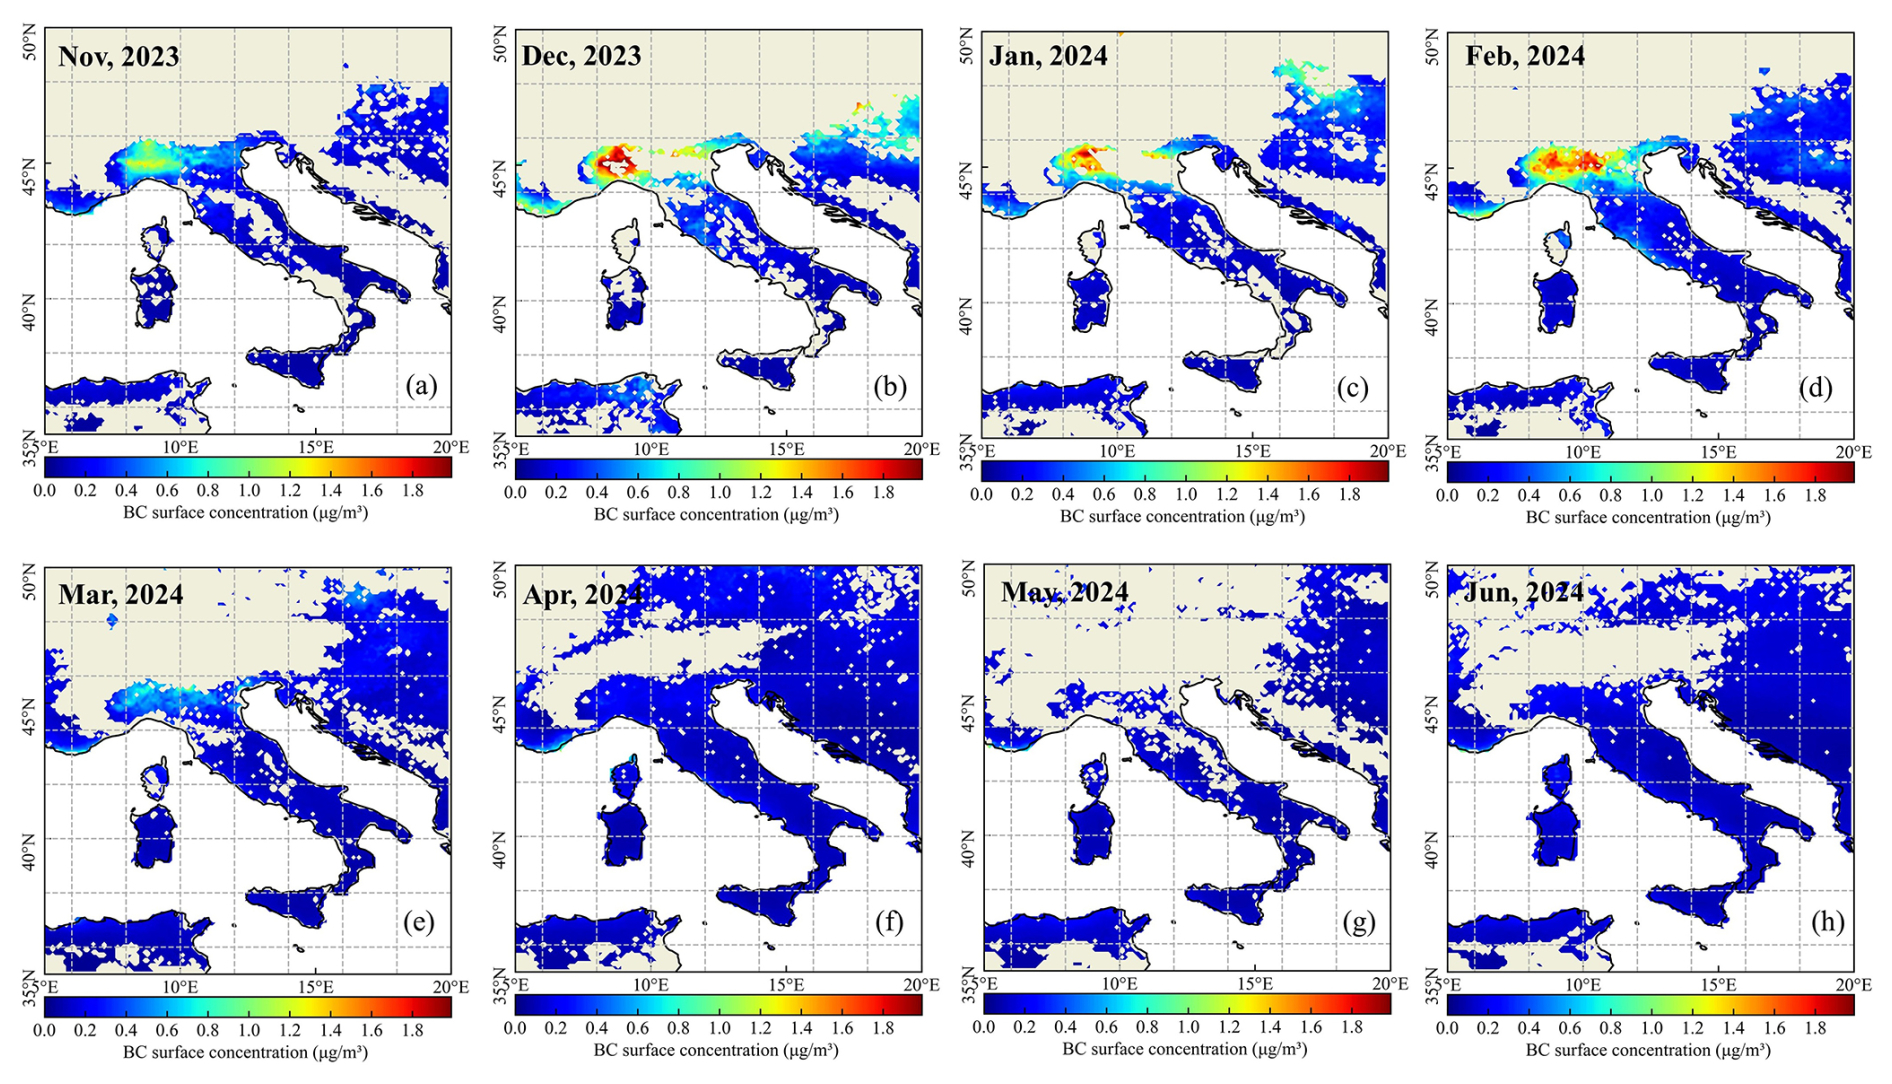
Figure 6Maps of monthly BC surface concentration distribution. Panels (a)–(h) respectively represent from November 2023 to June 2024.
As shown in Fig. 5a–d, the sensitivity analysis results indicate that as AOD increases, the estimated TOA standard deviation under different surface conditions gradually increases, suggesting that the theoretical inversion accuracy is higher under high aerosol loading conditions. However, when ρs=0.10 and the aerosol loading is high (AOD > 1.0), if the BC fraction is high (fBC≥0.04), the TOA will basically not change with the increase of AOD, which will lead to an unsatisfactory inversion effect under such conditions. In Fig. 5e, as the BC fraction increases, the SSA, which is independent of aerosol load, decreases notably, suggesting that BC content has a substantial impact on the overall aerosol absorption properties. Additionally, under low fBC conditions, the standard deviation of the estimated TOA for dark surfaces is higher, while under high fBC conditions, the standard deviation of the estimated TOA for bright surfaces is higher. This indicates that bright surfaces are more sensitive to absorbing aerosols and are more conducive to estimating strongly absorbing BC particles.
4.1 Inverse results
Figure 6 shows the monthly variations in MODIS BC surface concentration from November 2023 to June 2024. It is evident that in the regions surrounding northern Italy, the BC concentration exhibits a pattern of first increasing and then decreasing from November 2023 to March 2024, with emission levels significantly higher than in other areas. This trend is likely related to the region's high population density, developed industry, and low temperatures, which hinder the timely dispersion of emitted BC. Additionally, the presence of the northern and western Alps as well as the southern Apennine Mountains determines weak wind conditions and frequent temperature retrogrades, which hinder atmospheric diffusion and trap pollution on the ground (Renna et al., 2024). From April to June, the overall BC concentration in the study area remains at a relatively low level.
4.2 Validation
To specifically compare the differences between MODIS BC and AE33 BC, this study employed a spatio-temporal matching method. For MODIS, the average value of valid pixel data within a 50 km radius centered on the location of the ground station was used. For AE33, the average value was calculated from the data within 1 h before and after the satellite's transit time (Remer et al., 2005). Figure 7 presents a comparison of the trend changes in the observed valid values of MODIS BC and AE33 BC from November 2023 to June 2024 at three AE33 stations (ISAC Bologna II, Marseille Longchamp, and Milano Pascal) located in high BC emission areas. It is evident that the fluctuation trends of MODIS BC and AE33 BC are generally consistent, although MODIS BC tends to be lower than AE33 BC most of the time. Therefore, the inversion results based on this algorithm can accurately capture the spatiotemporal variations of BC in high-emission areas.
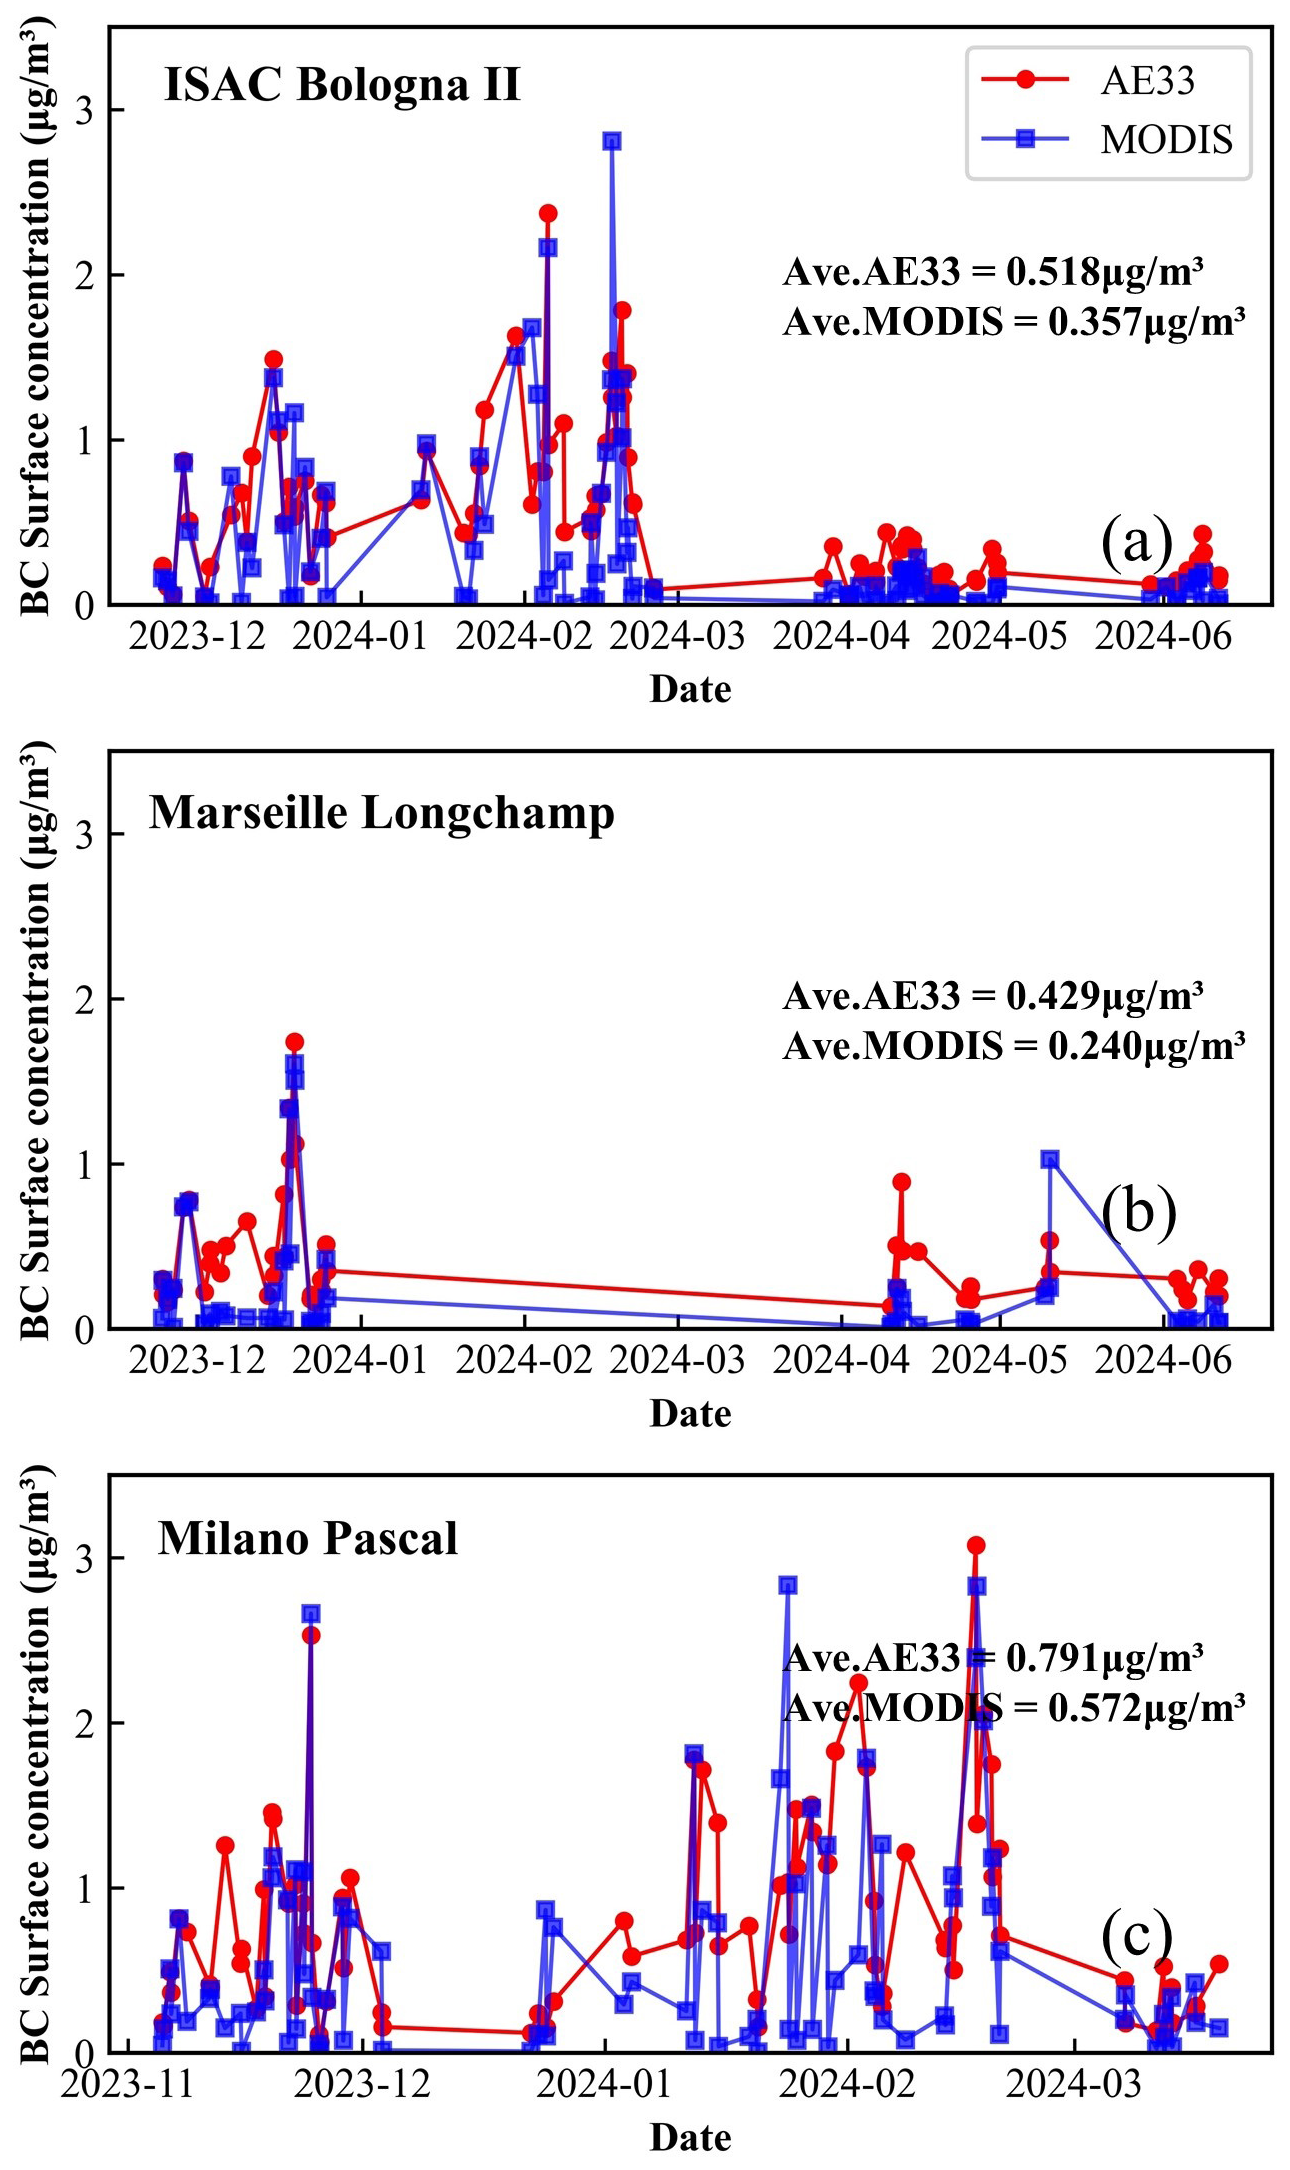
Figure 7Comparison of consistency changes between MODIS BC and AE33 BC. Panels (a), (b), and (c) represent ISAC Bologna II, Marseille Longchamp, and Milano Pascal, respectively.
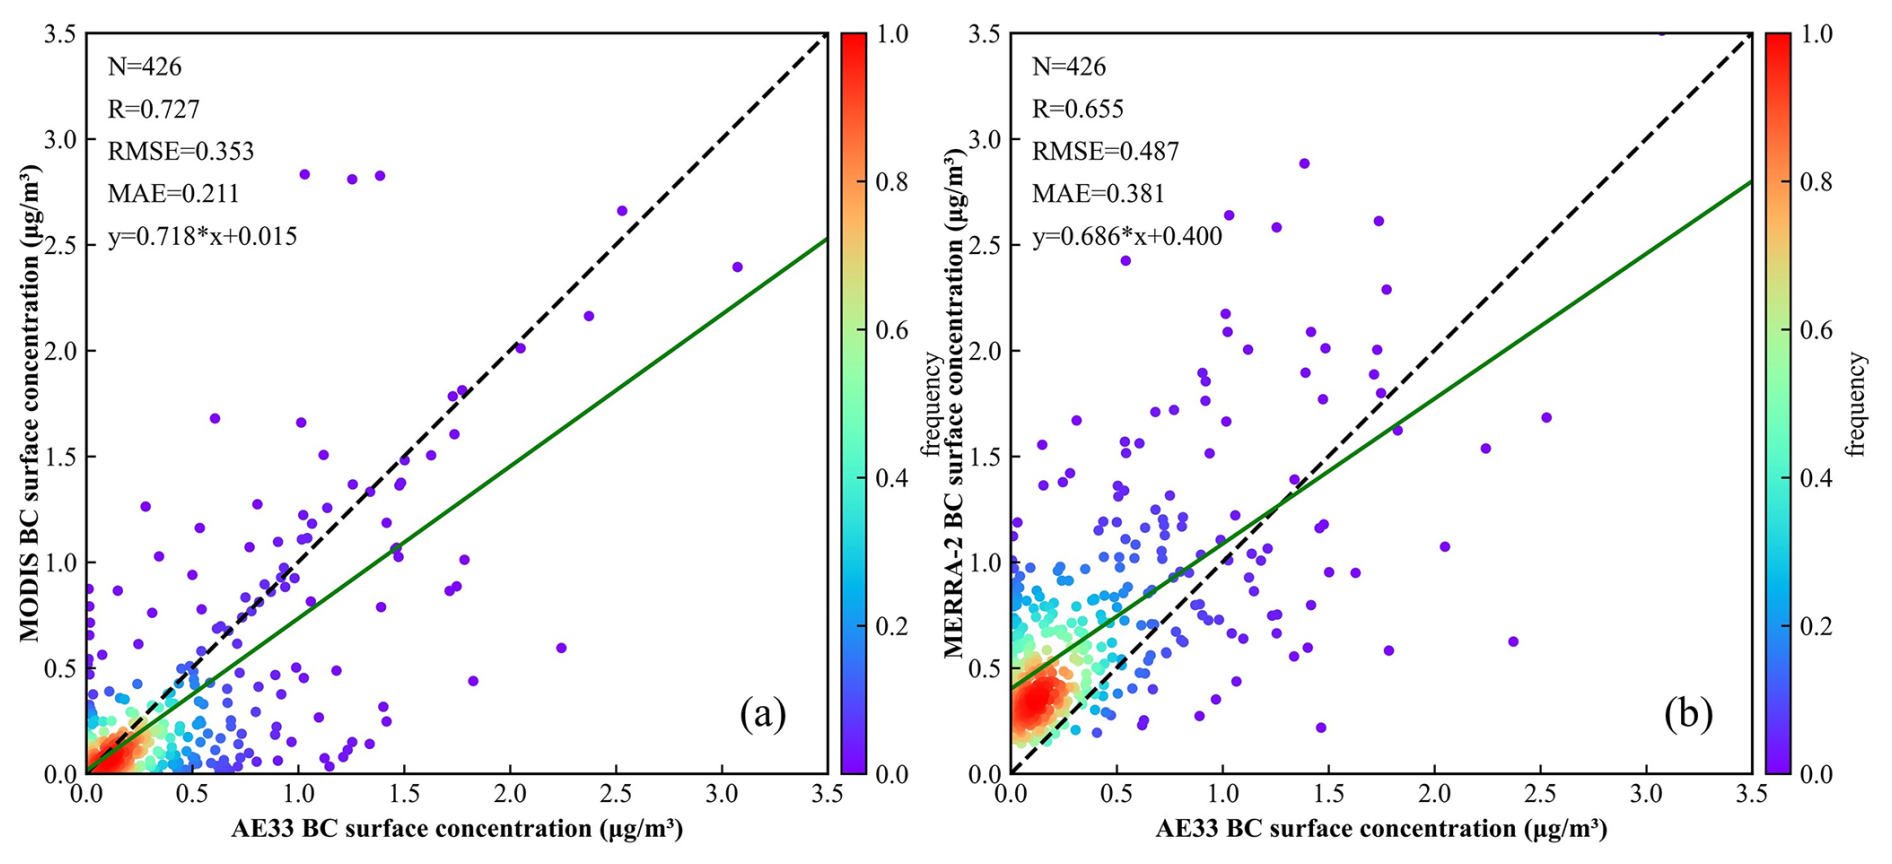
Figure 8Scatter plot of MODIS BC and AE33 versus MERRA-2 BC and AE33. Panels (a) and (b) represent MODIS BC and MERRA-2 BC, respectively. The black dashed line and the green solid line represent the 1 : 1 line and the linear regression function respectively.
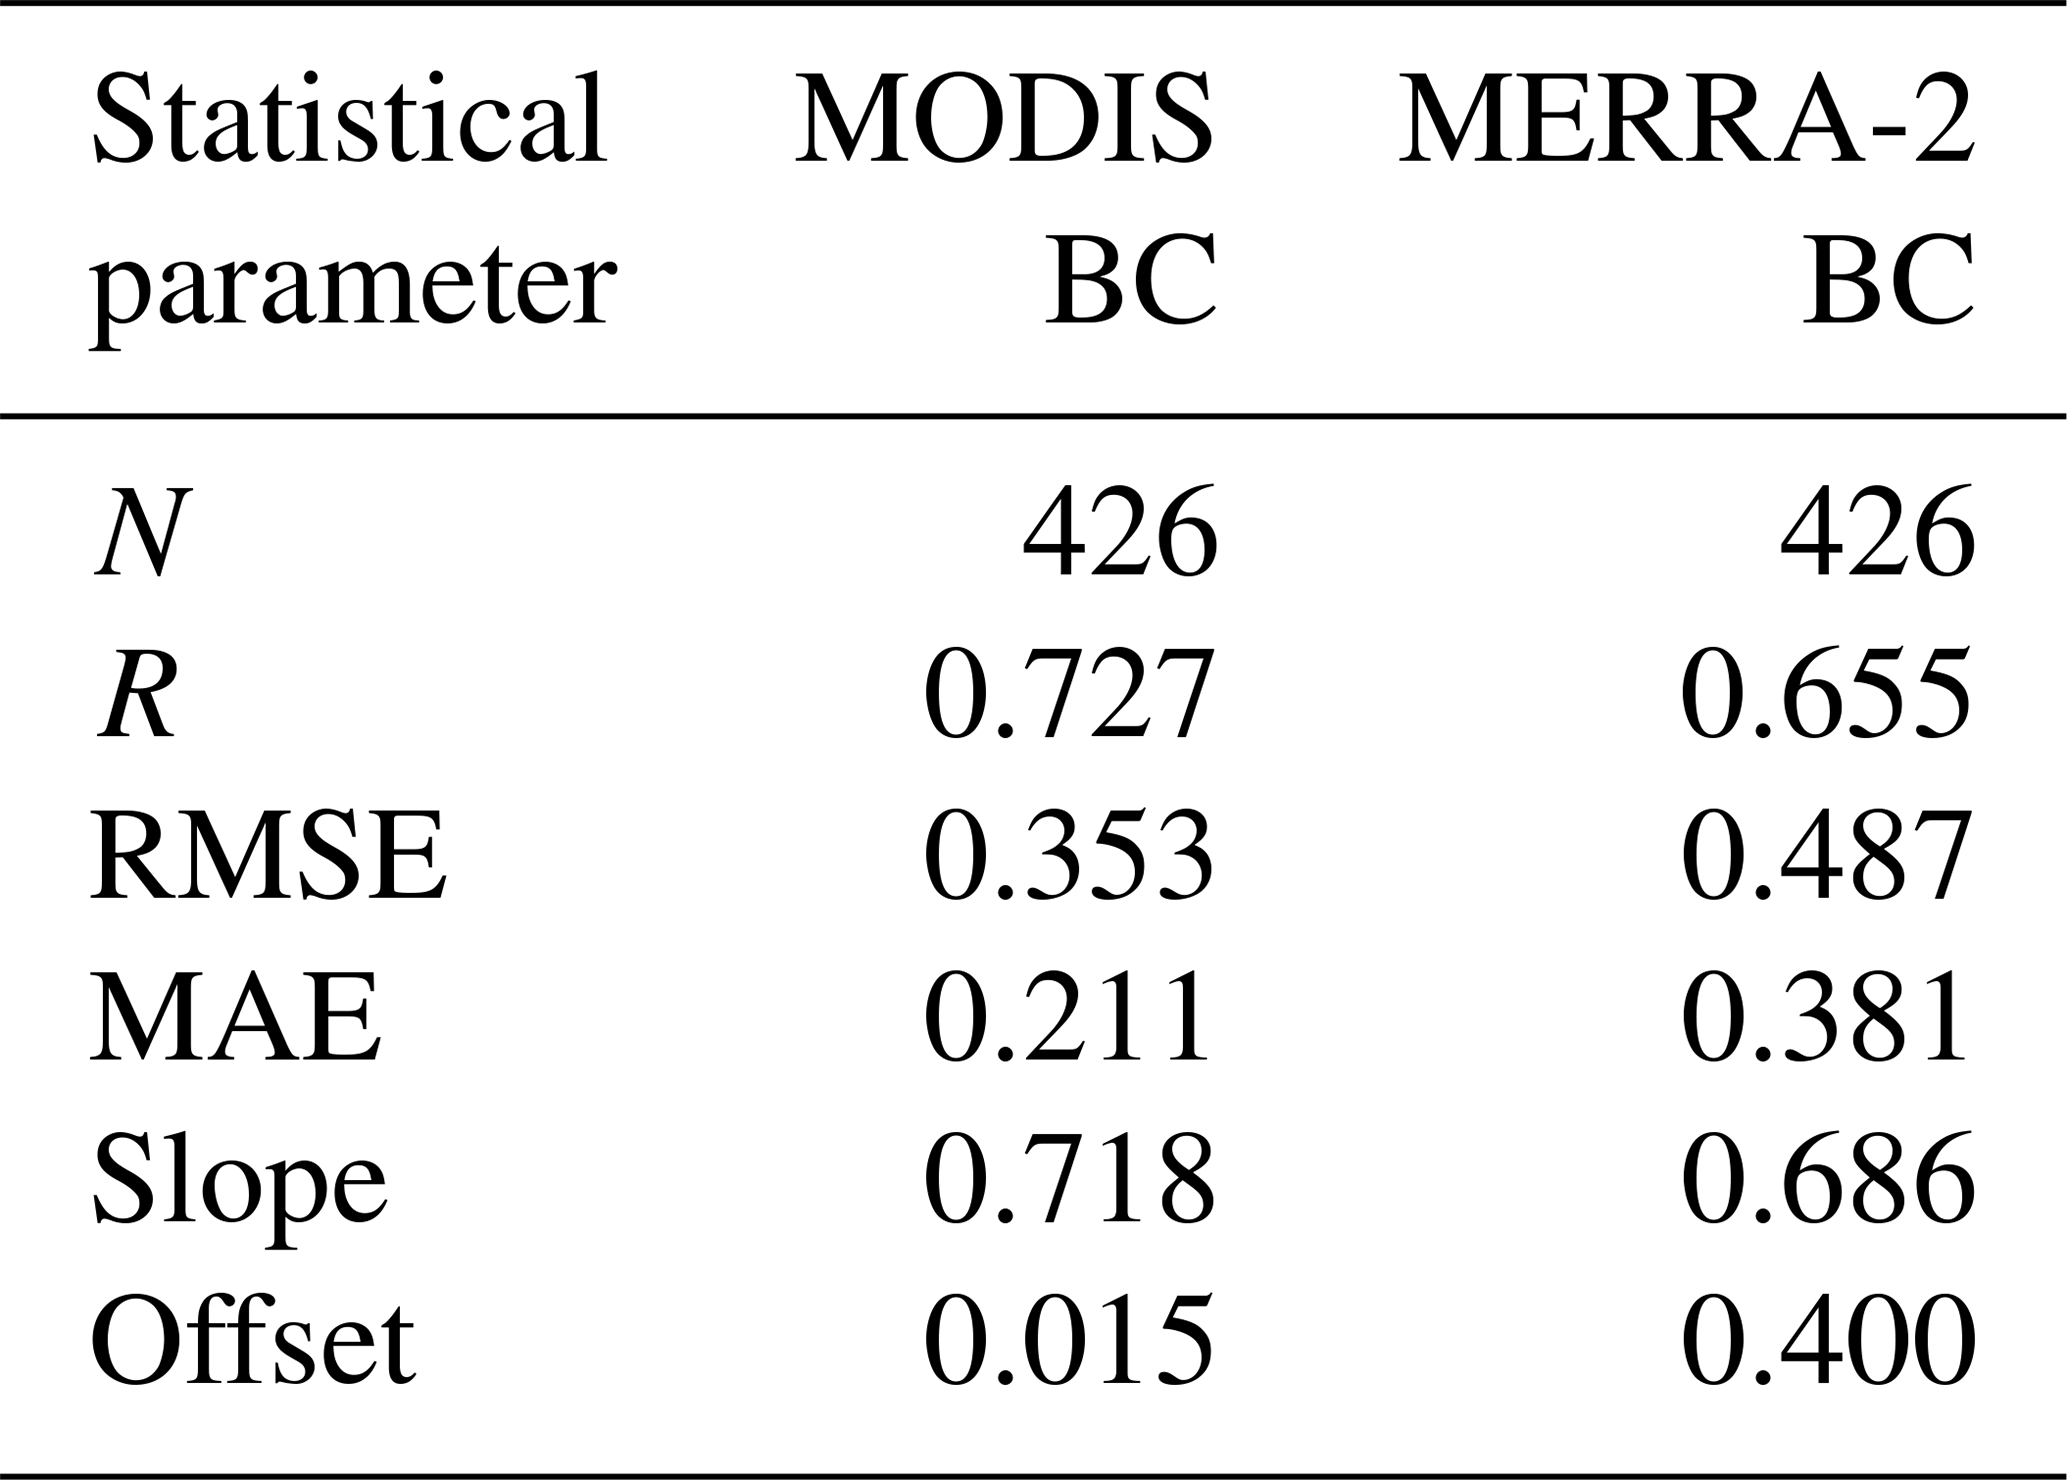
Figure 8a presents a scatter plot of all valid values between MODIS BC and the six AE33 BC sites located in the study area from November 2023 to June 2024, used to quantitatively evaluate the accuracy of the algorithm. Additionally, Fig. 8b shows the BC surface concentration verification accuracy of MERRA-2 for comparison. Statistical parameters include the total number of matching points (N), correlation coefficient (R), root mean square error (RMSE), mean absolute error (MAE), and linear fitting function (Jiang et al., 2024). The corresponding accuracy validation results are summarized in Table 4. The correlation coefficient (R) for MODIS BC is 0.727, while for MERRA-2 BC it is 0.655, indicating that our algorithm performs better in terms of relevance. The RMSE for MODIS BC is 0.353, compared to 0.487 for MERRA-2 BC, and the MAE for MODIS BC is 0.211, whereas for MERRA-2 BC it is 0.381. These results suggest that the numerical difference between MODIS BC and AE33 is smaller, indicating better accuracy for MODIS BC. From the perspective of linear regression and scatter point density, MERRA-2 tends to overestimate the surface concentration of BC, while MODIS BC shows the opposite trend. This may be related to the MG-EMA model only considers BC internal mixing state, but there may still be a small amount of fresh and exposed BC externally mixed in the atmosphere (China et al., 2013), which may result in an underestimate of BC.
4.3 Uncertainty analysis
Figure 9 analyzes the influence of AOD and surface reflectance on the Bias (MODIS–AE33) of the retrieved BC surface concentration. The results reveal that the BC bias exhibits different patterns of change. As shown in Fig. 9a, when AOD is low, the uncertainty of the bias is high, but as AOD increases, the bias decreases. When AOD > 0.75, the overall bias approaches zero, and the uncertainty becomes very low. This trend aligns with the conclusion in Sect. 3.4, where the retrieval accuracy improves under high AOD conditions due to the stronger aerosol signal. In Fig. 9b, the uncertainty of the bias gradually increases as surface reflectance rises. When ρs > 0.08, the uncertainty of the bias increases significantly, suggesting that the algorithm's applicability in relatively high surface reflectance areas still needs improvement. However, it is worth noting that due to the lack of data from AE33 stations in high brightness areas (ρs≥0.2), the surface reflectance of the AE33 stations in this study is below 0.12, and when ρs > 0.1, the data also is insufficient. Therefore, uncertainty analysis confirms that this retrieval algorithm has better performance under high AOD conditions. However, due to the lack of ground-based AE33 observation data in high-brightness surface areas, the accuracy under this surface condition still lacks effective validation.
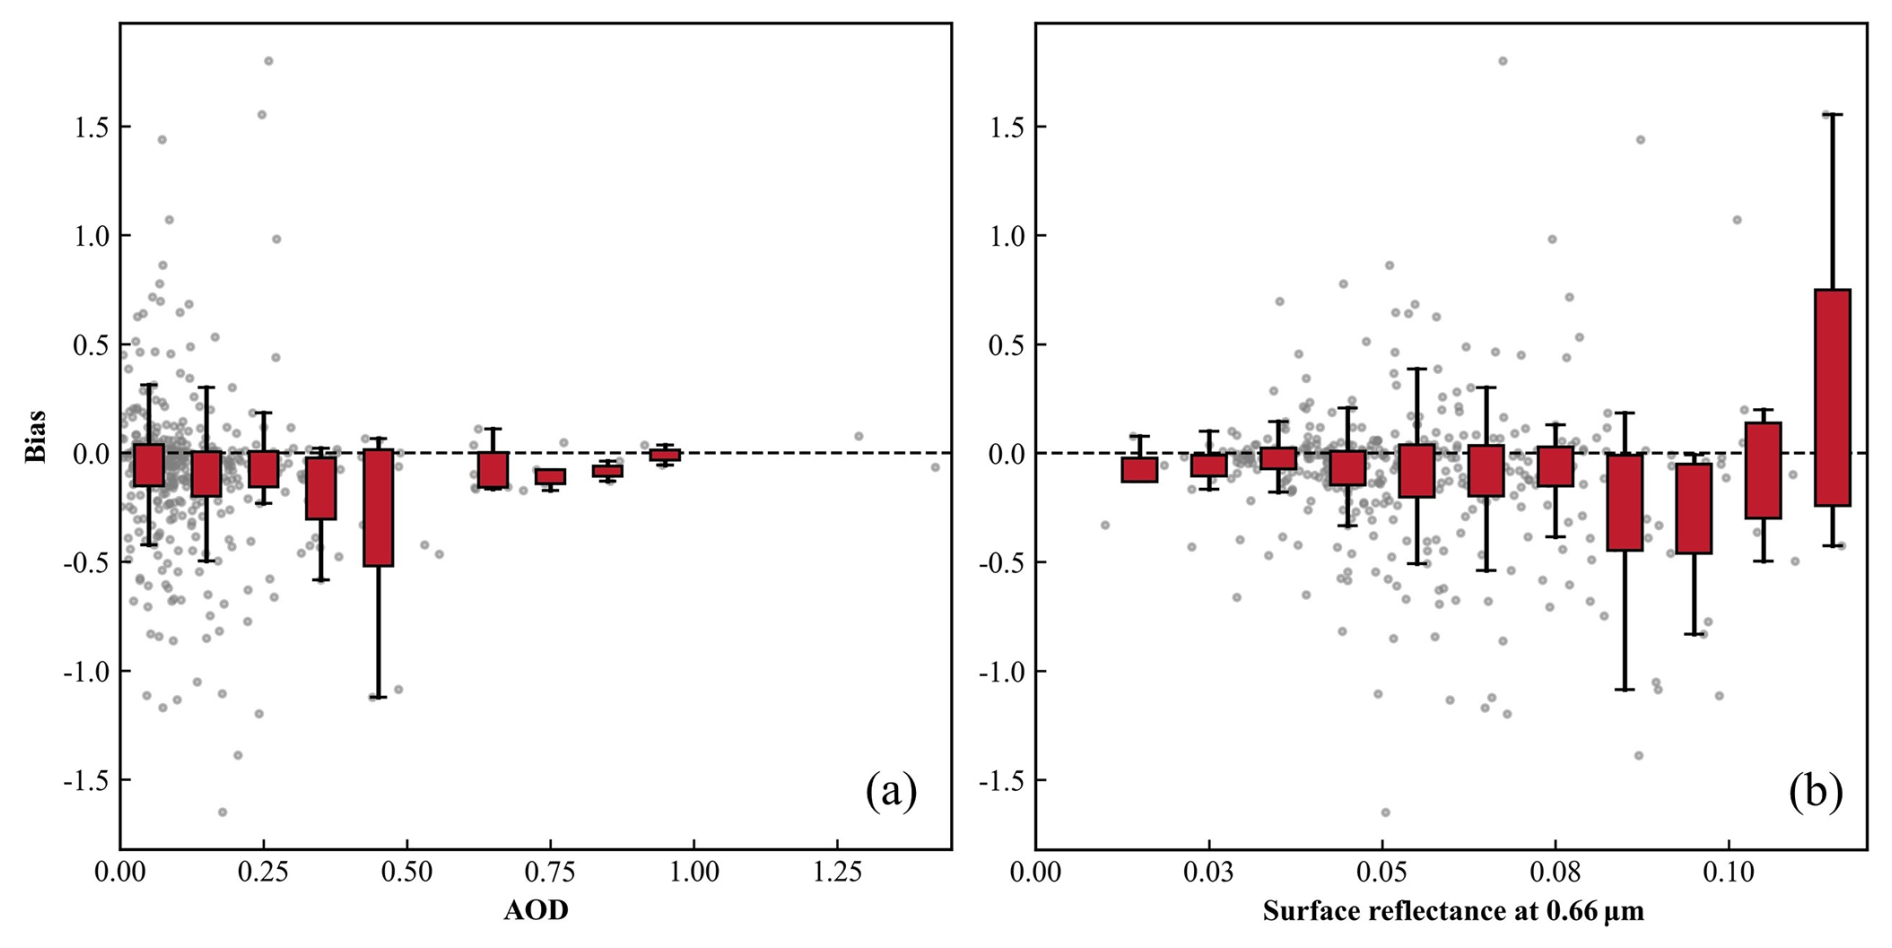
Figure 9The box plot of BC surface concentration Bias (MODIS–AE33) independence analysis on the (a) AOD and (b) surface reflectance. The red box represents the interquartile range (IQR, 25th–75th percentiles), and the black whiskers extend to the most extreme data points within 1.5 × IQR from the quartiles.
In this paper, we proposed a new algorithm for retrieving BC surface concentrations based on joint MODIS and AERONET data. First, the algorithm derived the optical properties of internally mixed BAs for each season from the AERONET V3 daily product. It used the particle volume size distribution and MG-MEA approximation equation to calculate the RI and volume concentration of the internal mixed aerosol, which were the 6SV2.1 input data of the aerosol model. Then, the sensitivity analysis was conducted for AOD, surface reflectance, and BC fraction. During the inversion process, multiple LUTs were established based on different BC fraction, and DT AOD values were inputted to iteratively find the optimal fBC. Next, the BC column concentration and surface concentration values generated by MERRA-2 were used to convert the inverted BC column concentration to surface concentration. Finally, the retrieved BC surface concentrations were validated against AE33 observation data. The BC surface concentrations obtained by this algorithm show relatively high reliability and accuracy (R = 0.727, RMSE = 0.353, MAE = 0.211), though there is a slight overall underestimation compared to high-precision ground-based in-situ measurements. This might be due to a small number of BC particles being exposed on the outside of the shell, which led to the failure to estimate the relevant aspect. Additionally, uncertainty analysis of the inversion results indicates that the algorithm is more suitable for high AOD conditions. However, since there is no AE33 site data in the bright surface area, the performance of the inversion results on the bright surface still needs further verification. Therefore, future work will focus on improving the algorithm's performance low aerosol loading conditions and evaluating inversion results accuracy in bright surface.
All the research data used in this paper are open access data, and can be freely downloaded from the websites listed in the Sect. 2. For BC retrieval results, please contact the corresponding author (yxue@cumt.edu.cn) at the China University of Mining and Technology.
XJ, SW, and PL downloaded the research data; XJ and YX provided retrieval method; XJ wrote the code and manuscript draft; YX and MC reviewed and edited the manuscript.
The contact author has declared that none of the authors has any competing interests.
Publisher's note: Copernicus Publications remains neutral with regard to jurisdictional claims made in the text, published maps, institutional affiliations, or any other geographical representation in this paper. While Copernicus Publications makes every effort to include appropriate place names, the final responsibility lies with the authors. Also, please note that this paper has not received English language copy-editing. Views expressed in the text are those of the authors and do not necessarily reflect the views of the publisher.
The authors gratefully acknowledge the NASA teams for providing MODIS, AERONET, and MERRA-2 data, and the EBAS group in the Norwegian Institute for Air Research for delivering an open-access AE33 BC surface concentration database.
This research has been supported by the National Natural Science Foundation of China, General Program (grant no. 42275147) and the China Scholarship Council, Chinese Government Scholarship (grant no. 202306420061).
This paper was edited by Omar Torres and reviewed by two anonymous referees.
Bao, F., Cheng, T., Li, Y., Gu, X., Guo, H., Wu, Y., Wang, Y., and Gao, J.: Retrieval of black carbon aerosol surface concentration using satellite remote sensing observations, Remote Sens. Environ., 226, 93–108, https://doi.org/10.1016/j.rse.2019.03.036, 2019.
Bao, F., Li, Y., Cheng, T., Gao, J., and Yuan, S.: Estimating the Columnar Concentrations of Black Carbon Aerosols in China Using MODIS Products, Environ. Sci. Technol., 54, 11025–11036, https://doi.org/10.1021/acs.est.0c00816, 2020.
Bao, F., Li, Y., and Gao, J.: Carbonaceous aerosols remote sensing from geostationary satellite observation, Part I: Algorithm development using critical reflectance, Remote Sens. Environ., 287, 113459, https://doi.org/10.1016/j.rse.2023.113459, 2023.
Bond, T. C. and Bergstrom, R. W.: Light absorption by carbonaceous particles: An investigative review, Aerosol Sci. Technol., 40, 27–67, https://doi.org/10.1080/02786820500421521, 2006.
Bond, T. C., Doherty, S. J., Fahey, D. W., Forster, P. M., Berntsen, T., DeAngelo, B. J., Flanner, M. G., Ghan, S., Kärcher, B., and Koch, D.: Bounding the role of black carbon in the climate system: A scientific assessment, J. Geophys. Res.-Atmos., 118, 5380–5552, https://doi.org/10.1002/jgrd.50171, 2013.
Brodowski, S., Amelung, W., Haumaier, L., Abetz, C., and Zech, W.: Morphological and chemical properties of black carbon in physical soil fractions as revealed by scanning electron microscopy and energy-dispersive X-ray spectroscopy, Geoderma, 128, 116–129, https://doi.org/10.1016/j.geoderma.2004.12.019, 2005.
Cai, J., Ge, Y., Li, H., Yang, C., Liu, C., Meng, X., Wang, W., Niu, C., Kan, L., and Schikowski, T.: Application of land use regression to assess exposure and identify potential sources in PM2.5, BC, NO2 concentrations, Atmos. Environ., 223, 117267, https://doi.org/10.1016/j.atmosenv.2020.117267, 2020.
Cao, J. J., Lee, S. C., Chow, J. C., Watson, J. G., Ho, K. F., Zhang, R. J., Jin, Z. D., Shen, Z. X., Chen, G. C., Kang, Y. M., Zou, S. C., Zhang, L. Z., Qi, S. H., Dai, M. H., Cheng, Y., and Hu, K.: Spatial and seasonal distributions of carbonaceous aerosols over China, J. Geophys. Res.-Atmos., 112, https://doi.org/10.1029/2006JD008205, 2007.
China, S., Mazzoleni, C., Gorkowski, K., Aiken, A. C., and Dubey, M. K.: Morphology and mixing state of individual freshly emitted wildfire carbonaceous particles, Nat. Commun., 4, 2122, https://doi.org/10.1038/ncomms3122, 2013.
Choi, M., Lyapustin, A., Schuster, G. L., Go, S., Wang, Y., Korkin, S., Kahn, R., Reid, J. S., Hyer, E. J., Eck, T. F., Chin, M., Diner, D. J., Kalashnikova, O., Dubovik, O., Kim, J., and Moosmüller, H.: Light-absorbing black carbon and brown carbon components of smoke aerosol from DSCOVR EPIC measurements over North America and central Africa, Atmos. Chem. Phys., 24, 10543–10565, https://doi.org/10.5194/acp-24-10543-2024, 2024.
Chung, C. E., Ramanathan, V., and Decremer, D.: Observationally constrained estimates of carbonaceous aerosol radiative forcing, Proc. Natl. Acad. Sci. USA, 109, 11624–11629, https://doi.org/10.1073/pnas.1203707109, 2012.
Dubovik, O. and King, M. D.: A flexible inversion algorithm for retrieval of aerosol optical properties from Sun and sky radiance measurements, J. Geophys. Res.-Atmos., 105, 20673–20696, https://doi.org/10.1029/2000jd900282, 2000.
Dubovik, O., Smirnov, A., Holben, B. N., King, M. D., Kaufman, Y. J., Eck, T. F., and Slutsker, I.: Accuracy assessments of aerosol optical properties retrieved from Aerosol Robotic Network (AERONET) Sun and sky radiance measurements, J. Geophys. Res.-Atmos., 105, 9791–9806, https://doi.org/10.1029/2000jd900040, 2000.
Dubovik, O., Holben, B., Eck, T. F., Smirnov, A., Kaufman, Y. J., King, M. D., Tanré, D., and Slutsker, I.: Variability of absorption and optical properties of key aerosol types observed in worldwide locations, J. Atmos. Sci., 59, 590–608, https://doi.org/10.1175/1520-0469(2002)059<0590:Voaaop>2.0.Co;2, 2002.
Dubovik, O., Herman, M., Holdak, A., Lapyonok, T., Tanré, D., Deuzé, J. L., Ducos, F., Sinyuk, A., and Lopatin, A.: Statistically optimized inversion algorithm for enhanced retrieval of aerosol properties from spectral multi-angle polarimetric satellite observations, Atmos. Meas. Tech., 4, 975–1018, https://doi.org/10.5194/amt-4-975-2011, 2011.
Everett, J. T., Newton, E. N., and Odum, M. M.: A review of progress in constraining global black carbon climate effects, Earth Syst. Environ., 6, 771–785, https://doi.org/10.1007/s41748-022-00313-1, 2022.
Flanner, M. G.: Arctic climate sensitivity to local black carbon, J. Geophys. Res.-Atmos., 118, 1840–1851, https://doi.org/10.1002/jgrd.50176, 2013.
Ganguly, D., Ginoux, P., Ramaswamy, V., Dubovik, O., Welton, J., Reid, E., and Holben, B.: Inferring the composition and concentration of aerosols by combining AERONET and MPLNET data: Comparison with other measurements and utilization to evaluate GCM output, J. Geophys. Res.-Atmos., 114, https://doi.org/10.1029/2009JD011895, 2009.
Gelaro, R., McCarty, W., Suárez, M. J., Todling, R., Molod, A., Takacs, L., Randles, C. A., Darmenov, A., Bosilovich, M. G., and Reichle, R.: The modern-era retrospective analysis for research and applications, version 2 (MERRA-2), J. Clim., 30, 5419–5454, https://doi.org/10.1175/JCLI-D-16-0758.1, 2017.
Guo, Q., Zhang, K., Wang, B., Cao, S., Xue, T., Zhang, Q., Tian, H., Fu, P., Zhang, J. J., and Duan, X.: Chemical constituents of ambient fine particulate matter and obesity among school-aged children: A representative national study in China, Sci. Total Environ., 849, 157742, https://doi.org/10.1016/j.scitotenv.2022.157742, 2022.
Jiang, X., Xue, Y., Jin, C., Bai, R., Sun, Y., and Wu, S.: A Simple Band Ratio Library (BRL) Algorithm for Retrieval of Hourly Aerosol Optical Depth Using FY-4A AGRI Geostationary Satellite Data, Remote Sens., 14, 4861, https://doi.org/10.3390/rs14194861, 2022.
Jiang, X., Xue, Y., Calvello, M., Pavese, G., Esposito, F., Pan, Y., Li, Y., Lu, X., Jin, C., and Wu, S.: Geographical coverage analysis and usage suggestions of temporal averaged aerosol optical depth product from GOES-R satellite data, Int. J. Remote Sens., 45, 2407–2423, https://doi.org/10.1080/01431161.2024.2331978, 2024.
Levy, R. C., Mattoo, S., Munchak, L. A., Remer, L. A., Sayer, A. M., Patadia, F., and Hsu, N. C.: The Collection 6 MODIS aerosol products over land and ocean, Atmos. Meas. Tech., 6, 2989–3034, https://doi.org/10.5194/amt-6-2989-2013, 2013.
Li, L., Dubovik, O., Derimian, Y., Schuster, G. L., Lapyonok, T., Litvinov, P., Ducos, F., Fuertes, D., Chen, C., Li, Z., Lopatin, A., Torres, B., and Che, H.: Retrieval of aerosol components directly from satellite and ground-based measurements, Atmos. Chem. Phys., 19, 13409–13443, https://doi.org/10.5194/acp-19-13409-2019, 2019.
Li, L., Che, H., Derimian, Y., Dubovik, O., Schuster, G. L., Chen, C., Li, Q., Wang, Y., Guo, B., and Zhang, X.: Retrievals of fine mode light-absorbing carbonaceous aerosols from POLDER/PARASOL observations over East and South Asia, Remote Sens. Environ., 247, 111913, https://doi.org/10.1016/j.rse.2020.111913, 2020.
Li, L., Che, H., Zhang, X., Chen, C., Chen, X., Gui, K., Liang, Y., Wang, F., Derimian, Y., Fuertes, D., Dubovik, O., Zheng, Y., Zhang, L., Guo, B., Wang, Y., and Zhang, X.: A satellite-measured view of aerosol component content and optical property in a haze-polluted case over North China Plain, Atmos. Res., 266, 105958, https://doi.org/10.1016/j.atmosres.2021.105958, 2022.
Meloni, D., Di Sarra, A., Monteleone, F., Pace, G., Piacentino, S., and Sferlazzo, D.: Seasonal transport patterns of intense Saharan dust events at the Mediterranean island of Lampedusa, Atmos. Res., 88, 134–148, https://doi.org/10.1016/j.atmosres.2007.10.007, 2008.
Pavese, G., Calvello, M., Castagna, J., and Esposito, F.: Black carbon and its impact on air quality in two semi-rural sites in Southern Italy near an oil pre-treatment plant, Atmos. Environ., 233, 117532, https://doi.org/10.1016/j.atmosenv.2020.117532, 2020.
Rajesh, T. and Ramachandran, S.: Black carbon aerosol mass concentration, absorption and single scattering albedo from single and dual spot aethalometers: Radiative implications, J. Atmos. Sci., 119, 77–90, https://doi.org/10.1016/j.jaerosci.2018.02.001, 2018.
Ramanathan, V. and Carmichael, G.: Global and regional climate changes due to black carbon, Nat. Geosci., 1, 221–227, https://doi.org/10.1038/ngeo156, 2008.
Remer, L. A., Kaufman, Y. J., Tanré, D., Mattoo, S., Chu, D. A., Martins, J. V., Li, R. R., Ichoku, C., Levy, R. C., Kleidman, R. G., Eck, T. F., Vermote, E., and Holben, B. N.: The MODIS aerosol algorithm, products, and validation, J. Atmos. Sci., 62, 947–973, https://doi.org/10.1175/jas3385.1, 2005.
Remer, L. A., Levy, R. C., and Martins, J. V.: Opinion: Aerosol remote sensing over the next 20 years, Atmos. Chem. Phys., 24, 2113–2127, https://doi.org/10.5194/acp-24-2113-2024, 2024.
Renna, S., Lunghi, J., Granella, F., Malpede, M., and Di Simine, D.: Impacts of agriculture on PM10 pollution and human health in the Lombardy region in Italy, Front. Environ. Sci., 12, 1369678, https://doi.org/10.3389/fenvs.2024.1369678, 2024.
Russell, P. B., Kacenelenbogen, M., Livingston, J. M., Hasekamp, O. P., Burton, S. P., Schuster, G. L., Johnson, M. S., Knobelspiesse, K. D., Redemann, J., and Ramachandran, S.: A multiparameter aerosol classification method and its application to retrievals from spaceborne polarimetry, J. Geophys. Res.-Atmos., 119, 9838–9863, https://doi.org/10.1002/2013JD021411, 2014.
Sato, M., Hansen, J., Koch, D., Lacis, A., Ruedy, R., Dubovik, O., Holben, B., Chin, M., and Novakov, T.: Global atmospheric black carbon inferred from AERONET, Proc. Natl. Acad. Sci. USA, 100, 6319–6324, https://doi.org/10.1073/pnas.0731897100, 2003.
Schuster, G. L., Dubovik, O., Holben, B. N., and Clothiaux, E. E.: Inferring black carbon content and specific absorption from Aerosol Robotic Network (AERONET) aerosol retrievals, J. Geophys. Res.-Atmos., 110, https://doi.org/10.1029/2004JD004548, 2005.
Vermote, E., Justice, C., Claverie, M., and Franch, B.: Preliminary analysis of the performance of the Landsat 8/OLI land surface reflectance product, Remote Sens. Environ., 185, 46–56, https://doi.org/10.1016/j.rse.2016.04.008, 2016.
Wang, J., Wu, Y., Ge, X., Shen, Y., Ge, S., and Chen, M.: Characteristics and sources of ambient refractory black carbon aerosols: Insights from soot particle aerosol mass spectrometer, Atmos. Environ., 185, 147–152, https://doi.org/10.1016/j.atmosenv.2018.05.011, 2018.
Wang, L., Li, Z., Tian, Q., Ma, Y., Zhang, F., Zhang, Y., Li, D., Li, K., and Li, L.: Estimate of aerosol absorbing components of black carbon, brown carbon, and dust from ground-based remote sensing data of sun-sky radiometers, J. Geophys. Res.-Atmos., 118, 6534–6543, https://doi.org/10.1002/jgrd.50356, 2013.
Xie, Y., Li, Z., Zhang, Y., Zhang, Y., Li, D., Li, K., Xu, H., Zhang, Y., Wang, Y., and Chen, X.: Estimation of atmospheric aerosol composition from ground-based remote sensing measurements of Sun-sky radiometer, J. Geophys. Res.-Atmos., 122, 498–518, https://doi.org/10.1002/2016JD025839, 2017.
Xie, Y., Xue, Y., Guang, J., Mei, L., She, L., Li, Y., Che, Y., and Fan, C.: Deriving a Global and Hourly Data Set of Aerosol Optical Depth Over Land Using Data From Four Geostationary Satellites: GOES-16, MSG-1, MSG-4, and Himawari-8, IEEE Trans. Geosci. Remote Sens., 58, 1538–1549, https://doi.org/10.1109/tgrs.2019.2944949, 2020.
Xu, X., Yang, X., Zhu, B., Tang, Z., Wu, H., and Xie, L.: Characteristics of MERRA-2 black carbon variation in east China during 2000–2016, Atmos. Environ., 222, 117140, https://doi.org/10.1016/j.atmosenv.2019.117140, 2020.
Xue, Y., He, X., Xu, H., Guang, J., Guo, J., and Mei, L.: China Collection 2.0: The aerosol optical depth dataset from the synergetic retrieval of aerosol properties algorithm, Atmos. Environ., 95, 45–58, https://doi.org/10.1016/j.atmosenv.2014.06.019, 2014.
Yuan, L., Zhang, X., Che, Y., Liu, X., Zhao, T., and Song, M.: Vertical profile and radiative forcing of black carbon in a winter pollution period over Chengdu, China, Atmos. Res., 265, 105896, https://doi.org/10.1016/j.atmosres.2021.105896, 2022.
Yus-Díez, J., Bernardoni, V., Močnik, G., Alastuey, A., Ciniglia, D., Ivančič, M., Querol, X., Perez, N., Reche, C., Rigler, M., Vecchi, R., Valentini, S., and Pandolfi, M.: Determination of the multiple-scattering correction factor and its cross-sensitivity to scattering and wavelength dependence for different AE33 Aethalometer filter tapes: a multi-instrumental approach, Atmos. Meas. Tech., 14, 6335–6355, https://doi.org/10.5194/amt-14-6335-2021, 2021.
Zhang, X., Li, L., Che, H., Dubovik, O., Derimian, Y., Holben, B., Gupta, P., Eck, T. F., Lind, E. S., Toledano, C., Xia, X., Zheng, Y., Gui, K., and Zhang, X.: Aerosol components derived from global AERONET measurements by GRASP: A new value-added aerosol component global dataset and its application, Bull. Amer. Meteorol. Soc., 105, E1822–E1848, https://doi.org/10.1175/bams-d-23-0260.1, 2024.