the Creative Commons Attribution 4.0 License.
the Creative Commons Attribution 4.0 License.
 | 26 Sep 2025
Adaptation of the CIMEL-318T to shipborne use: 3 years of automated AERONET-compatible aerosol measurements on board the research vessel Marion Dufresne
Benjamin Torres
Luc Blarel
Philippe Goloub
Gaël Dubois
Maria Fernanda Sanchez-Barrero
Ioana Elisabeta Popovici
Fabrice Maupin
Elena Lind
Alexander Smirnov
Ilya Slutsker
Julien Chimot
Ramiro González
Michaël Sicard
Jean Marc Metzger
Pierre Tulet
The Earth's oceans play a critical role in regulating the global climate and atmospheric processes, with marine aerosols significantly influencing weather patterns, air quality, and climate dynamics. Despite extensive land-based aerosol monitoring through networks like AERONET (AErosol RObotic NETwork), marine aerosol characterization remains a critical gap, due in part to the logistical challenges of conducting measurements in remote oceanic environments. To address this, robust, automated, and precise monitoring systems adapted for research vessels are essential.
This study reports on the first 3 years (July 2021–June 2024) of continuous aerosol optical depth (AOD) measurements collected aboard the research vessel Marion Dufresne using a ship-adapted CIMEL CE318-T automatic photometer in the frame of the MAP-IO (Marion Dufresne Atmospheric Program – Indian Ocean) program. The dataset comprises over 25 000 quality-assured AOD measurements, primarily from the southwest Indian Ocean region, revealing mid-range AOD and Ångström exponent values consistent with previous studies. The reliability and precision of the system were validated through dual-instrument comparisons conducted during the Amaryllis-Amagas/Transama campaign, yielding strong correlations (R>0.96 for different wavelengths) and low root-mean-square error (RMSE<0.01), within the expected error margins for AERONET ground-based sites and benefiting from the continue tracking system implemented for ship-adapted version. Additionally, recurrent comparisons with the ground-based AERONET site at Saint-Denis (La Réunion) further confirm the system's accuracy, presenting good correlations despite differences in altitude and the greater influence of local urban aerosols in Saint-Denis.
Retrievals from spectral AOD and sky radiance data collected over the Indian Ocean during a biomass burning event (October 2023) demonstrate the feasibility of deriving detailed aerosol properties, including size distribution and optical characteristics, from shipborne platforms adapted for marine conditions, following the protocols of the AERONET standard algorithm. Observed single scattering albedo (SSA) values, ranging from 0.88 to 0.95 with higher absorption at longer wavelengths, align with those recorded at the Saint-Denis site during the event and are consistent with expectations for a mixture of biomass burning (at the end of the dry season) and sea salt aerosols. These preliminary results underscore the potential of shipborne systems to provide comprehensive aerosol characterization in remote marine environments.
- Article
(6405 KB) - Full-text XML
- BibTeX
- EndNote


Atmospheric aerosol optical studies, including radiative forcing analysis, aerosol–cloud interactions, remote sensing of the atmosphere, and global aerosol modeling, rely on precise information about AOD and aerosol absorption. Oceans, which cover approximately 70 % of the Earth's surface, play a crucial role in the atmospheric system through sea–air interactions on both local and global scales. Specifically, oceans serve as a major source of sea spray aerosols and primary organic matter, such as chlorophyll a (Gantt and Meskhidze, 2013). Sea spray aerosols, consisting of seawater droplets and dry sea salt particles (ionic species like sodium and potassium), are produced predominantly by bubble bursting from breaking waves (Blanchard and Woodcock, 1980). These particles range in size from 0.05 µm to 1 mm (Hoppel et al., 1990; O'Dowd et al., 1997; Porter and Clarke, 1997). The production of sea spray is influenced by factors such as wind speed, sea state, atmospheric stability, and seawater composition (O'Dowd and Smith, 1993; de Leeuw et al., 2011). Globally, sea spray aerosols are the dominant contributors to columnar AOD over oceans (Mahowald et al., 2006) and are the most widely dispersed natural aerosols, with an estimated total flux of 4100 Tg yr−1 according to the IPCC, 2013 (Stocker et al., 2013). The contained primary marine organic matter is normally found in smaller particles under 200 nm (Leck and Bigg, 2008; Russell et al., 2010), with emission rates dependent on biological activity in ocean waters, estimated between 2–20 Tg yr−1 (Facchini et al., 2008; Gantt et al., 2011). From a climatic perspective, the main interest in sea spray aerosols lies in their direct influence on the radiation budget due to their predominantly scattering nature (Gordon and Clark, 1981; Gathman, 1983; Haywood et al., 1999; Satheesh and Krishna Moorthy, 2005), as well as their indirect impact on cloud formation, dynamics, and life cycle, driven by their hygroscopic properties (e.g. Gunn and Phillips, 1957; Albrecht, 1989; O'Dowd et al., 1999; Van den Heever et al., 2006; Sandu et al., 2008).
Characterizing marine environments is particularly challenging due to the complexity of aerosol production and the variety of sources involved (Lewis and Schwartz, 2004). Marine atmospheric aerosols encompass both the natural components mentioned above emitted by the sea and aerosols transported from terrestrial sources, whether natural (e.g., desert dust) or anthropogenic (e.g., sulfates, nitrates, or biomass burning aerosols; see Prospero et al., 2002; O'Dowd and de Leeuw, 2007; O'Dowd et al., 2007). These aerosols contribute to the complex and dynamic nature of marine environments. For example, long-range transport of continental aerosols modifies the aerosol composition over the ocean, blending natural sea salt with desert dust or industrial emissions (Fitzgerald, 1991; O'Dowd et al., 2007). The generally low concentrations of marine aerosols make their climatic effects highly sensitive to small changes. As Koren et al. (2014) suggested, even minor variations can significantly influence cloud formation and radiative forcing, often resulting in negative forcing (cooling) by promoting convective cloud development.
Pristine marine regions, such as the southern Indian Ocean and the South Pacific, are particularly valuable for understanding these processes because there is minimal human influence on them (Hamilton et al., 2014). Studying aerosols in these regions also provides information on preindustrial meteorological conditions, which serve as a baseline to evaluate the contribution of natural emissions to climate change. Furthermore, recent findings highlight the role of marine aerosols in climate feedback mechanisms, with processes such as marine cloud brightening (Alterskjær and Kristjánsson, 2013), illustrating the sensitivity of radiative forcing to aerosol–cloud interactions (Twomey, 1977). However, the efficacy of such processes is influenced by meteorological conditions, background aerosol levels, and particle properties, resulting in a wide range of potential impacts on radiative forcing, estimated between −5.4 and −0.8 W m−2 (Intergovernmental Panel on Climate Change (IPCC), 2021, mostly based on the analysis by Pringle et al., 2012).
Despite advances in understanding marine aerosols, substantial uncertainties continue to exist due to their strong dependence on sources, emissions, and interactions with clouds. Variability in sea spray concentrations, driven by changes in wind speed, sea state, and sea ice cover, adds further complexity (Struthers et al., 2011). Climate projections suggest that these emissions could increase or decrease under changing conditions, with potential implications for aerosol–cloud–climate feedbacks (Jones et al., 2007). Addressing these uncertainties requires comprehensive observational datasets to refine models, improve estimates of aerosol sources, and better quantify their climatic impacts. Systematic measurements of aerosol optical properties in maritime environments, coupled with robust statistical analysis, are therefore essential to advance our understanding of regional marine aerosol climatologies, their trends, and their global effects.
Marine aerosol optical properties can be measured using passive remote sensing instruments from spaceborne, airborne, or shipborne platforms. Spaceborne observations offer a global, long-term perspective on marine aerosol conditions, with aerosol properties retrieved by analyzing spectral radiances collected by their sensors from solar reflection off the Earth's surface and transmission through the atmosphere. In this context, satellite data retrievals either rely on assumptions about surface reflectance or employ a combined retrieval of aerosol and surface properties (Dubovik et al., 2011; Sayer et al., 2018), both of which introduce non-negligible errors. The accuracy and level of detail of aerosol products derived from satellite data vary depending on sensor performance and capabilities (e.g., multi-wavelength, multi-angular, and polarization measurements). For the most advanced sensors, AOD uncertainties at 550 nm typically start at 0.04–0.05 over oceans and around 0.1 over land (see, for example, validation studies in Gupta et al., 2018; Dubovik et al., 2019; Chen et al., 2020).
In contrast, AOD from Earth-based measurements is obtained through direct irradiance measurements of the Sun (or Moon) using precise photometers and applying the well-known Beer–Bouguer–Lambert law (Shaw, 1983), which describes the attenuation of solar or lunar light as it passes through the atmosphere. The associated uncertainty is around 0.01–0.02 and is mainly due to errors in the calibration coefficient in the different channels (Eck et al., 1999; Holben et al., 2006; Giles et al., 2019), a level significantly lower than that of satellite-derived AOD products. The high precision of Earth-based measurements is particularly valuable for improving our understanding of regional marine aerosol properties and their climatologies, while also refining uncertainty estimates for satellite aerosol products over oceans. These satellite products are rarely validated with Earth-based data due to a critical lack of ground observations in oceanic regions. In most validation studies, available data usually come from island stations or coastal sites, rather than from pure open-ocean environments. Additionally, this lack of Earth-based data in oceanic areas also complicates the validation of aerosol transport models, which typically rely on ground-based data to extend coverage of detailed aerosol properties beyond fixed ground-based sites. This gap in validated marine aerosol data hinders a comprehensive understanding of general aerosol dynamics and impedes accurate global climate predictions.
One reason for the lack of data over oceans is that most aerosol ground-based networks have historically concentrated on studying aerosol properties over land. For example, the well-known AERONET network (Holben et al., 1998, 2001) comprises more than 600 land-based sites, with limited information over the oceans, primarily covering islands. However, not all areas of the World Ocean can be studied from islands; aside from space and airborne sensors, ships are the only platforms where measurements can be obtained. Consequently, despite challenges such as platform mobility and the harsh marine environment, including exposure to salt and high humidity, shipborne Sun photometer observations have advanced significantly over the past 20 years (see for example developments for Prede POM instruments in Kobayashi and Shiobara, 2015). The largest long-term aerosol observation network in the ocean is the Maritime Aerosol Network (MAN) (Smirnov et al., 2009), a component of AERONET. MAN inherits its legacy from the NASA SIMBIOS (Sensor Intercalibration and Merger for Biological and Interdisciplinary Oceanic Studies) program (Fargion et al., 2000, 2003; Knobelspiesse et al., 2004). MAN provides a unique dataset of AOD, the Ångström exponent (as defined by Ångström, 1929, and calculated within using a least-squares linear regression in log–log space over the 440–870 nm wavelength range), and precipitable water vapor (PWV) in the ocean, spanning the Arctic to Antarctica.
MAN exploits the advanced AERONET calibration facilities and processing schemes and relies on many logistical and scientific developments from the AERONET project. The MAN web-based public data archive is available from the AERONET website. MAN represents an important strategic sampling initiative, and ship-borne data acquisition complements island-based AERONET measurements. MAN started collecting data over the oceans in November 2006 and has since made significant progress in data collection and archival. With more than 750 cruises completed and ongoing (and many more planned), the MAN database continues to grow, enhancing our knowledge of spectral AOD variation over the oceans. The ultimate objective is to advance the fundamental scientific understanding of aerosol optical properties globally through highly accurate and standardized measurements, providing a basis for evaluation and inter-comparison of AOD retrievals from various spaceborne sensors and outputs of the global aerosol transport models. However, unlike AERONET ground-based standard instruments, the standard device of MAN is the hand-held Microtops II Sun photometer, which requires manual operation, making it less suitable for continuous and unattended measurements. Furthermore, it cannot provide aerosol optical and microphysical properties obtained through the AERONET aerosol retrieval algorithm (Dubovik and King, 2000; Dubovik et al., 2000, 2002b, 2006; Sinyuk et al., 2020) due to the lack of sky radiance measurements (Smirnov et al., 2009).
For these reasons, the development of a ship-adapted version of the automated standard instrument used at AERONET ground-based sites, the CIMEL CE318-T Sun/Moon photometer (from now referred only as CE318-T), has been a primary objective in recent years within the Agora Lab framework (CIMEL Electronique and Université de Lille, https://www.agora-lab.fr, last access: 31 May 2025). The aim is to acquire aerosol properties from moving platforms using the same protocols and standards as those applied at AERONET ground sites. This strategy ensures consistency across the network and enables the retrieval of high-quality shipborne data.
This paper presents the technical development of the fully autonomous, AERONET-compatible version of the CE318-T Sun photometer for deployment on oceanographic research vessels. Section 2 details the evolution and final architecture of the system, while Sect. 3 reports on 3 years of continuous AOD measurements from the research vessel (RV) Marion Dufresne, the first ship to host such a system. Section 4 introduces the first shipborne AERONET retrievals of aerosol microphysical and optical properties. Throughout the paper, data validation and performance analysis are conducted with the objective of demonstrating that shipborne measurements can achieve the same level of quality and standardization as those from land-based AERONET sites. This opens the possibility of integrating shipborne data into global aerosol networks, thereby extending coverage to remote oceanic regions and supporting satellite validation and climate modeling efforts.
2.1 Sea-deployed CE318-T photometer
2.1.1 System adaptation and historical development
Adapting the CE318-T for shipborne use required two key modifications, both identified during the early stages of development. The first was the integration of real-time attitude information (specifically, GPS position, heading, pitch, and roll) to allow the instrument to continuously compute the Sun or Moon position relative to the moving platform. This capability became feasible with the modernization introduced in the CE318-T version (Barreto et al., 2016), which includes an internal GPS receiver capable of automatically determining geographic coordinates (an improvement over previous models that required manual entry). In the shipborne configuration, GPS updates are acquired every 5 min, compared to once daily in standard ground-based operation. While the internal GPS provides accurate location data, additional attitude parameters (heading, pitch, and roll) are supplied by an external system. In the last version of CE318-T, control electronics and software can be updated accordingly to allow integration of this external attitude information, enabling real-time compensation for platform motion.
The second essential modification was the implementation of continuous Sun (or Moon) tracking during direct irradiance measurements. In ground-based sites, the instrument tracks the Sun (or Moon) only once prior to each triplet measurement sequence (comprising three repetitions over nine spectral channels, as detailed in Sect. 2.2). On a moving platform, however, continuous tracking is necessary to maintain alignment throughout the acquisition period and to ensure accurate AOD measurements despite vessel movement.
These core modifications enabled the first successful experiments with shipborne CE318-T operation during the AQABA campaign in 2017, on board the RV Kommandor-Iona (Eger et al., 2019; Kaskaoutis et al., 2023; Pfannerstill et al., 2019), around the Arabian Peninsula. To obtain the vessel's attitude information, previous experience from developing photometry on moving platforms was leveraged. Specifically, the magnetic compass developed for the PLASMA airborne photometer (Karol et al., 2013) was used in this first implementation to compute the magnetic declination. The system operated successfully and produced the first automatic AOD measurements with CE318-T on a ship, during the transit from southern France to Kuwait. However, several operational limitations were soon identified. First, the magnetic compass required frequent recalibration to account for the magnetic environment of the ship. This procedure is feasible for short airborne deployments (as it is routinely performed before each PLASMA flight) but is impractical for long-term autonomous shipboard operations. In addition, the software did not include magnetic declination information, which is essential for the proper functioning of the heading calculation. Second, sea spray caused water ingress and salt deposition on the optics, revealing the need for a protective system to shield the collimator. Third, the CE318-T standard resistive rain sensor was found to be unsuitable for marine conditions, as it oxidized. Finally, strong winds and high waves not only increased instrument motion but also created risks of water ingress into the sensors, underscoring the need for a wind monitoring system capable of disabling measurements under harsh conditions.
These challenges informed a series of improvements implemented during subsequent deployments in the OCEANET transatlantic campaigns (PS113, PS116, and MOSAIC/Arctic) aboard the RV Polarstern (Yin et al., 2019). A protective system known as the “airshield” (a general term for the anti-sea spray setup using continuous air injection) was introduced. In this first implementation, dry air was channeled from inside the vessel to the base of the CE318-T collimator in order to prevent sea spray contamination. While this solution effectively shielded the optics from marine aerosols and salt deposition, condensation issues occasionally occurred due to differences in temperature and humidity between the interior of the vessel and the external environment. To enhance durability in marine conditions, the original resistive rain sensor was replaced with a corrosion-resistant optical sensor. An anemometer was also added to monitor wind speed and automatically disable measurements during strong winds. Furthermore, the basic electronic card-based attitude measurement system (magnetic declination calculator) was replaced by a SIMRAD-H60 commercial navigation compass, which includes a dual GPS antenna and a declination-corrected magnetic compass. These combined enhancements significantly improved the quality and quantity of retrieved AOD products. Yin et al. (2019) reported strong agreement between the CE318-T and the handheld MAN Microtops-II instrument, with RMSE of 0.015, 0.013, 0.010, and 0.009 at 380, 440, 500, and 870 nm, respectively, and correlation coefficients (R) of 0.99 at all wavelengths.
However, despite testing two versions of the SIMRAD-H60 system during the campaigns on the RV Polarstern (MOSAIC/Arctic campaign), attitude errors ranging between 2–5° occasionally complicated the Sun acquisition, as the field of view of the CE318-T tracking system is approximately 3°. This solution proved insufficient for the intended fully autonomous system, where the instrument can be deployed for several months at sea without continuous supervision.
The final improvements leading to the current version were implemented in 2020 (note that all technical components of the present system are described in detail in Sect. 2.1.2). During the Sea2Cloud campaign aboard the RV Tangaroa, the SIMRAD-H60 system was replaced with the ABX-Two inertial GPS unit, ensuring a RMSE of 0.07–0.1° for heading and 0.13–0.2° for pitch and roll1. The system functioned correctly after some initial adjustments to the position of the antennas. Unfortunately, only a few AOD measurements were obtained since the campaign started on 1 March 2020 and was canceled by the end of the month due to the COVID-19 pandemic. In late 2020, additional tests were conducted on fishing boats (small vessels of around 20 m in length) off the coast of northern France. The fishing boats conducted daily round trips, allowing for numerous tests and on-site modifications. During these tests, the final airshield system was installed outside, effectively preventing condensation issues. Additionally, the CE318-T firmware was adapted to enable automatic radiance (Almucantar) measurements for the ship-version.
By early 2021, the goal was to install a fully AERONET-compatible photometer on the RV Marion Dufresne (a vessel of the French oceanographic fleet), as part of the MAP-IO program (Tulet et al., 2024). More details about the vessel and the MAP-IO project are provided in Sect. 2.3. The instrument included all necessary adaptations for marine operations, along with the final software version capable of performing both direct and radiance measurements. However, a calibration issue was identified during installation. As a result, a different photometer, running an earlier software version, was installed and provided the first measurements on board the RV Marion Dufresne. This instrument, operational from January to March 2021, routinely performed automatic AOD measurements, while radiance measurements were taken manually, as it lacked the updated system for automatic sky radiance acquisition. The initially planned instrument was subsequently recalibrated, and, on 1 July 2021, the first fully AERONET-compatible photometer deployed at sea was successfully installed on board the RV Marion Dufresne, marking a significant milestone. This deployment serves as the reference point for the data analyzed in this study, collected using the fully operational and network-compliant shipborne system.
2.1.2 Current version and implementation
With all the aforementioned developments, the current system has evolved into a robust, modular configuration incorporating the necessary adaptations for long-term autonomous operation aboard research vessels. The present version combines the CE318-T photometer with an inertial GPS unit, a protective airshield, and a weather control system to ensure continuous, reliable measurements at sea. A schematic overview of this final modular configuration is provided in Fig. 1, and its components are described in detail below.
The core of the system is the CE318-T Sun photometer (center of Fig. 1), the latest standard instrument in the AERONET network. It performs automated measurements of spectral AOD (340–1640 nm), downward sky radiances (380–1640 nm), and column-integrated water vapor content, following the same protocols as AERONET ground-based sites. The second key component is the Trimble ABX-Two inertial GPS unit (shown on the right side of Fig. 1), which provides real-time attitude information with an estimated uncertainty below 0.2°. These data are continuously transmitted to the photometer and, together with its internal GPS position, allow the system to compute the Sun and Moon positions relative to the moving platform with high precision. Once the Sun or Moon enters the field of view of the tracking system, the photometer engages the adapted continuous tracking mode for shipborne operation, ensuring stable alignment throughout acquisition despite vessel motion. In addition, the ABX-Two generates continuous positioning data, which, together with attitude information, are recorded every second on a dedicated PC. This PC also collects data from the photometer and manages connectivity with the ship's communication system (Wi-Fi/cable), facilitating remote access and monitoring.
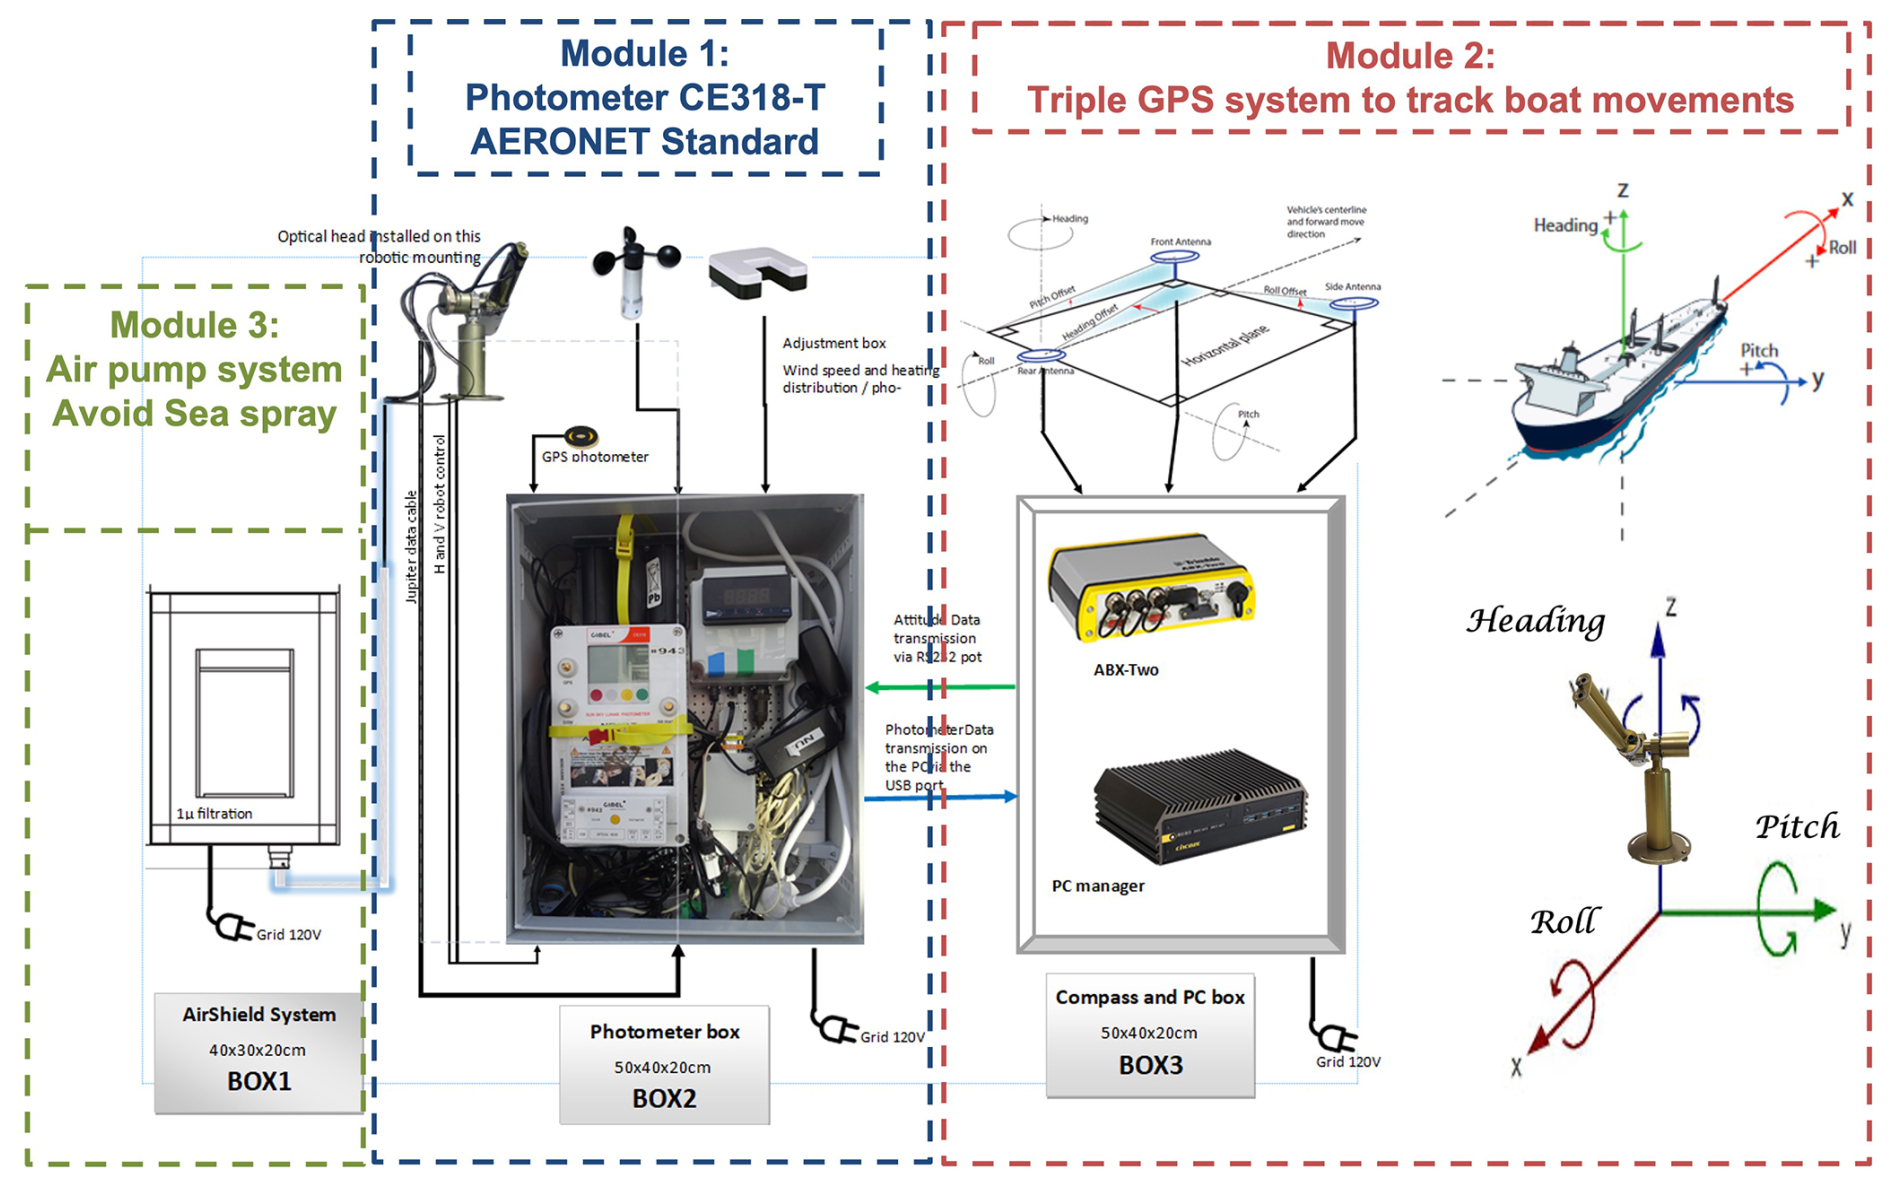
Figure 1Scheme of the photometer adapted for boat conditions. The central part of the figure shows the CE318-T photometer, the latest standard instrument in the AERONET network, originally designed for ground-based installations. The right side displays the Trimble ABX-Two inertial GPS unit, which provides attitude data (heading, roll, pitch) and continuously transmits this information to the photometer's communication ports. The left side of the figure illustrates the airshield, which supplies clean, compressed air to the base of the collimator, preventing sea spray deposition. A weather system, including a non-corrosive optical rain sensor and an anemometer, is also integrated to halt operation during rain or high winds. Source: pictures of Module 2 taken from the User Guide of the Trimble ABX-Two.
To prevent sea spray contamination, an airshield (located on the left side of Fig. 1) supplies clean, dry air to the base of the photometer's collimator. This airflow creates a protective overpressure that prevents both sea spray deposition and particle intrusion. A flexible, butyl-lined hose connects the pump to the photometer, minimizing pressure loss while allowing free movement of the tracking head. A filter installed at the air intake (Box 1) ensures that only clean air flows through the system. The pump operates continuously to protect the optics, even when measurements are paused, although it can be manually stopped when the head is removed.
The system also includes a weather unit with a corrosion-resistant optical rain sensor and an anemometer to monitor wind speed. Measurements are automatically halted during precipitation or high winds, protecting the instrument from sea spray (due to wave splash) and excessive motion. The unit is connected through the standard humidity sensor port and follows an enhanced safety protocol compared to land-based systems, which only pause measurements during rain.
Although a formal cost–benefit analysis is beyond the scope of this study, the operational feasibility of the system has been demonstrated through multi-year deployments with only minor repairs. The shipborne CE318-T system operates autonomously, occupies minimal deck space, and requires a standard 220 V power supply, with a maximum consumption below 100 W. All components (photometer, airshield, control units, and inertial GPS units) are compact and lightweight, with installation requiring about 1 full day by two trained personnel. The system can be affixed to standard ship railings using stainless steel clamps with rubber padding, ensuring stability under marine conditions. Maintenance is minimal – mostly limited to occasional filter cleaning and visual inspections – while continuous data transmission (maximum 5 kB h−1 for near-real-time data processing) and remote diagnostics (e.g., via TeamViewer) enable reliable, unattended operation for several months at sea. These characteristics make the current system design scalable and well suited for broader deployment aboard other research vessels, particularly within global ocean monitoring frameworks. Finally, it is important to note that the Trimble ABX-Two system is currently facing supply constraints. Finally, it is important to note that the Trimble ABX-Two system is currently facing supply constraints. Although it remains a key component of the architecture shown in Fig. 1, alternative commercial solutions are being evaluated to ensure comparable attitude precision and performance, with minimal impact on cost and overall system design.
The installation position aboard the vessel is selected in coordination with the crew to ensure optimal sky visibility (i.e., minimal obstruction from ship structures), while also considering other aspects such as ease of access, avoiding proximity to exhausts or contamination sources, mounting the system at a sufficient height to reduce exposure to waves, and avoiding electromagnetic interference from large antennas, which may affect the Trimble ABX-Two. In particular, the position on the RV Marion Dufresne, shown in Fig. 1 of Tulet et al. (2024), has proven effective in maintaining consistent solar acquisition while protecting the instrument from spray and mechanical interference.
2.2 Data processing and availability
2.2.1 Acquisition, calibration, and treatment
The use of the standard CE318-T photometer in the shipborne system offers a major advantage: its full compatibility with AERONET calibration and processing protocols. This compatibility ensures that the same quality control and quality assurance (QC/QA) procedures can be applied to all measurements, significantly simplifying the data treatment workflow. The term “AERONET-compatible” implies that the shipborne photometers follow the same measurement protocols and schedules as ground-based instruments, use identical optical filters, and undergo the same calibration and data processing. In particular, the calibration of both irradiance (Sun and Moon direct measurements) and sky radiance is performed using the same methods as for terrestrial photometers, ensuring consistency and comparability across the network.
Solar irradiance calibration is conducted through intercomparisons with reference “master” photometers at dedicated calibration facilities operated by NASA Goddard (USA), the University of Lille (France), the University of Valladolid (Spain), and the Asia Pacific AERONET Calibration and Training Center (APAC, Taiwan). These master instruments are themselves calibrated using the Langley plot method at high-altitude sites such as Mauna Loa and Izaña, where atmospheric conditions are stable and aerosol loads are minimal (see Toledano et al., 2018). The resulting calibration coefficient, commonly referred to as the “extraterrestrial constant,” corresponds to the digital number (DN) that the instrument would produce under extraterrestrial irradiance, that is, the expected output signal from the photodetector if the measurement were taken at the top of the atmosphere, with no atmospheric attenuation. This coefficient is then used to derive AOD through the Beer–Bouguer–Lambert law (Shaw, 1983; Holben et al., 1998) and the direct Sun/Moon measurements. In contrast, sky radiance calibration is carried out in controlled laboratory conditions using an integrating sphere. Regular recalibration (typically every 12–18 months) is required to compensate for instrument aging, particularly filter degradation, and to ensure long-term consistency.
Once the raw data are collected aboard the RV Marion Dufresne, they are transmitted via satellite to the PHOTONS CNRS National Observation Service (University of Lille) and subsequently forwarded to the NASA AERONET server. There, the data are processed using the AERONET Version 3 system, identical to that applied at ground-based sites. This includes rigorous quality-control protocols for assigning data to different quality levels (Level 1.0 and Level 1.5), as detailed in Giles et al. (2019). The most relevant steps and concepts for this analysis are briefly revisited and contextualized in the following subsections.
Unlike ground-based photometers, not all raw data from the shipborne instrument are automatically processed. Following an approach similar to that of the MAN program, only direct Sun or Moon measurements (used to derive spectral AOD, water vapor content, and the Ångström exponent) are processed when the vessel is officially on mission. This avoids unnecessary processing during extended docked periods. However, some data collected while the ship is at port are still processed, particularly during declared testing missions involving daily departures and returns. Additionally, on certain days within declared testing periods, the vessel may remain at the dock while data continue to be processed. In the 3-year dataset analyzed in this study, approximately 20 % of the processed data correspond to periods when the vessel was within the port area2. These data, which include both daytime and nighttime measurements, are included in the analysis presented in Sect. 3.1.
As part of the standard AERONET processing, Ångström exponent (α) values are derived from the spectral dependence of AOD using the Ångström law (Ångström, 1929). Several α values are computed over different spectral intervals. In this study, we use the α calculated over the 440–870 nm range, as it is the most commonly adopted in the literature and in AERONET-related studies. This value is obtained via log–log linear regression of all available AODs within this range (typically includes AOD at 440, 500, 675, and 870 nm) against wavelength.
2.2.2 Correct functioning and Level 1.0 assignment
Level 1.0 assignment is primarily based on the analysis of the instrument's electronic signal. Anomalies in system electronics (such as extreme battery voltages, amplifier malfunctions, or very low signal levels) can prevent measurements from reaching Level 1.0 (Giles et al., 2019). However, the most relevant criterion in this study is the verification of correct Sun (or Moon) pointing, which may be compromised by cloud obstruction or tracking system errors. This verification is based on the fact that AOD is derived using the Beer–Bouguer–Lambert law from a triplet of direct irradiance measurements. To ensure the reliability of these measurements, the relative RMSE of the DN triplet must remain below 16 %; otherwise, the entire observation is discarded (see Sect. 3.1.3 in Giles et al., 2019). In the case of the shipborne photometer, tracking errors, often associated vessel motion and vibrations, can lead to inconsistencies within the triplet, preventing the data from passing this 16 % threshold.
Approximately 30 % of the total Sun/Moon triplets from the shipborne photometer aboard the RV Marion Dufresne achieved Level 1.0 during the analyzed period (1 July 2021–30 June 2024). Since the RV Marion Dufresne regularly operates near La Réunion, the AERONET site “REUNION_ST_DENIS” (hereafter Saint-Denis), located on the roof of the University of La Réunion at 93 , provides a relevant ground-based reference. For the same period, approximately 47 % of the measurements at Saint-Denis reached Level 1.0. Given that Level 1.0 assignment is strongly influenced by instrument location and local climate conditions (e.g., obstruction by thick clouds), this comparison offers valuable context. Still, this difference is reasonable considering the additional challenges faced by shipborne measurements, particularly due to the vessel's motion and rotational movements. Moreover, part of the data loss can be attributed to installation-specific constraints. Unlike AERONET ground-based stations, which are typically located at sites with an unobstructed 360° horizon, shipborne platforms are subject to obstructions from onboard structures, masts, and other equipment intrinsic to the vessels. As mentioned earlier, the photometer position aboard the RV Marion Dufresne (see Fig. 1 of Tulet et al., 2024) was carefully chosen in coordination with the crew as the most suitable location for this vessel, though it places the instrument near a platform structure, further reducing the fraction of successful Level 1.0 measurements. Taking these constraints into account, the 30 % success rate compared to 47 % at Saint-Denis highlights the robustness of the shipborne system and its capability to maintain tracking in a high percentage of cases, even under challenging conditions.
2.2.3 Cloud screening and Level 1.5 assignment
While the 16 % DN triplet variance test used for Level 1.0 assignment effectively filters out thick clouds and outliers, it is insufficient for detecting thin or homogeneous cloud layers such as cirrus. Achieving Level 1.5 (cloud-screened AOD data) therefore requires additional screening procedures. In AERONET Version 2, the main method was the AOD triplet variability test, which assessed fluctuations within each AOD triplet. A triplet was accepted if the difference between maximum and minimum AOD remained below 0.02 across all wavelengths. In cases of high aerosol loading (such as biomass burning or extreme haze events), a more flexible threshold was applied, allowing a maximum variability of 0.03⋅ AOD, with the less restrictive criterion taking precedence when necessary.
AERONET Version 3 (Giles et al., 2019) introduced key refinements. First, the test was limited to three wavelengths (675, 870, and 1020 nm), avoiding unnecessary exclusions at shorter wavelengths where fine-mode aerosol can exhibit greater natural variability (Eck et al., 2018). At the same time, the threshold was made stricter: the AOD variability must remain below the greater of 0.01 or 0.015⋅ AOD across all three wavelengths. Additional criteria were introduced, including refined temporal variation thresholds (see Table 2 in Giles et al., 2019), along with others highlighted by Giles et al. (2019). These advancements further refine the cloud-screening process in Version 3, enabling a more effective removal of cloud-contaminated data and enhancing the quality of Level 1.5 AOD measurements. Consequently, the Level 1.5 AOD data collected aboard the RV Marion Dufresne and presented here have undergone rigorous cloud screening, ensuring that the retained Sun and Moon measurements comply with AERONET's quality standards. Approximately 70 % of the Level 1.0 data advance to Level 1.5, while this percentage is slightly higher at the Saint-Denis site reaching nearly 80 %. The 10 % difference is likely due to occasional small tracking instabilities at sea, which may cause triplets to pass the 16 % DN test but fail the more stringent 2 % AOD triplet variability threshold.
While Level 2 quality-assured AOD data are routinely performed and available for AERONET ground-based instruments, shipborne data are currently limited to Level 1.5 due to the added complexity of operating on a moving platform. Further validations, such as those presented here and by Yin et al. (2019), remain essential for establishing the reliability of CE318-T shipborne data within the AERONET network.
2.2.4 Sky radiances and inversion
The determination of calibrated downward atmospheric radiances from sky measurements acquired in almucantar geometry is processed during declared mission periods. Although the T-Model version of the CIMEL photometer is capable of performing hybrid sky scans – combining simultaneous azimuthal and zenith angle movements to provide intermediate data between almucantar and principal plane geometries (Sinyuk et al., 2020) – the photometer installed aboard the RV Marion Dufresne is currently limited to almucantar scans due to its specific software configuration. This limitation, while restricting hybrid scan capabilities, remains fully AERONET-compatible and capable of producing high-quality sky radiance measurements. As with other regular AERONET instruments in the network, almucantar scans consist of azimuthal sweeps from −180 to +180°, performed sequentially at four wavelengths (440, 675, 870, and 1020 nm). These scans are typically carried out in the morning and afternoon at specific optical air masses of 3.8, 2.9, 2.0, 1.7, and 1.4, which correspond to solar zenith angles (θS) of 75, 70, 60, 54, and 45°, respectively.
Almucantar sky radiance data, combined with spectral AOD measurements at identical wavelengths, serve as input to the AERONET inversion algorithm developed by Dubovik and King (2000) and later expanded by Dubovik et al. (2006). This algorithm retrieves column-integrated, optically equivalent volume size distributions and aerosol refractive indices, which are further utilized to derive secondary aerosol properties such as SSA, the asymmetry parameter, and phase functions. For the first time, this methodology has been applied to perform such retrievals from a shipborne platform within the AERONET network. However, retrievals from shipborne platforms are not yet automated. Processing has been done for selected periods of interest, and the first results are discussed in this study (Sect. 4). Although all ground-based quality control criteria, including the symmetry of almucantar scans, are considered in these initial inversions, additional quality criteria for shipborne retrievals are being analyzed. This includes setting extra thresholds related to ship motion during sky radiance acquisitions (or accounting for their effects), improving the model of sea water reflectances, and other factors.
2.2.5 Availability
AOD, water vapor, calibrated radiance, and preliminary aerosol microphysical and optical properties of the first AERONET retrievals are currently accessible internally through Demonstrat, an internal AERONET piece of software used to aid calibration, technical control of equipment, and data review. Figure 2 left shows an example of calibrated radiance measurements from an almucantar scan performed on 17 October 2023, on board the RV Marion Dufresne. These data will soon be accessible on the general AERONET website (https://aeronet.gsfc.nasa.gov, last access: 31 May 2025). This delay is due to the technical modifications required for the visualization software to handle data from moving platforms, as opposed to ground-based sites. In addition to AERONET processing and archiving, a near-real-time visualization system has been developed within the PHOTONS system (https://mobile.photons.univ-lille.fr/, last access: 31 May 2025). By selecting the mission and the boat, it is possible to visualize and download the corresponding AOD data (see the right panel of Fig. 2, showing the AOD at 440 nm (AOD440) during the OBS-AUSTRAL campaign from January to March 2022 as visualized through the PHOTONS system.).
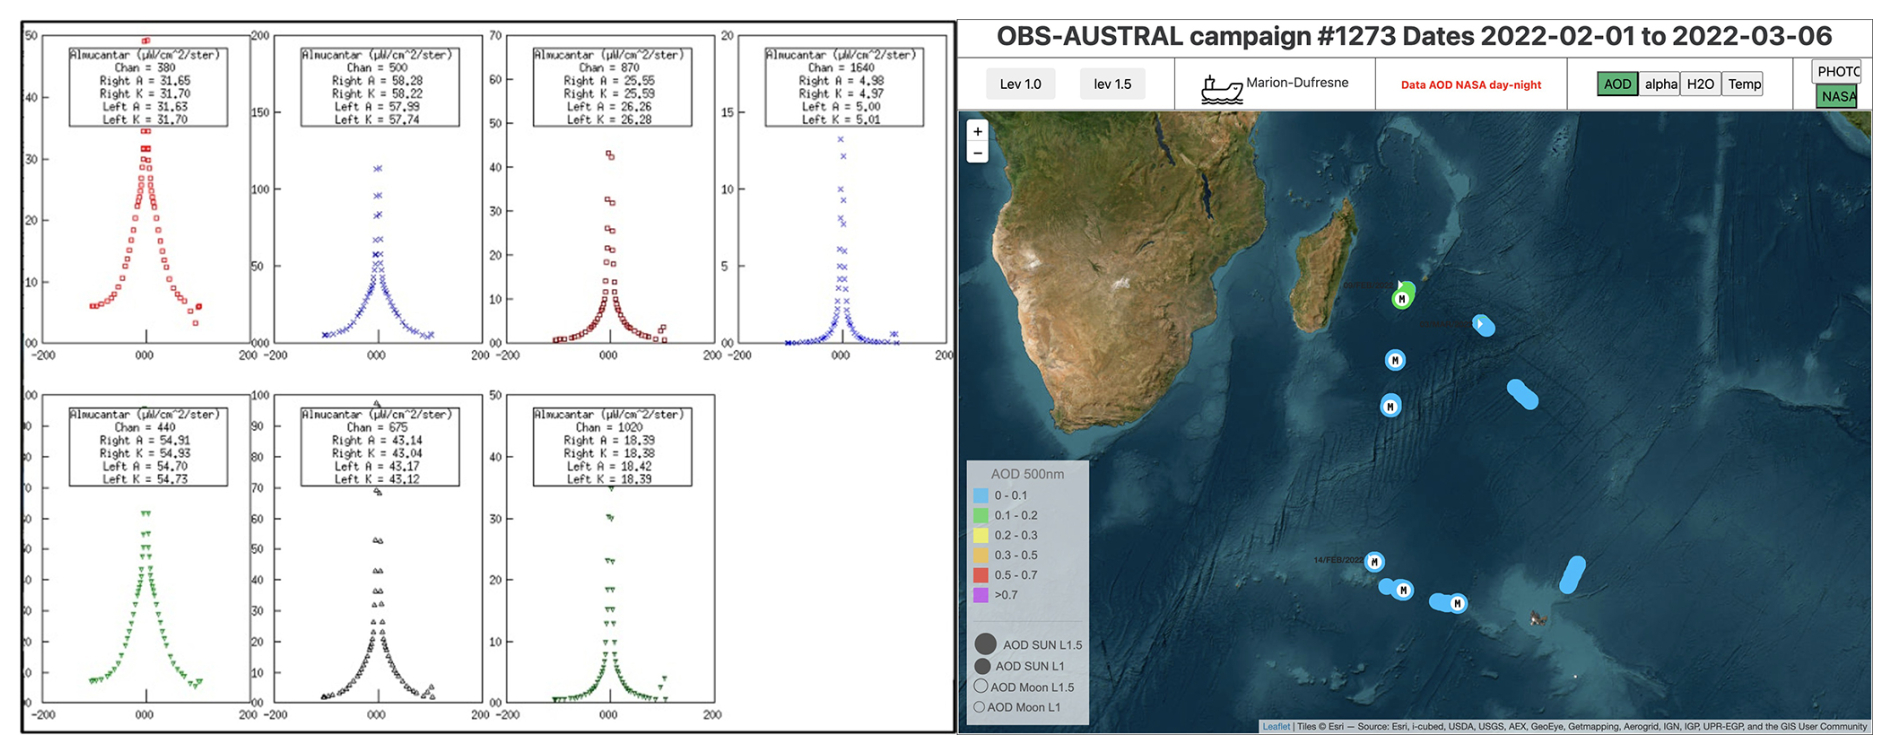
Figure 2Left: example of calibrated radiance measurements following an almucantar scenario on 17 October 2023, on board the RV Marion Dufresne from Demonstrat (AERONET internal system). Right: visualization of AOD440 during the OBS-AUSTRAL campaign from January to March 2022, as displayed on the PHOTONS system platform (https://mobile.photons.univ-lille.fr/, last access: 31 May 2025).
2.3 RV Marion Dufresne and MAP-IO program
The RV Marion Dufresne is a state-of-the-art oceanographic research vessel operated by the French Research Institute for Exploitation of the Sea (Ifremer) for approximately 220 d per year, and by Terres Australes et Antarctiques Françaises (TAAF) for around 120 d. The remaining time, typically about 25 d per year, the vessel remains at port for freight operations and routine maintenance activities such as mechanical repairs and technical upgrades. This period is also used for the maintenance and recalibration of scientific instruments installed on board. Designed for long-range, multidisciplinary scientific campaigns, the vessel is equipped with advanced laboratories and cutting-edge technologies, making it an ideal platform for atmospheric aerosol studies in marine regions.
The MAP-IO program, launched in early 2021, aims to address the critical lack of atmospheric and oceanographic observations in the southern Indian Ocean and the Southern Ocean – key regions in global climate regulation that remain among the least studied. By the end of 2024, after approximately 1100 d at sea, MAP-IO had deployed 17 scientific instruments aboard the RV Marion Dufresne, collecting unprecedented data on atmospheric aerosols, greenhouse gases, ultraviolet radiation, and water vapor, along with high-resolution phytoplankton observations in surface waters. The primary objective of MAP-IO is to assess the feasibility of establishing a permanent marine observatory aboard the Marion Dufresne, integrating it into international atmospheric and oceanographic monitoring networks. The collected data provide valuable insights into aerosol distribution and optical thickness, as well as seasonal variability in marine aerosols, greenhouse gases, and ocean–atmosphere interactions in these climatically sensitive regions. MAP-IO represents a strategic initiative to bridge observational gaps, enabling more accurate assessments of regional aerosol dynamics and their climatic impacts while supporting the development and validation of aerosol retrieval algorithms for marine environments, such as those explored in this study. In 2025, MAP-IO was accredited as a French CNRS National Instrument, securing its operation until at least 2030. All observations collected under the MAP-IO program are freely available through the AERIS atmospheric data center (https://www.aeris-data.fr/catalogue-map-io/, last access: 31 May 2025) and the SEANOE ocean data center (https://doi.org/10.17882/89505, last access: 31 May 2025). Further details are available at http://www.mapio.re (last access: 31 May 2025) and in Tulet et al. (2024).
3.1 Aerosol optical depth
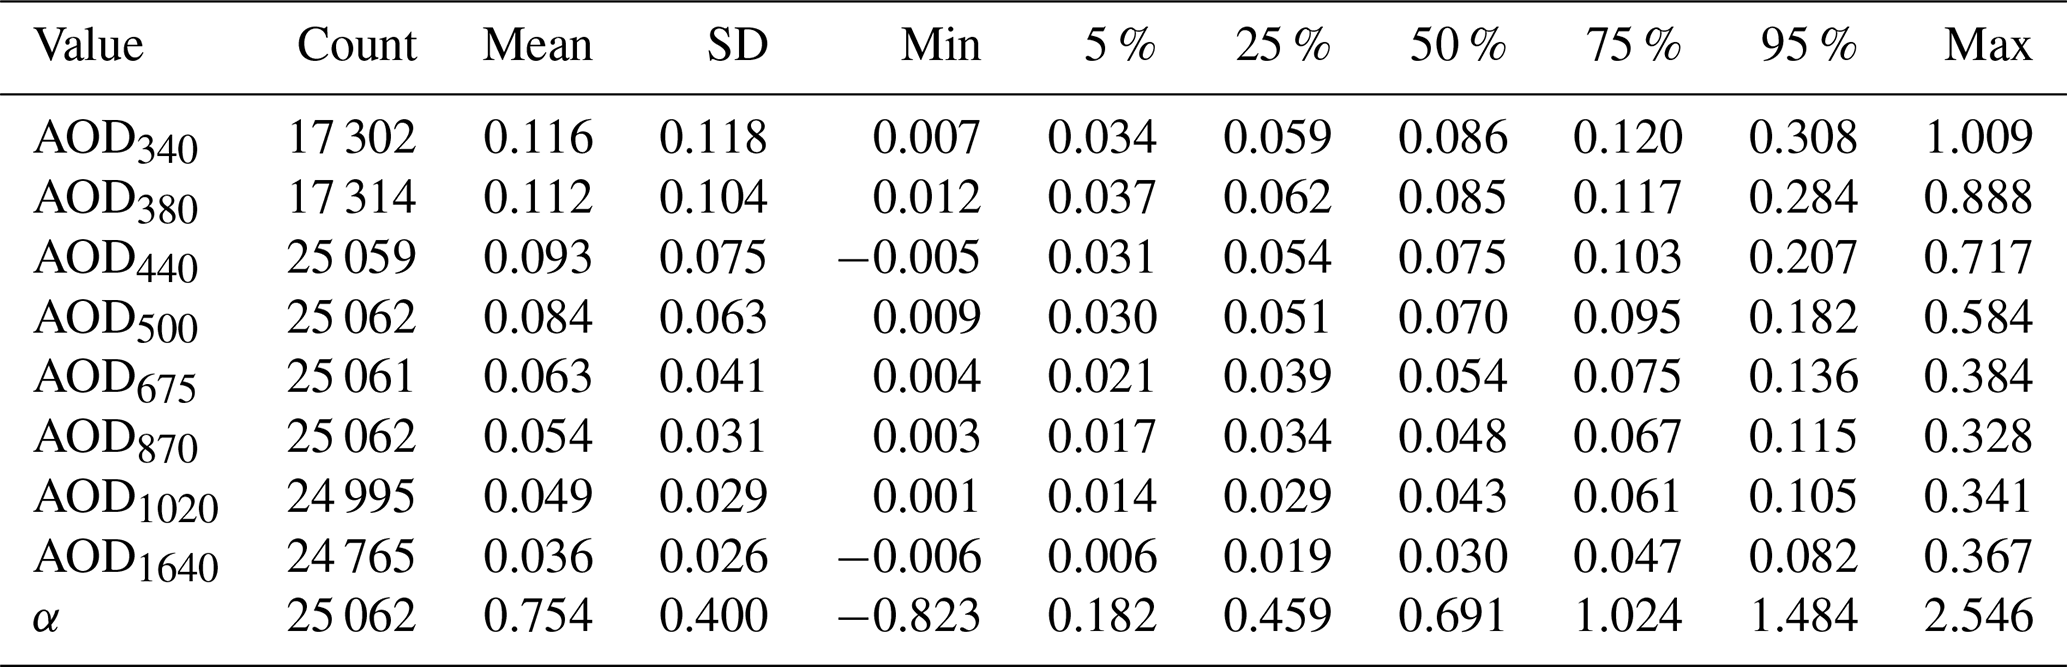
This section presents the AOD measurements obtained aboard the RV Marion Dufresne over a 3-year period, from 1 July 2021 to 30 June 2024. Table 1 summarizes the key statistical metrics for this dataset, including the total number of data points per channel; the mean and standard deviation; and the percentiles at 5 %, 25 %, 50 %, 75 %, and 95 %, along with the minimum and maximum values.
Table 1Summary statistics of the AOD and α data collected aboard the RV Marion Dufresne from 1 July 2021 to 30 June 2024. The table includes the total number of data points for each channel; the mean value and its standard deviation; and percentiles at 5 %, 25 %, 50 %, 75 %, and 95 %, along with the minimum and maximum values.
The total number of measurements containing at least one wavelength at Level 1.5 is 25 602, including 17 293 recorded during the day and 7735 at night using moonlight. Among the available spectral channels, only 500 and 870 nm are present in all Level 1.5 records. It is important to note that certain Level 1.0 criteria (outlined in Sect. 2.2 and detailed in Giles et al., 2019) apply to individual channels and can result in the exclusion of specific wavelengths. Since Level 1.5 processing requires a valid Level 1.0 measurement, any data failing Level 1.0 checks cannot advance to Level 1.5. Furthermore, the transition from Level 1.0 to Level 1.5 most often leads to the rejection of the entire spectral AOD measurement (typically due to general cloud-screening criteria; see Sect. 2.2). However, in some cases, Level 1.5 criteria apply only to individual wavelengths3. This explains the very few rejections observed in the 440 and 675 nm channels (only 3 and 1 cases, respectively).
A significant portion of the missing data in the remaining channels is attributable to nighttime observations, although some exclusions also result from the aforementioned Level 1.0 and Level 1.5 criteria applied to individual wavelengths. For the 340 and 380 nm channels, AOD estimation from Moon measurements systematically excludes these wavelengths due to the low incoming lunar irradiance in this spectral range (Barreto et al., 2013, 2016). As a result, none of the 7735 nighttime Level 1.5 measurements include these two channels. For the near-infrared channels (1020 nm and especially 1640 nm), the lunar irradiance signal is lower than in the visible range. This limitation is particularly pronounced during the first and last quarters of the lunar cycle (the first and last days with AOD night observations), when the received light is minimal. On the one hand, this increases the measurement uncertainty for these channels compared to the visible range on these Moon quarter days (Barreto et al., 2016). On the other hand, if the signal is too weak, it may fail the Level 1.0 filters related to minimum signal requirements, either due to the minimum digital number threshold or because the signal is lower than the extraterrestrial signal divided by 1500, both of which apply to individual wavelengths. As a consequence, some Moon quarter days lack AOD data at 1020 and 1640 nm, even when measurements are available for visible channels. This explains most of the nearly 300 missing data points at 1640 nm and the 67 missing at 1020 nm.
Table 2 presents the same statistics as Table 1 but computed using daily mean AOD values. This analysis includes a total of 344 d of observations, of which 60 contain only nighttime measurements, meaning the 340 and 380 nm channels have valid data for 284 d. This results in an overall observation frequency of approximately one out of every 3 d over the 3-year study period, largely due to extended periods when the vessel was not declared on a mission. Figure 3 shows the temporal evolution of these daily means for AOD440 and α from 1 July 2021 to 30 June 2024.
Table 2Statistical summary of daily mean AOD and α values at different wavelengths obtained aboard the RV Marion Dufresne from 1 July 2021 to 30 June 2024. The table presents the number of valid daily averages per channel, the mean and standard deviation, and percentiles at 5 %, 25 %, 50 %, 75 %, and 95 %, along with the minimum and maximum values.
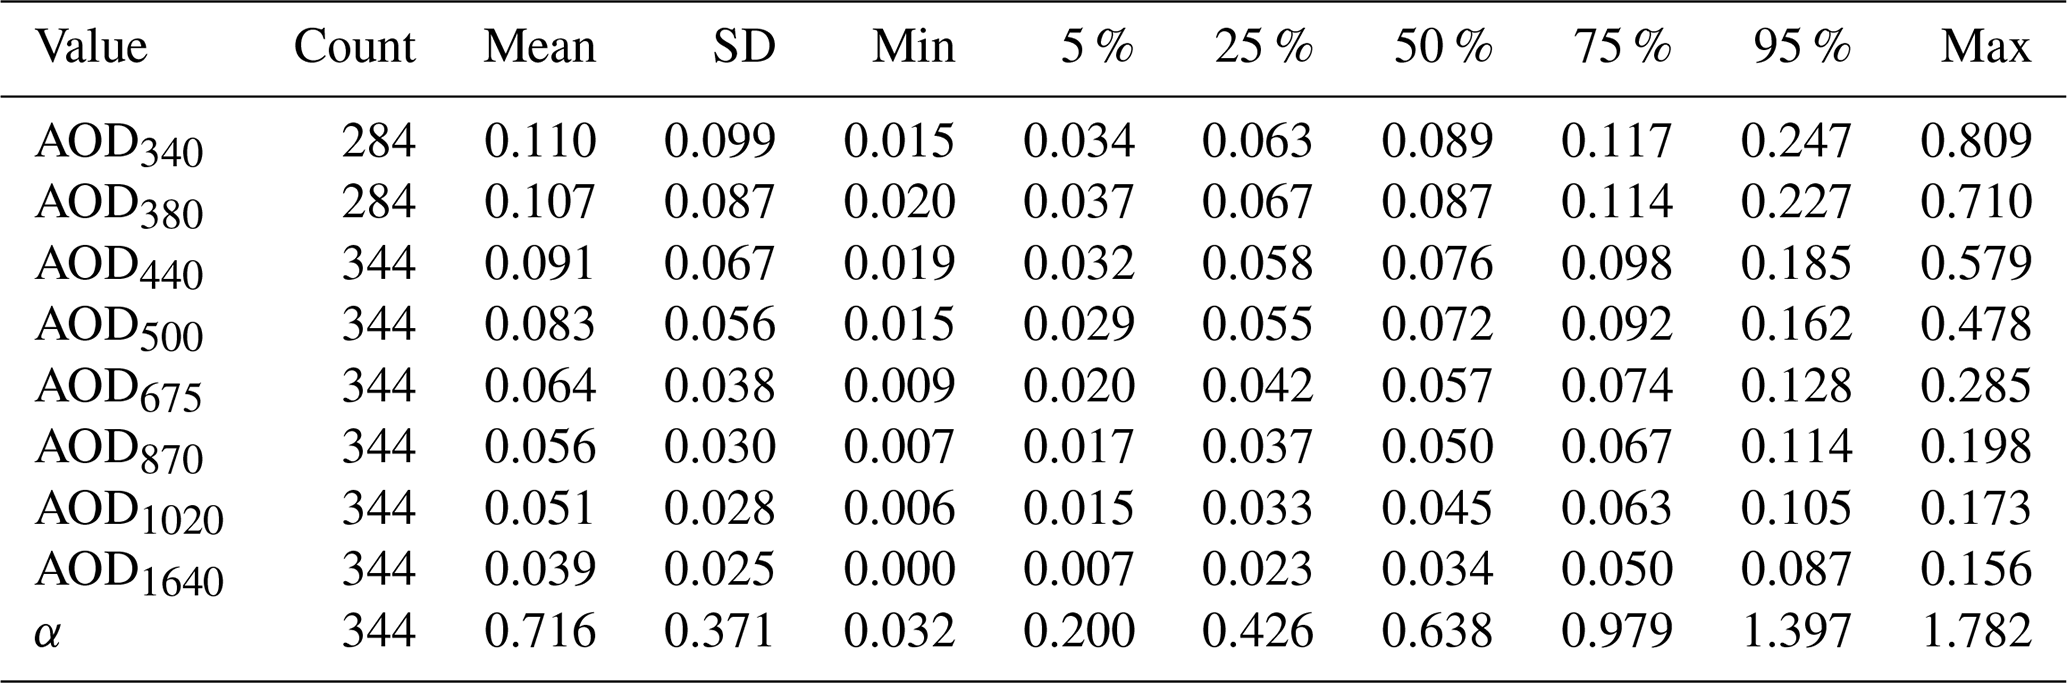
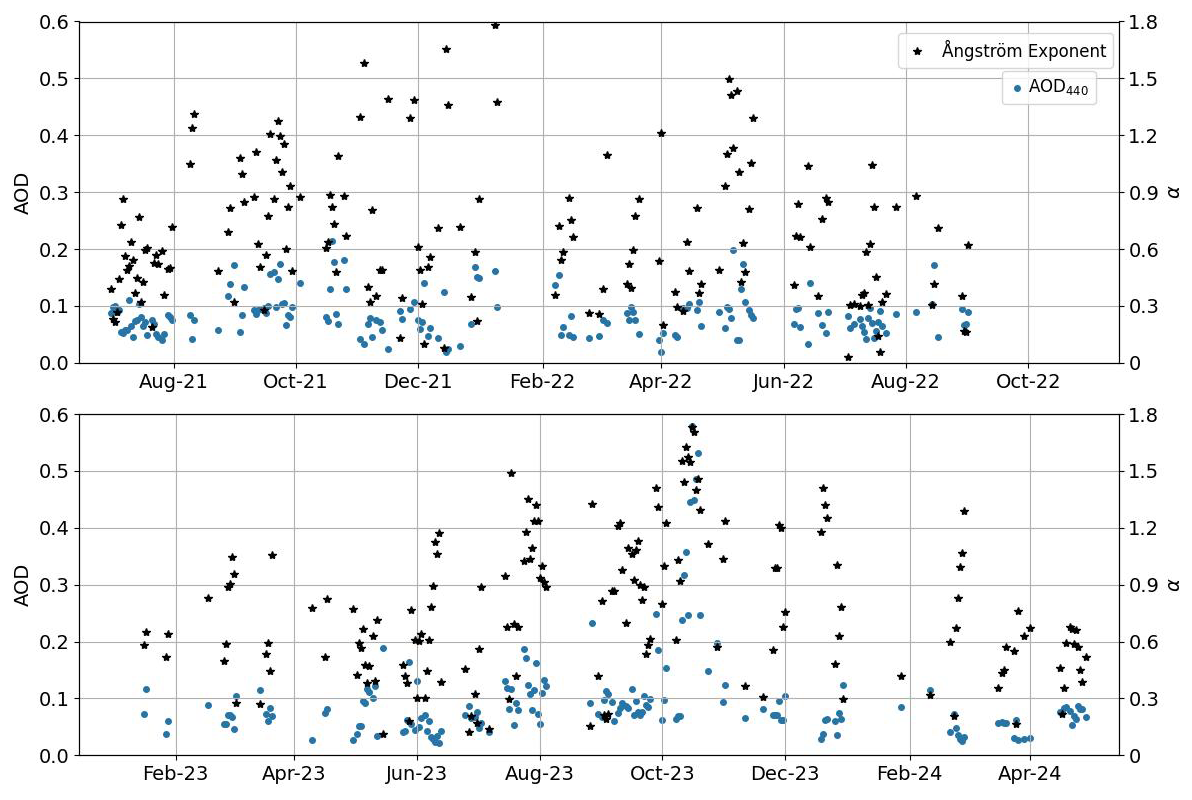
Figure 3Time series of daily mean AOD Level 1.5 at 440 nm (blue dots) and α values (black asterisks, right y axis) recorded by the shipborne-adapted CIMEL CE318-T photometer aboard the RV Marion Dufresne from 1 July 2021 to 30 June 2024.
The mean AOD values from the full dataset in Table 1 are 0.093±0.075, 0.063±0.041, and 0.054±0.031 at 440, 675, and 870 nm, respectively. These values remain consistent when calculated from daily averages, as shown in Table 2, yielding 0.091±0.067, 0.064±0.038, and 0.056±0.030 for the same three channels. Additionally, the α mean is 0.75±0.40 for the entire dataset and 0.72±0.37 when computed from daily averages. These averages confirm the overall pristine atmospheric conditions in the most common operational area of the RV Marion Dufresne, which are characteristic of the southwestern Indian Ocean. These findings are consistent with those reported by Mallet et al. (2018) and other studies conducted in the region (references therein), and they generally align with observations from other clean marine environments with minimal continental influence (Smirnov et al., 2002).
It is important to note that the study includes all AOD measurements recorded aboard the RV Marion Dufresne, corresponding to its regular operational area in the southwestern Indian Ocean, including voyages to the French Southern and Antarctic Territories (TAAF), with the sole exception of a short period during the Amaryllis-Amagas and Transama campaigns (April–June 2023), when the vessel traveled from its regular base to the Brazilian coast4 and back. This segment represents less than 5 % of the total dataset. Importantly, the AOD statistics computed exclusively for the Transama transit campaign (AOD440=0.08 and α=0.06) are very similar to the global averages, confirming their representativeness and minimal influence on the overall results. Moreover, although the vessel approached the Brazilian coast during Amaryllis-Amagas, no photometer measurements were collected in that area due to the lack of authorization from Brazilian authorities; thus, the available data of that period correspond exclusively to the transit campaign between La Réunion and Brazil and back.
The general pristine conditions during the 3 years of measurements on board RV Marion Dufresne are clearly observed in Fig. 3, where daily averaged AOD440 values rarely exceed 0.2, with the vast majority remaining below 0.1 (the 75th percentile limit for both the full dataset and the daily means). It should also be noted that α exhibits a large variability, as reflected in its standard deviation of 0.37 and clearly visible in Fig. 3. This variability is in part due to the very low AOD conditions frequently observed in the region. For example, the mean AOD870 is 0.056, with a median of 0.05, while the associated uncertainty in AOD retrievals is approximately 0.01 (Eck et al., 1999). This implies that at least 50 % of the data in this channel have an uncertainty of at least 20 % in the AOD measurement itself, which significantly affects the accuracy of α calculations under such low aerosol load conditions and may explain a large part of the observed variation.
Long-term observations from the AERONET Saint-Denis site provide a valuable reference for assessing aerosol conditions in the most common operational area of the RV Marion Dufresne. The data from this site were previously used to contextualize the transition rates between AOD data quality levels for the RV Marion Dufresne in Sect. 2.2 and will be further utilized in a point-by-point comparison in Sect. 3.2.2. For the period 2007–2019, Duflot et al. (2022) reported a mean AOD440 of 0.08 and an α of 0.71, values that closely match those obtained in this study (0.09 and 0.72, respectively, from daily averages). According to Duflot et al. (2022), these averages reflect the regional dominance of marine aerosols, providing a representative baseline for the local atmospheric column. Comparable statistics for the α can be found in Smirnov et al. (2011), whose Fig. 5c (MAN climatology from Indian Ocean) shows a similar variation range5 with a 50 % percentile of approximately 0.6, slightly lower than the 0.64 observed in this study for the daily averages (Table 2).
The study by Duflot et al. (2022) highlights the significant seasonal impact of biomass burning emissions, primarily due to bushfires, particularly during the September–October–November (SON) period. During the extended dry season, which spans late July to early December (shortly before the onset of the first significant rains), emissions from southeastern Africa and Madagascar lead to a substantial increase in AOD and α values, indicating a greater dominance of fine-mode particles in the region. Duflot et al. (2022) note that while sea salt aerosols are consistently present throughout the year and contribute significantly to AOD, they account for only 16.3 % of its variability. In contrast, biomass burning emissions dominate this variability, contributing 67.4 %. Thus, sea salt establishes the regional AOD baseline, while biomass burning plumes drive the most significant fluctuations during the dry season.
An extraordinary biomass burning plume was detected aboard the RV Marion Dufresne from 11–20 October 2023, in the vicinity of La Réunion. As seen in Fig. 3, this period stands out as the only one in the entire dataset where daily mean AOD440 values exceed 0.3. Notably, 65 % of the data within the top 5 % percentile of AOD440 for the 3-year dataset were recorded during this event. Furthermore, all measurements in the top 2.1 % percentile (approximately 580 measurements with AOD440 exceeding 0.36) occurred between 12–19 October 2023. The highest AOD440 value recorded in the dataset (0.73; see Table 1) and the highest daily average (0.58; see Table 2) both occurred on 16 October 2023. The weekly average AOD440 and α reached 0.45 and 1.56, respectively, well above the 95th percentile of AOD440 (0.21) and α (1.46) for the 3-year dataset (Table 1).
While Duflot et al. (2022) acknowledge the presence of biomass burning events in the region and their impact on AOD, their study does not provide a detailed analysis of individual episodes concerning aerosol optical and microphysical properties. Other studies, such as Clain et al. (2009), Duflot et al. (2010), Vigouroux et al. (2012), and Verreyken et al. (2020), primarily focus on the gas-phase contributions associated with individual biomass burning events in the region, without providing insights into aerosol properties. On the other hand, Smirnov et al. (2011) documented a similar episode in the southwest Indian Ocean region on 12 November 2009, where AOD500 measured from a vessel reached approximately 0.60 with an α of about 1.4. However, this episode was detected in the Mozambique Channel and likely did not extend to La Réunion, as AOD500 values measured at the Saint-Denis site (Level 2) for November 2009 rarely exceeded 0.15, except for a few measurements on 5 November. Additionally, no detailed aerosol retrievals analyzing properties such as size distribution or optical parameters were performed for this event, as Smirnov et al. (2011) relied on MAN data, which lack the sky radiance measurements required for AERONET aerosol retrievals.
Note that sky radiance observations were collected alongside automated AOD measurements aboard the RV Marion Dufresne during that week, enabling the retrieval of microphysical and optical aerosol properties using AERONET's standard retrieval algorithm. The exceptionally high AOD values measured during the biomass burning event of 11–20 October 2023 provide a unique opportunity to evaluate the first quality-assured AERONET aerosol retrievals (AOD440>0.4) obtained from a shipborne platform. A detailed analysis of this event and the retrieved optical and microphysical aerosol properties will be presented in Sect. 4.
3.2 Data validation
As mentioned in the Introduction, an initial validation of AOD data from the shipborne version of the CE318-T photometer was carried out by Yin et al. (2019), who compared automated AOD measurements with a MAN Microtops II instrument aboard the RV Polarstern during the OCEANET transatlantic campaigns (PS113, PS116, and MOSAIC/Arctic). However, a similar comparison could not be performed in this study, as no Microtops measurements were conducted aboard the RV Marion Dufresne during the 3-year period from July 2021 to June 2024. Instead, the present study provides a complementary validation based on a shipborne intercomparison during overlapping operation and on ground-based AERONET data from the nearby Saint-Denis site when the vessel was in proximity.
3.2.1 Validation during the Transama campaign
Throughout the full 3-year period of analysis, two different photometers were deployed. The first instrument, labeled #1273, operated from 1 July 2021 until 12 June 2023, when it was scheduled for calibration and replacement. This replacement coincided with the Amaryllis-Amagas and Transama campaigns, during which the vessel was temporarily relocated from its usual operational area in the southwestern Indian Ocean to the Brazilian coast. During the Transama campaign, both the outgoing instrument (#1273) and its replacement, labeled #1243, were kept on board, allowing for simultaneous operation between April and June 2023. This overlap enabled additional tests and optimizations6 by research engineers involved in the campaign. For the time series presented in the previous subsection, data from instrument #1273 were used until 31 May 2023, after which data from instrument #1243 were used until 30 June 2024.
Figure 4 presents the comparison of coincident data, using Level 1.5 AOD from both instruments (the highest quality level achievable for moving platform data). This includes AOD measurements at (from top to bottom and left to right) 380, 440, 500, 675, and 870 nm, as well as α. In this analysis, AOD measurements from photometer #1273 (plotted on the x axis) were compared with AOD values from photometer #1243 (plotted on the y axis) averaged within a ±3 min interval. All AOD datasets include 1180 data points, except for the 380 nm channel, which is limited to 622 points since AOD380 is provided only during daytime (Moon-based AOD measurements do not include this wavelength, as explained in Sect. 2.2). The α comparison is also based on 1180 points. Color bars represent data density, using a 0.01×0.01 grid for AOD comparisons and a 0.1×0.1 grid for α. A logarithmic scale was applied to the density representation to better visualize the high concentration of data points along the one-to-one line.
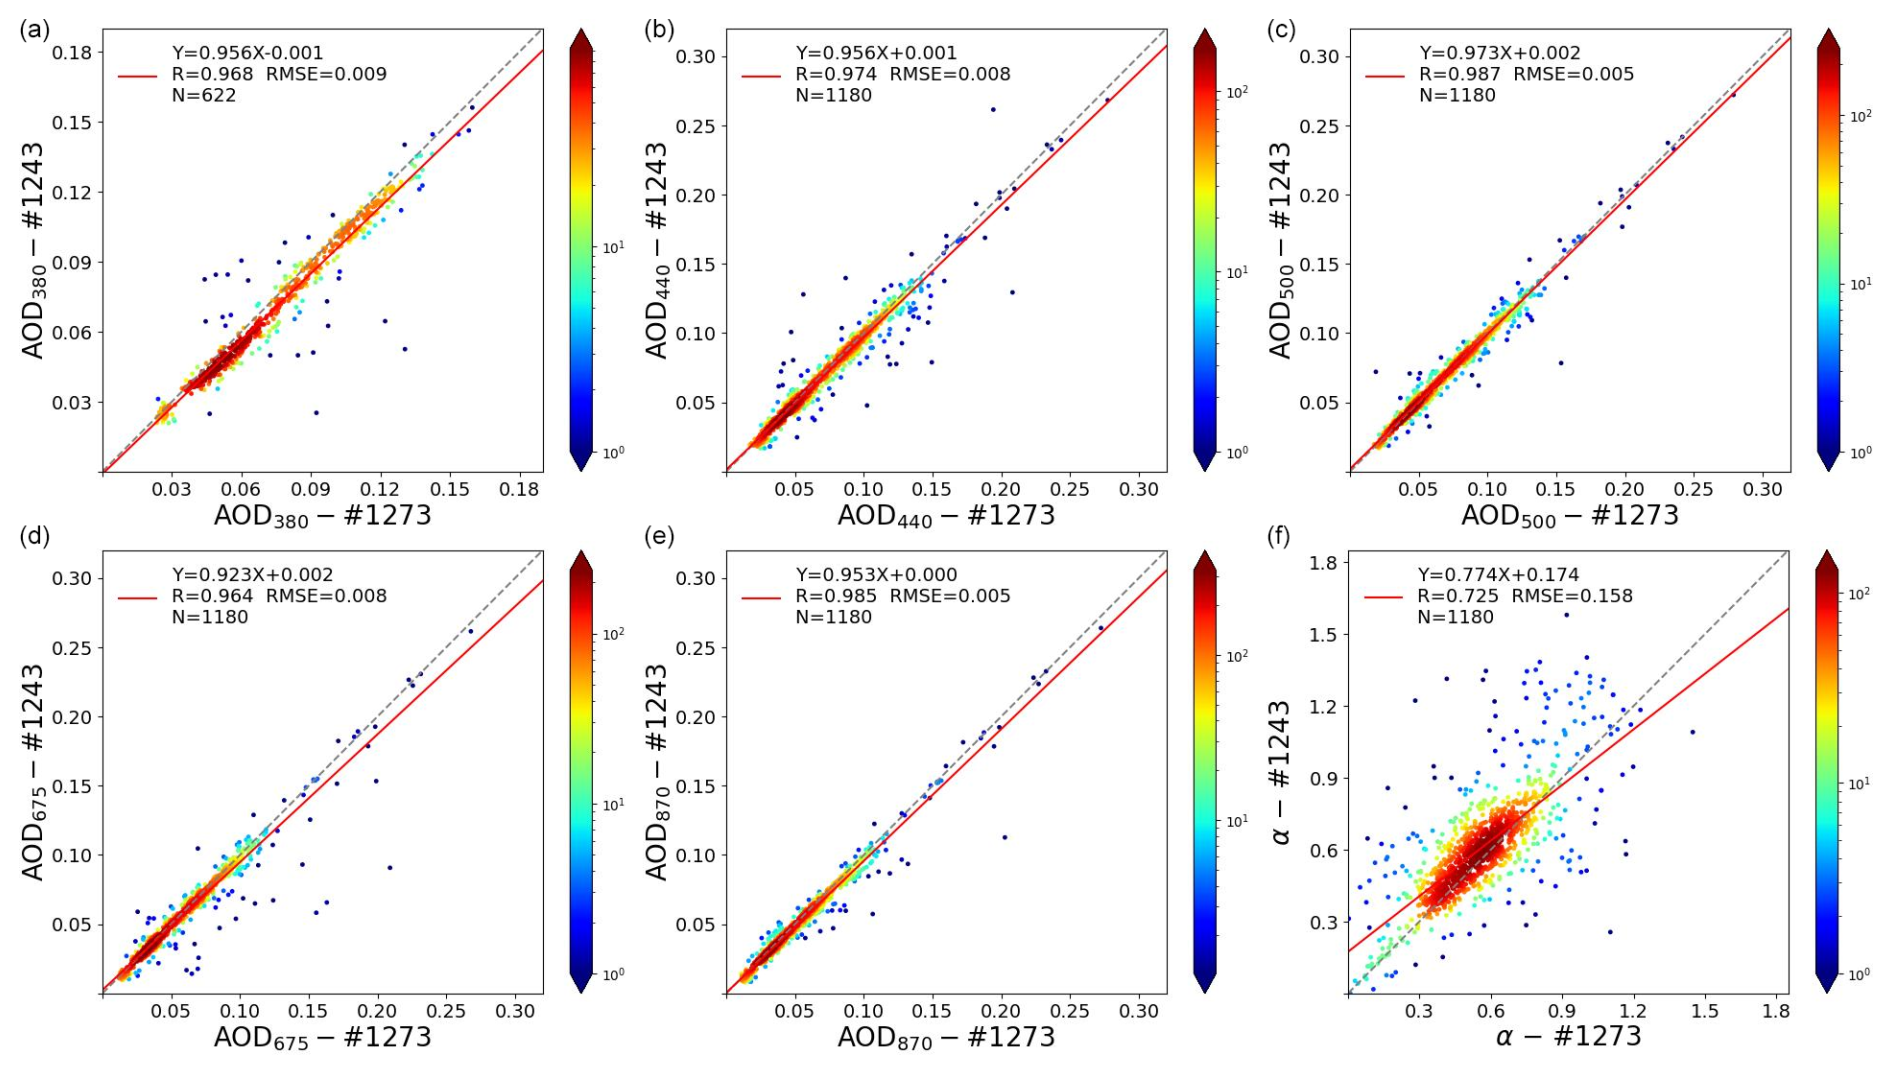
Figure 4Comparison of Level 1.5 AOD and α measurements between photometer #1273 (x axis) and photometer #1243 (y axis) during the Amaryllis-Amagas/Transama campaign from late April to early June 2023. The comparison is shown for the AOD channels 380, 440, 500, 675, and 870 nm (top to bottom, left to right) and the α. Color bars represent data density on a 0.01×0.01 grid for AOD and a 0.1×0.1 grid for α, with a logarithmic scale applied due to the high data density along the one-to-one line. For each AOD measurement from photometer #1273, the comparison was made with the average of AOD data from photometer #1243 within a ±3 min interval. All data shown have undergone the Level 1.5 cloud-screening and quality control procedures described in Sect. 2.2 and references therein.
As shown in the panels, the agreement between the two instruments is particularly strong, with R exceeding 0.96 for all AOD channels and slopes ranging from 0.92 to 0.98. The corresponding RMSE values lie between 0.005–0.008, which are slightly lower than those reported by Yin et al. (2019), where differences relative to the Microtops-II instrument ranged from 0.009 to 0.015 (see Fig. 4 in their study). In addition, the biases, computed as AOD(#1273) – AOD(#1243), are also minimal, with values of , , , , and for the 380, 440, 500, 675, and 870 nm channels, respectively. These biases are slightly smaller than those reported in Yin et al. (2019), where they ranged from to . Notably, the high correlations and low biases observed for AOD comparison in this study are comparable to those obtained in ground-based calibration sites during intercalibration periods with AERONET master instruments (Holben et al., 1998), demonstrating the reliability of shipborne Level 1.5 data.
However, the comparison for α shows a much higher RMSE (0.158 vs. 0.063) and a slightly lower correlation (R=0.73 vs. 0.9) than those reported by Yin et al. (2019). These larger discrepancies for α, despite smaller differences in AOD, might be attributed to the significantly low AOD values observed during the Amaryllis-Amagas/Transama campaign, which took place under pristine conditions (with AOD440 below 0.18, except for one night with measurements reaching up to 0.27), in contrast to the higher values reported by Yin et al. (2019), where AOD440 reached up to 0.6. As mentioned in the previous section, when AOD values are low, the relative errors tend to be much larger, which has a more pronounced impact on α. For instance, if the analysis is restricted to cases where AOD870>0.05 (not shown in any figure, with 490 data points), the RMSE for α decreases to 0.12, and the correlation coefficient increases to 0.8.
3.2.2 Validation against AERONET Saint-Denis observations
An additional validation of the shipborne CE318-T is conducted using the AERONET ground-based photometer at the Saint-Denis site, previously introduced in Sect. 3.1. Located 93 and approximately 20 km from the port of La Réunion, this site offers a unique opportunity for comparison due to the frequent proximity of the RV Marion Dufresne during its regular entries and departures. As the nearest ground-based AERONET site with the highest number of coincident measurements, it serves as a key validation point for the shipborne data, despite the inherent challenges posed by the elevation difference.
Figure 5 presents the correlation between AOD and α data from the CE318-T at the Saint-Denis AERONET site and the shipborne photometer aboard the RV Marion Dufresne. These comparisons were conducted over the full 3-year period of data collection. To ensure meaningful comparisons, measurements were selected when the RV Marion Dufresne was within a maximum distance of 50 km from the Saint-Denis site. Notably, adjusting the threshold between 30–100 km only had a minor impact on the dataset size, with 1745 points at 30 km, 1833 points at 50 km (the selected threshold), and 1941 points at 100 km. The statistical results (e.g., RMSE, slopes, and correlation coefficients) remained largely unchanged across these thresholds. However, a significant reduction occurs when using a stricter 20 km limit, leaving only eight coincident observations. This sharp drop is explained by the fact that the distance between the ship's docking location in Le Port and the Saint-Denis photometer is approximately 21 km, meaning that most entries and departures fall just outside the 20 km range.
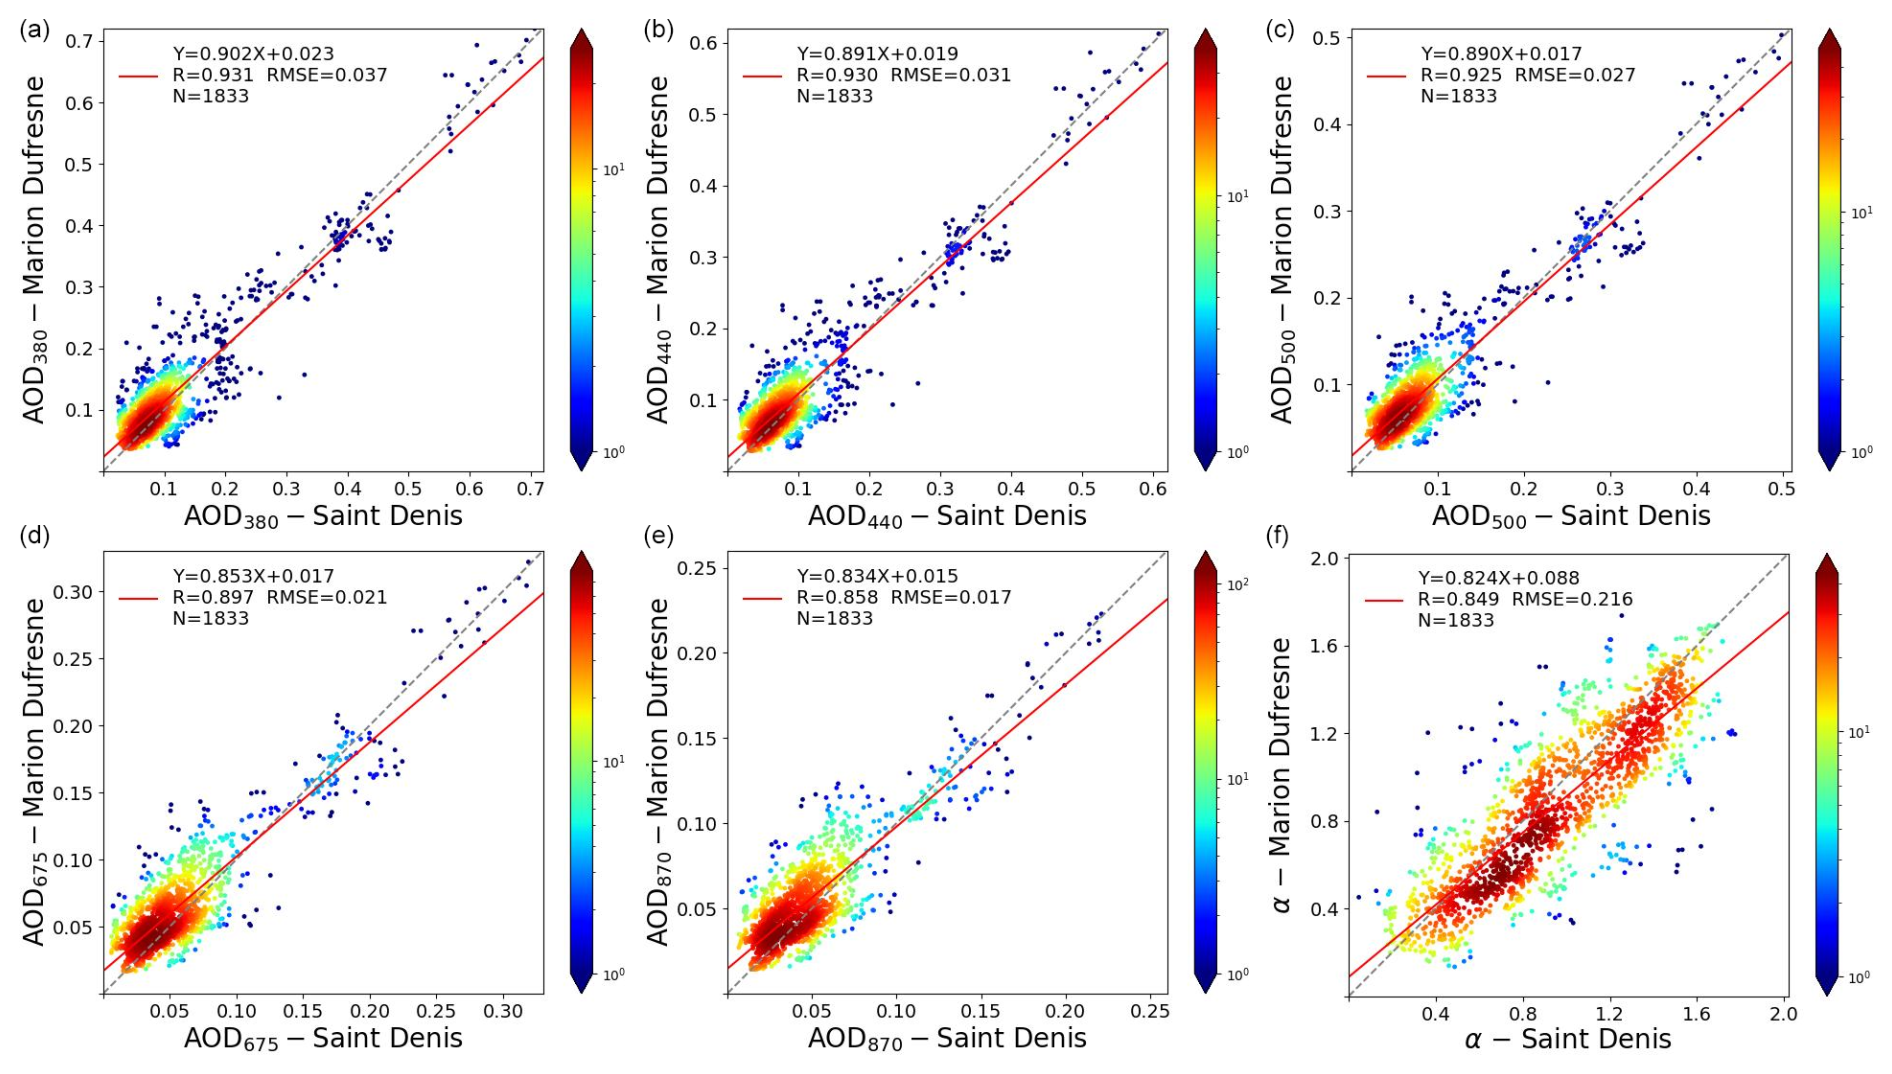
Figure 5Comparison of AOD and α measurements between the ground-based photometer at Saint-Denis (x axis) and the shipborne photometer aboard the RV Marion Dufresne (y axis). The comparison is shown for the AOD channels 380, 440, 500, 675, and 870 nm (top to bottom, left to right) and α. Color bars represent data density on a 0.01×0.01 grid for AOD and a 0.1×0.1 grid for α, with a logarithmic scale used due to strong data density along the one-to-one line. For each AOD measurement from the RV Marion Dufresne, the comparison was made with the average of AOD data from the Saint-Denis photometer within a ±3 min interval and only when the ship was within a maximum distance of 50 km from the Saint-Denis site.
For each comparison, the shipborne data were averaged over a ±3 min interval relative to the ground-based measurements. The figure follows the same structure as Fig. 4, displaying AOD comparisons at 380, 440, 500, 675, and 870 nm, along with α (arranged top to bottom, left to right). To ensure the highest data quality, only Level 2 AERONET data from Saint-Denis were used in this comparison. Since Moon-based AERONET observations are still under evaluation and have not yet reached Level 2 status, the comparison only includes AOD values obtained from direct Sun measurements.
The correlations between the shipborne and ground-based photometers are generally strong, with R values ranging from 0.86 to 0.93. However, a clear negative bias is observed when using the Saint-Denis photometer as a reference. The bias values are , , , , and for the 380, 440, 500, 675, and 870 nm channels, respectively. These biases are approximately an order of magnitude larger than those found in the previous instrument intercomparison, likely due to the altitude difference between the Saint-Denis station (93 ) and sea level. Additionally, notable differences in local pollution levels may contribute to these discrepancies. While Saint-Denis is a relatively cleaner urban site, the RV Marion Dufresne is often docked in Le Port, an area heavily influenced by industrial emissions, including those from a coal-fired power plant.
Upon examining the RMSE values between the shipborne and ground-based photometers, it is noted that they are approximately double the typical AERONET error estimates for the respective wavelengths. Specifically, the RMSE values are 0.037, 0.031, 0.027, 0.021, and 0.017 for the 380, 440, 500, 675, and 870 nm channels, respectively (AERONET error estimates are around 0.02 for the 380 nm channel and 0.01 for the channels 675 and 870 nm; for 440 and 500 nm, an intermediate value of 0.015 can be expected; Eck et al., 1999). Despite these higher RMSE values, the agreement between the shipborne and ground-based measurements remains within acceptable limits. Even if the altitude difference were not considered, the comparison between the two instruments would still be reasonable.
There is also a positive bias for α of 0.08. The larger values at the Saint-Denis site could be attributed to a diminished influence of marine aerosols and a relatively greater contribution from local urban aerosols in the city, primarily consisting of smaller particles, as reported by Duflot et al. (2022). Nevertheless, a relatively strong correlation for α is observed, better than that seen in Fig. 4, indicating that both instruments are identifying similar aerosol types in the atmospheric column, with the primary difference being the lowest 93 m, which may lead to the observed bias in AOD and α measurements. The greater variability of α during the 3 years analyzed in this study, compared to the Amaryllis-Amagas/Transama campaign, also positively contributes to the improved R values.
The use of the modified CE318-T photometer for shipborne platforms has enabled the acquisition of sky radiance measurements, a necessary input for performing aerosol retrievals with the AERONET aerosol algorithm. As introduced in Sect. 2.2.4, this algorithm retrieves detailed binned aerosol volume size distributions and spectrally independent optical properties, including refractive index as a primary parameter and derived properties such as SSA and absorption (Dubovik and King, 2000). The systematic collection of sky radiances over the past 3 years as part of the MAP-IO program aboard the RV Marion Dufresne represents a significant milestone, marking the first AERONET aerosol inversions conducted on a shipborne platform.
Among the potential retrievals available from the 3-year dataset, those from the week of 12–19 October 2023 stand out as particularly noteworthy. As discussed in Sect. 3.1, this period corresponds to an extraordinary biomass burning event linked to intense bushfires in Madagascar, which significantly elevated aerosol levels in the surrounding region. Madagascar's bushfire season, which typically spans the dry season from late July to early December (Clain et al., 2009; Duflot et al., 2010, 2022; Vigouroux et al., 2012; Verreyken et al., 2020) as in the rest of southern Africa area, reached a peak in mid-October 2023. During this time, fire alerts were exceptionally high, with the most intense activity concentrated in the western regions of Madagascar. According to the Global Disaster Alert and Coordination System (GDACS), approximately 5154 ha was burned during this period. The rigorous criteria required for AERONET Level 2 aerosol optical inversion properties7 – AOD440>0.4 and θS>50° (Dubovik et al., 2000; Holben et al., 2006) – were met several times during this period, allowing for the first detailed analysis of retrievals from shipborne measurements under sufficient aerosol load. The results of these retrievals are presented in this section.
The top-left panel of Fig. 6 illustrates the aerosol and fire activity around La Réunion during this exceptional week. This composite image, obtained from NASA Worldview, overlays a MODIS RGB image with the AOD product at 550 nm from 16 October, derived using the C6.1 MODIS Dark Target (DT) algorithm. The DT algorithm, akin to the Collection 6 version described by Levy et al. (2013), incorporates updates such as enhanced sensor calibration, stricter cloud screening, and an improved surface reflectance model for urban areas (Gupta et al., 2016). The fire counts layer, based on the detection algorithm by Giglio et al. (2003) and depicted as red spots, underscores the widespread distribution of fires across Madagascar during this period. The position of the RV Marion Dufresne on 16 October 2023, at 12:11 UTC, is marked with a black cross (20.93° S, 55.20° E) in the figure. This moment represents the first almucantar measurement meeting Level 2 aerosol retrieval criteria8, not only during this event but also across the entire dataset recorded aboard the RV Marion Dufresne since 2021. At this location, the vessel was approximately 12 km northwest of the nearest coastal point of La Réunion and 30 km from the AERONET station in Saint-Denis. The top-right panel of Fig. 6 displays back-trajectories, calculated using the HYSPLIT model (Stein et al., 2015), that estimate the origins of the air masses over the RV Marion Dufresne on 16 October 2023, at 12:00 UTC, around the time of the almucantar measurement from the boat. At 3000 m, the air mass forms a loop around Madagascar, traveling counterclockwise from the southwest to the northwest before exiting to the east. At 2000 m, the air mass crosses the southern part of the island, while at 1000 m, it remains localized near La Réunion, indicating recirculation and certainly more affected by marine aerosols. These trajectories, calculated over a 5 d period with a point every 6 h, confirm that the air masses influencing the aerosol observations over the ship predominantly originated from Madagascar, where the biomass burning episode occurred.
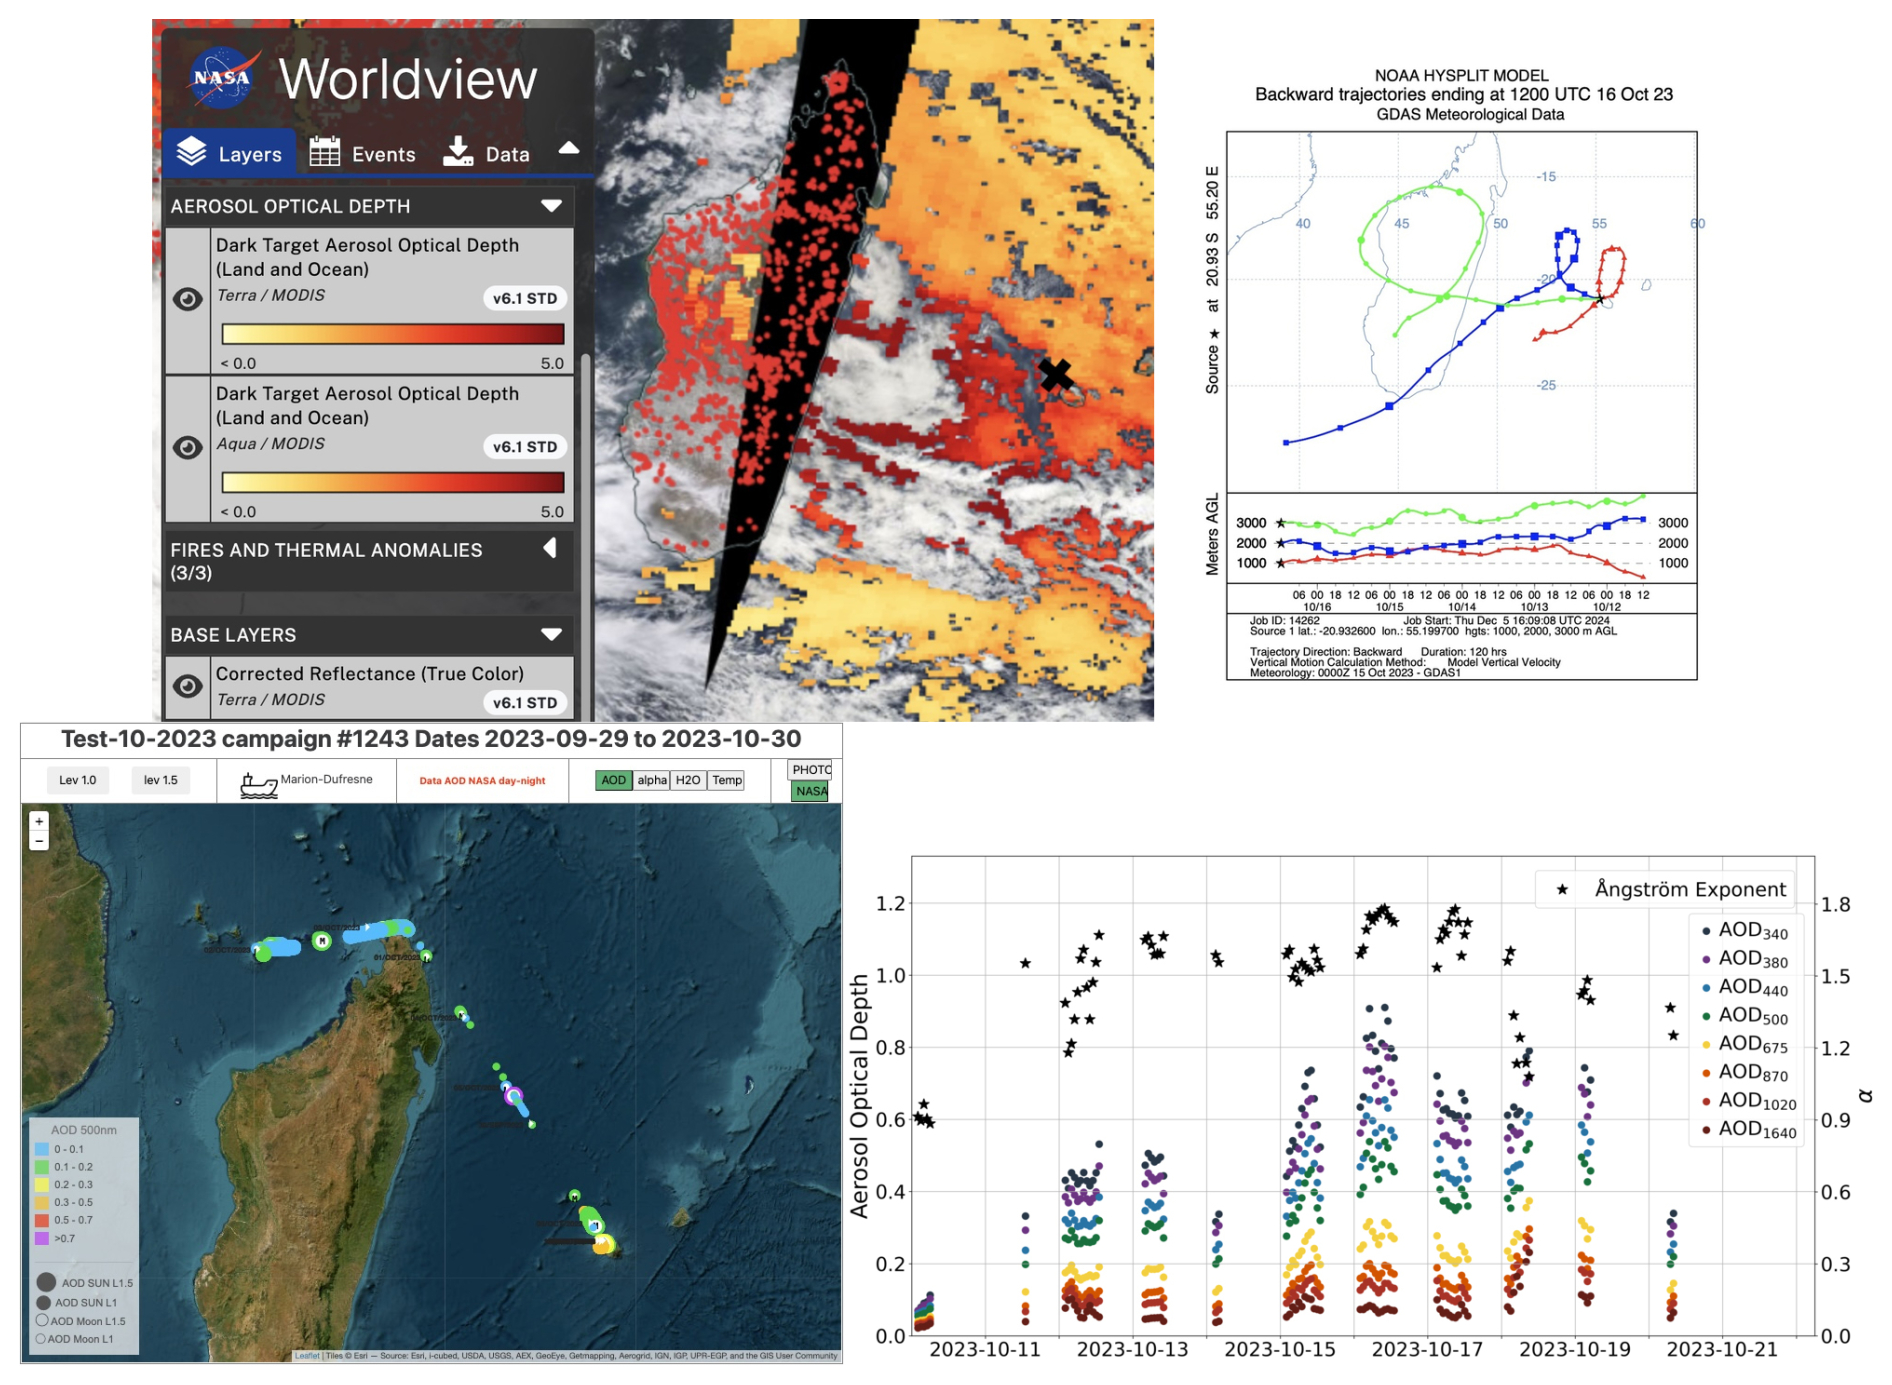
Figure 6Overview of the aerosol and fire conditions around La Réunion during the week of 12–19 October 2023. Top-left panel: composite image obtained from NASA Worldview, combining MODIS RGB imagery with the AOD550 from 16 October (C6.1 MODIS Dark Target algorithm), overlaid with fire counts detection. The black cross marks the position of the RV Marion Dufresne on 16 October (20.93 E, 55.20 S), approximately 12 km northwest of the closest coastal point of La Réunion and 30 km from Saint-Denis. Top-right panel: backward air mass trajectories for 16 October, calculated using the HYSPLIT model. Bottom-left panel: AOD values recorded during the campaign referred to as “test in the sea area” (29 September to 30 October 2023) as displayed on the PHOTONS system platform (https://mobile.photons.univ-lille.fr/, last access: 31 May 2025). Bottom-right panel: time series of hourly-averaged spectral AOD (Level 1.5) values from 10 October to 21 October, represented by navy blue (340 nm), violet (380 nm), light blue (440 nm), green (500 nm), yellow (675 nm), orange (870 nm), red (1020 nm), and brown (1640 nm) dots. Values of α are shown with black asterisks (right y axis).
The bottom-left panel of Fig. 6 illustrates the AOD500 recorded between 29 September–30 October 2023, during the campaign referred to as test in the sea area. These geolocated AOD measurements reveal the ship's trajectory, showing a voyage to northern Madagascar at the beginning of October, characterized by typically pristine AOD values, and shorter trips of 2–3 d around the port of Saint-Denis from mid-October until the end of the month. Some of these shorter trips coincided with the biomass burning episode. These AOD data are available on the PHOTONS system platform (https://mobile.photons.univ-lille.fr/, last access: 31 May 2025), and the figure can be directly generated from the web by selecting the RV Marion Dufresne and the campaign “2023 MAP-IO Test en mer 2023-10”.
The bottom-right panel presents multi-spectral Level 1.5 AOD data recorded by the shipborne-adapted CE318-T photometer from 10 October to 21 October, covering the week of interest. The values are displayed as hourly averages for all standard AERONET channels: 340 nm (navy blue dots), 380 nm (violet dots), 440 nm (light blue dots), 500 nm (green dots), 675 nm (yellow dots), 870 nm (orange dots), 1020 nm (red dots), and 1640 nm (brown dots). The temporal evolution of α is represented by black asterisks (right y axis and also displayed as hourly averages). On 10 October, conditions reflect the typical pristine marine environment, dominated by sea salt aerosols, observed during the 3-year analysis period. The mean AOD440 for this day was 0.076, with an α of 0.88 – values consistent with the dataset's overall mean. However, due to abundant cloud cover during this period (see Fig. 6), no data were recorded in the afternoon on 10 October, and only limited measurements were obtained on 11 October, primarily in the late afternoon.
Starting on 11 October, a gradual increase in AOD values, indicative of rising aerosol load, and α values, reflecting fine-mode particle dominance, becomes evident around La Réunion. The values during this period, as already introduced in Sect. 3.1, correspond to the most extreme aerosol event of the 3-year dataset, with AOD440 values consistently exceeding 0.36 and a weekly average of 0.45. The α values during this episode also peaked, averaging 1.56 for the week, well above the 95th percentile of the full dataset. Notably, 16 October registered the highest AOD levels of the entire period, with a shipborne AOD500 of 0.49±0.05 around midday, closely matching the MODIS AOD550 value of 0.52 observed in Fig. 6. After 19 October, AOD values gradually declined, with limited measurements on 20 October reflecting this reduction. Persistent cloud cover prevented further AOD data collection until 31 October, except for a few observations during the night of 24 October. By 31 October, atmospheric conditions had returned to a typical clean marine state, with a daily average AOD440 of 0.096 and an α of 1.02, consistent with baseline marine aerosol conditions. It should be noted that the marked days in the graph correspond to 00:00 UTC. Due to the geographic location and time of the year, the first morning direct Sun measurements (daylight AOD) began around 02:30 , provided cloud conditions allowed. Additionally, the new Moon occurred on the night of 14–15 October 2023, preventing Moon-based AOD measurements during the period from 8 to 21 October (from the last quarter to the first quarter of the lunar phase).
Figures 7 and 8 present the aerosol inversions performed at the RV Marion Dufresne and Saint-Denis sites during the week of 12–19 October 2023. The inversions from 12 October are shown separately in Fig. 7, as it is the only day with simultaneous measurements from both sites. Figure 8 includes the remaining inversions, consisting of data from the RV Marion Dufresne on 16 and 17 October and from Saint-Denis site on 19 October. Due to persistent cloud cover during this period, complete inversions were only obtained at Saint-Denis on 12 and 19 October and aboard the RV Marion Dufresne on 12, 16, and 17 October. In each figure, the panels from left to right represent the volume size distribution, the real part of the refractive index (RRI), and the SSA. The retrievals from the RV Marion Dufresne are represented by solid lines, while those from Saint-Denis are shown as dashed lines. The legend in each figure includes the type of scan, the exact date and time of the radiance measurement corresponding to the inversion, θS and the AOD440.
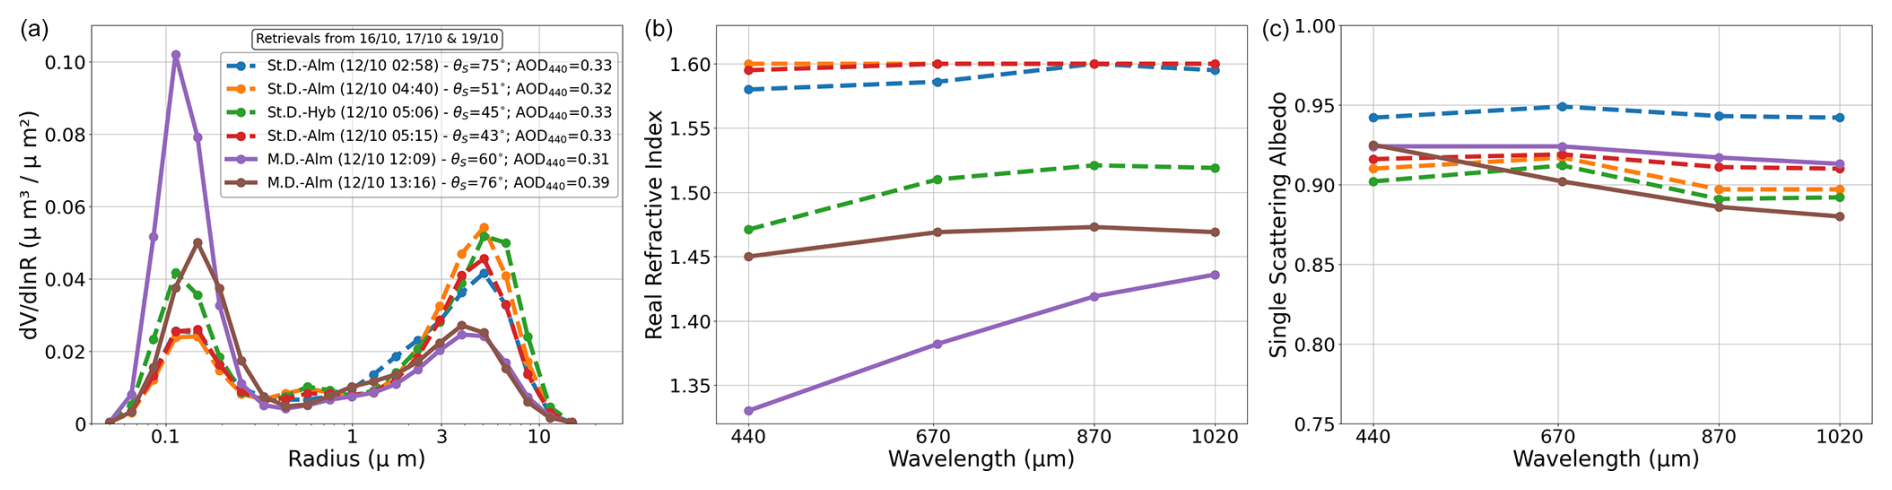
Figure 7Aerosol retrievals performed on 12 October 2023, at the RV Marion Dufresne (solid lines) and Saint-Denis (dashed lines). Panels from (a) to (c) represent the retrieved 22 bin volume size distribution; the RRI; and the SSA at 440, 675, 870, and 1020 nm. The inversions include morning measurements from Saint-Denis and afternoon measurements from the RV Marion Dufresne. The legend specifies the type of scan, exact time of radiance measurement, the θS and AOD440.
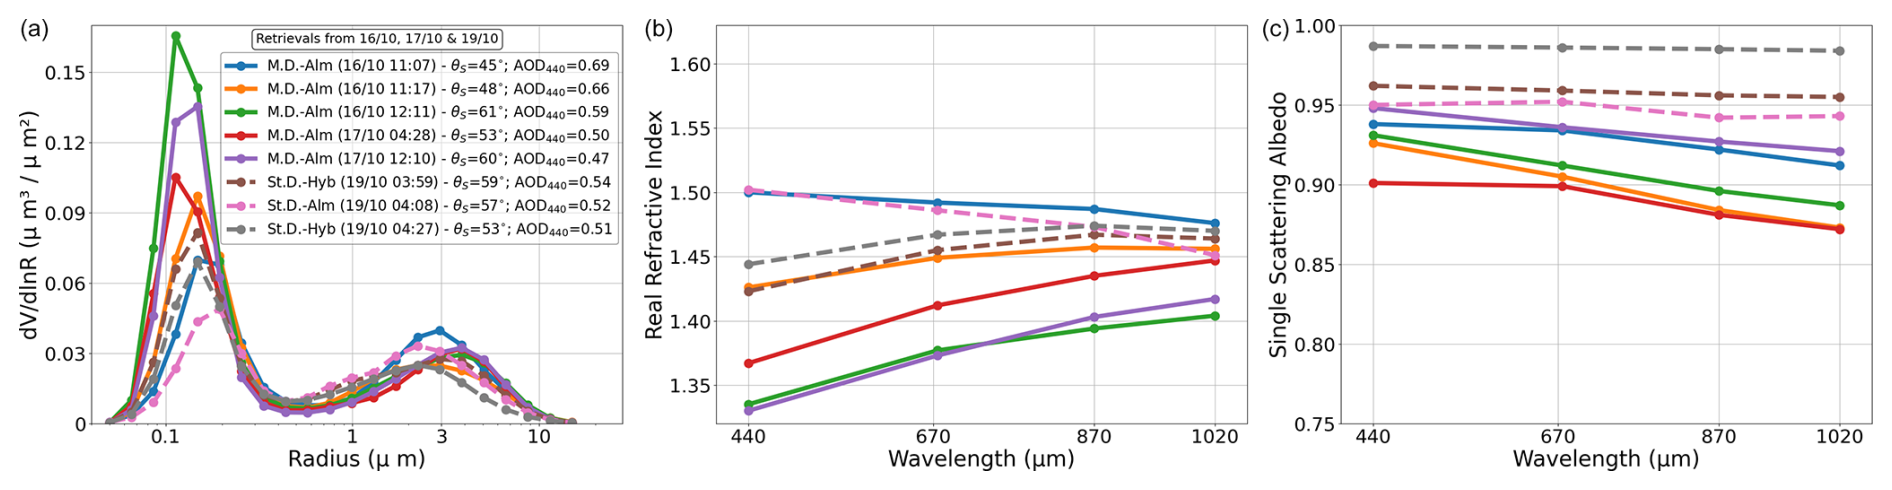
Figure 8Aerosol retrievals performed at the RV Marion Dufresne (16 and 17 October) and Saint-Denis (19 October) in 2023. Panels from (a) to (c) display the retrieved 22 bin volume size distribution; the RRI; and the SSA at 440, 675, 870, and 1020 nm. Retrievals from the RV Marion Dufresne are shown as solid lines, while those from Saint-Denis are represented as dashed lines. The legend indicates the type of scan, measurement time, θS and AOD440.
Additionally, Table 3 provides a summary of the key parameters derived from the inversions during this period. The first columns of the table include information similar to the figure legends: site name, date, type of scan, θS, α, and AOD440. The table further presents a concise overview of the aerosol size distribution parameters for both fine and coarse modes, including modal radius (RVf and RVc in [µm]) and volume concentration (CVf and CVc in [µm3 µm−2]). The total effective radius (Reff in [µm]) is also included. It is important to highlight that these size distribution parameters are derived systematically from the detailed 22-bin size distribution provided by the retrieval algorithm, rather than being direct outputs. Additional details on the methodology to obtain these size parameters can be found in the AERONET inversion product documentation (http://aeronet.gsfc.nasa.gov/new_web/Documents/Inversion_products_V2.pdf, last access: 31 May 2025). Finally, the table summarizes key aerosol optical properties, such as the RRI and the SSA at 440 nm (RRI440 and SSA440), offering a comprehensive view of some optical aerosol properties observed during this period.
Table 3Summary of aerosol inversion parameters obtained at the RV Marion Dufresne and Saint-Denis sites during the week of 12–19 October 2023. The table includes the site, date, scan type (almucantar or hybrid), θS, α, AOD440, size distribution parameters for fine and coarse modes (modal radius RVf and RVc in [µm] and volume concentration CVf and CVc in [µm3 µm−2]), the total effective radius (Reff in [µm]), and optical properties including RRI440 and SSA440.
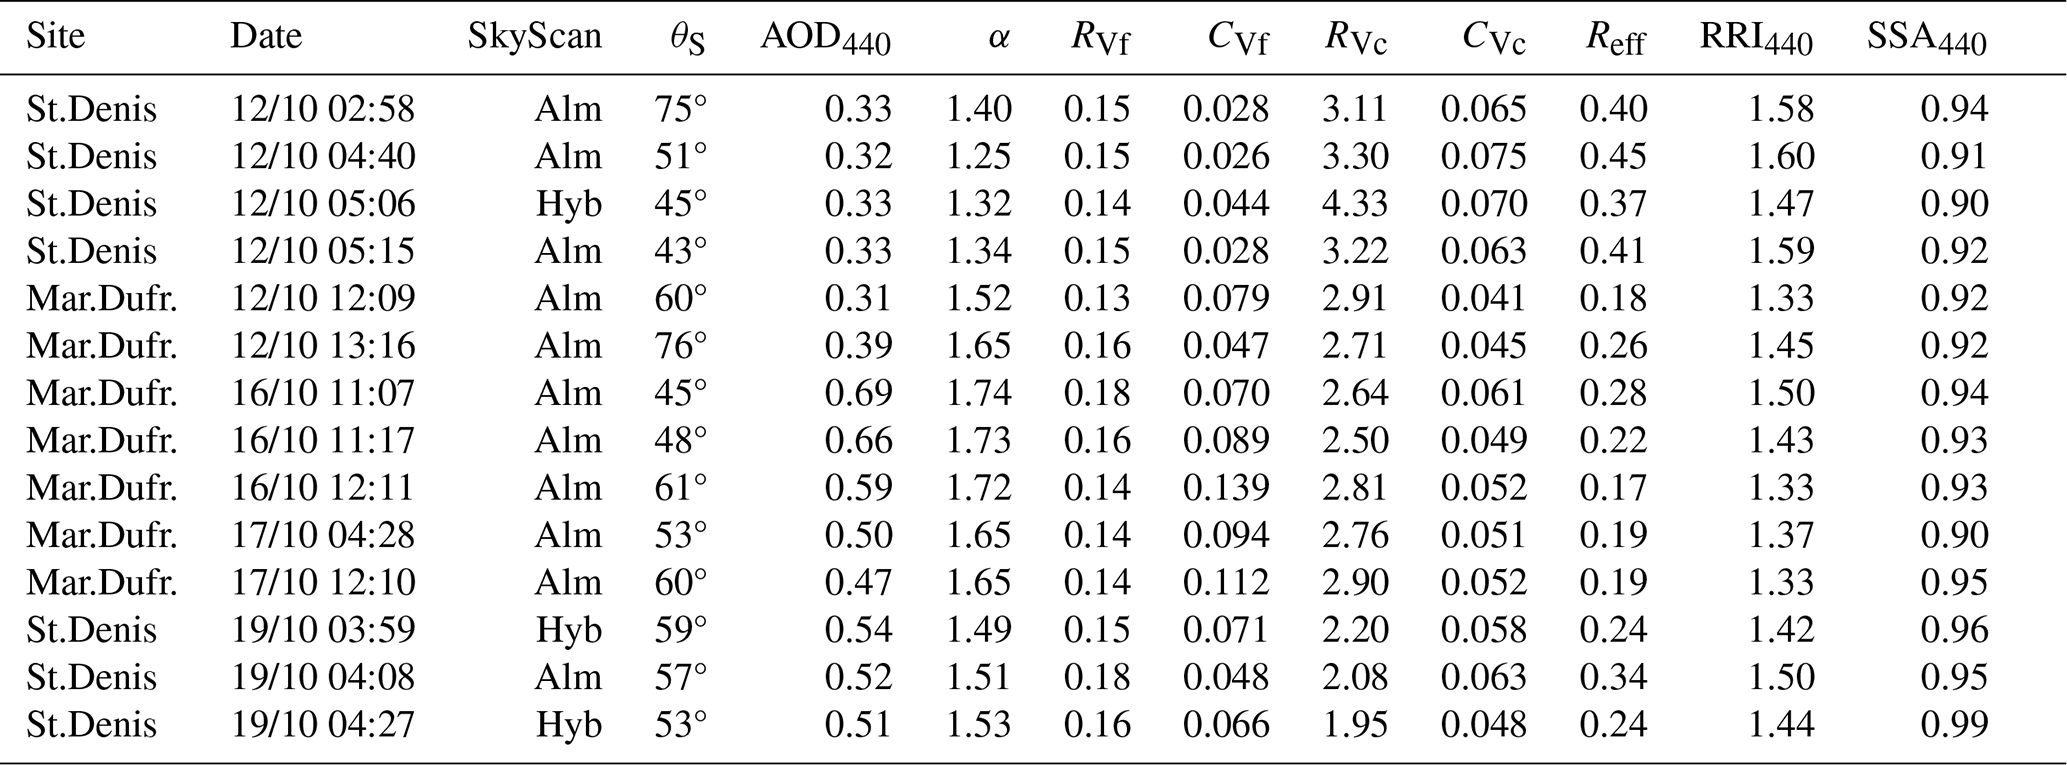
The inversions from 12 October, shown in Fig. 7, include morning measurements from the Saint-Denis site and afternoon measurements from the RV Marion Dufresne. Due to cloud cover, no valid inversions were obtained from Saint-Denis in the afternoon or from the RV Marion Dufresne in the morning. During this day, the RV Marion Dufresne was located in the port area of La Réunion, approximately 30 km from the Saint-Denis site. AOD440 values remained relatively constant throughout the day, approximately 0.32–0.33, except for the last inversion from the RV Marion Dufresne, which recorded a higher value of 0.39. This evolution is also reflected in the RV Marion Dufresne measurements presented in Fig. 6. Value of α show a more noticeable evolution, increasing from 1.2–1.3 in the morning to 1.5–1.6 in the afternoon (values presented in Table 3 individually for each retrieval). This shift suggests a greater dominance of fine-mode aerosols (biomass burning) over coarse-mode aerosols (pristine marine aerosol) as the day progresses. This evolution in α could explain why coarse-mode aerosols are more prominent in the Saint-Denis inversions compared to those from the RV Marion Dufresne in the left panel of Fig. 7. This trend is further supported by the values of Reff presented in Table 3, where the morning inversions from Saint-Denis range between 0.37–0.45 µm, while the afternoon inversions from the RV Marion Dufresne fall between 0.18–0.25µm.
Regarding fine-mode aerosols, while the modal median radius (RVf) remains consistent across inversions from both sites throughout the day (ranging from 0.13 to 0.16 µm), significant differences are observed in concentration values. Notably, higher fine-mode volume concentration values (CVf) are retrieved from the shipborne data (top-right panel, ranging from 0.047 to 0.079 µm3 µm−2) compared to those obtained at Saint-Denis (ranging from 0.026 to 0.044 µm3 µm−2). Additionally, lower RRI values are retrieved from the RV Marion Dufresne inversions compared to Saint-Denis retrievals. The Saint-Denis inversions at 02:58, 04:40, and 05:15 UTC exhibit CVf values that are likely underestimated, accompanied by saturated RRI values reaching the upper limit of 1.6. Conversely, the RV Marion Dufresne inversion at 12:09 UTC reveals exceptionally high CVf values and an RRI nearing the lower limit of 1.33 of AERONET inversion for the 440 nm channel. These results are likely due to the well-documented anti-correlation often observed between RRI and fine-mode size distribution, particularly in fine-mode concentration. This phenomenon is extensively described in the literature (Dubovik et al., 2000, 2002b; Torres et al., 2014; Fedarenka et al., 2016; Sinyuk et al., 2020; Herrera et al., 2022). For instance, Fig. 33 of Herrera et al. (2022) illustrates the correlation matrix for retrieval unknowns in a simulated biomass burning scenario, revealing a strong negative correlation (dark blue) between RRI and fine-mode size distribution concentrations. The absence of angular measurements in some scenarios, particularly between 40–90° of scattering angle due to cloud-screening criteria in almucantar and hybrid scans based on symmetry tests, likely amplifies this anti-correlation in the dataset from both sites during that week. It is worth noting that polarimetric observations can mitigate this anti-correlation and improve retrieval accuracy, as shown in sensitivity studies by Fedarenka et al. (2016). However, neither the shipborne nor the Saint-Denis photometers were equipped with calibrated polarized measurement, limiting further exploration of this issue.
Two inversions – Saint-Denis at 05:06 UTC and RV Marion Dufresne at 13:16 UTC – show intermediate and similar values for both the size distribution and RRI, making them the most realistic representations of the columnar aerosol properties for this day. These intermediate RRI values, ranging from 1.45 to 1.52, are reasonably expected for a mix of biomass burning and sea salt aerosols. While Dubovik et al. (2002b) reported an RRI of approximately 1.51 for pure biomass burning aerosols in southern Africa, the mixture with sea salt could reduce the RRI since the value of this aerosol component is typically between 1.35–1.40, depending on water uptake of sea salt under high relative humidity conditions (Schuster et al., 2009). It is important to highlight that there are no detailed studies available for direct comparison of the observed columnar RRI values in this specific region, including the southeastern African Indian Ocean and the Madagascar–La Réunion area, where, under high aerosol load conditions, biomass burning is typically mixed with sea salt aerosols (Duflot et al., 2022). Although many studies have investigated the gas-phase contributions associated with biomass burning episodes in the region (Clain et al., 2009; Duflot et al., 2010; Vigouroux et al., 2012; Verreyken et al., 2020), and Duflot et al. (2022) provided some insights into aerosol size properties, detailed analyses of column-integrated aerosol optical properties remain scarce – mainly due to the very limited availability of Level 2 aerosol inversions in this region. At the Saint-Denis site, for instance, only nine almucantar inversions meet the Level 2 criteria of AOD440>0.4 and θS>50° across the entire dataset (2003–2024). These inversions are exclusively from the dry season and likely represent a mixture of biomass burning and sea salt aerosols (Duflot et al., 2022). The average RRI values for these nine inversions at Saint-Denis are 1.51±0.06, 1.49±0.05, 1.48±0.05, and 1.46±0.05 at 440, 670, 870, and 1020 nm, respectively, and are similar to the intermediate values found in the two aforementioned inversions. The relatively high variability (standard deviation) in these RRI values is likely driven primarily by varying contributions of sea salt aerosols in the mixture, which can lower the RRI compared to that of pure biomass burning aerosols. Another potential contributor to this variability is the previously mentioned anti-correlation, which introduces a relatively high uncertainty in the RRI values derived from AERONET inversions. For reference, Sinyuk et al. (2020) reported an uncertainty of approximately 0.02 in RRI for pure African biomass burning aerosols when AOD440=0.4.
As noted by Sinyuk et al. (2020), despite the anti-correlation between RRI and fine-mode aerosol volume concentration, their combined effects counterbalance in terms of aerosol scattering. Thus, the capability of AERONET-type inversions to accurately distinguish between absorption and scattering remains unaffected, even in cases where the anti-correlation is significant. Consequently, even in scenarios with high uncertainties in RRI and fine-mode volume concentration, the retrieval of SSA is highly accurate under the conditions established by Level 2 retrieval criteria. The SSA values observed in the shipborne and Saint-Denis inversions (right panel) are therefore reliable and show spectral values ranging from 0.88 to 0.95, with most falling between 0.90–0.92. These values are less absorbing than the averages typically found in pure biomass burning episodes in southern Africa (e.g. Dubovik et al., 2002a; Giles et al., 2012; Denjean et al., 2020), which range between 0.75–0.85. The higher SSA values observed here are consistent with what is expected for a case of mixed biomass burning and sea salt aerosols – a highly scattering and non-absorbing aerosol type – or, more generally, even for aging biomass burning aerosols influenced by high relative humidity (Mallet et al., 2019). Indeed, the spectral SSA averages of the aforementioned nine AERONET Level 2 inversions from Saint-Denis are 0.92±0.03, 0.89±0.03, 0.87±0.04, and 0.85±0.04 at 440, 670, 870, and 1020 nm, respectively. The SSA values retrieved from the inversions presented in Fig. 7 are broadly consistent with these averages, though they appear slightly less absorbing overall. Among them, the inversion from the RV Marion Dufresne at 13:16 UTC stands out as the closest match to the Level 2 averages at the Saint-Denis site, with spectral SSA values of 0.92, 0.90, 0.89, and 0.88 at 440, 670, 870, and 1020 nm, respectively. This retrieval, with an AOD440 of 0.39 and θS=75.8°, is the only one on 12 October that nearly satisfies Level 2 criteria, further supporting the reliability of shipborne retrievals under conditions of sufficient aerosol load.
Beyond the retrievals performed on 12 October, additional inversions were obtained from the RV Marion Dufresne on 16 and 17 October and from the Saint-Denis site on 19 October, as shown in Fig. 8. The lack of coincident retrievals between the two sites on these dates is primarily attributed to persistent cloud cover in the region, which limited the number of valid sky radiance measurements. Although the inversions from Saint-Denis on 19 October satisfy the AOD440>0.4 and θS>50° criteria (including two hybrid and one almucantar scans), they do not achieve Level 2 status due to insufficient valid radiances under the symmetry criteria, likely a consequence of the prevalent cloud cover (Level 2 inversions require more valid radiance angles than Level 1.5; for more details see Table 3 from Holben et al., 2006). For the retrievals from the RV Marion Dufresne, RVf values ranging between 0.14–0.18 µm and Reff values between 0.19–0.28 µm are consistent across the inversions, align with the values observed on 12 October, and agree with the retrievals from Saint-Denis on 19 October. Notably, the previously discussed anti-correlation between fine-mode concentration (CVf) and RRI is evident in the last three inversions: two from 17 October and, to a lesser extent, the final inversion from 16 October. This phenomenon, as highlighted earlier, is a common retrieval artifact amplified under conditions such as limited angular radiance measurements caused by cloud cover. The first two inversions from 16 October, despite having slightly lower θS than the Level 2 threshold of 50°, appear to provide the most realistic retrievals for both fine-mode concentration and RRI. These retrievals show RRI values ranging between 1.43–1.50, consistent with the historical average RRI values for the nine Level 2 inversions from Saint-Denis, and align with expectations for a mixture of biomass burning and sea salt aerosols.
The SSA values for the five RV Marion Dufresne inversions range between 0.88–0.95, with generally higher absorption observed at longer wavelengths. These values are consistent with the historical average SSA values for the nine Level 2 inversions from Saint-Denis, though they are slightly higher. As in the retrievals from 12 October, the varying influence of sea salt aerosols in the mixture could explain the differences with the averaged Saint-Denis values. Additionally, Eck et al. (2013) reported a seasonal trend in SSA during the dry season at three South African sites, with values for pure biomass burning aerosols being highest at the end of the season. Apart from the variation on the sea salt contribution, this trend could also explain the differences with the averaged values, as the period analyzed here is October (while the nine inversions include also retrievals from August, September, and October). While some seasonality may exist, the SSA values retrieved from Saint-Denis on 19 October are notably higher and appear unrealistic for the observed mixture of biomass burning and sea salt aerosols during this week. This discrepancy is likely a result of cloud cover impacting the inversion quality, as retrievals that do not meet Level 2 criteria are expected to exhibit greater uncertainties.
The overall good performance of the ship-adapted CE318-T photometer on board the RV Marion Dufresne has been demonstrated by the consistent acquisition of high-quality triplets that meet AERONET Level 1.5 criteria, as well as the first successful retrieval of aerosol microphysical and optical properties at sea. These results confirm the system's reliability under conditions typical of large research vessels, which are characterized by limited and slow movements.
To quantify the small and slow movements of the RV Marion Dufresne, a full-year analysis was performed using data from 2023, based on consecutive 7 min segments corresponding to the typical duration of an almucantar scan. For each segment, the mean and standard deviations of pitch and roll were computed to evaluate the amplitude and characteristics of the vessel's motion. An example of such a 7 min segment is shown in Fig. 9, which presents histograms of pitch (left panel) and roll (central panel) measured during an almucantar scan performed at 11:07 UTC on 16 October. Dashed lines indicate the mean values, annotated within each panel, while arrows mark the corresponding standard deviations. A fitted normal distribution curve is shown in black, and the data are displayed as shaded histograms with black edges for clarity. It is important to note that the standard deviation provides a direct measure of the amplitude of the vessel's oscillatory motion, while the mean values are more influenced by navigation factors such as heading relative to wave direction or vessel speed. The full-year analysis shows that the standard deviation over 7 min intervals typically ranges between 0.4 and 0.5° for both pitch and roll. These statistics include all weather conditions; however, variability tends to be lower during clear-sky periods. For instance, the example shown in Fig. 9, recorded under clear-sky and relatively calm conditions, exhibits standard deviations of approximately 0.2°.
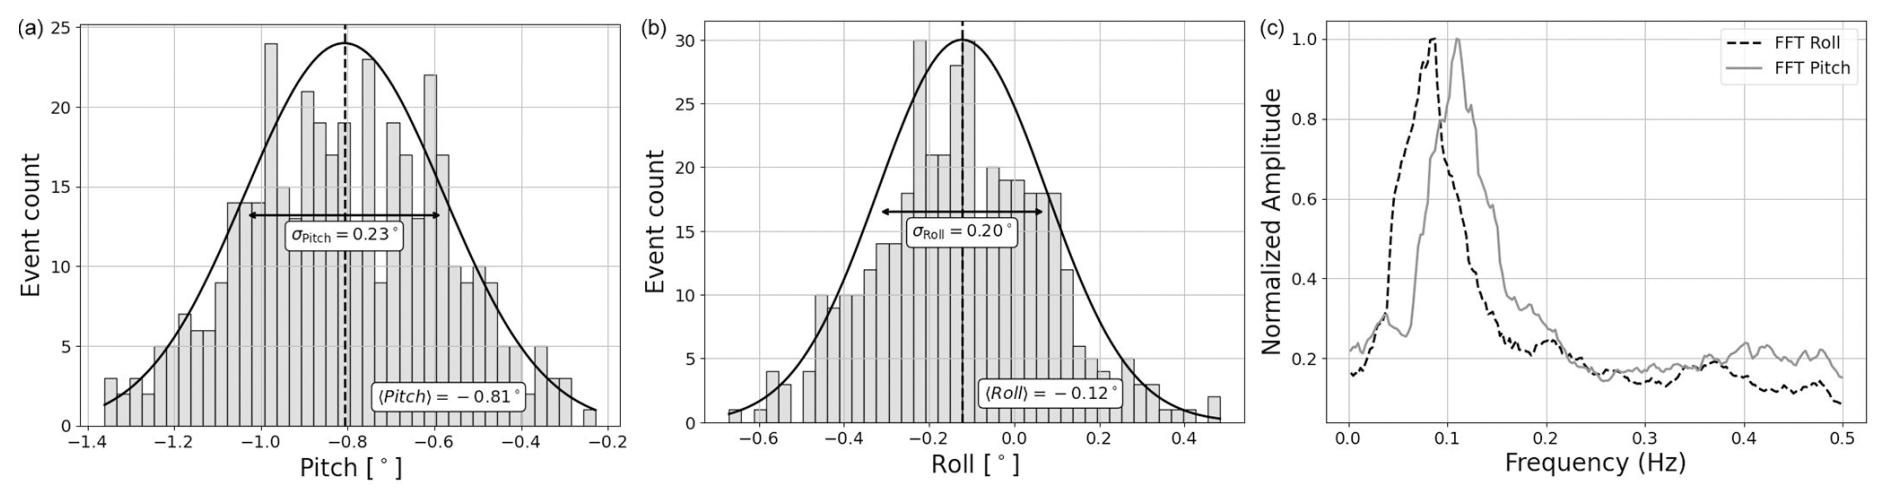
Figure 9Histograms of pitch (a) and roll (b) values recorded during the 7 min almucantar measurement at 11:07 UTC on 16 October 2023. Dashed black lines indicate the mean values, with standard deviations represented by black arrows. A normal distribution curve is also shown. Panel (c) displays the frequency spectra of pitch and roll motions, derived via FFT.
Additionally, the right panel of Fig. 9 presents the frequency spectra of these same pitch and roll movements, obtained via a fast Fourier transform (FFT), which decomposes the time series into its frequency components. A filtering step was applied to remove the zero-frequency component and focus on oscillatory behavior. The dominant frequencies are found around 0.1 Hz (slightly lower for roll and slightly higher for pitch), corresponding to oscillation periods of approximately 10 s. These frequency peaks are consistently observed aboard the RV Marion Dufresne, indicating that the vessel's oscillations are not only small in amplitude, but also slow in nature.
The success of quality-assured AOD measurements relies on the ability of the continuous tracking system (specifically developed for this marine implementation, as described in Sect. 2.1.2) to compensate for oscillations around the vessel's mean orientation. Once the Sun enters the tracking system's field of view (thanks to the initial attitude correction provided by the Trimble ABX-Two), the photometer locks on and maintains alignment through active tracking for the duration of the direct Sun (or Moon) measurement sequence. As shown in Sect. 3, this implementation performs reliably aboard the RV Marion Dufresne, whose slow and low-amplitude movements fall within the tolerance range of the continuous tracking system. Under these conditions, the instrument consistently yields AOD measurements that meet Level 1.5 quality criteria.
A preliminary analysis of AOD data from similar installations deployed in 2024 on other large research vessels, such as the RV Gaia Blu (83 m, ESA IDEAS-QA4EO program, in collaboration with the Italian Istituto di Scienze Marine del Consiglio Nazionale delle Ricerche) and the RV Sarmiento de Gamboa (72 m, in collaboration with Valladolid University and the Consejo Superior de Investigaciones Científicas), confirms that the system is well-adapted for marine aerosol monitoring on large and stable vessels. In these environments, which show motion characteristics similar to those aboard the RV Marion Dufresne, AOD Level 1.5 data have also been routinely obtained. Although the data from these new deployments have not yet been analyzed in detail, they hold significant potential for expanding the system's application.
However, despite its robustness on large vessels, the current system faces significant limitations when applied to smaller research vessels. Tests on the 20 m NOAA RV Shearwater, a high-speed catamaran used during the PACE-PAX campaign in September 2024 (https://espo.nasa.gov/pace-pax, last access: 31 May 2025), showed frequent pitch and roll standard deviations exceeding 2–3°, even under calm conditions. These larger-amplitude motions caused the continuous tracking system to fail, preventing the acquisition of stable Level 1.5 AOD measurements. To address this challenge, a stabilizing mount was tested to actively counteract ship movements while keeping the continuous tracking system operational. This solution successfully enabled Level 1.5 AOD acquisition, achieving similar measurement frequency to that of large vessels. Nevertheless, stabilizing mounts are significantly more expensive (roughly four to five times the cost of the Trimble system), and their long-term resilience in harsh marine environments is still uncertain. In contrast, the Trimble ABX-Two has functioned reliably for 3 years aboard the RV Marion Dufresne without failure. Further testing is needed to evaluate whether stabilizing mounts can offer a sustainable and robust long-term solution for dynamic platforms. An alternative approach currently under development within the Agora Lab involves implementing adaptive, faster tracking based on proportional–integral–derivative (PID) control algorithms. These would adjust tracking speeds dynamically in response to pitch and roll fluctuations, enabling Sun lock even in more turbulent sea conditions.
The shipborne photometer's capabilities extend beyond automatic AOD measurements, as demonstrated by the successful AERONET standard inversions conducted from the RV Marion Dufresne (see Sect. 4), made possible by routine onboard sky radiance acquisitions. The inversions presented in Sect. 4, although limited to a few days with sufficient aerosol load for quality-assured retrievals (based on AERONET Level 2.0 criteria), show retrieved values consistent with expectations for the region and comparable to historical averages from the nearby Saint-Denis AERONET site. These results confirm the potential for reliable inversions from a moving platform, despite the challenges inherent to shipborne measurements, when conditions are favorable.
Although ship movements are recorded, with the Trimble ABX-Two system generating and storing positioning data every second, the current approach has been to invert radiance measurements using the standard almucantar angles without applying any corrections. The main reason for this choice is that the observed ship movements are generally small as shown in Fig. 9. In this regard, a mean pitch and roll value below 1° falls within the leveling precision of standard ground-based AERONET stations, as the bubble-level system of the CE318-T introduces a comparable uncertainty in ground-based installations9. Additionally, the observed standard deviations are not much higher than the manufacturer's specified error for the Trimble ABX-Two system (0.1–0.2°), further questioning both the necessity and the potential accuracy of applying these angular corrections. Moreover, any post-processing correction would disrupt the symmetry criteria used in almucantar and hybrid scans, where left and right branch measurements are traditionally considered symmetric for cloud-screening purposes. Given these factors, the most appropriate use of the recorded ship attitude data appears to be as a quality control criterion, requiring mean pitch and roll values to remain below ±1° and standard deviations below 0.5°.
These standard deviation values of the ship's movements could be considered comparable to pointing errors in almucantar measurements. The impact of pointing errors on retrieval properties has been analyzed in previous studies. For instance, Dubovik et al. (2000) modeled a 1° mispointing in azimuth (twice the threshold suggested here) and found that the only significant effect on inversion products was observed in desert dust retrievals. It is worth noting that the authors did not average the left and right sides of the almucantar (personal communication, 2025), so the actual effect would likely be smaller. In a later study, Torres et al. (2014) tested azimuth and zenith errors of 0.4° (while also averaging almucantar measurements) and observed minimal influence on almucantar retrievals, even for desert dust. The largest effects were seen in the principal plane scenario, which, unlike almucantar scans, lacks the possibility of averaging and is now obsolete.
The analysis of the heading angle differs slightly from that of pitch and roll. This angle represents the ship's direction and is corrected each time the instrument performs Sun pointing and tracking. For shipborne photometers, this process occurs before each branch of the almucantar measurement (seven wavelengths per branch, left and right), leading to a tracking update approximately every minute. The heading standard deviation observed within 1 min intervals are roughly half the amplitude of pitch and roll variations, suggesting that their impact on almucantar symmetry is even less significant.
Further improvements to mitigate the impact of ship movement on sky radiance measurements could involve actively correcting the photometer's orientation in real time using pitch and roll information from the attitude system. This approach appears to be a promising long-term and cost-effective solution, as it would eliminate the need for additional mechanical stabilization. However, its implementation would require significant development efforts from the instrument manufacturer, including the integration of dynamic motion compensation algorithms directly into the tracking system. Alternatively, a stabilizing platform, like the one tested on the NOAA RV Shearwater, could be used to counteract ship movements and maintain stable pointing. This method would offer the advantage of simplifying post-processing by minimizing the need for attitude corrections. However, it also requires the integration of a costly stabilizing system, which may not be practical for all shipborne deployments.
The primary objective of this study was not to conduct an exhaustive analysis of aerosol inversions but rather to demonstrate the feasibility of performing such measurements and retrieving aerosol optical properties from a moving platform in open ocean conditions. A more detailed validation could not be achieved with the RV Marion Dufresne dataset, as only 1 week with AOD440>0.4 was recorded over a 3-year period, and even then, frequent cloud cover further limited the number of quality-assured retrievals, making a more comprehensive analysis unfeasible. Nonetheless, the successful retrievals obtained confirm the potential of shipborne aerosol inversions and establish a foundation for future, more detailed studies. In this regard, the dataset from the RV Gaia Blu, which has been operating in the Mediterranean Sea since February 2024, appears to be a strong candidate for a more extensive assessment. A preliminary evaluation of the data recorded by the shipborne photometer on board RV Gaia Blu indicates more frequent episodes with AOD440 exceeding 0.4 under clear-sky conditions, including episodes influenced by anthropogenic sources, desert dust, and even volcanic emissions from Etna. Moreover, the frequent proximity of the RV Gaia Blu to several Italian ground-based AERONET sites provides an excellent opportunity for a thorough validation of aerosol retrievals by enabling direct comparisons with the same retrievals performed using fixed photometer data. This will allow for an exhaustive assessment of retrieval performance, offering deeper insights into the accuracy and reliability of shipborne aerosol inversions, as well as the influence of ship motion on retrieval quality and potential limitations.
The installations in 2024, along with future deployments foreseen for 2025, will establish a foundation for a new network of ship-based automatic photometers. This network is expected to significantly enhance the study of aerosols in marine environments, particularly in regions that are otherwise challenging to monitor. In addition to supporting systematic aerosol characterization in purely maritime settings, this network will contribute to the validation of satellite observations. It will provide valuable ground-truth data not only for the AOD product but also for more complex aerosol optical properties, such as SSA. These data will be critical for validating the advanced retrievals from upcoming multi-angular polarimetric sensors on board space missions, such as the ESA-EUMETSAT 3MI/MetOp-SG and NASA's PACE mission, which includes the SpexOne and HARP2 sensors (details and other mission sensors in Dubovik et al., 2019).
This study demonstrates the feasibility of establishing a permanent AERONET site aboard research vessels, adhering to the same automated measurement protocols and standards as conventional ground-based sites. Over a 3-year period (July 2021–June 2024), the first ship-based AERONET site equipped with automatic photometer measurements was operated aboard the RV Marion Dufresne, primarily in the southwestern Indian Ocean, collecting a continuous AOD dataset as part of MAP-IO program. The mean AOD values – 0.093±0.075, 0.063±0.041, and 0.054±0.031 at 440, 675, and 870 nm, respectively – are consistent with previous studies characterizing aerosols in uncontaminated marine environments. Similarly, the average α of 0.76±0.40 reflects the dominance of coarse-mode aerosols, with episodic contributions from fine-mode aerosols.
The reliability and precision of the ship-adapted CE318-T photometer were validated through detailed intercomparisons, particularly during the Amaryllis-Amagas/Transama campaign. During this campaign, two photometers (#1273 and #1243) were simultaneously operated aboard the RV Marion Dufresne between April and June 2023, enabling a direct comparison of their measurements. Strong correlations (R>0.965) were observed across all analyzed AOD wavelengths (380–870 nm), with RMSE values ranging from 0.005 to 0.008 and biases between and . These results confirm the high precision of the shipborne system and are comparable to those reported by Yin et al. (2019), who analyzed CE318-T measurements against MAN Microtops-II observations during the OCEANET campaigns aboard the RV Polarstern, finding RMSE values of 0.009–0.015 (their Fig. 4). Notably, the strong correlations and minimal biases observed in AOD comparisons during this study align with those typically obtained at ground-based calibration sites during intercalibration periods with AERONET master instruments. This consistency underscores the reliability of shipborne Level 1.5 data, reinforcing its comparability to well-established AERONET standards.
In addition to co-located comparisons, the shipborne photometer was validated against the AERONET ground-based site at Saint-Denis, located 93 and approximately 20 km from the port of La Réunion. A systematic negative bias was observed in the shipborne AOD data relative to Saint-Denis, ranging from to , which can be attributed to altitude differences and variations in local aerosol sources. While Saint-Denis is considered a relatively clean urban site, the RV Marion Dufresne is frequently docked in Le Port, an area influenced by industrial emissions, including those from a coal-fired power plant. Similarly, α exhibited a positive bias of 0.08, likely reflecting a greater contribution of fine-mode aerosols at Saint-Denis, where the reduced influence of marine aerosols allows urban aerosol contributions to become more dominant (Duflot et al., 2022). Despite these systematic differences, the strong correlations observed between the shipborne and ground-based measurements (R=0.86–0.93) demonstrate that both instruments capture similar temporal aerosol variability, further supporting the reliability of shipborne photometer.
A key achievement of this study is the successful application of the AERONET aerosol inversion algorithm to shipborne platforms, resulting in the first quality-assured retrievals of aerosol microphysical and optical properties from a moving research vessel. The data obtained during the exceptional biomass burning event of October 2023 exemplify the system's capability to perform advanced aerosol characterization in remote marine environments. During this episode, AOD440 values frequently exceeded 0.36, peaking at 0.73, and α values averaged 1.56, highlighting a clear shift from background marine conditions to a fine-mode-dominated regime. Backward trajectory analyses confirmed the predominant influence of fine-mode aerosols transported from Madagascar, where intense biomass burning activity was occurring.
Retrievals of aerosol microphysical and optical properties during this period from measurements aboard the RV Marion Dufresne were presented alongside those from the Saint-Denis site in Figs. 7 (for the coincident day, 12 October, at both sites) and 8 (for non-coincident days between the two sites). The retrieved fine-mode modal radii (RVf), summarized in Table 3, remained remarkably consistent across inversions from both the shipborne platform and the Saint-Denis site, ranging from 0.13 to 0.18 µm. This consistency underscores the ability of the shipborne photometer to accurately characterize fine-mode particle size during biomass burning episodes. However, fine-mode volume concentrations (CVf) derived from the shipborne photometer were consistently higher than those retrieved at Saint-Denis. This discrepancy can be attributed to the well-documented anti-correlation between fine-mode volume concentration and refractive index (Herrera et al., 2022), which may be further amplified in inversions where limited angular radiance data, due to cloud cover, influences retrieval accuracy.
As noted by Sinyuk et al. (2020), even in cases with marked anti-correlation between fine-mode volume concentration and refractive index, the AERONET retrieval algorithm reliably distinguishes between aerosol absorption and scattering properties. Indeed, the SSA retrievals from the shipborne platform exhibit robust performance, with values ranging from 0.88 to 0.95, indicating increased absorption at longer wavelengths. These SSA values are consistent with expectations for a mixture of biomass burning and sea salt aerosols (Dubovik et al., 2002b). Moreover, the SSA values obtained during this week closely match with historical data from the Saint-Denis site under high aerosol load conditions, meeting the AOD440>0.4 threshold required for AERONET Level 2 criteria.
In conclusion, the deployment of a CE318-T photometer aboard the RV Marion Dufresne has demonstrated its viability for providing high-quality aerosol measurements comparable to those of AERONET ground-based stations. These findings validate the system's potential to close observational gaps in marine aerosol research, offering a novel approach for satellite validation and advancing our understanding of aerosol–climate interactions in remote oceanic environments.
| AERONET | Aerosol Robotic Network |
| AOD | Aerosol optical depth |
| AODx | Aerosol optical depth at wavelength x nm |
| CE318-T | Cimel Electronique Sun Sky Lunar Multispectral Photometer model CE318-T |
| CVf | Fine-mode volume concentration (column-integrated volume size distribution) [µm3 µm−2] |
| CVc | Coarse-mode volume concentration (column-integrated volume size distribution) [µm3 µm−2] |
| DN | Digital number |
| GPS | Global positioning system |
| Ifremer | Institut Français de Recherche pour l'Exploitation de la Mer |
| IPCC | Intergovernmental Panel on Climate Change |
| L1.0, L1.5, L2.0 | AERONET data levels (preliminary processed, cloud-screened, quality-assured) |
| MAN | Maritime Aerosol Network |
| MAP-IO | Marion Dufresne Atmospheric Program – Indian Ocean |
| MODIS | Moderate Resolution Imaging Spectroradiometer |
| NASA | National Aeronautics and Space Administration |
| NOAA | National Oceanic and Atmospheric Administration |
| PWV | Precipitable water vapor |
| R | Pearson correlation coefficient |
| Reff | Total column effective radius of volume size distribution [µm] |
| RVf | Fine-mode modal radius of volume size distribution [µm] |
| RVc | Coarse-mode modal radius of volume size distribution [µm] |
| RMSE | Root-mean-square error |
| RRI | Real part of refractive index |
| RRIx | Real part of refractive index at wavelength x nm |
| RV | Research vessel |
| SSA | Single scattering albedo |
| SSAx | Single scattering albedo at wavelength x nm |
| TAAF | Terres Australes et Antarctiques Françaises |
| α | Ångström exponent (computed over the 440–870 nm range) |
| λ | Wavelength |
| θS | Solar zenith angle |
The AOD data from the shipborne photometer are publicly accessible at https://mobile.photons.univ-lille.fr/ (last access: 31 May 2025). The AOD data from the Saint-Denis AERONET station, as well as the retrievals from the AERONET standard aerosol algorithm for this site, are available at https://aeronet.gsfc.nasa.gov/ (last access: 31 May 2025). The aerosol retrieval data obtained from the shipborne photometer inversions are not currently available online.
BT led the writing of the manuscript, including the preparation of tables, figures, and result analysis. LB, GD, and FM designed and developed the shipborne adaptation of the instrument. AS contributed substantially to the scientific discussion and elaboration of the introduction. IS managed the data processing for AOD and inversions within the AERONET Demonstrat platform. MS and PT coordinated the scientific activities of the MAP-IO program; JMM is responsible for the instrumentation aboard the RV Marion Dufresne, including the photometer operations. PG, MFSB, IEP, EL, JC, and RG contributed to the interpretation and discussion of the results.
The contact author has declared that none of the authors has any competing interests.
The views and opinions expressed in this article are those of the authors and do not necessarily reflect the official policy or position of any affiliated institutions or funding agencies. The use of brand names or commercial products does not imply endorsement by the authors or their institutions.
Publisher's note: Copernicus Publications remains neutral with regard to jurisdictional claims made in the text, published maps, institutional affiliations, or any other geographical representation in this paper. While Copernicus Publications makes every effort to include appropriate place names, the final responsibility lies with the authors.
This article is part of the special issue “Sun-photometric measurements of aerosols: harmonization, comparisons, synergies, effects, and applications”. It is not associated with a conference.
The technical developments of the shipborne photometer are part of the joint laboratory AGORA-LAB, a collaboration between LOA and CIMEL Electronique. Special thanks are due to all the engineers from both institutions who made this work possible. The authors gratefully acknowledge the support of TAAF, IFREMER, LDAS, and GENAVIR for their assistance with the installation and maintenance of scientific instruments aboard the RV Marion Dufresne. Special thanks are also extended to the technical teams of LACy and OSU-R for their efforts in data acquisition and instrument maintenance.
This work was supported by the ESA-funded project QA4EO (Quality Assurance Framework for Earth Observation), the EUMETSAT-funded project FRM4AER (Fiducial Reference Measurements for Copernicus Aerosol Product Cal/Val Activities), the CNES (through the projects EECLAT, AOS and EXTRA-SAT), the European Union through H2020-INFRAIA-2014-2015 (ACTRIS-2, grant no. 654109), the Horizon Europe project REALISTIC (grant no. 101086690), and the Marie Sklodowska-Curie Staff Exchange Actions within the project GRASP-SYNERGY (grant no. 101131631). MAP-IO was funded by the European Union through the ERDF program, the University of La Réunion, the SGAR-Réunion, the Région Réunion, the CNRS, IFREMER, and the Flotte Océanographique Française. This research has also been supported by the Ministerio de Ciencia e Innovación (grant no. PID2021-127588OB-I00) and by Junta de Castilla y León with FEDER funds (CLU-2023-1-05).
This paper was edited by Lionel Doppler and reviewed by three anonymous referees.
Albrecht, B. A.: Aerosols, cloud microphysics, and fractional cloudiness, Science, 245, 1227–1230, https://doi.org/10.1126/science.245.4923.1227, 1989. a
Alterskjær, K. and Kristjánsson, J. E.: The sign of the radiative forcing from marine cloud brightening depends on both particle size and injection amount, Geophys. Res. Lett., 40, 210–215, https://doi.org/10.1029/2012GL054286, 2013. a
Ångström, A.: On the atmospheric transmission of sun radiation and on dust in the air, Geogr. Ann., 11, 156–166, https://doi.org/10.2307/519399, 1929. a, b
Barreto, A., Cuevas, E., Damiri, B., Guirado, C., Berkoff, T., Berjón, A. J., Hernández, Y., Almansa, F., and Gil, M.: A new method for nocturnal aerosol measurements with a lunar photometer prototype, Atmos. Meas. Tech., 6, 585–598, https://doi.org/10.5194/amt-6-585-2013, 2013. a
Barreto, Á., Cuevas, E., Granados-Muñoz, M.-J., Alados-Arboledas, L., Romero, P. M., Gröbner, J., Kouremeti, N., Almansa, A. F., Stone, T., Toledano, C., Román, R., Sorokin, M., Holben, B., Canini, M., and Yela, M.: The new sun-sky-lunar Cimel CE318-T multiband photometer – a comprehensive performance evaluation, Atmos. Meas. Tech., 9, 631–654, https://doi.org/10.5194/amt-9-631-2016, 2016. a, b, c
Blanchard, D. C. and Woodcock, A. H.: The production, concentration, and vertical distribution of the sea-salt aerosol, Ann. N.Y. Acad. Sci., 338, 330–347, https://doi.org/10.1111/j.1749-6632.1980.tb17130.x, 1980. a
Chen, C., Dubovik, O., Fuertes, D., Litvinov, P., Lapyonok, T., Lopatin, A., Ducos, F., Derimian, Y., Herman, M., Tanré, D., Remer, L. A., Lyapustin, A., Sayer, A. M., Levy, R. C., Hsu, N. C., Descloitres, J., Li, L., Torres, B., Karol, Y., Herrera, M., Herreras, M., Aspetsberger, M., Wanzenboeck, M., Bindreiter, L., Marth, D., Hangler, A., and Federspiel, C.: Validation of GRASP algorithm product from POLDER/PARASOL data and assessment of multi-angular polarimetry potential for aerosol monitoring, Earth Syst. Sci. Data, 12, 3573–3620, https://doi.org/10.5194/essd-12-3573-2020, 2020. a
Clain, G., Baray, J. L., Delmas, R., Diab, R., Leclair de Bellevue, J., Keckhut, P., Posny, F., Metzger, J. M., and Cammas, J. P.: Tropospheric ozone climatology at two Southern Hemisphere tropical/subtropical sites, (Reunion Island and Irene, South Africa) from ozonesondes, LIDAR, and in situ aircraft measurements, Atmos. Chem. Phys., 9, 1723–1734, https://doi.org/10.5194/acp-9-1723-2009, 2009. a, b, c
de Leeuw, G., Andreas, E. L., Anguelova, M. D., Fairall, C. W., Lewis, E. R., O'Dowd, C., Schulz, M., and Schwartz, S. E.: Production flux of sea spray aerosol, Rev. Geophys., 49, https://doi.org/10.1029/2010RG000349, 2011. a
Denjean, C., Bourrianne, T., Burnet, F., Mallet, M., Maury, N., Colomb, A., Dominutti, P., Brito, J., Dupuy, R., Sellegri, K., Schwarzenboeck, A., Flamant, C., and Knippertz, P.: Overview of aerosol optical properties over southern West Africa from DACCIWA aircraft measurements, Atmos. Chem. Phys., 20, 4735–4756, https://doi.org/10.5194/acp-20-4735-2020, 2020. a
Dubovik, O. and King, M. D.: A flexible inversion algorithm for retrieval of aerosol optical properties from Sun and sky radiance measurements, J. Geophys. Res.-Atmos., 105, 20673–20696, https://doi.org/10.1029/2000JD900282, 2000. a, b, c
Dubovik, O., Smirnov, A., Holben, B. N., King, M. D., Kaufman, Y. J., Eck, T. F., and Slutsker, I.: Accuracy assessments of aerosol optical properties retrieved from Aerosol Robotic Network (AERONET) Sun and sky radiance measurements, J. Geophys. Res.-Atmos., 105, 9791–9806, https://doi.org/10.1029/2000JD900040, 2000. a, b, c, d
Dubovik, O., Holben, B., Eck, T. F., Smirnov, A., Kaufman, Y. J., King, M., Tanré, D., and Slutsker, I.: Variability of absorption and optical properties of key aerosol types observed in worldwide locations, J. Atmos. Sci., 59, 590–608, https://doi.org/10.1175/1520-0469(2002)059<0590:VOAAOP>2.0.CO;2, 2002a. a
Dubovik, O., Holben, B. N., Lapyonok, T., Sinyuk, A., Mishchenko, M., Yang, P., and Slutsker, I.: Non-spherical aerosol retrieval method employing light scattering by spheroids, Geophys. Res. Lett., 29, 54/1–4, https://doi.org/10.1029/2001GL014506, 2002b. a, b, c, d
Dubovik, O., Sinyuk, A., Lapyonok, T., Holben, B. N., Mishchenko, M., Yang, P., Eck, T. F., Volten, H., Munoz, O., Veihelmann, B., Van Der Zande, W. J., Leon, J. F., Sorokin, M., and Slutsker, I.: Application of spheroid models to account for aerosol particle nonsphericity in remote sensing of desert dust, J. Geophys. Res.-Atmos., 111, D11208, https://doi.org/10.1029/2005JD006619, 2006. a, b
Dubovik, O., Herman, M., Holdak, A., Lapyonok, T., Tanré, D., Deuzé, J. L., Ducos, F., Sinyuk, A., and Lopatin, A.: Statistically optimized inversion algorithm for enhanced retrieval of aerosol properties from spectral multi-angle polarimetric satellite observations, Atmos. Meas. Tech., 4, 975–1018, https://doi.org/10.5194/amt-4-975-2011, 2011. a
Dubovik, O., Li, Z., Mishchenko, M. I., Tanré, D., Karol, Y., Bojkov, B., Cairns, B., Diner, D. J., Espinosa, W. R., Goloub, P., Gu, X., Hasekamp, O., Hong, J., Hou, W., Knobelspiesse, K. D., Landgraf, J., Li, L., Litvinov, P., Liu, Y., Lopatin, A., Marbach, T., Maring, H., Martins, V., Meijer, Y., Milinevsky, G., Mukai, S., Parol, F., Qiao, Y., Remer, L., Rietjens, J., Sano, I., Stammes, P., Stamnes, S., Sun, X., Tabary, P., Travis, L. D., Waquet, F., Xu, F., Yan, C., and Yin, D.: Polarimetric remote sensing of atmospheric aerosols: instruments, methodologies, results, and perspectives, J. Quant. Spectrosc. Ra., 224, 474–511, https://doi.org/10.1016/j.jqsrt.2018.11.024, 2019. a, b
Duflot, V., Dils, B., Baray, J. L., De Mazière, M., Attié, J. L., Vanhaelewyn, G., Senten, C., Vigouroux, C., Clain, G., and Delmas, R.: Analysis of the origin of the distribution of CO in the subtropical southern Indian Ocean in 2007, J. Geophys. Res.-Atmos., 115, https://doi.org/10.1029/2010JD013994, 2010. a, b, c
Duflot, V., Bègue, N., Pouliquen, M.-L., Goloub, P., and Metzger, J.-M.: Aerosols on the tropical island of La Réunion (21°S, 55°E): assessment of climatology, origin of variability and trend, Remote Sens.-Basel, 14, https://doi.org/10.3390/rs14194945, 2022. a, b, c, d, e, f, g, h, i, j, k
Eck, T. F., Holben, B. N., Reid, J. S., Dubovik, O., Smirnov, A., O'Neill, N., Slutsker, I., and Kinne, S.: Wavelength dependence of the optical depth of biomass burning, urban, and desert dust aerosols, J. Geophys. Res.-Atmos., 104, 31333–31349, https://doi.org/10.1029/1999JD900923, 1999. a, b, c, d
Eck, T. F., Holben, B. N., Reid, J. S., Mukelabai, M. M., Piketh, S. J., Torres, O., Jethva, H. T., Hyer, E. J., Ward, D. E., Dubovik, O., Sinyuk, A., Schafer, J. S., Giles, D. M., Sorokin, M., Smirnov, A., and Slutsker, I.: A seasonal trend of single scattering albedo in southern African biomass-burning particles: implications for satellite products and estimates of emissions for the world's largest biomass-burning source, J. Geophys. Res.-Atmos., 118, 6414–6432, https://doi.org/10.1002/jgrd.50500, 2013. a
Eck, T. F., Holben, B. N., Reid, J. S., Xian, P., Giles, D. M., Sinyuk, A., Smirnov, A., Schafer, J. S., Slutsker, I., Kim, J., Koo, J.-H., Choi, M., Kim, K. C., Sano, I., Arola, A., Sayer, A. M., Levy, R. C., Munchak, L. A., O'Neill, N. T., Lyapustin, A., Hsu, N. C., Randles, C. A., Da Silva, A. M., Buchard, V., Govindaraju, R. C., Hyer, E., Crawford, J. H., Wang, P., and Xia, X.: Observations of the interaction and transport of fine mode aerosols with cloud and/or fog in Northeast Asia from aerosol robotic network and satellite remote sensing, J. Geophys. Res.-Atmos., 123, 5560–5587, https://doi.org/10.1029/2018JD028313, 2018. a
Eger, P. G., Friedrich, N., Schuladen, J., Shenolikar, J., Fischer, H., Tadic, I., Harder, H., Martinez, M., Rohloff, R., Tauer, S., Drewnick, F., Fachinger, F., Brooks, J., Darbyshire, E., Sciare, J., Pikridas, M., Lelieveld, J., and Crowley, J. N.: Shipborne measurements of ClNO2 in the Mediterranean Sea and around the Arabian Peninsula during summer, Atmos. Chem. Phys., 19, 12121–12140, https://doi.org/10.5194/acp-19-12121-2019, 2019. a
Facchini, M. C., Rinaldi, M., Decesari, S., Carbone, C., Finessi, E., Mircea, M., Fuzzi, S., Ceburnis, D., Flanagan, R., Nilsson, E. D., de Leeuw, G., Martino, M., Woeltjen, J., and O'Dowd, C. D.: Primary submicron marine aerosol dominated by insoluble organic colloids and aggregates, Geophys. Res. Lett., 35, https://doi.org/10.1029/2008GL034210, 2008. a
Fargion, G. S., McClain, C. R., and Barnes, R. A.: Ocean color instrument intercomparisons and cross-calibrations by the SIMBIOS project (1999-2000), in: Proc. SPIE 4135, Earth Observing Systems V, https://doi.org/10.1117/12.494210, 411–420, 2000. a
Fargion, G. S., Franz, B. A., Kwiatkowska, E. J., Pietras, C. M., Bailey, S. W., Gales, J., Meister, G., Knobelspiesse, K. D., Werdell, J., and McClain, C. R.: SIMBIOS program in support of ocean color missions: 1997–2003, in: Proc. SPIE 5155, Ocean Remote Sensing and Imaging II, https://doi.org/10.1117/12.504769, 49–60, 2003. a
Fedarenka, A., Dubovik, O., Goloub, P., Li, Z., Lapyonok, T., Litvinov, P., Barel, L., Gonzalez, L., Podvin, T., and Crozel, D.: Utilization of AERONET polarimetric measurements for improving retrieval of aerosol microphysics: GSFC, Beijing and Dakar data analysis, J. Quant. Spectrosc. Ra., 179, 72–97, https://doi.org/10.1016/j.jqsrt.2016.03.021, 2016. a, b
Fitzgerald, J. W.: Marine aerosols: a review, Atmos. Environ. A-Gen., 25, 533–545, https://doi.org/10.1016/0960-1686(91)90050-H, 1991. a
Gantt, B. and Meskhidze, N.: The physical and chemical characteristics of marine primary organic aerosol: a review, Atmos. Chem. Phys., 13, 3979–3996, https://doi.org/10.5194/acp-13-3979-2013, 2013. a
Gantt, B., Meskhidze, N., Facchini, M. C., Rinaldi, M., Ceburnis, D., and O'Dowd, C. D.: Wind speed dependent size-resolved parameterization for the organic mass fraction of sea spray aerosol, Atmos. Chem. Phys., 11, 8777–8790, https://doi.org/10.5194/acp-11-8777-2011, 2011. a
Gathman, S. G.: Optical properties of the marine aerosol as predicted by the Navy Aerosol Model, Opt. Eng., 22, 220157, https://doi.org/10.1117/12.7973048, 1983. a
Giglio, L., Descloitres, J., Justice, C. O., and Kaufman, Y. J.: An enhanced contextual fire detection algorithm for MODIS, Remote Sens. Environ., 87, 273–282, https://doi.org/10.1016/S0034-4257(03)00184-6, 2003. a
Giles, D. M., Holben, B. N., Eck, T. F., Sinyuk, A., Smirnov, A., Slutsker, I., Dickerson, R. R., Thompson, A. M., and Schafer, J. S.: An analysis of AERONET aerosol absorption properties and classifications representative of aerosol source regions, J. Geophys. Res.-Atmos., 117, https://doi.org/10.1029/2012JD018127, 2012. a
Giles, D. M., Sinyuk, A., Sorokin, M. G., Schafer, J. S., Smirnov, A., Slutsker, I., Eck, T. F., Holben, B. N., Lewis, J. R., Campbell, J. R., Welton, E. J., Korkin, S. V., and Lyapustin, A. I.: Advancements in the Aerosol Robotic Network (AERONET) Version 3 database – automated near-real-time quality control algorithm with improved cloud screening for Sun photometer aerosol optical depth (AOD) measurements, Atmos. Meas. Tech., 12, 169–209, https://doi.org/10.5194/amt-12-169-2019, 2019. a, b, c, d, e, f, g, h, i
Gordon, H. R. and Clark, D. K.: Clear water radiances for atmospheric correction of coastal zone color scanner imagery, Appl. Optics, 20, 4175–4180, https://doi.org/10.1364/AO.20.004175, 1981. a
Gunn, R. and Phillips, B. B.: An experimental investigation of the effect of air pollution on the initiation of rain, J. Atmos. Sci., 14, 272–280, https://doi.org/10.1175/1520-0469(1957)014<0272:AEIOTE>2.0.CO;2, 1957. a
Gupta, P., Levy, R. C., Mattoo, S., Remer, L. A., and Munchak, L. A.: A surface reflectance scheme for retrieving aerosol optical depth over urban surfaces in MODIS Dark Target retrieval algorithm, Atmos. Meas. Tech., 9, 3293–3308, https://doi.org/10.5194/amt-9-3293-2016, 2016. a
Gupta, P., Remer, L. A., Levy, R. C., and Mattoo, S.: Validation of MODIS 3 km land aerosol optical depth from NASA's EOS Terra and Aqua missions, Atmos. Meas. Tech., 11, 3145–3159, https://doi.org/10.5194/amt-11-3145-2018, 2018. a
Hamilton, D. S., Lee, L. A., Pringle, K. J., Reddington, C. L., Spracklen, D. V., and Carslaw, K. S.: Occurrence of pristine aerosol environments on a polluted planet, P. Natl. Acad. Sci. USA, 111, 18466–18471, https://doi.org/10.1073/pnas.1415440111, 2014. a
Haywood, J. M., Ramaswamy, V., and Soden, B. J.: Tropospheric aerosol climate forcing in clear-sky satellite observations over the oceans, Science, 283, 1299–1303, https://doi.org/10.1126/science.283.5406.1299, 1999. a
Herrera, M. E., Dubovik, O., Torres, B., Lapyonok, T., Fuertes, D., Lopatin, A., Litvinov, P., Chen, C., Benavent-Oltra, J. A., Bali, J. L., and Ristori, P. R.: Estimates of remote sensing retrieval errors by the GRASP algorithm: application to ground-based observations, concept and validation, Atmos. Meas. Tech., 15, 6075–6126, https://doi.org/10.5194/amt-15-6075-2022, 2022. a, b, c
Holben, B. N., Eck, T. F., Slutsker, I., Tanré, D., Buis, J. P., Setzer, A., Vermote, E., Reagan, J. A., Kaufman, Y. J., Nakajima, T., Lavenu, F., Jankowiak, I., and Smirnov, A.: AERONET – a federated instrument network and data archive for aerosol characterization, Remote Sens. Environ., 66, 1–16, https://doi.org/10.1016/S0034-4257(98)00031-5, 1998. a, b, c
Holben, B. N., Tanré, D., Smirnov, A., Eck, T. F., Slutsker, I., Abuhassan, N., Newcomb, W. W., Schafer, J. S., Chatenet, B., Lavenu, F., Kaufman, Y. J., Castle, J. V., Setzer, A., Markham, B., Clark, D., Frouin, R., Halthore, R., Karneli, A., O'Neill, N. T., Pietras, C., Pinker, R. T., Voss, K., and Zibordi, G.: An emerging ground-based aerosol climatology: aerosol optical depth from AERONET, J. Geophys. Res.-Atmos., 106, 12067–12097, https://doi.org/10.1029/2001JD900014, 2001. a
Holben, B. N., Eck, T. F., Slutsker, I., Smirnov, A., Sinyuk, A., Schafer, J., Giles, D., and Dubovik, O.: AERONET's Version 2.0 quality assurance criteria, in: Proc. SPIE 6408, Remote Sensing of the Atmosphere and Clouds, 6408Q, https://doi.org/10.1117/12.706524, 2006. a, b, c, d
Hoppel, W. A., Fitzgerald, J. W., Frick, G. M., Larson, R. E., and Mack, E. J.: Aerosol size distributions and optical properties found in the marine boundary layer over the Atlantic Ocean, J. Geophys. Res.-Atmos., 95, 3659–3686, https://doi.org/10.1029/JD095iD04p03659, 1990. a
Intergovernmental Panel on Climate Change (IPCC): Climate Change 2021 – The Physical Science Basis: Working Group I Contribution to the Sixth Assessment Report of the Intergovernmental Panel on Climate Change, Cambridge University Press, Cambridge, UK, https://doi.org/10.1017/9781009157896, 2021. a
Jones, A., Haywood, J. M., and Boucher, O.: Aerosol forcing, climate response and climate sensitivity in the Hadley Centre climate model, J. Geophys. Res.-Atmos., 112, https://doi.org/10.1029/2007JD008688, 2007. a
Karol, Y., Tanré, D., Goloub, P., Vervaerde, C., Balois, J. Y., Blarel, L., Podvin, T., Mortier, A., and Chaikovsky, A.: Airborne sun photometer PLASMA: concept, measurements, comparison of aerosol extinction vertical profile with lidar, Atmos. Meas. Tech., 6, 2383–2389, https://doi.org/10.5194/amt-6-2383-2013, 2013. a
Kaskaoutis, D., Pikridas, M., Barmpounis, K., Kassell, G., Logan, D., Rigler, M., Ivančič, M., Mohammadpour, K., Mihalopoulos, N., Lelieveld, J., and Sciare, J.: Aerosol characteristics and types in the marine environments surrounding the East Mediterranean – Middle East (EMME) region during the AQABA campaign, Atmos. Environ., 298, 119633, https://doi.org/10.1016/j.atmosenv.2023.119633, 2023. a
Knobelspiesse, K. D., Pietras, C., Fargion, G. S., Wang, M., Frouin, R., Miller, M. A., Subramaniam, A., and Balch, W. M.: Maritime aerosol optical thickness measured by handheld sun photometers, Remote Sens. Environ., 93, 87–106, https://doi.org/10.1016/j.rse.2004.06.018, 2004. a
Kobayashi, H. and Shiobara, M.: Development of new shipborne aureolemeter to measure the intensities of direct and scattered solar radiation on rolling and pitching vessel, in: Remote Sensing of Clouds and the Atmosphere XX, edited by: Comerón, A., Kassianov, E. I., and Schäfer, K., Vol. 9640, International Society for Optics and Photonics, SPIE, https://doi.org/10.1117/12.2195691, 96401A 2015. a
Koren, I., Dagan, G., and Altaratz, O.: From aerosol-limited to invigoration of warm convective clouds, Science, 344, 1143–1146, https://doi.org/10.1126/science.1252595, 2014. a
Leck, C. and Bigg, E. K.: Comparison of sources and nature of the tropical aerosol with the summer high Arctic aerosol, Tellus B, 60, 118–126, https://doi.org/10.1111/j.1600-0889.2007.00315.x, 2008. a
Levy, R. C., Mattoo, S., Munchak, L. A., Remer, L. A., Sayer, A. M., Patadia, F., and Hsu, N. C.: The Collection 6 MODIS aerosol products over land and ocean, Atmos. Meas. Tech., 6, 2989–3034, https://doi.org/10.5194/amt-6-2989-2013, 2013. a
Lewis, E. R. and Schwartz, S. E.: Sea salt aerosol production: mechanisms, methods, measurements and models–a critical review, Geoph. Monog. Series, 152, 3719, https://doi.org/10.1029/GM152, 2004. a
Mahowald, N. M., Lamarque, J.-F., Tie, X. X., and Wolff, E.: Sea-salt aerosol response to climate change: Last Glacial Maximum, preindustrial, and doubled carbon dioxide climates, J. Geophys. Res.-Atmos., 111, https://doi.org/10.1029/2005JD006459, 2006. a
Mallet, M., Nabat, P., Zuidema, P., Redemann, J., Sayer, A. M., Stengel, M., Schmidt, S., Cochrane, S., Burton, S., Ferrare, R., Meyer, K., Saide, P., Jethva, H., Torres, O., Wood, R., Saint Martin, D., Roehrig, R., Hsu, C., and Formenti, P.: Simulation of the transport, vertical distribution, optical properties and radiative impact of smoke aerosols with the ALADIN regional climate model during the ORACLES-2016 and LASIC experiments, Atmos. Chem. Phys., 19, 4963–4990, https://doi.org/10.5194/acp-19-4963-2019, 2019. a
Mallet, P., Pujol, O., Brioude, J., Evan, S., and A., J.: Marine aerosol distribution and variability over the pristine Southern Indian Ocean, Atmos. Environ., 182, 17–30, https://doi.org/10.1016/j.atmosenv.2018.03.016, 2018. a
O'Dowd, C. D. and de Leeuw, G.: Marine aerosol production: a review of the current knowledge, Philos. T. Roy. Soc. A, 365, 1753–1774, https://doi.org/10.1098/rsta.2007.2043, 2007. a
O'Dowd, C. D. and Smith, M. H.: Physicochemical properties of aerosols over the northeast Atlantic: evidence for wind-speed-related submicron sea-salt aerosol production, J. Geophys. Res.-Atmos., 98, 1137–1149, https://doi.org/10.1029/92JD02302, 1993. a
O'Dowd, C. D., Smith, M. H., Consterdine, I. E., and Lowe, J. A.: Marine aerosol, sea-salt, and the marine sulphur cycle: a short review, Atmos. Environ., 31, 73–80, https://doi.org/10.1016/S1352-2310(96)00106-9, 1997. a
O'Dowd, C. D., Lowe, J. A., and Smith, M. H.: Coupling sea-salt and sulphate interactions and its impact on cloud droplet concentration predictions, Geophys. Res. Lett., 26, 1311–1314, https://doi.org/10.1029/1999GL900231, 1999. a
O'Dowd, C. D., Yoon, Y. J., Junkerman, W., Aalto, P., Kulmala, M., Lihavainen, H., and Viisanen, Y.: Airborne measurements of nucleation mode particles I: coastal nucleation and growth rates, Atmos. Chem. Phys., 7, 1491–1501, https://doi.org/10.5194/acp-7-1491-2007, 2007. a, b
Pfannerstill, E. Y., Wang, N., Edtbauer, A., Bourtsoukidis, E., Crowley, J. N., Dienhart, D., Eger, P. G., Ernle, L., Fischer, H., Hottmann, B., Paris, J.-D., Stönner, C., Tadic, I., Walter, D., Lelieveld, J., and Williams, J.: Shipborne measurements of total OH reactivity around the Arabian Peninsula and its role in ozone chemistry, Atmos. Chem. Phys., 19, 11501–11523, https://doi.org/10.5194/acp-19-11501-2019, 2019. a
Porter, J. N. and Clarke, A. D.: Aerosol size distribution models based on in situ measurements, J. Geophys. Res.-Atmos., 102, 6035–6045, https://doi.org/10.1029/96JD03403, 1997. a
Pringle, K. J., Carslaw, K. S., Fan, T., Mann, G. W., Hill, A., Stier, P., Zhang, K., and Tost, H.: A multi-model assessment of the impact of sea spray geoengineering on cloud droplet number, Atmos. Chem. Phys., 12, 11647–11663, https://doi.org/10.5194/acp-12-11647-2012, 2012. a, b
Prospero, J. M., Ginoux, P., Torres, O., Nicholson, S. E., and Gill, T. E.: Environmental characterization of global sources of atmospheric soil dust identified with the Nimbus 7 Total Ozone Mapping Spectrometer (TOMS) absorbing aerosol product, Rev. Geophys., 40, 2–1–2–31, https://doi.org/10.1029/2000RG000095, 2002. a
Russell, L. M., Hawkins, L. N., Frossard, A. A., Quinn, P. K., and Bates, T. S.: Carbohydrate-like composition of submicron atmospheric particles and their production from ocean bubble bursting, P. Natl. Acad. Sci. USA, 107, 6652–6657, https://doi.org/10.1073/pnas.0908905107, 2010. a
Sanchez-Barrero, M. F.: Development of an autonomous integrated mobile system combining lidar and photometer to monitor aerosol properties in near real time, PhD thesis, Université de Lille, https://pepite.univ-lille.fr/ori-oai-search/notice/view/2024ULILR014 (last access: 25 September 2025), 2024. a
Sandu, I., Brenguier, J.-L., Geoffroy, O., Thouron, O., and Masson, V.: Aerosol impacts on the diurnal cycle of marine stratocumulus, J. Atmos. Sci., 65, 2705–2718, https://doi.org/10.1175/2008JAS2451.1, 2008. a
Satheesh, S. and Krishna Moorthy, K.: Radiative effects of natural aerosols: a review, Atmos. Environ., 39, 2089–2110, https://doi.org/10.1016/j.atmosenv.2004.12.029, 2005. a
Sayer, A., Hsu, N., Lee, J., Kim, W. V., Dubovik, O., Dutcher, S., Huang, D., Litvinov, P., Lyapustin, A., Tackett, J., and Winker, D.: Validation of SOAR VIIRS over-water aerosol retrievals and context within the global satellite aerosol data record, J. Geophys. Res.-Atmos., 123, 13496–13526, https://doi.org/10.1029/2018JD029465, 2018. a
Schuster, G. L., Lin, B., and Dubovik, O.: Remote sensing of aerosol water uptake, Geophys. Res. Lett., 36, https://doi.org/10.1029/2008GL036576, 2009. a
Shaw, G. E.: Sun photometry, B. Am. Meteorol. Soc., 64, 4–10, https://doi.org/10.1175/1520-0477(1983)064<0004:SP>2.0.CO;2, 1983. a, b
Sinyuk, A., Holben, B. N., Eck, T. F., Giles, D. M., Slutsker, I., Korkin, S., Schafer, J. S., Smirnov, A., Sorokin, M., and Lyapustin, A.: The AERONET Version 3 aerosol retrieval algorithm, associated uncertainties and comparisons to Version 2, Atmos. Meas. Tech., 13, 3375–3411, https://doi.org/10.5194/amt-13-3375-2020, 2020. a, b, c, d, e, f
Smirnov, A., Holben, B. N., Kaufman, Y. J., Dubovik, O., Eck, T. F., Slutsker, I., Pietras, C., and Halthore, R.: Optical properties of atmospheric aerosol in maritime environments, J. Atmos. Sci., 59, 501–523, https://doi.org/10.1175/1520-0469(2002)059<0501:OPOAAI>2.0.CO;2, 2002. a
Smirnov, A., Holben, B. N., Slutsker, I., Giles, D. M., McClain, C. R., Eck, T. F., Sakerin, S. M., Macke, A., Croot, P., Zibordi, G., Quinn, P. K., Sciare, J., Kinne, S., Harvey, M., Smyth, T. J., Piketh, S., Zielinski, T., Proshutinsky, A., Goes, J. I., Nelson, N. B., Larouche, P., Radionov, V. F., Goloub, P., Krishna Moorthy, K., Matarrese, R., Robertson, E. J., and Jourdin, F.: Maritime aerosol network as a component of aerosol robotic network, J. Geophys. Res.-Atmos., 114, https://doi.org/10.1029/2008JD011257, 2009. a, b
Smirnov, A., Holben, B. N., Giles, D. M., Slutsker, I., O'Neill, N. T., Eck, T. F., Macke, A., Croot, P., Courcoux, Y., Sakerin, S. M., Smyth, T. J., Zielinski, T., Zibordi, G., Goes, J. I., Harvey, M. J., Quinn, P. K., Nelson, N. B., Radionov, V. F., Duarte, C. M., Losno, R., Sciare, J., Voss, K. J., Kinne, S., Nalli, N. R., Joseph, E., Krishna Moorthy, K., Covert, D. S., Gulev, S. K., Milinevsky, G., Larouche, P., Belanger, S., Horne, E., Chin, M., Remer, L. A., Kahn, R. A., Reid, J. S., Schulz, M., Heald, C. L., Zhang, J., Lapina, K., Kleidman, R. G., Griesfeller, J., Gaitley, B. J., Tan, Q., and Diehl, T. L.: Maritime aerosol network as a component of AERONET – first results and comparison with global aerosol models and satellite retrievals, Atmos. Meas. Tech., 4, 583–597, https://doi.org/10.5194/amt-4-583-2011, 2011. a, b, c, d
Stein, A. F., Draxler, R. R., Rolph, G. D., Stunder, B. J. B., Cohen, M. D., and Ngan, F.: NOAA's HYSPLIT atmospheric transport and dispersion modeling system, B. Am. Meteorol. Soc., 96, 2059–2077, https://doi.org/10.1175/BAMS-D-14-00110.1, 2015. a
Stocker, T., Qin, D., Plattner, G.-K., Tignor, M., Allen, S., Boschung, J., Nauels, A., Xia, Y., Bex, V., and Midgley, P.: Climate Change 2013: The Physical Science Basis. Contribution of Working Group I to the Fifth Assessment Report of the Intergovernmental Panel on Climate Change., Cambridge University Press, https://doi.org/10.1017/CBO9781107415324, 2013. a
Struthers, H., Ekman, A. M. L., Glantz, P., Iversen, T., Kirkevåg, A., Mårtensson, E. M., Seland, Ø., and Nilsson, E. D.: The effect of sea ice loss on sea salt aerosol concentrations and the radiative balance in the Arctic, Atmos. Chem. Phys., 11, 3459–3477, https://doi.org/10.5194/acp-11-3459-2011, 2011. a
Toledano, C., González, R., Fuertes, D., Cuevas, E., Eck, T. F., Kazadzis, S., Kouremeti, N., Gröbner, J., Goloub, P., Blarel, L., Román, R., Barreto, Á., Berjón, A., Holben, B. N., and Cachorro, V. E.: Assessment of Sun photometer Langley calibration at the high-elevation sites Mauna Loa and Izaña, Atmos. Chem. Phys., 18, 14555–14567, https://doi.org/10.5194/acp-18-14555-2018, 2018. a
Torres, B., Dubovik, O., Toledano, C., Berjon, A., Cachorro, V. E., Lapyonok, T., Litvinov, P., and Goloub, P.: Sensitivity of aerosol retrieval to geometrical configuration of ground-based sun/sky radiometer observations, Atmos. Chem. Phys., 14, 847–875, https://doi.org/10.5194/acp-14-847-2014, 2014. a, b
Tulet, P., Van Baelen, J., Bosser, P., Brioude, J., Colomb, A., Goloub, P., Pazmino, A., Portafaix, T., Ramonet, M., Sellegri, K., Thyssen, M., Gest, L., Marquestaut, N., Mékiès, D., Metzger, J.-M., Athier, G., Blarel, L., Delmotte, M., Desprairies, G., Dournaux, M., Dubois, G., Duflot, V., Lamy, K., Gardes, L., Guillemot, J.-F., Gros, V., Kolasinski, J., Lopez, M., Magand, O., Noury, E., Nunes-Pinharanda, M., Payen, G., Pianezze, J., Picard, D., Picard, O., Prunier, S., Rigaud-Louise, F., Sicard, M., and Torres, B.: MAP-IO: an atmospheric and marine observatory program on board Marion Dufresne over the Southern Ocean, Earth Syst. Sci. Data, 16, 3821–3849, https://doi.org/10.5194/essd-16-3821-2024, 2024. a, b, c, d
Twomey, S.: The influence of pollution on the shortwave albedo of clouds, J. Atmos. Sci., 34, 1149–1152, https://doi.org/10.1175/1520-0469(1977)034<1149:TIOPOT>2.0.CO;2, 1977. a
Van den Heever, S. C., Carrió, G. G., Cotton, W. R., DeMott, P. J., and Prenni, A. J.: Impacts of nucleating aerosol on Florida storms. Part I: Mesoscale simulations, J. Atmos. Sci., 63, 1752–1775, https://doi.org/10.1175/JAS3713.1, 2006. a
Verreyken, B., Amelynck, C., Brioude, J., Müller, J.-F., Schoon, N., Kumps, N., Colomb, A., Metzger, J.-M., Lee, C. F., Koenig, T. K., Volkamer, R., and Stavrakou, T.: Characterisation of African biomass burning plumes and impacts on the atmospheric composition over the south-west Indian Ocean, Atmos. Chem. Phys., 20, 14821–14845, https://doi.org/10.5194/acp-20-14821-2020, 2020. a, b, c
Vigouroux, C., Stavrakou, T., Whaley, C., Dils, B., Duflot, V., Hermans, C., Kumps, N., Metzger, J.-M., Scolas, F., Vanhaelewyn, G., Müller, J.-F., Jones, D. B. A., Li, Q., and De Mazière, M.: FTIR time-series of biomass burning products (HCN, C2H6, C2H2, CH3OH, and HCOOH) at Reunion Island (21° S, 55° E) and comparisons with model data, Atmos. Chem. Phys., 12, 10367–10385, https://doi.org/10.5194/acp-12-10367-2012, 2012. a, b, c
Yin, Z., Ansmann, A., Baars, H., Seifert, P., Engelmann, R., Radenz, M., Jimenez, C., Herzog, A., Ohneiser, K., Hanbuch, K., Blarel, L., Goloub, P., Dubois, G., Victori, S., and Maupin, F.: Aerosol measurements with a shipborne Sun–sky–lunar photometer and collocated multiwavelength Raman polarization lidar over the Atlantic Ocean, Atmos. Meas. Tech., 12, 5685–5698, https://doi.org/10.5194/amt-12-5685-2019, 2019. a, b, c, d, e, f, g, h, i
The specifications of the ABX-Two inertial GPS unit indicate an RMSE of 0.1° m−1 of baseline (distance between the antennas) for heading and 0.2° for pitch and roll. Given that the final antenna separation aboard the RV Marion Dufresne ranged from 1.5 to 2 m, the associated errors fall within these stated values. Internal tests conducted on fixed platforms confirm these specifications. In contrast, the specifications for the SIMRAD-H60 system indicate a RMSE of 2° (with 68 % of values below this threshold); however, similar internal tests have revealed larger errors in practice, reaching up to 5° as stated in the text.
The ship does not always remain stationary while at port; the port area is considered to span approximately 1 km2.
For instance, criteria such as “Aerosol optical depth spectral dependence” and “Large aerosol optical depth triplet variability” (Sects. 3.3.5 and 3.3.6 in Giles et al., 2019) applied specifically to individual wavelengths.
Further information about these campaigns is available at https://www.ipsl.fr/campagne/amaryllis-amagas/ (last access: 31 May 2025) and https://archimer.ifremer.fr/doc/00875/98738/108483.pdf (last access: 31 December 2024).
It is worth noting that while a minimum α value of −0.823 is reported here, less than 0.6 % of the data are negative. Similarly, negative values have also been observed in the region by Smirnov et al. (2011). These occurrences are generally associated with very low AOD conditions (AOD440<0.05), where the relative uncertainty of AOD measurements (estimated at 0.01 for standard channels and 0.02 for UV channels; see Eck et al., 1999) can range from 20 % to 100 % for AOD440, considering that the minimum observed values are 0.019 for daily means and 0.01 for the full dataset. This uncertainty is even higher for AOD870, where AOD values are generally lower. These large relative errors significantly impact the accuracy of α calculations.
For instance, a shorter collimator was tested to reduce wind-induced instabilities, as wind significantly affects data collection at sea. Software modifications were also implemented, and the two photometers were placed in different locations on the vessel to assess the impact of ship vibrations and movement. Elastic lidar measurements were performed in parallel, enabling Klett inversions based on total extinction derived from combined photometer and lidar signals. Further details on remote sensing data and instrumentation from the Amaryllis-Amagas/Transama campaign can be found in Sanchez-Barrero (2024).
It is worth noting that the Level 2 criteria for size distribution properties are less stringent, as they do not impose an AOD440 threshold. However, they share the remaining conditions with the optical property criteria, such as θS>50° and a minimum symmetrical number of radiance measurements in the almucantar (or, more recently, in hybrid scans) across different scattering angle ranges, among other. For further details, refer to Table 3 in Holben et al. (2006).
In this study, retrievals meeting the thresholds of AOD440>0.4 and θS>50° are referred to as Level 2 to distinguish them from those that do not meet these thresholds. However, official Level 2 status requires that the underlying AOD data be validated and reclassified to Level 2 within the AERONET network. Shipborne measurements are currently classified as Level 1.5, and retrievals satisfying these additional criteria will only be officially recognized as Level 2 once the AOD data are upgraded. Retrievals failing to meet these thresholds will remain classified as Level 1.5 even after reclassification.
While the CE318-T is equipped with an internal bubble level, AERONET generally recommends using external leveling systems with higher precision, often achieving level adjustments of 4 mm m−1, corresponding to approximately 0.25°. However, this recommendation is not always implemented in practice.
- Abstract
- Introduction
- Instrument, site, and data treatment
- Data analysis
- First quality-assured shipborne AERONET aerosol retrievals of optical and microphysical properties
- Discussion
- Conclusions
- Appendix A: List of acronyms and symbols used in the paper
- Data availability
- Author contributions
- Competing interests
- Disclaimer
- Special issue statement
- Acknowledgements
- Financial support
- Review statement
- References