the Creative Commons Attribution 4.0 License.
the Creative Commons Attribution 4.0 License.
 | 29 Sep 2025
Performance and evaluation of remote sensing satellites for monitoring dust weather in East Asia
Yuanyuan Zhang
Ning Wang
Shuanggen Jin
Satellite remote sensing provides a rich data source for the real-time and accurate acquisition of dust weather information in East Asia. However, there are few studies to evaluate whether these data can effectively and accurately reflect the dynamic process of dust weather. This study evaluates and compares the continuity, accuracy, and stability of five commonly used remote sensing products for monitoring dust weather in East Asia, based on recorded dust events (DEs) from 2019 to April 2025. The products evaluated are the Fengyun-4A/B (FY-4A/B) dust score (DST), infrared difference dust index (IDDI), Moderate Resolution Imaging Spectroradiometer (MODIS) aerosol optical depth (AOD), Sentinel-5P absorbing aerosol index (AAI), and Himawari-8/9 AOD, using ground station PM10 concentration data. The results show that the daily spatial distribution of atmospheric dust presented by the five remote sensing products has good consistency. Notably, the AAI not only offers better continuity in depicting the spatial distribution of atmospheric dust compared to other aerosol products but also compensates for the shortcomings of other products that cannot detect UV-absorbing aerosols mixed with clouds. Based on the evaluation using ground station PM10 data, the mean probability of correct detection (POCD) for atmospheric dust during multiple DEs for Sentinel-5P AAI, MODIS AOD, Himawari-8/9 AOD, FY-4A/B DST, and IDDI products were 57.16 %, 45.18 %, 31.25 %, 22.78 %, and 12.41 %, respectively. The mean probability of false detection (POFD) values were 88.66 %, 88.61 %, 92.04 %, 69.9 %, and 67.69 %, respectively. Overall, the Sentinel-5P AAI has the highest POCD in DEs but is unstable. At the same time, it also has a high POFD. The FY-4A/B IDDI has the lowest POCD, but it is relatively stable, and its POFD is low.
- Article
(14242 KB) - Full-text XML
- BibTeX
- EndNote


Dust weather refers to a general term for a weather phenomenon in which wind blows dust and sand from the ground into the air, making the air turbid (Yang et al., 2008; Wang et al., 2013; Zhao et al., 2018). When dust weather occurs, the dust particles dispersed into the air by the wind not only have an impact on the ecological environment and human life and health but also have an important impact on global climate change (Zhuang et al., 2001; Mahowald, 2011; Kok et al., 2023). On the one hand, the long-distance transport and dry and wet deposition of dust particles in the atmosphere provide critical mineral supplements for terrestrial and marine organisms, playing an irreplaceable role in global biochemical processes and carbon cycle systems (Mahowald et al., 2005; Shao et al., 2011; Richon et al., 2018). On the other hand, the diffusion of dust from the surface into the air not only reduces visibility and air quality but also carries some harmful microorganisms and heavy metals that are extremely harmful to human life and health (Middleton, 2017; Rao et al., 2020; Mu et al., 2023). In addition, the dust particles staying in the atmosphere have significant radiative forcing and climate effects, which can affect the radiation balance of the earth–atmosphere system through direct effects, indirect effects, and semi-direct effects, and are a key factor causing deviations in global climate change predictions and sensitivity assessments (Huang et al., 2006, 2014; Kok et al., 2023). Therefore, obtaining effective information on dust weather in real time and accurately is a key issue for effective early warning and forecasting of dust weather and studying its environmental and climate effects.
In the past, the dust weather processes were mainly monitored by conventional ground weather stations (Shao and Dong, 2006; Akhlaq et al., 2012). However, large-scale dust weather usually originates in remote desert areas with harsh natural environments. The ground weather monitoring stations are extremely susceptible to the influence of complex natural environments, which makes it difficult to achieve long-term monitoring of dust weather. In addition, limited by various factors, it is difficult to build large-scale, high-density ground stations to monitor the formation, development, and disappearance of dust weather in real time and over the long term (Bao et al., 2023). Following the 1970s, the evolution of earth observation technologies has progressively transformed dust weather monitoring methodologies. Akhlaq et al. (2012) critically evaluated different monitoring techniques, definitively establishing satellite imagery's superiority in dust detection and characterization. Building upon this foundation, Li et al. (2021) conducted a comparative analysis between ground-based radar and satellite remote sensing technologies, conclusively demonstrating satellite remote sensing's enhanced capabilities in tracking dust trajectories and identifying source regions. The comparative assessments by these researchers underscored satellite remote sensing's comprehensive advantages, including wider spatial coverage, higher temporal resolution, and more precise environmental data acquisition. First of all, satellite remote sensing technology has the advantages of wide observation range, strong timeliness, and high economic benefits, which make up for the shortcomings of ground-based monitoring methods. Secondly, different satellite sensors have different temporal resolutions, spatial resolutions, spectral resolutions, and radiation resolutions. The dust weather information obtained by integrating multiple satellite observation data is more comprehensive. Finally, the complementary advantages of different imaging modalities can achieve all-weather dust weather information acquisition.
The methods of monitoring atmospheric dust aerosol by satellite remote sensing have been continuously improved during development, forming two different monitoring methods of dust weather: passive remote sensing and active remote sensing. Passive remote sensing uses the earth–atmosphere system itself to emit or reflect electromagnetic wave information from natural radiation sources to realize quantitative retrieval of atmospheric dust optical parameters, which is mainly divided into the ultraviolet absorption method (Torres et al., 2002; De Graff et al., 2005; Chen et al., 2014; Torres et al., 2020; Ahn et al., 2021), the visible near-infrared method (Kaufman et al., 2001), the thermal infrared method (Zhang et al., 2006), and the microwave polarization index method (Huang et al., 2007). Currently, passive remote sensing products that are widely used in dust weather monitoring and research originate from the aerosol products of the Terra\Aqua Moderate Resolution Imaging Spectroradiometer (MODIS) (Levy et al., 2007) and Himawari-8 Advanced Himawari Imager (AHI) (She et al., 2018), the absorbing aerosol index (AAI) products of the Aura Ozone Monitoring Instrument (OMI) and the Sentinel-5P Tropospheric Monitoring Instrument (TROPOMI) (Torres et al., 2020; Apituley et al., 2022), the infrared difference dust index (IDDI) products of the Fengyun-2 (FY-2) series of satellites with the Visible Infrared Spin Scan Radiometer (VISSR) (Xian et al., 2021), the dust score (DST), dust strong index (DSI), and aerosol index (AI) products of the FY-3 series of satellites with the Visible Infrared Radiometer (VIRR) (Lu et al., 2015), and the dust detection dataset (DSD) product of FY-4A with the Advanced Geostationary Radiation Imager (AGRI) (Wu and Ma, 2020). For example, Filonchyk et al. (2020) integrated MODIS aerosol optical depth (AOD) and OMI AAI products to study two severe dust weather processes that occurred in the South Gobi Desert of China. The results showed that the AOD value in the area affected by dust weather exceeded 1, and the AAI value was in the range of 0.7–3.9. Sun et al. (2022) integrated Himawari-8 AOD and FY-4A DSD products to analyze the spatiotemporal distribution and transmission characteristics of two dust events (DEs) in North China in March 2021. Prospero et al. (2002) used the TOMS sensor on the Nimbus 7 satellite to map the distribution of major atmospheric dust sources around the world and identify their common environmental characteristics. Gao and Washington (2010) used TOMS AI products to characterize the frequency and intensity of dust weather in the Tarim Basin and explored the teleconnection between dust activities and the Arctic Oscillation. Ye et al. (2023) used the TROPOMI AAI product to study and analyze the impact range of daily DEs from a strong dust weather process that occurred in northern China from 14 to 18 March 2021. Fang et al. (2016) analyzed the outbreak, development, transmission, and impact range of the Taklimakan desert sandstorm in April 2014 based on the IDDI product of FY-2E and the AI product of FY-3B, and they used the MODIS AOD product to explore the atmospheric dust aerosol load in the areas affected by the sandstorm process. Jiang et al. (2021) used the DSI product of FY-3A to analyze the intensity and seasonal changes of dust weather activities in the Tibetan Plateau from 2010 to 2013.
Active remote sensing relies on artificial radiation sources on the remote sensing platform to emit electromagnetic waves to targets and detect atmospheric dust information by receiving backscattered signals (Liu et al., 2008). So far, Cloud-Aerosol LIdar with Orthogonal Polarization (CALIOP) carried on the CALIPSO satellite is the most stable, longest-running, most mature, and most widely used spaceborne lidar in orbit (Wang et al., 2023). The satellite stopped operating in August 2023 because its fuel reserves had been exhausted, and (in its decaying orbit) the satellite could no longer generate sufficient power to operate the science instruments. During its 17 years in orbit, CALIPSO has provided unprecedented measurement data of the vertical structure of the earth's atmosphere, which has been verified by a large number of ground-based and passive satellite remote sensing observation data (Kim et al., 2018; Winker et al., 2007; Liu et al., 2018). CALIOP has the advantages of active remote sensing detection and polarization monitoring, which can distinguish dust from complex atmospheric environments (Liu et al., 2008). Its aerosol classification products and vertical distribution information are widely used in research on atmospheric dust transport, aerosol–cloud interactions, optical effects, and climate effects (Gui et al., 2022; Jia et al., 2018; Wang et al., 2023). For example, Bao et al. (2023) used CALIPSO data to study the vertical structure of the atmospheric dust layer during three severe dust weather processes in East Asia, and they found that the vertical structure of the dust layer depends on the sources and intensity of the dust weather. Sun et al. (2022) used CALIPSO aerosol products to study and analyze the three-dimensional structure and transmission path of atmospheric dust during the dust weather in North China from 26 to 30 March 2021.
In the past, most studies directly utilized these satellite data or products to investigate and analyze the characteristics of intensity changes, transport directions, and impact ranges of one or more dust events. Research assessing the accuracy, stability, and reliability of these satellite remote sensing retrieval products for dust monitoring has been scarce. Furthermore, it is still challenging whether these data can effectively and accurately capture the dynamic process of dust weather. Therefore, this study valuated the accuracy, stability, and reliability of four main satellite remote sensing products (MODIS, Himawari-8/9, Sentinel-5P, and FY-4A DSD products) that were widely used in dust weather monitoring studies in East Asia. By evaluating the accuracy, stability, and reliability of satellite remote sensing in monitoring dust weather in East Asia, it will help us to monitor and study disaster weather more effectively by using satellite remote sensing technology and providing a reliable scientific basis for environmental management and danger warning so as to better maintain human health and ecological balance. The remainder of this paper is organized as follows. Section 2 introduces the study area, observation data, and methods. Section 3 evaluates the continuity, accuracy, and stability of different satellite remote sensing products for dust weather monitoring in East Asia and discusses the possible reasons for the discrepancy between satellite remote sensing results and observed values. Finally, conclusions are given in Sect. 4.
2.1 Study area and observation data from ground stations
Spring (March–May) is the season when dust weather occurs frequently in East Asia (Hang et al., 2023). On the one hand, the northern regions of East Asia experience frequent cold air activities dominated by Mongolian cyclones in spring, which provide the main driving force for the formation of dust weather (Mu and Fiedler, 2025). On the other hand, western East Asia is located inside the Eurasian continent, which is far away from the ocean and has little precipitation. It is mainly composed of arid and semi-arid areas, with desert areas widely distributed, which provides a sufficient material basis for the formation of dust weather. When large-scale dust weather occurs, the dust content in the air will increase significantly, exacerbating air pollution. The PM10 concentration data from ground observation stations can effectively represent the dust content of the air. It is an important data source to reflect the intensity of dust weather. Therefore, this study is based on 64 recorded DEs that occurred in East Asia between 2019 and April 2025 (source from the National Climate Center of the China Meteorological Administration, https://ncc-cma.net/cn/, last access: 30 June 2025), using hourly PM10 concentration data from 925 national environmental monitoring stations in China to evaluate the continuity, accuracy, and stability of different satellite products for East Asian dust monitoring (hourly PM10 concentration data were obtained from China National Environmental Monitoring Station: https://www.cnemc.cn/, last access: 30 June 2025). The location of the study area and the distribution of PM10 monitoring stations are shown in Fig. 1.
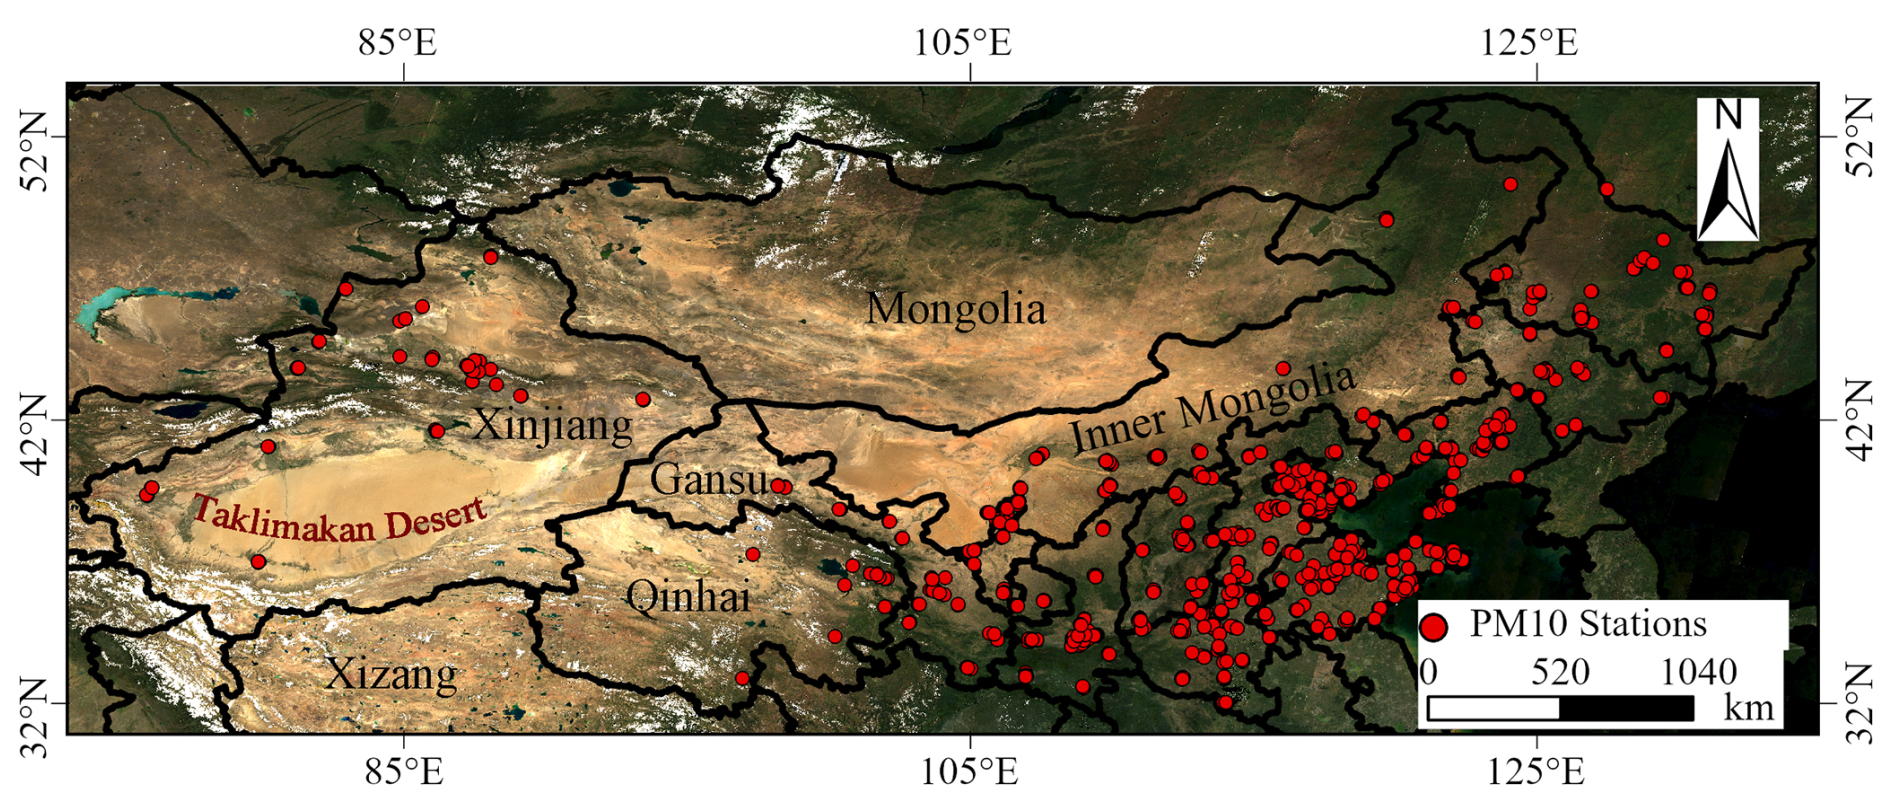
Figure 1Location of the study area and distribution of environmental monitoring stations in China.
2.2 Observation data from satellites
2.2.1 AGRI/FY-4A and FY-4B
FY-4A and FY-4B represent China's new generation of geostationary orbit meteorological observation satellites, having been successfully launched in December 2016 and June 2021, respectively. The satellite system is equipped with an advanced geostationary radiation imager (AGRI), geostationary interferometric infrared sounder (GIIRS), and a lightning mapping imager (LMI), and the space environment monitoring instrument package (SEP) can provide continuous monitoring data for land surface, water body, lightning, and space weather. As the primary payload of FY-4A/B, AGRI acquires high spatiotemporal resolution imagery across 14 spectral bands (15 bands for FY-4B) from visible to infrared wavelengths, with spatial resolution ranging from 0.5 km (visible band) to 4 km. As FY-4A ceased transmitting data to the ground on 4 March 2024, subsequent identical data will be provided by FY-4B.
In addition to providing level 1 (L1) raw observation data, FY-4A/4B satellites also generate various level 2 (L2) quantitative satellite products, including cloud and atmospheric products, surface products, weather products and radiation products. The data are publicly available from the National Satellite Meteorological Centre (NSMC) of China (https://www.nsmc.org.cn/, last access: 30 June 2025). The product of DSD observed by AGRI was used in the study, with a spatial resolution of 4 km and a temporal resolution of 15 min. The DSD product contains DST data and the Infrared Difference Dust Index (IDDI_DST). Among them, DST is based on the radiation characteristics of dust and uses the characteristics of the AGRI spectral channel to summarize and generalize the bands and indicators that can be applied to satellite remote sensing dust monitoring; DST designs 12 sets of dust identification indicators. Based on dust weather occurrence areas, cloud areas, vegetation areas, and desert areas, different reliability indicators are set for the threshold ranges of different identification indicators by using the probability density function (PDF) and cumulative probability density function (CDF) (Zhang et al., 2019a). The final dust detection product is synthesized by the PDF of the reliability of 12 identification indicators and their threshold, which effectively avoids misjudgments and omissions caused by a single or a few identification indicators of FY-4A/B. The higher the DST, the closer it is to the standard dust spectrum statistical value, that is, the greater the possibility of dust. The recommended DST is above 16 for dust pixels, between 14 and 16 for possible dust pixels, and below 14 for non-dust pixels. Therefore, this study considered that DST greater than 16 is dust.
IDDI describes the difference between the real-time target brightness temperature observed by satellites and the surface brightness temperature of the clear-sky atmosphere at the same moment to obtain the attenuation of the brightness temperature of the earth–atmosphere system caused by atmospheric dust aerosols, which can semi-quantitatively characterize the dust intensity (Legrand et al., 2001; Hu et al., 2007). The first step in the generation process of IDDI is to establish a clear-sky surface background brightness temperature image, which consists of the daily maximum thermal infrared brightness temperature value of the surface collected in the latest period. In order to make each image pixel clear-sky observation data and avoid the influence of seasonal changes, it is appropriate to use 10 consecutive days as the synthesis period of the background brightness and temperature image. Secondly, the background brightness temperature image is used to subtract the daily real-time observed brightness temperature image to obtain the brightness temperature difference image, which represents the brightness temperature attenuation caused by atmospheric components (aerosol, water vapor or clouds). Finally, the cloud coverage area is filtered out to eliminate the influence of background aerosols and water vapor.
where RBT10.8 is the clear-sky background reference brightness temperature, which is the maximum 10.8 µm brightness temperature at the same time for 9 or 10 consecutive days. BT10.8 is the actual brightness temperature measured by the 10.8 µm satellite sensor.
The IDDI value of the remaining area is the IDDI value of atmospheric dust aerosol. Generally speaking, the amount of surface brightness temperature attenuation caused by atmospheric background aerosols and clear-air atmospheric water vapor in sandstorm weather is a small amount compared to the brightness temperature attenuation of dust aerosols, and can be ignored for the identification of dust. Therefore, the image obtained after removing the cloud area can be used as an IDDI image. Generally, the higher IDDI value indicates that the dust content of the air is higher, otherwise it is lower. In accordance with Yang et al. (2023) methodology, pixels with IDDI values ranging from 2 to 40 were classified as dust-containing to minimize both omission errors and commission errors in dust detection.
2.2.2 MODIS/Terra and Aqua
MODIS carried on the Terra and Aqua satellites is a key instrument in the earth observation system program for observing global biological and physical processes. It has 36 medium-resolution spectral bands (0.4–14.4 µm). The double satellites combine to observe the earth's surface every 1–2 d to achieve long-term observation of changes in land, oceans, atmosphere, and other targets. Its observational data and products are widely used in regional/global ecological environment and natural disaster monitoring as well as climate change research. The data can be downloaded from MODIS Web (https://modis.gsfc.nasa.gov/, last access: 30 June 2025).
MODIS provides aerosol products with varying resolutions (1, 3, and 10 km) for operational use, offering long-term and global coverage. One type includes daily atmospheric aerosol products with spatial resolutions of 10 and 3 km, while another type features daily, 8 d, and monthly composite products with a spatial resolution of 1° × 1°. These aerosol products are based on two famous aerosol retrieval algorithms, including the Dark Target (DT) algorithm on land/ocean and the Deep Blue (DB) algorithm on land (Hsu et al., 2013; Levy et al., 2013). Due to the significant impact of high-reflectivity areas such as deserts and snowfields on the atmospheric top layer reflectance in the red light and shortwave infrared bands, the linear relationship between the surface reflectance of red and blue light (0.65 and 0.47 µm) and the surface reflectance in the shortwave infrared band (2.11 µm) does not hold. This makes it difficult to distinguish the contributions from aerosols and the ground (Hsu et al., 2013). In contrast, the DB algorithm shows better retrieval results in these areas, as its initial development aimed to overcome the uncertainties in retrieval results in high-reflectance environments. Considering the characteristics of different algorithms, the characteristics of the study area, and the temporal and spatial resolution of the data, this study selects the aerosol parameters retrieved by the DB algorithm from MODIS Collection 6.1 MOD04_L2 and MYD04_L2 data, with a spatial resolution of 10 km.
2.2.3 TROPOMI/Sentinel-5P
Sentinel-5P is a sun-synchronous orbit satellite launched by the European Space Agency (ESA) in October 2017. It observes earth with consistent solar illumination angles, enabling daily global coverage. The payload's TROPOMI instrument features a scanning swath of about 2600 km, achieving a nadir ground resolution of 7 km along-track by 3.5 km cross-track. As the world's highest-resolution and most advanced imaging spectrometer for atmospheric environmental monitoring, TROPOMI provides hyperspectral measurements across ultraviolet (UV), visible (VIS), near-infrared (NIR), and shortwave infrared (SWIR) bands (Veefkind et al., 2012). This allows for more detailed atmospheric aerosol parameter retrieval, significantly outperforming existing instruments such as the Ozone Monitoring Instrument (OMI) (Fioletov et al., 2020).
The TROPOMI L2_AER_AI dataset provides global high-resolution images of the ultraviolet aerosol index (UVAI), also known as the absorption aerosol index (AAI). UVAI is based on the wavelength-dependent variation of Rayleigh scattering within the UV spectral range for a given wavelength pair, calculating a ratio from the measured top-of-the-atmosphere (TOA) reflectance and the pre-calculated theoretical reflectance of atmospheric Rayleigh scattering (Apituley et al., 2022). However, the difference between the observed and simulated reflectance produces residual values. When this residual value is positive, it indicates the presence of UV-absorbing aerosols such as dust and smoke (Michailidis et al., 2023). Therefore, AAI can effectively track the evolution of intermittent aerosol plumes caused by dust weather, volcanic eruptions, and biomass burning. Clouds produce residual values close to 0, and strongly negative residual values can indicate the presence of non-absorbing aerosols and clouds. AAI is a reliable calculation method that depends on aerosol layer characteristics, including aerosol optical depth, aerosol single scattering albedo, aerosol layer height, and underlying surface albedo (Torres et al., 2020). It is well documented based on years of data, and its key advantages include fast computing speed, wide global coverage, ease of use, and the potential to build long-term climate data records (Apituley et al., 2022). Additionally, unlike satellite-based AOD measurements, UVAI can qualitatively characterize the presence of absorbing aerosols and their spatial distribution characteristics even under cloudy conditions, thereby achieving daily global coverage. In the study, the AAI index used was measured at wavelengths of 354 and 388 nm, which are wavelengths with very low ozone absorption. According to the study results of Rezaei et al. (2019) and Filonchyk et al. (2020), the study considers that when the AAI > 0.7 it is a dust pixel. In order to improve data quality and eliminate the impact of sunlight flicker, only TROPOMI pixels with quality assurance (QA) greater than 0.8 are used according to official recommendations. Data are freely and publicly available from https://dataspace.copernicus.eu/ (last access: 30 June 2025).
2.2.4 AHI/Himawari-8 and Himawari-9
Himawari-8/9 was developed under the leadership of the Japan Meteorological Agency (JAM) and enables high-frequency observations within the region (80° E–160° W, 60° S–60° N), with a maximum spatial resolution of 500 m and a temporal resolution of 10 min (providing six full-disk images per hour). Compared to the previous Himawari-7 satellite, the Himawari-8/9 satellites have significantly improved in terms of operational lifespan and meteorological observation capabilities. It carries an AHI with 16 bands, including 3 visible, and 3 near-infrared, and 10 infrared channels. Due to its advantages of high-frequency imaging, high spatial resolution, and wide spectral band, it can observe targets such as land, ocean, and atmosphere more accurately and with detail (Bessho et al., 2016; Wei et al., 2019a). Therefore, it is widely used in the monitoring of clouds, aerosols, sea surface temperatures, and natural disasters. In addition, since its spectral band contains aerosol-sensitive blue light channels, it has great potential in aerosol retrieval (Ge et al., 2018).
Currently, the Earth Observation Research Centre of Japan Aerospace Exploration Agency (JAXA) provides level 2 and level 3 aerosol datasets, including full-disk AOD and Ångström exponent (AE) at 500 nm wavelength. The AHI aerosol products are generated by an aerosol retrieval algorithm developed by Fukuda et al. (2013). The algorithm is based on the Lambertian assumption on land and sea, using three visible bands (470, 510, and 640 nm) and two near-infrared bands (860 and 1600 nm), introducing weights into the objective function of each channel (Fukuda et al., 2013; Yoshida et al., 2018). Then, the best channel for aerosol retrieval is automatically selected. The specific process is as follows.
Firstly, the radiation correction of clear-sky pixels is carried out (filtering out cloud pixels), based on the assumption that the atmospheric scattering is entirely due to Rayleigh scattering. Then, the pixels with the second-lowest reflectance at 470 nm within a month are synthesized. Pixels exhibiting values at 470 nm that are higher than those at 640 nm are suspected of being influenced by residual aerosol contamination. To address this, these pixels will be replaced with reflectance values calculated based on the vegetation index, utilizing the spectral dependence of surface reflectance (Kaufman et al., 1997). These results will be considered the true surface reflectance. Next, the atmospheric radiation transmission system is used to simulate the reflectance of the top of the atmosphere, and the calculation speed is accelerated by building a lookup table (Wei et al., 2019a; Zhang et al., 2019b). Simultaneously, cluster analysis was performed using AErosol RObotic NETwork (AERONET) measurement data, and the aerosol model was hypothesized to consist of fine-mode aerosols (including rural, sea spray, and yellow dust) and coarse-mode aerosols (pure marine and dust) with unimodal lognormal volume size distributions (Wei et al., 2019a). Furthermore, a general cloud detection algorithm previously developed by Yoshida et al. (2018) and an empirical approximation method based on MODIS were adopted to minimize the impact of clouds, water vapor, and ozone on the retrieval result (Wei et al., 2019b). Finally, the objective function is established using the simulated and observed TOA reflectance, and those parameters that minimize the objective function are the retrieval results (Zhang et al., 2019b). The study used AOD and AE datasets from AHI level 2 hourly (00:00 to 12:00 UTC) and level 3 daily synthetic aerosol products to evaluate the continuity, accuracy, and stability of AHI aerosol products in monitoring dust activities in East Asia. Among them, level 3 data are based on the hourly combination algorithm developed by Kikuchi et al. (2018), which is more accurate. The data are publicly available from https://www.eorc.jaxa.jp/ptree/index.html (last access: 2 July 2025).
2.3 Methods
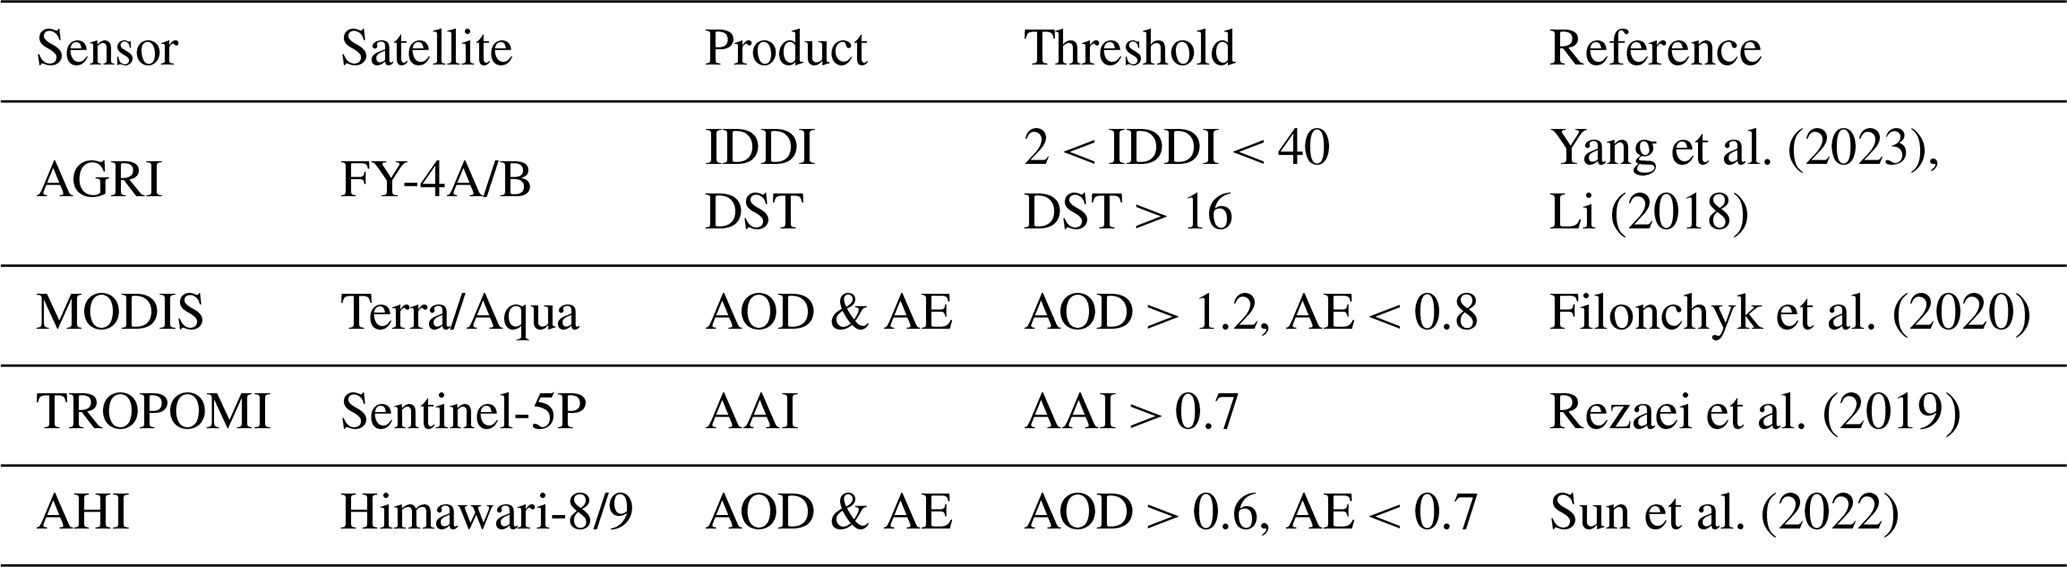
In this study, the method of AOD and AE (Ångström exponent) relationship was used for aerosol type identification. This method has been used in several studies, and its principle is based on the sensitivity of two wavelength parameters to various microphysical properties of aerosols (Boiyo et al., 2018). AOD is a key physical quantity that characterizes the degree of atmospheric turbidity. It describes the light attenuation caused by aerosol absorption and scattering, and its magnitude mainly depends on the aerosol column density. AE is the main indicator to characterize the size of atmospheric aerosol particles, which describes the dependence between AOD and wavelength. When the AE value is less than 1, it indicates that coarse particle aerosols dominate. Otherwise, fine-particle aerosols dominate. Therefore, the dominant aerosol types in the atmosphere of this region can be identified based on the interaction between AOD and AE. In the study, MODIS AOD pixels with AOD > 0.6 and AE < 0.7 are considered to be dust based on the study results of Filonchyk et al. (2020). Similarly, according to the study results of Sun et al. (2022), AHI AOD pixels with AOD > 1.2 and AE < 0.8 are considered to be dust. The specific detection thresholds for different remote sensing data are shown in Table 1.
The continuity, accuracy, and stability of satellite remote sensing detection of dust in the atmosphere require verification of ground data. At present, most studies use aerosol parameters measured by AERONET to verify the results of satellite remote sensing detection (Wei et al., 2020). However, the number of AERONET stations in East Asian dust source areas and transmission paths is small and unevenly distributed, making it difficult to provide effective observation data. However, because ground environmental monitoring stations have the characteristics of high observation frequency, large number of stations, and wide distribution, they are often used to verify the authenticity of satellite remote sensing products. In addition, the PM10 concentration at ground environmental monitoring stations is very sensitive to changes in the concentration of coarse particles, especially changes in dust concentration (Çapraz and Deniz, 2021). Therefore, PM10 concentration data from ground monitoring stations provides a reliable and stable data source for verifying the continuity, accuracy, and stability of satellite remote sensing detection of atmospheric dust. According to the “Technical Regulations on Classification of Dust Weather” issued by the Ministry of Ecology and Environment of the People's Republic of China, an hourly PM10 concentration greater than or equal to 600 µg m−3 is considered to be dust weather (Yang et al., 2023). Therefore, when the PM10 concentration at any environmental monitoring station was greater than 600 µg m−3 during dust weather, which is classified as dust observation. In the study, the probability of correct detection (POCD) and the probability of false detection (POFD) were used to evaluate the accuracy of satellite remote sensing in detecting atmospheric dust. The calculation formula is as follows:
where DD represents the number of matching points with PM10 concentration greater than 600 µg m−3, and the satellite remote sensing detection result is dust. DN represents the number of matching points with the PM10 concentration greater than 600 µg m−3, while the satellite remote sensing monitoring results indicate no dust. ND represents the number of matching points with the PM10 concentration lower than 600 µg m−3, while the satellite remote sensing monitoring results are dust.
In addition, due to the differences in observation frequencies and observation ranges of different types of satellites. In order to better compare the continuity, accuracy, and stability of different satellite remote sensing products in monitoring the evolution of dust weather in East Asia. In this study, we used the temporal and spatial data from Sentinel-5P as a benchmark to select MODIS, Himawari-8/9, and FY-4A/B data that have the smallest time difference from Sentinel-5P within a 30 min window and share overlapping observation areas. These data are considered to reflect atmospheric dust information in the same spatiotemporal context as that observed by Sentinel-5P.
3.1 Performance of FY-4A/B in monitoring dust weather
Compared to ground-based observation stations monitoring dust weather, satellite remote sensing observations not only provide a broader perspective but also offer a more intuitive dynamic evolution process of dust storm events. To comprehensively assess the performance of different satellite remote sensing products during dust weather events in East Asia, this study selected all recorded DEs from 2019 to April 2025, which include 41 blowing sand (BS) events, 16 dust storm (DS) events, and 7 strong dust storm (SDS) events.
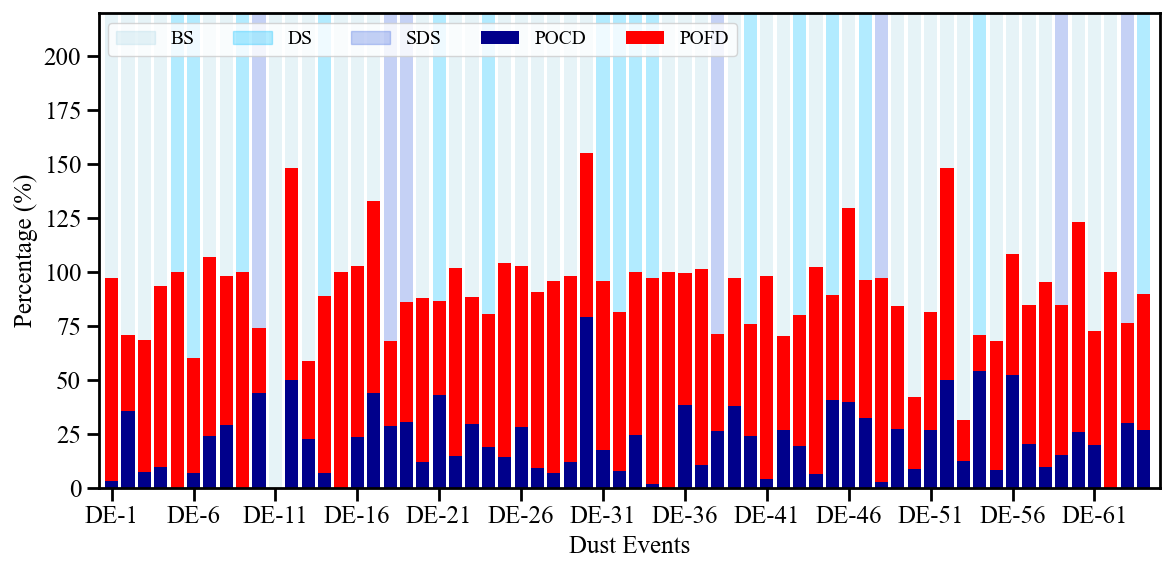
Figure 2 illustrates the POCD and POFD of the FY-4A/B DST product during dust storm events of varying intensities. The horizontal axis represents different dust events (DE-1 to DE-64), while the vertical axis indicates the percentage of accuracy. Overall, the POFD significantly exceeds the POCD, indicating a high misjudgment rate in dust detection by DST products during DEs. For example, during events DE-5, DE-15, DE-35, and DE-62, the POCD approaches 0 while the POFD is close to or equal to 1. In addition, the overall fluctuations of POCD in multiple events are greater than those of POFD. The dust detection performance of DST products in DE-12, DE-30, DE-52, DE-54, and DE-56 was relatively good, with an overall POCD exceeding 50 %. Notably, DE-30 exhibited a POCD as high as 75 %, making it the most effective dust detection among all DEs. It is worth highlighting that for the DE-54 event, DST's dust detection not only achieved a high POCD but also registered the lowest POFD among all events. From the perspective of different types of sandstorm weather processes, the POCD of the DST product shows little variation across the different intensity levels of sandstorm weather events, with average POCD values of 23 % (BS), 20 % (DS), and 25 % (SDS), respectively. This indicates that the DST product exhibits relatively stable detection capability for DEs of varying intensities. However, the POFD shows significant discrepancies. The POFD is lowest during SDS events, with an average of 54 %, whereas it is higher during DS and BS events, both having an average of 74 %. These values are significantly higher than that of the SDS events, indicating that the DST product has a higher false detection rate during BS and DS events, with only a few DEs, such as DE-11 and DE-56, showing better performance. However, in SDS events, the dust detection effectiveness of the DST products is significantly improved, indicating that the atmospheric dust detection capability of the DST products works better in more intense dust weather processes. Although the POCD of the DST products increases during these intense dust processes, the POFD still displays a high value.
This study takes the strong dust event that occurred from 15 to 20 March 2021, in northern China, as a case to investigate the monitoring of dynamic changes in sandstorm weather through satellite remote sensing. By associating satellite remote sensing products with ground station PM10 concentrations spatially, the study analyses the variations of both throughout the entire dust weather process. Figure 3 shows the distribution of the daily average DST from FY-4A and the daily average PM10 concentration at environmental monitoring stations during the dust event from 15 to 20 March 2021. The data indicate that on 15 March 2021 a dust storm formed a dust band stretching from west to east across northern China, affecting an area that extended from eastern Xinjiang to the northeast region of China (40–53° N, 118–135° E). The daily average PM10 concentrations at most monitoring stations within the dust band exceeded 600 µg m−3. As the dusty weather continued to develop, the affected areas expanded southward in China on 16 March, with PM10 concentrations continuously rising in multiple regions. From 17 to 19 March, the coverage of this sand and dust weather began to decrease from east to west, especially as PM10 concentrations gradually fell in China's North (32–42° N, 110–120° E) and Northeast regions. By 19 March, the daily average PM10 concentration at most monitoring stations affected by the dust was between 0 and 200 µg m−3, indicating that the dust weather event is generally coming to an end. However, there are still stations in the southwest part of Inner Mongolia where the PM10 concentration exceeds 600 µg m−3. However, on 20 March, the PM10 concentration in China's northern region showed an increase compared to 19 March, with the DST values in that area distributed between 21 and 23.
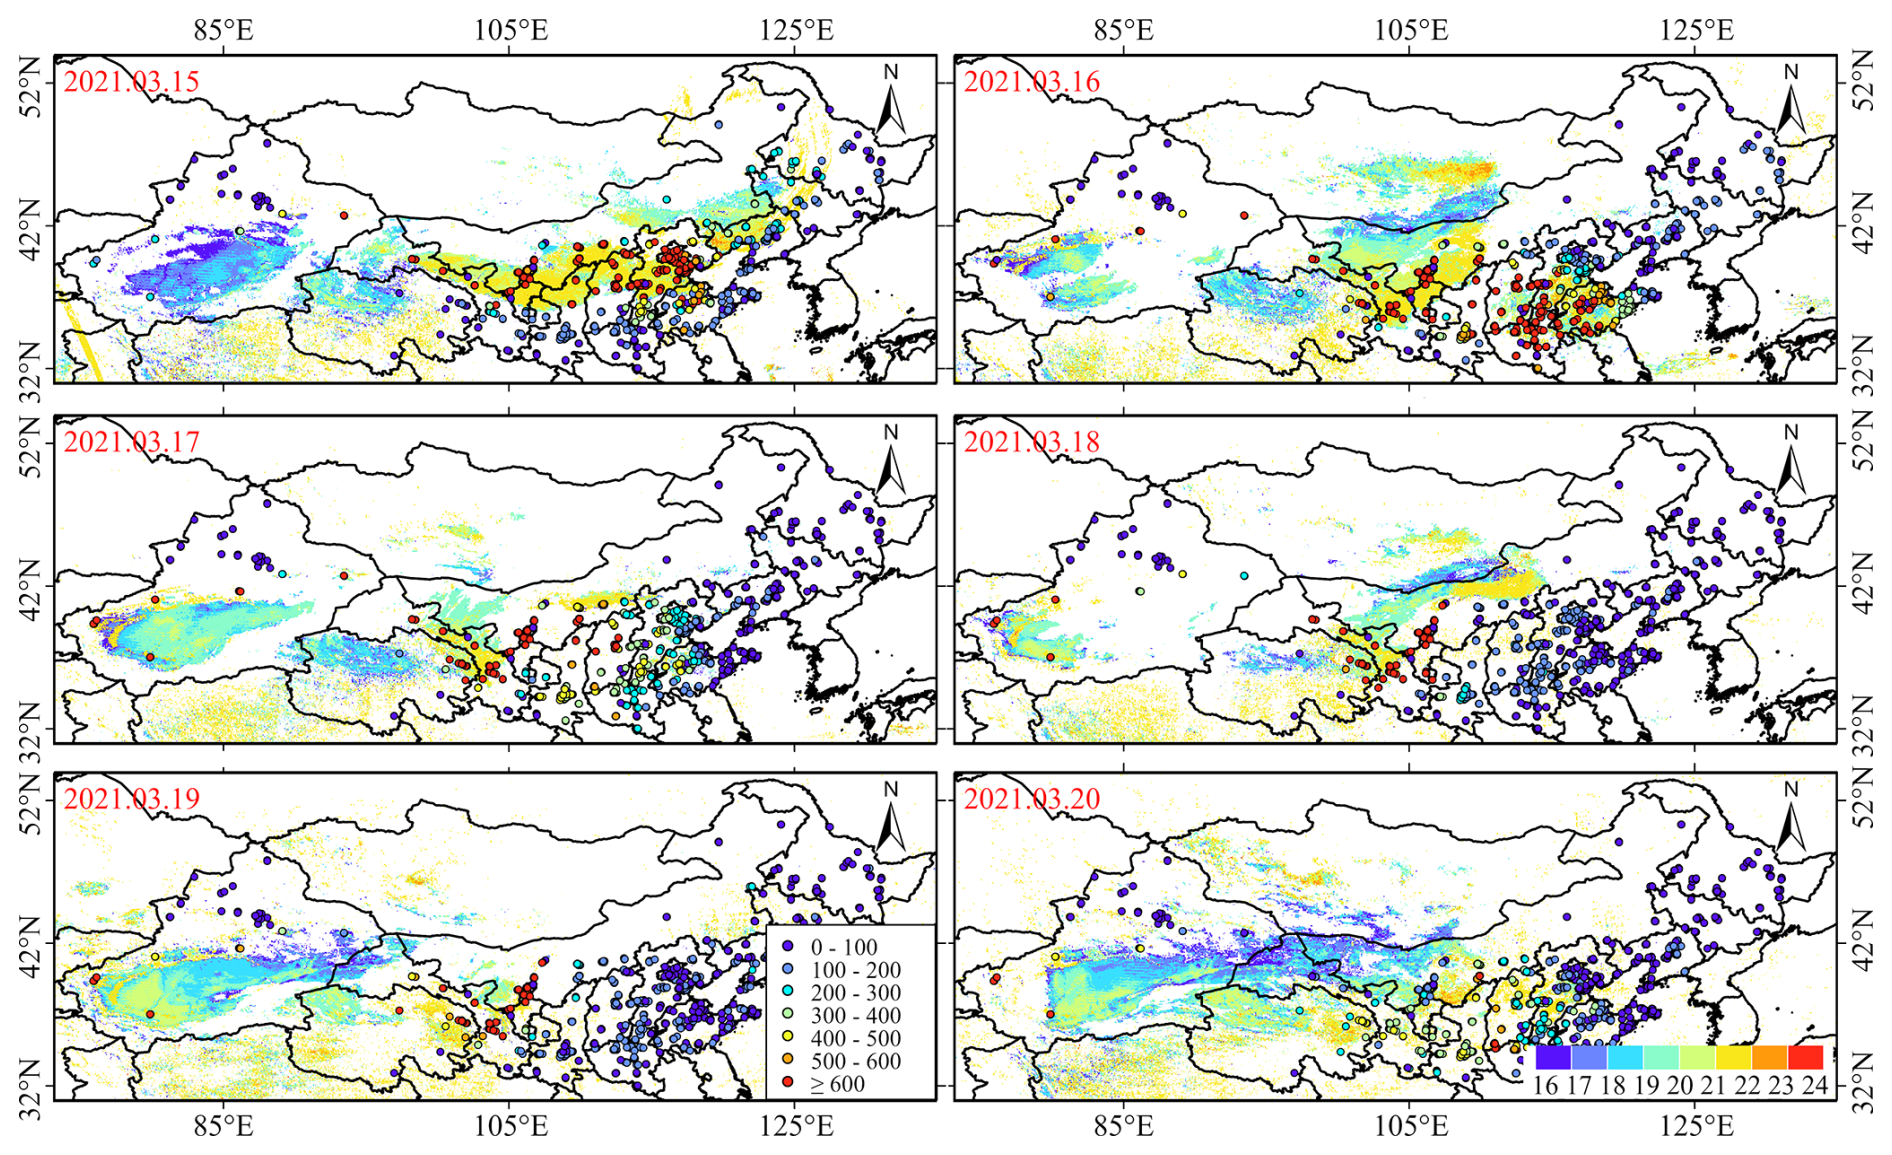
Figure 3Spatial distribution of daily FY-4A DST during the dust weather process from 15 to 20 March 2021.
Figure 4 illustrates the performance of FY-4A/B IDDI_DST across multiple dust events. From the graph, it can be observed that in the vast majority of DEs, the POCD values are low, predominantly ranging between 1 % and 15 %. Only a few events (such as DE-10, DE-30, DE-52, and DE-54) exhibit POCD values exceeding 15 %, indicating that the IDDI_DST product demonstrates poor atmospheric dust detection capabilities during dust weather processes. From a statistical distribution perspective, the POFD for most events is concentrated between 50 % and 90 %, which implies that approximately 50 % to 90 % of the results in each detection could be false alarms. Notably, events such as DE-15, DE-17, and DE-41 have POFD values approaching 1, which nearly signifies complete misjudgment. Only a few events, such as DE-10, DE-42, and DE-50, have POFD values below 40 %, indicating relatively better detection accuracy. From the perspective of different types of sandstorm weather, the POCD of the IDDI shows little variation across different intensity levels of sandstorm weather processes, but the differences in POFD are more pronounced. The POFD is relatively low during SDS events, while it is relatively higher during DS and BS events. The detection capability of BS events is the poorest, with POCD values generally below 10 %, while POFD values range from 60 % to 90 %, with an average of 72 %. In comparison, DS and SDS events show slightly improved detection performance but still exhibit high POFD values. This indicates that although there has been some improvement in detection capabilities, the false alarm rates remain substantially high during dust detection.
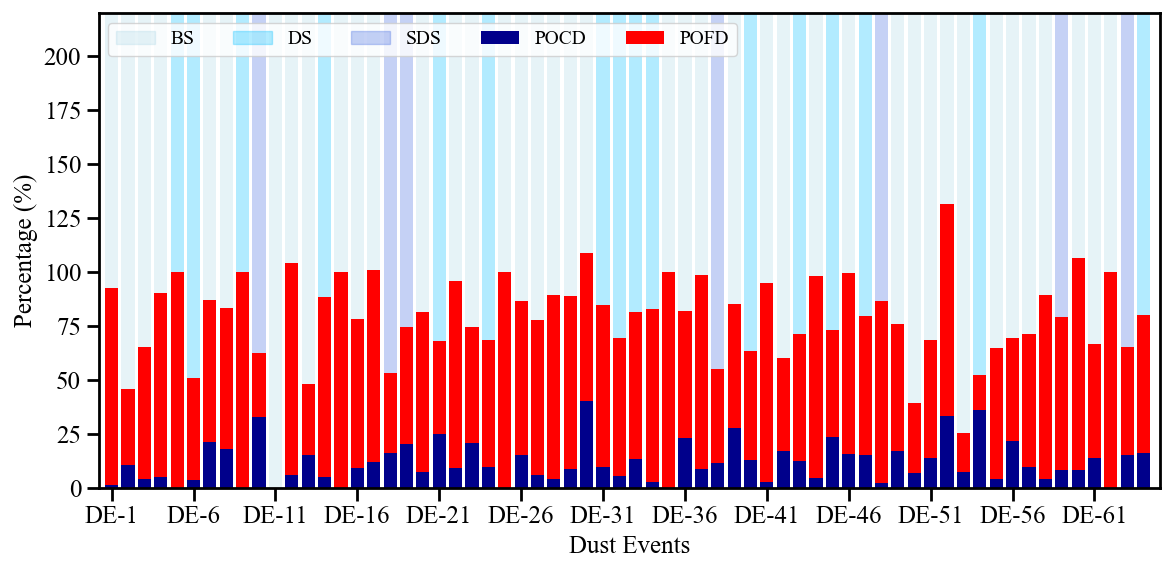
Figure 5 shows the distribution of daily average IDDI_DST and PM10 concentrations from 15 to 20 March 2021. From Fig. 5, it can be observed that the spatial distribution of FY-4A IDDI and DST is relatively consistent throughout the dust weather event, and the areas of high values are also associated with higher PM10 concentrations. Additionally, from the daily spatial distributions of DST and IDDI, when the DST indicates the presence of dust, the IDDI results do not necessarily reflect dust conditions. For example, on 15 March 2021, the DST values in the central-western region of the Taklimakan Desert ranged from 16 to 20, while the IDDI did not detect any dust. At the same time, there are areas where the PM10 concentrations at ground monitoring stations indicate high dust intensity, but the IDDI values are relatively low. For example, on 16 March the IDDI values in the North China Plain ranged from 2 to 8, while the PM10 concentration values at most monitoring stations exceeded 600 µg m−3.
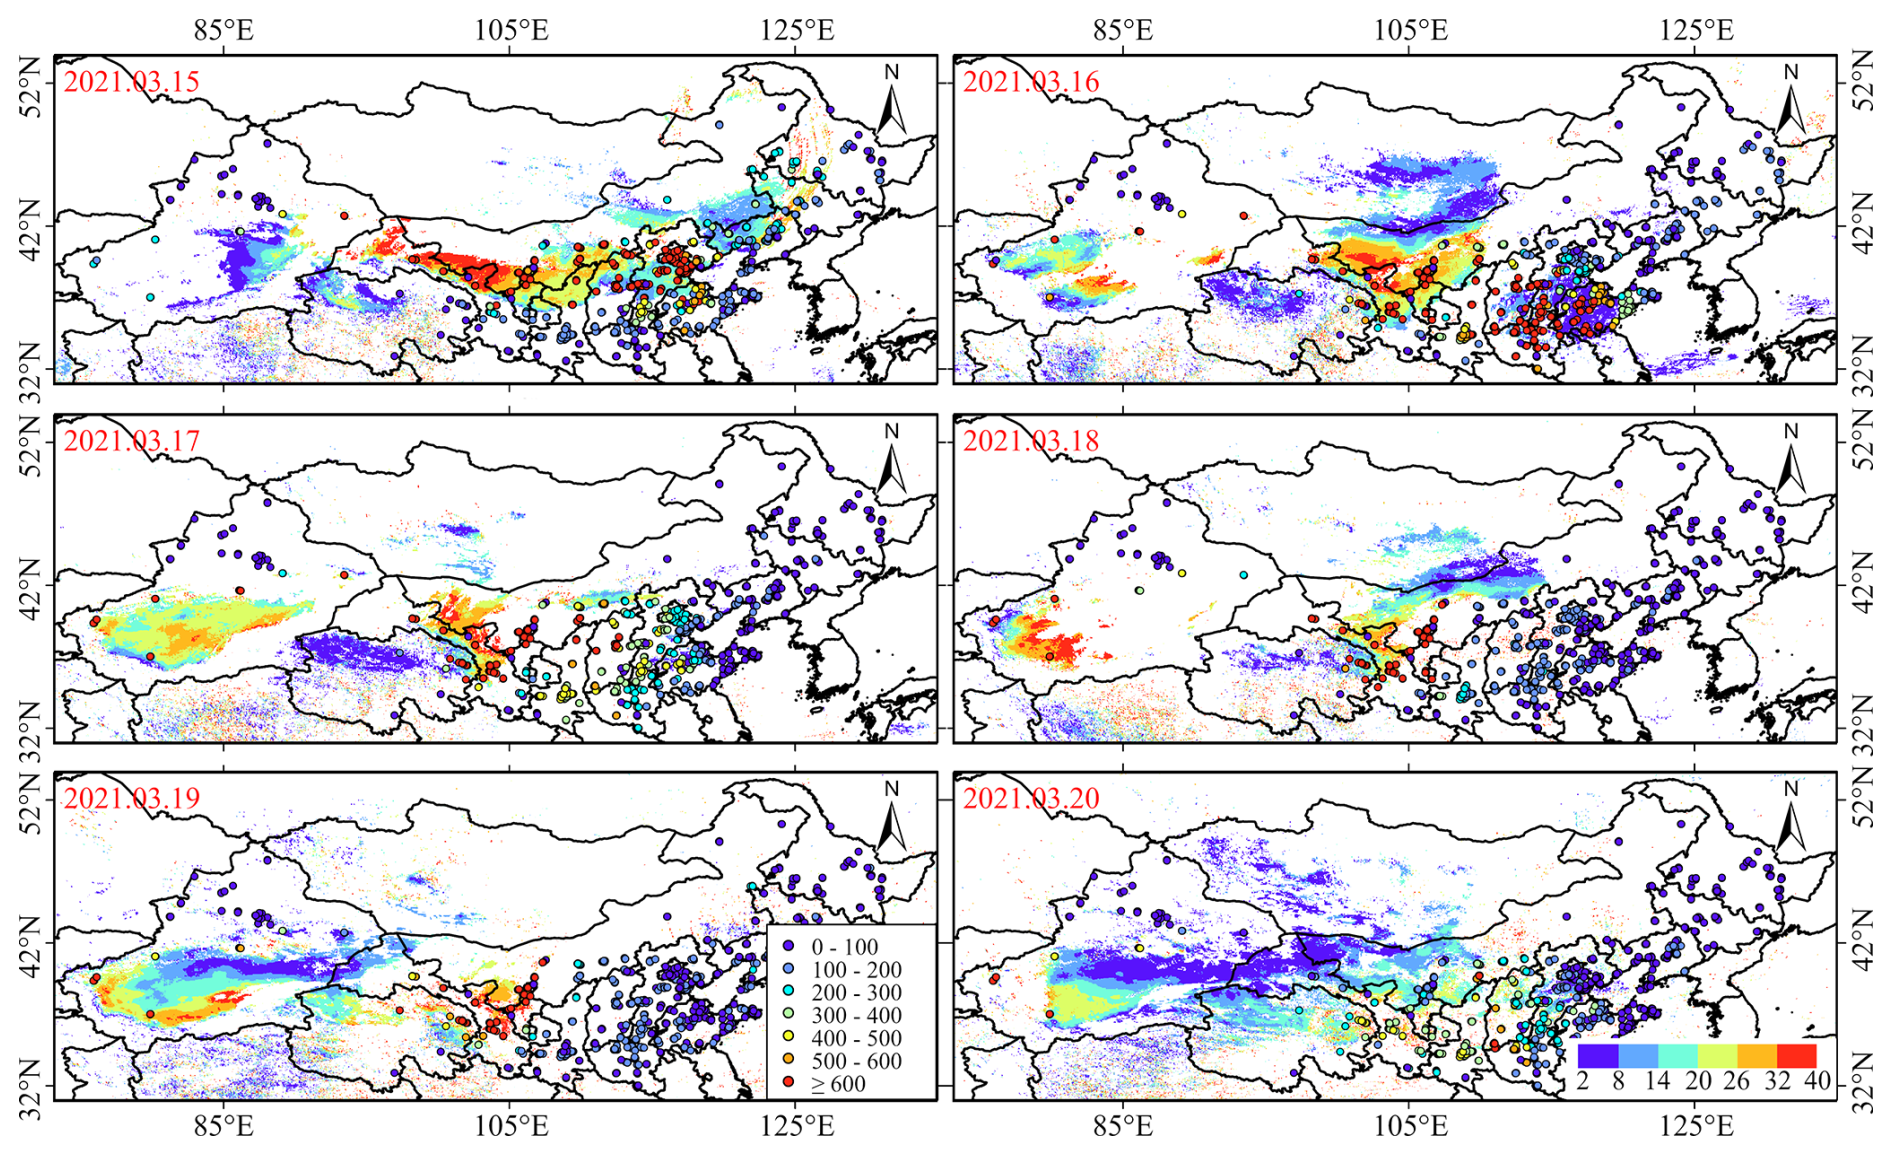
Figure 5Spatial distribution of daily FY-4A IDDI during the dust weather process from 15 to 20 March 2021.
Although IDDI can be used as a semi-quantitative parameter of dust intensity, it cannot be ignored due to the effect by surface background brightness and meteorological factors (Hu et al., 2007). First of all, the premise of IDDI calculation is that the surface temperature does not change within a certain period of time. However, the surface background brightness temperature changes significantly throughout the day. For East Asia, spring is not only the season with the most frequent dust weather but also the season with the most frequent cold air activities. Since the sudden arrival of cold air causes a substantial drop in surface temperature, the synthetic background brightness temperature used in the reference period may be higher than the actual surface brightness temperature on that day, which will cause an overestimation of IDDI. Secondly, during the calculation process, the atmosphere was considered to be clean on the day with the maximum brightness temperature, but the actual situation was not that ideal. In the process of surface brightness temperature image generation the final IDDI value will be underestimated if there is residual dust in the clearest weather. Finally, the maximum brightness temperature in the cloud coverage area that lasts for a long time is still not the actual surface brightness temperature, or the inversion fog appears when the brightness temperature is synthesized in the reference period; the inversion fog is regarded as the surface brightness temperature. Therefore, there will inevitably be systematic errors when calculating IDDI, resulting in the final IDDI value being too high or too low. In addition, Hu et al. (2007) found that it is difficult to distinguish a small amount of clouds and dust, and the usual cloud detection algorithms often misjudge dust as clouds. Some thin cirrus clouds and heavy precipitation clouds will appear similar for bright temperature difference signals, which is also an important reason for missed and misjudgment of atmospheric dust detected by satellite remote sensing. Duan et al. (2014) compared the forecast results of the FY-2D IDDI product with the GRAPES-SDM dust model and found that the FY-2D IDDI product often misjudged the deep dust in the southern Tarim Basin as a cloud area, ultimately leading to missed judgments of dust. Zhang et al. (2019a) used ground dust observation data to verify the IDDI product of FY-4A. The results showed that FY-4A IDDI can detect 88 % of ground dust observations. Especially under cloud-free conditions, IDDI can effectively detect dust areas. However, when the dust layer is under clouds or mixed with clouds, the false detection rate is higher.
Although DST is synthesized using the reliability of 12 kinds of dust discriminant indicators, it can avoid misjudgments and omissions caused by one or a small number of concentrated discriminant indicators to a certain extent. However, these judgment indicators include the 11 µm background brightness temperature and actual brightness temperature difference. Therefore, the same error sources as IDDI inevitably occur (affected by surface background brightness temperature and meteorological factors), resulting in misjudgments and missed judgments in the final identification results. Zhang et al. (2019a) conducted a preliminary verification of the FY-4A DST product using surface weather phenomena and visibility observation data. The results showed that the FY-4A dust detection algorithm can effectively identify dust weather processes; detection rates are especially high for cloudless dust weather. However, there was a certain missed detection in the case of dust mixed with clouds or under the cloud. In addition, an index is usually calculated using the brightness temperatures of two or more thermal infrared bands in these methods, and a fixed threshold is also used to identify dust. However, the brightness temperature observed by satellites is directly related to surface temperature and emissivity, and it is also affected by dust characteristics (particle size and vertical distribution, etc.) (Li et al., 2021). Therefore, there are large differences in dust identification results based on a single fixed threshold, and there are significant differences in DEs in different regions and different intensities.
3.2 Performance of MODIS in monitoring dust weather
For East Asia, especially in northern China, when large-scale sandstorms occur in the spring, the main pollutant in the atmosphere within the affected area is dust (Filonchyk, 2022; Song et al., 2022). Figure 6 shows the POCD and POFD of atmospheric dust for each of the 64 DEs recorded by the MODIS AOD product from 2019 to 2025. As seen in Fig. 6, the MODIS AOD demonstrates relatively high POCD in some DEs. In approximately 40 % of the events, the POCD is greater than or equal to 50 %, indicating that the MODIS AOD product has good capability in detecting dust suspended in the atmosphere. In DEs such as DE-21, DE-30, and DE-44, POCD reaches 80 % or higher, with DE-30 and DE-44 showing POCD close to 100 %, demonstrating their advantage in monitoring and research applications for sandstorm weather. Although the MODIS AOD product shows good detection capability for atmospheric dust in most DEs, the POFD is notably high in some events (e.g., DE-4, DE-5, and DE-15). It is worth noting that during BS events, the POFD of AOD is generally higher than in other events, with an average value of 92 % significantly higher than the 85 % and 74 % for DS and SDS, indicating that MODIS has limited detection capability in regions with low dust concentrations in the atmosphere. In contrast, the comparison between POCD and POFD is more significant in some DS and SDS events (e.g., DE-18, DE-21), reflecting an improvement in the reliability of the MODIS AOD product during higher intensity DEs. Furthermore, although the MODIS AOD shows high POCD in some events (such as DE-44 and DE-56), the POFD does not significantly decrease.
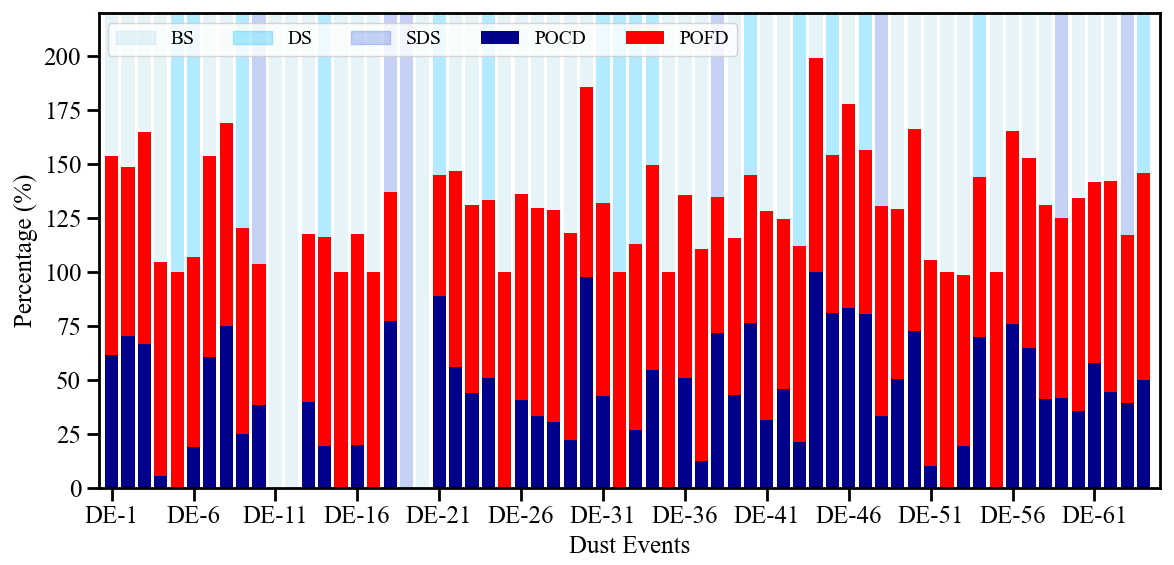
Figure 7 presents the daily average spatial distribution of AOD and PM10 concentration during the DEs from 15 to 20 March 2021. As shown in Fig. 7, the spatial distribution of daily AOD during the DEs is relatively consistent with the FY-4A DST (Fig. 3). However, the MODIS AOD demonstrates better detection performance during the DEs, revealing additional areas that the FY-4A dust product could not detect. For instance, on 15, 17, and 18 March, high AOD value regions are observed at the border between southwestern Mongolia and western Inner Mongolia, where there is a significant discrepancy in the results detected by the FY-4A product. Furthermore, the areas of high AOD values correspond with the locations of high PM10 concentration monitoring stations.
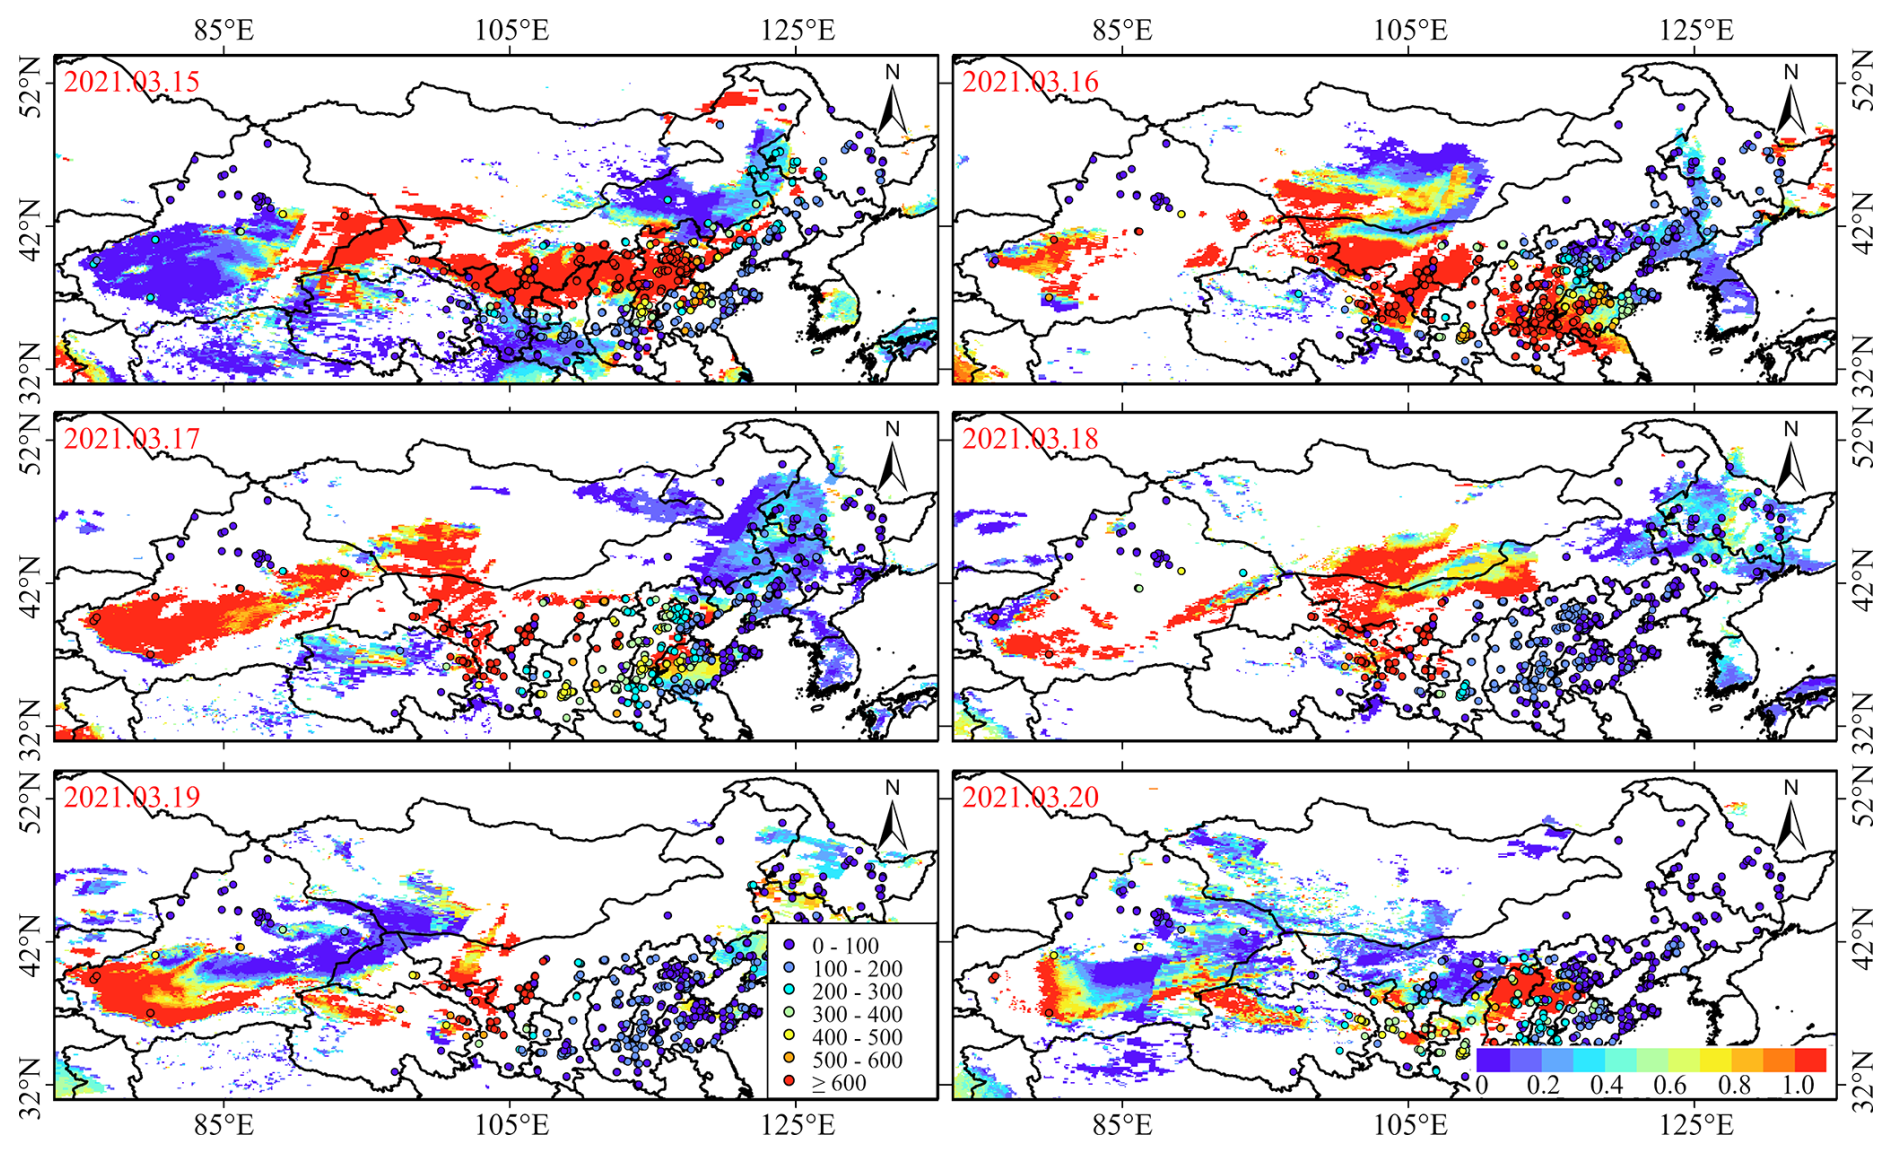
Figure 7Spatial distribution of daily MODIS AOD during the dust weather process from 15 to 20 March 2021.
The MODIS aerosol retrieval algorithm is a radiation-based physical method that mainly relies on the physical properties and spectral characteristics of atmospheric aerosol particles in the visible and near-infrared bands, which is currently the most mature and widely used quantitative remote sensing method for dust aerosols (Hsu et al., 2013; Yan et al., 2020; Wang et al., 2020). However, physically empirical methods are limited by their reliance on thresholds that may be a function of land cover type, aerosol properties, lighting conditions, scattering angles, etc. (Li et al., 2021). In order to quantitatively evaluate the impact of surface albedo, Zhang et al. (2018) used the 6S radiation transfer model to simulate the relationship between the difference between the satellite observation apparent reflectance and the surface reflectance at the 0.47 µm wavelength under different AOD concentration conditions as the surface emissivity changes. The results showed that visible light can be used to effectively monitor dust aerosols over the ocean. However, for areas with complex surface types, the contribution of surface-reflected radiation needs to be considered. When the surface reflectance is higher than a certain value, the apparent reflectance changes little as the aerosol optical thickness increases, and the radiation observed by the satellite mainly comes from the contribution of reflected radiation from the underlying surface. Therefore, how to eliminate the influence of the underlying surface from satellite observations is the key and the difficulty in improving quantitative remote sensing of aerosols. In addition, visible and near-infrared remote sensing cannot penetrate the clouds to detect dust under the clouds. However, dust weather is often mixed with clouds when they occur, and cloud pollution in dust pixels can lead to an increase in AOD (Li et al., 2021). At the same time, in actual situations, the AOD of atmospheric dust aerosols changes continuously in space, and the boundaries are blurred during dust weather processes. Therefore, it is unrealistic to unambiguously classify pixels into dust, cloud, and clear sky.
3.3 Performance of Sentinel-5P in monitoring of dust weather
The positive values in the Sentinel-5P AAI product indicate the presence of absorbing aerosols in the atmosphere, such as dust, smoke, and volcanic ash, while negative values indicate the presence of non-absorbing aerosols (such as sulfates and sea salt) and clouds (Filonchyk et al., 2020; Penning de Vries and Wagner, 2011). In general, large-scale straw burning and forest fires rarely occur in northern China during the spring, let alone volcanic eruptions. Therefore, when large-scale dust weather occurs in the spring and the AAI is positive, it can generally be attributed to dust aerosols.
Figure 8 shows the POCD and POFD of atmospheric dust from the Sentinel-5P AAI product across 64 DEs. The AAI product demonstrates relatively good POCD in multiple DEs, especially during the later DEs of 2019–2025, where the average POCD exceeds 70 %. However, the average POCD in the earlier period was only 30 %. Although the AAI product exhibits high POCD in most events, the POFD for these events is also generally high. In very few specific events (such as DE-10), the AAI product managed to maintain both high POCD and low POFD simultaneously. The detection performance of the AAI product shows significant differences across DEs of varying intensities, with an average POCD of 59 % in BS events accompanied by a very high POFD. The average POCD in DS events is 51 %, while the average POFD is 90 %, indicating that the AAI has weak detection capability for moderate-intensity dust. In SDS events, the performance is relatively balanced, with POCD and POFD at 62 % and 75 %, respectively. It is worth noting that the detection performance does not change monotonically with the intensity of dust; overall, the POCD in DS events is lower than that in BS events, while the average POFD for both is similar. Specifically, BS events exhibit significant polarization: some events are almost completely detected (such as DE-20 and DE-44, which have POCD values of 100 %), while other events have very low POFD (such as DE-1 and DE-25). The detection stability of DS events is the poorest, with a significant discrepancy between the best (POCD of 0.94 for DE-54) and the worst (POCD of 0.09 for DE-6) performance. Although SDS events are generally stable, there are still some events where POFD approaches 1 (such as DE-48).
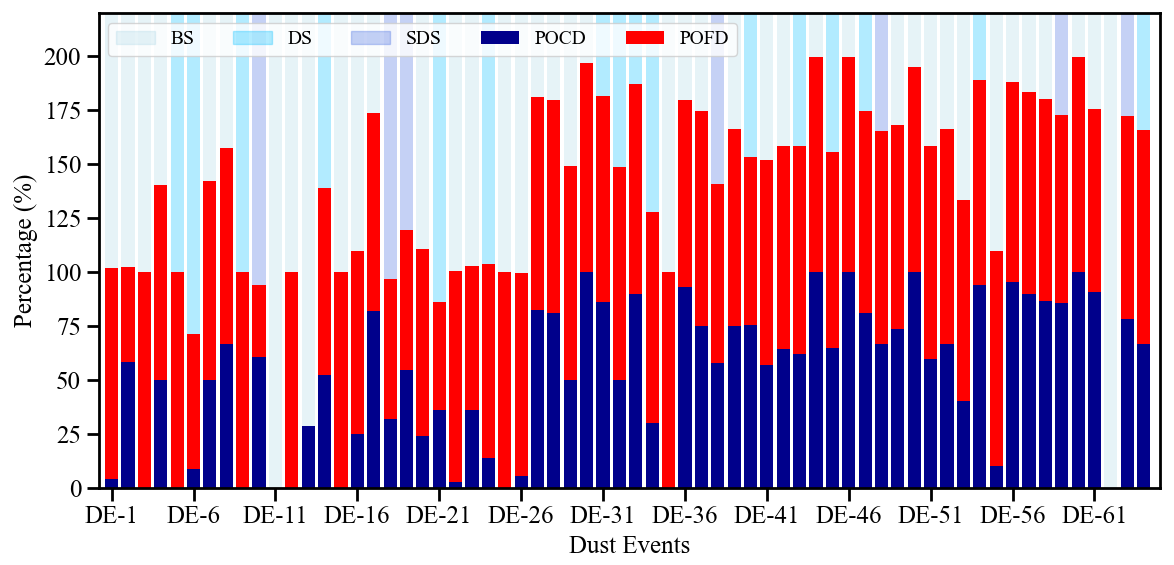
Figure 9 shows the daily average spatial distribution of AAI and PM10 during the DEs from 15 to 20 March 2021, clearly and continuously illustrating the transport process, intensity, and air quality conditions in the areas affected by this dust event. The daily AAI spatial distribution derived from TROPOMI is consistent with the atmospheric dust spatial distribution obtained from MODIS AOD and FY-4A DSD products, with the majority of areas having AAI values ranging from 1 to 4. Moreover, the PM10 concentration is also relatively high in most areas with high AAI values. However, compared to MODIS AOD and FY-4A DSD, AAI exhibits better spatial continuity. In addition, on 15 and 20 March, AAI captured a continuous dust plume in northeastern China, whereas MODIS AOD and FY-4A DSD products are not sensitive to the atmospheric dust in these regions, likely due to the influence of cloud cover and the concentration of dust in the air. Therefore, the Sentinel-5P AAI product has advantages over other passive remote sensing aerosol products in detecting dust under cloudy conditions, allowing it to compensate for the dust information that is missed by other passive remote sensing products due to sub-pixel cloud contamination.
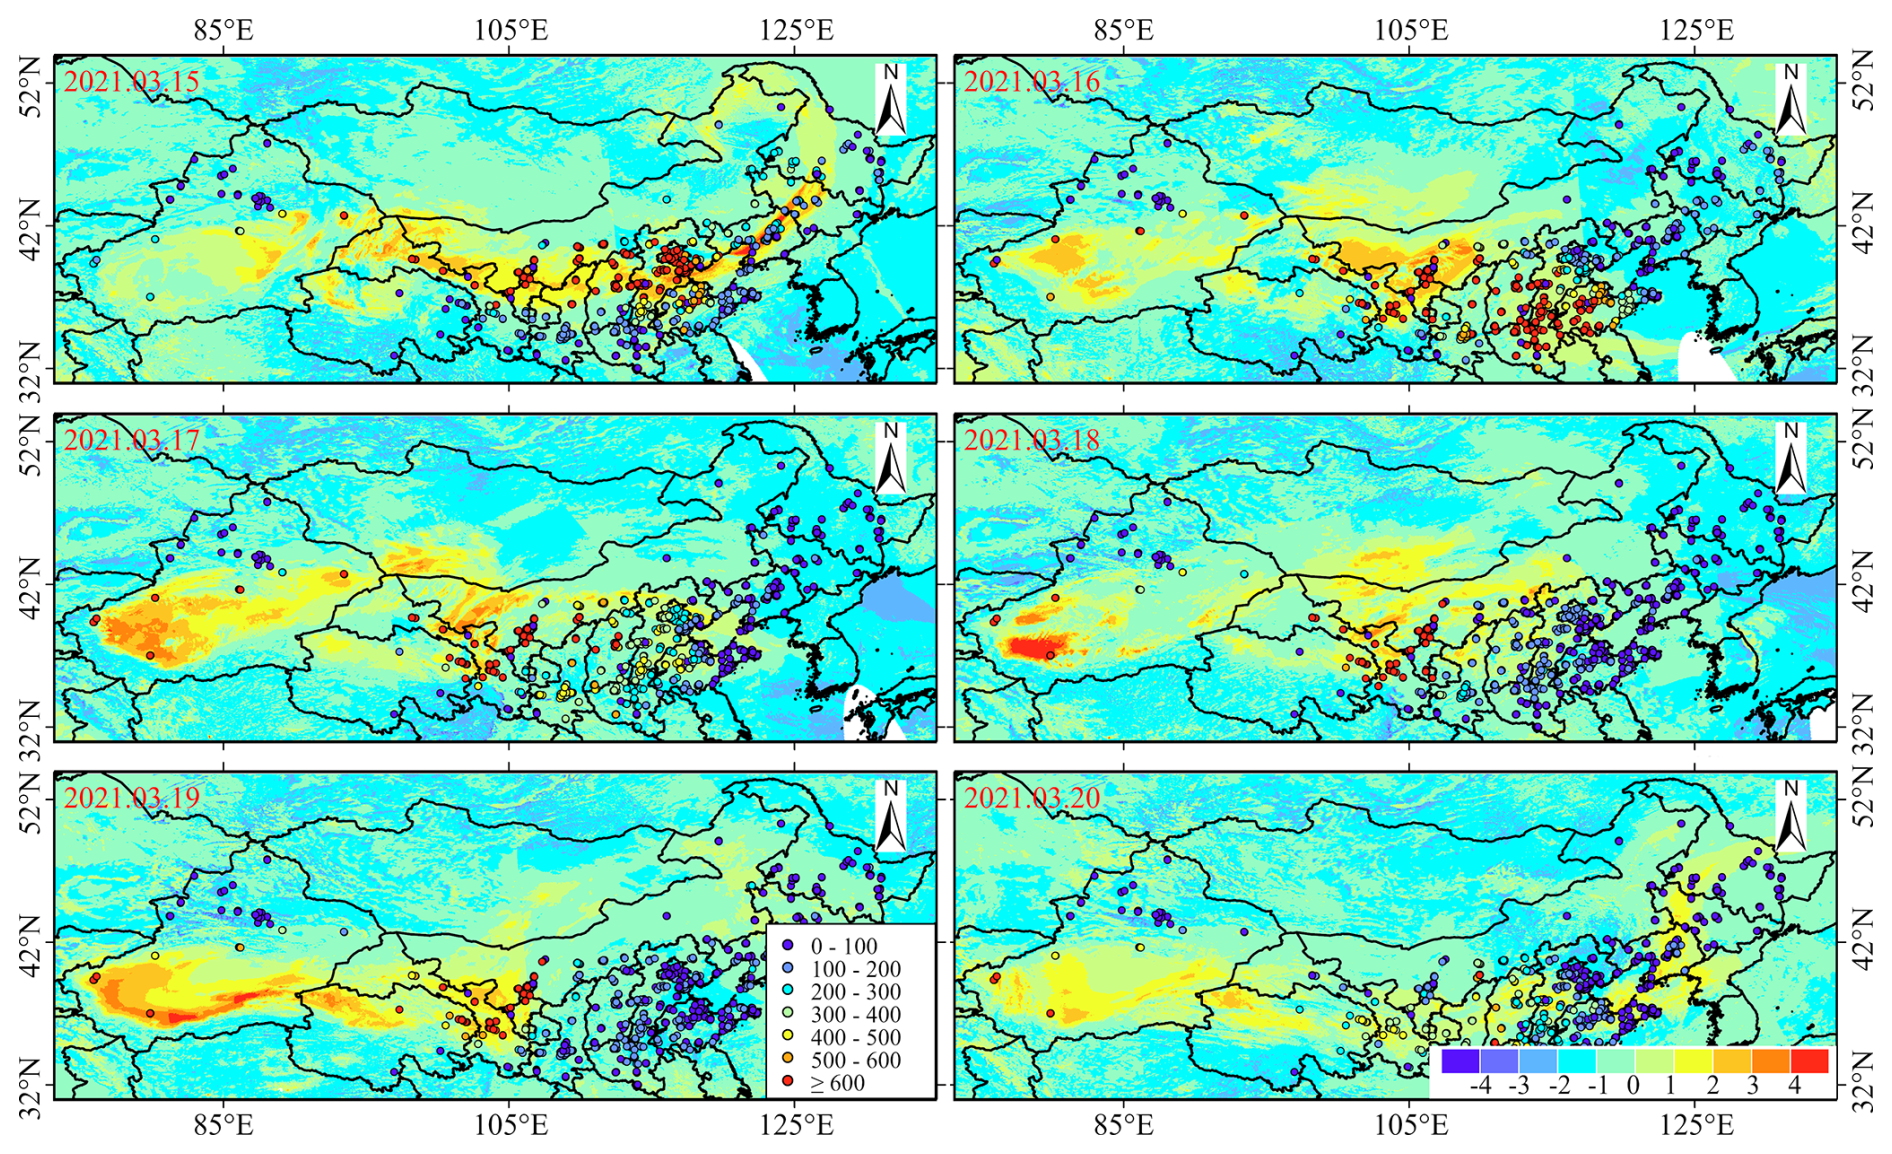
Figure 9Spatial distribution of daily Sentinel AAI during the dust weather process from 15 to 20 March 2021.
Overall, due to its high spatial resolution and high signal-to-noise ratio, TROPOMI is able to capture aerosol plumes from desert dust in great detail. As described in Sect. 2.2.3, the AAI is derived by calculating the residual value obtained from the ratio of the observed to the modeled reflectance. Therefore, the calculation of AAI relies on measured reflectance, the theoretical atmospheric reflectance with Rayleigh scattering stored in a pre-calculated look-up table, and the assumption that the scene surface behaves as a Lambert equivalent reflector (Dave and Mateer, 1967). As early as 1997, Herman et al. (1997) used the radiation difference between 340 and 380 nm measured by Nimbus-7/TOMS to obtain the global distribution of UV-absorbing aerosols and the interannual variation of aerosols in major desert areas from 1979 to 1993. It was found that atmospheric dust aerosol contributed the most to the absorption in the ultraviolet band. However, due to the small amount of Rayleigh scattering in the bottom layer, TOMS was insensitive to the bottom signal. Therefore, it was difficult to obtain information on absorbing aerosols below the atmospheric boundary layer. Apituley et al. (2022) compared the aerosol index data of TROPOMI AAI with OMI and OMPS (Ozone Mapping & Profiler Suite) and found that the values observed by TROPOMI were lower than those of OMI and OMPS. It is known that the accuracy of aerosol products is sensitive to small changes in calibration radiation, which may lead to deviations (Torres et al., 2020; Go et al., 2020). In addition, the deviation of AAI is also dependent on the knowledge of surface albedo and wavelength-dependent variability of surface albedo (Chimot et al., 2017). Some studies have also found that the detection of absorbing aerosols in the UV band and the calculation of optical thickness are affected by the presence of large-scale and sub-pixel clouds in the sensor field of view (Herman et al.,1997; Penning de Vries and Wagner, 2011). Moreover, Zweers (2022) used determining instrument specifications and analyzing methods for atmospheric retrieval to test the influence of terrain height variation on AAI. The results showed that when the terrain height is less than 250 m, the AAI deviation is about 0.3 depending on the layer height and layer thickness.
3.4 Performance of Himawari-8/9 in monitoring of dust weather
Figure 10 shows the POCD and POFD of atmospheric dust from the Himawari-8/9 AOD product across 64 DEs. From Fig. 10, it can be seen that the Himawari-8/9 AOD product exhibits significant fluctuations in POCD during multiple DEs from 2019 to 2025, with an average value of 34 %. In contrast, the changes in POFD are relatively stable, with an average value of approximately 92 %. When the POCD exceeds 70 %, the corresponding POFD remains at a relatively high level, as seen in DE-9, DE-42, and DE-60. Notably, the detection effectiveness of the Himawari-8/9 AOD product is least satisfactory in BS events, with an average POCD of only 32 %. Although its POCD value is similar to that of DS events, the average POFD for BS events is as high as 95 %. Especially in events such as DE-17, DE-29, and DE-55, the POFD values approach 1.00, reflecting severe false alarm issues. In contrast, the detection performance of DS events is relatively stable. In the case of DE-6, the POCD reaches 69 %, indicating sensitivity to moderate-intensity dust. However, there are still significant missed detections in DS events, with events such as DE-5, DE-14, and DE-32 having a POCD of 0. In terms of false detection, the average POFD for DS events is 89 %, which is an improvement compared to BS events, but the POFD for events like DE-54 remains as high as 0.95. The performance of the Himawari-8/9 AOD product in detecting SDS events is the most complex, with an average POCD of 26 %, which is lower than that for BS and DS events. At the same time, the POFD for SDS events is also lower than that for BS and DS. Event DE-18 exhibits relatively good detection performance (POCD = 49 %, POFD = 58 %), whereas events such as DE-10 completely missed detection (POCD = 0 %, POFD = 100 %). This variability indicates a clear insufficiency in the adaptability of detection thresholds for high-concentration dust.
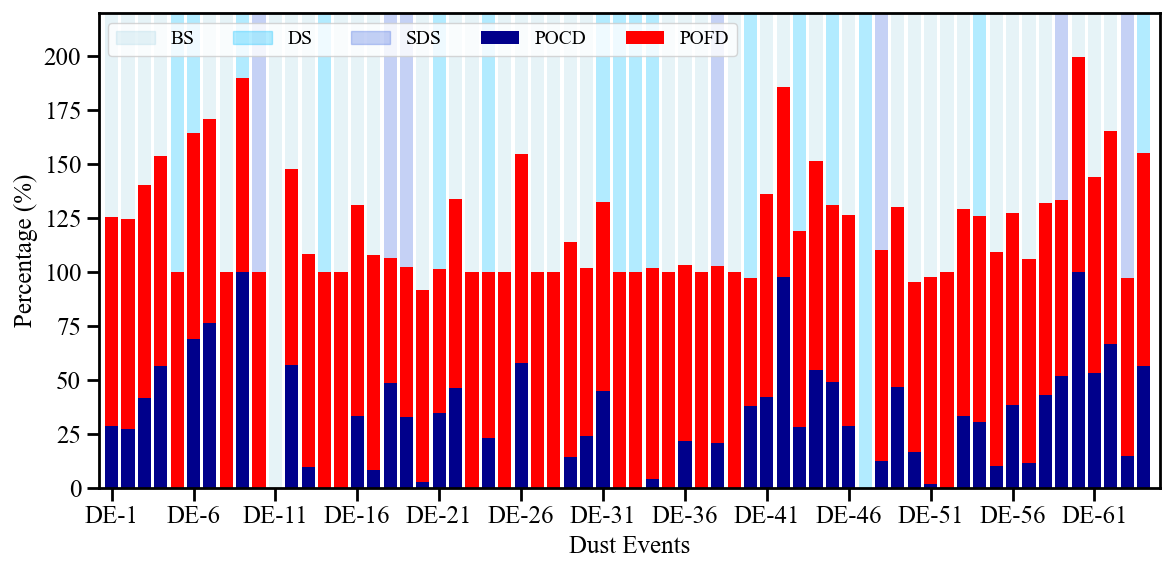
Figure 11 shows the spatial distribution of daily average AOD from Himawari-8 and station PM10 concentrations during the dust event in East Asia from 15 to 20 March 2021. From Fig. 11, it can be seen that the temporal and spatial evolution of the dust weather captured by the daily average AOD from Himawari-8 generally shows good consistency with FY-4A/B DSD, MODIS AOD, and Sentinel AAI. In particular, the distribution of high AOD regions corresponds well with the distribution of high MODIS AOD regions. At the same time, it can effectively capture the dust transmission over the ocean. In this regard, it performs better than the AOD products retrieved using the FY-4A/B DSD and MODIS DB algorithms for monitoring long-distance transport of dust in East Asia. Furthermore, due to its higher temporal and spatial resolution, Himawari-8 has a stronger dynamic characterization capability for the evolution of dust weather compared to other satellite aerosol products. However, due to the limitations of the geostationary satellite's observational field of view, the Himawari series of geostationary meteorological satellites cannot effectively monitor dust activities in the northwestern region of Xinjiang, China. Additionally, the distribution of AOD values from the Himawari-8 satellite shows a good correspondence with changes in PM10 concentrations measured at ground stations. Specifically, environmental monitoring stations in areas with relatively high AOD values also detected relatively high pollutant concentrations.
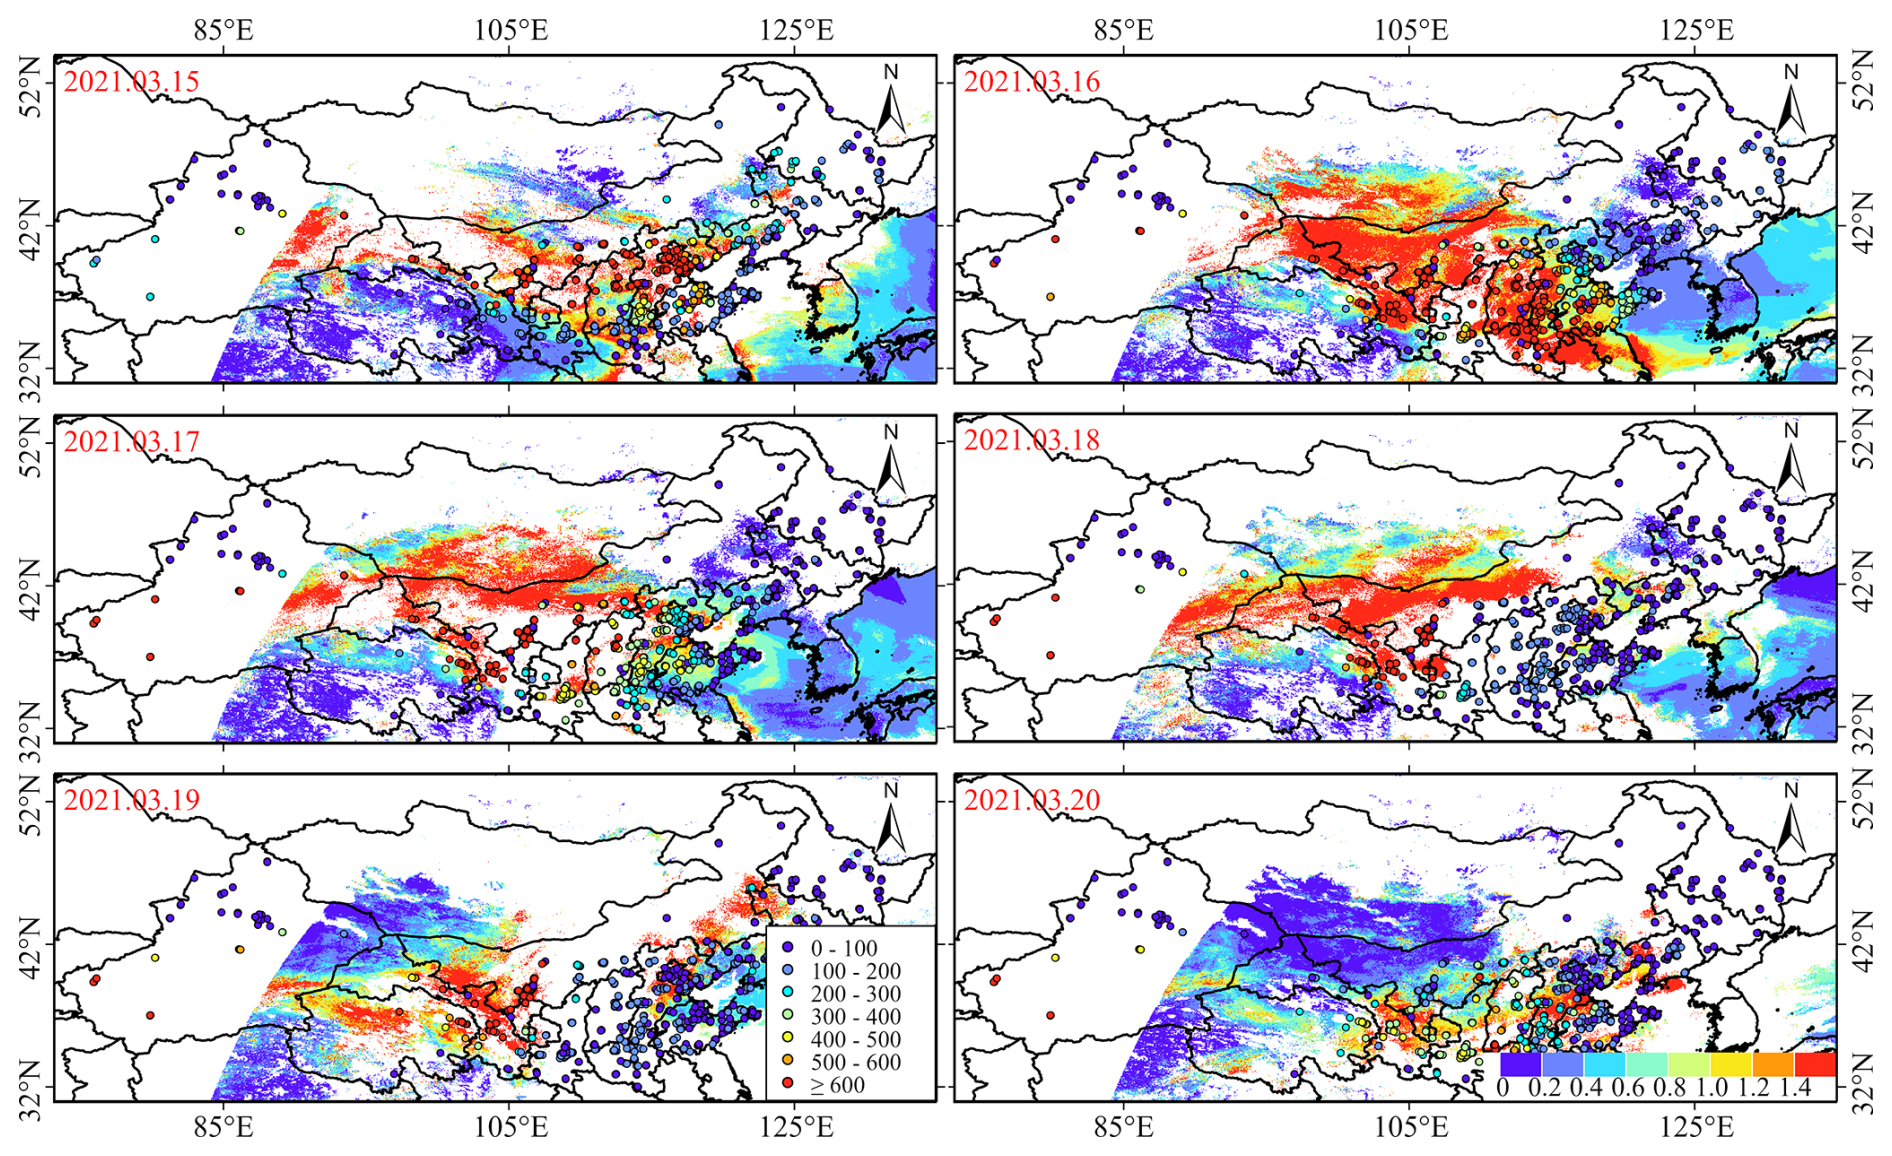
Figure 11Spatial distribution of daily Himawari-8 AOD during the dust weather process from 15 to 20 March 2021.
The extremely high observation frequency of Himawari-8/9 can generate time-continuous aerosol products, thereby effectively obtaining time-continuous daily changes in aerosols. However, small uncertainties in surface reflectance may affect the accuracy of AOD (Hashimoto and Nakajima, 2017). Tang et al. (2023) studied and analyzed the impact of surface conditions, observation angles, and aerosol types on the accuracy of Himawari-8 AOD retrievals. It was found that Himawari-8 AOD has an obvious underestimation in areas with surface reflectance close to 0.1 and Normalized Difference Vegetation Index (NDVI) close to 0.5, and there is no linear relationship between surface conditions and retrieval accuracy, indicating that Himawari-8 AOD retrieval accuracy does not entirely depend on the surface reflectance. In addition, the study also found that significant underestimation occurs when the aerosol load is high, coarse particles dominate, and the observation zenith angle is less than 50°. Similarly, Wei et al. (2019a) tested the accuracy of Himawari-8 aerosol products using AERONET and sun–sky radiometer observation data from 98 ground stations in the main observation area of Himawari-8, and they found that there are large uncertainties in both AOD and AE. AOD captured daily changes well but performed worst in spring. AE generally showed significant underestimation, especially in China. At the same time, the AOD retrieval accuracy increased with the increase in NDVI and AE, indicating that the current Himawari-8 aerosol retrieval algorithm was not suitable for the retrieval of atmospheric aerosol optical parameters under bright surfaces and high load conditions of coarse particles. Jiang et al. (2019) used the AOD measurement results of the AERONET sites to evaluate the AOD accuracy of Himawari-8 and the MODIS Deep Blue retrieval algorithm in China, comparing them. It was found that the AOD accuracy retrieved by Himawari-8 greatly depends on the atmospheric aerosol load, AE, and NDVI. However, the MODIS AOD retrieval bias does not appear to be related to these variables. Due to the above factors, there are errors in the retrieved AOD, which eventually spread to the actual application of the aerosol product.
3.5 Evaluation of different satellites in monitoring dust weather
Figure 12 presents the boxplots of POCD and POFD for the FY-4A/B DSD, MODIS AOD, Sentinel-5P AAI, and Himawari-8/9 AOD products across all DEs from 2019 to April 2025. As shown in Fig. 12, regarding the POCD, the median and mean values of the Sentinel-5P AAI product are 62.26 % and 57.16 %, respectively, placing it at a high level compared to all other data, indicating that its detection performance for atmospheric dust during DEs is superior to that of other products. However, its interquartile range of 48.13 % is larger than that of DST (20.77 %), IDDI (11.06 %), Himawari-8/9 AOD (39.58 %), and MODIS AOD (41.67 %), suggesting that the POCD of the AAI product exhibits significant variability across multiple DEs. The median POCD for the MODIS AOD product is 45.18 %, making its detection performance in DEs second only to that of the AAI product. Following this are the Himawari-8/9 AOD, DST, and IDDI products, with corresponding POCD medians of 31.25 %, 22.78 %, and 12.41 %, respectively. Notably, both FY-4A/B products have lower POCD values in terms of both median and mean compared to other products. However, their interquartile ranges are smaller than those of the other products. In particular, the interquartile range for IDDI (11.06 %) is significantly smaller than its mean, indicating that its overall detection performance is poorer but relatively stable. In terms of the POFD, the Himawari-8/9 AOD product has the highest false detection rate with a median of 92.04 %. Additionally, its lower quartile ranges of 11.46 % indicate that the variability of the high false detection rate is low and is similar to the interquartile range of the AAI product. The median false detection rates for the MODIS AOD and Sentinel-5P AAI products are similar (88.6 %), but their interquartile range (16.11 %) is larger than that of the Himawari-8/9 AOD and AAI, suggesting greater overall variability in false detection rates. The medians for the POFD of the DST and IDDI products are 73.3 % and 65.6 %, respectively, with an interquartile range of approximately 33 %. Although the false detection rates remain high, they are lower compared to those of other products. It is particularly noteworthy that, despite having higher POCD values than other products, AAI and MODIS AOD maintain relatively high POFD rates.
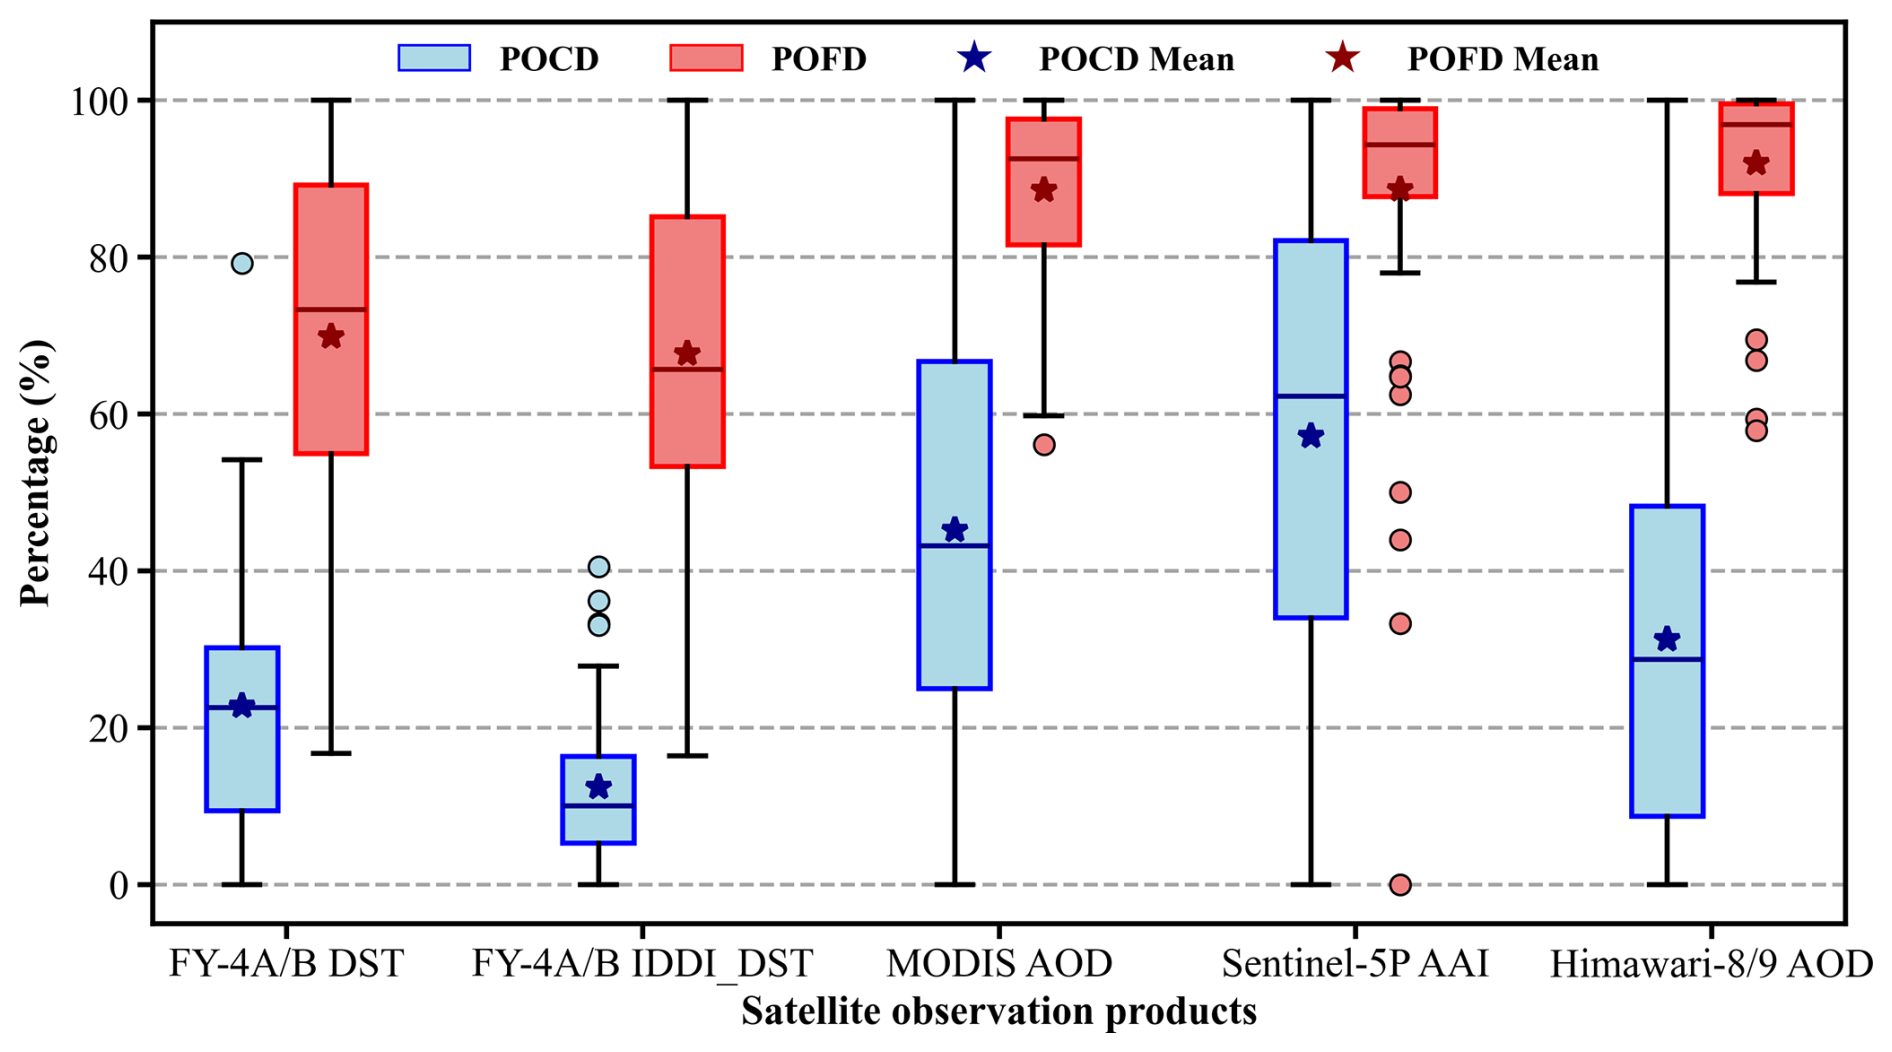
Figure 12The POCD and POFD of different satellite products for atmospheric dust for every dust events.
One reason for the high POFD is that most PM10 monitoring stations are distributed in eastern and central China, while relatively few are located in the northwestern regions where dust originates. This uneven distribution of stations leads to a low DD, which in turn results in a high POFD during the early stages of dust. Secondly, PM10 concentrations exceeding 600 µg m−3 are considered an indicator of dust occurrence, which may lead to an excessively high number of ND, subsequently causing a high POFD. Furthermore, as dust settles during its atmospheric diffusion, its concentration significantly decreases when transported to downstream areas compared to upstream regions. Consequently, the PM10 concentrations monitored by environmental stations in downstream areas will not be excessively high, leading to an excessive number of NDs, which, to some extent, contributes to an increase in POFD.
Figure 13 shows the dust detection results, including the POCD and POFD, of FY-4A/B DST, FY-4A/B IDDI, MODIS AOD, and Himawari-8/9 AOD products compared to the Sentinel-5P AAI product under the same spatiotemporal conditions. It can be observed from the figure that the POCD of the AAI product is significantly higher than that of the other four remote sensing products, with the POCD of the MODIS AOD product being closest to that of the AAI product. Furthermore, the POFD of the MODIS AOD product is lower than that of the AAI product, indicating better detection performance. The POCD of the Himawari-8/9 AOD product is 35 %, which is 30 % lower than the AAI's 65 %, and its POFD is also lower than that of the AAI. In contrast, both the FY-4A/B DST and FY-4A/B IDDI have a POCD of 40 %, showing a significant difference compared to the AAI and MODIS and AHI AOD products. Additionally, the IDDI product exhibits a lower false detection rate compared to the AAI product, further highlighting its superior detection performance. In addition, compared to the other four remote sensing products in the same space-time context, the AAI product consistently has the highest POFD, exceeding 90 %.
Figure 13The FY-4A/B DST, FY-4A/B IDDI, MODIS AOD, and Himawari-8/9 AOD products were respectively compared with the Sentinel-5P AAI product for atmospheric dust POCD and POFD at the same spatiotemporal conditions.
It can be seen from Fig. 12b that the POCD of MODIS AOD was still the largest (85.7 %) at roughly the same observation time and the same observation area. This was followed by the AOD of Himawari-8/9 at 43.8 %. Next was FY-4A DST and IDDI products, both at 37.3 %. The smallest POCD was the Sentinel-5P AAI product, which was 5.6 %. However, the POFD of the Sentinel-5P AAI product was the largest among all aerosol products at 90.3 %. The POFD of the other four products in descending order was MODIS AOD (61 %), Himawari-8/9 AOD (50 %), FY-4A DST (24 %), and FY-4A IDDI (20.8 %). In addition, the POCD of MODIS AOD and FY-4A DSD products was higher than POFD at the same time and space (Fig. 12b). However, the POCD of Himawari-8/9 AOD and Sentinel-5P AAI products was lower than POFD. In particular, the POFD of Sentinel-5P AAI was about 85 % higher than POCD.
This study assesses and validates the continuity, accuracy, and stability of FY-4A/B DSD, MODIS AOD, Sentinel-5P AAI, and Himawari-8/9 AOD products in monitoring dust weather using ground station PM10 concentration data in East Asia. The main conclusions are summarized as follows:
- 1.
In terms of the dust detection performance from different satellite remote sensing products during multiple DEs, the Sentinel-5P AAI demonstrates the best detection performance, with an average POCD of 57.16 % and a median of 62.26 %. Following this are the MODIS AOD, Himawari-8/9 AOD, FY-4A/B DST, and FY-4A/B IDDI products, which have average POCD values of 45.18 %, 31.25 %, 22.78 %, and 12.41 %, respectively. Additionally, although the average POCD for the FYY4A/B IDDI product is the lowest, the variation in POCD during multiple DEs is relatively stable.
- 2.
All products exhibit a common issue with high false alarm rates in dust detection during DEs. Even the best-performing product (AAI) has an average POFD as high as 88.66 %; the average POFD values for other products are as follows: Himawari-8 AOD (92.04 %), MODIS AOD (88.61 %), FY-4A/B DST (69.9 %), and FY-4A/B IDDI (67.69 %).
- 3.
There are significant differences in the stability of dust detection among the different products. For instance, the Himawari-8 AOD has a POFD interquartile range of only 11.46 %, exhibiting stable high false alarm characteristics, while the Sentinel-5P AAI shows a POCD interquartile range of 48.13 %, indicating greater variability.
- 4.
Regarding the spatial continuity of dust weather observed from 15 to 20 March 2021, different satellite remote sensing dust aerosol products demonstrate good spatial consistency in their daily atmospheric dust level distributions. In particular, the spatial distribution of atmospheric dust aerosols captured by the Sentinel-5P AAI product is not only more detailed than that of other products but also compensates for dust information that is missed by other passive remote sensing products due to sub-pixel cloud contamination. Furthermore, the distribution of atmospheric dust concentrations captured by these satellites is well aligned with the PM10 concentration distributions from ground stations.
The data mentioned in the article can be obtained by contacting the corresponding author.
YZ: conceptualization, methodology, software, writing (original draft), visualization. NW: conceptualization, visualization, writing (review and editing). SJ: conceptualization, writing (original draft), supervision, project administration. All authors have read and agreed to the published version of the paper.
The contact author has declared that none of the authors has any competing interests.
Publisher's note: Copernicus Publications remains neutral with regard to jurisdictional claims made in the text, published maps, institutional affiliations, or any other geographical representation in this paper. While Copernicus Publications makes every effort to include appropriate place names, the final responsibility lies with the authors. Views expressed in the text are those of the authors and do not necessarily reflect the views of the publisher.
We thank the editor and all reviewers for their valuable comments.
This paper was edited by Omar Torres and reviewed by two anonymous referees.
Ahn, C., Torres, O., Jethva, H., Tiruchirapalli, R., and Huang, L. K.: Evaluation of aerosol properties observed by DSCOVR/EPIC instrument from the Earth-Sun Lagrange 1 Orbit, J. Geophys. Res.-Atmos., 126, e2020JD033651, https://doi.org/10.1029/2020JD033651,2021.
Akhlaq, M., Sheltami. T. R., and Mouftah, H. T.: A review of techniques and technologies for sand and dust storm detection, Rev. Environ. Sci. Bio, 11, 305–322, https://doi.org/10.1007/s11157-012-9282-y, 2012.
Apituley, A., Pedergnana, M., Sneep, M., Veefkind, J. P., Loyola, D., and Zweers, D. S.: Sentinel-5 precursor/TROPOMI level 2 product user manual UV aerosol index, https://sentinels.copernicus.eu/documents/247904/2474726/ Sentinel-5P-Level-2-Product-User-Manual-Aerosol-Index-product (last access: 2 July 2025), 2022.
Bao, T., Xi, G., Hao, Y., Chang, I. S., Wu, J., Xue, Z., Jin, E., Zhang, W., and Bao, Y.: The Transport Path and Vertical Structure of Dust Storms in East Asia and the Impacts on Cities in Northern China, Remote Sens., 15, 3183, https://doi.org/10.3390/rs15123183, 2023.
Bessho, K., Date, K., Hayashi, M., Ikeda, A., Imai, T., Inoue, H., Kumagai, Y., Miyakawa, T., Murata, H., Ohno, T., Okuyama, A., Oyama, R., Sasaki, Y., Shimazu, Y., Shimoji, K., Sumida, Y., Suzuki, M., Taniguchi, H., Tsuchiyama, H., Uesawa, D., Yokota, H., and Yoshida, R.: An introduction to Himawari-8/9 – Japan's new-generation geostationary meteorological satellites, J. Meteorol. Soc. Jpn. Ser. II, 94, 151–183, https://doi.org/10.2151/jmsj.2016-009, 2016.
Boiyo, R., Kumar, K. R., and Zhao, T.: Optical, microphysical and radiative properties of aerosols over a tropical rural site in Kenya, East Africa: Source identification, modification and aerosol type discrimination, Atmos. Environ., 177, 234–252, https://doi.org/10.1016/j.atmosenv.2018.01.018, 2018.
Çapraz, Ö. and Deniz, A.: Particulate matter (PM10 and PM2.5) concentrations during a Saharan dust episode in Istanbul, Air Qual. Atmos. Hlth., 14, 109–116, https://doi.org/10.1007/s11869-020-00917-4, 2021.
Chen, B., Zhang, P., Zhang, B., Jia, R., Zhang, Z., Wang, T., and Zhou, T.: An overview of passive and active dust detection methods using satellite measurements, J. Meteorol. Res.-PRC, 28, 1029–1040, https://doi.org/10.1007/s13351-014-4032-4, 2014.
Chimot, J., Veefkind, J. P., Vlemmix, T., de Haan, J. F., Amiridis, V., Proestakis, E., Marinou, E., and Levelt, P. F.: An exploratory study on the aerosol height retrieval from OMI measurements of the 477 nm O2–O2 spectral band using a neural network approach, Atmos. Meas. Tech., 10, 783–809, https://doi.org/10.5194/amt-10-783-2017, 2017.
Dave, J. V. and Mateer, C. L.: A preliminary study on the possibility of estimating total atmospheric ozone from satellite measurements, J. Atmos. Sci., 24, 414–427, https://doi.org/10.1175/1520-0469(1967)024<0414:APSOTP>2.0.CO;2, 1967.
de Graaf, M., Stammes, P., Torres, O., and Koelemeijer, R. B. A.: Absorbing Aerosol Index: Sensitivity analysis, application to GOME and comparison with TOMS, J. Geophys. Res.-Atmos., 110, D10201, https://doi.org/10.1029/2004JD005178, 2005.
Duan, H., Guo, N., Huo, W., Qin, H., and Ma, Y.: The Comparison of the prediction efficiency of GRAPES-SDM dust-storm model and the satellite remote sensing monitoring, J. Desert Res., 34, 1617–1623, https://doi.org/10.7522/j.issn.1000-694X.2014.00012, 2014.
Fang, L., Wang, S., Yu, T., Gu, X., Zhang, X., Wang, W., and Ren, S.: Changes in aerosol optical and micro-physical properties over Northeast Asia from a severe dust storm in April 2014, Remote Sens., 8, 394, https://doi.org/10.3390/rs8050394, 2016.
Filonchyk, M.: Characteristics of the severe March 2021 Gobi Desert dust storm and its impact on air pollution in China, Chemosphere, 287, 132219, https://doi.org/10.1016/j.chemosphere.2021.132219, 2022.
Filonchyk, M., Hurynovich, V., Yan, H., and Yang, S.: Atmospheric pollution assessment near potential source of natural aerosols in the South Gobi Desert region, China, GIScience & Remote Sensing, 57, 227–244, https://doi.org/10.1080/15481603.2020.1715591, 2020.
Fioletov, V., McLinden, C. A., Griffin, D., Theys, N., Loyola, D. G., Hedelt, P., Krotkov, N. A., and Li, C.: Anthropogenic and volcanic point source SO2 emissions derived from TROPOMI on board Sentinel-5 Precursor: first results, Atmos. Chem. Phys., 20, 5591–5607, https://doi.org/10.5194/acp-20-5591-2020, 2020.
Fukuda, S., Nakajima, T., Takenaka, H., Higurashi, A., Kikuchi, N., Nakajima, T. Y., and Ishida, H.: New approaches to removing cloud shadows and evaluating the 380 nm surface reflectance for improved aerosol optical thickness retrievals from the GOSAT/TANSO-Cloud and Aerosol Imager, J. Geophys. Res.-Atmos., 118, 520-531, https://doi.org/10.1002/2013JD020090, 2013.
Gao, H. and Washington, R.: Arctic oscillation and the interannual variability of dust emissions from the Tarim Basin: a TOMS AI based study, Clim. Dynam., 35, 511–522, https://doi.org/10.1007/s00382-009-0687-4, 2010.
Ge, B., Yang, L., Chen, X., Li, Z., Mei, X., and Liu, L.: Study on aerosol optical depth retrieval over land from Himawari-8 data based on dark target method, Natl. Remote Sens. Bull., 22, 38–50, https://doi.org/10.11834/jrs.20187033, 2018.
Go, S., Kim, J., Park, S. S, Kim, M., Lim, H., Kim, J., Lee, D., and Im, J.: Synergistic use of hyperspectral UV-visible OMI and broadband meteorological imager MODIS data for a merged aerosol product, Remote Sens., 12, 3987, https://doi.org/10.3390/rs12233987, 2020.
Gui, L., Tao, M., Wang, Y., Wang, L., Chen, L., Lin, C., Tao, J., Wang, J., and Yu, C.: Climatology of aerosol types and their vertical distribution over East Asia based on CALIPSO lidar measurements, Int. J. Climatol., 42, 6042–6054, https://doi.org/10.1002/joc.7599, 2022.
Hang, Y., Jiang, X., Yun, J., Yinana, and Liu, K.: Comparison and Analysis of Sand-Dust Weather Frequency Changes between Sand Sources and Downstream Areas in East Asia, Meteorol. Sci. Technol., 51, 499–509, https://doi.org/10.19517/j.1671-6345.20220173, 2023.
Hashimoto, M. and Nakajima, T.: Development of a remote sensing algorithm to retrieve atmospheric aerosol properties using multiwavelength and multipixel information, J. Geophys. Res.-Atmos., 122, 6347–6378, https://doi.org/10.1002/2016JD025698, 2017.
Herman, J. R., Bhartia, P. K., Torres, O., Hsu, C., Seftor, C., and Celarier, E.: Global distribution of UV-absorbing aerosols from Nimbus 7/TOMS data, J. Geophys. Res.-Atmos., 102, 16911–16922, https://doi.org/10.1029/96JD03680, 1997.
Hsu, N. C., Jeong, M. J., Bettenhausen, C., Sayer, A. M., Hansell, R., Seftor, C. S., Huang, J., and Tsay, S. C. Enhanced Deep Blue aerosol retrieval algorithm: The second generation, J. Geophys. Res.-Atmos., 118, 9296–9315, https://doi.org/10.1002/jgrd.50712, 2013.
Hu, X., Lu, N., and Zhang, P.: Remote sensing and detection of dust storm in China using the thermal bands of geostationary meteorological satellite, J. Appl. Meteorol. Sci., 18, 266–275, https://doi.org/10.3969/j.issn.1001-7313.2007.03.002, 2007.
Huang, J., Ge, J., and Weng, F.: Detection of Asia dust storms using multisensor satellite measurements, Remote Sens. Environ., 110, 186–191, https://doi.org/10.1016/j.rse.2007.02.022, 2007.
Huang, J., Lin, B., Minnis, P., Wang, T., Wang, X., Hu, Y., Yi, Y., and Ayers, J. K.: Satellite-based assessment of possible dust aerosols semi-direct effect on cloud water path over East Asia, Geophys. Res. Lett., 33, L19802, https://doi.org/10.1029/2006GL026561, 2006.
Huang, J., Wang, T., Wang, W., Li, Z., and Yan, H.: Climate effects of dust aerosols over East Asian arid and semiarid regions, J. Geophys. Res.-Atmos., 119, 398–416, https://doi.org/10.1002/2014JD021796, 2014.
Jia, R., Liu, Y., Hua, S., Zhu, Q., and Shao, T.: Estimation of the aerosol radiative effect over the Tibetan Plateau based on the latest CALIPSO product, J. Meteorol. Res.-PRC, 32, 707–722, https://doi.org/10.1007/s13351-018-8060-3, 2018.
Jiang, T., Chen, B., Chan, K .K. Y., and Xu B.: Himawari-8/AHI and MODIS aerosol optical depths in China: evaluation and comparison, Remote Sens., 11, 1011, https://doi.org/10.3390/rs11091011, 2019.
Jiang, Y., Gao, Y., He, C., Liu, B., Pan, Y., and Li, X.: Spatiotemporal distribution and variation of wind erosion over the Tibetan Plateau based on a coupled land-surface wind-erosion model, Aeolian. Res., 50, 100699, https://doi.org/10.1016/j.aeolia.2021.100699, 2021.
Kaufman, Y. J., Tanre, D., Remer, L. A., Vermote, E. F., Chu, A., and Holben, B. N.: Operational remote sensing of tropospheric aerosol over land from EOS moderate resolution imaging spectroradiometer, J. Geophys. Res.-Atmos., 102, 17051–17067, https://doi.org/10.1029/2000GL012647, 1997.
Kaufman, Y. J., Tanré, D., Dubovik, O., Karnieli, A., and Remer, L. A.: Absorption of sunlight by dust as inferred from satellite and ground-based remote sensing, Geophys. Res. Lett., 28, 1479–1482, https://doi.org/10.1029/2000GL012647, 2001.
Kikuchi, M., Murakami, H., Suzuki, K., Nagao, T. M., and Higurashi, A.: Improved hourly estimates of aerosol optical thickness using spatiotemporal variability derived from Himawari-8 geostationary satellite, IEEE T. Geosci. Remote, 56, 3442–3455, https://doi.org/10.1109/TGRS.2018.2800060, 2018.
Kim, M.-H., Omar, A. H., Tackett, J. L., Vaughan, M. A., Winker, D. M., Trepte, C. R., Hu, Y., Liu, Z., Poole, L. R., Pitts, M. C., Kar, J., and Magill, B. E.: The CALIPSO version 4 automated aerosol classification and lidar ratio selection algorithm, Atmos. Meas. Tech., 11, 6107–6135, https://doi.org/10.5194/amt-11-6107-2018, 2018.
Kok, J. F., Storelvmo, T., Karydis, V. A., Adebiyi, A. A., Mahowald, N. M., Evan, A. T., Evan, A. T., He, C., and Leung, D. M.: Mineral dust aerosol impacts on global climate and climate change, Nature Reviews Earth & Environment, 4, 71–86, https://doi.org/10.1038/s43017-022-00379-5, 2023.
Legrand, M., Plana-Fattori, A., and N'doumé, C.: Satellite detection of dust using the IR imagery of Meteosat: 1. Infrared difference dust index, J. Geophys. Res.-Atmos., 106, 18251–18274, https://doi.org/10.1029/2000JD900749, 2001.
Levy, R. C., Remer, L. A., and Dubovik, O.: Global aerosol optical properties and application to moderate resolution imaging Spectroradiometer aerosol retrieval over land, J. Geophys. Res.-Atmos., 112, D13210, https://doi.org/10.1029/2006jd007815, 2007.
Levy, R. C., Mattoo, S., Munchak, L. A., Remer, L. A., Sayer, A. M., Patadia, F., and Hsu, N. C.: The Collection 6 MODIS aerosol products over land and ocean, Atmos. Meas. Tech., 6, 2989–3034, https://doi.org/10.5194/amt-6-2989-2013, 2013.
Li, J., Wong, M., Lee, K. H., Nichol, J., and Chan, P. W.: Review of dust storm detection algorithms for multispectral satellite sensors, Atmos. Res., 250, 105398, https://doi.org/10.1016/j.atmosres.2020.105398, 2021.
Li, Y.: Operational application of Fengyun satellite in dust weather monitoring, Satell. Appl., 11, 24–28, https://doi.org/10.3969/j.issn.1674-9030.2018.11.008, 2018.
Liu, C., Shen, X., and Gao, W.: Intercomparison of CALIOP, MODIS, and AERONET aerosol optical depth over China during the past decade, Int. J. Remote Sens., 39, 7251–7275, https://doi.org/10.1080/01431161.2018.1466070, 2018.
Liu, D., Wang, Z., Liu, Z., Winker, D., and Trepte, C.: A height resolved global view of dust aerosols from the first year CALIPSO lidar measurements, J. Geophys. Res.-Atmos., 113, D16214, https://doi.org/10.1029/2007JD009776, 2008.
Lu, J., Xu, Z., and Qi, Y.: Global Dust Remote Sensing with the FengYun-3 Satellite, Desert Res., 35, 690–698, 2015.
Mahowald, N. M., Baker, A. R., Bergametti, G., Brooks, N., Duce, R. A., Jickells, T. D., Kubilay, N., Prospero, J. M., and Tegen, I.: Atmospheric global dust cycle and iron inputs to the ocean, Global Biogeochem. Cy., 19, GB4025, https://doi.org/10.1029/2004GB002402, 2005.
Mahowald, N.: Aerosol indirect effect on biogeochemical cycles and climate, Science, 334, 794–796, https://doi.org/10.1126/science.1207374, 2011.
Michailidis, K., Koukouli, M.-E., Balis, D., Veefkind, J. P., de Graaf, M., Mona, L., Papagianopoulos, N., Pappalardo, G., Tsikoudi, I., Amiridis, V., Marinou, E., Gialitaki, A., Mamouri, R.-E., Nisantzi, A., Bortoli, D., João Costa, M., Salgueiro, V., Papayannis, A., Mylonaki, M., Alados-Arboledas, L., Romano, S., Perrone, M. R., and Baars, H.: Validation of the TROPOMI/S5P aerosol layer height using EARLINET lidars, Atmos. Chem. Phys., 23, 1919–1940, https://doi.org/10.5194/acp-23-1919-2023, 2023.
Middleton, N. J.: Desert dust hazards: A global review, Aeolian. Res., 24, 53–63, https://doi.org/10.1016/j.aeolia.2016.12.001, 2017.
Mu, F. and Fiedler, S.: How much do atmospheric depressions and Mongolian cyclones contribute to spring dust activities in East Asia? npj Clim. Atmos. Sci., 8, 51, https://doi.org/10.1038/s41612-025-00929-w, 2025.
Mu, F., Luiz, E. W., and Fiedler, S.: On the dynamics and air-quality impact of the exceptional East Asian dust outbreak in mid-March 2021, Atmos. Res., 292, 106846, https://doi.org/10.1016/j.atmosres.2023.106846, 2023.
Penning de Vries, M. and Wagner, T.: Modelled and measured effects of clouds on UV Aerosol Indices on a local, regional, and global scale, Atmos. Chem. Phys., 11, 12715–12735, https://doi.org/10.5194/acp-11-12715-2011, 2011.
Prospero, J. M., Ginoux, P., Torres, O., Nicholson, S. E., and Gill, T. E.: Environmental characterization of global sources of atmospheric soil dust identified with the Nimbus 7 Total Ozone Mapping Spectrometer (TOMS) absorbing aerosol product, Rev. Geophys., 40, 2-1–2-31, https://doi.org/10.1029/2000RG000095, 2002.
Rao, Y., Li, H., Chen, M., Fu, Q., Zhuang, G., and Huang, K.: Characterization of airborne microbial aerosols during a long-range transported dust event in Eastern China: bacterial community, influencing factors, and potential health effects, Aerosol Air Qual. Res., 20, 2834–2845, https://doi.org/10.4209/aaqr.2020.01.0030, 2020.
Rezaei, M., Farajzadeh, M., Mielonen, T., and Ghavidel, Y.: Analysis of spatio-temporal dust aerosol frequency over Iran based on satellite data, Atmos. Pollut. Res., 10, 508–519, https://doi.org/10.1016/j.apr.2018.10.002, 2019.
Richon, C., Dutay, J.-C., Dulac, F., Wang, R., and Balkanski, Y.: Modeling the biogeochemical impact of atmospheric phosphate deposition from desert dust and combustion sources to the Mediterranean Sea, Biogeosciences, 15, 2499–2524, https://doi.org/10.5194/bg-15-2499-2018, 2018.
Shao, Y. and Dong, C. H.: A review on East Asian dust storm climate, modelling and monitoring, Global Planet. Change, 52, 1–22, https://doi.org/10.1016/j.gloplacha.2006.02.011, 2006.
Shao, Y., Wyrwoll, K. H., Chappell, A., Huang, J., Lin, Z., McTainsh, G. H., Mikami, M., Tanaka, T. Y., Wang, X., and Yoon, S.: Dust cycle: An emerging core theme in Earth system science, Aeolian. Res., 2, 181–204, https://doi.org/10.1016/j.aeolia.2011.02.001, 2011.
She, L., Xue, Y., Yang, X., Guang, J., Li, Y., Che, Y., and Fan, C.: Dust detection and intensity estimation using Himawari-8/AHI observation, Remote Sens., 10, 490, https://doi.org/10.3390/rs10040490, 2018.
Song, L., Bi, X., Zhang, Z., Li, L., Dai, Q., Zhang, W., Hu, L., Wang, X., Liang, D., and Feng, Y.: Impact of sand and dust storms on the atmospheric environment and its source in Tianjin-China, Sci. Total Environ., 825, 153980, https://doi.org/10.1016/j.scitotenv.2022.153980, 2022.
Sun, X., Fan, X., Zhang, T., Wang, Y., Lyu, D., and Zheng, M.: Tempo-Spatial Distributions and Transport Characteristics of Two Dust Events over Northern China in March 2021, Remote Sens., 14, 5967, https://doi.org/10.3390/rs10040490, 2022.
Tang, C., Shi, C., Letu, H., Ma, R., Yoshida, M., Kikuchi, M., Xu, J., Li, N., Zhao, M., Chen, L., and Shi, G. Evaluation and uncertainty analysis of Himawari-8 hourly aerosol product version 3.1 and its influence on surface solar radiation before and during the COVID-19 outbreak, Sci. Total Environ., 892, 164456, https://doi.org/10.3390/rs10040490, 2023.
Torres, O., Bhartia, P. K., Herman, J. R., Sinyuk, A., Ginoux, P., and Holben, B.: A long-term record of aerosol optical depth from TOMS observations and comparison to AERONET measurements, J. Atmos. Sci., 59, 398–413, https://doi.org/10.1175/1520-0469(2002)059<0398:ALTROA>2.0.CO;2, 2002.
Torres, O., Jethva, H., Ahn, C., Jaross, G., and Loyola, D. G.: TROPOMI aerosol products: evaluation and observations of synoptic-scale carbonaceous aerosol plumes during 2018–2020, Atmos. Meas. Tech., 13, 6789–6806, https://doi.org/10.5194/amt-13-6789-2020, 2020.
Veefkind, J. P., Aben, I., McMullan, K., Förster, H., de Vries, J., Otter, G., Claas, J., Eskes, H. J., de Haan, J. F., Kleipool, Q., Van Weele, M., Hasekamp, O., Hoogeveen, R., Landgraf, J., Snel, R., Tol, P., Ingmann, P., Voors, R., Kruizinga, B., Vink, R., Visser, H., and Levelt, P. F.: TROPOMI on the ESA Sentinel-5 Precursor: A GMES mission for global observations of the atmospheric composition for climate, air quality and ozone layer applications, Remote Sens. Environ., 120, 70–83, https://doi.org/10.1016/j.rse.2011.09.027, 2012.
Wang, D., Zhang, F., Yang, S., Xia, N., and Ariken, M.: Exploring the spatial-temporal characteristics of the aerosol optical depth (AOD) in Central Asia based on the moderate resolution imaging spectroradiometer (MODIS), Environ. Monit. Assess., 192, 383, https://doi.org/10.1007/s10661-020-08299-x, 2020.
Wang, M., Wei, W., Ruan, Z., He, Q., and Ge, R.: Application of wind-profiling radar data to the analysis of dust weather in the Taklimakan Desert, Environ. Monit. Assess., 185, 4819–4834, https://doi.org/10.1007/s10661-012-2906-4, 2013.
Wang, N., Chen, J., Zhang, Y., Xu, Y., and Yu, W.: The Spatiotemporal Characteristics and Driving Factors of Dust Emissions in East Asia (2000–2021), Remote Sens., 15, 410, https://doi.org/10.3390/rs15020410, 2023.
Wei, J., Li, Z., Sun, L., Peng, Y., Zhang, Z., Li, Z., Su, T., Feng, L., Cai, Z., and Wu, H.: Evaluation and uncertainty estimate of next-generation geostationary meteorological Himawari-8/AHI aerosol products, Sci. Total Environ., 692, 879–891, https://doi.org/10.1016/j.atmosenv.2019.01.016, 2019a.
Wei, J., Li, Z., Sun, L., Peng, Y., and Wang, L.: Improved merge schemes for MODIS Collection 6.1 Dark Target and Deep Blue combined aerosol products, Atmos. Environ., 202, 315–327, https://doi.org/10.1016/j.scitotenv.2019.07.326, 2019b.
Wei, X., Chang, N. B., Bai, K., and Gao, W.: Satellite remote sensing of aerosol optical depth: Advances, challenges, and perspectives, Crit. Rev. Env. Sci. Tec., 50, 1640–1725, https://doi.org/10.1080/10643389.2019.1665944, 2020.
Winker, D. M., Hunt, W. H., and McGill, M. J.: Initial performance assessment of CALIOP, Geophys. Res. Lett., 34, L19803, https://doi.org/10.1029/2007GL030135, 2007.
Wu, S. and Ma, X.: Analysis of dust vertical and horizontal distribution during dust events in northwest China based on FY-4A, MODIS and CALIPSO satellite data, Acta Sci. Circumstantiae, 40, 2892–2901, https://doi.org/10.13671/j.hjkxxb.2020.0093, 2020.
Xian, D., Zhang, P., Gao, L., Sun, R., Zhang, H., and Jia, X.: Fengyun meteorological satellite products for earth system science applications, Adv. Atmos. Sci., 38, 1267–1284, https://doi.org/10.1007/s00376-021-0425-3, 2021.
Yan, X., Luo, N., Liang, C., Zang, Z., Zhao, W., and Shi, W.: Simplified and Fast Atmospheric Radiative Transfer model for satellite-based aerosol optical depth retrieval, Atmos. Environ., 224, 117362, https://doi.org/10.1016/j.atmosenv.2020.117362, 2020.
Yang, L., She, L., Che, Y., He, X., Yang, C., and Feng, Z.: Analysis of Dust Detection Algorithms Based on FY-4A Satellite Data, Appl. Sci., 13, 1365, https://doi.org/10.3390/app13031365, 2023.
Yang, Y. Q., Hou, Q., Zhou, C. H., Liu, H. L., Wang, Y. Q., and Niu, T.: Sand/dust storm processes in Northeast Asia and associated large-scale circulations, Atmos. Chem. Phys., 8, 25–33, https://doi.org/10.5194/acp-8-25-2008, 2008.
Ye, Q., Zheng, X. S., and Zhao, S. Y.: Monitoring and transport path analysis of an intense dust weather process in 2021, National Remote Sensing Bulletin, 27, 1821–1833, https://doi.org/10.11834/jrs.20232153, 2023.
Yoshida, M., Kikuchi, M., Nagao, T.M., Murakami, H., Nomaki, T., and Higurashi, A.: Common retrieval of aerosol properties for imaging satellite sensors, J. Meteorol. Soc. Jpn., 96B, 193–209, https://doi.org/10.2151/jmsj.2018-039, 2018.
Zhang, P., Lu, N., Hu, X., and Dong, C.: Identification and physical retrieval of dust storm using three MODIS thermal IR channels, Global Planet. Change, 52, 197–206, https://doi.org/10.1016/j.gloplacha.2006.02.014, 2006.
Zhang, P., Wang, C., Chen, L., Bai, W., Qi, C., and Qi, J.: Current Status of Satellite-Based Dust Aerosol Remote Sensing and Some Issues to Be Concerned, Meteor. Mon., 44, 725–736, https://doi.org/10.7519/j.issn.1000-0526.2018.06.001, 2018.
Zhang, P., Zhu, L., Tang, S., Gao, L., Chen, L., Zheng, W., Han, X., Chen, J., and Shao, J.: General comparison of FY-4A/AGRI with other GEO/LEO instruments and its potential and challenges in non-meteorological applications, Front. Earth Sci., 6, 224, https://doi.org/10.3389/feart.2018.00224, 2019a.
Zhang, W., Xu, H., and Zhang, L.: Assessment of Himawari-8 AHI aerosol optical depth over land, Remote Sens., 11, 1108, https://doi.org/10.3390/rs11091108, 2019b.
Zhao, Y., Xin, Z., and Ding, G.: Spatiotemporal variation in the occurrence of sand-dust events and its influencing factors in the Beijing-Tianjin Sand Source Region, China, 1982–2013, Reg. Environ. Change, 18, 2433–2444, https://doi.org/10.1007/s10113-018-1365-z, 2018.
Zhuang, G., Guo, J., Yuan, H., and Zhao, C.: The compositions, sources, and size distribution of the dust storm from China in spring of 2000 and its impact on the global environment, Chinese Sci. Bull., 46, 895–900, https://doi.org/10.1007/BF02900460, 2001,
Zweers, D. S.: TROPOMI ATBD of the UV Aerosol Index, https://sentinels.copernicus.eu/documents/247904/2476257/Sentinel-5P-TROPOMI-ATBD-UV-Aerosol-Index.pdf (last access: 2 July 2025), 2022.